







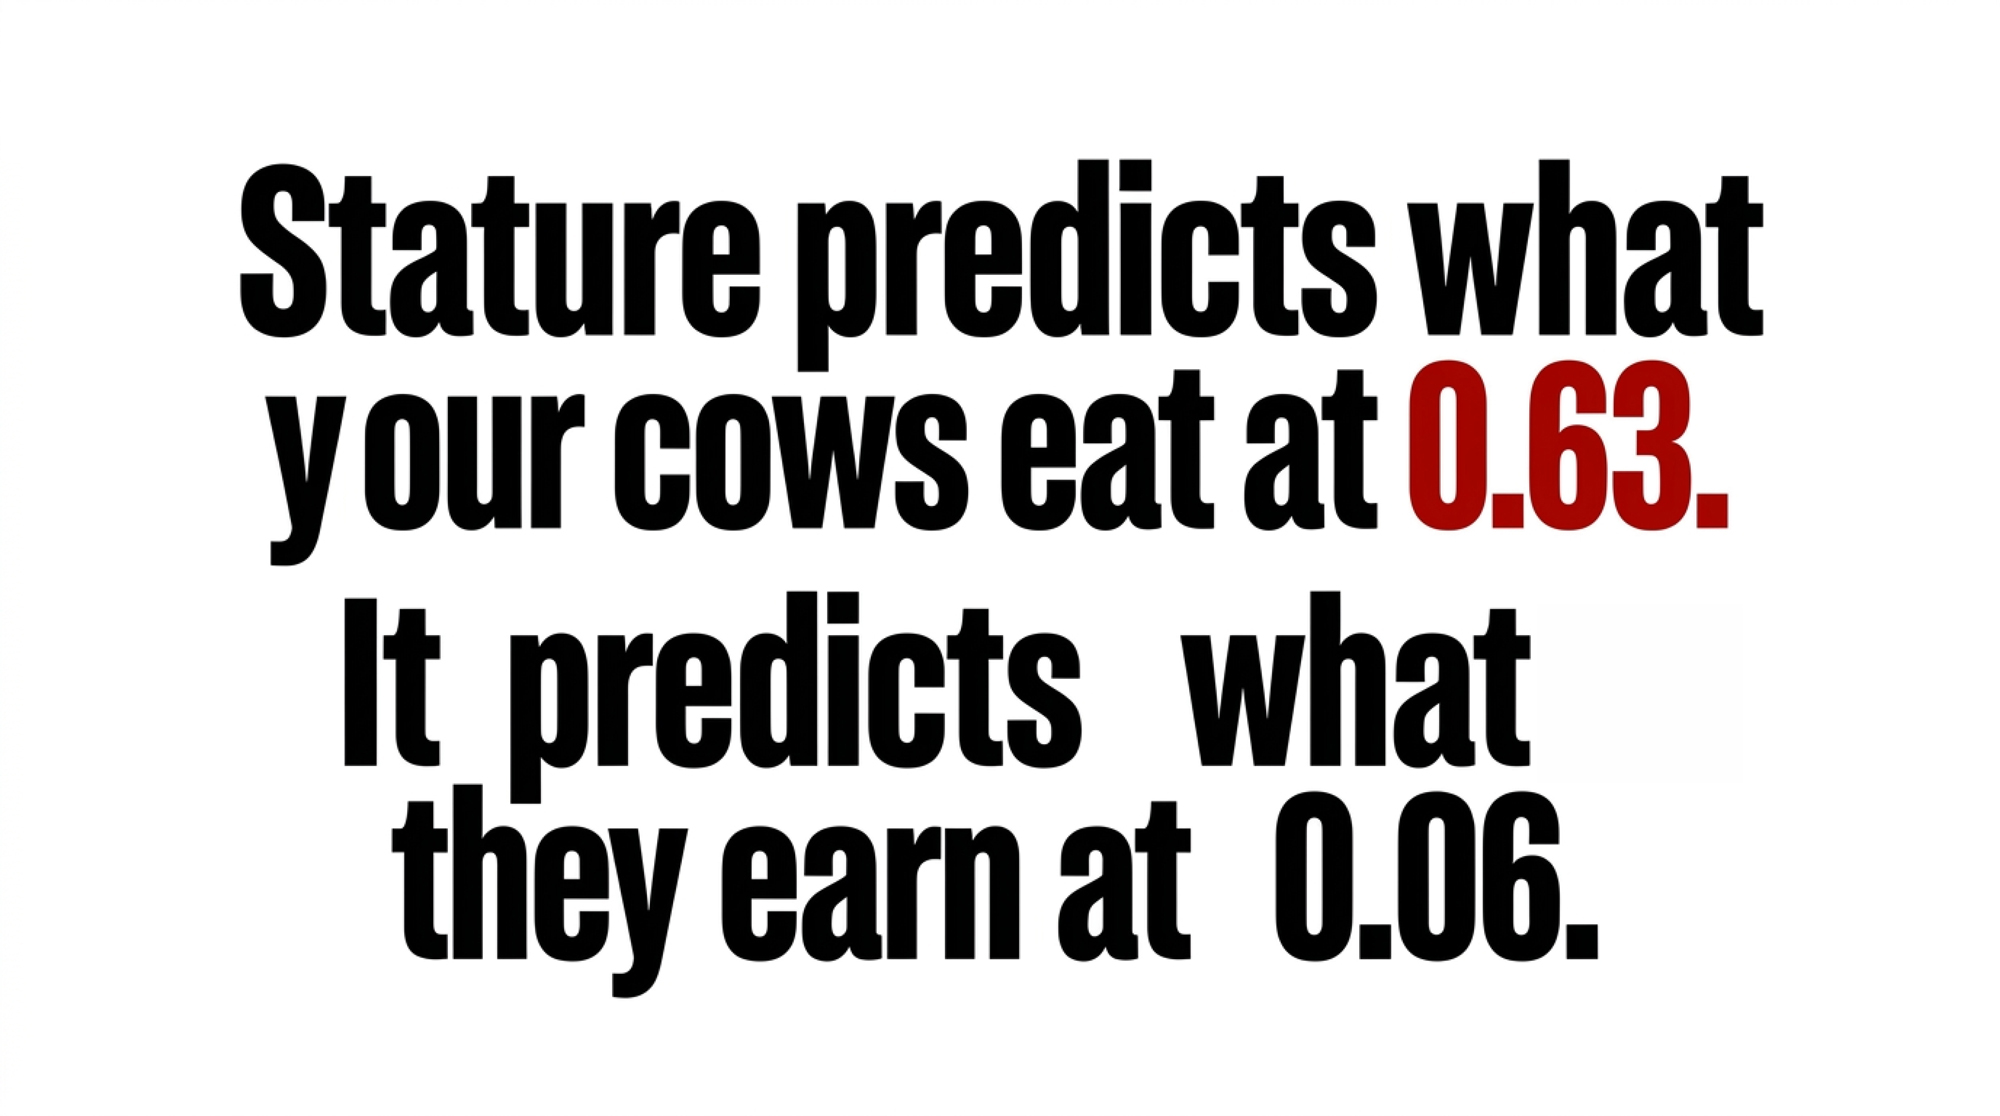
Two decimals, two decades of peer-reviewed data. Stature tracks what your cows eat at 0.52–0.63 and what they earn at 0.06 — and CDCB just priced the spread at 1,682 pounds of dry matter.
EXECUTIVE SUMMARY:
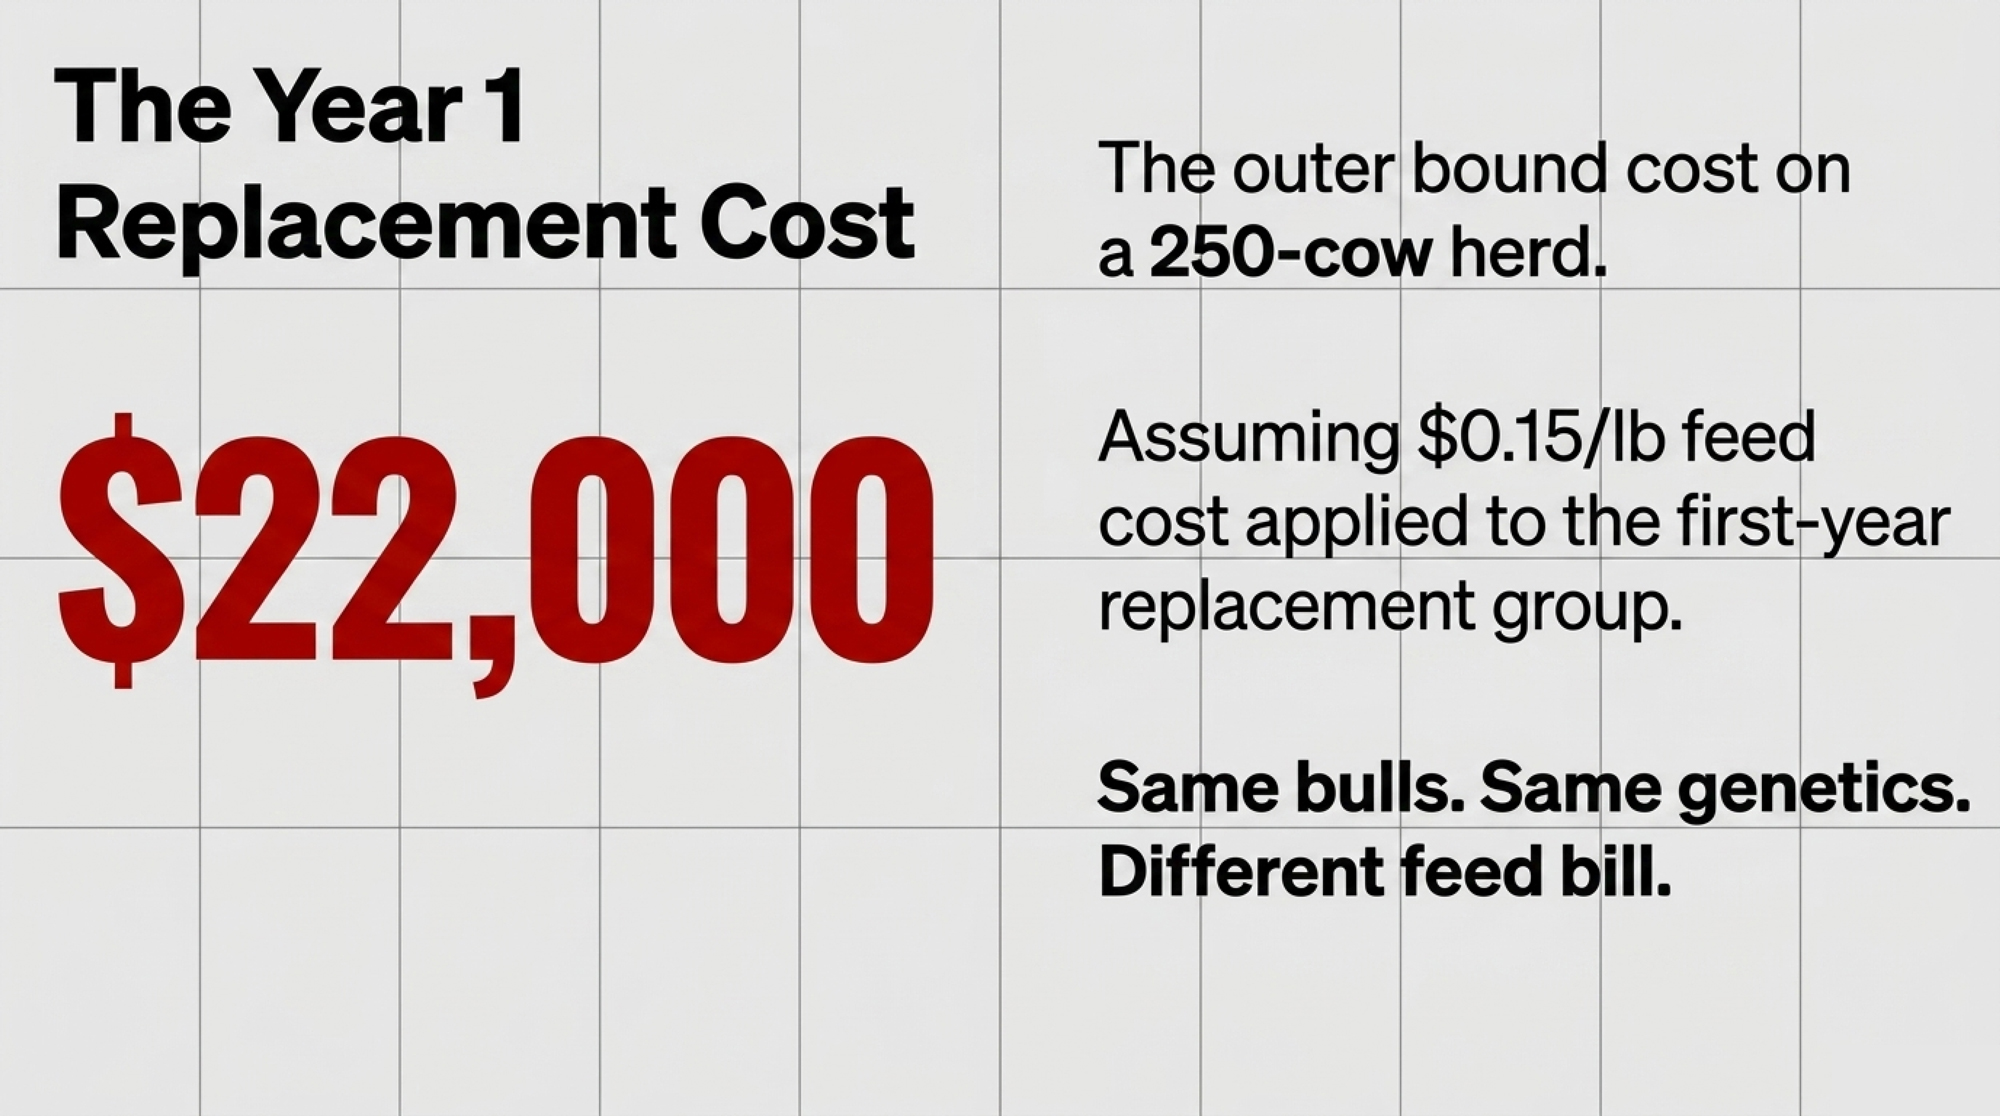
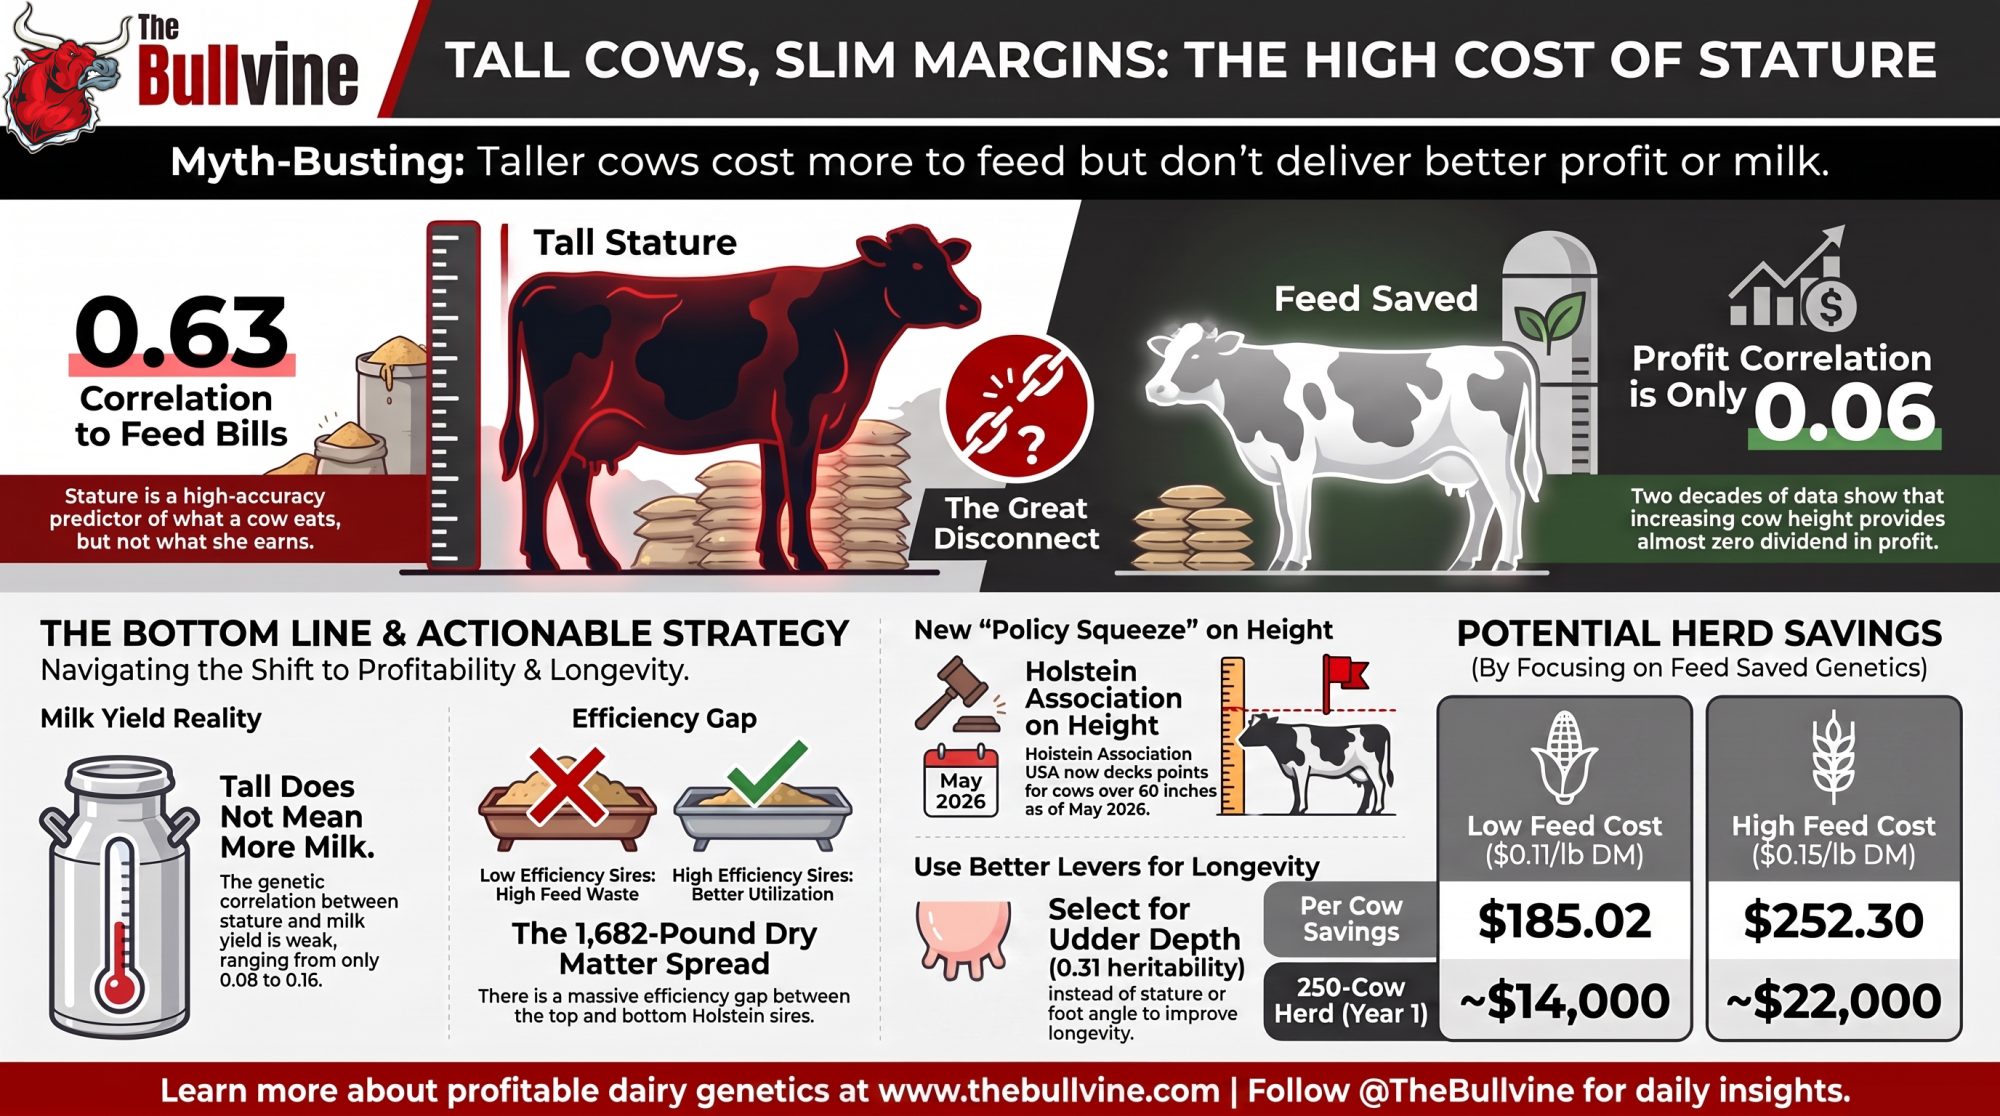
- The Feed Spread: CDCB’s Feed Saved evaluations show a 1,682-lb dry matter spread per lactation between top and bottom Holstein sires. At $0.11–$0.15/lb DM, that’s $185 to $252 per cow — or $14,000 to $22,000 in Year 1 on a 250-cow herd once you apply it to the replacement group.
- The Policy Squeeze: Holstein Association USA now docks Final Score up to 3.45 points for 70-inch cows (May 2026), while CDCB raised Feed Saved to 17.8% of Net Merit (April 2025). Two separate organisations, thirteen months apart, no evidence of coordination.
- The Selection Reality: Feed Saved reliability averages 28% on young genomic sires versus 38% on proven bulls — use it to weed out extremes, not to split hairs. And if you’re capping stature expecting longevity to follow, Productive Life heritability sits at 0.05–0.13.
- Same milk. Different feed bill. And nothing on your monthly milk statement will ever tell you which side of that 1,682-pound dry matter spread your herd landed on.
- That range is current, too. CDCB’s August 2026 evaluation update introduced three new traits and revised four female reproductive traits, but left Feed Saved untouched.
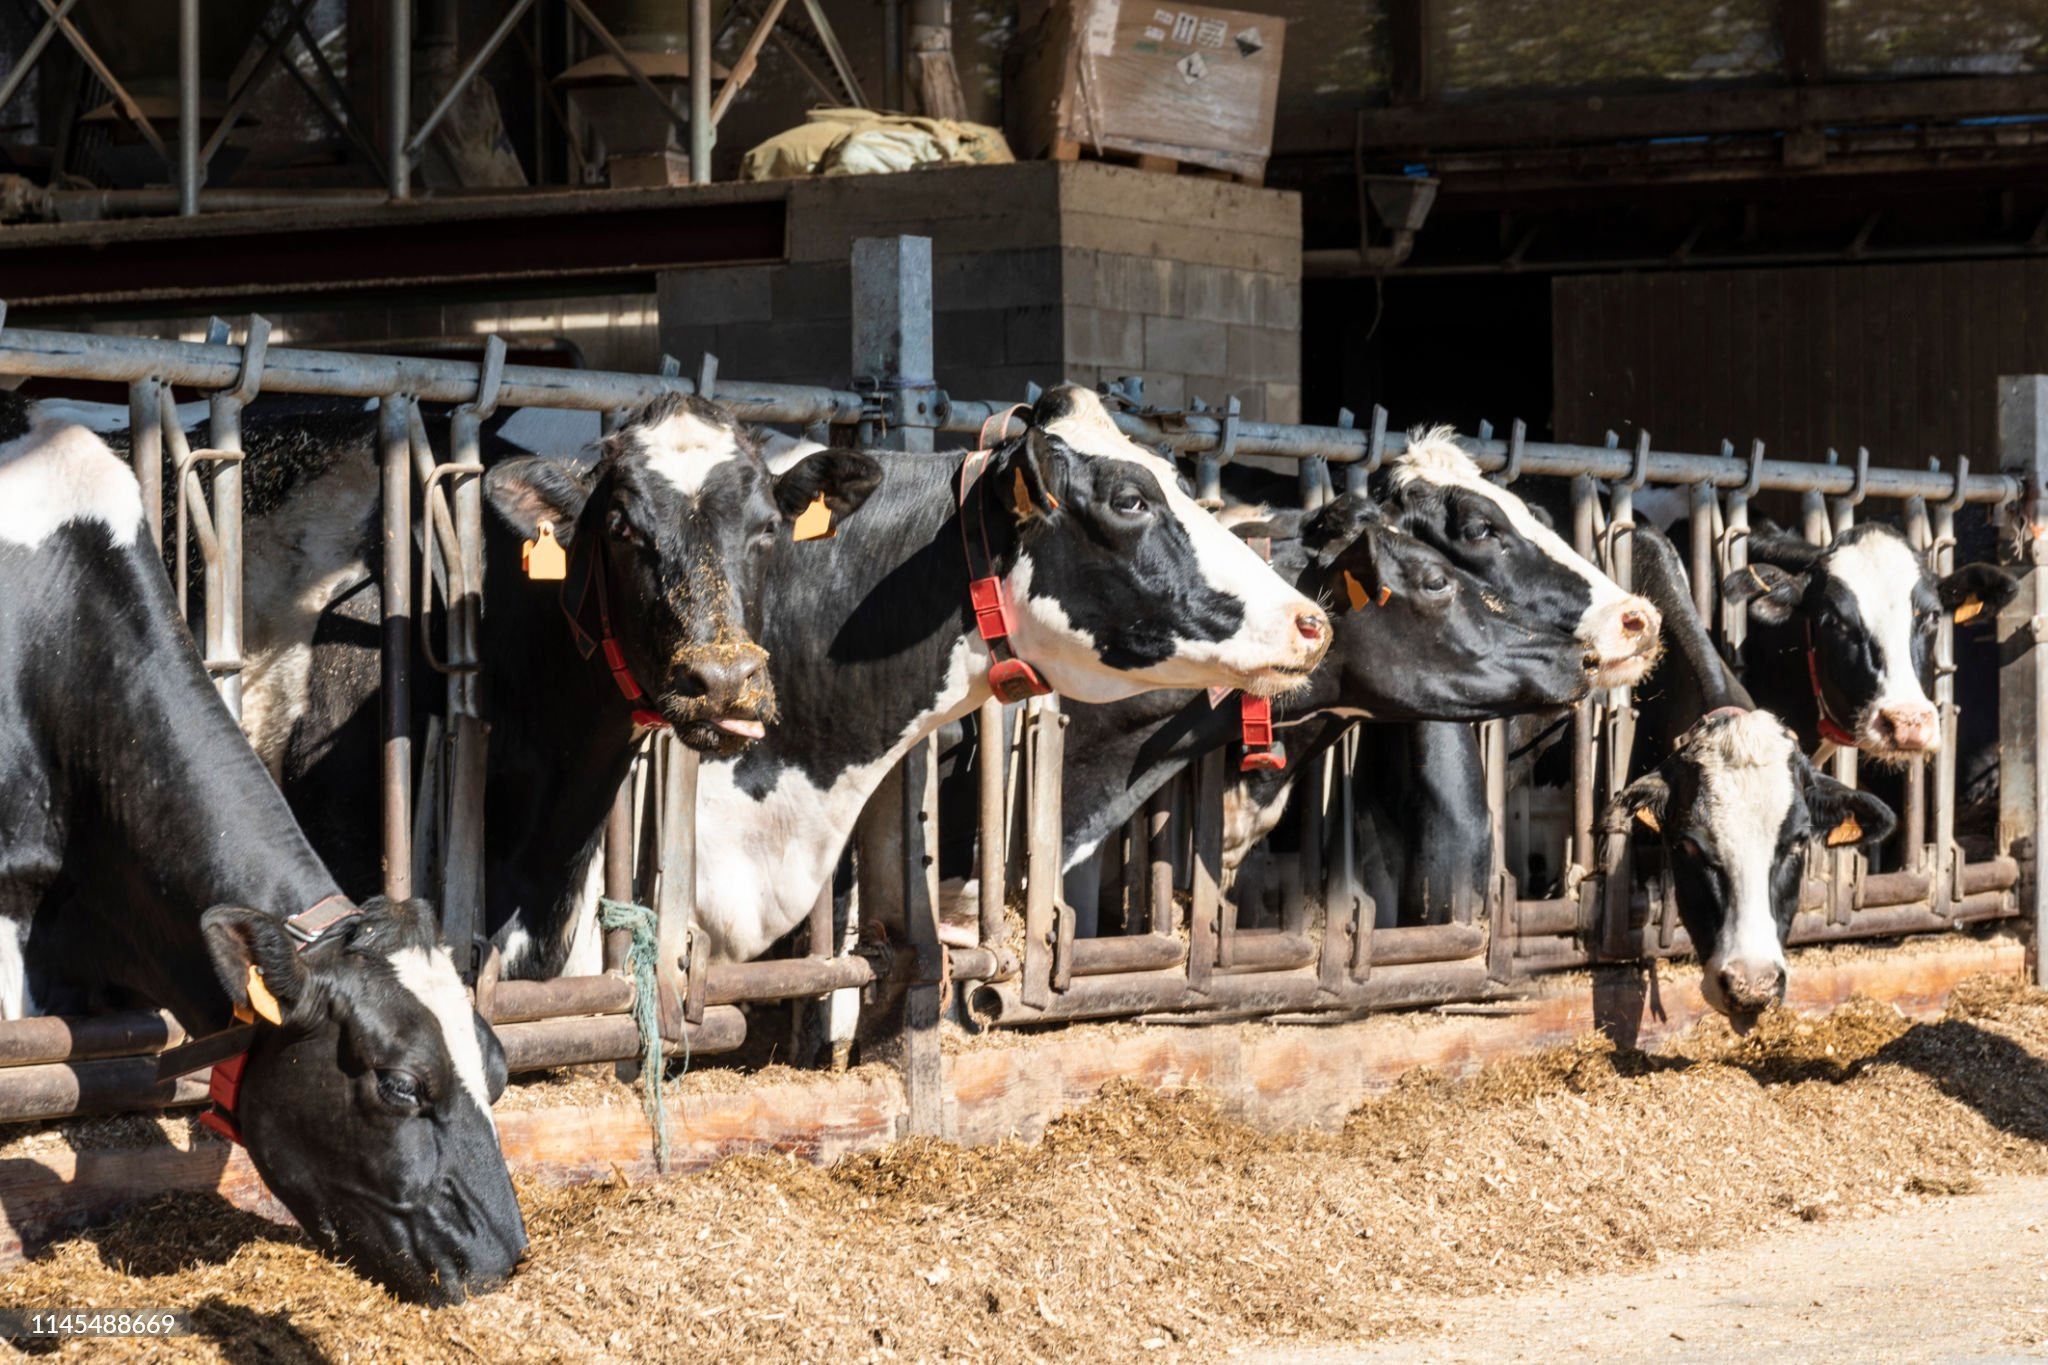
Two Changes, Seventeen Months Apart, Pointing Opposite Ways
On December 1, 2024, Holstein Association USA threw out its stature linear scale. The old 51-to-61-inch range became 55 to 65 inches, five points per inch. Behind it was a 2023 cow-measurement project that found the breed had physically outgrown the old ruler.
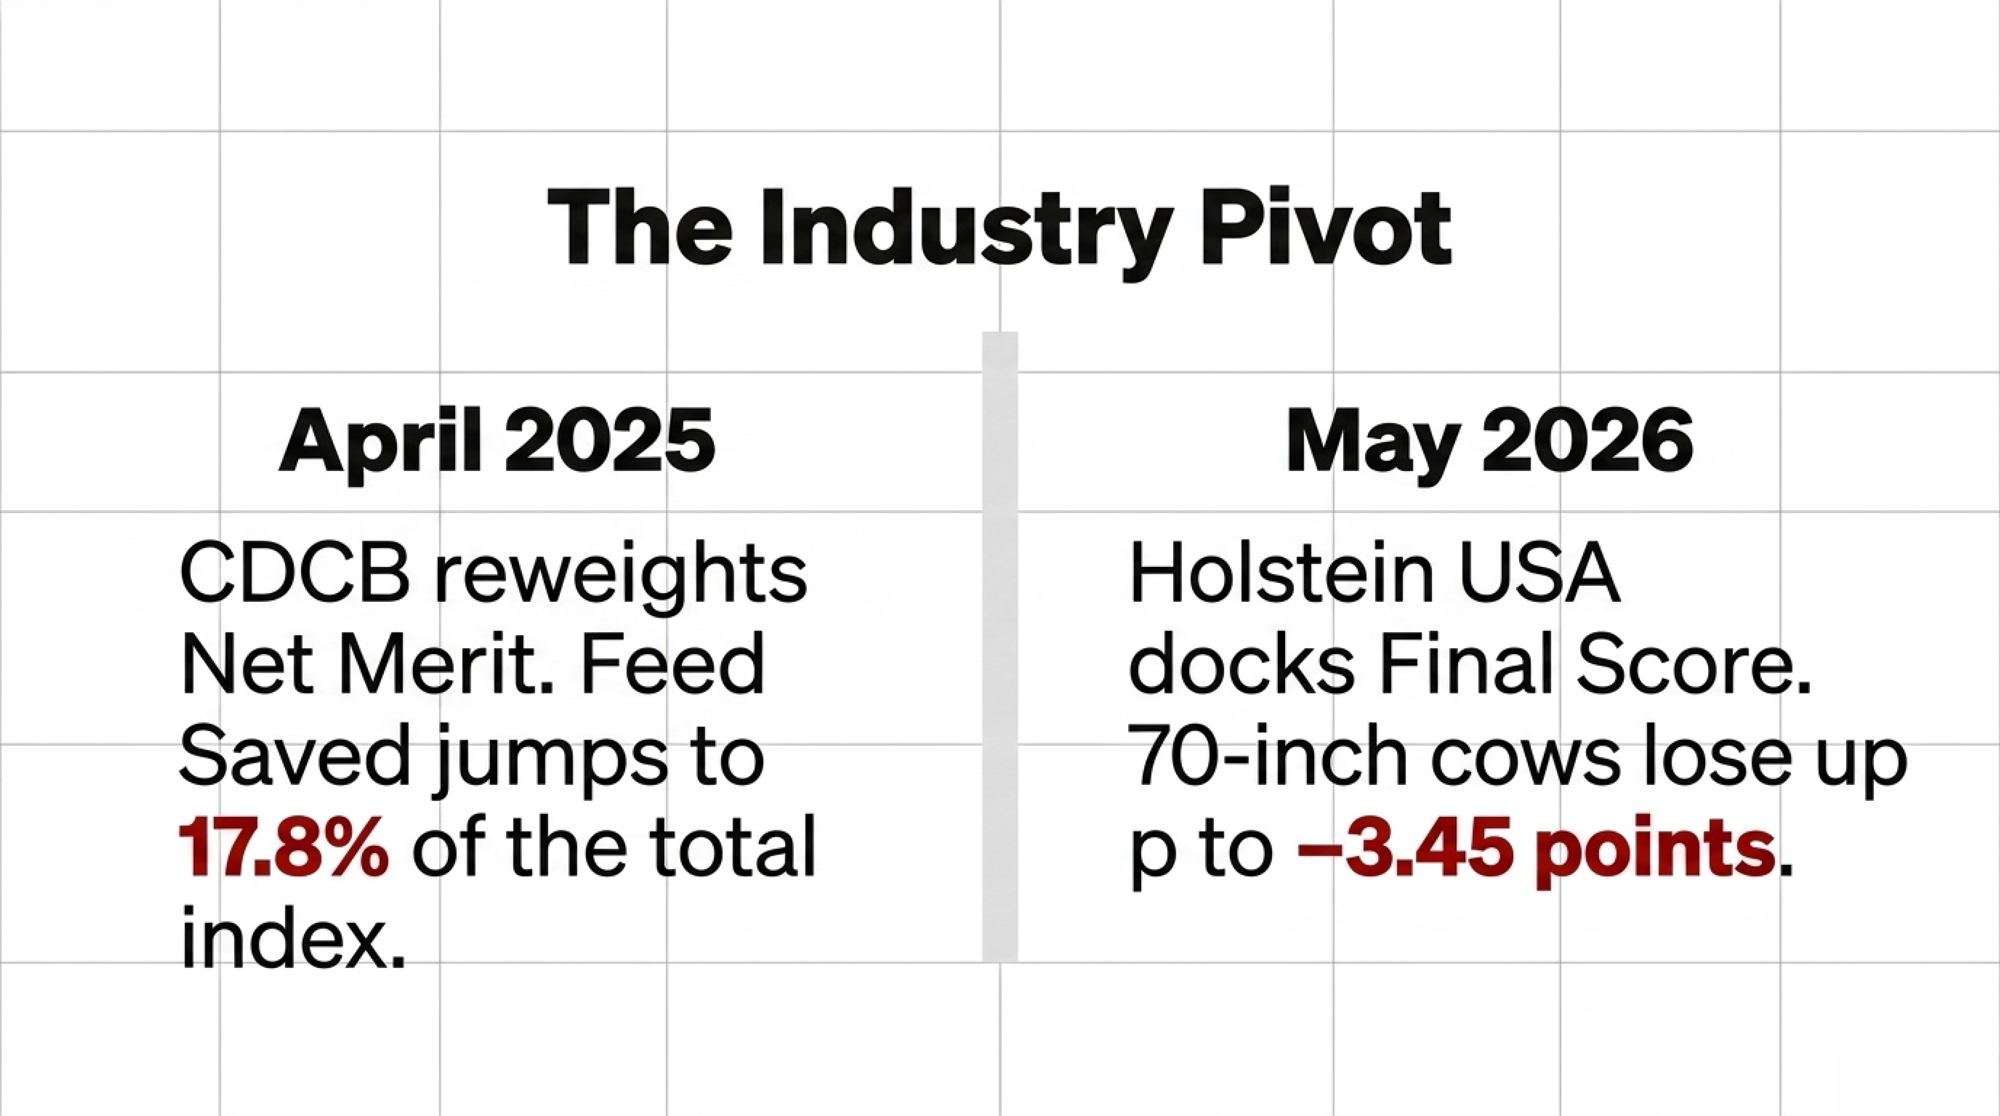
Seventeen months later, the same organization started docking height. From the May 2026 classification run forward, 60 inches is the ideal, and every inch above it costs Final Score — taken out of Front End and Capacity, which is 15% of the score.
- 60 inches — breed standard ideal, no deduction
- 61 inches — −0.15 points
- 65 inches — −1.20 points
- 68 inches — −2.55 points
- 70 inches — −3.45 points
Source: Holstein Association USA, Spring 2026 Pulse
Widen the scale, then penalise what you made room for. It reads like whiplash.
It isn’t, quite. December was a ruler problem. The association’s rationale: cows were bunching at the top of the old 61-inch ceiling, leaving classifiers little room to separate them, and their measurements showed the scale no longer matched the population. Under the new one, 60 inches reads as 25 and 65 reads as 50. Nothing got punished. Tall cows just got measured honestly.
May 2026 is a different instrument, and the association was explicit about why. The sliding scale “defines a breed standard for ideal stature for the first time” and is “designed to discourage extreme stature in the Holstein breed, while continuing to reward cows that combine balance, strength and functional correctness.” Both changes came from recommendations by the association’s Conformation Advisory Committee and Genetic Advancement Committee.
The Change That Didn’t Get a Headline
Underneath both, on its own track, CDCB revised Net Merit effective April 1, 2025.
Net Merit Weighting Shift — Effective April 1, 2025
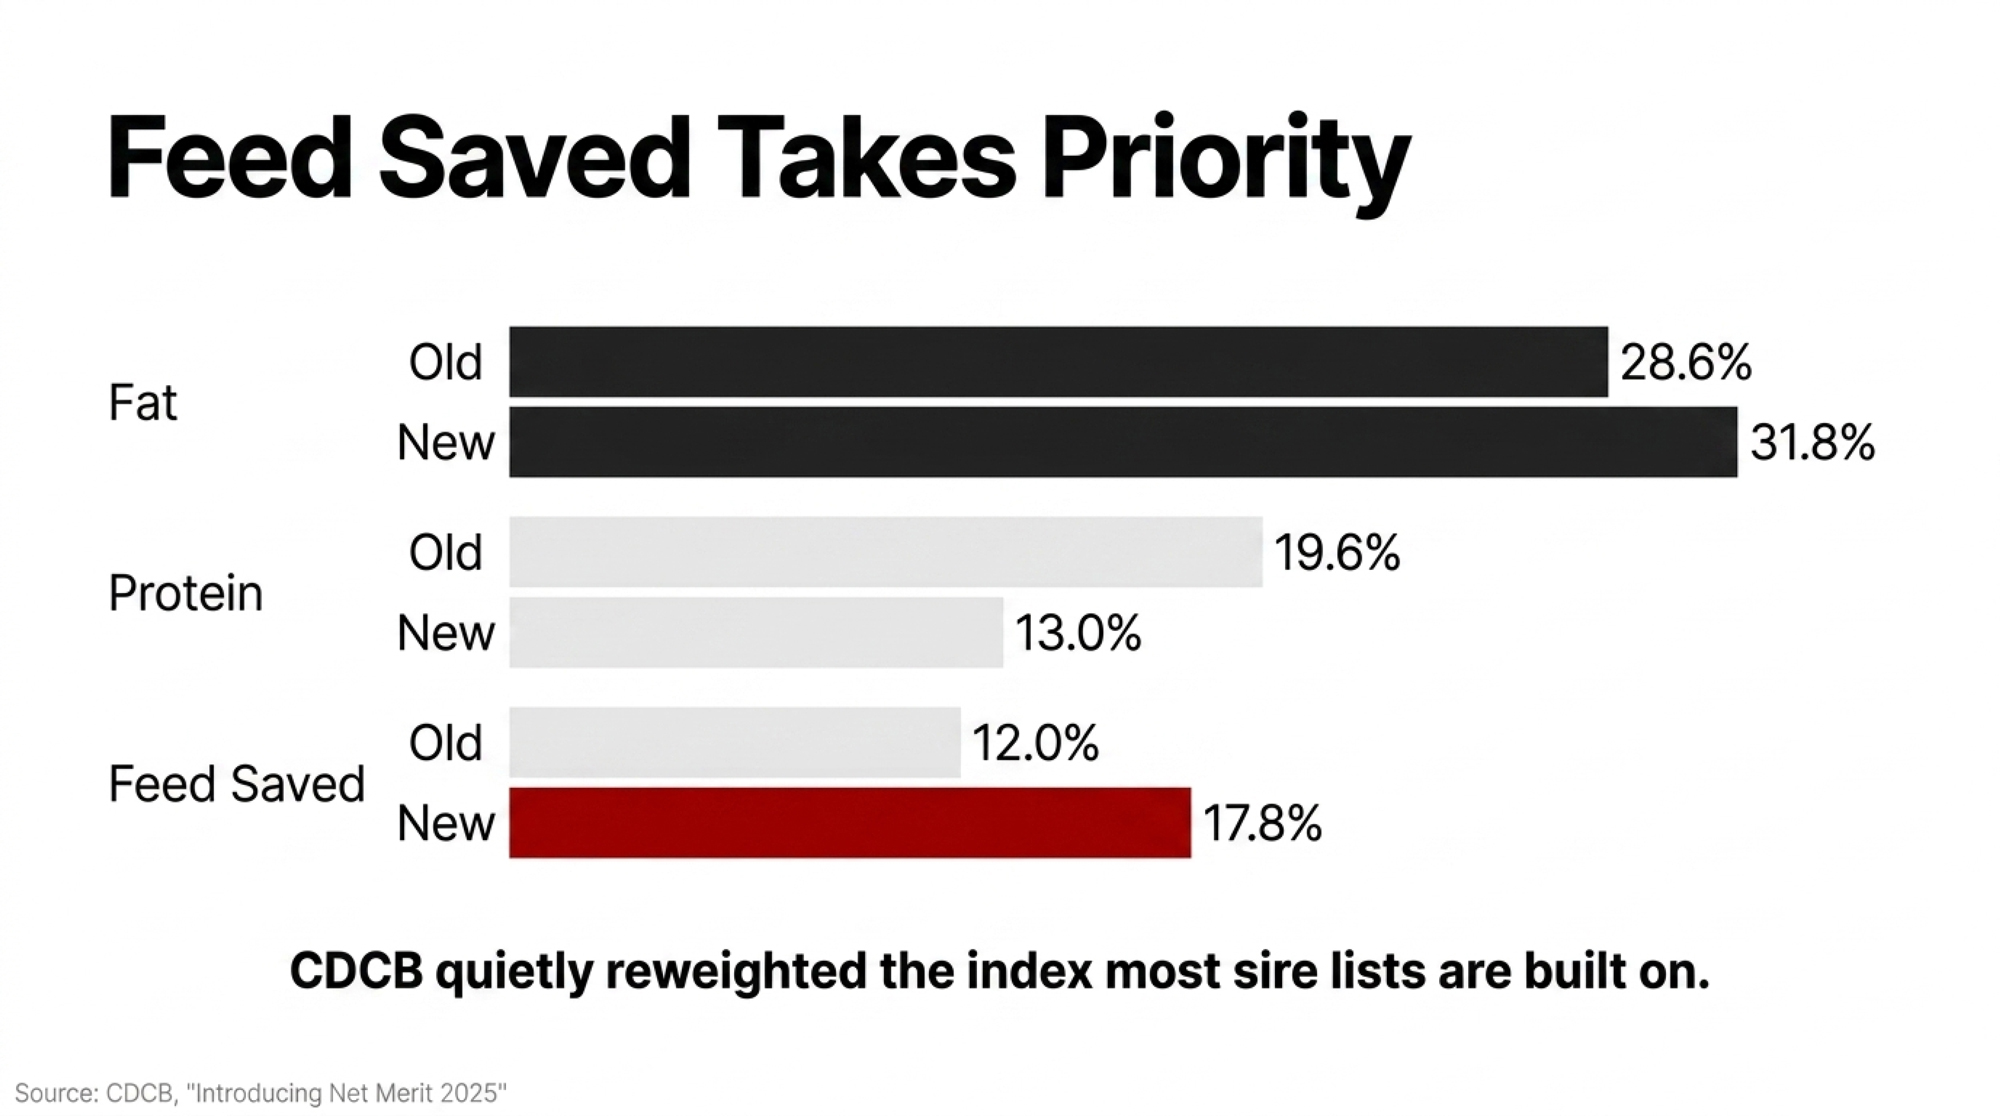
| Trait | Before | After |
| Fat | 28.6% | 31.8% |
| Protein | 19.6% | 13.0% |
| Feed Saved (combined) | 12.0% | 17.8% |
| Body Weight Composite | Included in Feed Saved bundle | Economic weight more negative — CDCB states the direction; no standalone percentage published |
Source: CDCB, “Introducing Net Merit 2025,” January 30, 2025. Board approval December 18, 2024.
No classification-run headline for that one. It just quietly reweighted the index a lot of sire lists get built on.
Careful what you read into the timing, though. CDCB and Holstein Association USA are separate organisations with separate boards and separate review cycles. Holstein Association USA’s published rationale for the stature penalty cites breed standards and functional correctness — not feed costs or Net Merit. And CDCB’s revision arrived without any public cross-reference to classification policy either. Thirteen months between CDCB’s April 2025 index change and Holstein USA’s May 2026 classification change isn’t evidence they were coordinating. Both could be downstream of the same peer-reviewed literature, which has been sitting in the Journal of Dairy Science since at least 2010.
What 1,682 Pounds Actually Costs
Here’s the barn math, and read the assumptions, because this isn’t a published finding. It’s CDCB’s spread times a feed cost, and it’s arithmetic you can check.
University of Wisconsin Extension’s feed-efficiency worked example prices dry matter at $0.15 per pound against milk revenue of $0.21 per pound. Toghiani et al. priced U.S. Holstein rations at $12 per 100 Mcal NEL and $73 per 100 kg metabolizable protein — near $0.109 per pound on a typical lactating ration. Call the working range $0.11 to $0.15, and know your own forage and ration costs can land outside it either way.
Financial Sensitivity Breakdown
| Scenario | Low feed cost ($0.11/lb DM) | High feed cost ($0.15/lb DM) |
| Per cow, per lactation | $185.02 | $252.30 |
| 100-cow herd, outer bound | $18,502/yr | $25,230/yr |
| 250-cow herd, outer bound | $46,255/yr | $63,075/yr |
| 500-cow herd, outer bound | $92,510/yr | $126,150/yr |
Bullvine calculation: 1,682 lb DM spread × feed cost. Herd figures are outer bounds only — they assume every cow descends from either the best or worst Feed Saved sire available. At a 30–35% replacement rate, you’d need roughly three years of one-directional mating to approach even half of it. A realistic first-year target is the per-cow figure applied to that year’s replacement group: on 250 cows, roughly 75–88 head, or $14,000–$22,000 depending on feed cost.
Across all genotyped animals, the range is tighter: −738 to +613 pounds, with an average PTA of about 10 pounds saved, per USDA-ARS. Use the wider bull range when you’re shopping. Use the narrower one when you’re setting herd expectations.
And here’s the part that should nag at you. On 250 cows, the gap between a $0.11 feed cost and a $0.15 one is roughly $17,000 a year all by itself. Same bulls. Same genetics. Your feed price moves this answer hard — and that’s a number you can’t get off a proof sheet.
| Feed Cost Scenario | Per-Cow/Lactation | 250-Cow Herd (Outer Bound) | Gap vs. Low Scenario |
|---|---|---|---|
| $0.11/lb DM (low) | $185.02 | $46,255/yr | — |
| $0.13/lb DM (mid) | $218.66 | $54,665/yr | +$8,410 |
| $0.15/lb DM (high) | $252.30 | $63,075/yr | +$16,820 |
Does the Tall Cow Actually Milk More?
This is where most stature conversations end at the rail, usually in the tall cow’s favour. The genetic data doesn’t really back it.
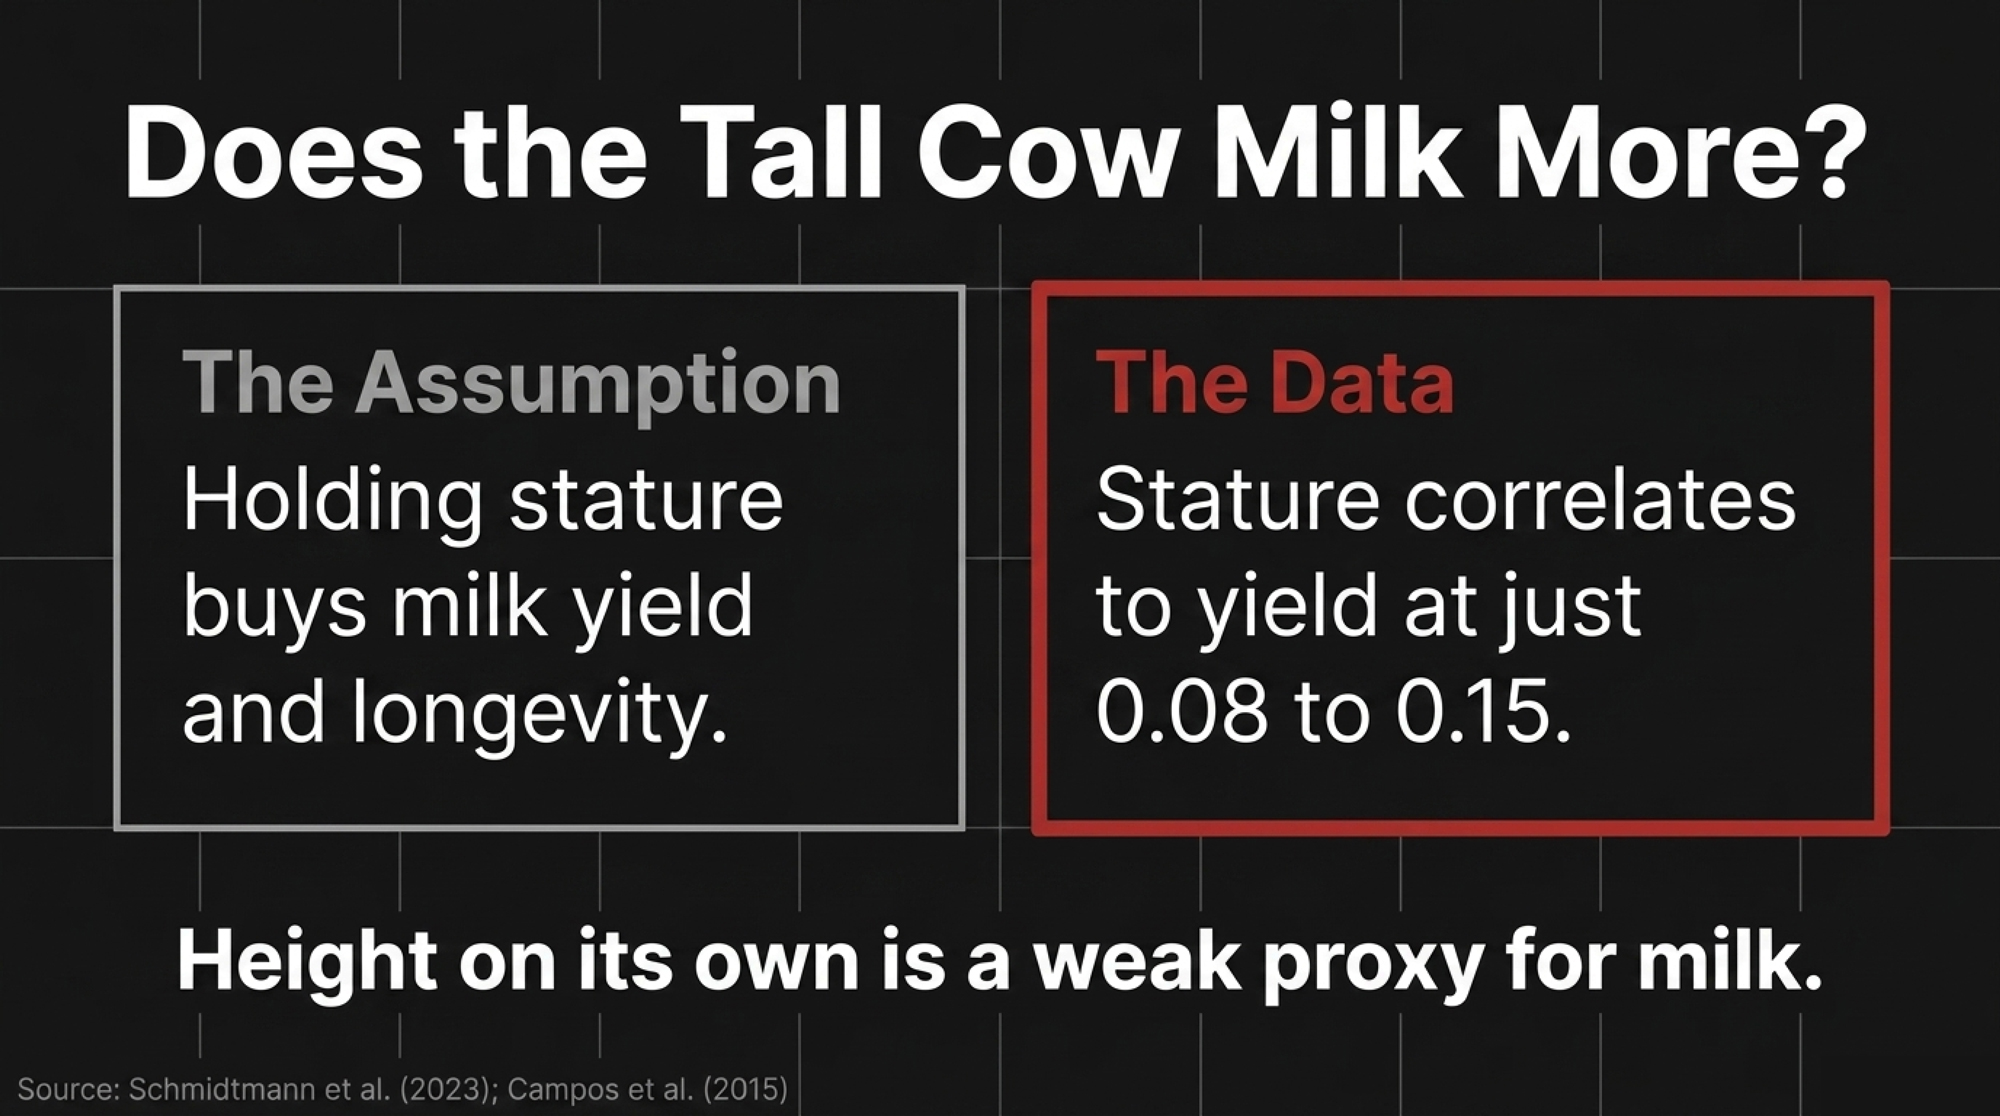
Schmidtmann et al. (2023), using German Holstein data, found stature’s genetic correlations with production traits ranged from 0.084 to 0.158 across milk, fat, and protein yield. Campos et al. (2015), looking across 21 linear type traits, put most yield correlations under 0.20 — stature well inside that band.
Body weight is a different animal — heavier cows do yield more, with the correlation shifting once you account for body condition. But height on its own is a weak proxy for milk.
Genetic Levers: Reality vs. Perception
| Trait | Heritability | Correlation to DMI | Correlation to lifetime profit | Practical takeaway |
| Stature | 0.49–0.63 | +0.52 to +0.63 | +0.06 (negligible) | High genetic response — builds size and feed cost fast with virtually no profit dividend |
| Productive Life | 0.05–0.13 | Low / variable* | High* | Direct progress is slow; work it through management and correlated composite traits |
| Udder Depth | 0.31 | Not established* | Moderate* | Roughly twice as responsive as foot angle (0.08–0.15); prime lever if culling traces to udders |
| Feed Saved | ~0.14 | Direct negative (saves DM) | High — inferred from its 17.8% Net Merit weighting | Real dollars, but 28–38% reliability — separate extremes, don’t split hairs |
Heritabilities and the stature correlations are sourced as follows: Vallimont et al., JDS 2010 (Pennsylvania research herd); Pérez-Cabal et al., Journal of Dairy Science, 2002 (Spanish Holstein population — a 24-year-old estimate, and the most direct one available); Kern et al. 2015 (Brazilian); Wasana et al. 2015 (Korean); Holstein Association USA Linear Type Evaluations; Canadian Dairy Network.
*Cells marked with an asterisk are directional professional assessments, not values drawn from the cited studies.
So the trait you can size up from across the yard tracks a cost you can’t see, barely tracks the profit you’re after, and only weakly tracks the milk you assumed you were buying. Nobody chose that on purpose. It’s a measurement gap that ran for decades before the tools existed to close it.
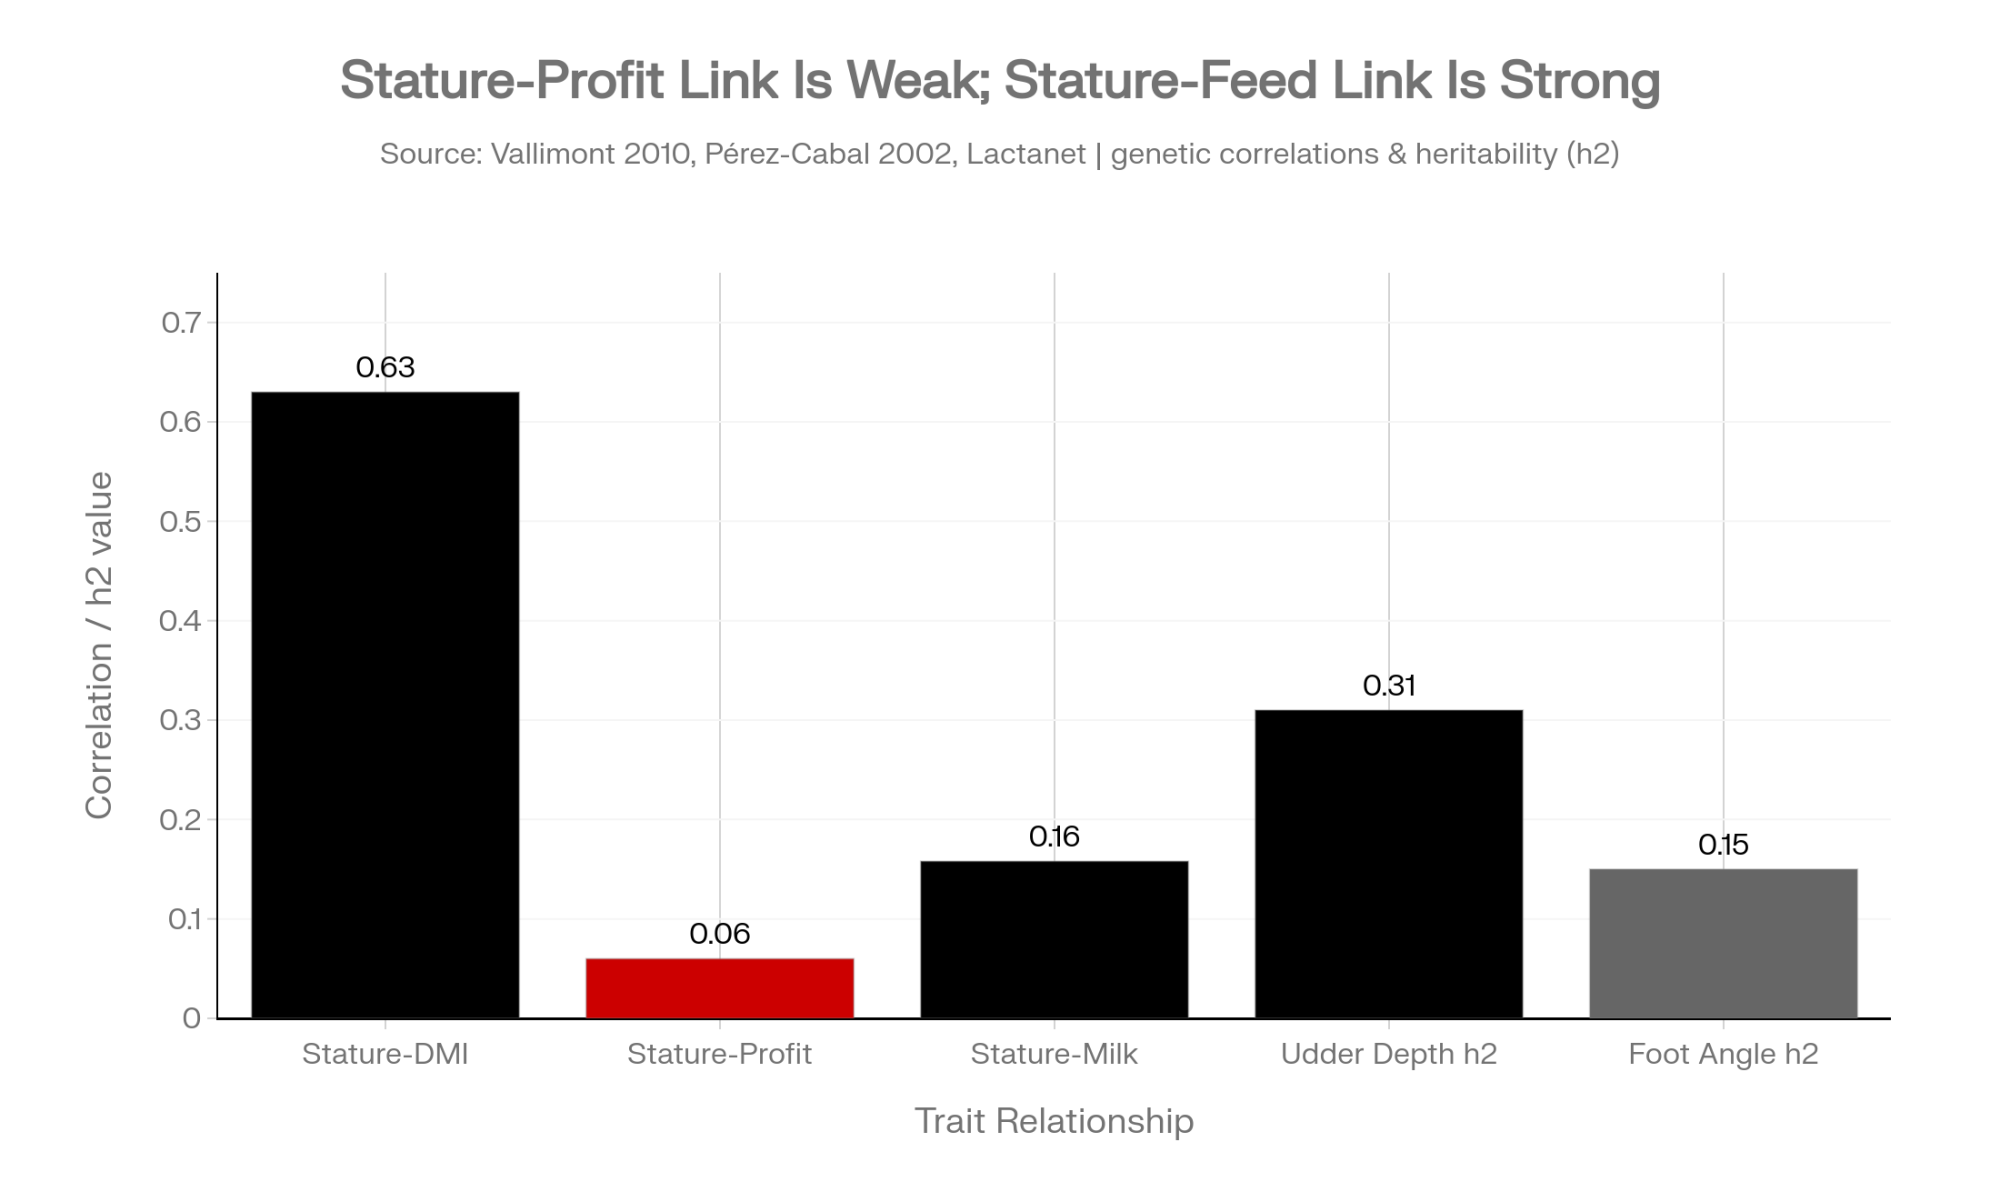
Put the heritability columns side by side and the last forty years make sense. Cow size moved fast because it was easy to select. Longevity — the thing every breeder says they want — is among the hardest traits in the barn to shift through genetics alone.
Four Paths, and What Each One Costs
| Path | Heritability / Reliability | Dollar Impact | Best Fit |
|---|---|---|---|
| Cap stature as a filter | N/A — policy lever | $0 cost, no direct gain | Almost any herd |
| Rank on Feed Saved + BWC | 28% (young) / 38% (proven) | $185–$252/cow/lactation | Herds chasing feed cost first |
| Chase longevity via udder depth | 0.31 h² (vs. 0.15 foot angle) | Indirect, high long-term | Culling problems traced to udders |
| Wait / hold steady | N/A | Opportunity cost only | Moderate-framed, decent feed conversion herds |
Path 1 — Cap stature as a filter, not a ranking trait
- Set the ceiling near 0.0 PTA, then rank survivors on everything else
- Fits almost any herd; costs nothing to apply
- Limit: a ceiling buys you nothing if you then rank survivors on the same traits you always did
Path 2 — Move Feed Saved and BWC into primary ranking
- This is where the dollars are: $185–$252 per cow per lactation across the full spread
- Reliability caution: CDCB reports Feed Saved reliabilities averaging 28% for young genomic bulls, 38% for progeny-tested. Thin against traits you’re used to trusting, because the dry matter intake phenotype database is still small
- Feed efficiency heritability sits near 14%
- Practical read: separate clear extremes, don’t split hairs between two bulls three points apart. Firmer ground on progeny-tested sires
Path 3 — Chase longevity sideways
- Direct PL selection is slow at 0.05–0.13 heritability
- Udder depth carries 0.31 heritability against foot angle’s 0.15 — roughly twice the response for the same selection pressure
- Lactanet’s Canadian estimates run the same direction: udder depth 0.31, foot angle 0.08
- Best fit: herds whose culling sheet keeps pointing at udders
- Honest caveat: no study in hand quantifies how much faster indirect selection moves Productive Life in this specific context
Path 4 — Or wait
- Reasonable if your herd’s already moderate-framed and feed conversion is decent
- Cost of waiting: each lactation is another cycle of Body Weight Composite drag before any correction compounds
- Context: VikingGenetics roughly doubled Saved Feed’s weighting in its Holstein NTM index, from 6.2% to 11.4%, per the company’s own documentation. Several evaluation systems are moving in the same direction independently.
Is Your Sire List Behind, or Is the Data Just Too New?
Depends which change you mean. Net Merit’s revision took effect April 1, 2025, so it’s had four full proof runs to work through rankings. The classification penalty started with the May 2026 run — roughly three months of data as of now.
Which is why one claim circulating in trade coverage deserves a flag: that cows under 60 inches show 25% longer longevity. No primary source for it turned up in this research. No named study, no institution, no population — it appears only in secondary aggregation. Don’t build a culling threshold on it.
Use the same caution on the softer version, common in recent coverage, that the May 2026 penalty has already delivered measurable longevity or profitability gains. Three months of classification data can’t carry that, whatever direction the underlying biology points.
What This Means for Your Operation
- Pull Feed Saved and BWC on every bull in your tank this month. If your rep quotes index totals only, ask for the component traits by name. That’s the 30-day move, and it’s one phone call.
- Ask whether each Feed Saved figure came from a progeny-tested or young genomic bull. At 38% versus 28% reliability, that distinction should change how hard you lean on it.
- Work out your own feed cost per pound of dry matter before using any per-cow figure here. The $185–$252 range swings entirely on that input.
- If a bull’s stature PTA sits above 0.0, ask what you’re getting for it. Correlation to milk yield is 0.084–0.158. If the answer is “he’s just tall,” that’s not a reason.
- If longevity is the problem, put the pressure on udder depth before foot angle. Twice the response for the same effort.
- Treat the May 2026 penalty as policy, not proven outcome. Three months isn’t a longevity dataset.
Key Takeaways
- If your ration runs near $0.15/lb DM, the Feed Saved spread is worth roughly $252/cow/lactation — first trait to fix. Nearer $0.11 and it’s $185, still real money, but other traits may earn the priority.
- If you’re selecting young genomic bulls on Feed Saved, treat 28% reliability as a reason to separate extremes only.
- If you’ve held stature because you believe it buys milk, the published correlation is 0.084–0.158. That belief is doing less work than you think.
- If your culling problem is udders rather than feet, you’re in luck — udder depth is the more heritable trait by a factor of two.
- If anyone quotes you a “25% longer longevity” figure for sub-60-inch cows, ask for the study. There doesn’t appear to be one.
- If you’re changing sire strategy this fall, plan on the replacement-group figure — $14,000–$22,000 on a 250-cow herd in year one — not the upper bound.
Run It Against Your Own Records
Pull your top and bottom quartile by frame. Look at their lifetime margin across three lactations. See whether your barn agrees with Pérez-Cabal’s 0.06 or argues with it — because a Spanish population estimate from 2002 can tell you where the odds sit, but it can’t tell you what happened in your own freestalls.
That’s answerable from your records this month. So what would you do differently if the tall ones came out ahead?
Complete references and supporting documentation are available upon request by contacting the editorial team at editor@thebullvine.com.
Learn More
- 7 Steps to Enhancing Performance and Reducing Feed Costs in Dairy Cattle — Arm your ration strategy with concrete bunk management, forage testing protocols, and dry matter intake controls to capture immediate day-to-day feeding margins while long-term genetics compound.
- Everything Dairy Farmers Need to Know About Residual Feed Intake — Unpack the biological engine behind Feed Saved evaluations to position your five-year breeding goals around true metabolic efficiency rather than misleading body size proxies.
- Cracking the Code: Behavioral Traits and Feed Efficiency — Exposes how automated sensor data on rumination and resting time acts as a high-heritability proxy for individual intake, bypassing low-reliability genomic estimates.
 The Sunday Read Dairy Professionals Don’t Skip.
 The Sunday Read Dairy Professionals Don’t Skip.
Every week, thousands of producers, breeders, and industry insiders open Bullvine Weekly for genetics insights, market shifts, and profit strategies they won’t find anywhere else. One email. Five minutes. Smarter decisions all week.
