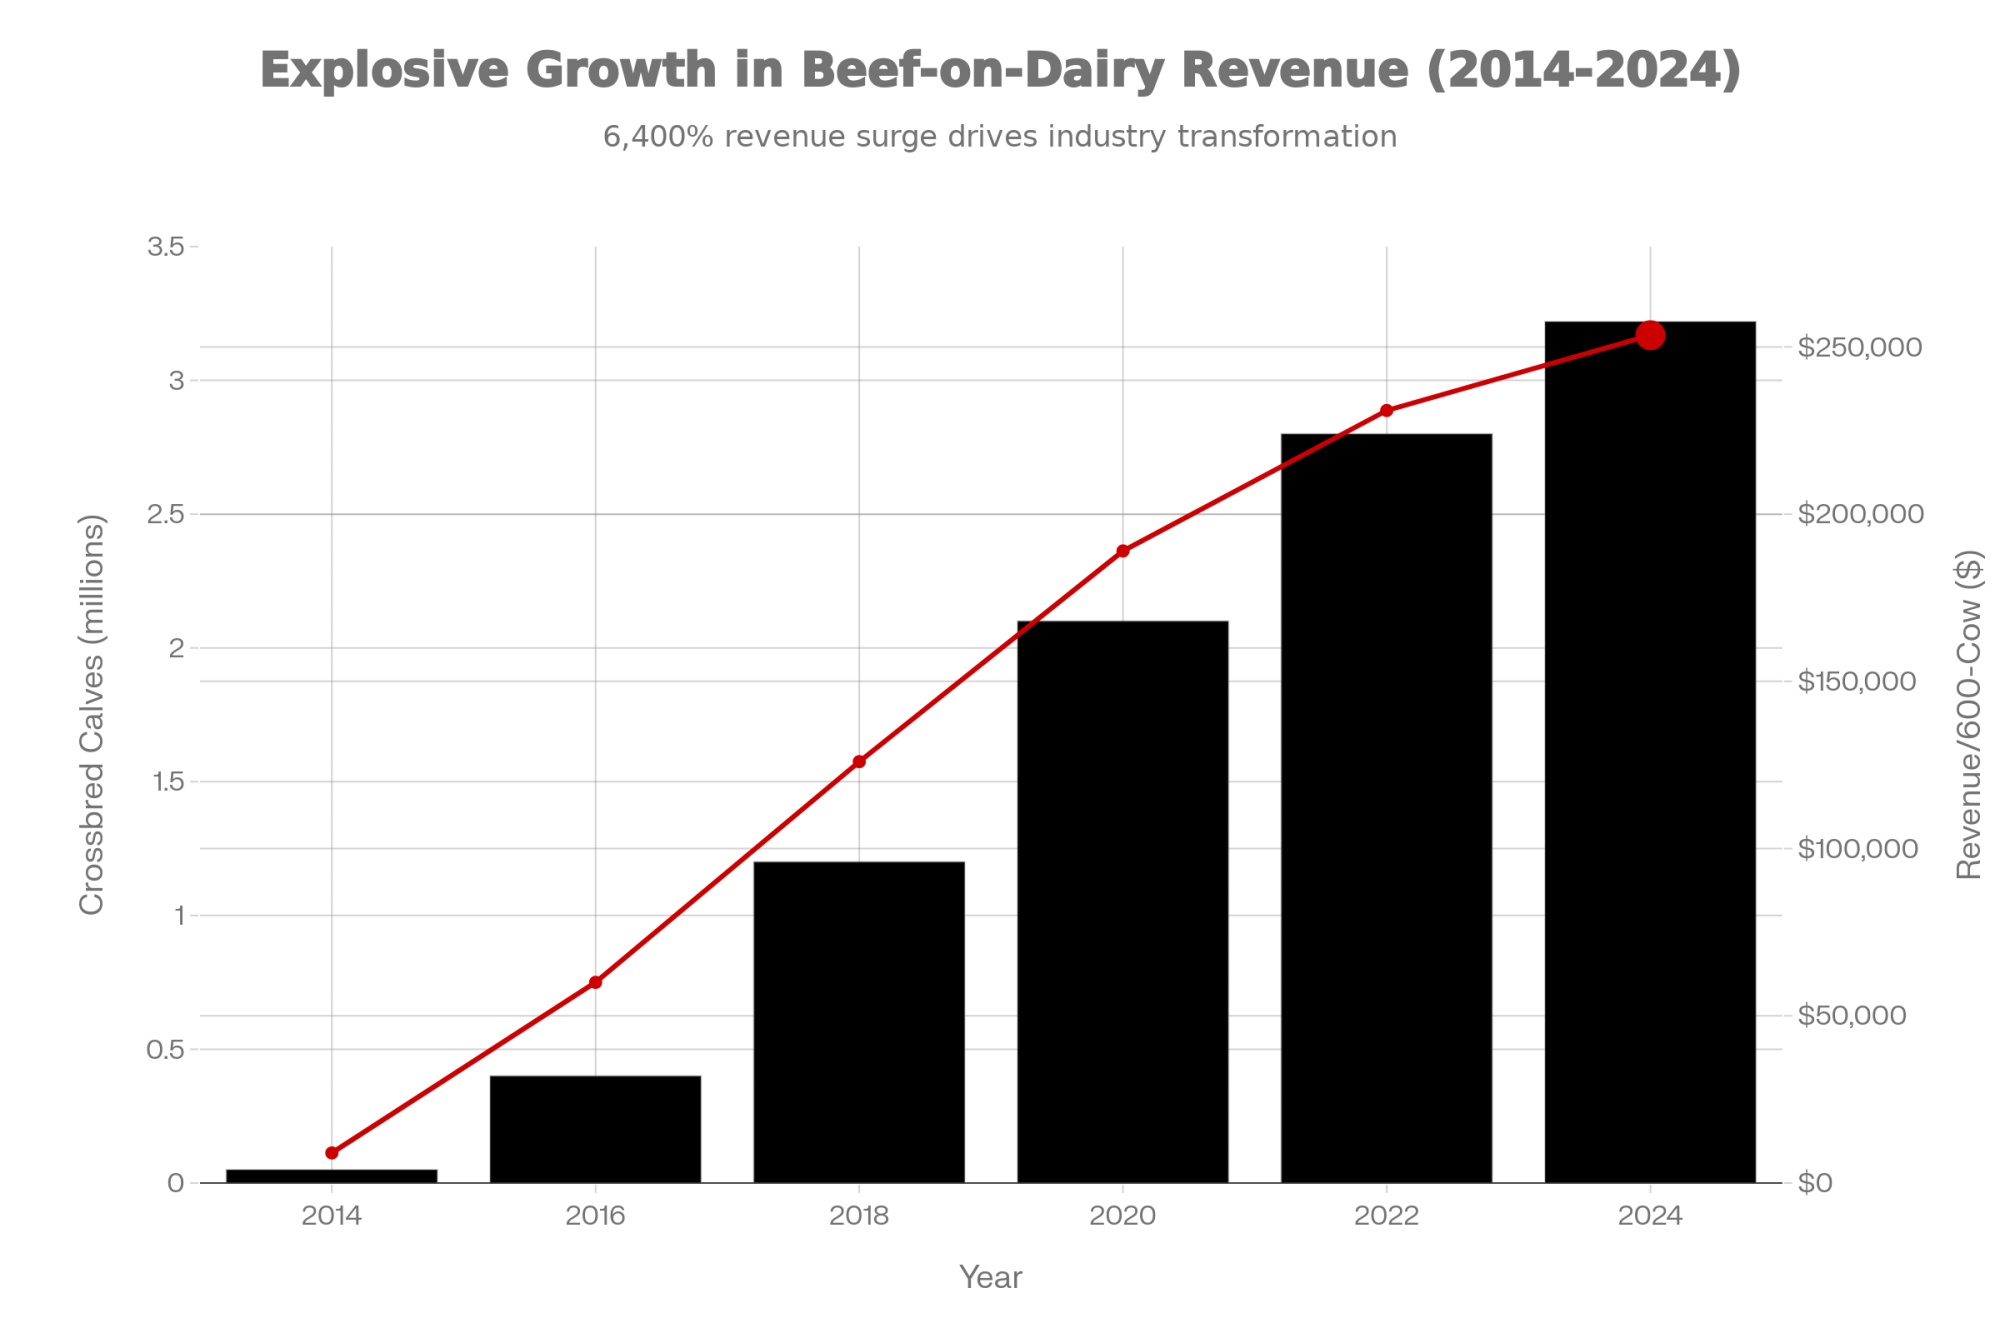
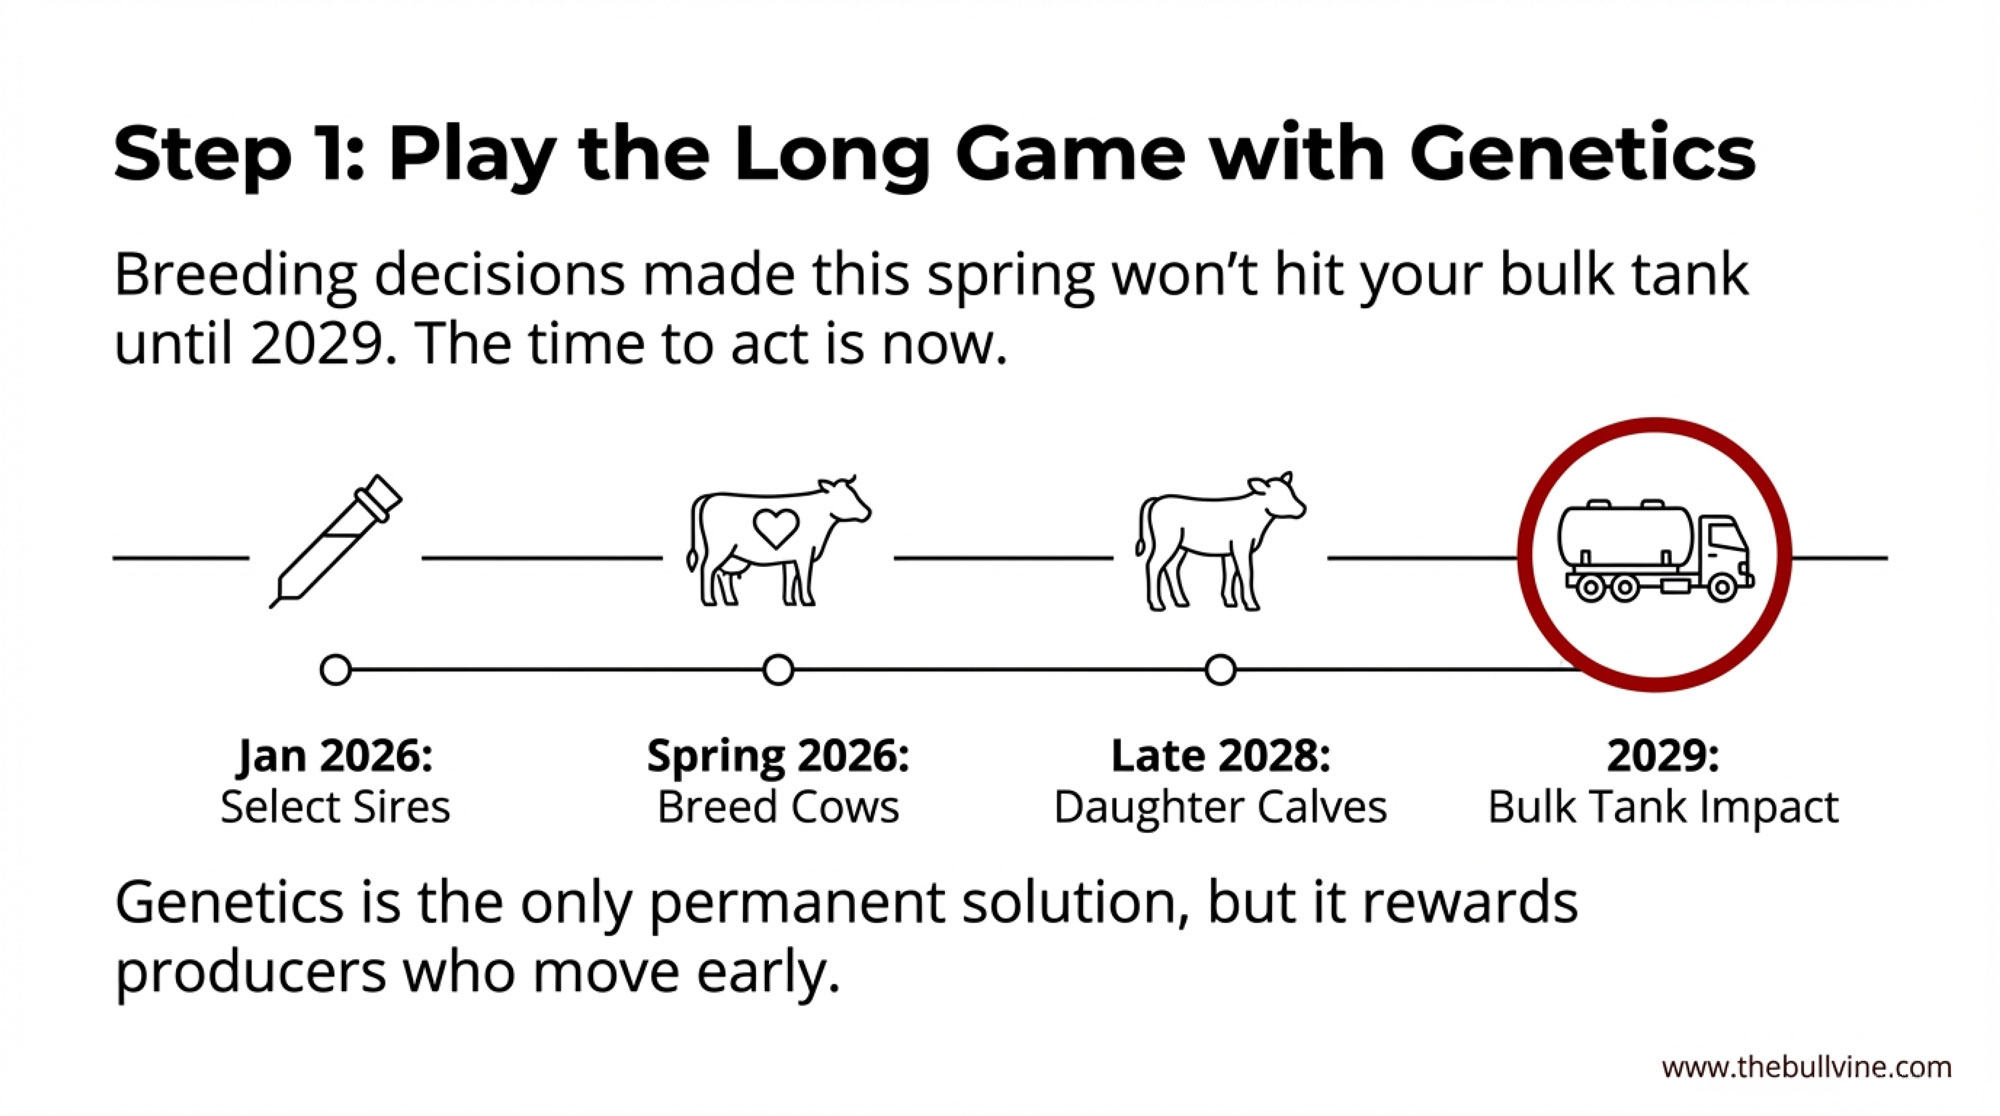
Secretariat’s Derby record is 53 years old. U.S. milk-per-cow is up 248% since he was born. One industry weaponized artificial insemination and genomics. The other banned the tools. Where’s your calf crop in that gap?
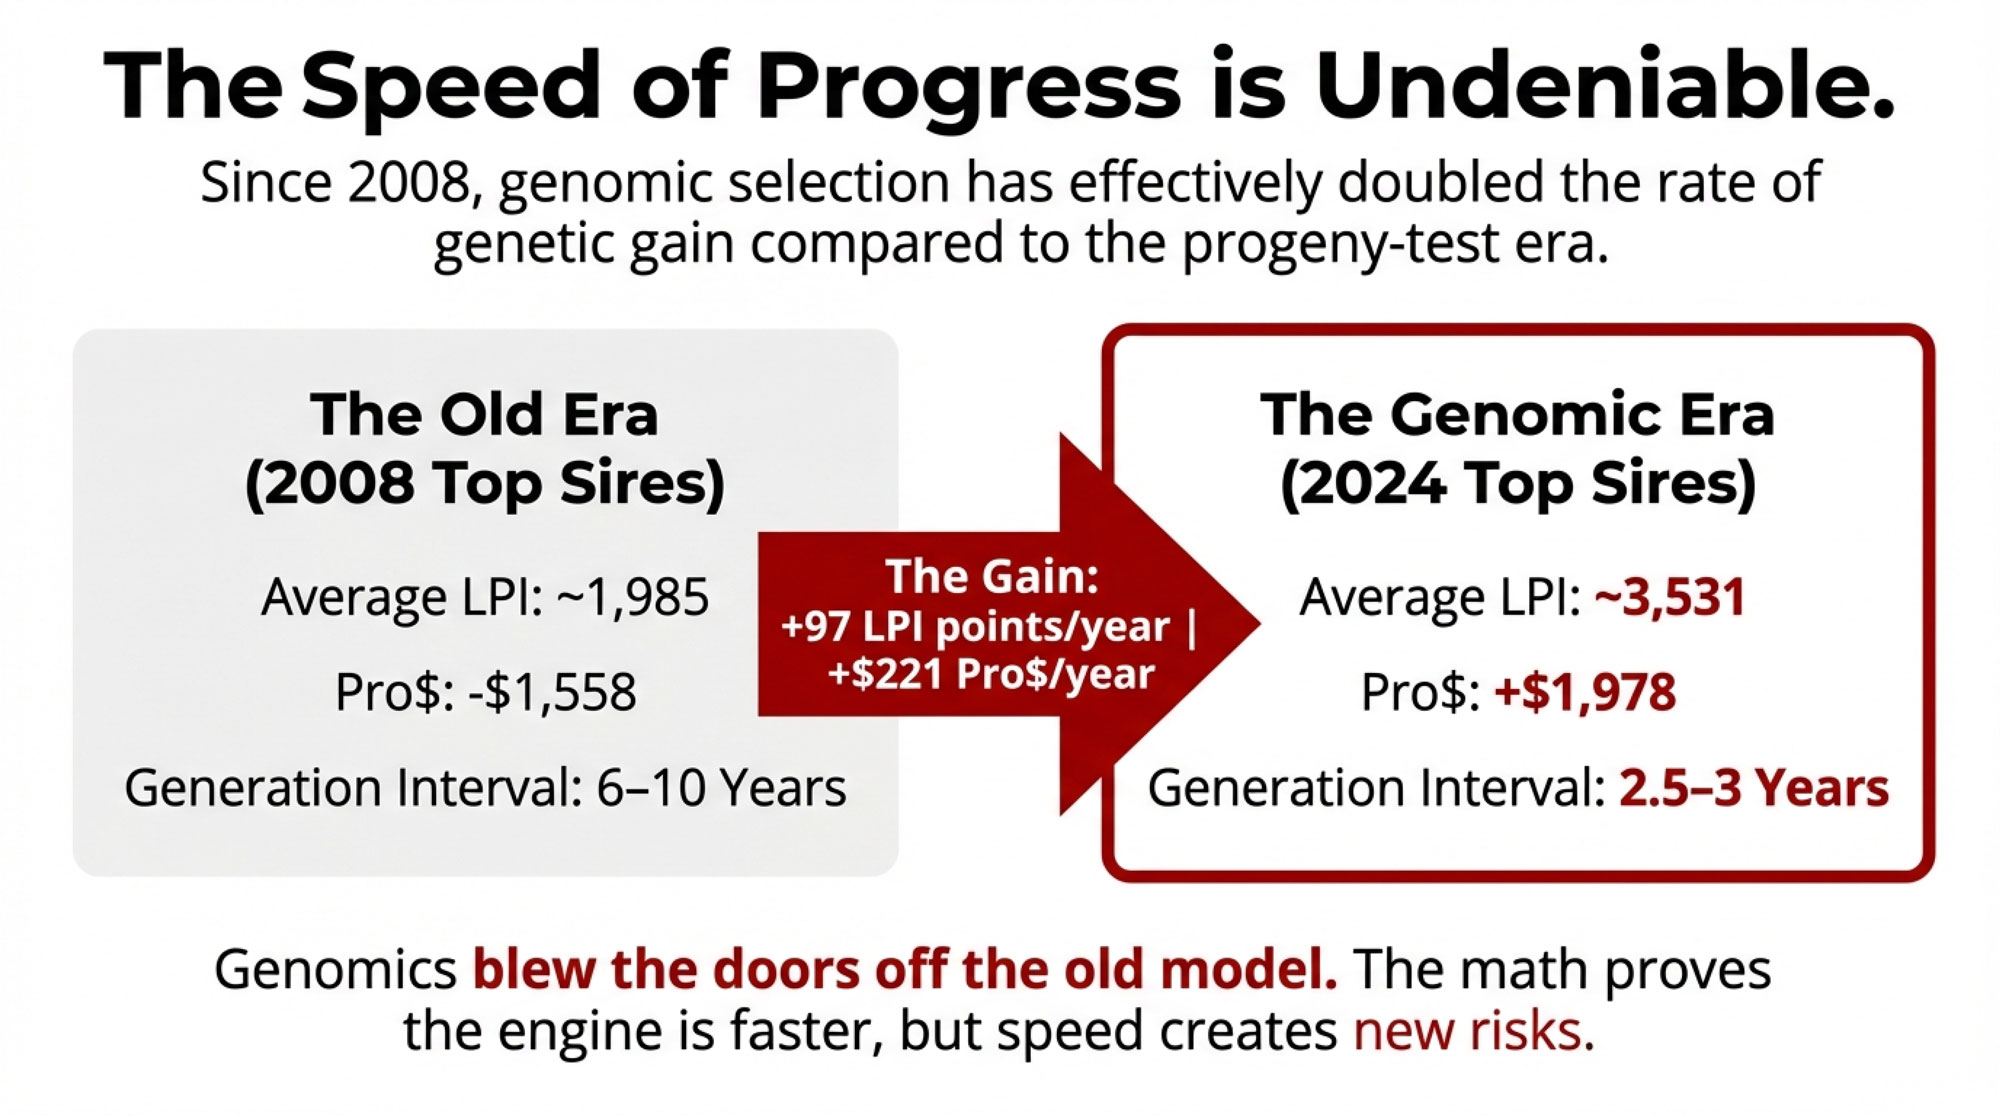
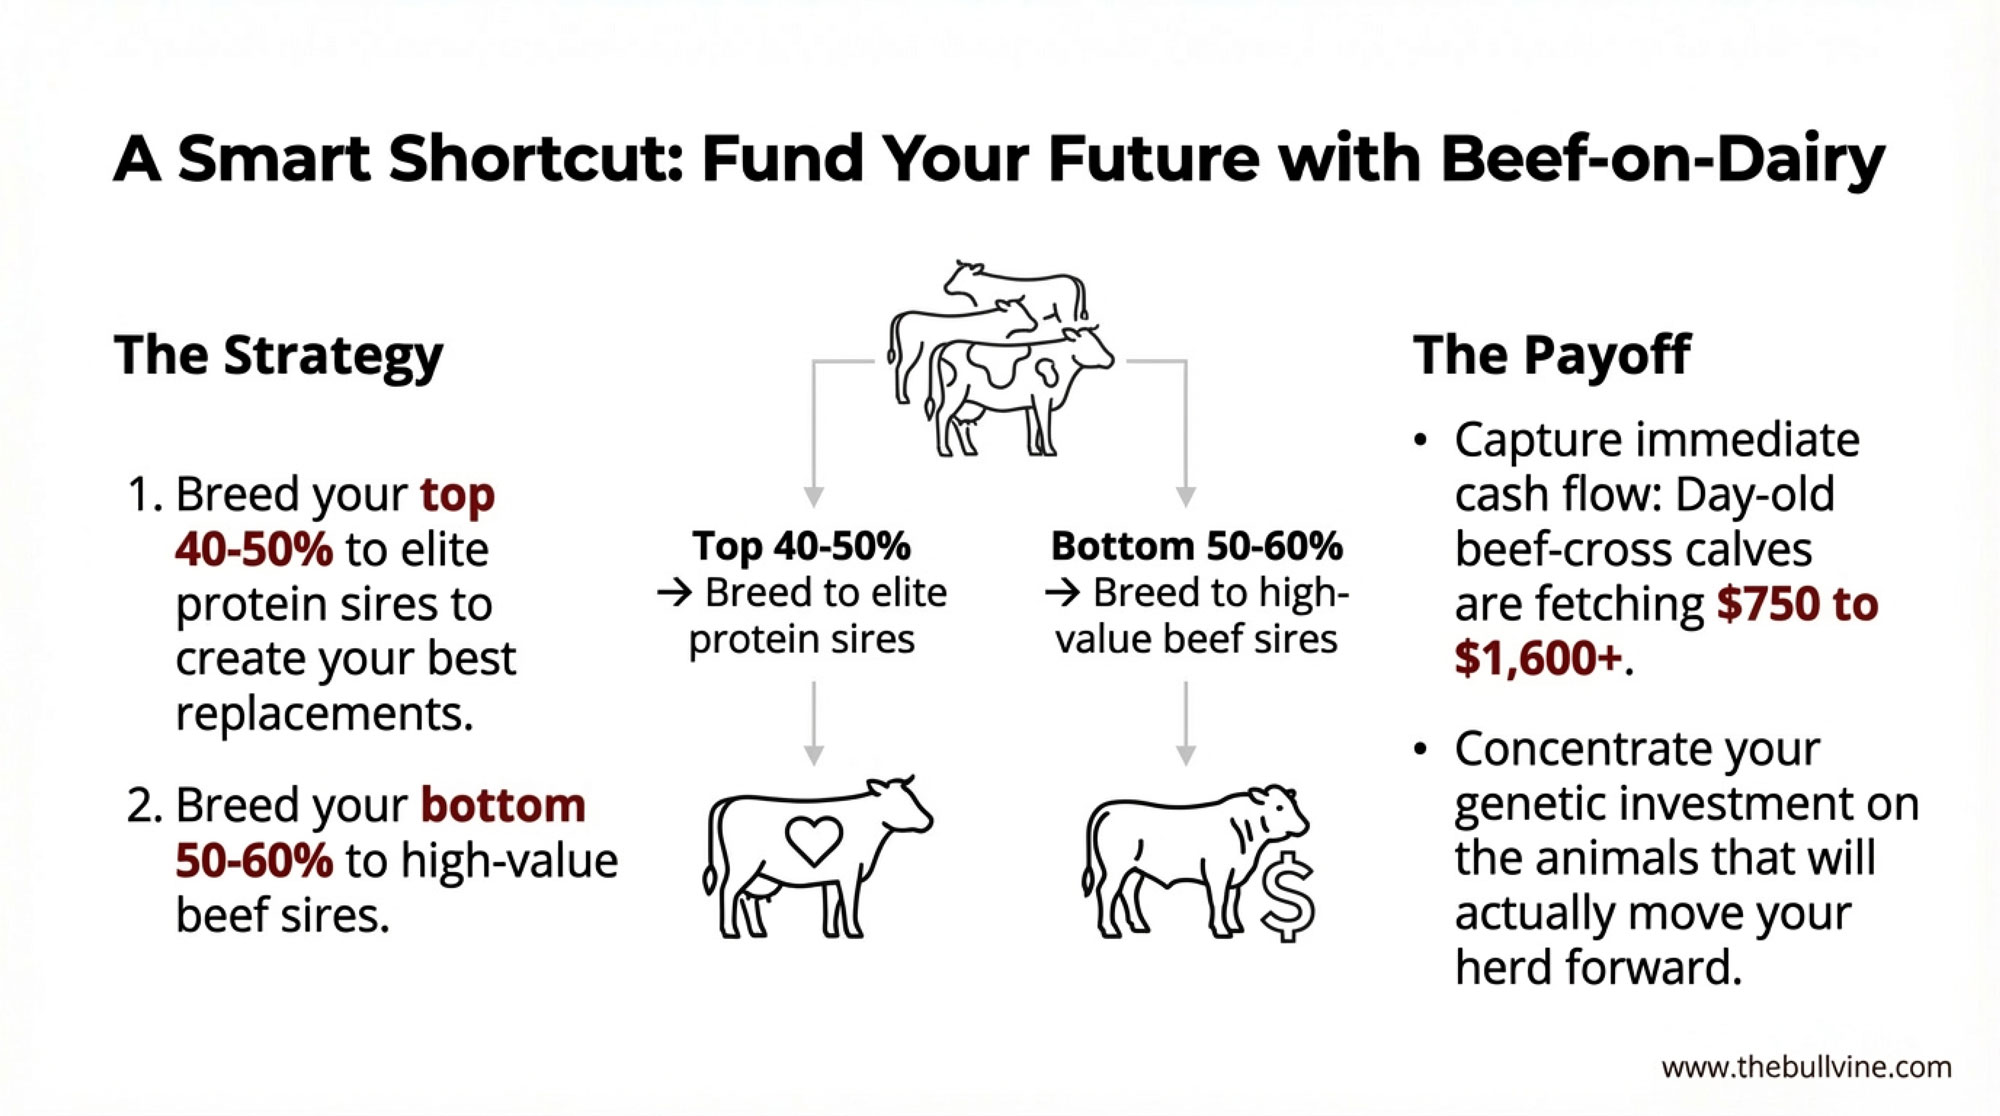
Executive Summary: Secretariat’s Kentucky Derby record is 53 years old and U.S. milk-per-cow is up 248% since he was born — not because of biology, but because the Jockey Club still bans AI, IVF, and ET while dairy weaponized all three plus genomic selection since 2009. The annual rate of Holstein genetic gain jumped more than 40-fold inside one decade, from roughly $1.80/year in Net Merit pre-genomics to $79.20–$85.00/year by the CDCB 2016–2020 window. KHW Regiment Apple-Red-ET, bred by Kamps-Hollow Holsteins, now carries more than 350 direct progeny — more than an entire stable of thoroughbred mares will produce across their combined lifetimes. But the uncomfortable number for your operation is this: genetics advisors consistently see 35–45% of replacement heifers in genomic-testing herds coming from the bottom half of the dam distribution, meaning your sire lineup is compounding while your dam decisions sit flat. On a 300-cow Holstein illustration, a 200-point NM$ spread between top and bottom quartiles equals 2.5 years of industry-average progress sitting inside the same barn — and an 8-month OPU flush versus a first-lactation flush compresses or extends 2 years of generation interval per calf. Run the one-hour quartile diagnostic this month before the next proof run: pull your last two calf crops, match each heifer to her dam’s genomic rank at conception, and count the bottom half. If 35% or more of your heifers are coming from there, your decision architecture — not your tool access — is what’s capping your herd’s runway.
Churchill Downs, first turn — a field of three-year-olds under the Twin Spires chasing a record that’s stood since 1973. Same 65 years U.S. milk-per-cow climbed 248%. One industry banned the tools. The other weaponized them.
Somewhere in Louisville this afternoon, a three-year-old thoroughbred worth more than most dairy operations will leave the gate at Churchill Downs and run for roses. Odds are, the winner’s time won’t touch Secretariat’s 1:59.40 from May 1973 — a Derby record that’s now stood for 53 years across an industry awash in discretionary capital.
Meanwhile, the U.S. dairy cow has gotten 248% better at her job in roughly the same window — a gain built on artificial insemination, IVF, embryo transfer, and, since 2009, dairy genomic selection. That gap — flat racing clock, exponential milk curve — is the most useful lens available on Derby Day 2026 for a question most progressive Holstein breeders have never run the diagnostic on:
How much of dairy’s tool advantage is actually reaching your specific herd?
The Scoreboard on Derby Day 2026
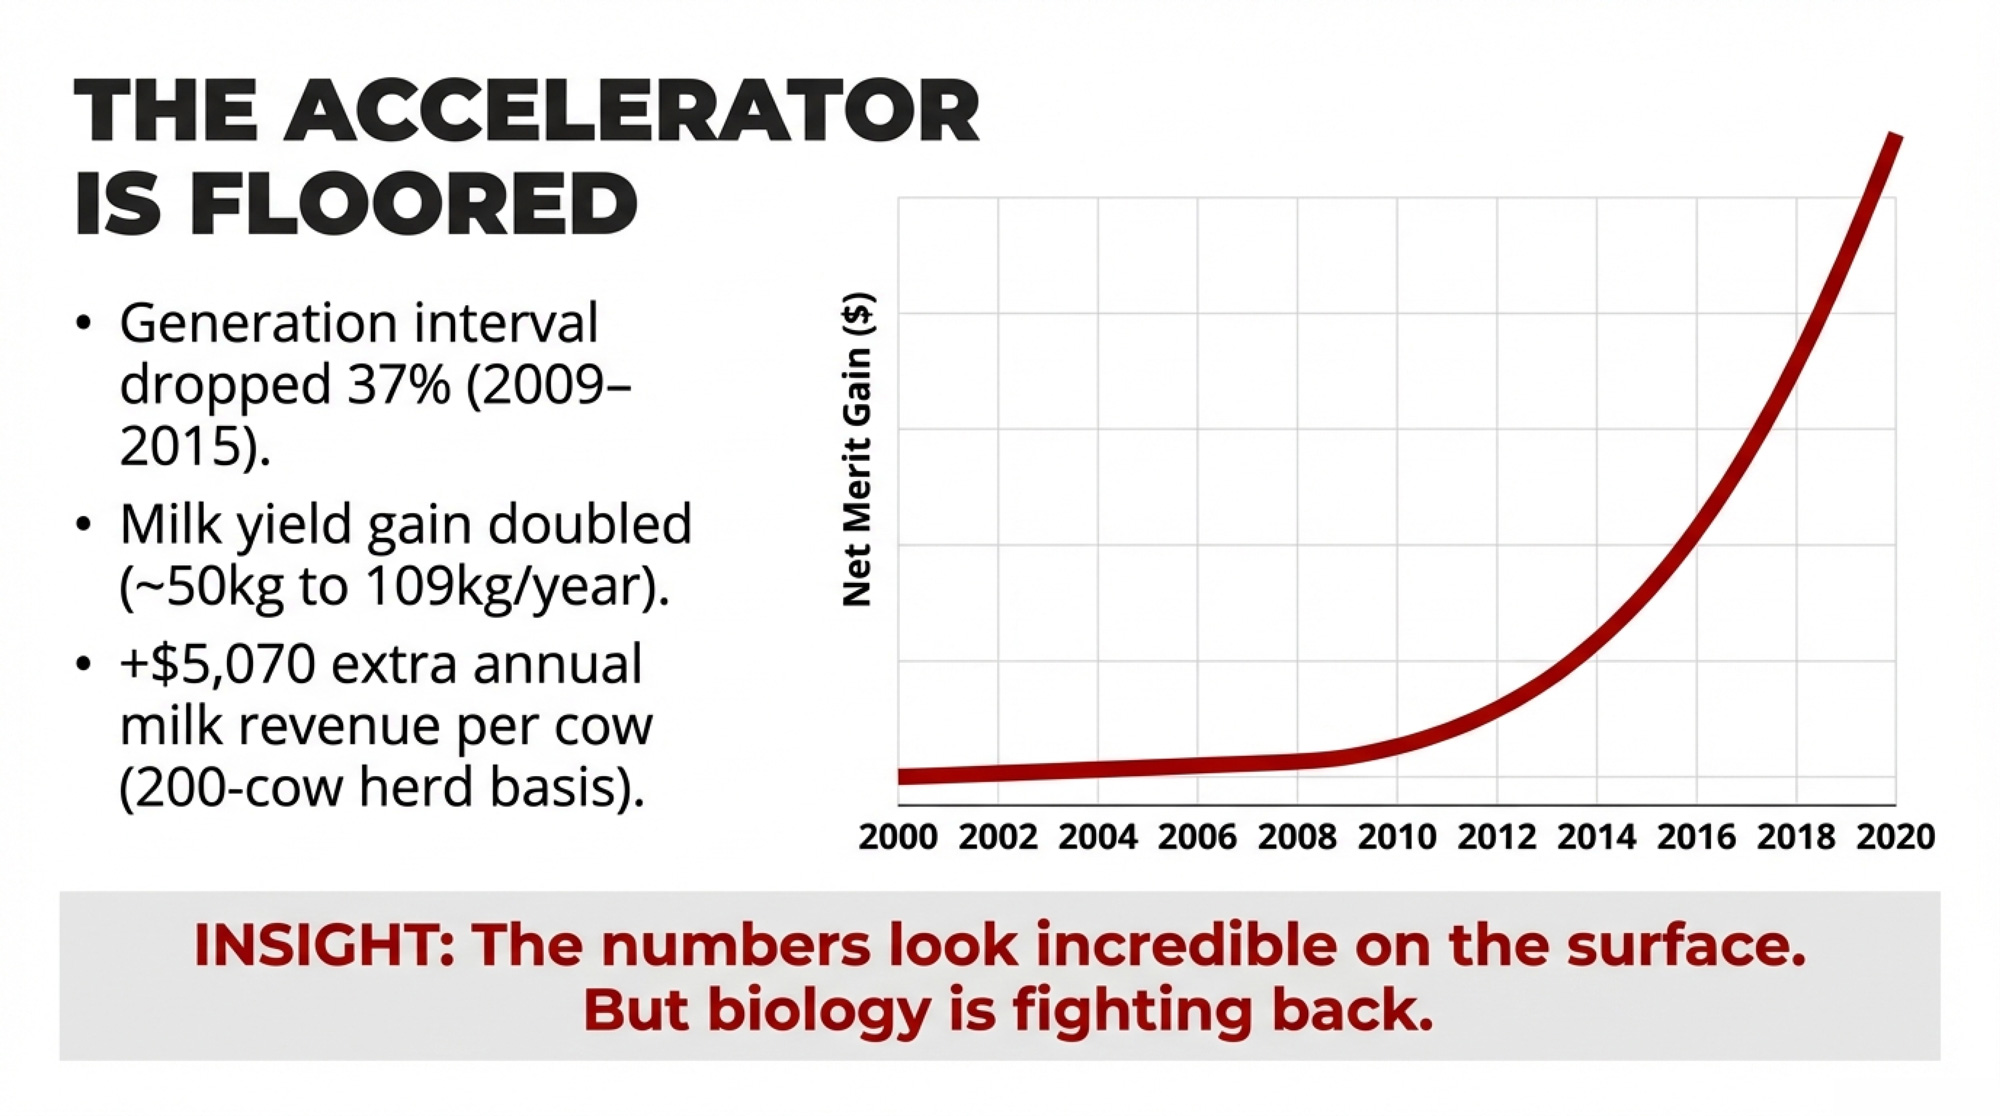
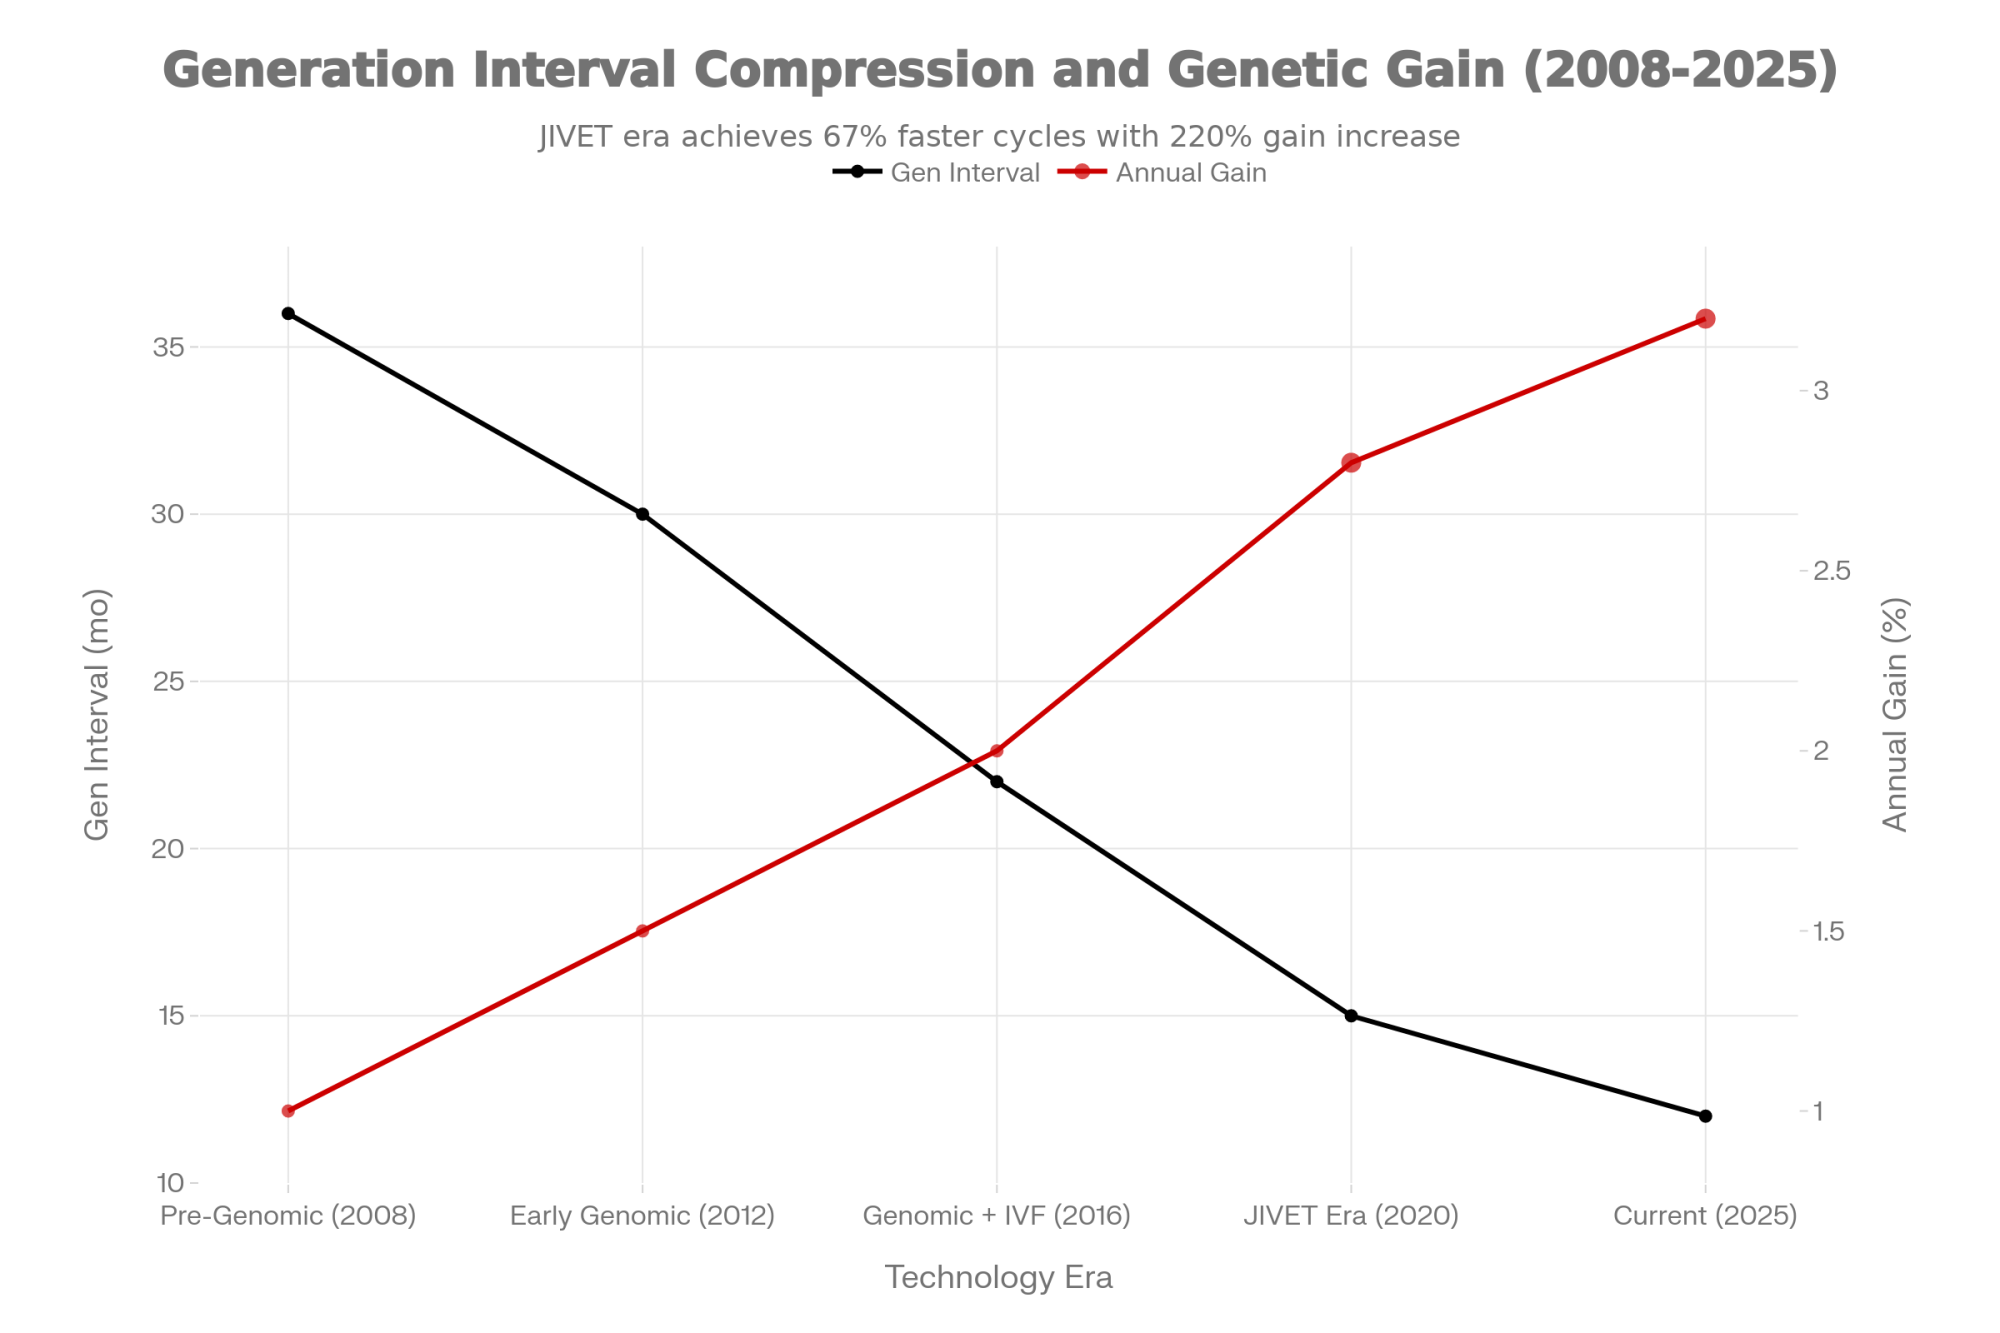
Average U.S. milk production per cow climbed from roughly 7,029 pounds in 1960 to 24,117–24,390 pounds by 2023–2025 — the 248% increase that defines modern dairy genetic gain. Annual Net Merit $ gain for U.S. Holsteins went from about $1.80 per year pre-genomics to $79.20–$85.00 by the CDCB 2016–2020 evaluation window. The annual rate of genetic gain increased more than 40-fold inside one decade.
Secretariat, blue-and-white checks, crossing the wire at Churchill Downs in 1:59.40 on May 5, 1973 — the Kentucky Derby record that’s now 53 years old and counting. Same stretch of years U.S. milk-per-cow climbed 248%. The clock hasn’t moved because the rulebook won’t let it.
Now the Derby contrast. Secretariat’s record has held for 53 years — a winning time that has barely moved across a century of racing. Thoroughbred racing commands billions in discretionary capital, elite veterinary care, and the best training money can buy. The clock has barely moved with it.
The reason isn’t biology. It’s the Jockey Club rulebook. Live cover only. No AI. No IVF. No embryo transfer. A thoroughbred mare is biologically capped at roughly 10–15 offspring across her productive lifetime because she can only produce one foal per year.
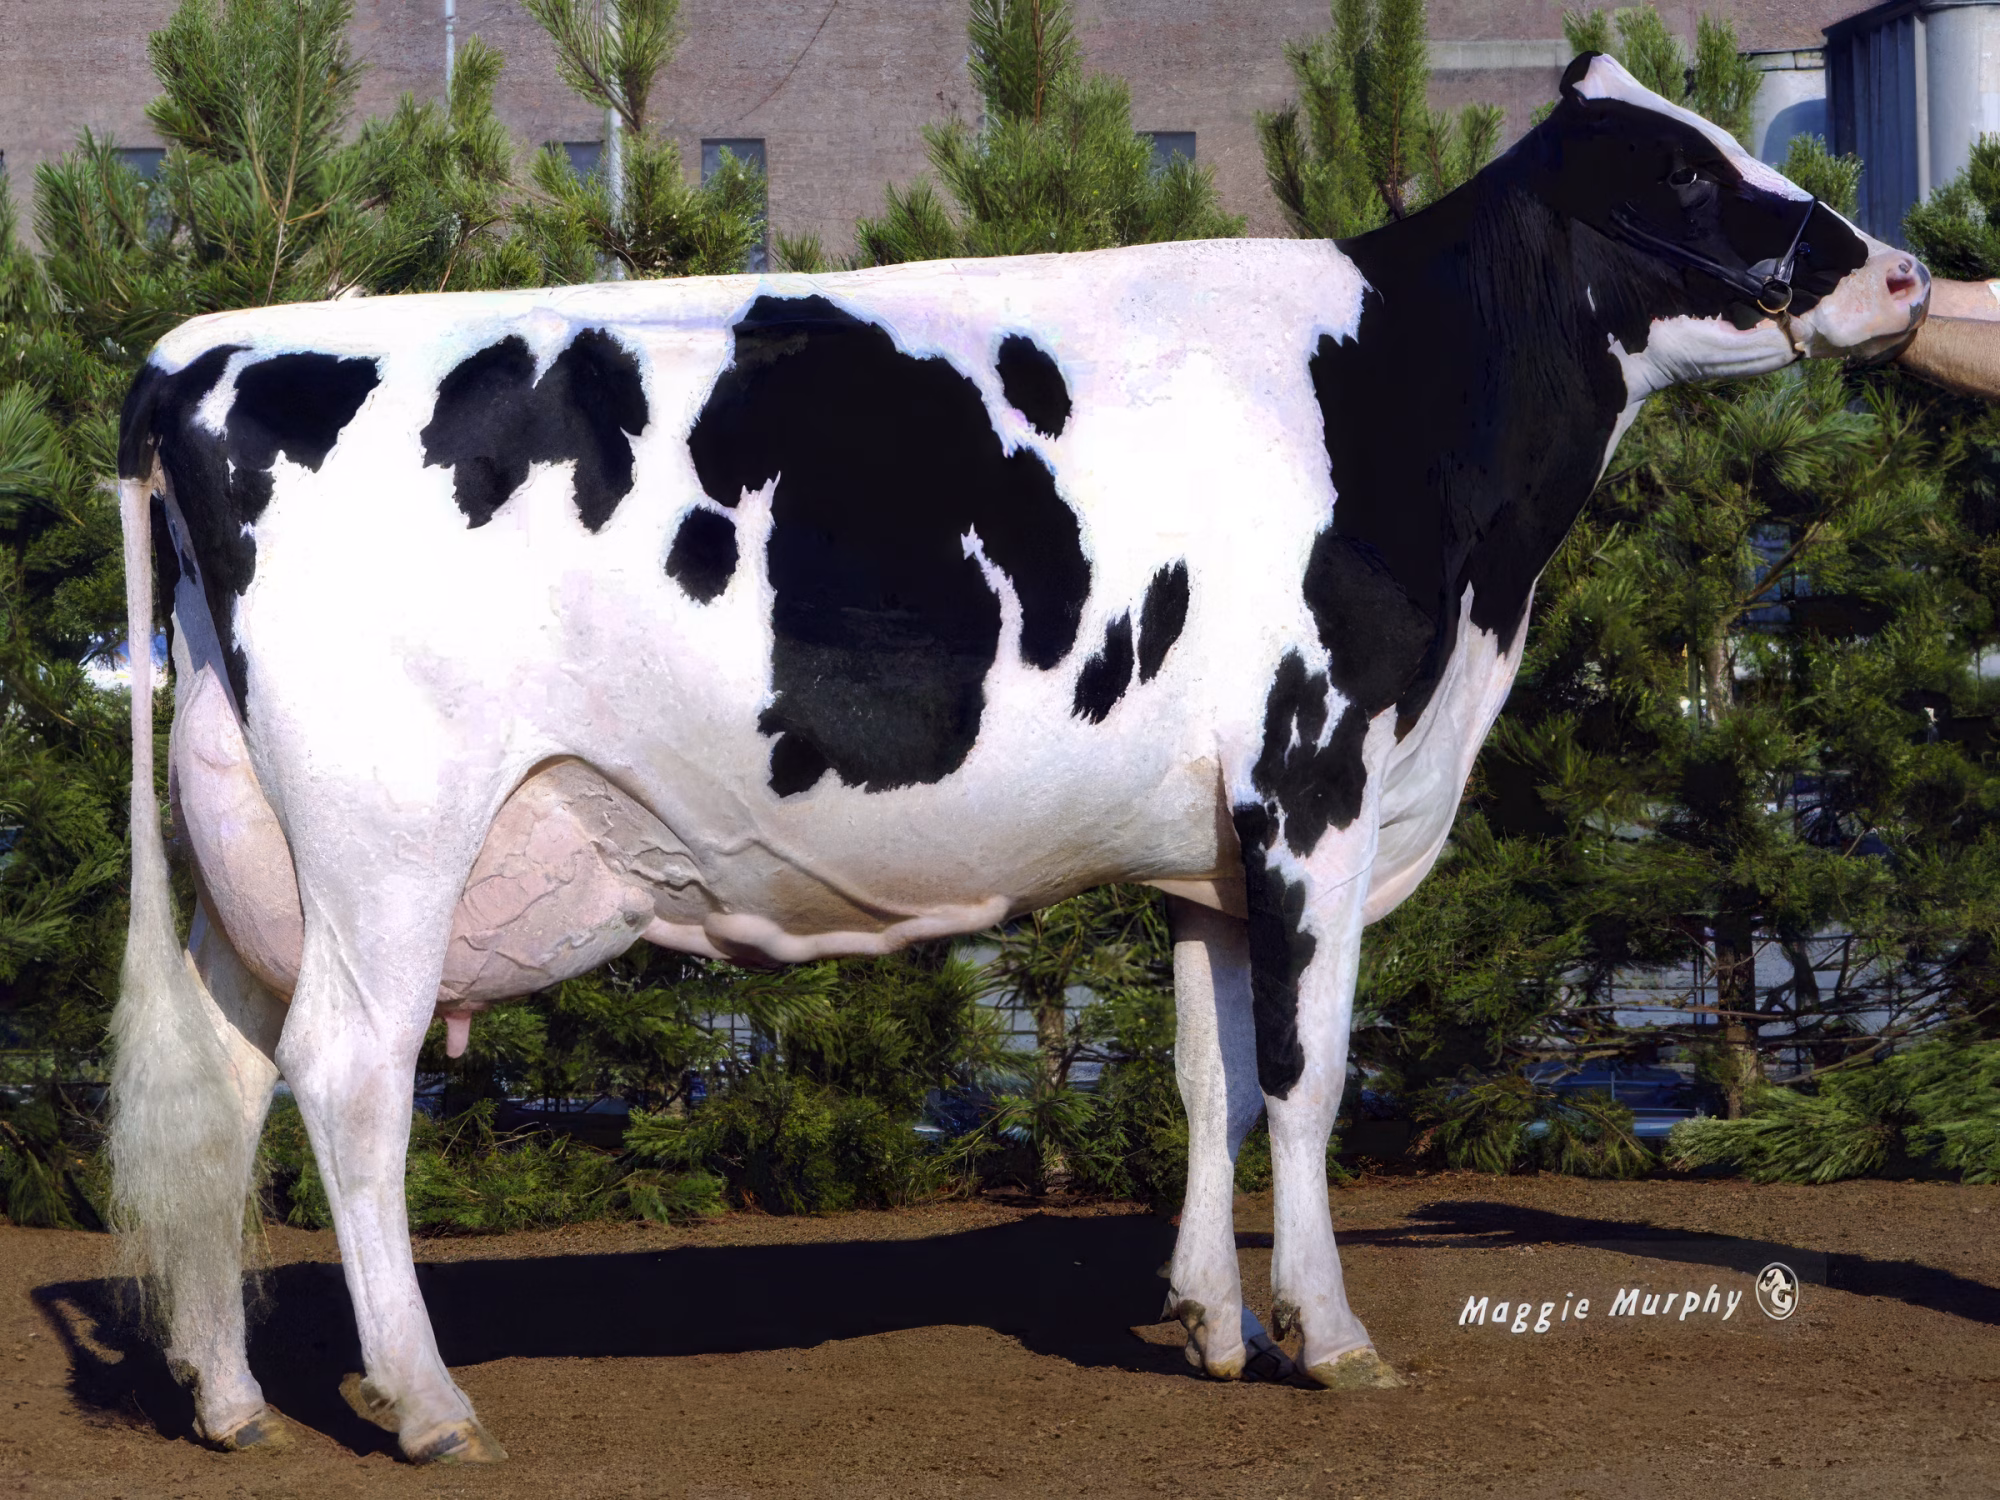
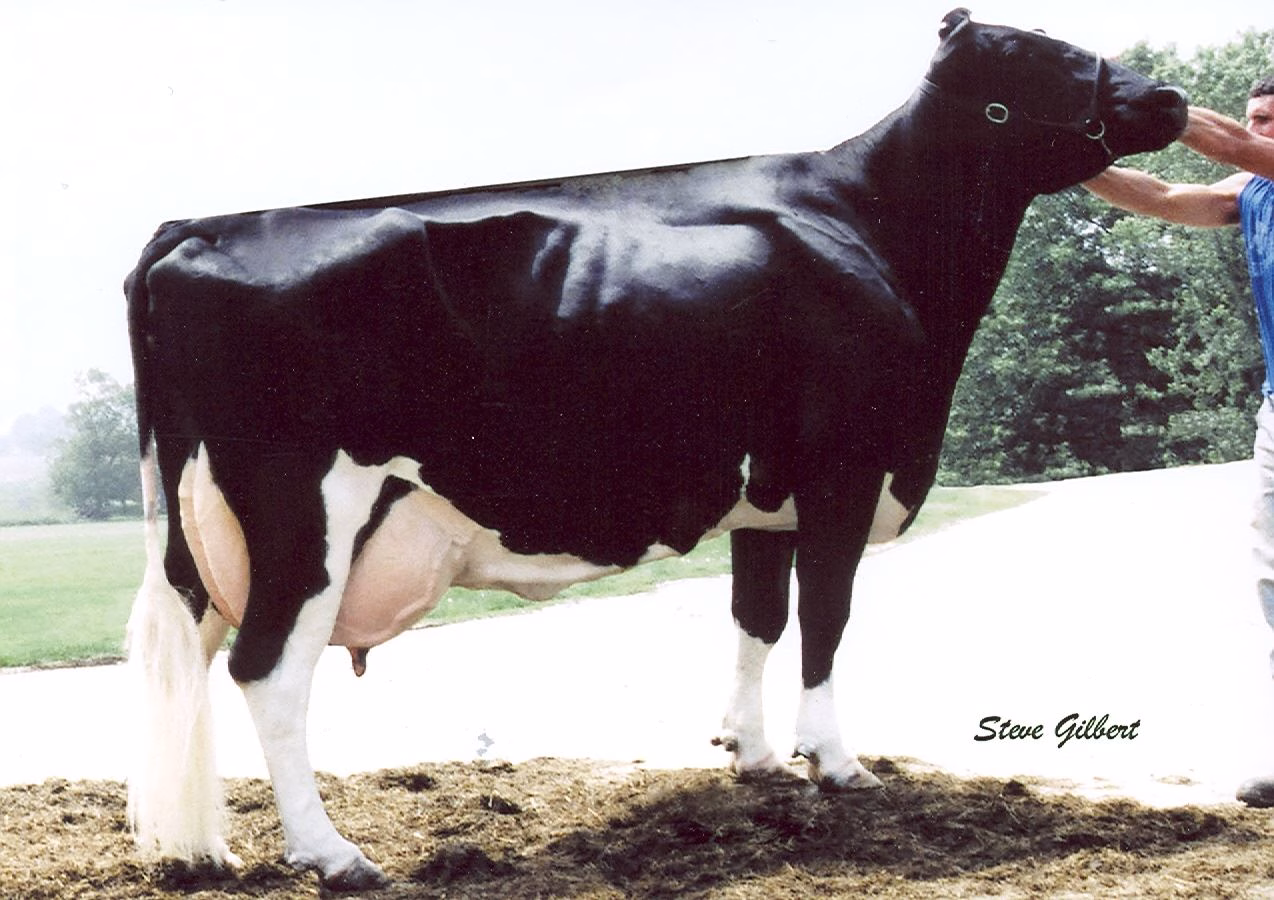
KHW Regiment Apple-Red-ET, posed on the colored shavings at The Royal — bred by Kamps-Hollow Holsteins and credited with 350+ direct progeny and 280+ Excellent-scored daughters and descendants worldwide. A single thoroughbred mare is capped at 10–15 across her whole lifetime. The tools are the difference.Read more
Did You Know? KHW Regiment Apple-Red-ET — bred by Kamps-Hollow Holsteins — is widely recognized as a landmark donor cow of the Holstein breed. Estimates credit her with more than 350 direct progeny and more than 280 Excellent-scored daughters and descendants worldwide, with a single oocyte collection session reportedly yielding 50 viable oocytes. One cow. More registered offspring than an entire stable of thoroughbred mares will produce across their combined lifetimes.
The Jockey Club’s rules aren’t accidental. They’re designed to protect a specific definition of sporting integrity, and there are thoroughbred people who would rather see Secretariat’s record stand forever than see it beaten by a genetically optimized horse. That’s a legitimate choice. It’s just a choice with a visible genetic cost.
So when the gates open at Churchill Downs this afternoon, you’re watching the cleanest control group in animal agriculture. Same century. Same species of smart, well-capitalized breeders. Tools available on one side, banned on the other. The results are on the clock.
The 45% Problem in Your Barn
The Derby clock raises an uncomfortable question for every progressive Holstein herd:
You have every tool thoroughbreds don’t — so are you actually using them?
Here’s the diagnostic that answers it, and it takes about an hour.
Pull your last two calf crops, match each heifer back to her dam’s genomic ranking at conception, split the herd into quartiles, and count. Among U.S. Holstein operations that have been genomic testing at birth for three-plus years, the number genetics advisors most often describe seeing lands somewhere between 35% and 45%.
That’s the share of your future breeding herd coming from the half of the cows you’d cull first if you were being systematic. It isn’t a knowledge gap. It’s a gap in decision architecture. And it’s the quiet reason herds with the same tools, the same semen access, and the same genomic infrastructure end up with very different rates of genetic gain five years from now.
How Does a Healthy, Productive Cow End Up Dragging Your Genetic Mean Down?
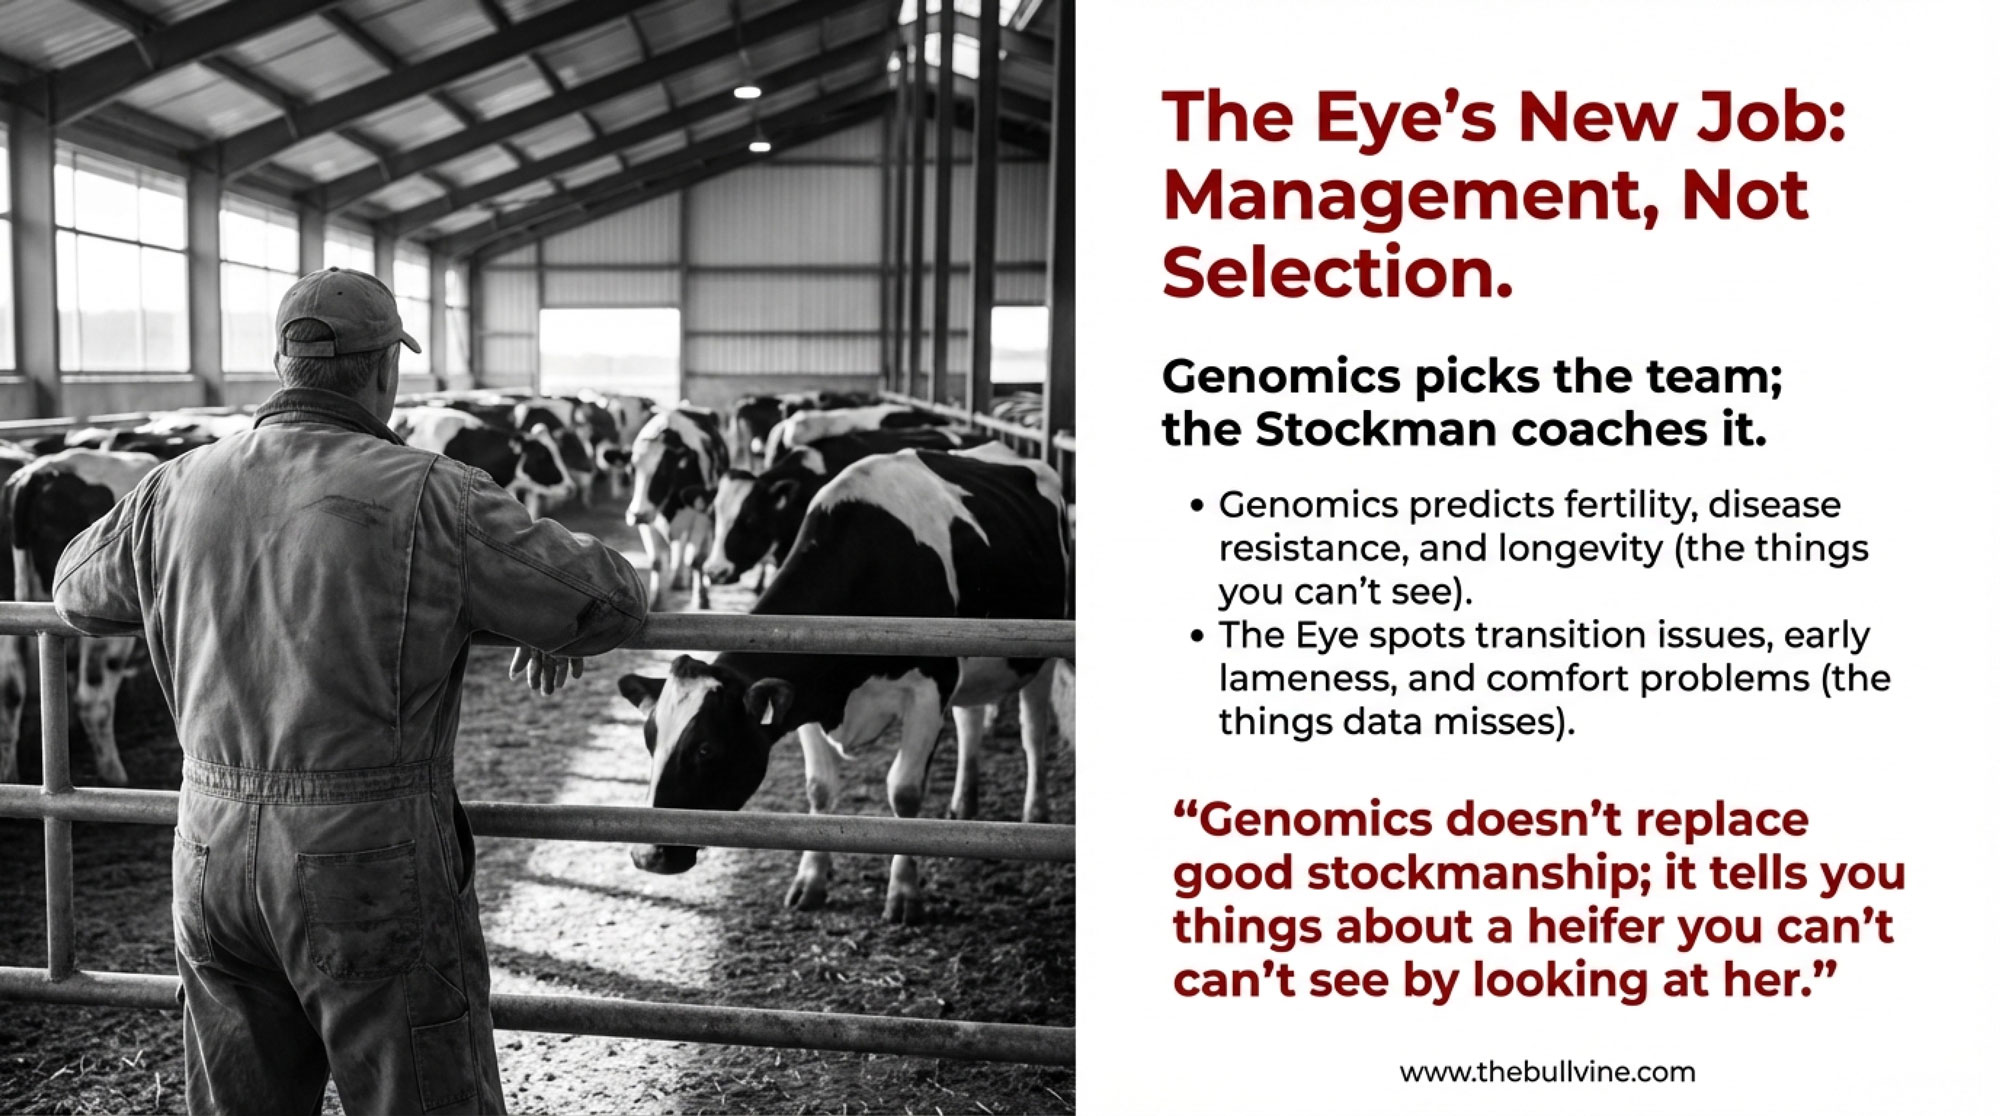
Here’s the composite scenario most genetics advisors describe. She’s milking 85 pounds. She settled on the first service. She’s healthy, she’s cycling, she hasn’t had a vet call in eight months. Every visible signal your eye has been trained to read says keep her. The genomic report, which arrived six months ago and sits in a binder somewhere, says she’s in the bottom quartile.
Those two signals aren’t in conflict biologically. Moderate producers with good health traits exist throughout the genetic distribution. But they feel like a conflict — because one is abstract and the other is standing in front of you eating hay.
So she doesn’t get culled. She gets bred back, probably to a mid-tier sire, because the elite semen is being saved for the top end of the herd. She calves. The calf is a heifer. The heifer enters the breeding pool. Two years later, when you run the diagnostic on your most recent calf crop, that heifer is part of the 45%.
Nobody decided this would happen. The repro program was built to maximize pregnancy rate and minimize days open. It does that well. But it wasn’t built to connect repro priority to genomic rank, so it didn’t. The outcome isn’t a failure of the system — it’s exactly what the system was designed to produce, and the team running it deserves credit for the competence, not blame for the gap.
What Does the Breeder’s Equation Actually Cost When You Don’t Enforce It?
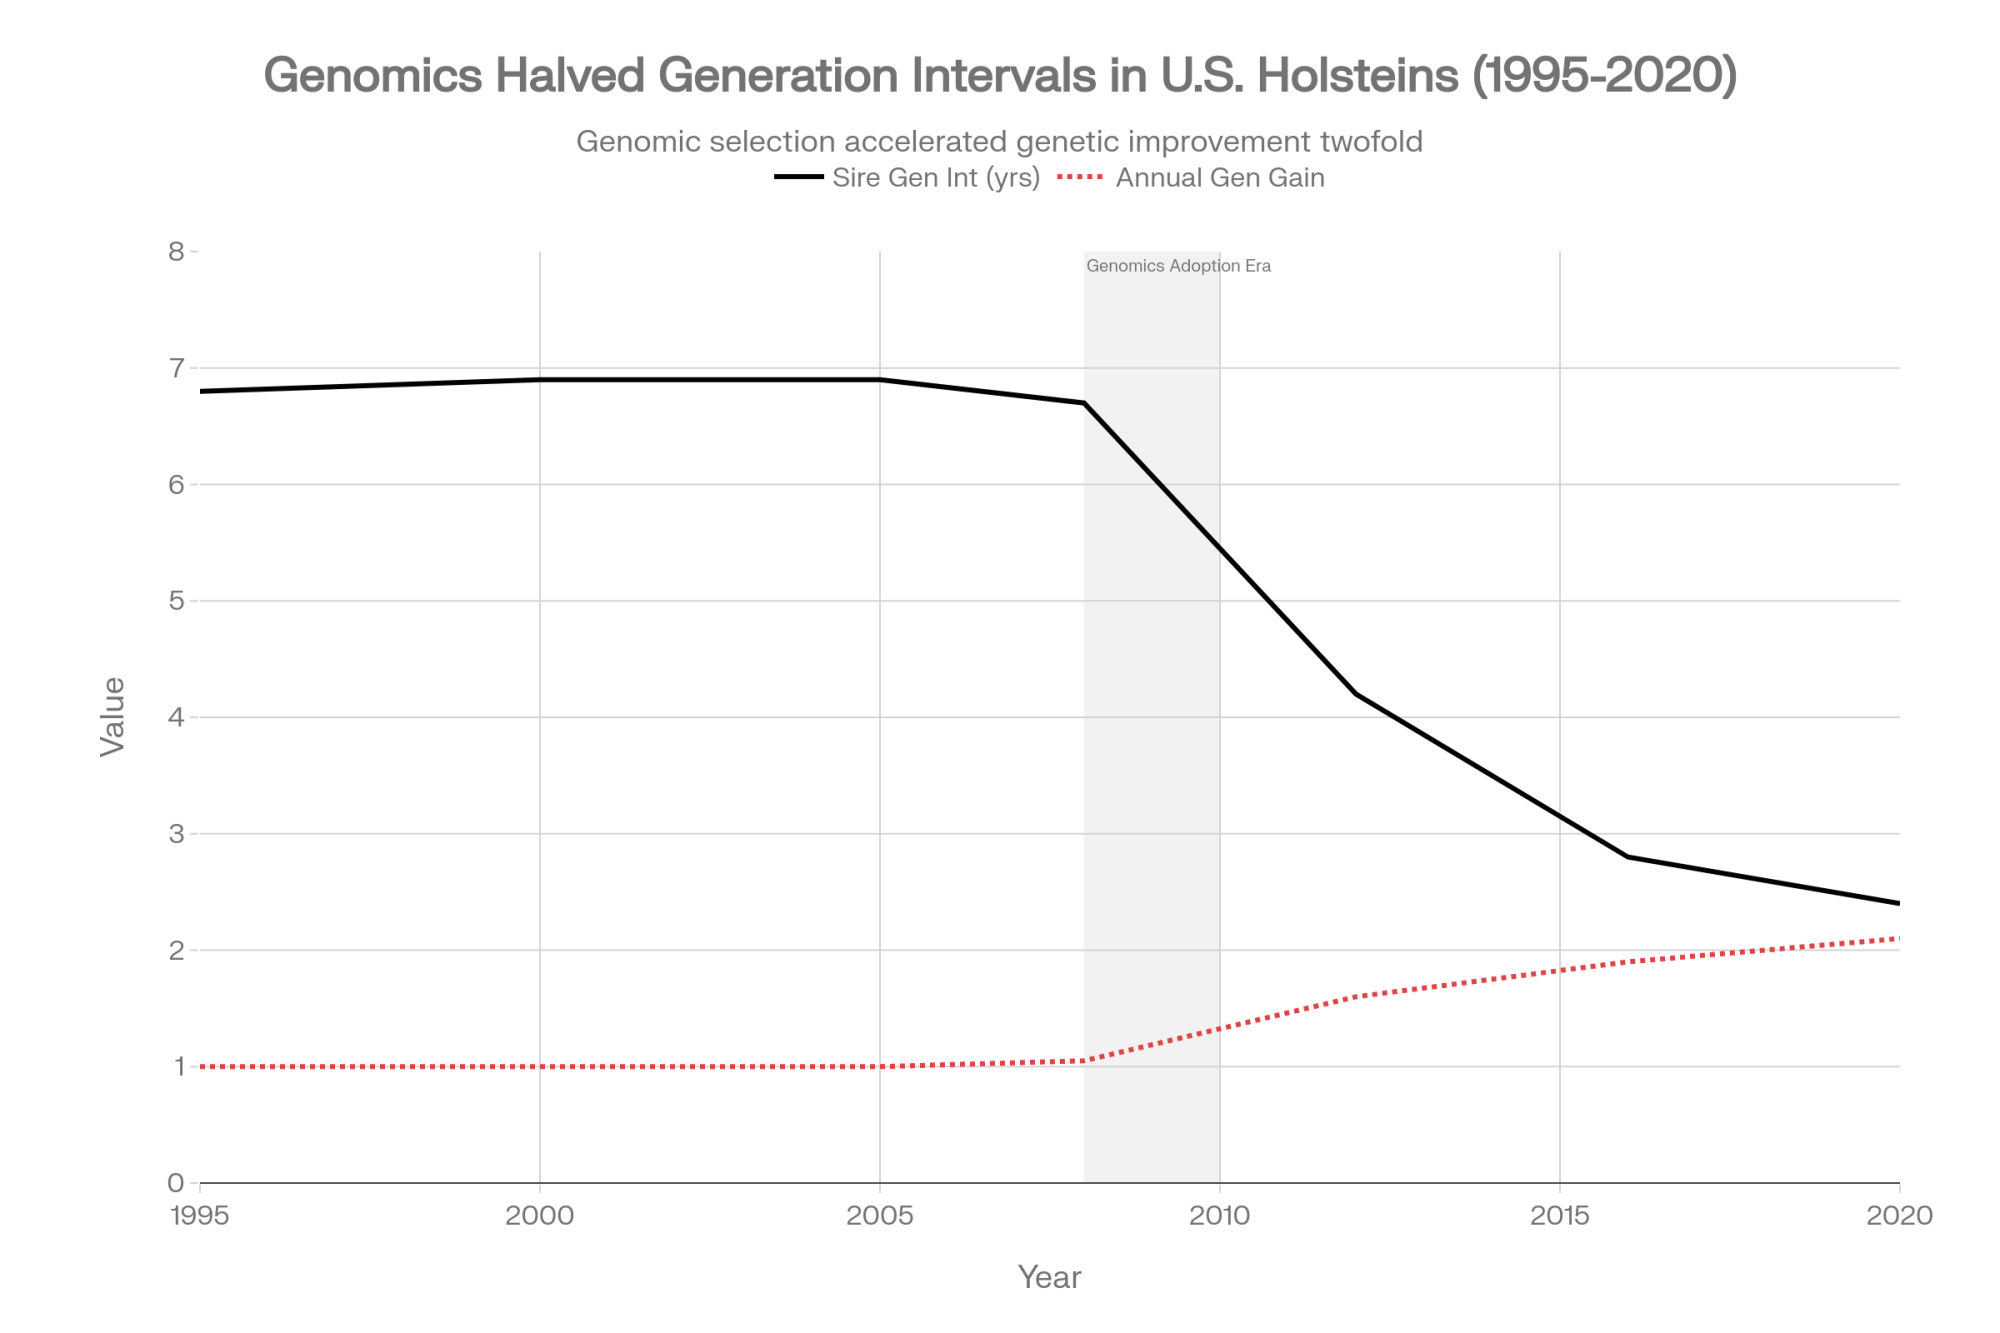
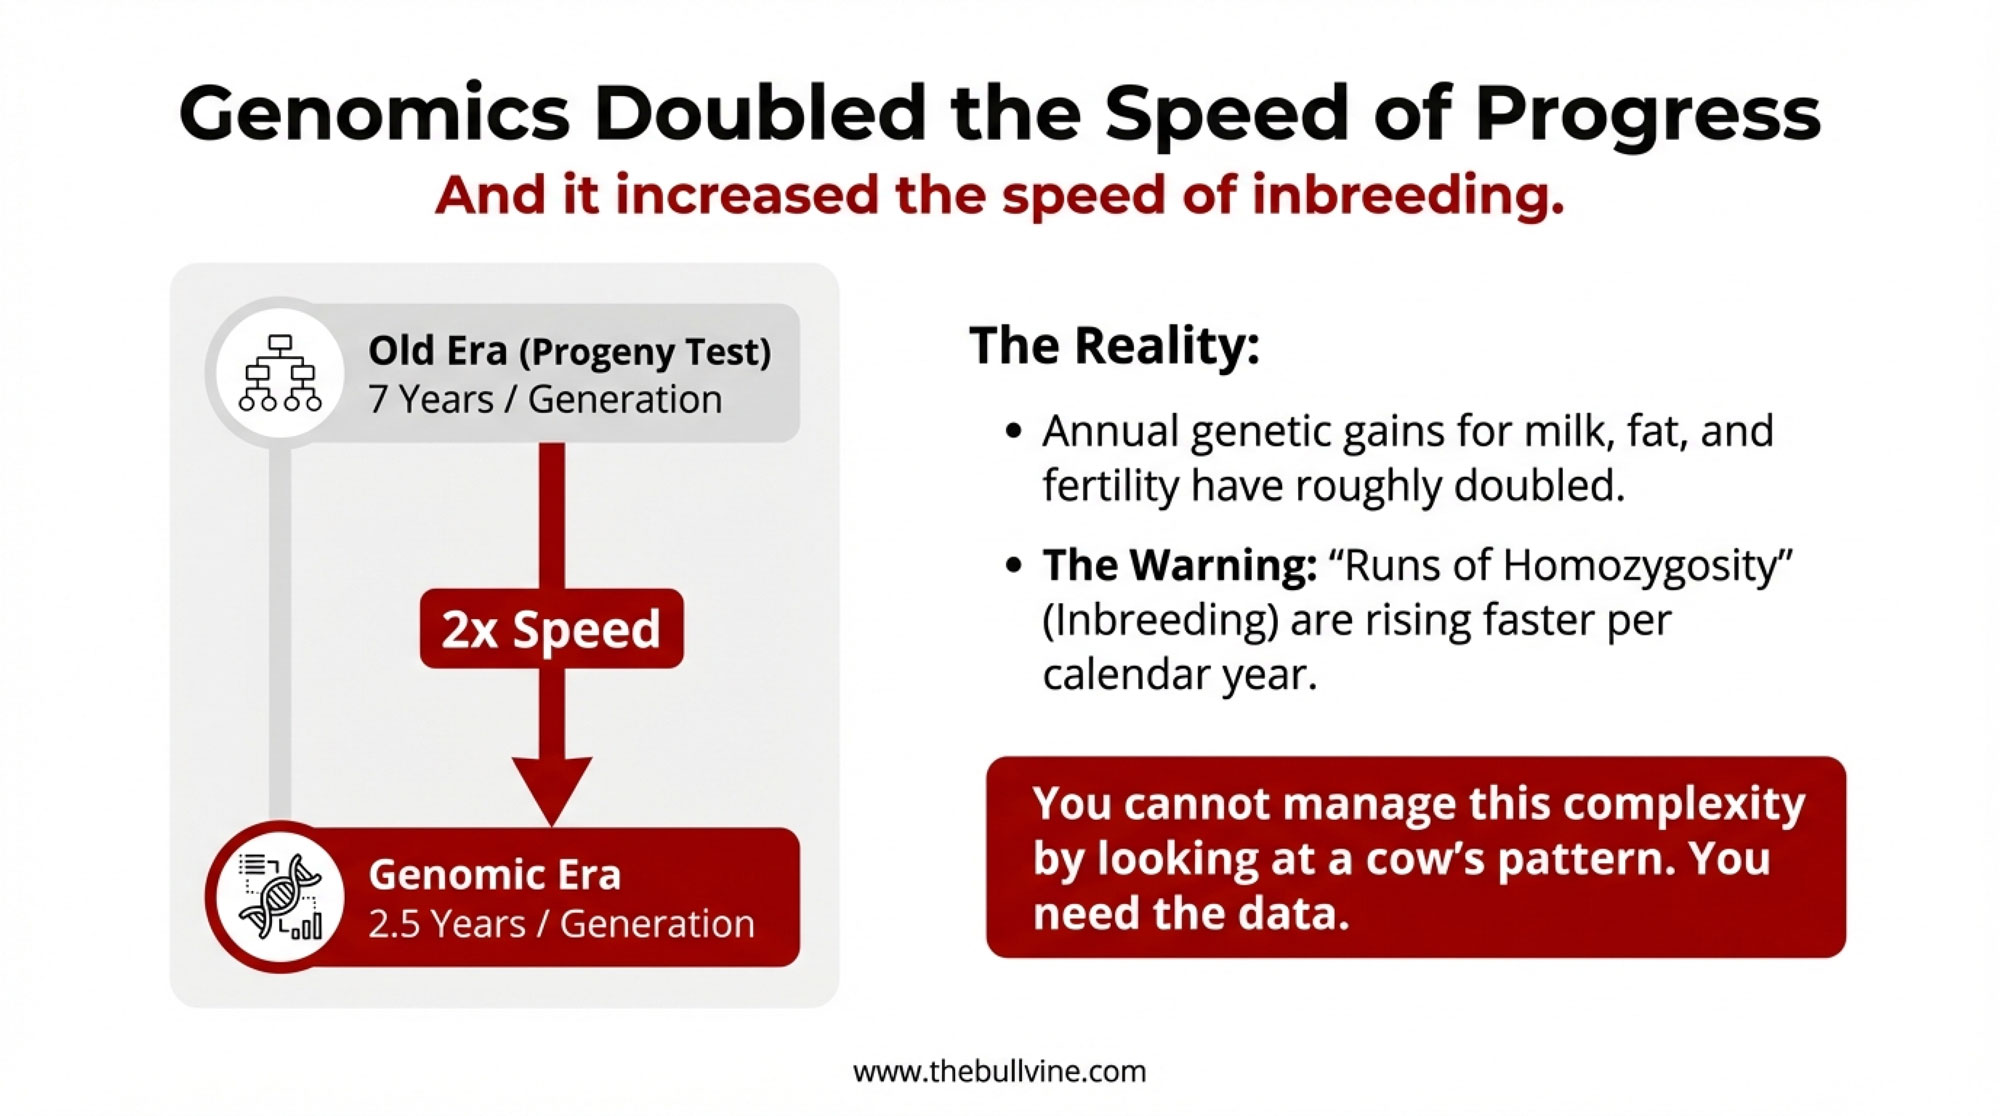
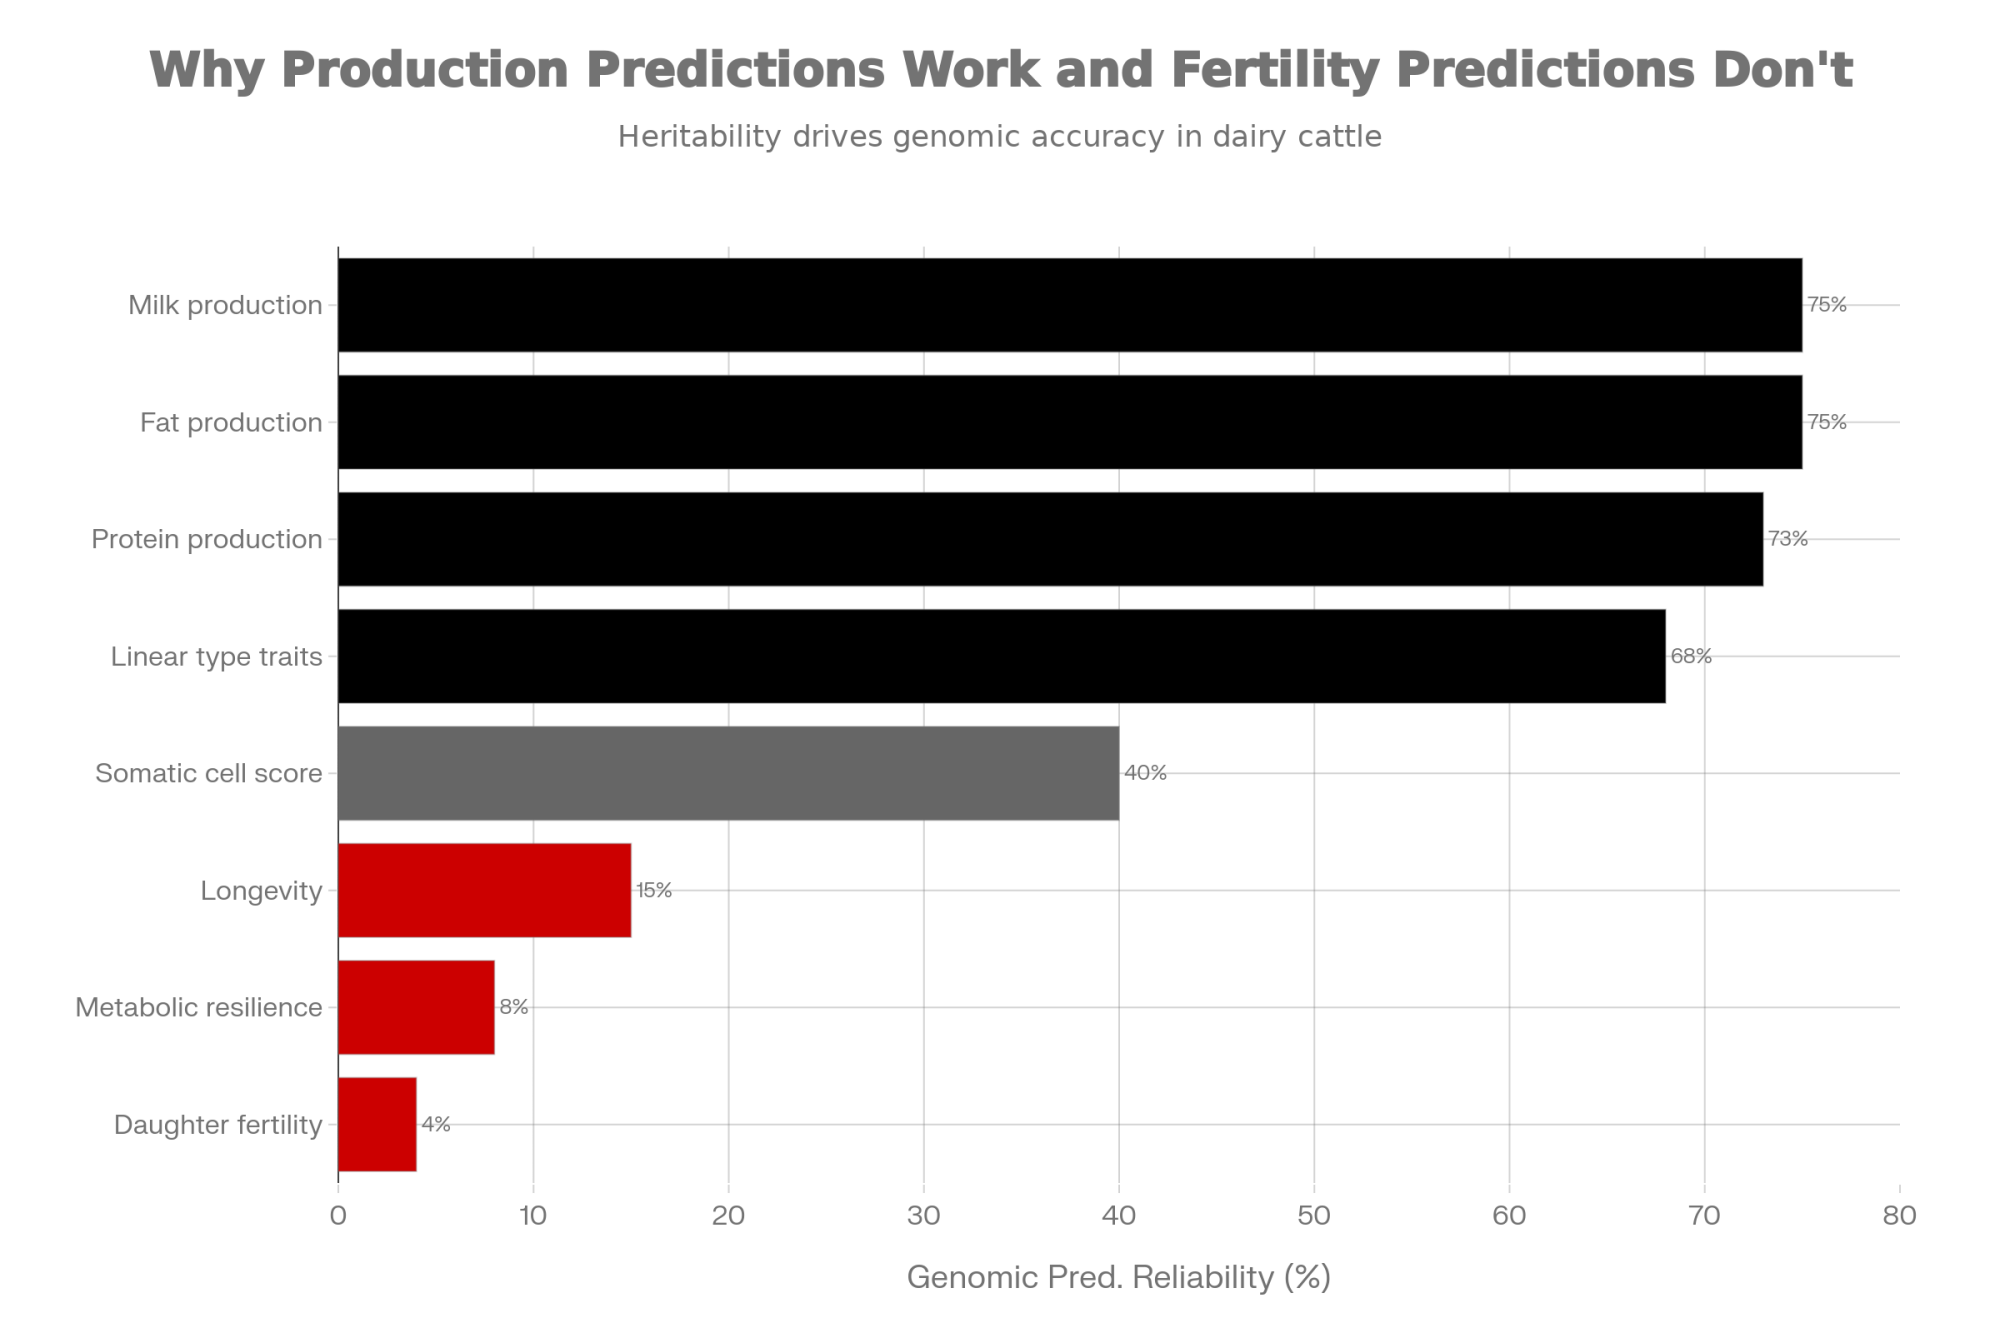
Every textbook on genetic improvement comes back to the breeder’s equation: ΔG = (i × r × σ_g) / L. Selection intensity, accuracy, genetic variation, generation interval. Dairy has optimized every variable at the industry level. AI lets breeders draw from a narrow band of the highest-ranked proven sires worldwide — something that was operationally impossible before frozen semen and international shipping. Genomic testing at birth delivers materially higher reliability on young-animal production indexes than pedigree alone — on the order of 70% versus 20–30%, depending on trait category. Genomic evaluation has compressed generation interval from the traditional 5–7 years under progeny testing to under 2 years.
Every one of those gains was unlocked at the industry level. Whether they’re unlocked inside your fence line depends on decisions made downstream of the data.
Here’s what the math looks like in a real barn. Take a 300-cow Holstein herd. For the sake of illustration — and this is illustrative, not a sourced herd-level distribution — say your top genomic quartile averages $800 NM$ and your bottom quartile averages $600 NM$, a 200-point spread. At the 2016–2020 CDCB annual Net Merit gain rate of roughly .20, that spread translates to about 2.5 years of industry-average genetic progress sitting inside the same barn. Every heifer calf born from the bottom quartile represents roughly 2.5 years of deferred progress compared to a calf born from the top quartile.
The second piece of math most breeders never run: flush an elite heifer at 8 months through OPU, and her daughter is born roughly 17–20 months later, once the embryo has been transferred to a recipient and carried to term. Wait until that same female completes her first lactation before flushing her, and the calf arrives roughly 44 months later. That’s 2 years of generation interval you’re either compressing or extending — and at roughly $79/year in NM$ gain, it’s a measurable number per calf, not a theoretical one.
How the Top Decile Actually Runs the Program
The operations that appear to compound consistently year over year tend to share four structural patterns, according to genetics advisors and herd-level genetic trend data published by CDCB. They don’t solve the 45% problem by working harder. They solve it by moving the genetic decisions upstream — out of the emotionally loaded moment of standing in front of a specific animal, and into a policy or schedule written when the stakes felt abstract.
A written genomic floor. A specific NM$ or LPI number — below it, no female is bred to a high-investment sire. The threshold is written down, the exception process requires documentation and a named approver, and the number is reviewed every proof run against the herd’s current distribution.
A standing heifer flush schedule. Candidates selected at birth based on genomic testing, OPU appointments booked as part of the herd health calendar at 7–8 months, not case-by-case. The question flips from “should we flush this heifer?” to “is there a reason to take her off the schedule?”
Two repro tracks, not one. A conception program for the working herd, optimized for pregnancy rate and days open. A multiplication program for the top tier, optimized for genomic advancement. Top-tier females get scheduled reproductive attention regardless of cycling convenience.
Breeding objectives written as decision rules. “We breed for components and fertility” is a preference. “No female below our written NM$ floor is eligible for the breeding herd” is a rule. One requires a decision every time. The other only requires one when you want an exception.
Every one of those moves has the same underlying effect: it changes what has to happen for the default to hold. In most herds, the default requires no decision and aggressive selection requires one. In top-decile herds, the reverse is true.
Options and Trade-Offs for Your Operation
There’s no single path out of the 45% pattern. The right one depends on herd size, cash position, and how much operational change the team can absorb in a single breeding cycle.
This month — run the quartile diagnostic. One hour, no commitment. Pull your last two calf crops, match each heifer to her dam’s genomic rank at conception, count the bottom half. The number is the intervention. Works for every herd size. Costs nothing. Backfires only if you look at the result and do nothing with it.
Set one genomic threshold for elite sire allocation. Pick your primary index, draw a line, and below it no female gets bred to a high-investment sire. Not a full culling policy yet. One constraint, applied consistently for one breeding cycle. Backfires if the threshold is set so low it doesn’t cut anyone you currently like — in which case it isn’t doing selection work
Schedule 8-month heifer OPU as standing protocol. Requires a relationship with an ET technician, recipient inventory or contracted recipients, and a lab that can handle variable volume. Fits operations with the scale and cash to maintain the infrastructure. Backfires when young stock nutrition or body condition isn’t supporting the protocol — fix the management environment first.
Separate repro priority from cycling priority. Most operations run one repro program for the whole herd. Top operations run two. Demands more management bandwidth but doesn’t require more labor — it reallocates the labor already there.
The trade-offs are real on all four. Culling productive cows hits next month’s milk cheque. Flushing heifers ties up cash before any daughter has been on the ground. Running two repro programs stretches whoever is managing them. Enforcing a written threshold means sometimes moving a cow you respect. None of that disappears because the math is sound. The math is just clearer than the discomfort.
What This Means for Your Operation
What percentage of your last two heifer calf crops came from the bottom half of your herd genomically?
If you don’t know, that’s the first number to pull this month. It reframes every other genetic decision you’ll make before the next proof run.
Is your repro program optimizing for pregnancy rate, or for the genomic rank of the calves it produces? Those are different objectives. When they’re not connected explicitly, the easier one wins every cycle.
Where is your genomic floor for the breeding herd, and when did you last enforce it on an animal you respected? A threshold that hasn’t cut anyone uncomfortable isn’t doing selection work.
How old is your average dam at first flush? If she’s a cow rather than a heifer, you’ve added years to your effective generation interval on the female side — the side the tools now let you compress.
Which cows are you keeping for reasons that have nothing to do with their genetics? Every operation has a few. Naming them explicitly is how you prevent the next generation of comfortable exceptions from quietly forming around the next set of animals.
When did you last cull a productive, healthy cow because her genomic rank disqualified her from the breeding pool? If never, your selection intensity on the dam side is near zero regardless of what your sire lineup looks like.
Is your breeding objective written as a trait preference list, or as decision rules with specific thresholds and a named person responsible for exceptions? Aspirational standards evaporate under production pressure. Enforceable ones survive because overrides require justification.
Key Takeaways
If 35% or more of your replacement heifers are coming from your bottom-half genomic distribution, your sire lineup is doing half the work of the breeder’s equation while your dam decisions are doing none of it. That asymmetry is the single biggest driver of the gap between top-decile and median-herd rates of genetic gain.
If your breeding objective lives in your head rather than on paper with specific thresholds, it’s a preference, not a program. Write the floor down. Name the person who can approve an exception. Require documentation when one gets made.
If you’ve been genomic testing for three-plus years and your herd’s genomic floor hasn’t risen meaningfully, the tool is doing its job. The decision architecture around it may be the piece still waiting to catch up.
If you can flush an elite heifer at 8 months instead of waiting for first lactation, you’re compressing roughly 2 years of generation interval per animal — and at roughly $79/year in NM$ gain, that’s a measurable outcome per calf, not a theoretical one.
If the first cow your new threshold disqualifies is one you respect, the threshold is set at the right level. If it doesn’t cut anyone uncomfortable, the line is in the wrong place.
Watching the Race, Reading Your Barn
When the 2026 Derby field hits the wire at Churchill Downs this evening, most of the barn talk afterward will be about the trip, the track, the trainer, the jockey. Nobody on the broadcast will say the quiet part: the winning time will be what it is today because the Jockey Club decided decades ago which tools their breeders can and can’t use. You have every tool they don’t — AI, IVF, genomic selection at birth, global semen access, compressed generation intervals, and the data infrastructure to act on all of it. The only thing making those tools unavailable inside your fence line is whether you decided how to use them before you walked into the barn this morning.
So here’s the Derby Day question for your operation:
Which one of the four structural moves is the one you’ve been putting off — and what would have to be true in the next proof run for you to stop?
Complete references and supporting documentation are available upon request by contacting the editorial team at editor@thebullvine.com.
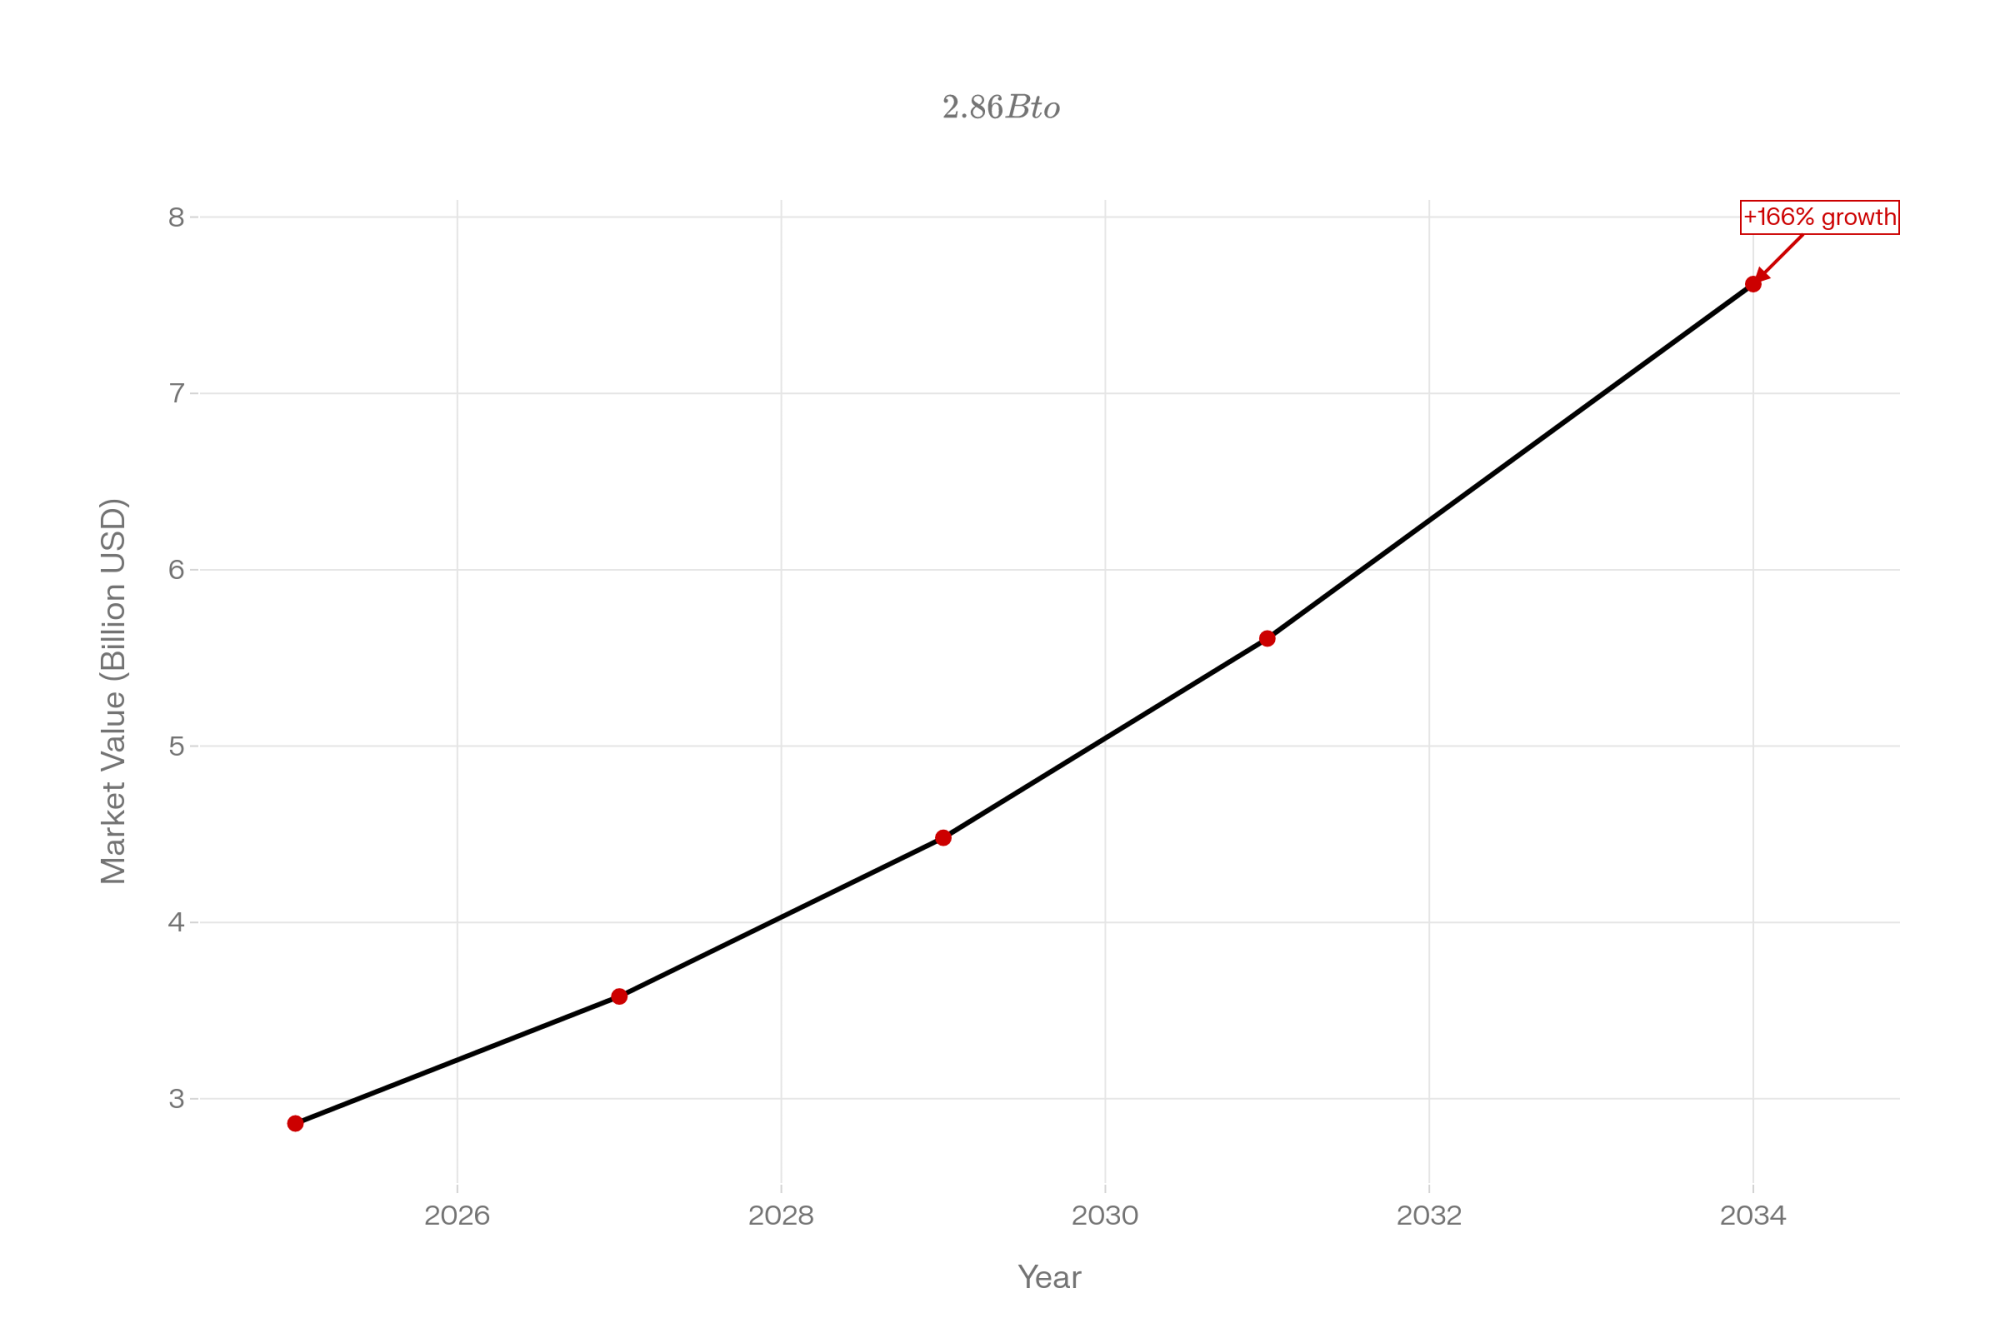
The Next Frontier: What’s Really Coming for Dairy Cattle Breeding (2025-2030) — Capture a $3,000 to $5,000 per cow premium by aligning your genetic strategy with emerging designer casein milk markets. Maps the impending collision between traditional production volume goals and the rapid rollout of CRISPR gene-editing technologies.
The Sunday Read Dairy Professionals Don’t Skip.
Every week, thousands of producers, breeders, and industry insiders open Bullvine Weekly for genetics insights, market shifts, and profit strategies they won’t find anywhere else. One email. Five minutes. Smarter decisions all week.
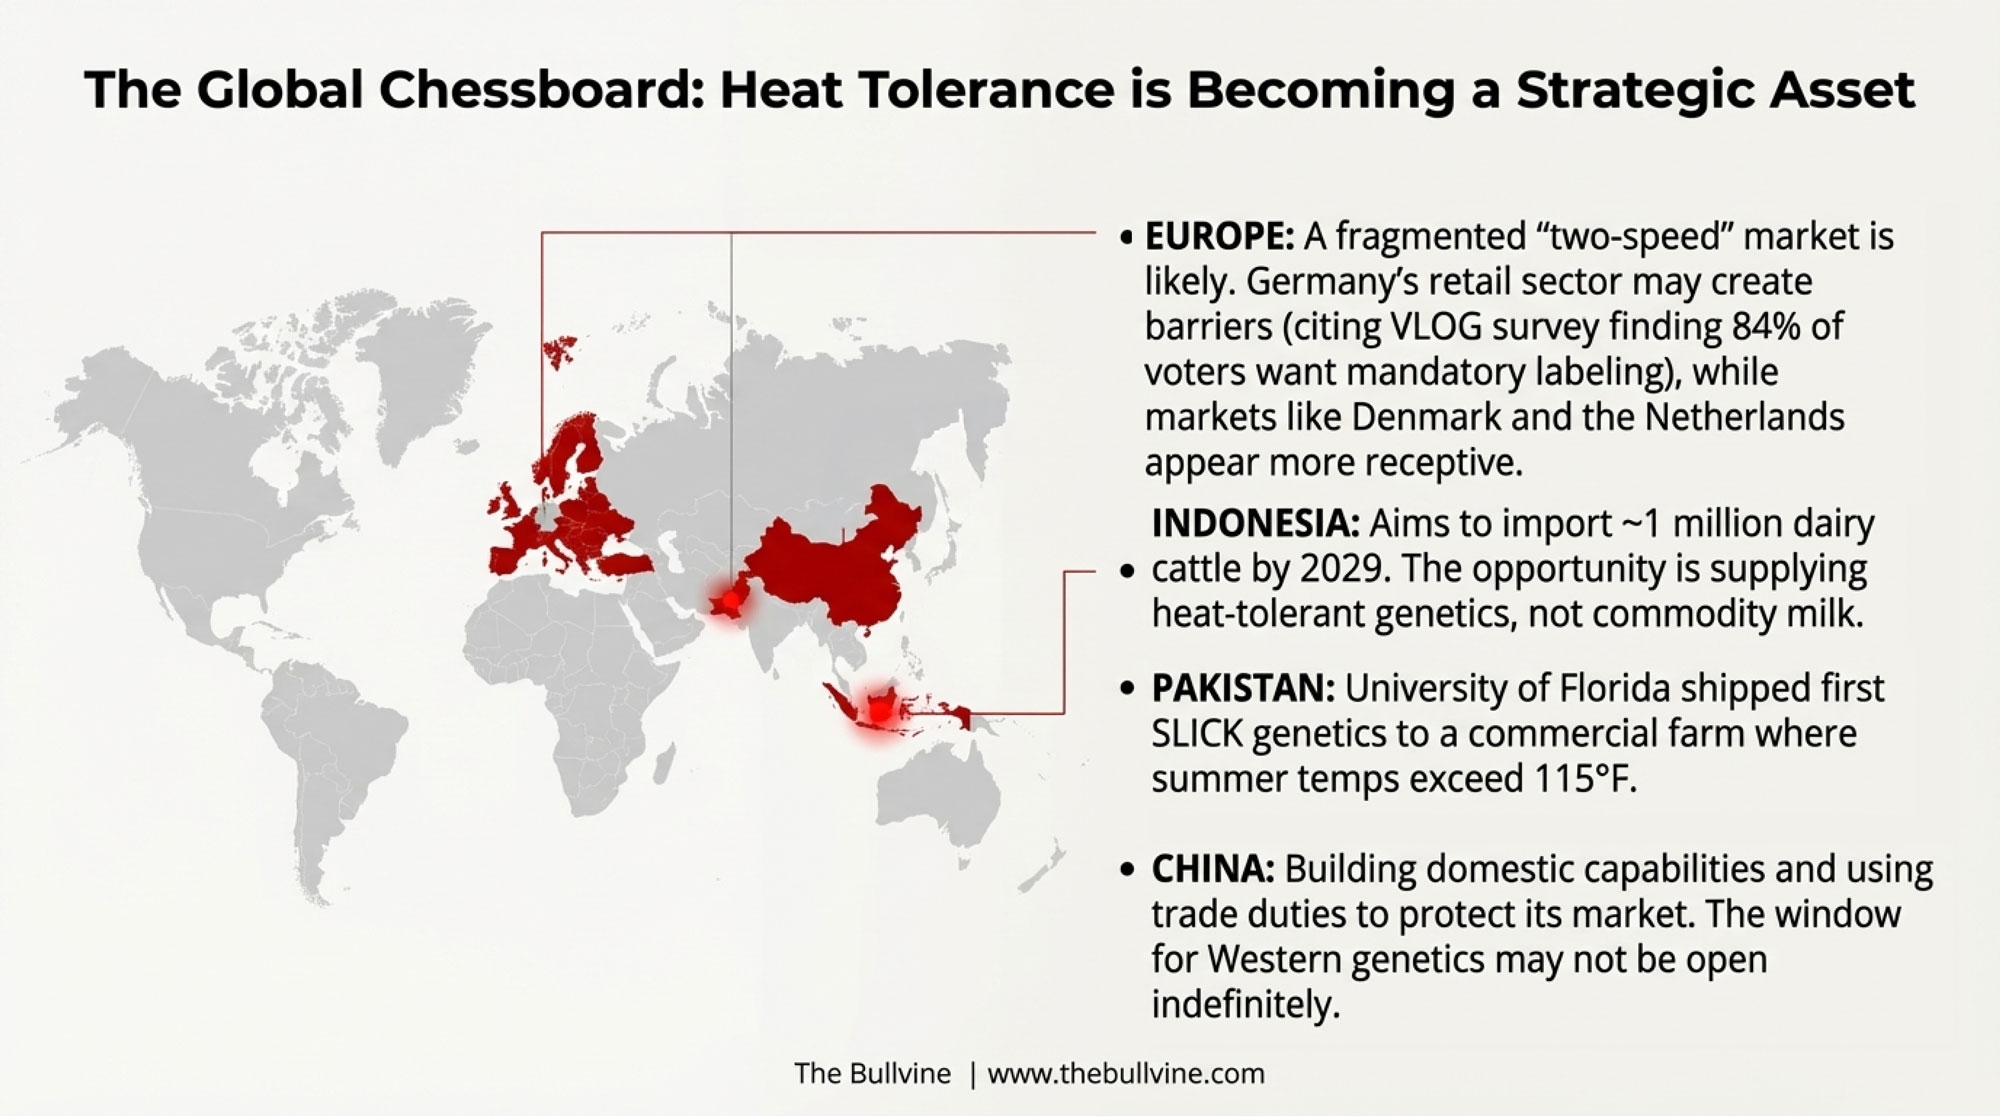
Trevor Parrish in NSW started filtering sires on HT ABV in 2017. By August 2024, 197 Holstein Good Bulls cleared the threshold. CDCB’s April 2025 NM$ revision added none of it.
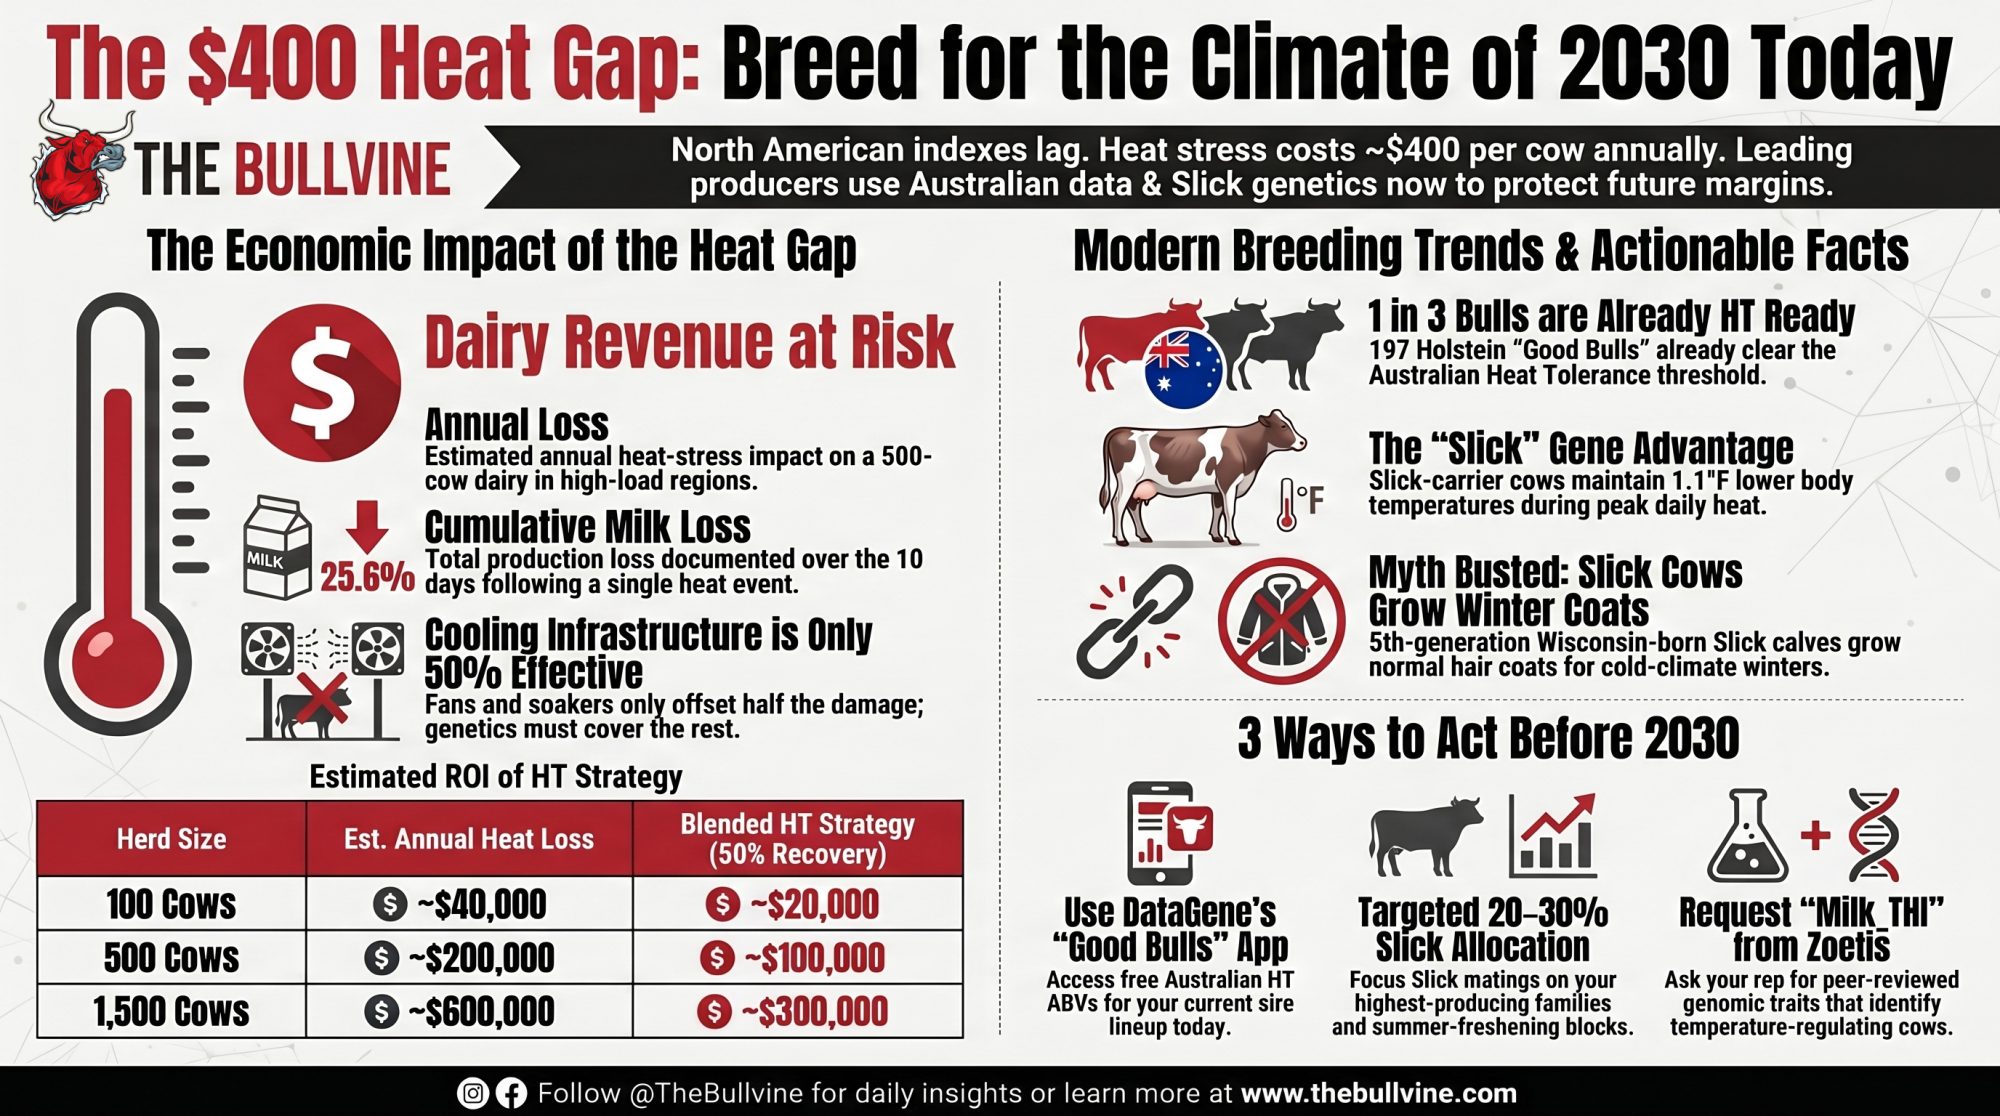
Executive Summary: Australia’s DataGene released a Heat Tolerance ABV in December 2017, and by the August 2024 run, 197 Holstein Good Bulls — roughly one in three — cleared the 100 threshold. CDCB’s April 2025 NM$ revision moved butterfat from 28.6 to 31.8 and dropped protein from 19.6 to 13, but added no heat tolerance trait; Lactanet hasn’t weighted it in LPI or Pro$ either, despite University of Guelph models hitting 0.97 rank correlation. The economic exposure for North American herds sits around $400/cow/year in heat-load regions — roughly $200,000 annually on a 500-cow dairy in southwestern Ontario or the Central Valley — based on the St-Pierre 2003 baseline adjusted for inflation and the 10% single-day, 25.6% 10-day cumulative milk losses documented in Science Advances (July 2025). Zoetis has peer-reviewed Milk_THI and CFS_THI traits in JDS (September and November 2025) that identify cows with measurably better rectal-temperature regulation. Select Sires’ ART program is now five Slick generations deep in Wisconsin, with parent averages tracking close to non-Slick matings and calves that still grow winter coat. The heifer you breed in May peaks in the early 2030s — waiting on CDCB locks in three more replacement cycles of thermal vulnerability, while DataGene’s Good Bulls App, Zoetis Clarifide, Australian proofs through Semex/Genex/ABS, and a 20–30% Slick allocation on your top cow families are all workable today. The question isn’t whether the margin math favours acting; it’s whether your AI rep can answer the HT question when you call tomorrow.
In late 2017, Holstein breeder Trevor Parrish of Kangaroo Valley, New South Wales, began weighting Heat Tolerance ABV into his sire selections — a decision still uncommon among his Australian peers at the time, according to DataGene’s adoption reporting and Parrish’s own May 2025 comments to Dairy News Australia. DataGene had just released the trait publicly: a quarterly-updated breeding value measuring how well a cow holds production when the Temperature-Humidity Index climbs past comfort. From that release forward, per his Dairy News Australia interview, Parrish treated Heat Tolerance as part of his standard sire-evaluation toolkit.
Eight years on, DataGene’s adoption data and Parrish’s published commentary tell the story of a breeder who treated the trait like calving ease — a filter you apply, not a debate you have. Meanwhile in Woodstock, Tulare, or Fond du Lac, no official North American genetic evaluation — not NM$, not TPI, not LPI — currently publishes a heat tolerance number at all. That gap has a dollar value. And it compounds every summer your replacement heifers come into the milking string.
What Australia Actually Did, Starting in 2017
DataGene released the Heat Tolerance ABV publicly in December 2017. The trait measures a cow’s ability to hold milk, fat, and protein output as THI rises past comfort thresholds. An ABV of 100 is breed average, and the trait sits inside the Balanced Performance Index (BPI) rather than floating as a standalone curiosity. A 2024 update lifted Holstein reliability by 10 percentage points and re-ranked the HT list more substantially for Holsteins than for Jerseys.
The adoption curve tells the more interesting story. In late 2016, during DataGene’s pilot work, only a handful of Good Bulls ranked meaningfully above 100 for HT. By the August 2024 ABV release, DataGene reported that one in three Holstein Good Bulls — 197 bulls — carried a Heat Tolerance ABV of 100 or above. That shift tracked a broader story of how climate pressure is reshaping dairy breeding priorities worldwide — but unlike most of the global picture, Australia already had the trait on the catalog page.
Speaking to Dairy News Australia in May 2025, Parrish framed the trait as part of a complete-cow picture: “Heat tolerance is part of that efficiency. As a breeder, you are trying to cover all the bases, and heat tolerance, now it has an ABV, is part of a solid, good quality cow.”
That isn’t a regulator’s decision. It’s a market filter, and it happened inside a decade.
Is the Science Strong Enough to Act On Without the Official Index?
Short answer: yes. And the research isn’t Australian-only. Three independent research pipelines — Australian, Canadian, and U.S. — now converge on the same conclusion: heat tolerance is a heritable, measurable, and economically significant trait in Holsteins.
Evidence stream
Metric
What it proves
Australia DataGene
197 Holstein Good Bulls at HT ABV ≥100 by Aug. 2024
Catalog-level selection signal exists
Canada Guelph / Lactanet-ready models
Rank correlations above 0.97 for Canadian Holstein bulls
Canadian evaluation framework is technically stable
U.S. Zoetis genomic traits
Milk_THI: -1.3 to 1.0 kg/day/THI; CFS_THI: -6.2 to 5.3 pts/THI
Heat tolerance can be genomically ranked in U.S. Holsteins
Slick allele field physiology
1.1°F lower vaginal temperature at noon–3 p.m.
Slick carriers regulate body temperature better under heat
The Three Scientific Proofs
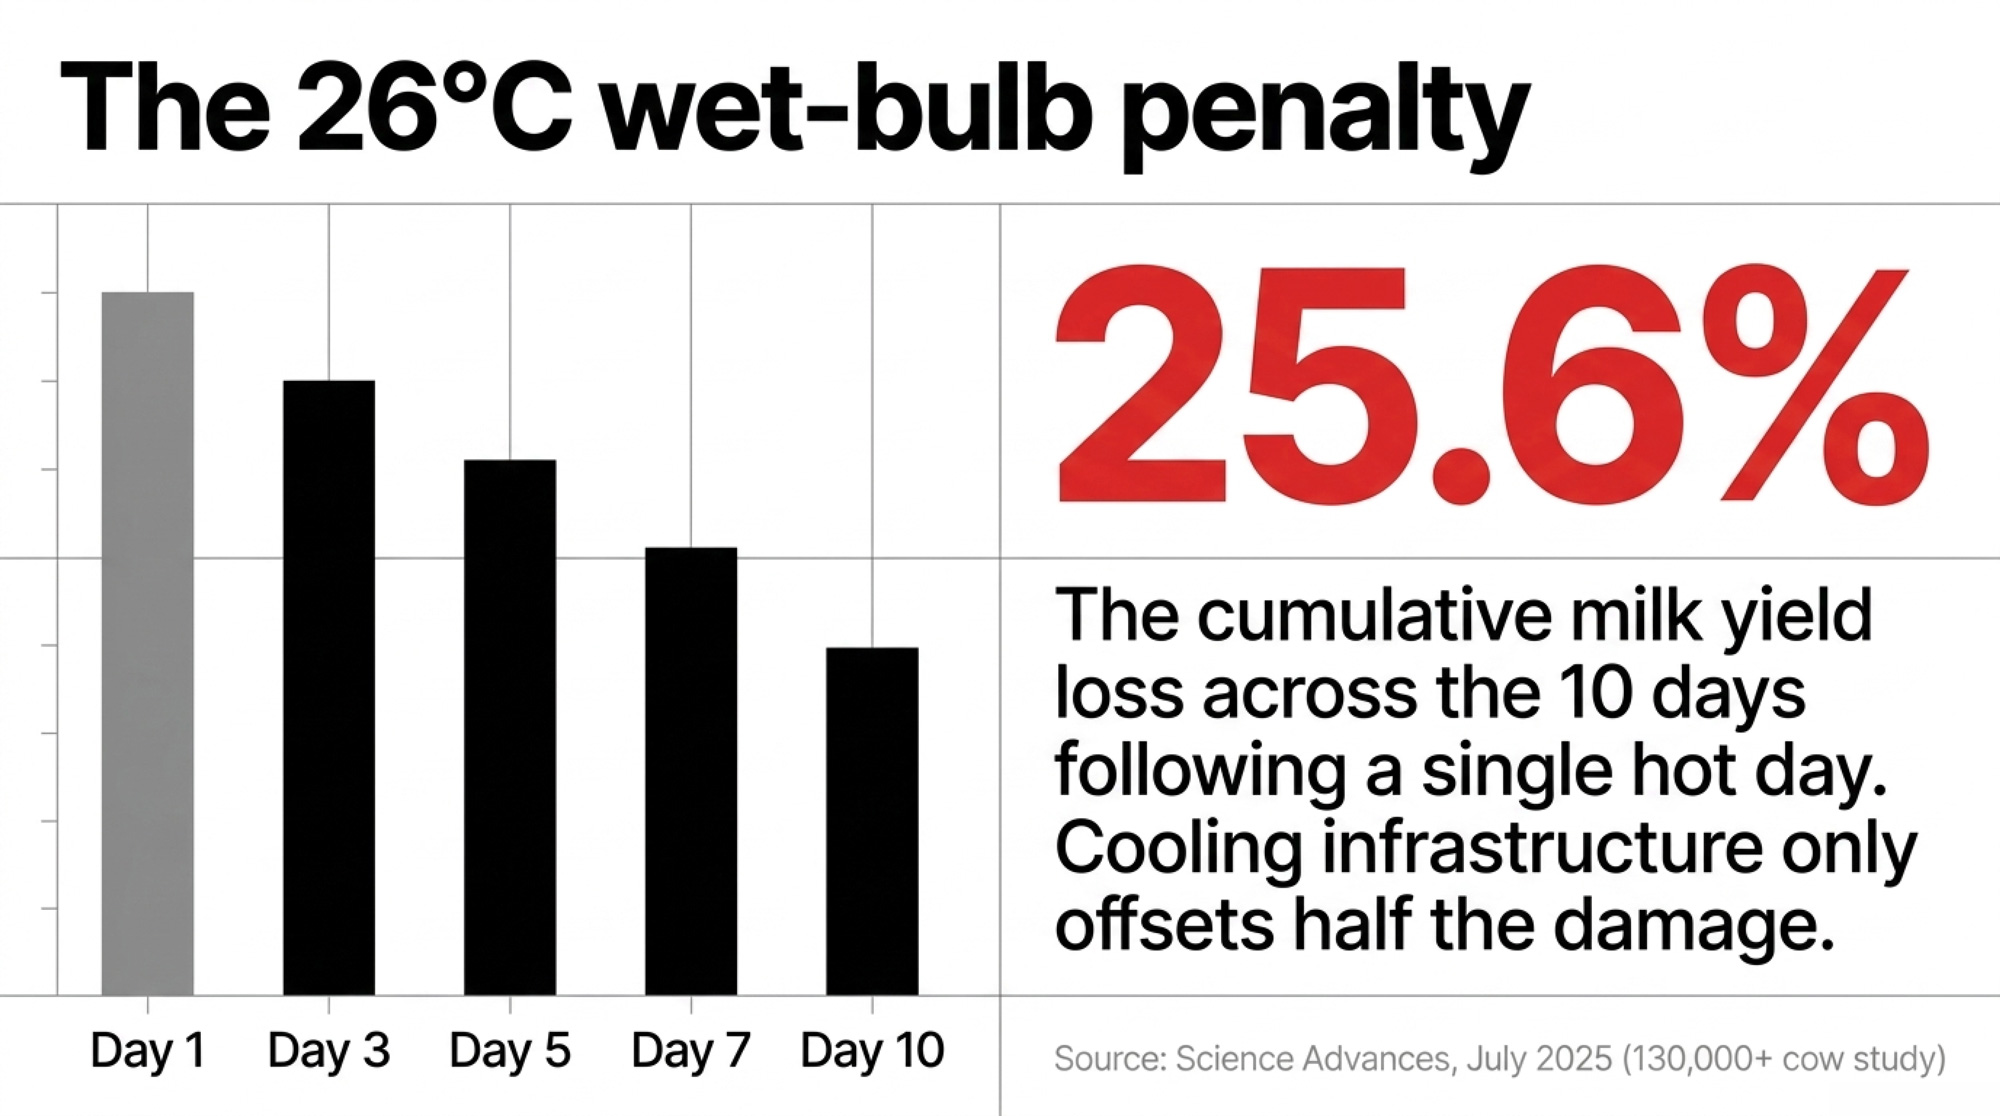
Australia — University of Chicago Climate Impact Lab (Science Advances, July 2025). Gong, Hsiang, Moscona and collaborators drew on production records from more than 130,000 cows over 12 years. Cooling infrastructure only offsets about half of the damage on the hottest days — fans and soakers cut losses by roughly 50% at a 20°C wet bulb, less than half overall at the top of the range.
Bottom line: Milk yield falls up to 10% on days when wet-bulb temperature exceeds 26°C. Cumulative loss across the 10 days following a single hot day reaches 25.6% of a single day’s baseline output.
Canada — University of Guelph (Schenkel, Miglior et al., Journal of Dairy Science). The Guelph group developed a Canadian heat tolerance evaluation framework using test-day production records and reaction-norm models. A follow-up 2025 JDS paper validated alternate models. Methodology is Canadian-ready; what’s missing is integration into LPI and Pro$.
Bottom line: Alternate models produce rank correlations above 0.97 for Canadian Holstein bulls — Lactanet has a validated, publication-ready HT evaluation sitting on the shelf.
United States — Zoetis research team (Vukasinovic et al., Journal of Dairy Science, September 2025). The team published validated genomic breeding values for heat tolerance in U.S. Holsteins. The specific traits are Milk_THI (change in daily milk yield per unit of THI, ranging from -1.3 to 1.0 kg per day per THI unit) and CFS_THI (change in conception at first service per unit of THI, ranging from -6.2 to 5.3 percentage points). A November 2025 JDS validation confirmed that higher standardized transmitting abilities on both traits corresponded to reduced rectal temperatures during heat stress.
Bottom line: The cows the Zoetis model ranks as heat-tolerant actually regulate body temperature better in the barn — the trait does what it says on the label.
The traits exist and are peer-reviewed. Whether Zoetis has integrated Milk_THI and CFS_THI into its customer-facing Clarifide reports is a question for your Zoetis rep. The September 2025 JDS paper establishes the methodology, not the commercial rollout timeline.
What Does the Barn Math Actually Look Like?
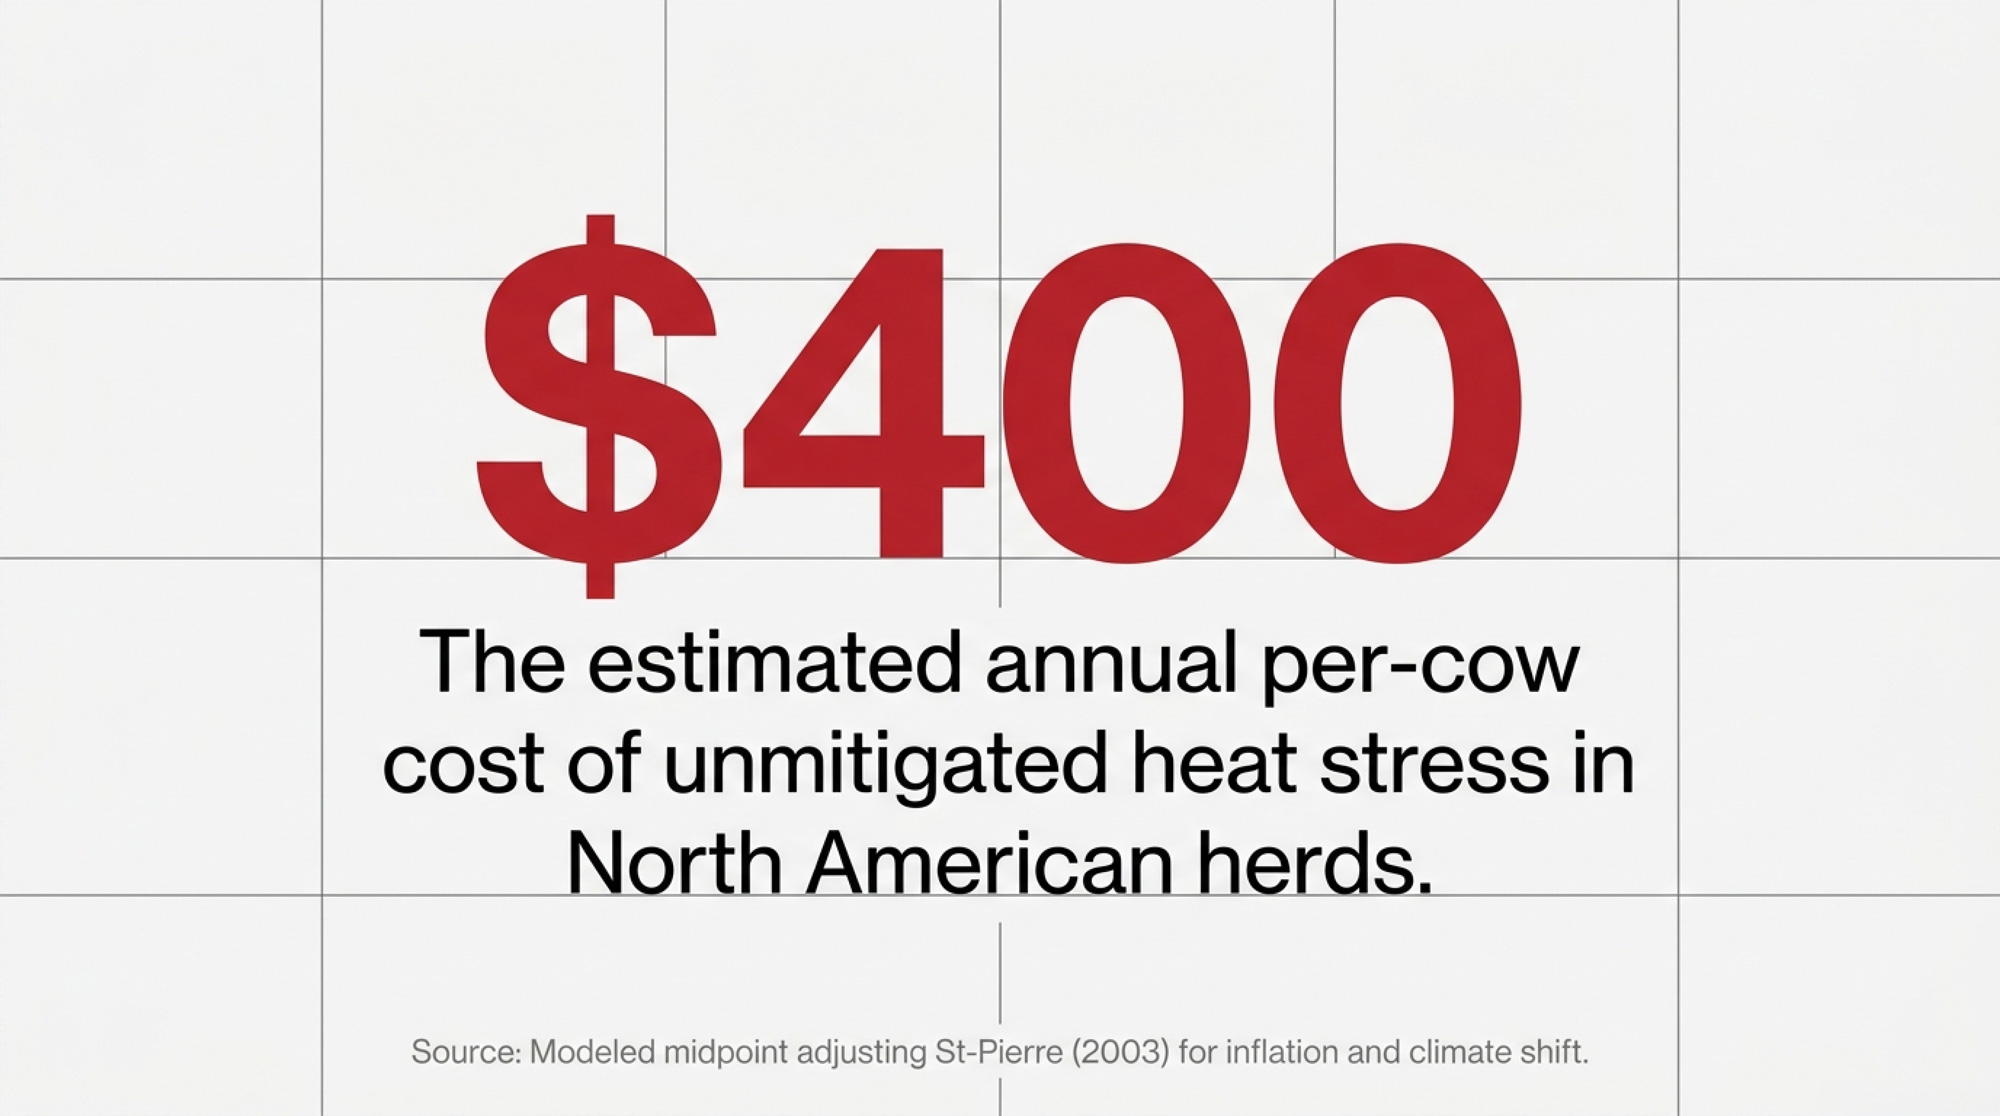
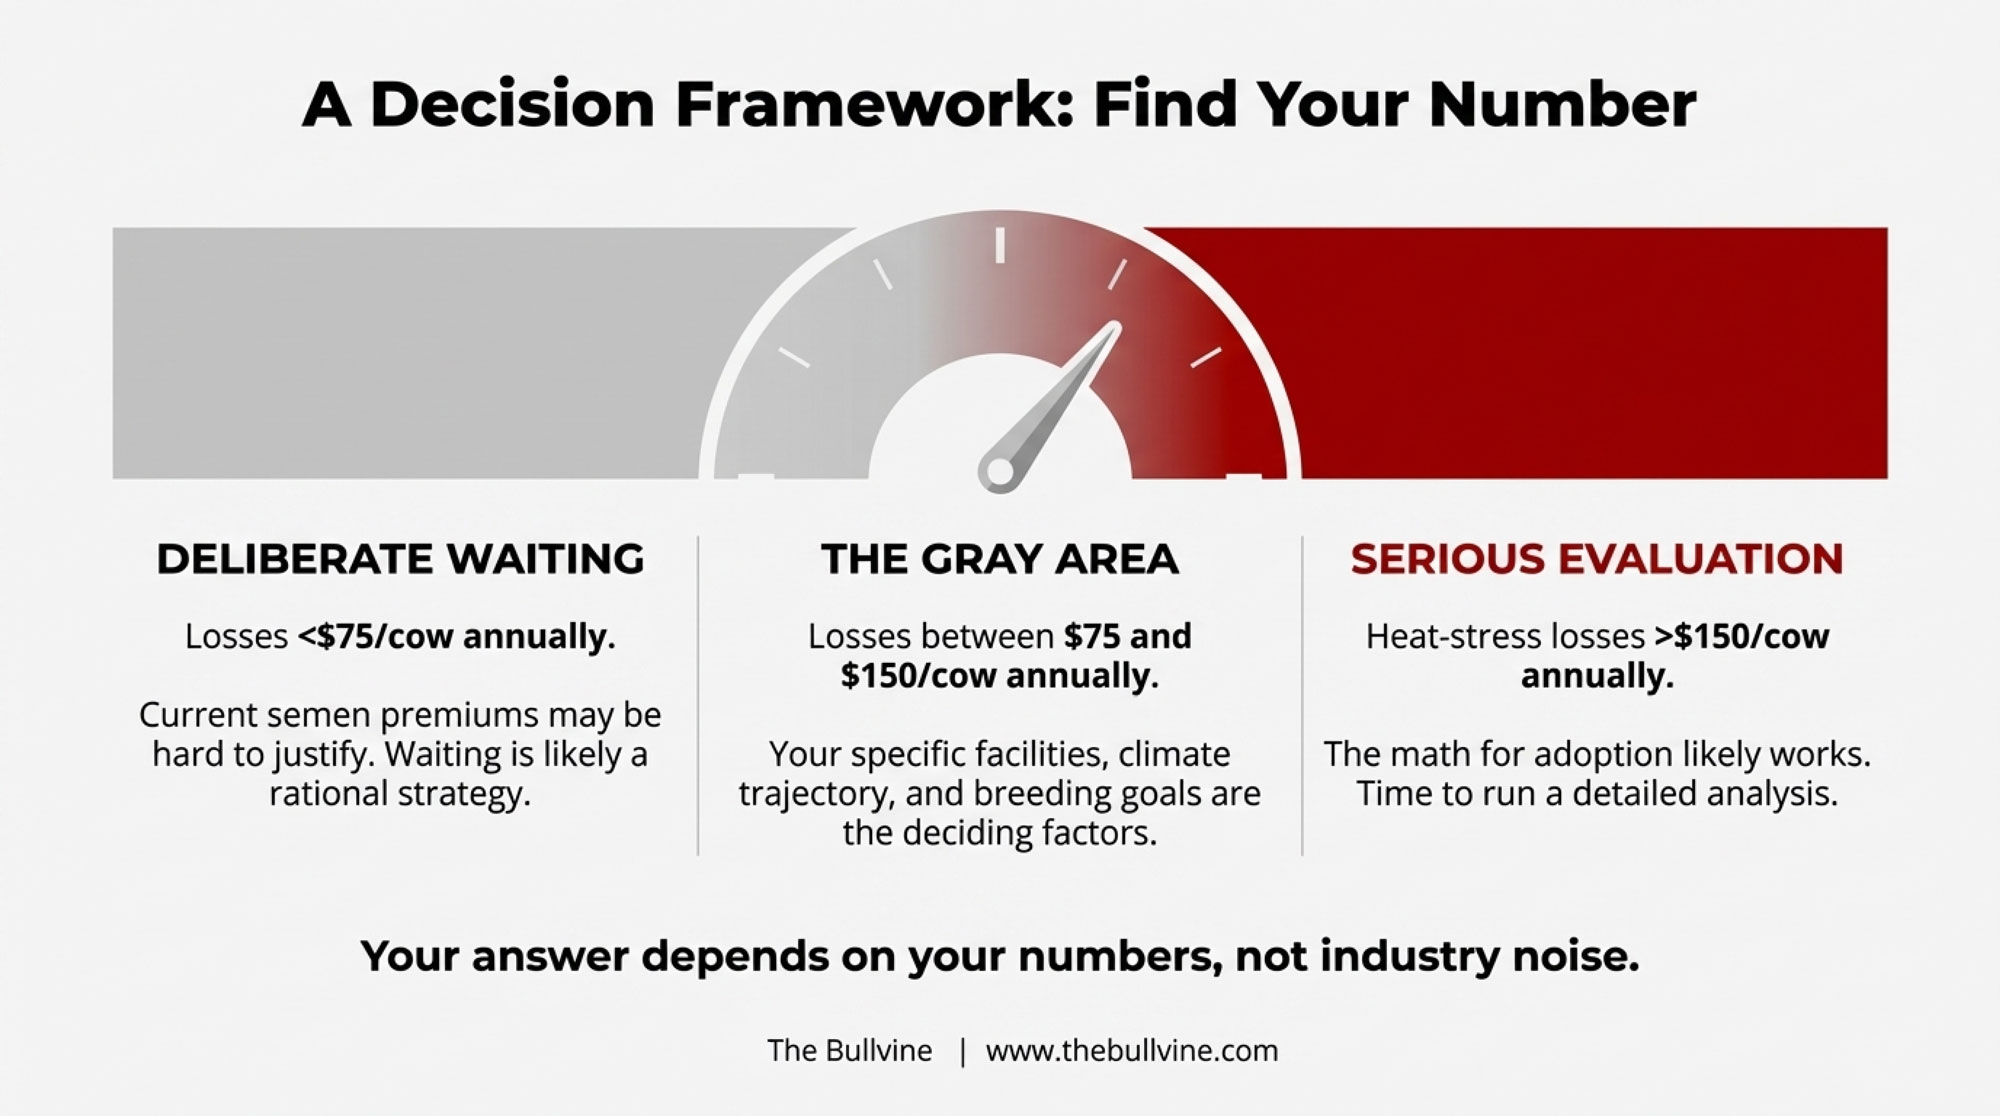
Published heat stress loss estimates for U.S. dairy herds anchor around 4 per cow per year as the unmitigated baseline, from St-Pierre, Cobanov and Schnitkey’s work in Journal of Dairy Science (2003) — early-2000s dollars. Aggregate U.S. dairy losses are modeled near $897 million annually at minimum heat abatement intensity, pulling back toward $500–$600 million with optimum abatement.
For herds in southwestern Ontario or California’s Central Valley — regions carrying a heavier seasonal heat load than the historical “temperate” framing suggests — a working midpoint of roughly $400 per cow annually is a reasonable illustrative figure once the St-Pierre baseline is adjusted for two decades of inflation and the climate shift documented in the Science Advances work. It’s a modeled estimate, not a published regional number. Operations still trying to cool their way out of the problem should also read our companion piece on where cooling infrastructure stops paying back.
The table below is an illustrative model built from that midpoint and a modeled 50% reduction assumption — the upper end of what combined cooling investment, Australian-style HT selection, and targeted Slick matings can plausibly deliver together. Actual results will vary with climate zone, milk price, Slick adoption percentage, and the sire mix already in the tank.
Herd Size
Est. Annual Heat Loss (Conventional)
Blended HT Strategy (50% Reduction)
Year-1 Implementation Cost (Est.)
100 cows
~$40,000
~$20,000
~$10,000
500 cows
~$200,000
~$100,000
~$40,000
1,500 cows
~$600,000
~$300,000
~$115,000
Underlying inputs: $400/cow annual heat loss (modeled midpoint); 50% recovery assumption from combined cooling + HT selection + Slick matings; Year-1 costs scaled for genomic testing on replacement heifers and semen premium on targeted Slick matings.
On a 500-cow operation, the Year-1 cost sketch roughly covers genomic testing on replacement heifers plus a modest semen premium on about 150 targeted Slick matings (roughly a 30% allocation of annual breedings). Under those modeled assumptions, payback clears inside the second summer. The arithmetic isn’t the weak point. The inputs are. But the direction and order of magnitude hold up in almost any scenario a North American breeder plugs in.
Where CDCB and Lactanet Have — and Haven’t — Moved
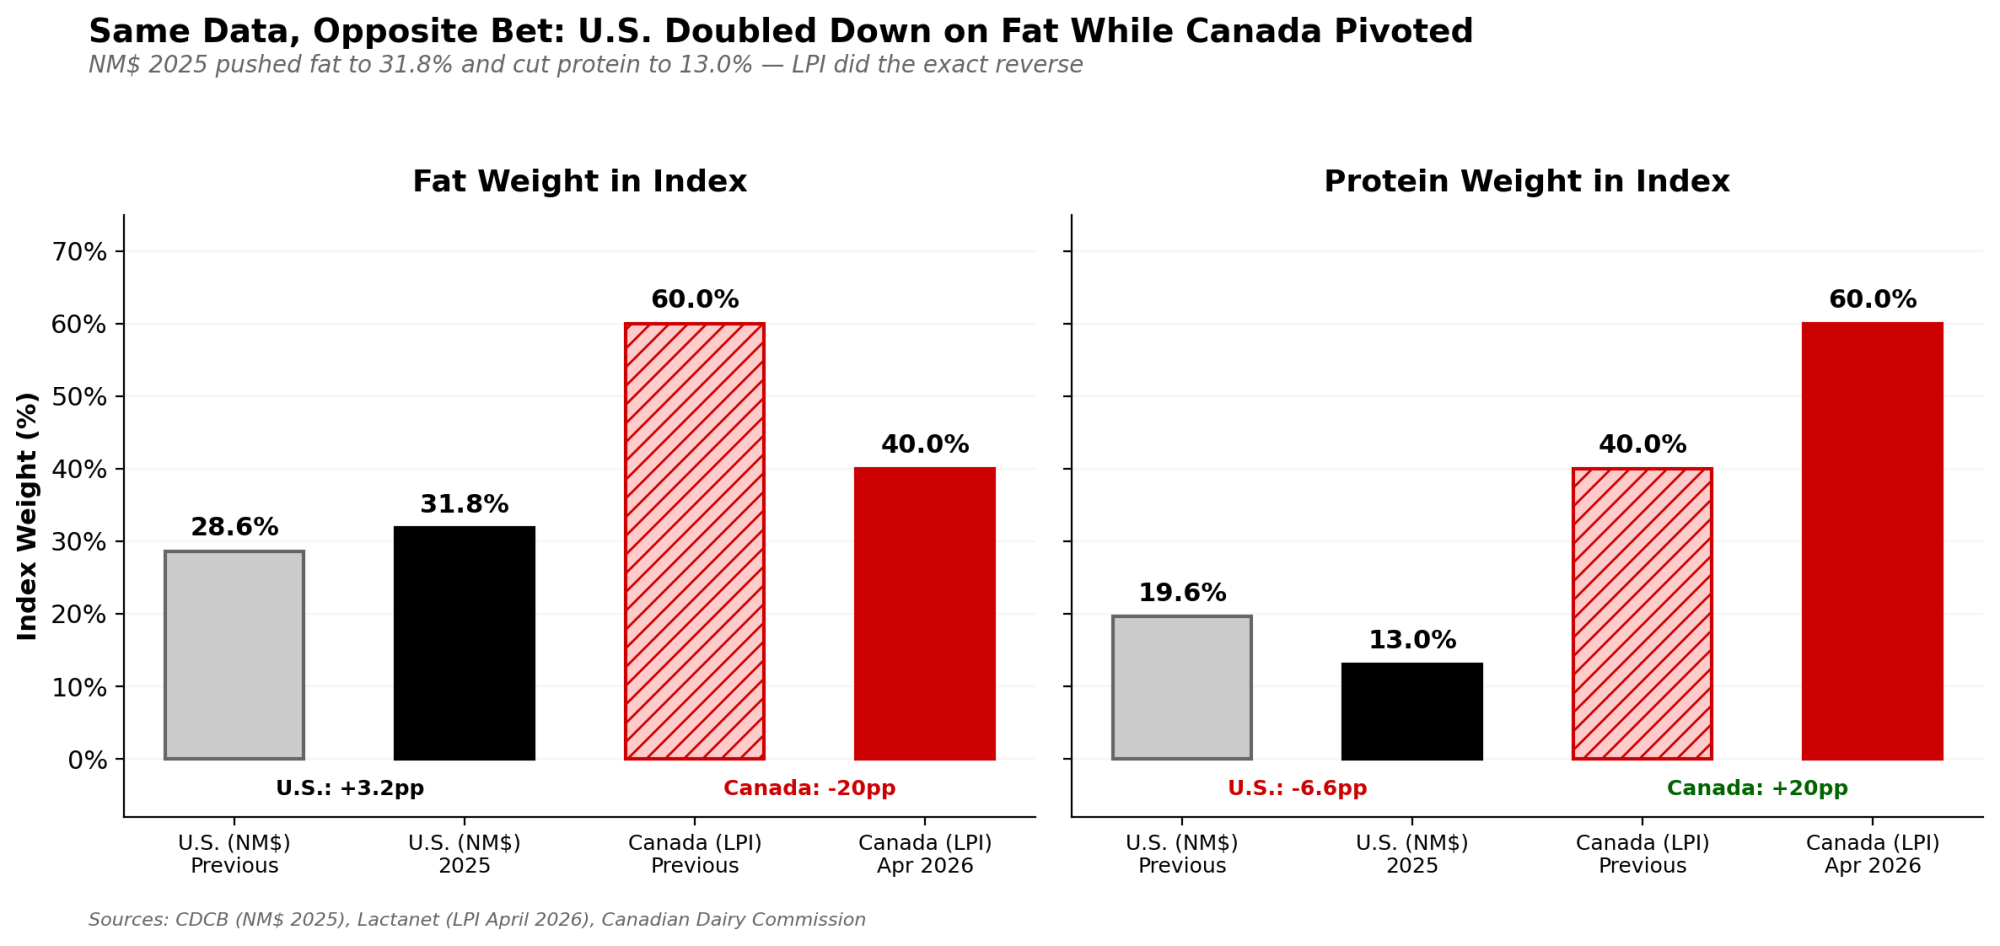
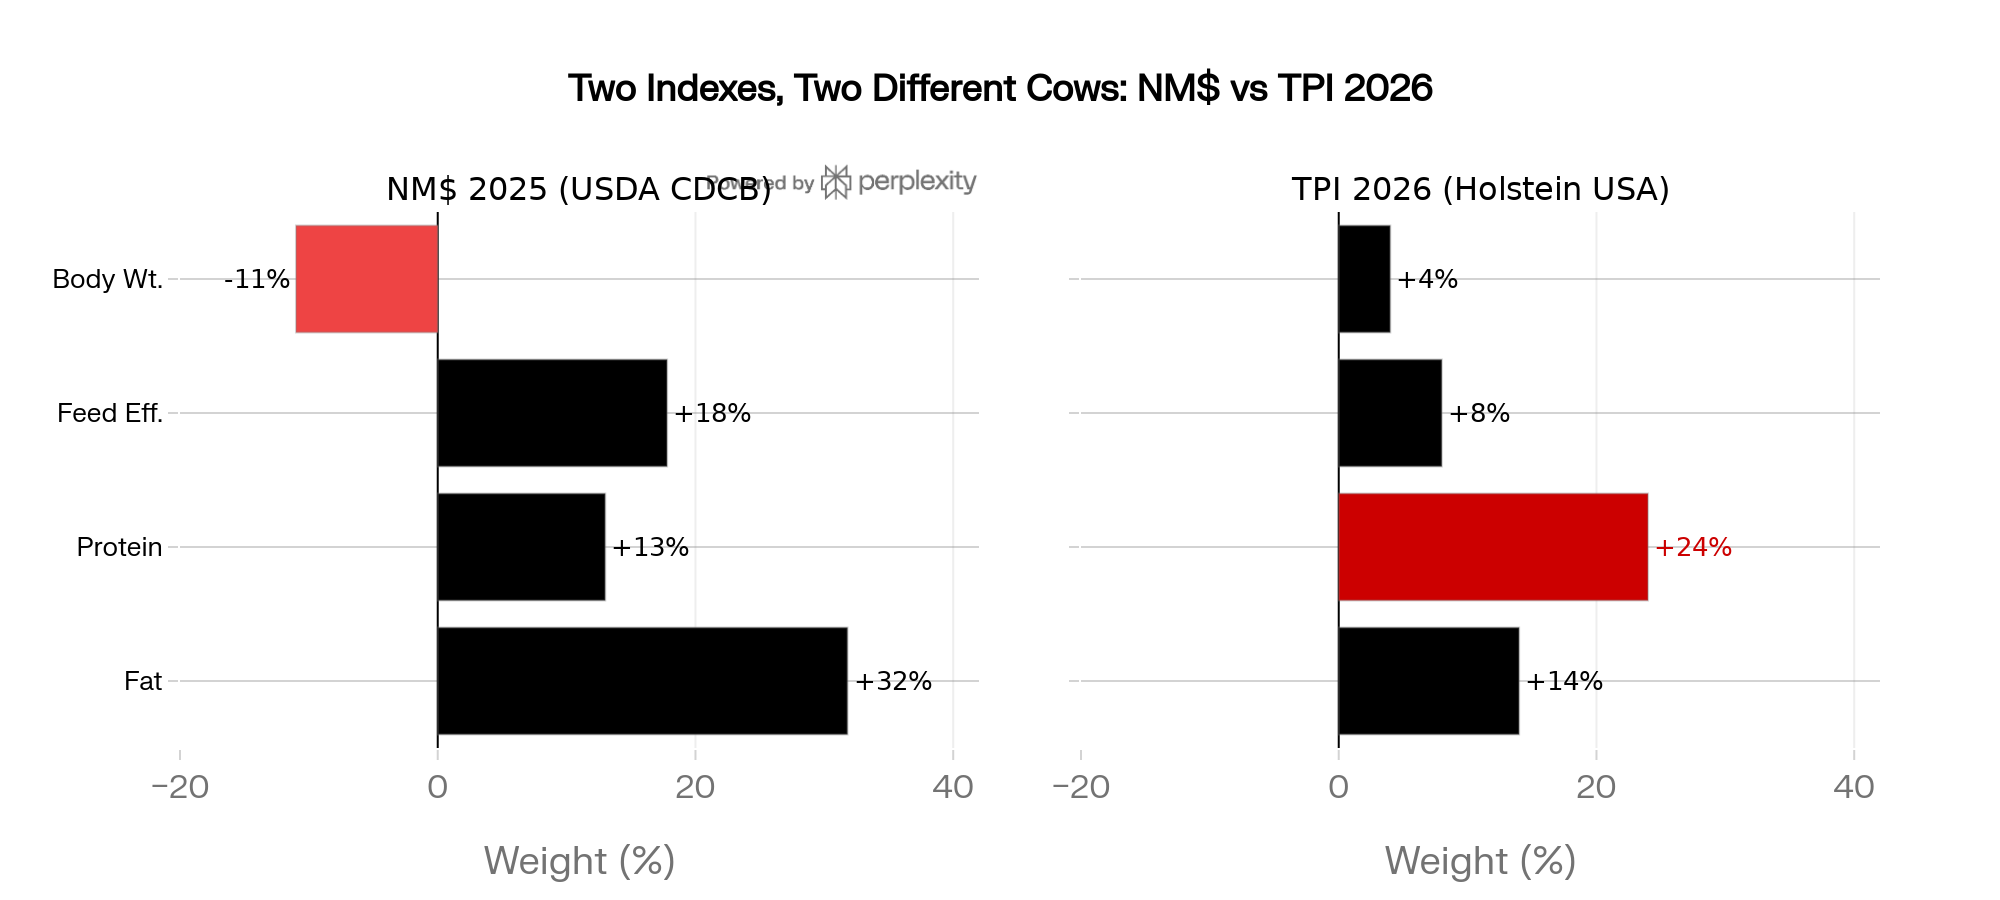
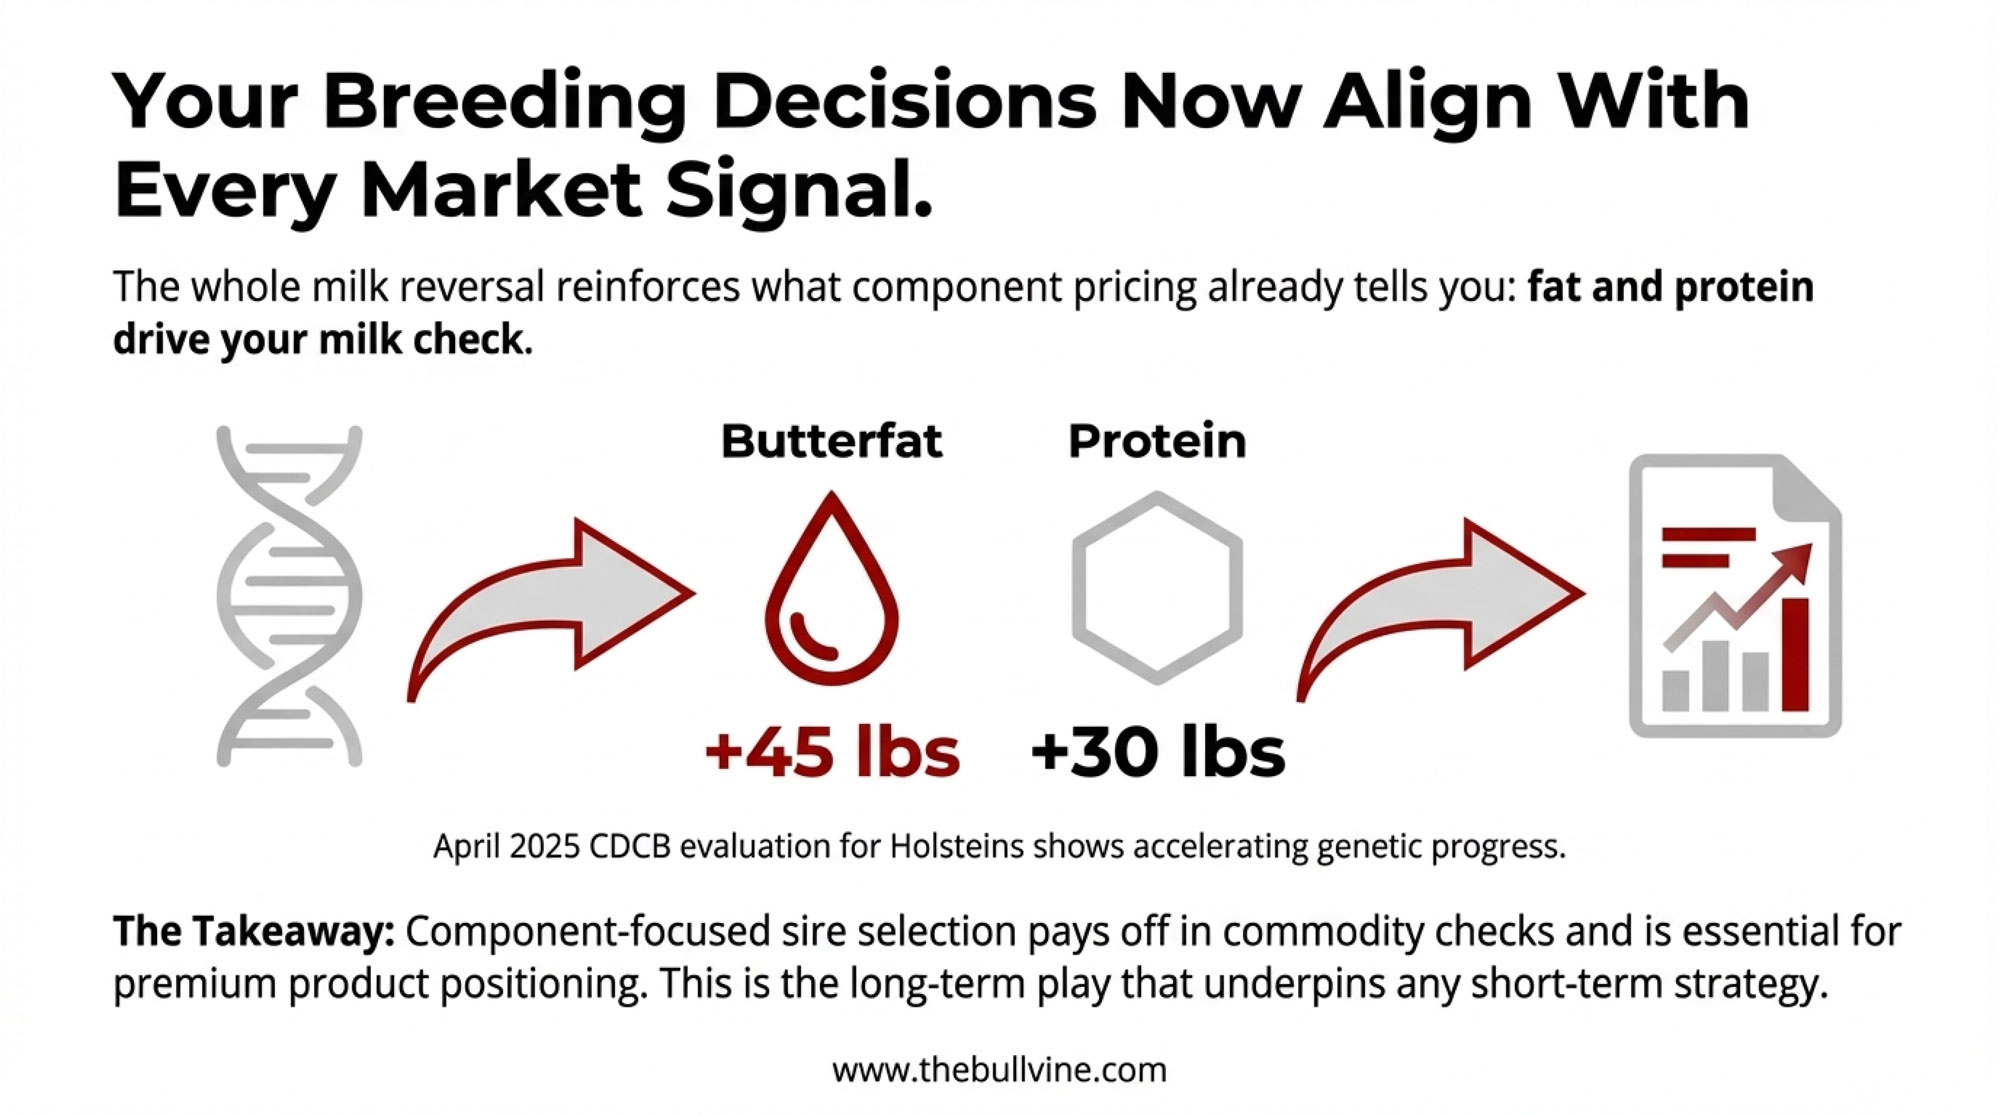
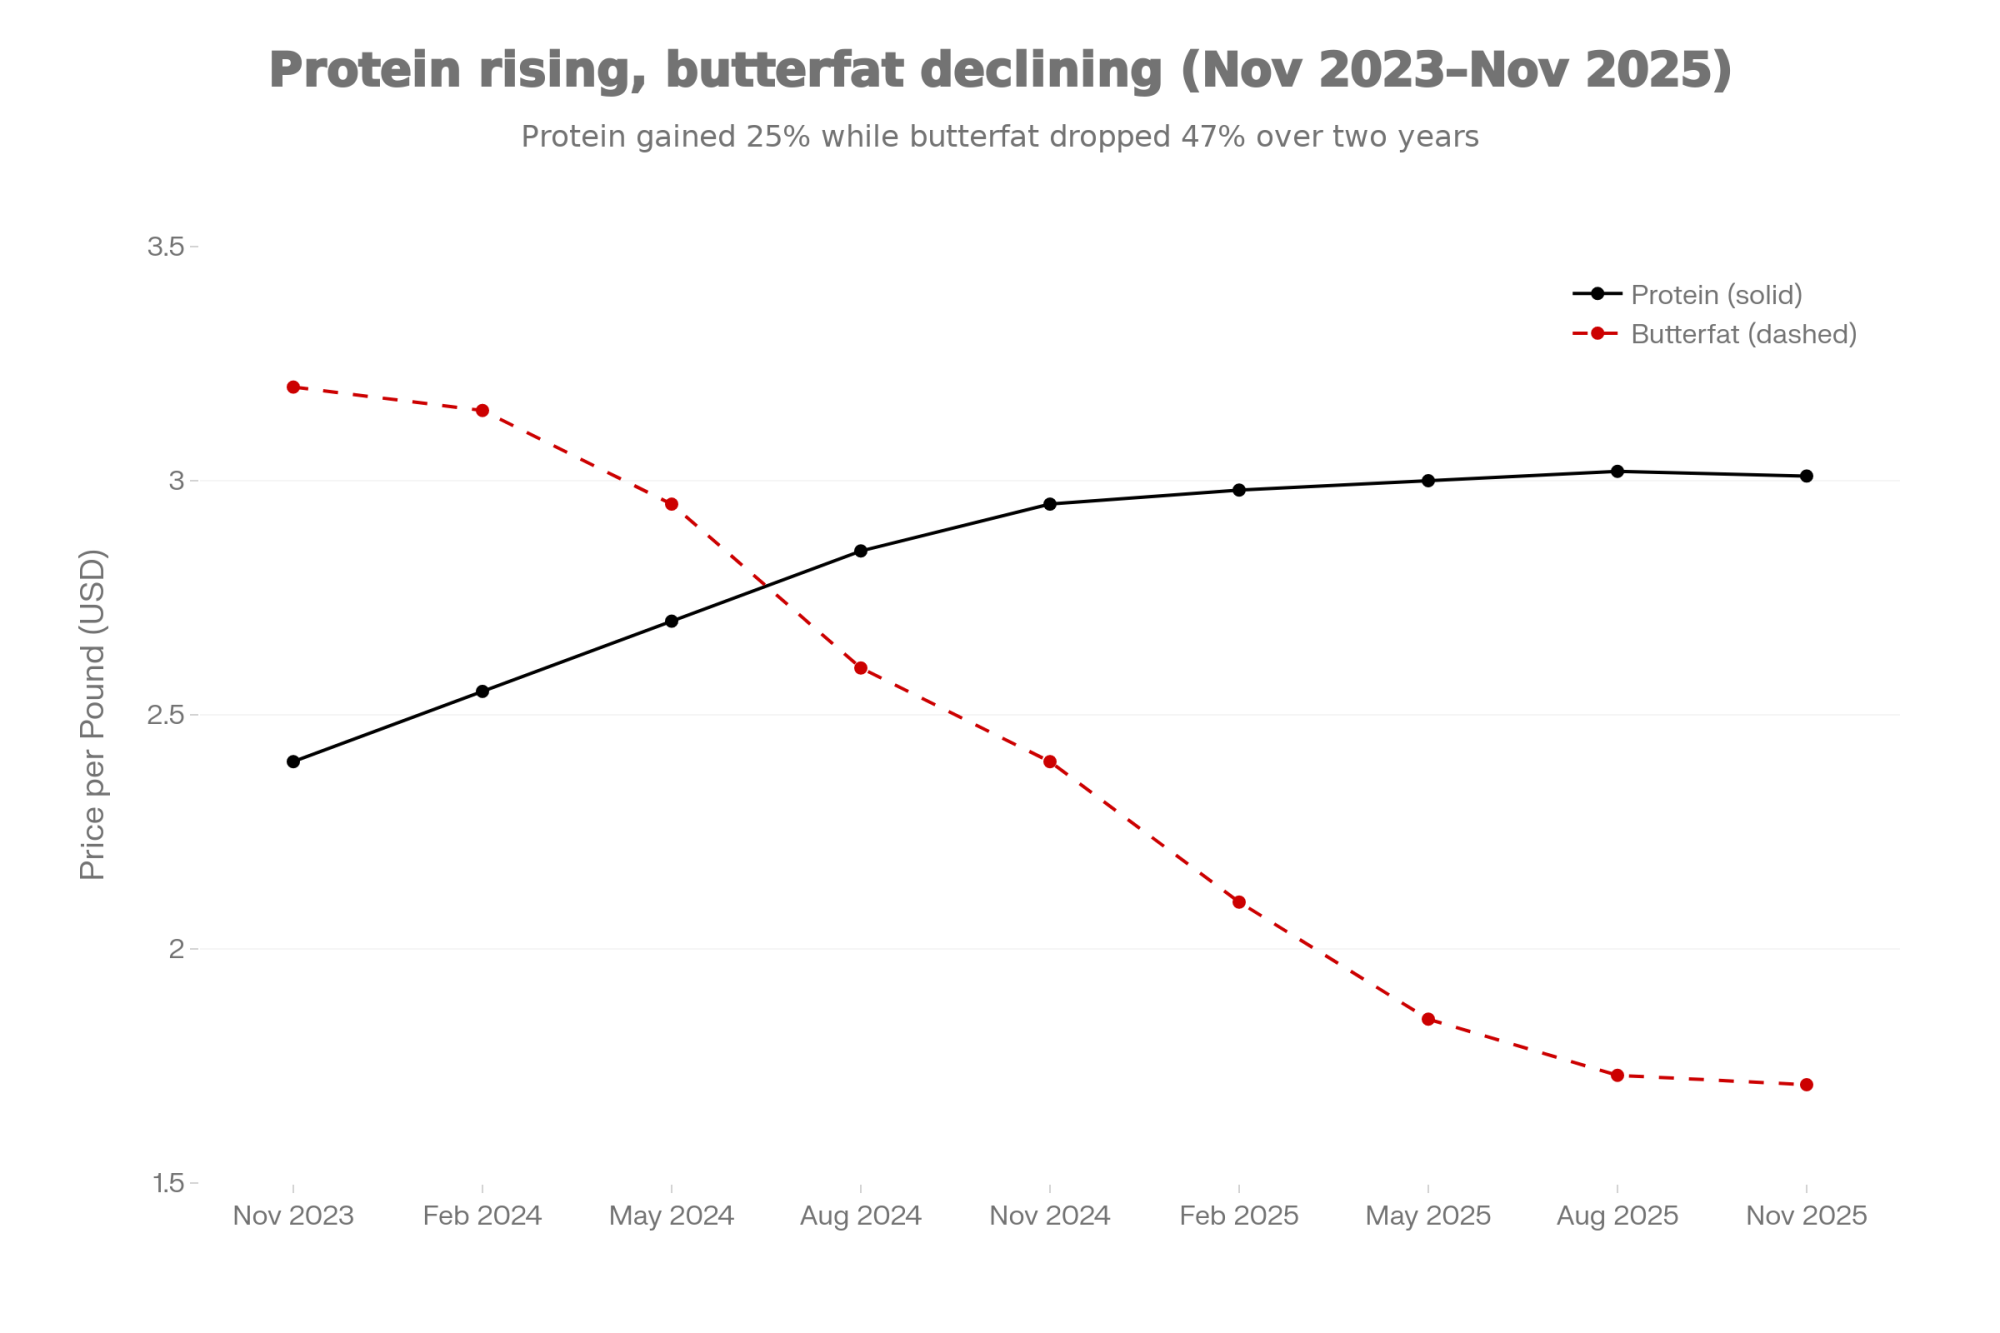
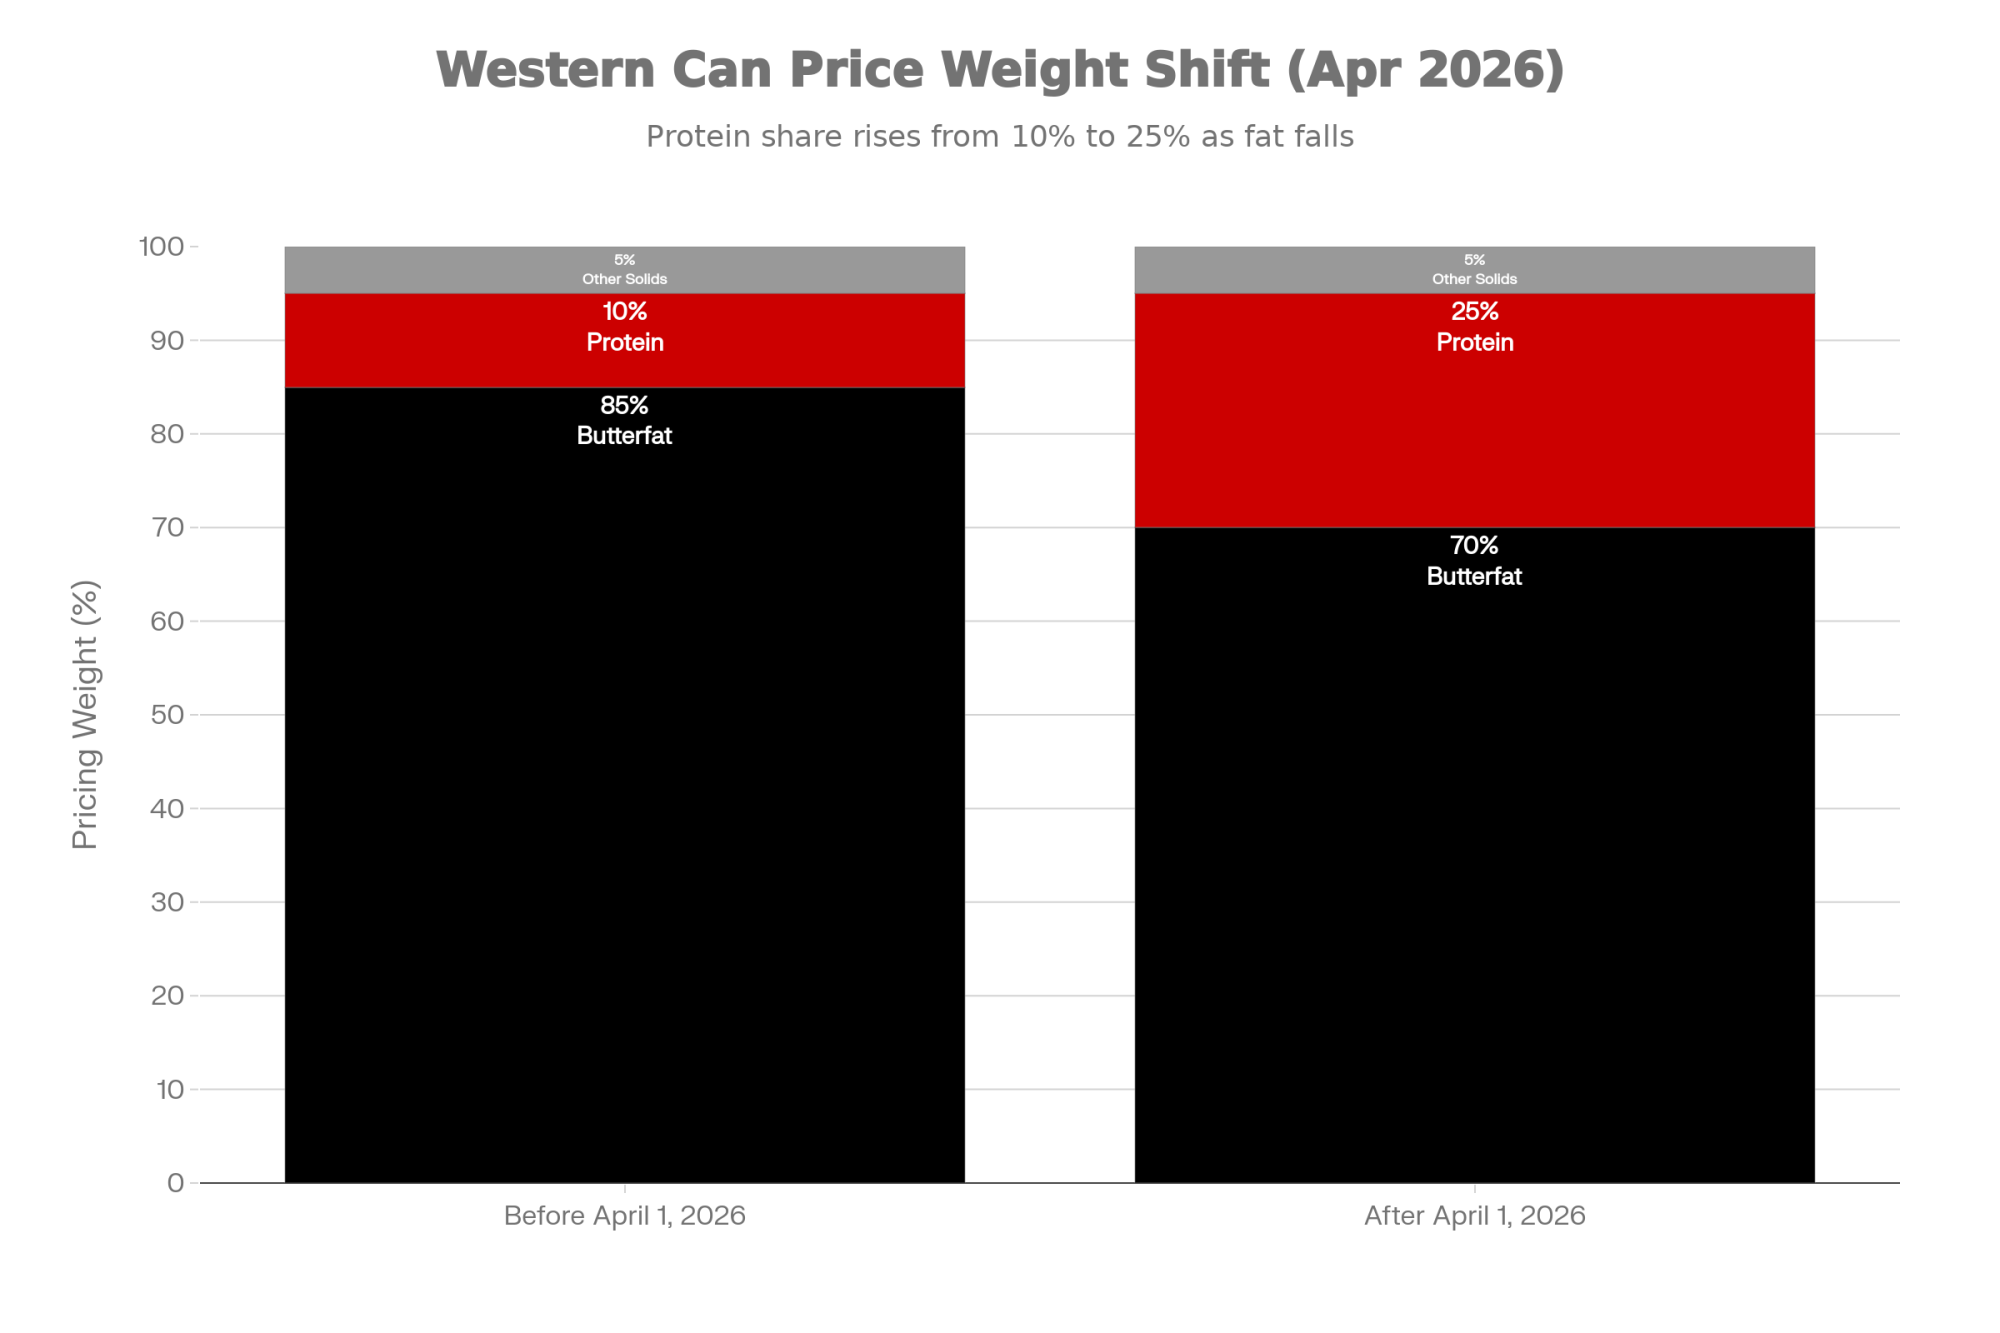
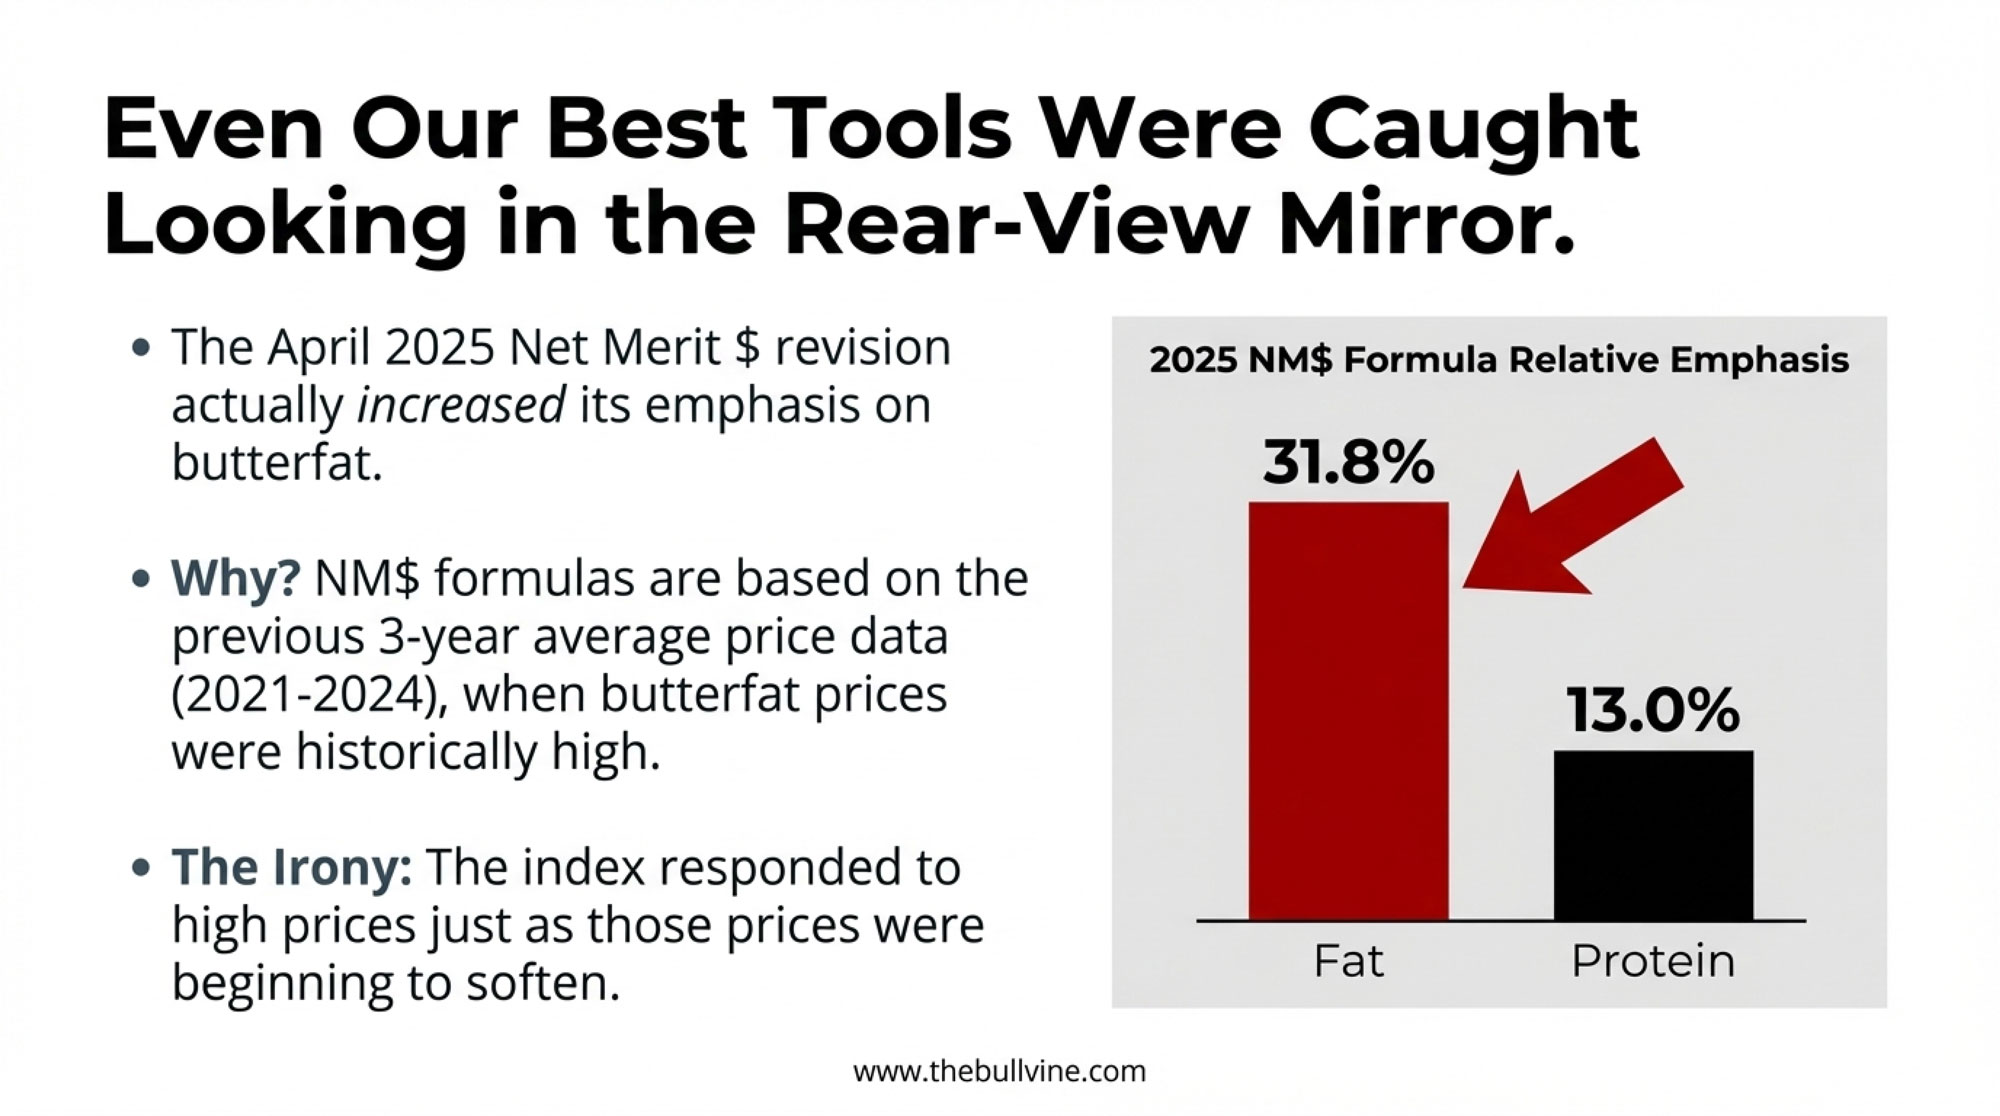
The CDCB’s April 2025 evaluation revision implemented the every-five-year base change (moving from cows born in 2015 to cows born in 2020) and updated income and cost variables inside NM$, Cheese Merit $, Fluid Merit $, and Grazing Merit $. Butterfat weight moved from 28.6 to 31.8 and protein dropped from 19.6 to 13, per the official CDCB April 2025 evaluation change documentation and the USDA-AGIL technical report by VanRaden, Toghiani, Basiel, and Cole. No new traits were added. No heat tolerance number. Those weight shifts carry their own strategic implications — which we unpack in our analysis of the April 2025 Net Merit revision’s butterfat-protein trade-off.
CDCB’s caution isn’t inertia for its own sake — the national evaluation’s credibility rests on trait reliability, and adding a trait prematurely carries real costs. But the cost of waiting now has a measurable dollar value. Realistic integration of Heat Tolerance into NM$ sits several evaluation cycles out. Lactanet is in a comparable position. The Guelph group has produced usable Canadian methodology and the 2025 JDS work validates it — but no heat tolerance index is currently published as part of LPI or Pro$.
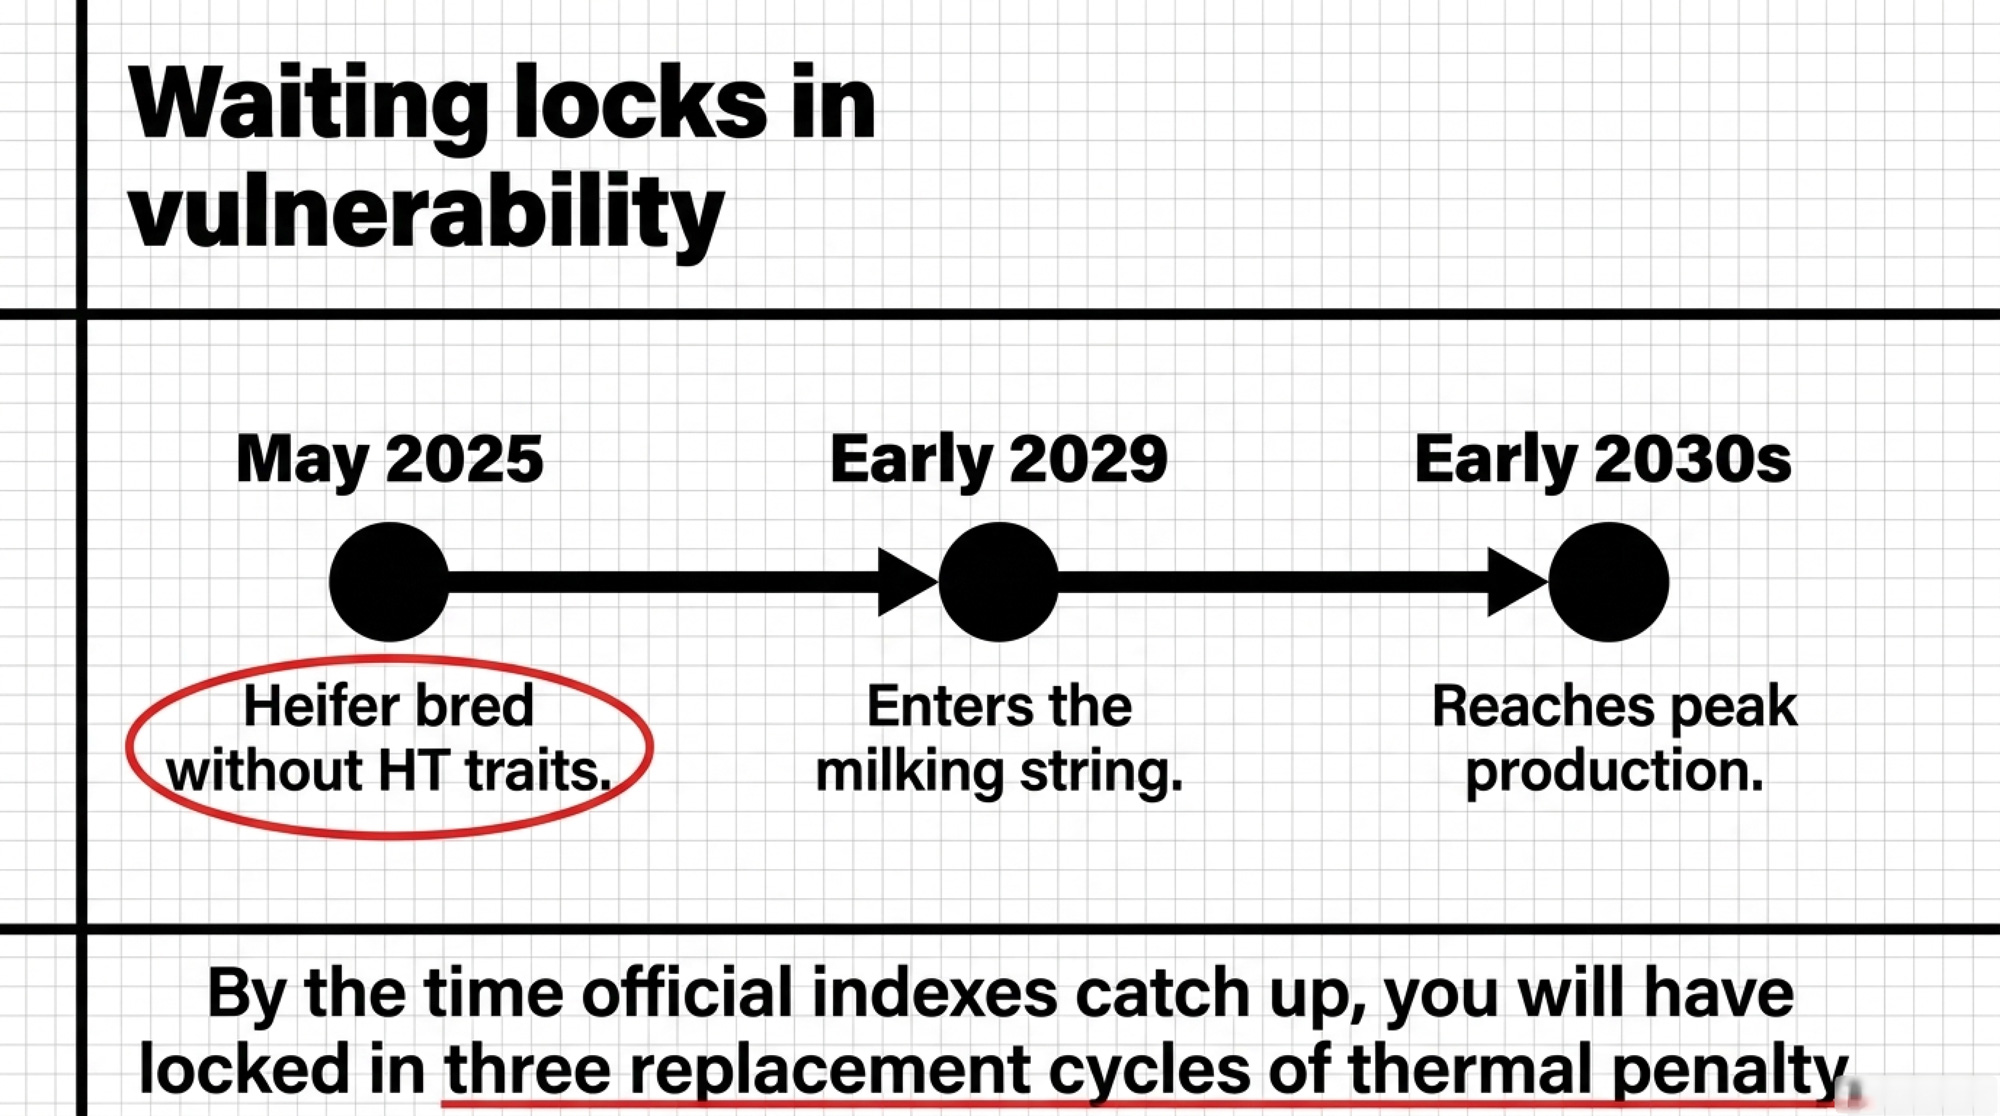
The replacement pipeline doesn’t care about governance timelines. A heifer bred this May enters the milking string in early 2029 and reaches peak production in the early 2030s — in a climate the Science Advances team projects will deliver materially more wet-bulb-26°C days across major dairy regions by midcentury, with 4% annual daily-yield losses baked in without adaptation. The genetic decision made this breeding cycle sets the thermal ceiling for that cow’s productive life.
The North American Program That’s Already Five Generations In
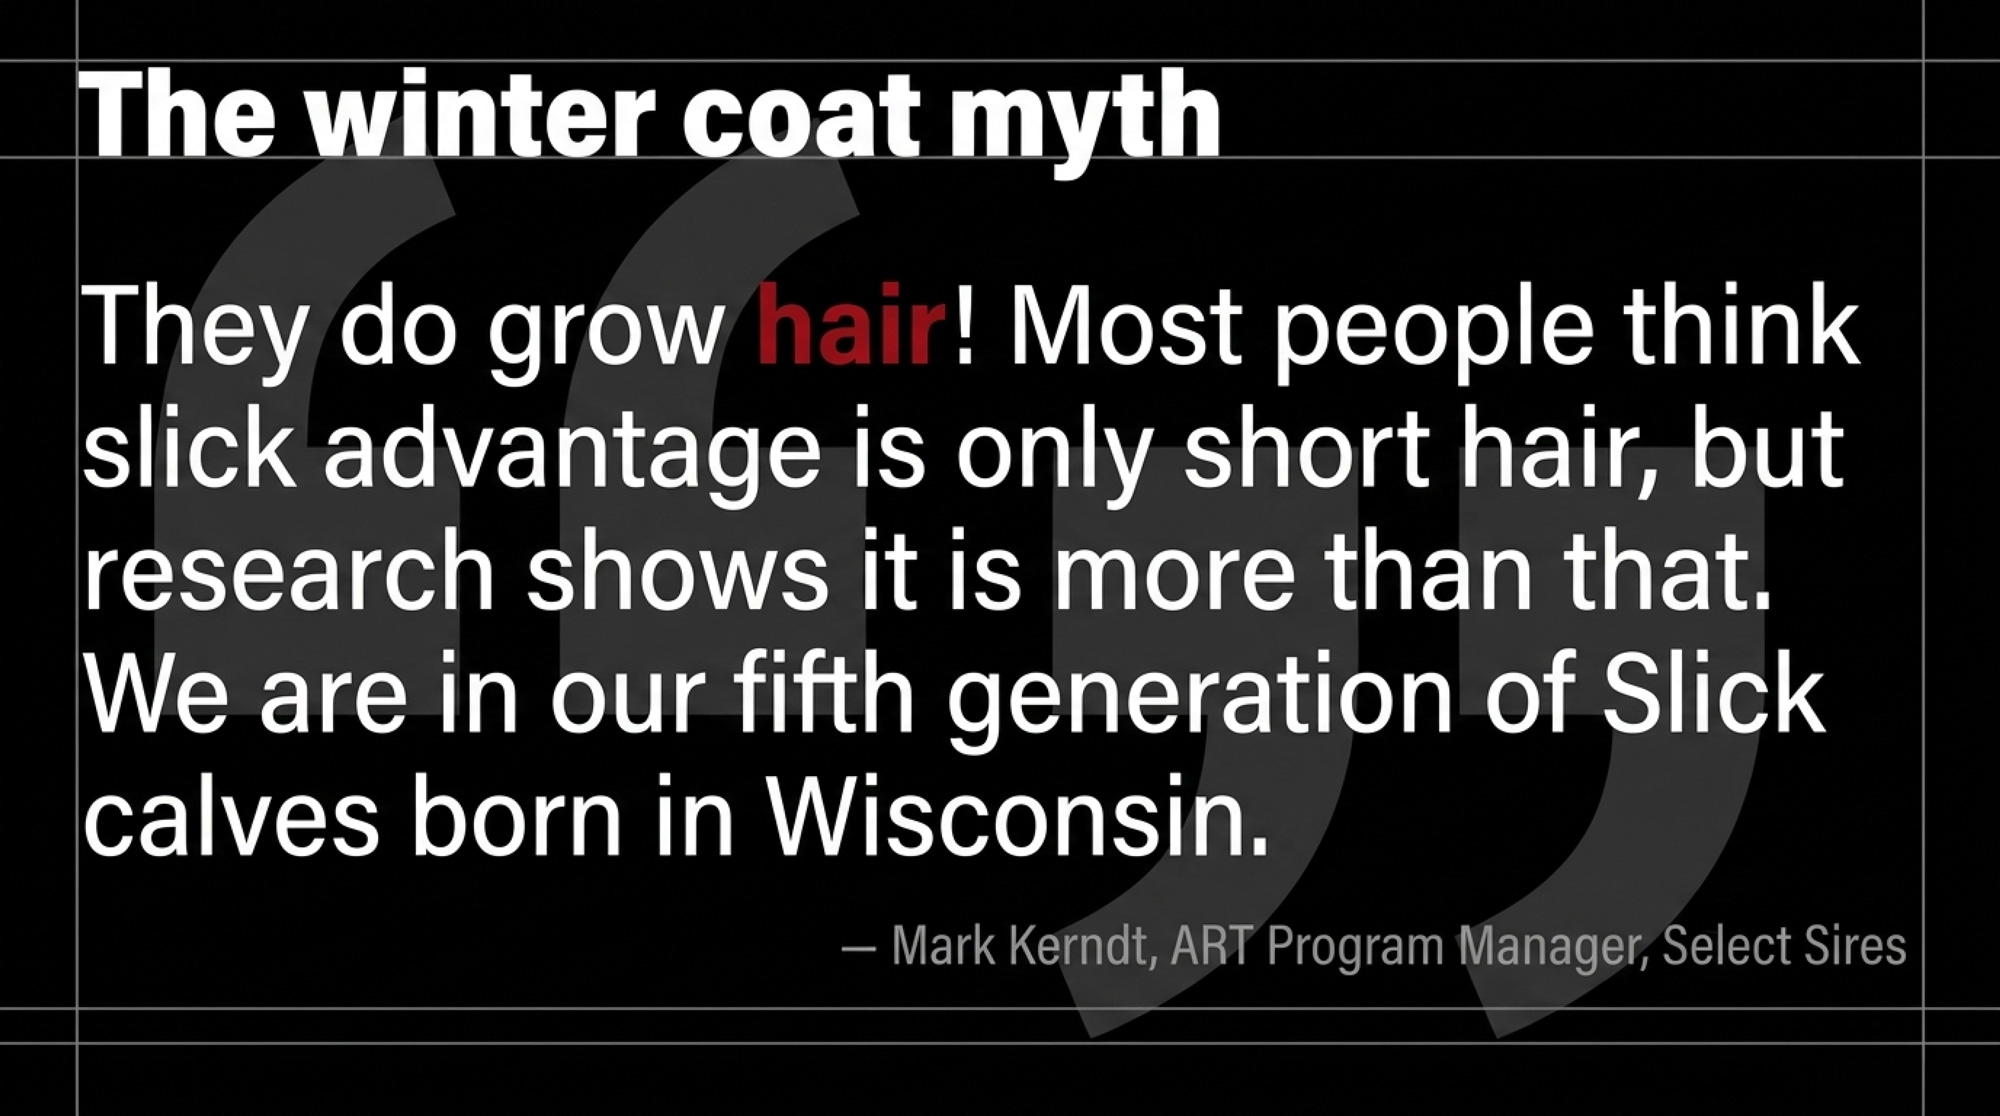
While CDCB hasn’t moved, Select Sires’ Aggressive Reproductive Technologies (ART) program has quietly been running the Slick playbook for years. Per an April 2026 blog authored by ART Program Manager Mark Kerndt, the program is now in its fifth generation of Slick calves, with all of them born in Wisconsin.
“We are breeding the horns out of the breed and are now also focusing on making the Holstein breed more heat tolerant, through the gradual introduction of the dominant slick allele into our cattle,” Kerndt wrote. “We expect several hundred potential slick calves to be born in our program in 2026 and the parent averages on these matings are very close to our non-slick matings.”
Two things worth holding onto from that. First: Wisconsin-born Slick calves grow hair in winter, which answers the most common North American objection before a breeder raises it. Kerndt again: “They do grow hair! Most people think slick advantage is only short hair, but research shows it is more than that.”
Second: parent averages on Slick matings sit close to non-Slick matings in the ART program. The production penalty breeders have long assumed isn’t showing up in the current generation. The piece of the picture North American breeders haven’t had — a named commercial program running the strategy long enough to produce fifth-generation data — is now on the record.
The piece still missing from the public record is the one that would close the circle: a named North American dairy producer, not an AI stud, who has been weighting HT or running Slick matings long enough to report two or three summers of their own production and fertility numbers. Those producers exist. Their data isn’t yet in the trade press. That’s the next story worth telling, and The Bullvine is actively reporting it — if you’re running one of these programs and willing to talk on the record, the editor’s line is open.
“But I Have -20°C Winters” — The Cold-Climate Objection That Isn’t Aging Well
The pushback from Ontario, Quebec, Wisconsin, and Minnesota breeders is almost always the same: “I don’t want a tropical cow in a -20°C barn.” Fair question. Until the data answers it.
Kerndt has answered it directly from Wisconsin, where January air temperatures regularly sit below -10°C. His fifth-generation Slick calves are born there, stay there, and — in his own words — “do grow hair!” The Slick allele isn’t producing tropical cattle incapable of holding coat in cold country. It’s producing cattle that thermoregulate more efficiently when THI climbs, while still growing a winter coat when the thermometer drops.
The framing error is calling it a “tropical gene” in the first place. Slick was characterized in Senepol cattle in tropical regions, yes — but the trait it delivers is heat dissipation efficiency, not tropical-only viability. And the climate the “temperate” label was built on doesn’t exist anymore. The Science Advances data shows that Ontario, the Upper Midwest, New York, and the Atlantic provinces are already accumulating enough wet-bulb-26°C days to put real dollars per cow per year on the table — the illustrative 0-per-cow midpoint in the Barn Math section lands squarely in those regions, not in Puerto Rico.
The decision has shifted. It used to be: “Is Slick worth the winter coat penalty?” The current data says: “Is holding onto an outdated temperate-climate mental model worth giving up 50% of the recoverable summer margin?”
Four Ways to Start Now — Without Waiting for CDCB
Active breeders split from waiters right here. Four approaches are already in use, each with a different cost, effort, and exposure profile. None require CDCB or Lactanet to move first.
MoveCost profileSignal usedBest fitDataGene Good Bulls AppFree lookupHT ABV; Holstein reliability around 48%Any breeder building a sire listZoetis Milk_THI / CFS_THI inquiryAccount / rep access dependentMilk-yield and first-service conception response to THILarge herds already using genomic servicesAustralian proof sheet requestRep request; sire coverage variesAustralian HT proof on eligible international siresHerds buying Semex, Genex, ABS or similar international geneticsCustom index layerGeneticist setup; usually 1–2 quartersNM$ or LPI floor plus HT as secondary filterOperations already using custom selection indexes
1. The Free Move — DataGene’s Good Bulls App. DataGene publishes HT ABVs quarterly in its freely available Good Bulls App. Pull it up, search a sire name, read the ABV. It costs nothing. DataGene’s own fact sheet recommends using a team of bulls because HT ABV reliability sits around 48% in Holsteins, lower than conventional production traits — but 48% on a trait that doesn’t exist in NM$ is still 48% more signal than you have today.
2. The Phone Call — Zoetis Milk_THI and CFS_THI. The Zoetis traits are peer-reviewed (Vukasinovic et al., JDS, September 2025; follow-up JDS validation, November 2025). Whether they’re accessible through Clarifide — and under what conditions — is a question for your Zoetis rep directly. Validation confirmed the traits identify cows that keep body temperature regulated during heat stress. Larger operations with existing account relationships are the ones most likely to get a useful answer first.
3. The Genetic Filter — Australian Proofs via International AI Partners. Sires distributed through international-facing AI partners — Semex, Genex, and ABS among them — may carry Australian proof data where their genetics are evaluated in the Australian system. Coverage varies by sire and stud. Ask your AI partner for the Australian proof sheet on specific bulls you’re considering. This is a phone call your rep can make today; no new account, no testing investment.
4. The Custom Index — Layering HT onto NM$ or LPI. For operations already running custom selection indexes, set NM$ or LPI as a floor and layer HT as a secondary filter — structurally how Australian farmers already use BPI alongside HT ABV. It takes a conversation with your AI partner’s geneticist and typically a quarter or two to implement cleanly. If you’re already building custom indexes, this is the obvious next add.
Slick Sires: What the Allele Actually Does — and Doesn’t
For operations ready to go further than a filter, weighting Slick sires into 20–30% of matings is the most direct structural play. Slick carriers are in commercial North American catalogs today, with Select Sires’ ART program the most openly documented pipeline — confirmed in the April 2026 Holstein Sire Directory. Swissgenetics also markets THERMO-ET P SL, the first European homozygous-polled Red carrier of the Slick gene. Coverage across other major studs varies; ask your AI partner what they currently carry or can source.
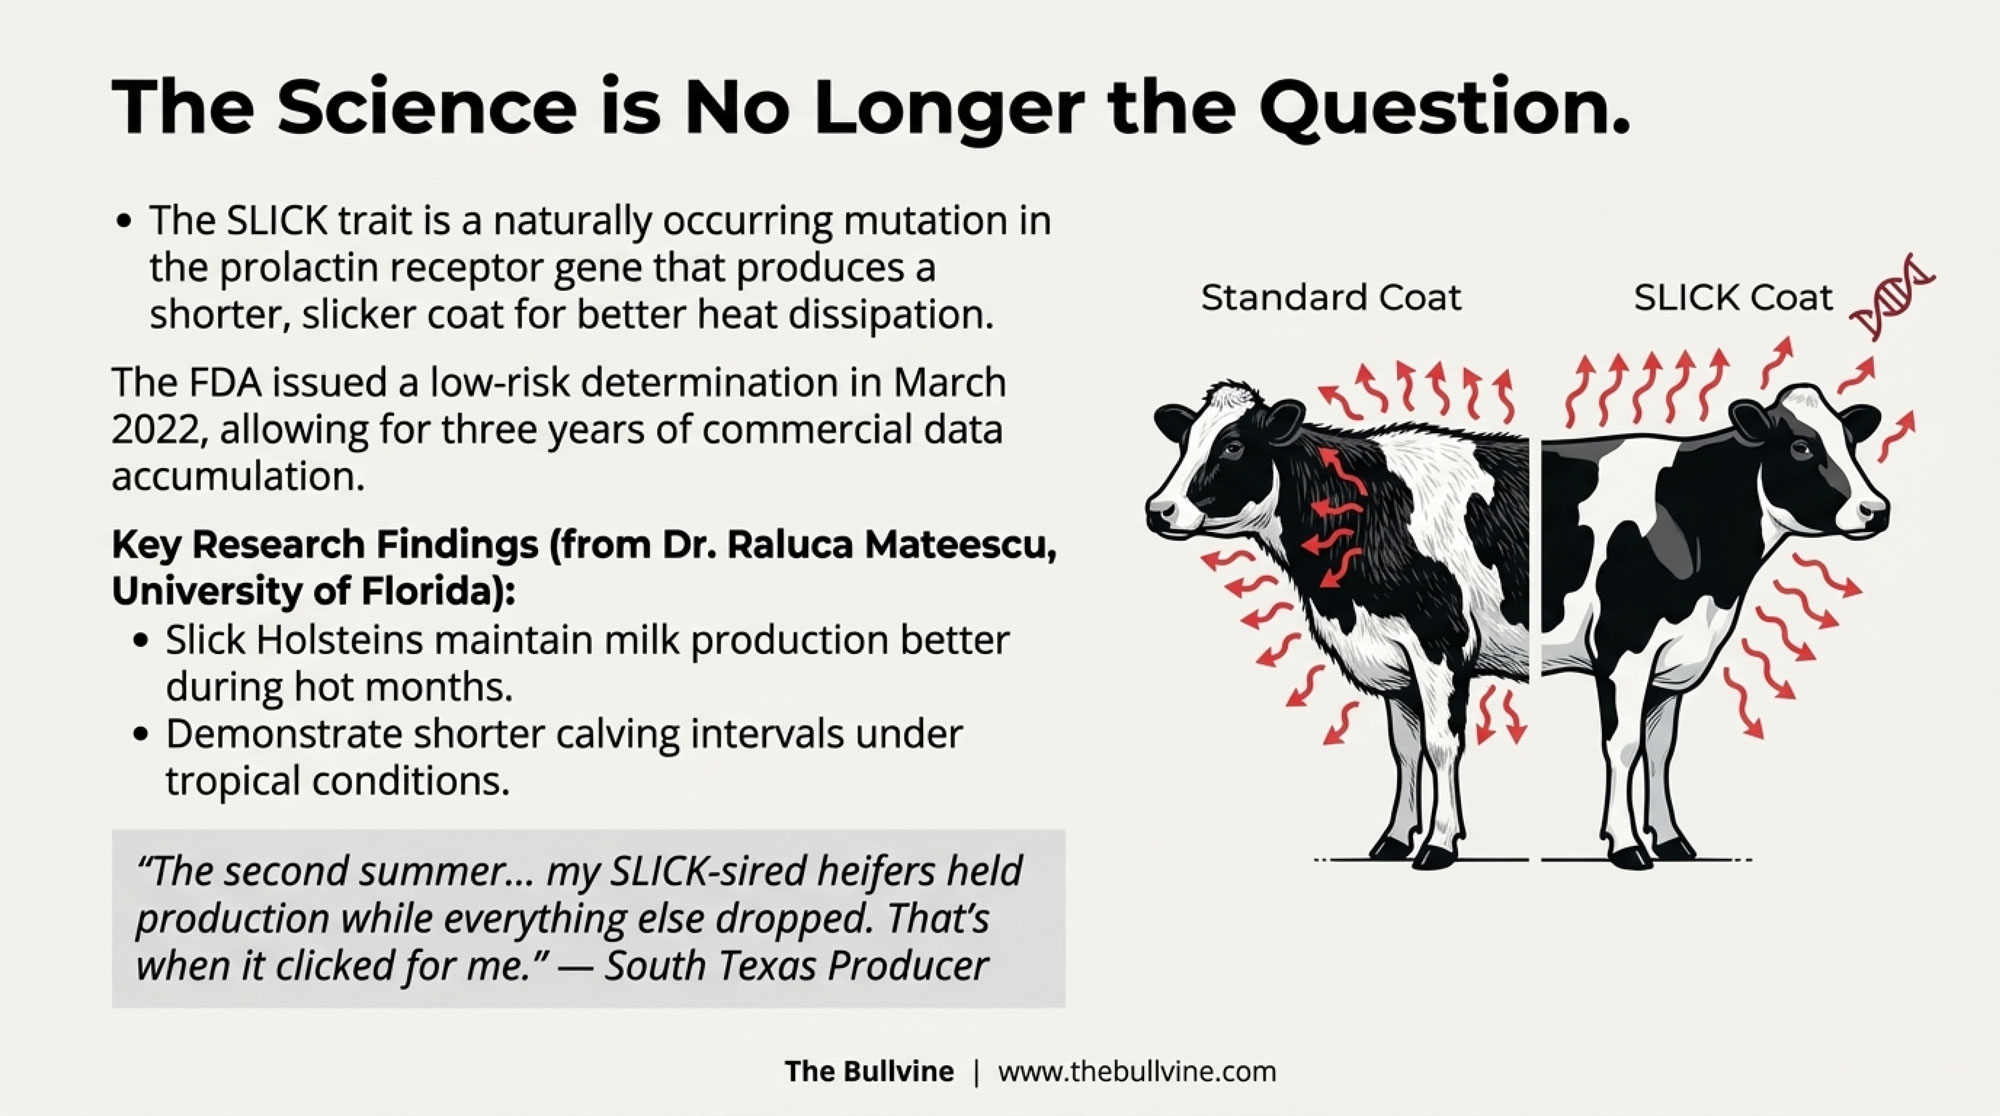
Here’s what the biology actually delivers. The Slick allele is a dominant mutation in the prolactin receptor gene that produces a short, sleek coat. University of Florida research by Dikmen and colleagues (Journal of Dairy Science, 2014) documented that Slick cows averaged 1.1°F lower vaginal temperatures at the hottest times of day (noon to 3 p.m.) compared with non-Slick herdmates housed in the same Florida freestall environment. And where summer-calving cows typically see a sharp first-90-day yield depression compared with winter-calving animals, that seasonal gap was substantially reduced in Slick carriers — Slick cows held closer to their winter-calving performance than wild-type animals in the same heat conditions. The regulatory and commercial path Slick has walked is worth comparing with how the PRLR-SLICK gene-edited variant stacks up on the 2029 milk cheque.
The strategy isn’t 100% Slick. It’s targeting Slick matings at your highest-producing cow families and summer-calving blocks, where heat stress hits the margin hardest. A 20–30% allocation blended with elite conventional sires selected on NM$ or LPI is where most breeders start. Per Select Sires’ own ART data, the production penalty Slick once carried isn’t showing up in the current generation.
Is Your Herd’s Genetic Strategy Already Behind Where Australia Was in 2019?
Not a rhetorical question. By the August 2024 ABV release, one in three Holstein Good Bulls cleared 100 for Heat Tolerance. Parrish told Dairy News Australia that Australian AI centres are moving toward filtering on HT the same way they already filter for calving ease: “AI centres won’t take bulls that aren’t good for Heat Tolerance. It will be like calving ease — now they won’t buy a bull that causes difficult calvings.”
That shift didn’t come from a regulator. It came from farmers like Parrish, year after year, building HT into what they asked their AI reps for.
North American studs respond to the same pressure. Kerndt has said plainly: “Heat tolerance is a valuable economic trait. By adding the slick trait to the elite genetic package offered by Select Sires, we can accomplish our goal of helping dairies everywhere become more profitable.”
When the conversation at the rep level shifts from “what’s your highest NM$ bull?” to “what’s your highest NM$ bull with Australian HT data above 100 or a validated Milk_THI value above zero?” — the catalogs move. Not in 2030. Sooner. The breeders best positioned will be the ones whose replacement heifers already carry heat-adapted genetics when that shift lands.
What This Means for Your Operation
If your herd regularly sees days with wet-bulb temperatures approaching or crossing 26°C, the Science Advances data says you’re already losing meaningfully on those days — even with fans and soakers running. Pull your summer milk-weight records against THI days from the last three years before your next breeding order.
If your replacement rate runs above 30%, you have enough genetic turnover to see measurable HT impact inside four years. Below 25%, stretch that timeline and adjust expectations accordingly.
If you already genomic-test 70% or more of your replacements, the incremental cost of adding HT screening at the sire level is effectively zero. The only reason not to add it is habit.
If your AI rep hasn’t raised heat tolerance in a sire presentation, that’s a conversation worth starting. The data exists. Whether your current stud has prioritized surfacing it is worth finding out before the next breeding order goes in.
If you breed for a specific milk market — components, cheese yield, A2A2 — weight HT as a filter on top of those targets, not a replacement for them. It stacks. It doesn’t substitute.
If you operate in what was traditionally called a “temperate” region — Ontario, Quebec, Upper Midwest, New York, Atlantic provinces — treat that label as historical, not current. The Science Advances midcentury projection work puts meaningful additional heat exposure in those regions.
If the winter-coat concern has kept you out of Slick matings: Select Sires’ fifth-generation Wisconsin-born Slick calves grow hair fine. The penalty isn’t what breeders have long assumed it was.
Key Takeaways
In the next 30 days: Pull your top 20 planned sires. Cross-reference each against DataGene’s Good Bulls App for HT ABV. Ask your Zoetis rep whether Milk_THI or CFS_THI values are accessible on those bulls. Request Select Sires’ April 2026 Holstein Sire Directory to identify current active Slick carriers. This is an afternoon’s work.
In the next 90 days: Identify your top-producing 20–30% of cow families and your May–July freshening block. Allocate Slick sire matings to those specific groups rather than broadcasting across the herd.
In the next 12 months: Begin documenting summer production and conception baselines now. When CDCB or Lactanet eventually integrates HT into NM$ or LPI, you’ll have your own performance delta in hand before your neighbor has results from their first Slick daughter.
If X, then Y: If your farm sits in a region that clears wet-bulb 26°C on more than a handful of days each summer and your replacement rate is above 30%, the cost of waiting another three years for CDCB exceeds the cost of starting a blended HT strategy now.
The wrong answers book-end the right one: 100% Slick is the wrong strategy for most North American herds in 2026. Zero Slick, in regions already carrying meaningful heat-day loads, is also the wrong strategy. The defensible position sits at 20–30%, targeted on your best, most heat-stressed genetics.
Parrish’s herd in Kangaroo Valley isn’t really the story. Select Sires’ fifth-generation Slick calves in Wisconsin aren’t quite it either. The story is that a producer in Woodstock, Tulare, or Fond du Lac could have started in 2019 or 2020 and closed most of the same distance by 2026. The tools have been sitting on the shelf. The question worth asking before the next breeding order goes in isn’t whether the climate will keep pressuring your margins. It’s whether the heifer you bred last Tuesday is built for the barn she’ll actually be milking in by the early 2030s — and if your AI rep can’t answer that question, what does that say about where the conversation needs to go next?
Complete references and supporting documentation are available upon request by contacting the editorial team at editor@thebullvine.com.
Transform Heat Stress into Your Carbon Strategy’s Secret Weapon — Follows the money on climate-linked regulatory risks, detailing how heat-stressed herds face a 23% methane penalty. Breaks down how selecting for heat-tolerant genomics secures your herd’s environmental compliance and long-term production floor.
Gene-Edited Cows Are Legal. Your 2029 Milk Cheque Isn’t Safe. — Exposes the massive regulatory shift making gene-edited Slick cattle a commercial reality. Highlights how PRLR-SLICK edits bypass decades of traditional breeding to deliver immediate thermal resilience and vital margin protection for the next decade.
The Sunday Read Dairy Professionals Don’t Skip.
Every week, thousands of producers, breeders, and industry insiders open Bullvine Weekly for genetics insights, market shifts, and profit strategies they won’t find anywhere else. One email. Five minutes. Smarter decisions all week.
STgen owns 36% of the proven TPI top 100. Select Sires took 29.5% of the genomic top 200. United Sires — an independent breeder partnership founded in 2024 — grabbed 15% of the genomic top 200. And Zoetis just bought the lab pipes everyone else’s DNA flows through.
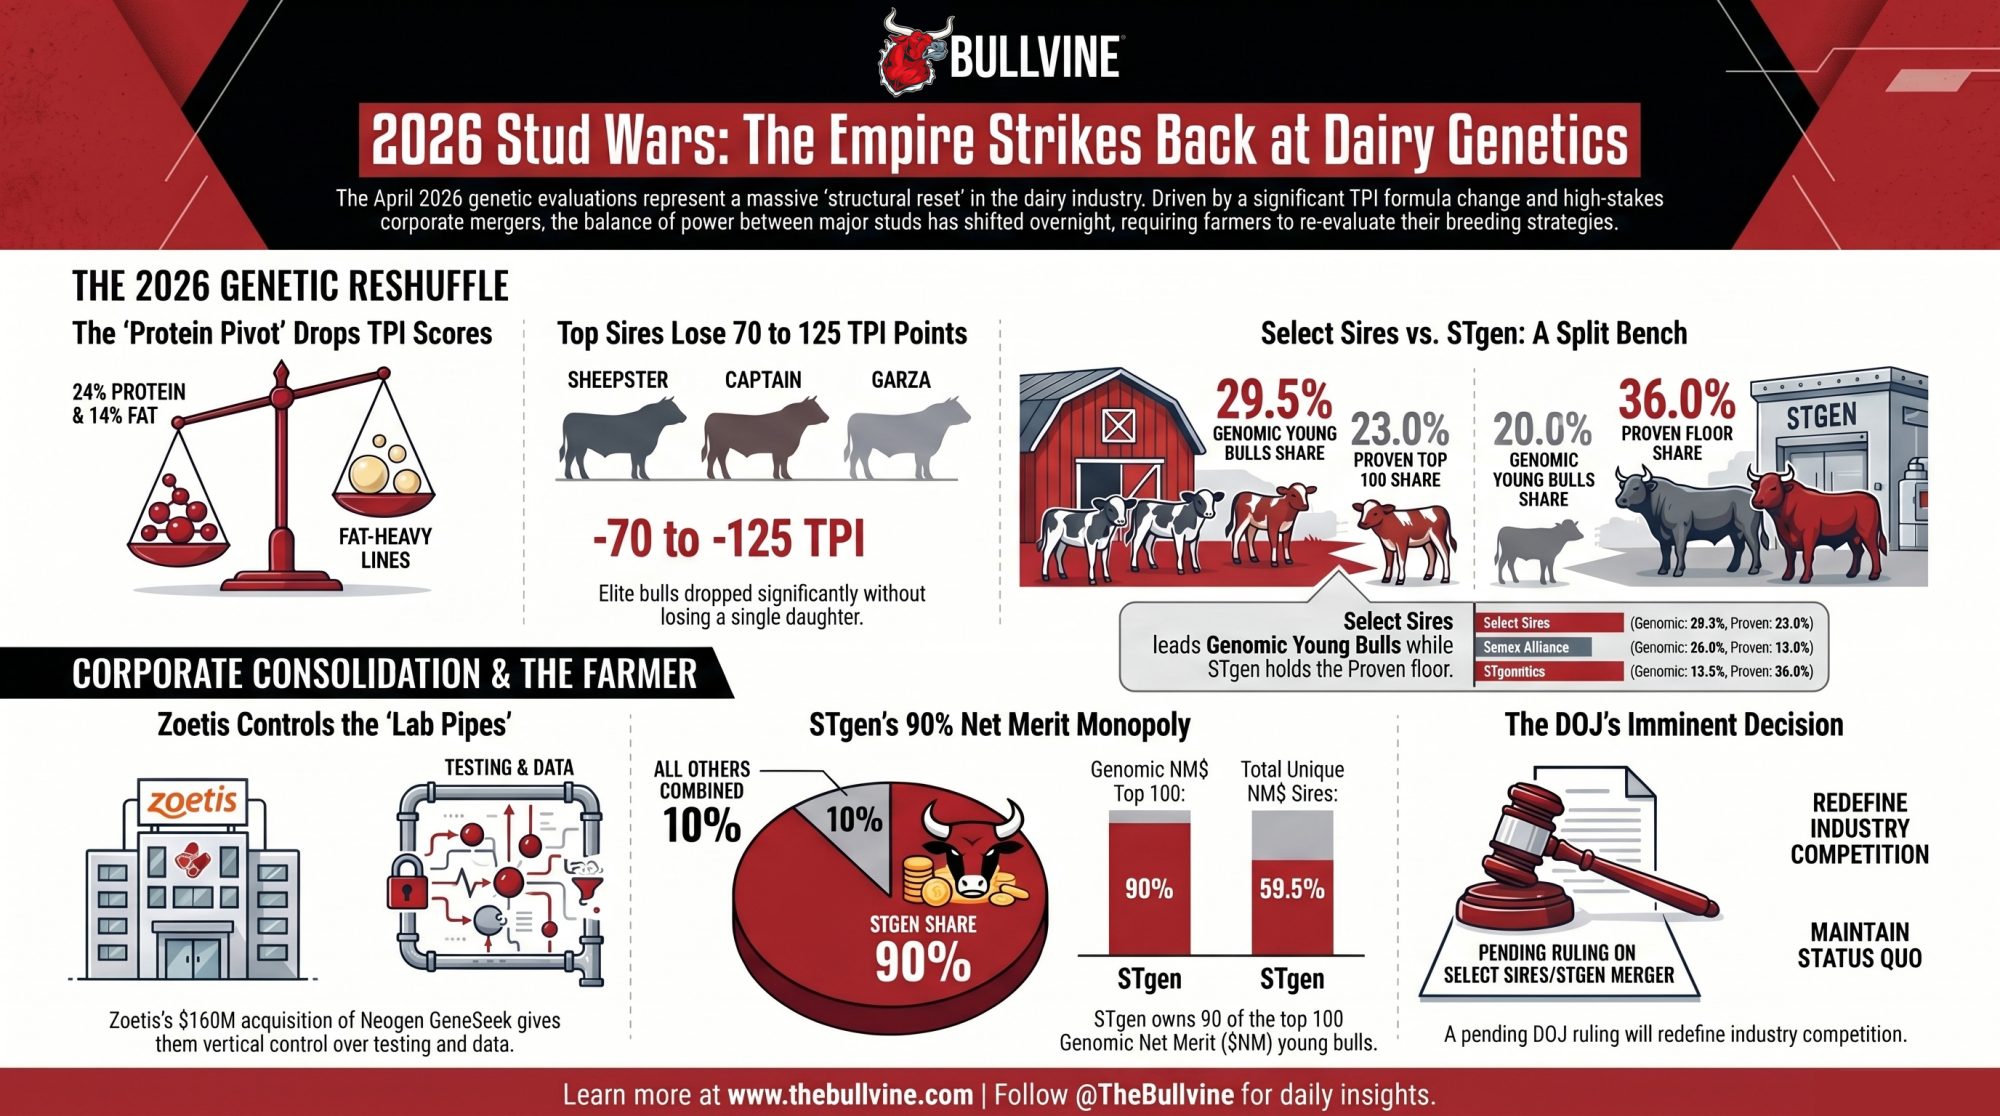
Three things hit at once on April 7, 2026.
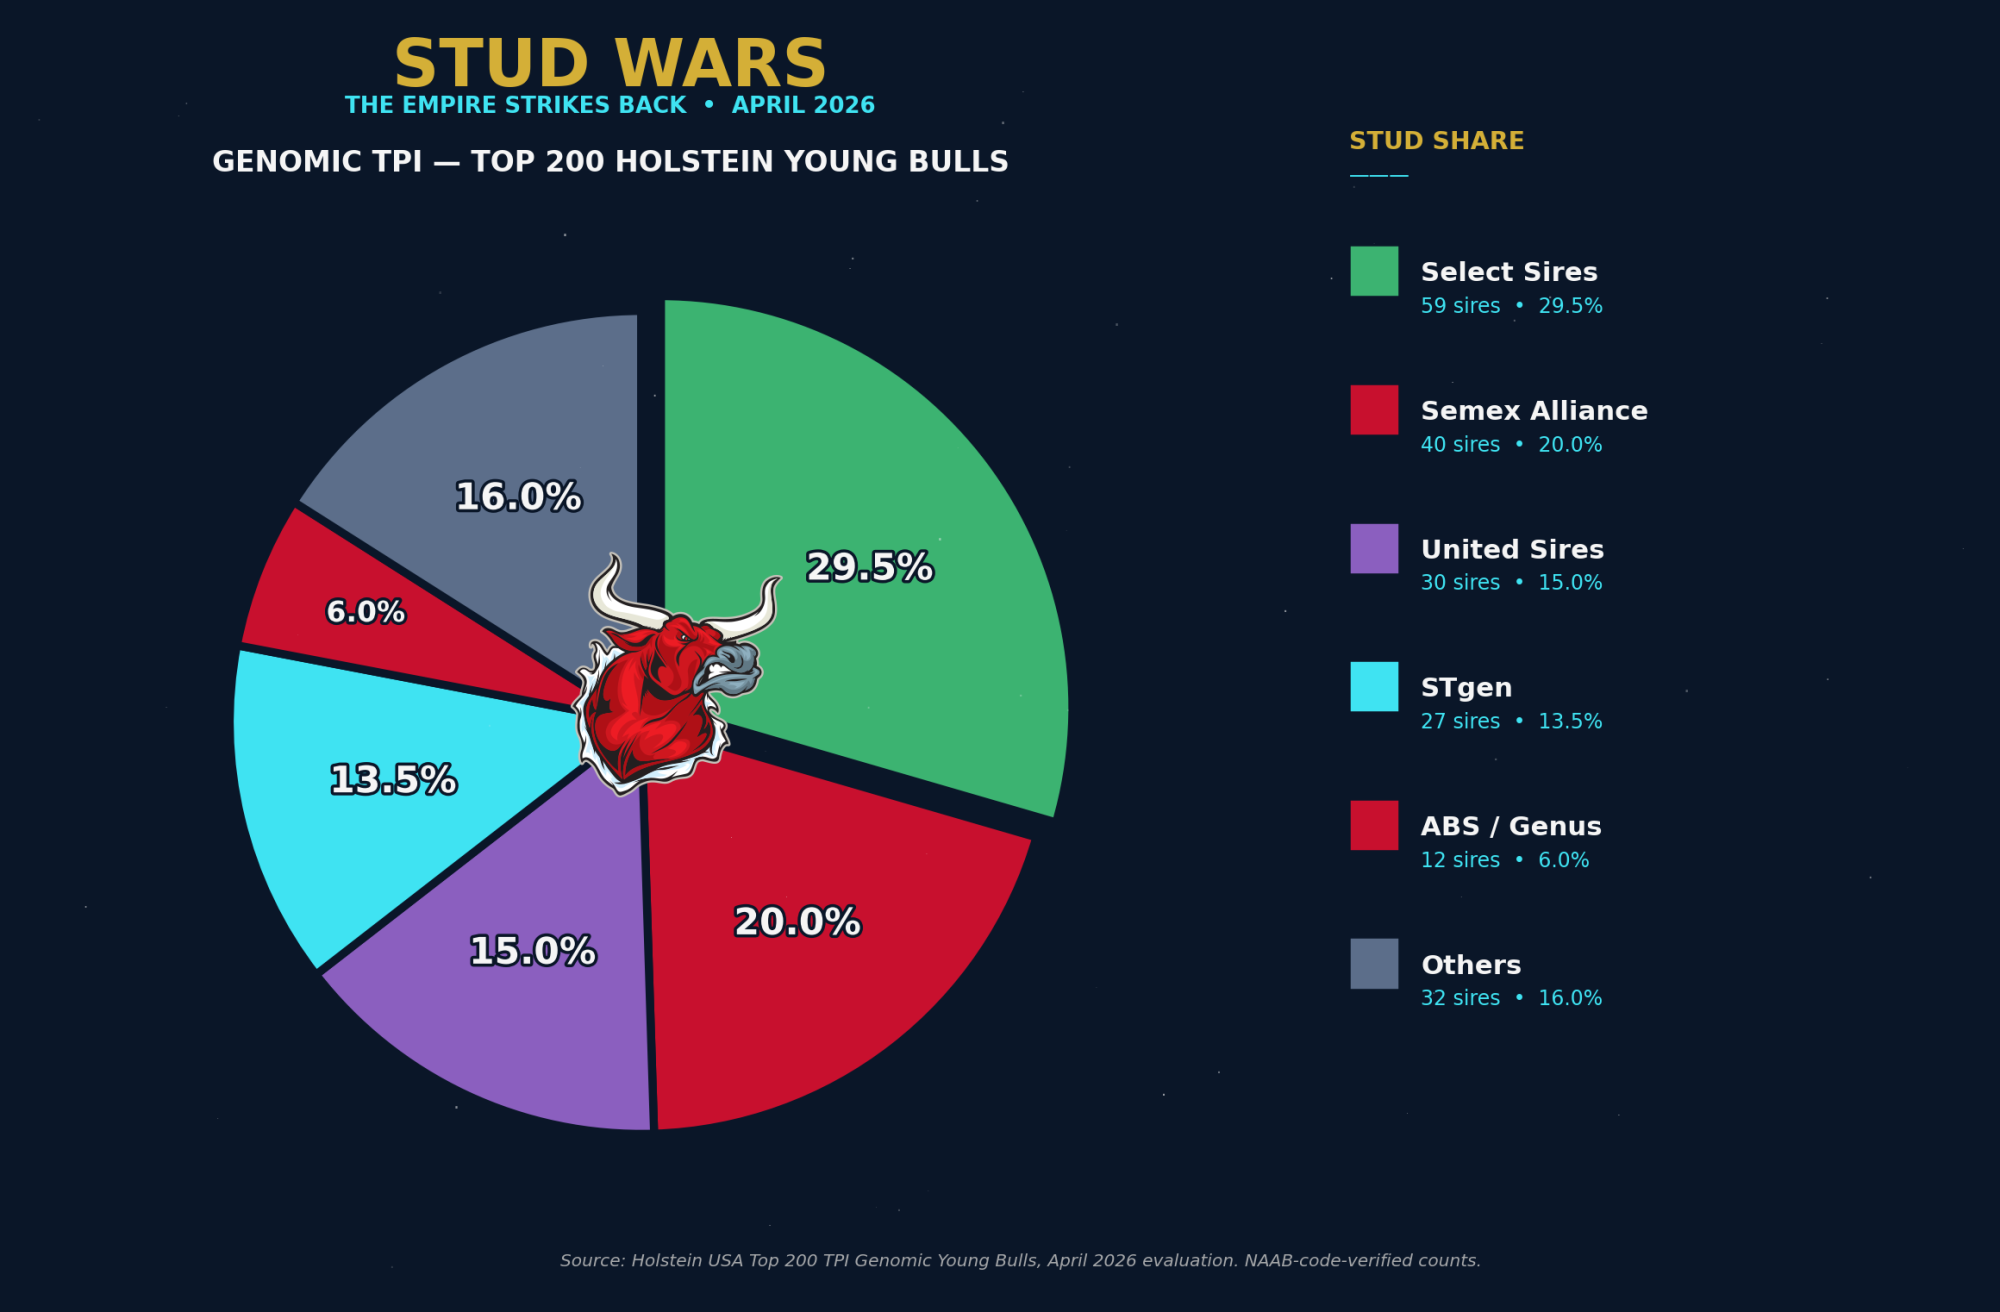
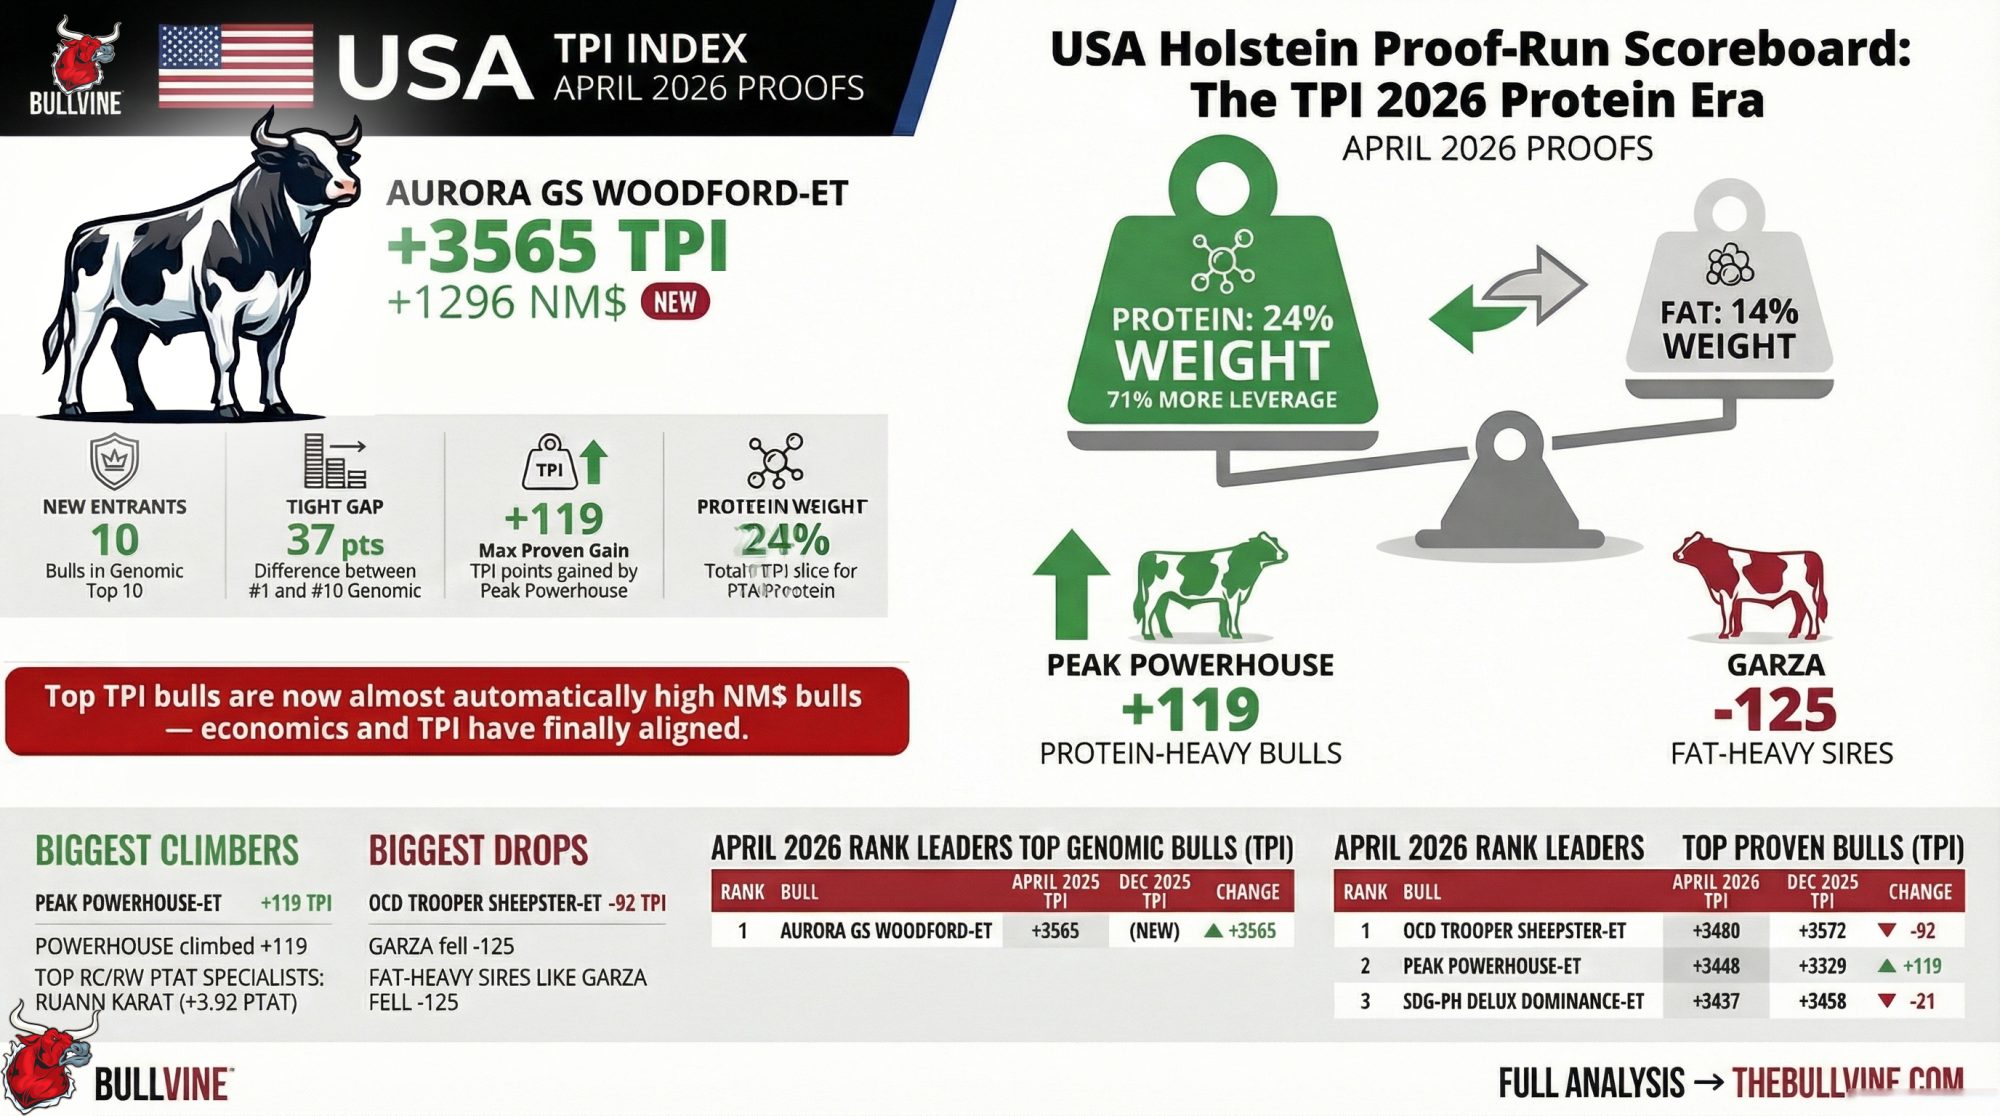
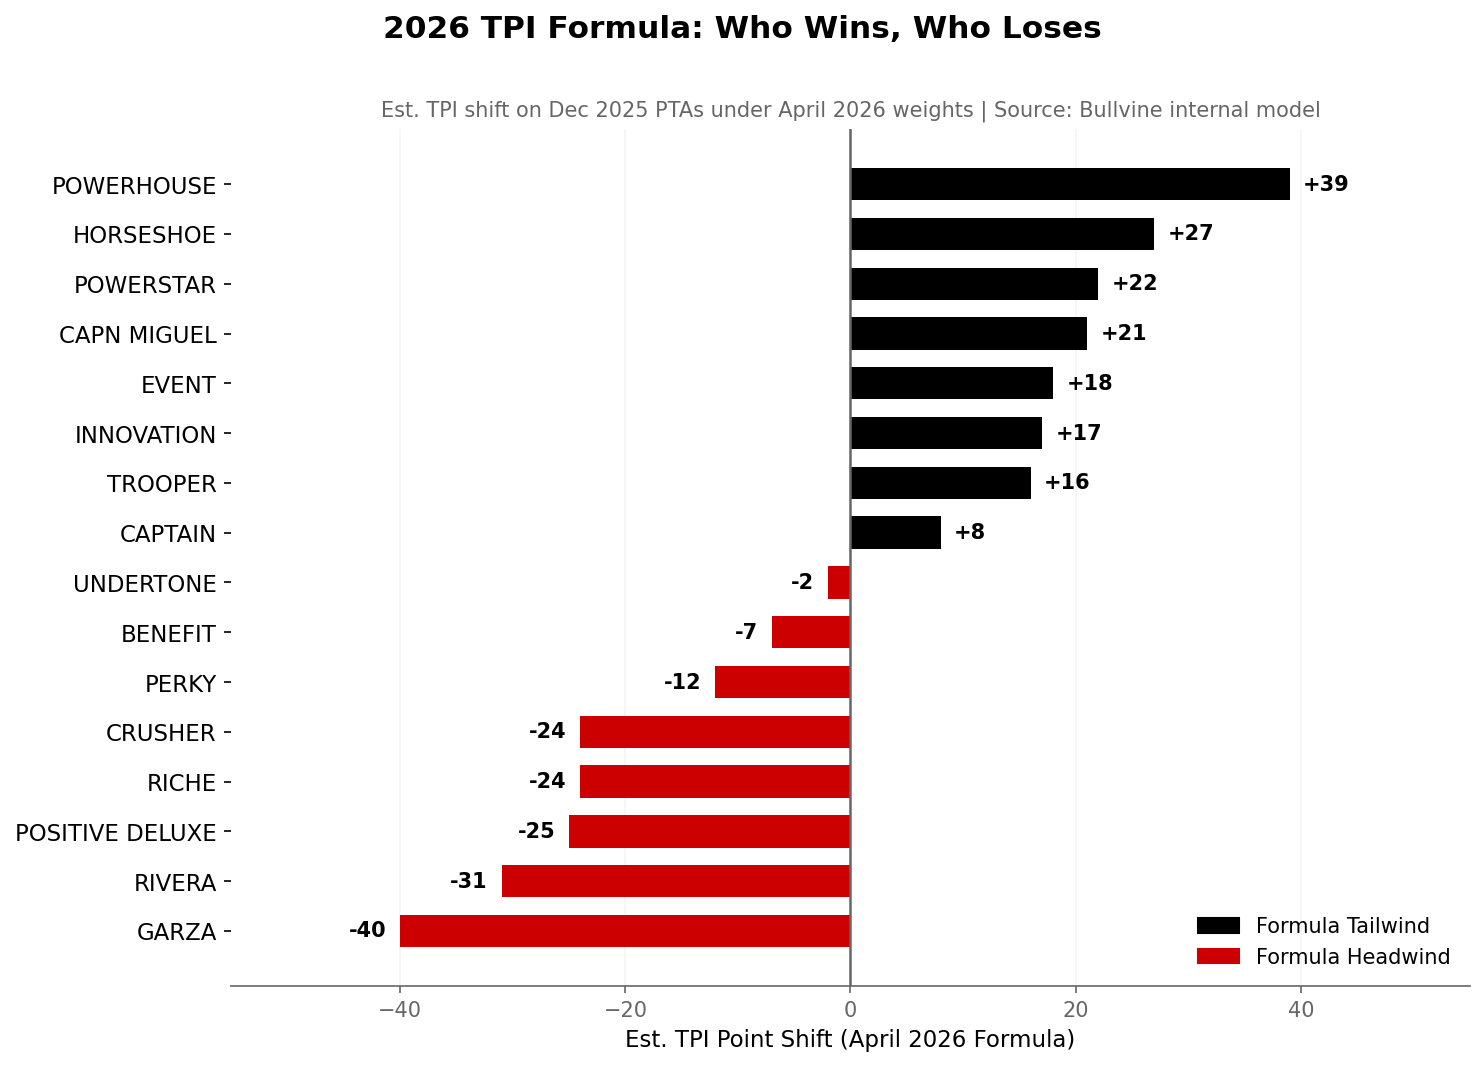
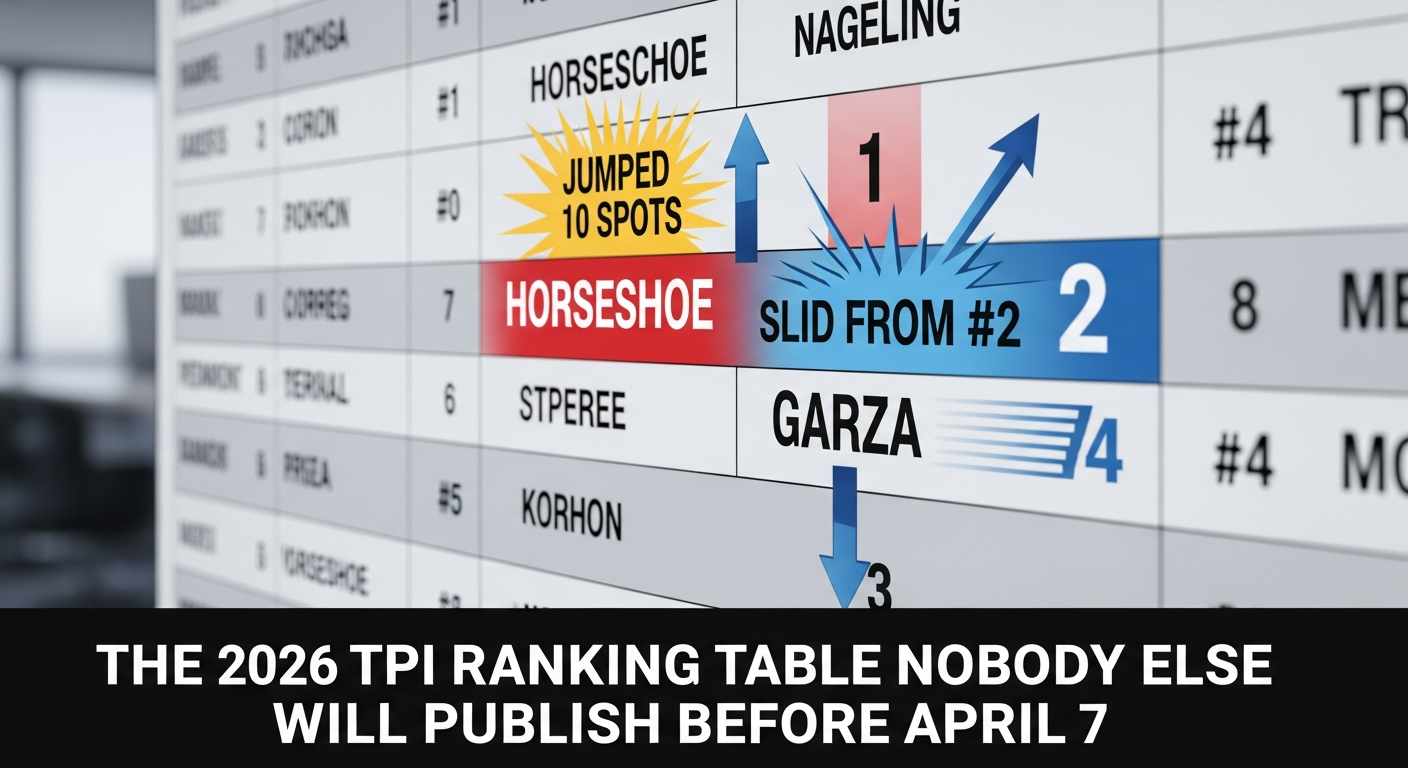
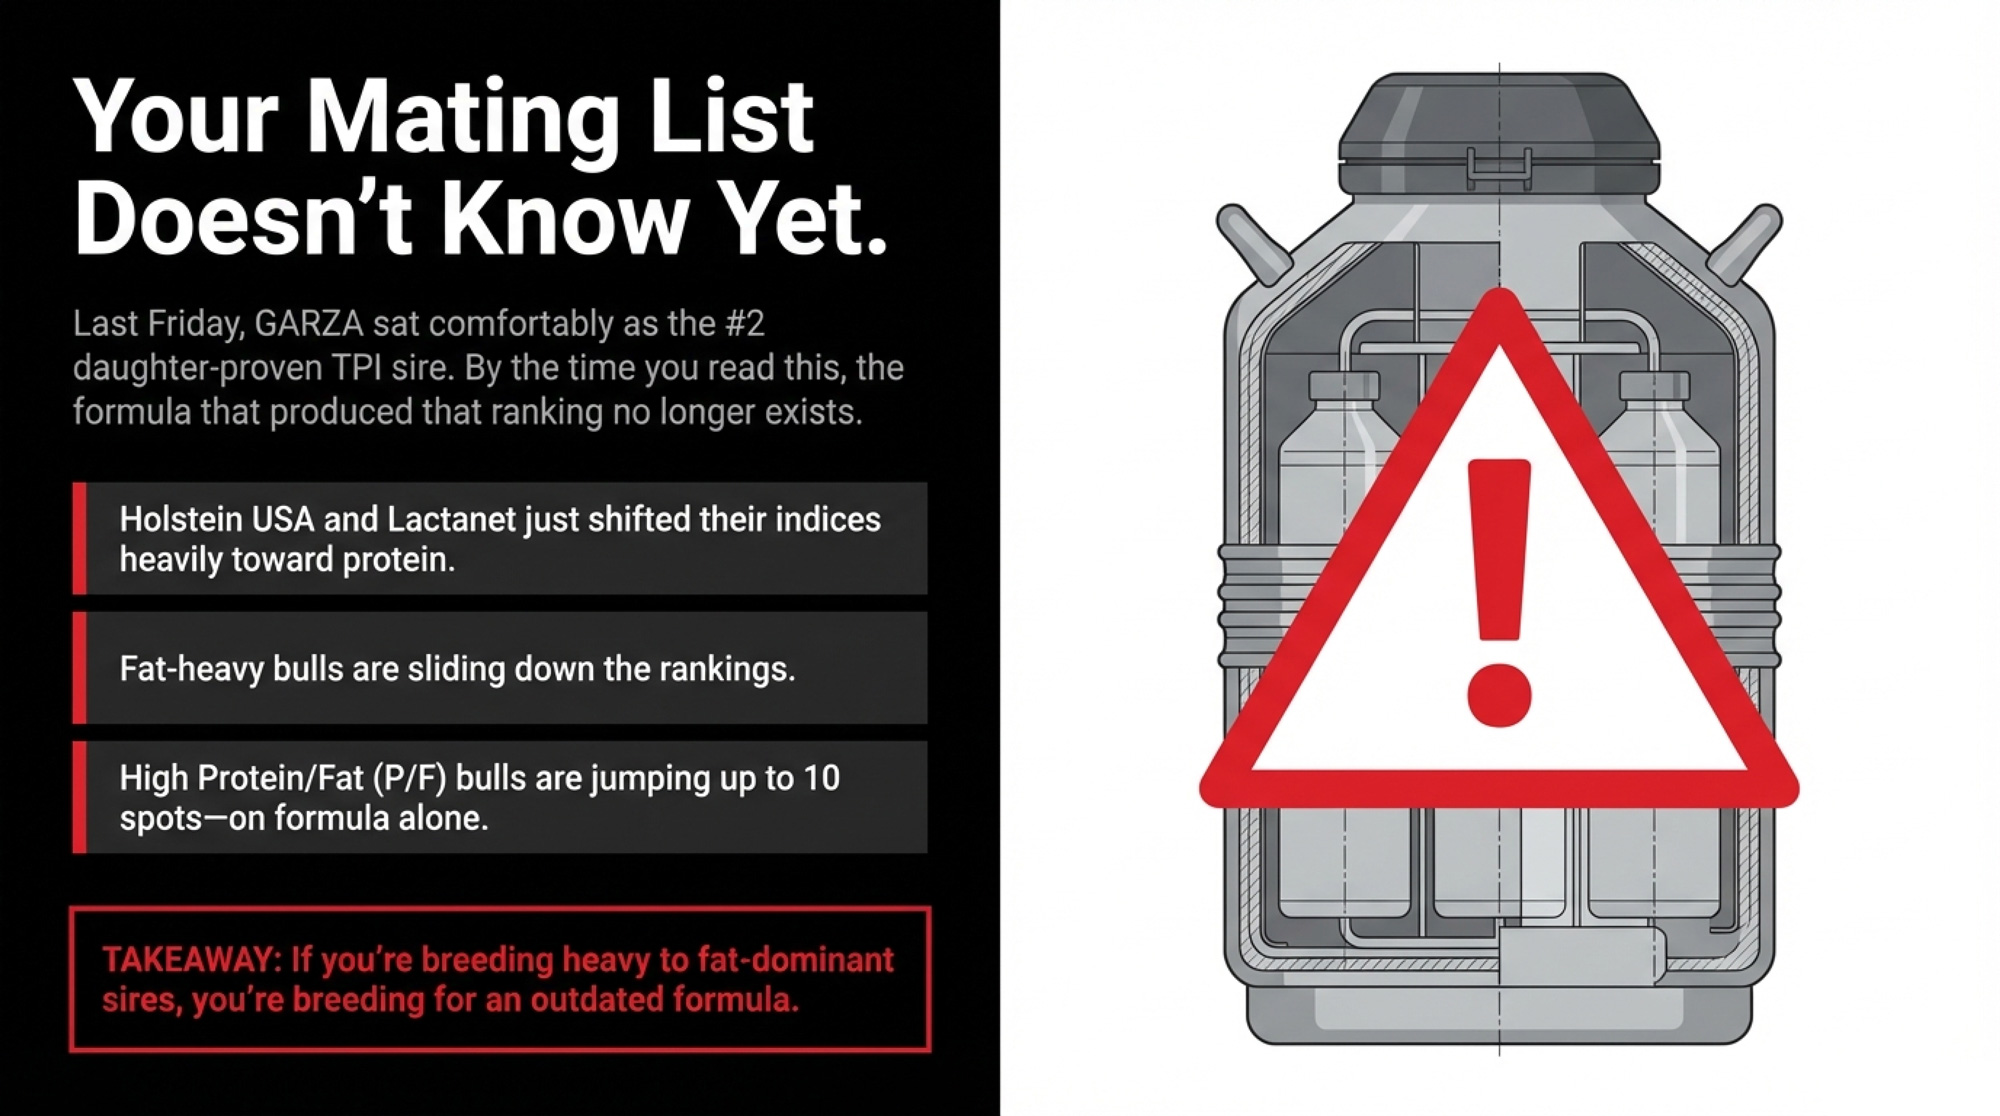
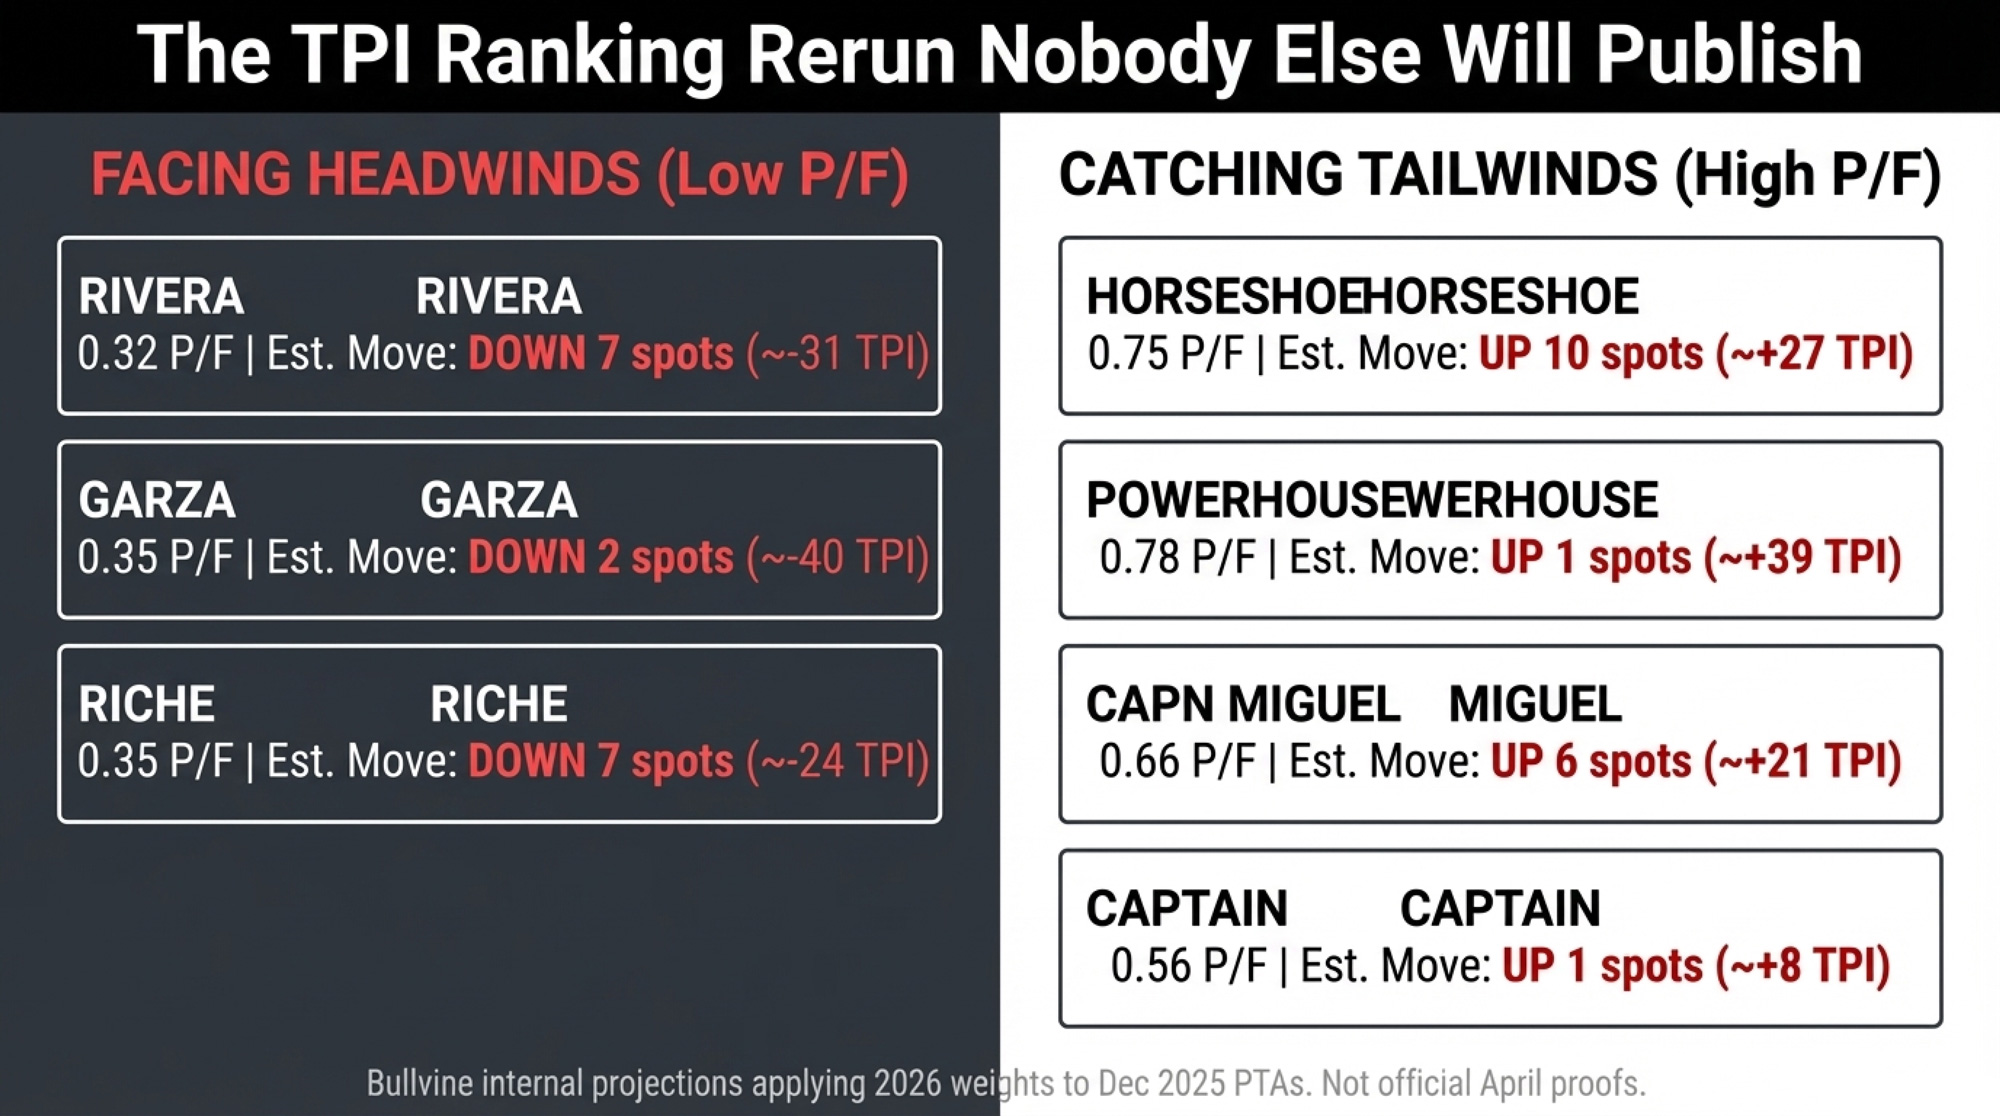
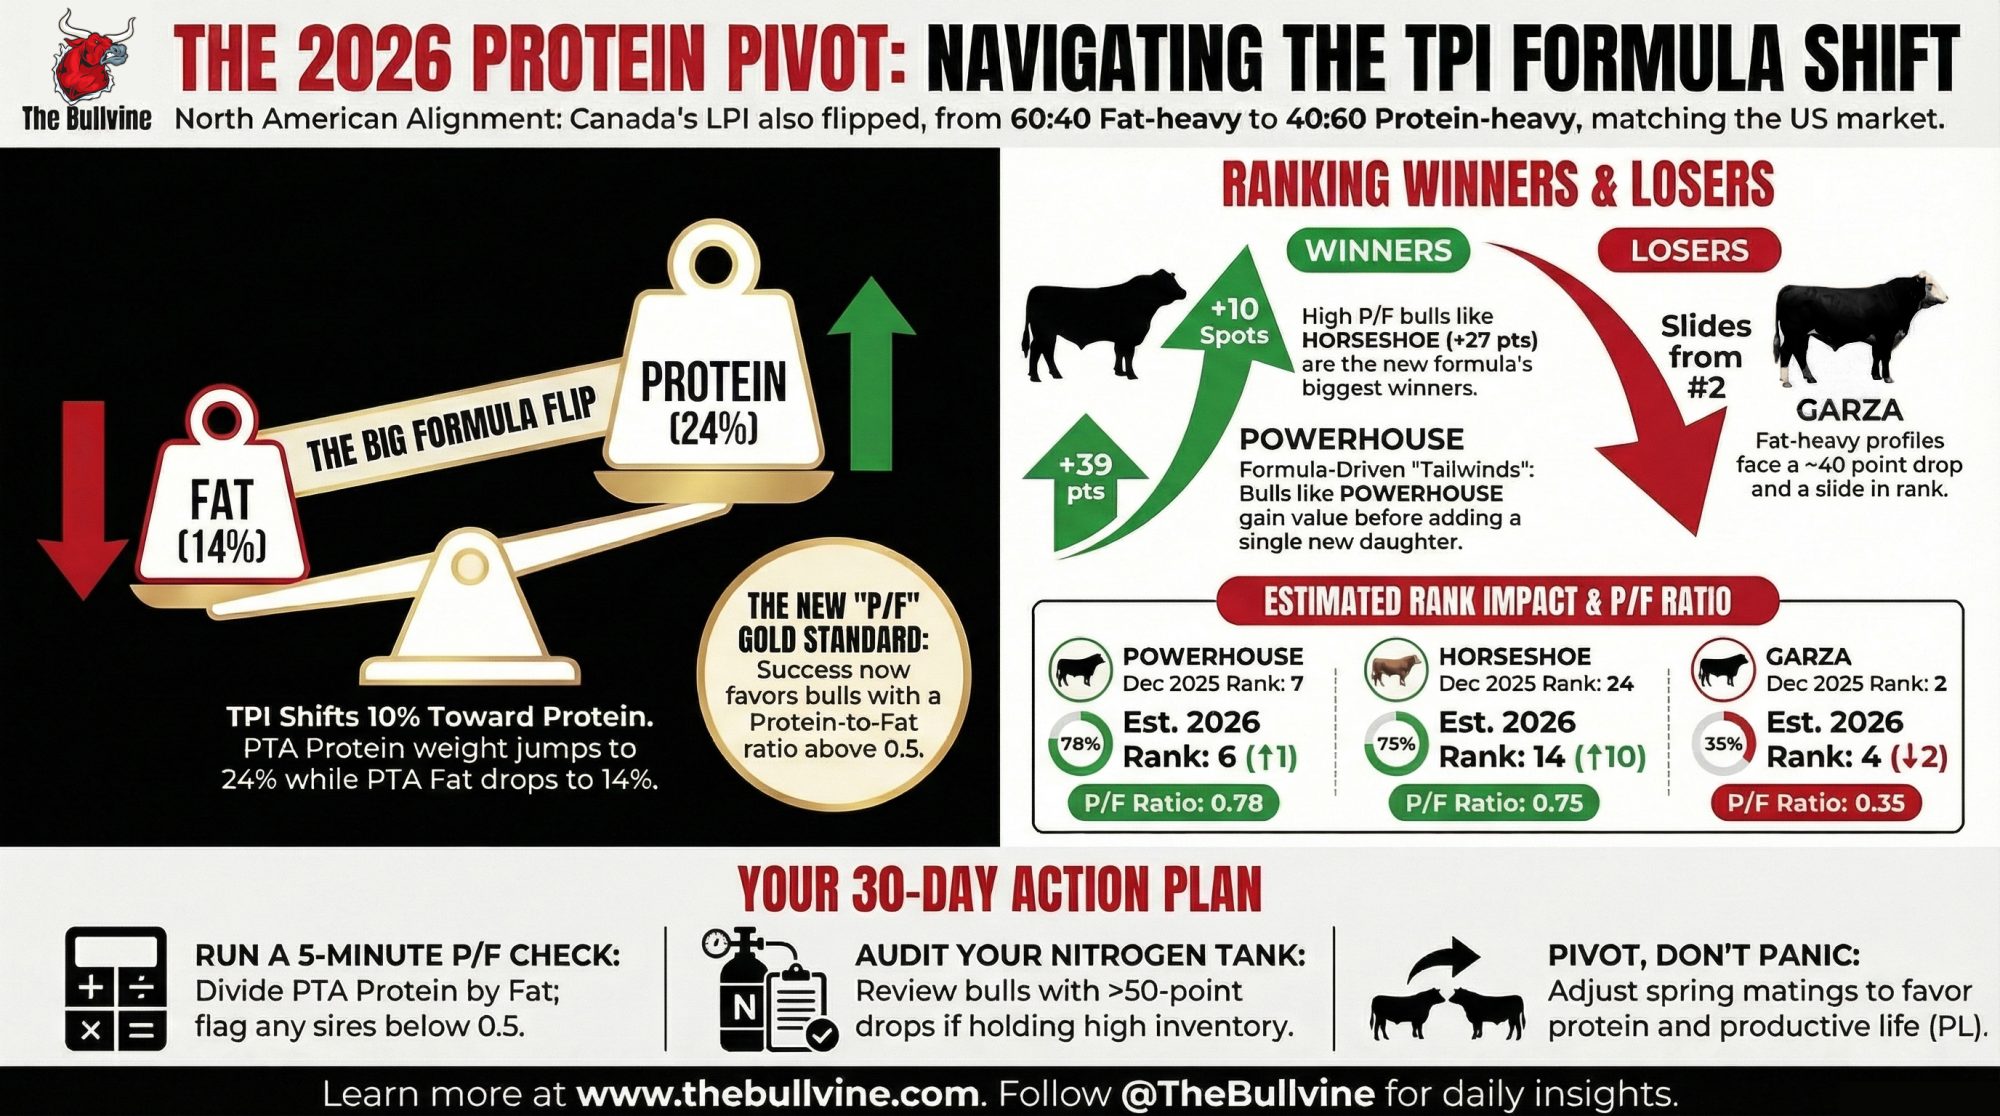
Holstein Association USA detonated a TPI formula change that dropped Garza 125 points, Captain 72, and Sheepster 92 — without a single new daughter. STgen’s elite proven army still owns 36 of the top 100 proven TPI sires even after the formula loss — but the genomic young bull lists tell a different story. Select Sires now owns 59 of the top 200 genomic young bulls (29.5%) — the broadest genomic depth of any single stud. Semex took 40 sires (20%) of the top 200, with 9 of the top 20 spots. United Sires — the breeder-owned independent that launched in 2024 — has grabbed 30 sires (15%) of the top 200 out of nowhere. The genetic galaxy reshuffled overnight.
Meanwhile, the DOJ pulled the Select Sires + STgenetics merger off the shelf and is now “nearing a decision” on whether the largest cooperative distributor in North America gets to merge with the company that owns global sexed-semen patents. And Zoetis — a company that doesn’t sell a single straw of semen — wrote a 0 million check for the lab infrastructure that processes everyone else’s DNA. ABS, meanwhile, completed its full takeover of De Novo Genetics. Three consolidation moves. All upstream of the farmer.
The Bullvine’s position on consolidation hasn’t changed: it’s structural, it’s accelerating, and pretending it isn’t doesn’t help anyone. Whether the DOJ, the FTC, or anyone in Washington is paying attention is another question. The April 2026 sire share analysis isn’t a cleanup of 2025. It’s a structural reset.
Last April we called the run The Force Awakens — an emerging order taking shape, polled and gNM$ rebellions challenging the dominant studs. Twelve months later, the Empire is striking back: STgen holding its proven army through a hostile formula change, Select Sires lining up the largest cooperative consolidation in dairy genetics history, and Zoetis executing a vertical lock on the lab pipes that read everyone’s DNA. The rebels who took the genomic top 20 — Semex’s Progenesis line, a brand-new breeder partnership called United Sires — won a battle. The Empire is positioning to win the war.
Methodology: Same Battlefield, New Rules of Engagement
Following the precedent set in our April 2025 analysis, we again use top 200 sires for genomic TPI, top 100 for proven TPI, and the official Holstein Association USA April 2026 evaluation lists drawn from the official CDCB run published April 7, 2026 (Holstein USA; CDCB).
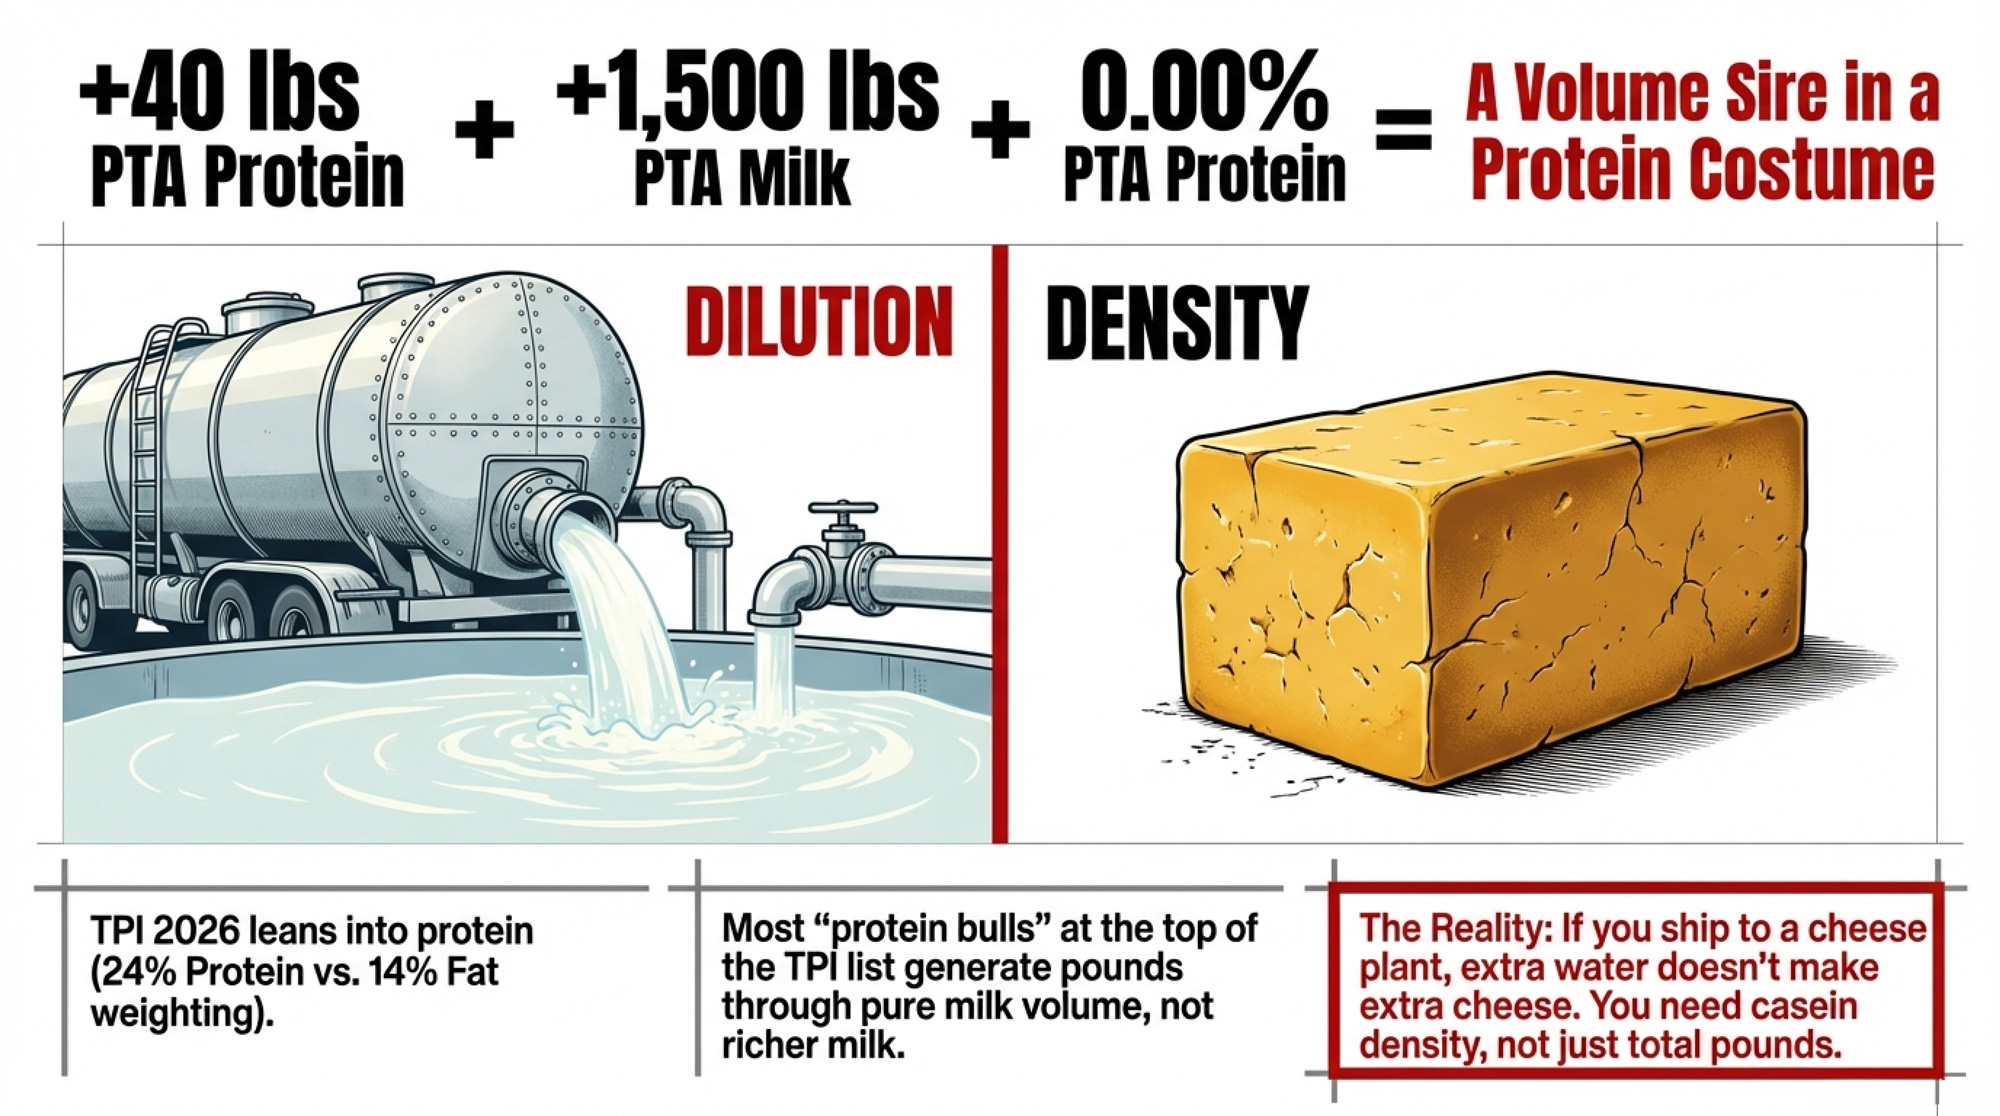
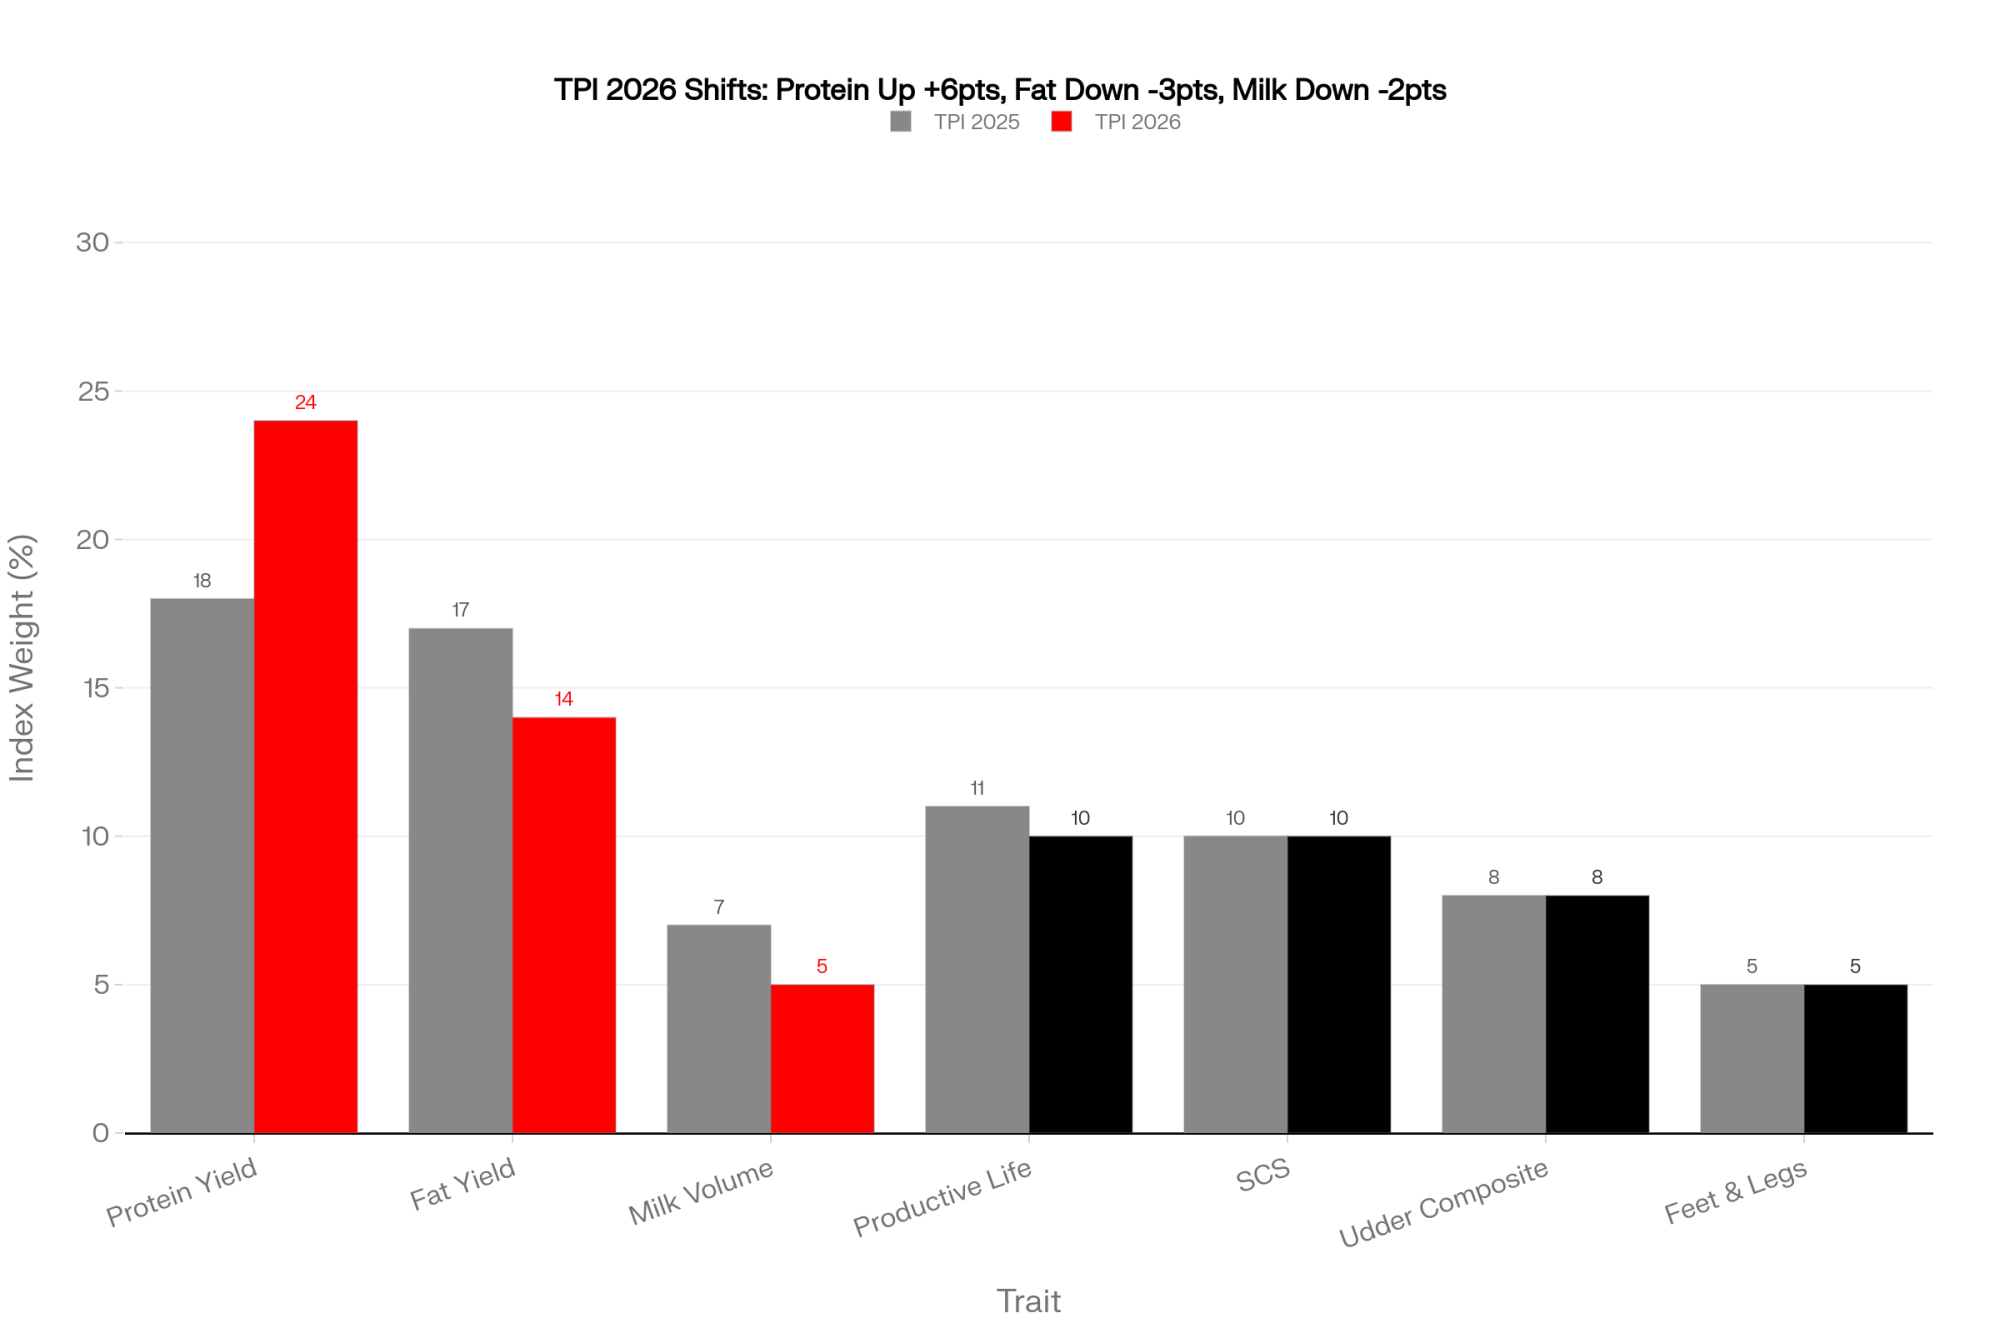
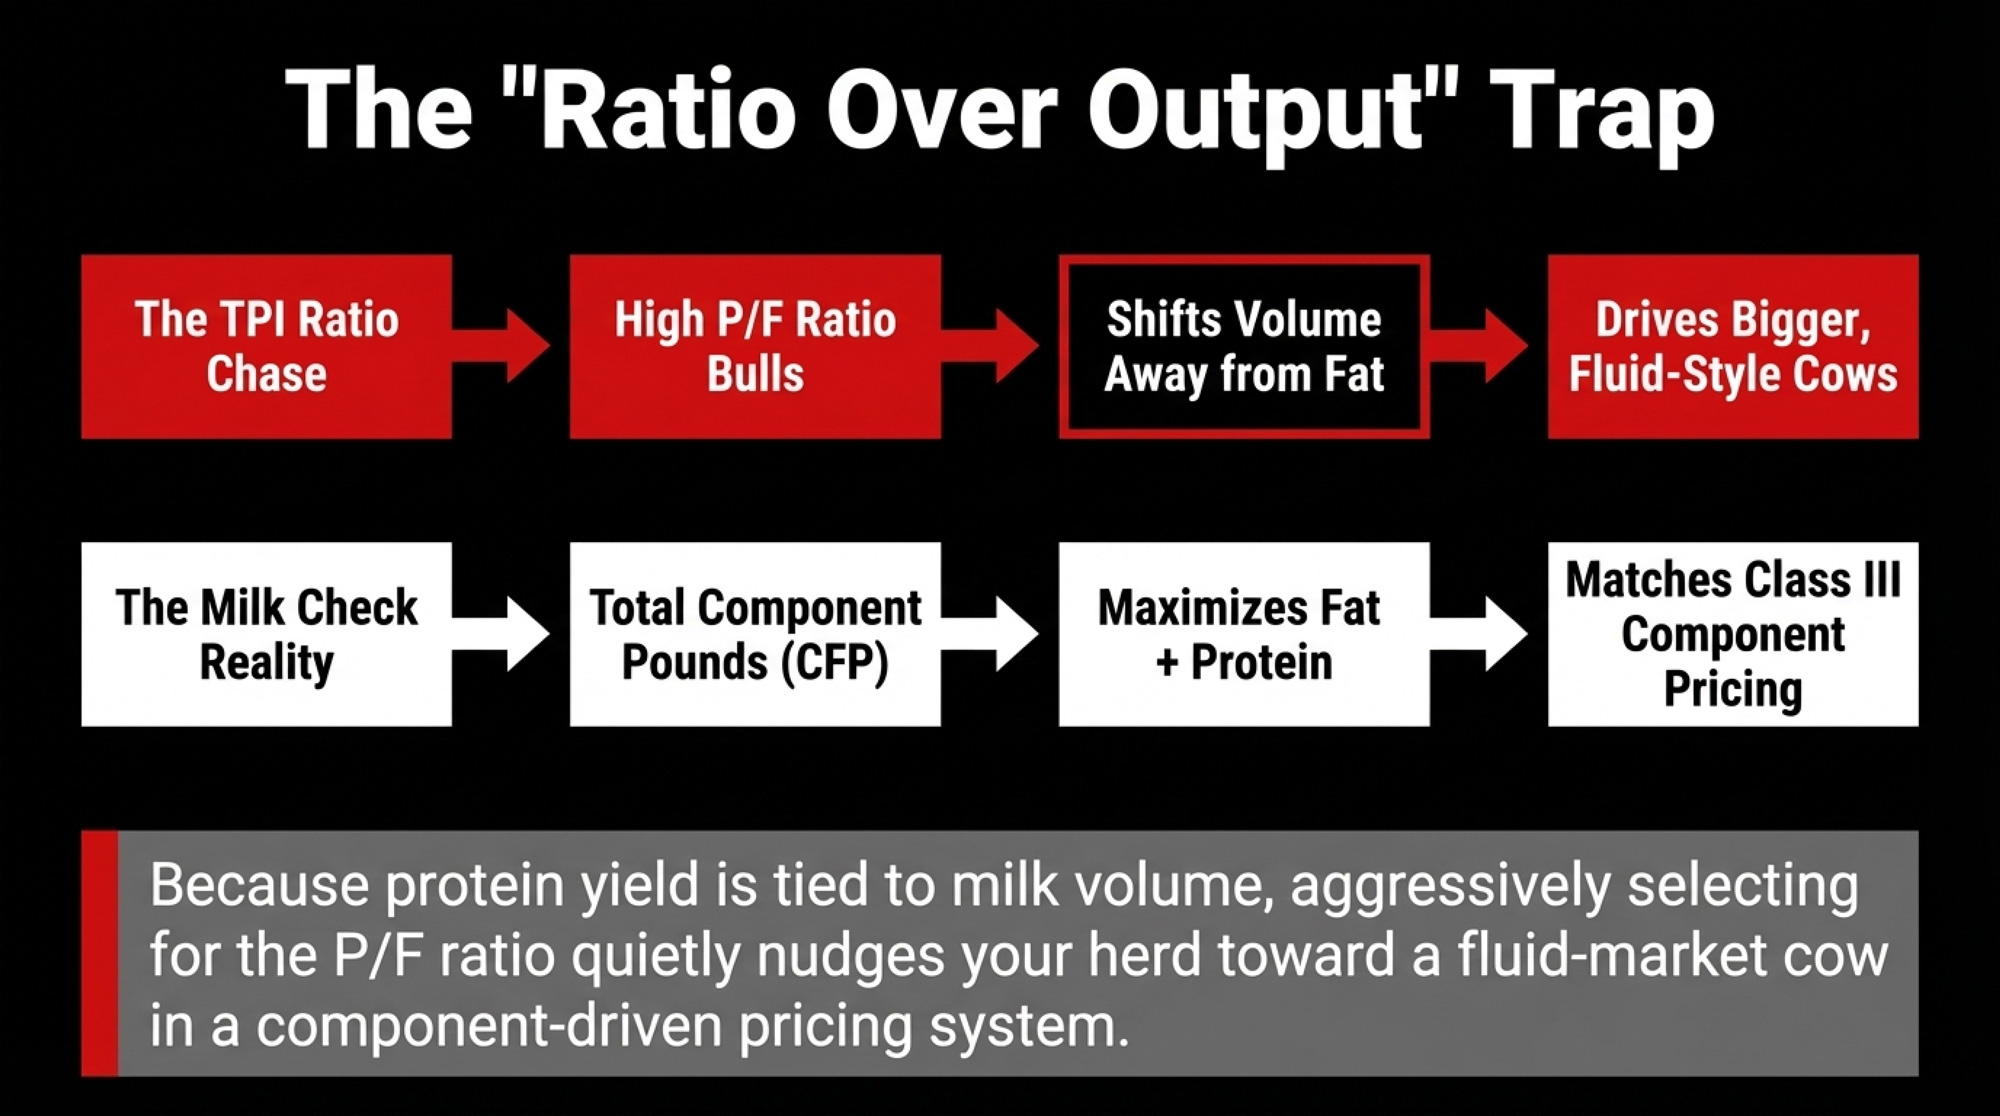
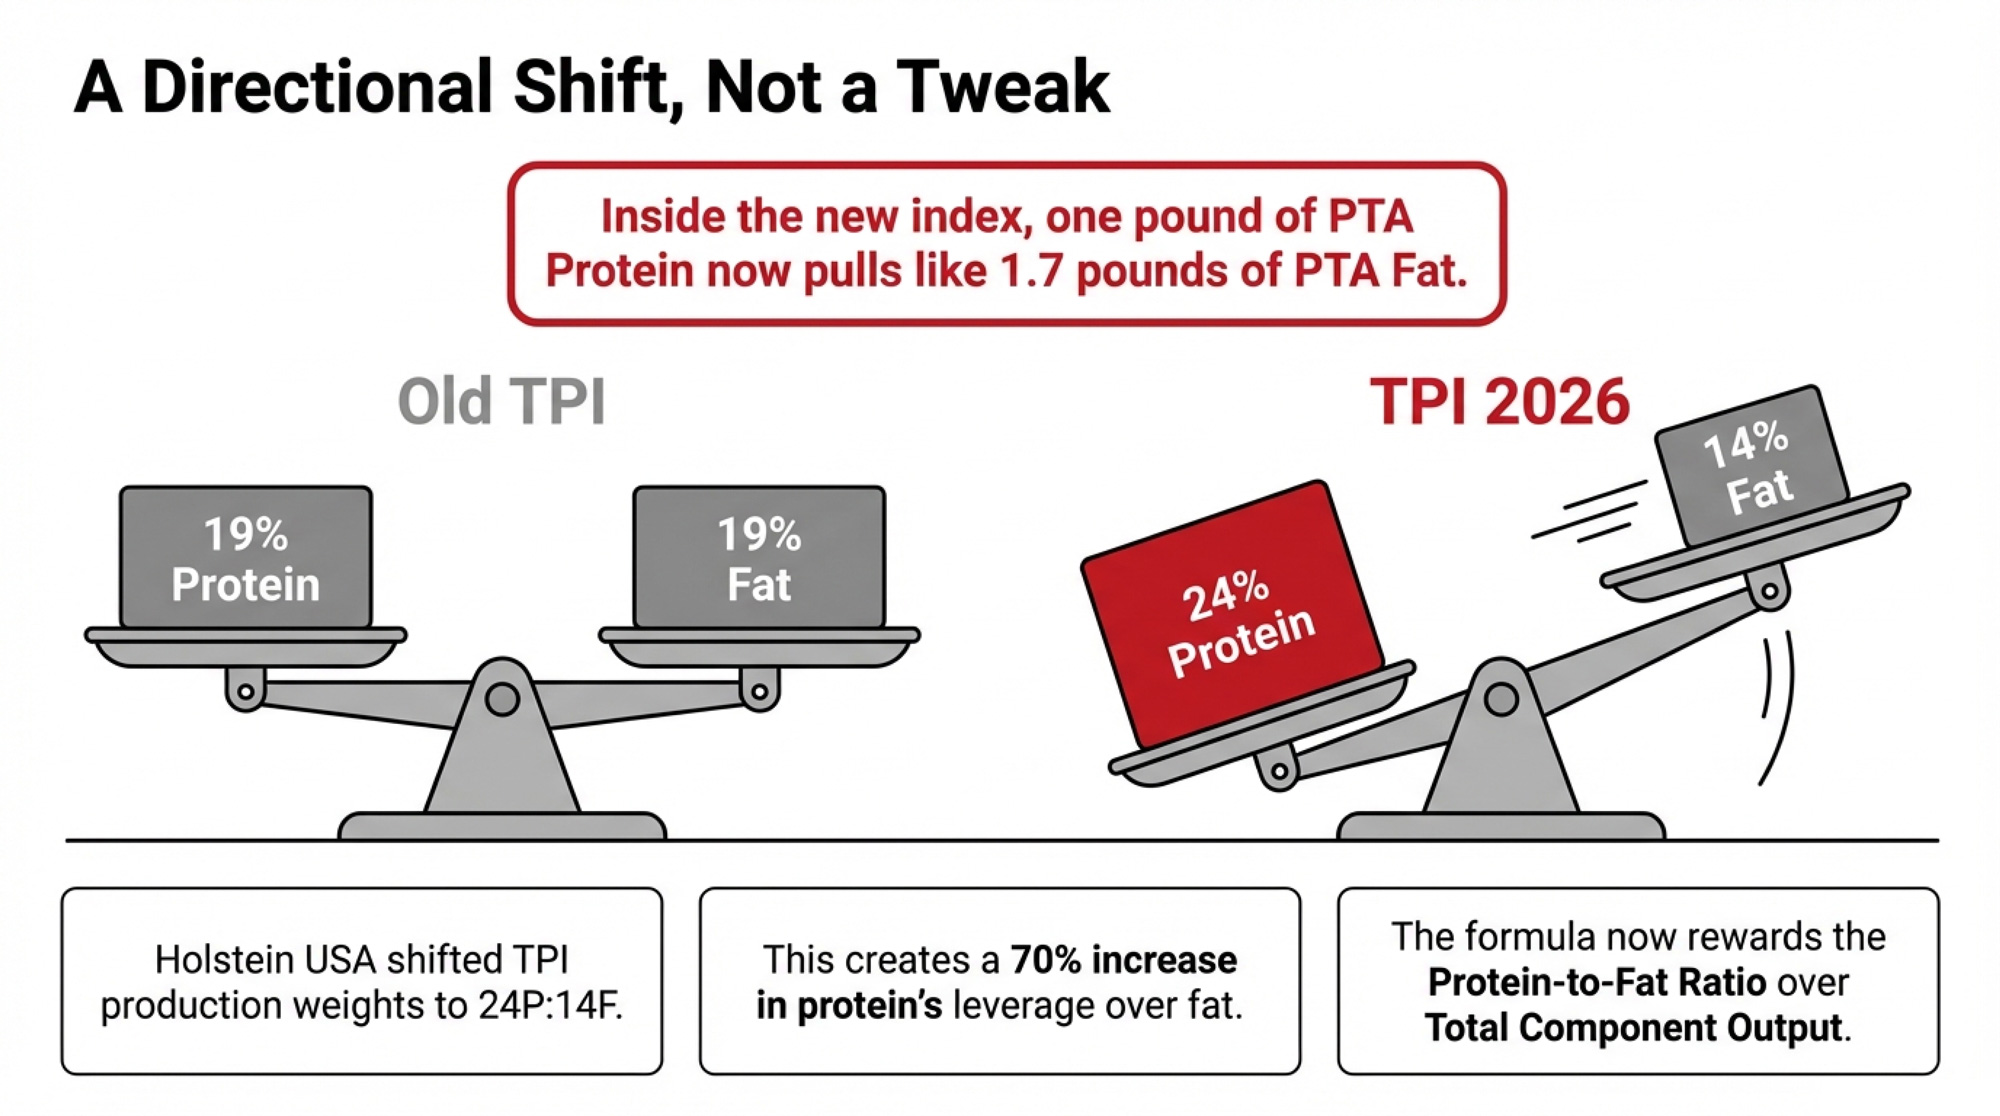
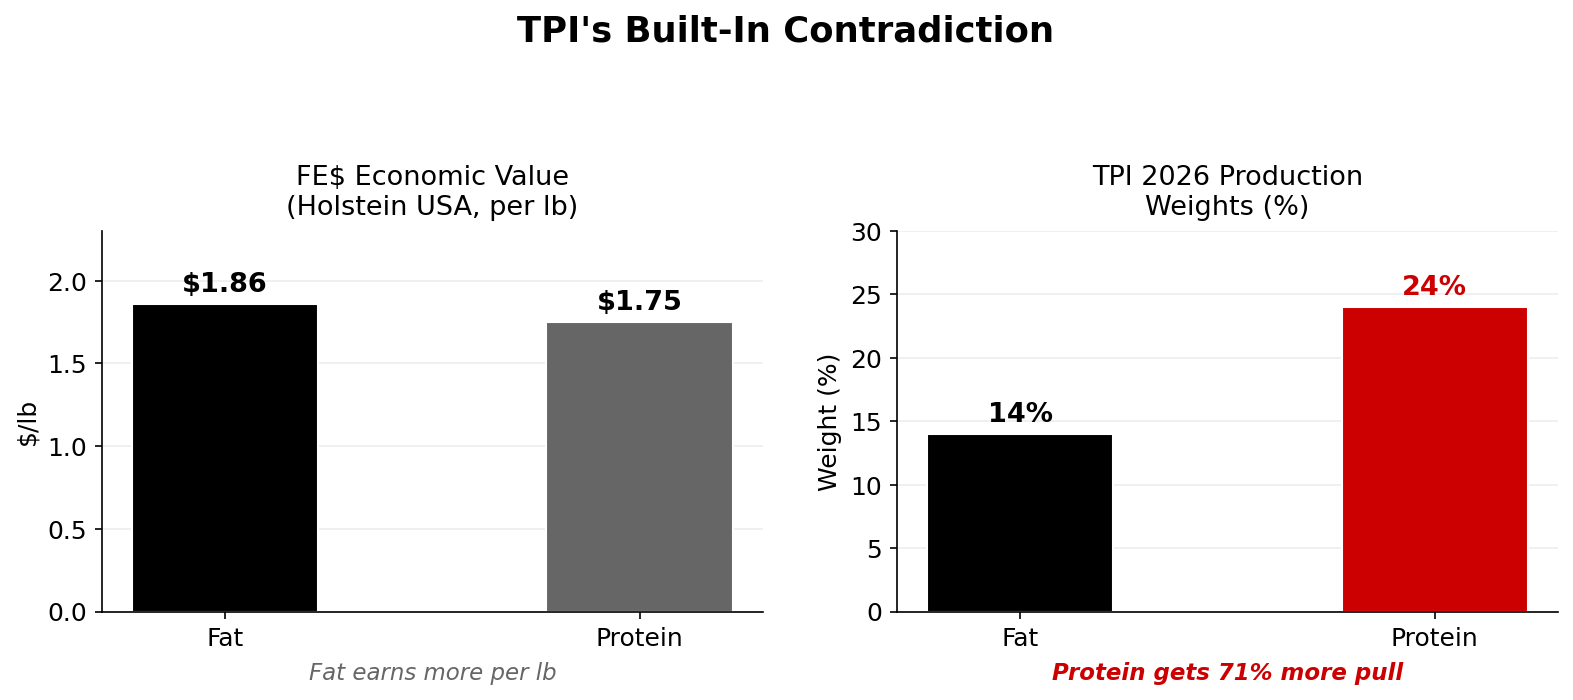
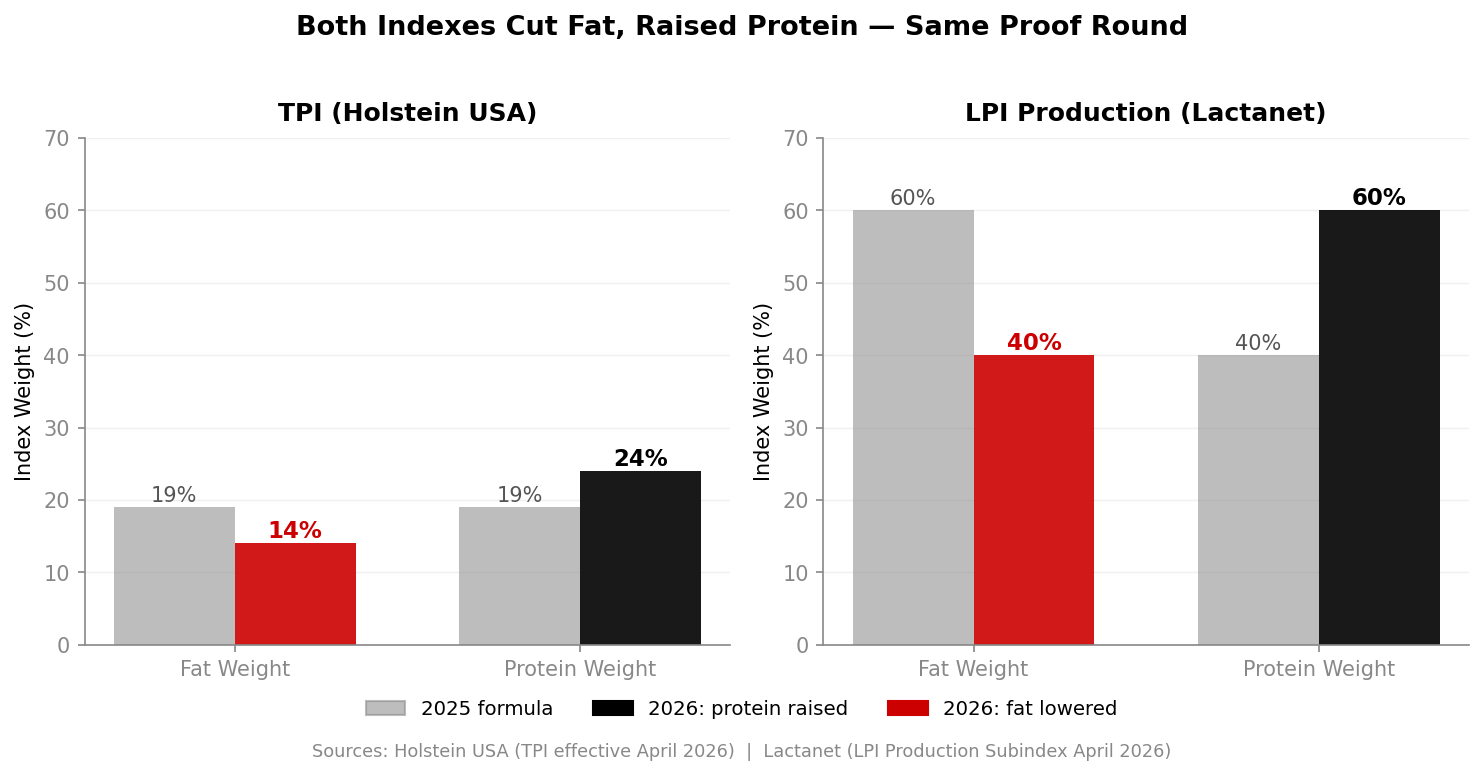
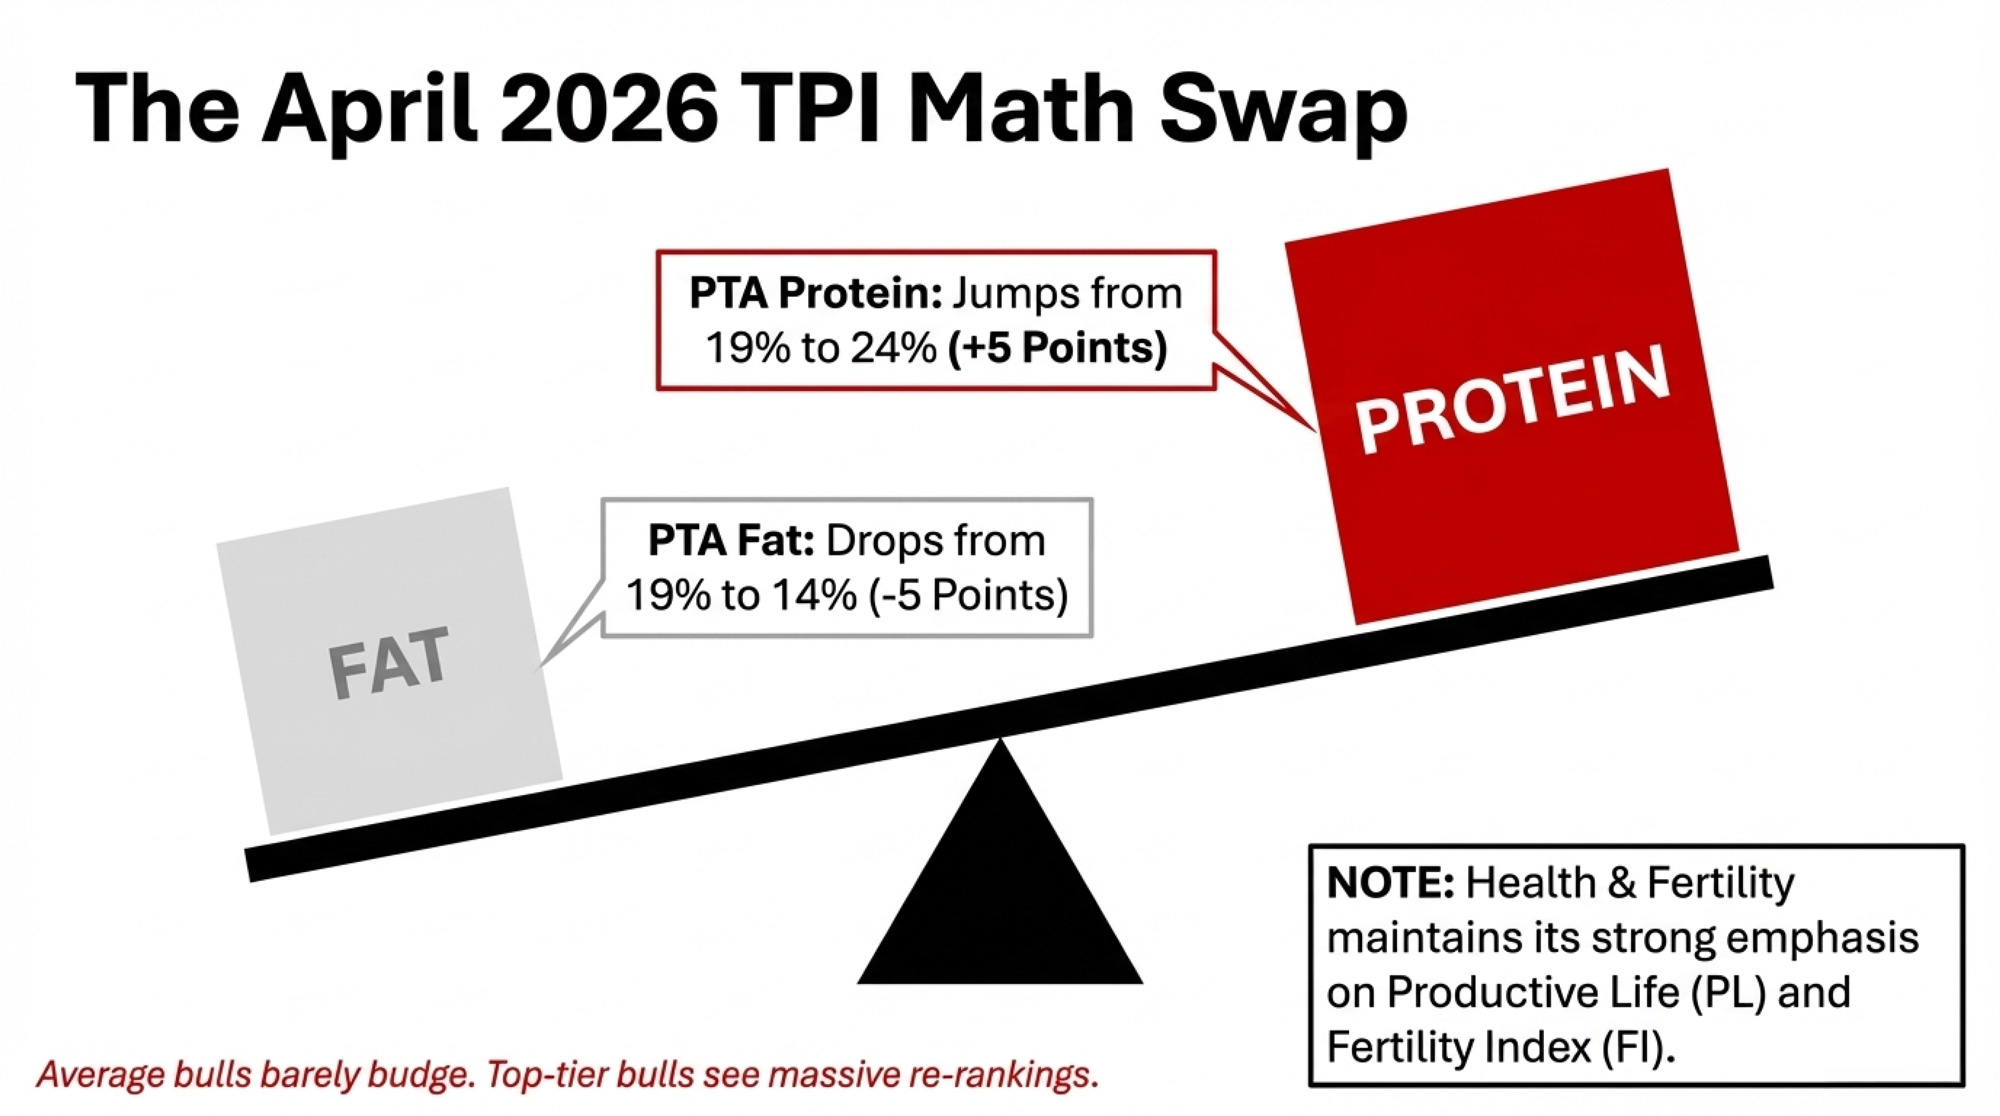
Holstein Association USA implemented the TPI 2026 formula change in this run — production weights shifted from 19% PTA Protein / 19% PTA Fat to 24% PTA Protein / 14% PTA Fat. That’s a 5-point bump for protein and a 5-point cut for fat. Daughter data didn’t change. The math behind the rankings did. This is the largest single TPI formula adjustment in recent memory, and it explains why bulls who were untouchable in December 2025 dropped 70 to 125 TPI points in April without milking a single new daughter (The Bullvine).
Methodology: All April 2026 stud-share figures in this analysis are independent counts of the official Holstein Association USA April 2026 lists, performed using the official NAAB marketing codes as the source of truth for stud assignment. Genomic TPI counts use the Holstein USA Top 200 TPI® Genomic Young Bulls (April 2026, 85% genomic reliability minimum). Proven TPI counts use the Holstein USA Top 100 TPI Bulls (April 2026, ACTIVE or LIMITED semen status, 80% traditional reliability minimum).
Key NAAB code → marketing organization assignments per the official NAAB table: 1 = GENEX Cooperative; 7/9/14/250/507/509 = Select Sires; 11 = Alta Genetics USA; 29/94 = ABS Global; 97 = CRV Holding; 200/777 = Semex Alliance; 288 = ASCOL; 523/551/646 = STgenetics (Inguran); 596/796 = United Sires, LLC (independent breeder partnership founded 2024); 599/799 = Blondin Sires; 719 = RuAnn Genetics. URUS-owned brands (GENEX, Alta, Jetstream, Trans Ova) are reported as separate codes per NAAB and consolidated where editorially useful. April 2025 baselines were independent counts performed at original publication using a different methodology that lumped some breeder codes together; year-over-year comparisons in this article are made cautiously.
Read that table. Five of the top 10 genomic young bulls in the world are 200HO — Semex Alliance. Two are Select Sires (S-S-I lines). Two are Alta/URUS (Peak AltaGoldenGate, Pen-Col AltaGlimpse). One is United Sires (OCD Whoops Sabotage, 796HO). Zero are STgen. The Progenesis line — Timetraveler, Superfreak, Tapas — locked down the top of the list. The 49-point spread between #1 (3563) and #10 (3514) is statistical noise at 65–80% genomic reliability. But the stud ownership pattern? That’s where the story lives.
Genomic TPI Stud Share — Top 200 Holstein Genomic Young Bulls (Verified Counts)
Stud (NAAB code)
Apr 2026 count
% of top 200
Select Sires (7, 14, 250)
59
29.5%
Semex Alliance (200, 777)
40
20.0%
United Sires (596, 796)
30
15.0%
STgen (523, 551)
27
13.5%
ABS / Genus (29, 94)
12
6.0%
Alta / URUS (11)
11
5.5%
GENEX / URUS (1)
9
4.5%
CRV (97)
8
4.0%
Independents (El Toro 508/708, A.I. Total 515, Genesis MX 706)
URUS umbrella — GENEX (1HO) + Alta (11HO) combined = 20 sires (10.0%), the third-largest cooperative group when consolidated.
Two notes on this table.
First, the April 2025 baseline used a different and less rigorous methodology — it lumped “Sexing Tech / Genosource” with breeder-affiliated codes that have since been revealed by official NAAB lookup to be a different organization entirely. With the corrected NAAB-code accounting, the year-over-year comparison should be read as: STgen alone has 13.5% of the genomic top 200 in April 2026 (down from the 39.5% “STgen / Genosource” lumped figure published in 2025). United Sires LLC — a separately-owned independent breeder partnership founded in 2024 with no ownership relationship to STgen — holds a separate 15.0%. The two are independent organizations with independent ownership and independent NAAB codes.
Second, Semex’s 20% matches their own self-reported claim closely. Their Facebook post on April 10 (Semex) reported “45% of the Top 20, 34% of the Top 50, 26% of the Top 100, 20% of the Top 200.” Our verified counts: 45% of top 20, 34% of top 50, 27% of top 100, 20% of top 200. They were on the money.
If you’re keeping score: the 24P/14F formula change penalized bulls heavy on fat — exactly the profile that built Captain, Garza, and Dominance into STgen’s elite proven army. STgen’s deep gNM$ pipeline still benefits from protein-heavy production traits. But on the genomic young bull TPI list — the leading indicator of where the next proven army comes from — Semex’s Progenesis and Beyond pipelines and Select Sires’ S-S-I and Stagger lines, protein-tilted by design, ate the formula change.
This is the imperial-consolidation reversal nobody scripted. STgen didn’t lose because their bulls got worse. They lost because Holstein Association USA changed what “best” means, and Select Sires, Semex, and a brand-new breeder cooperative were already breeding for the new definition.
Proven TPI: STgen’s Empire Holds Despite the Formula
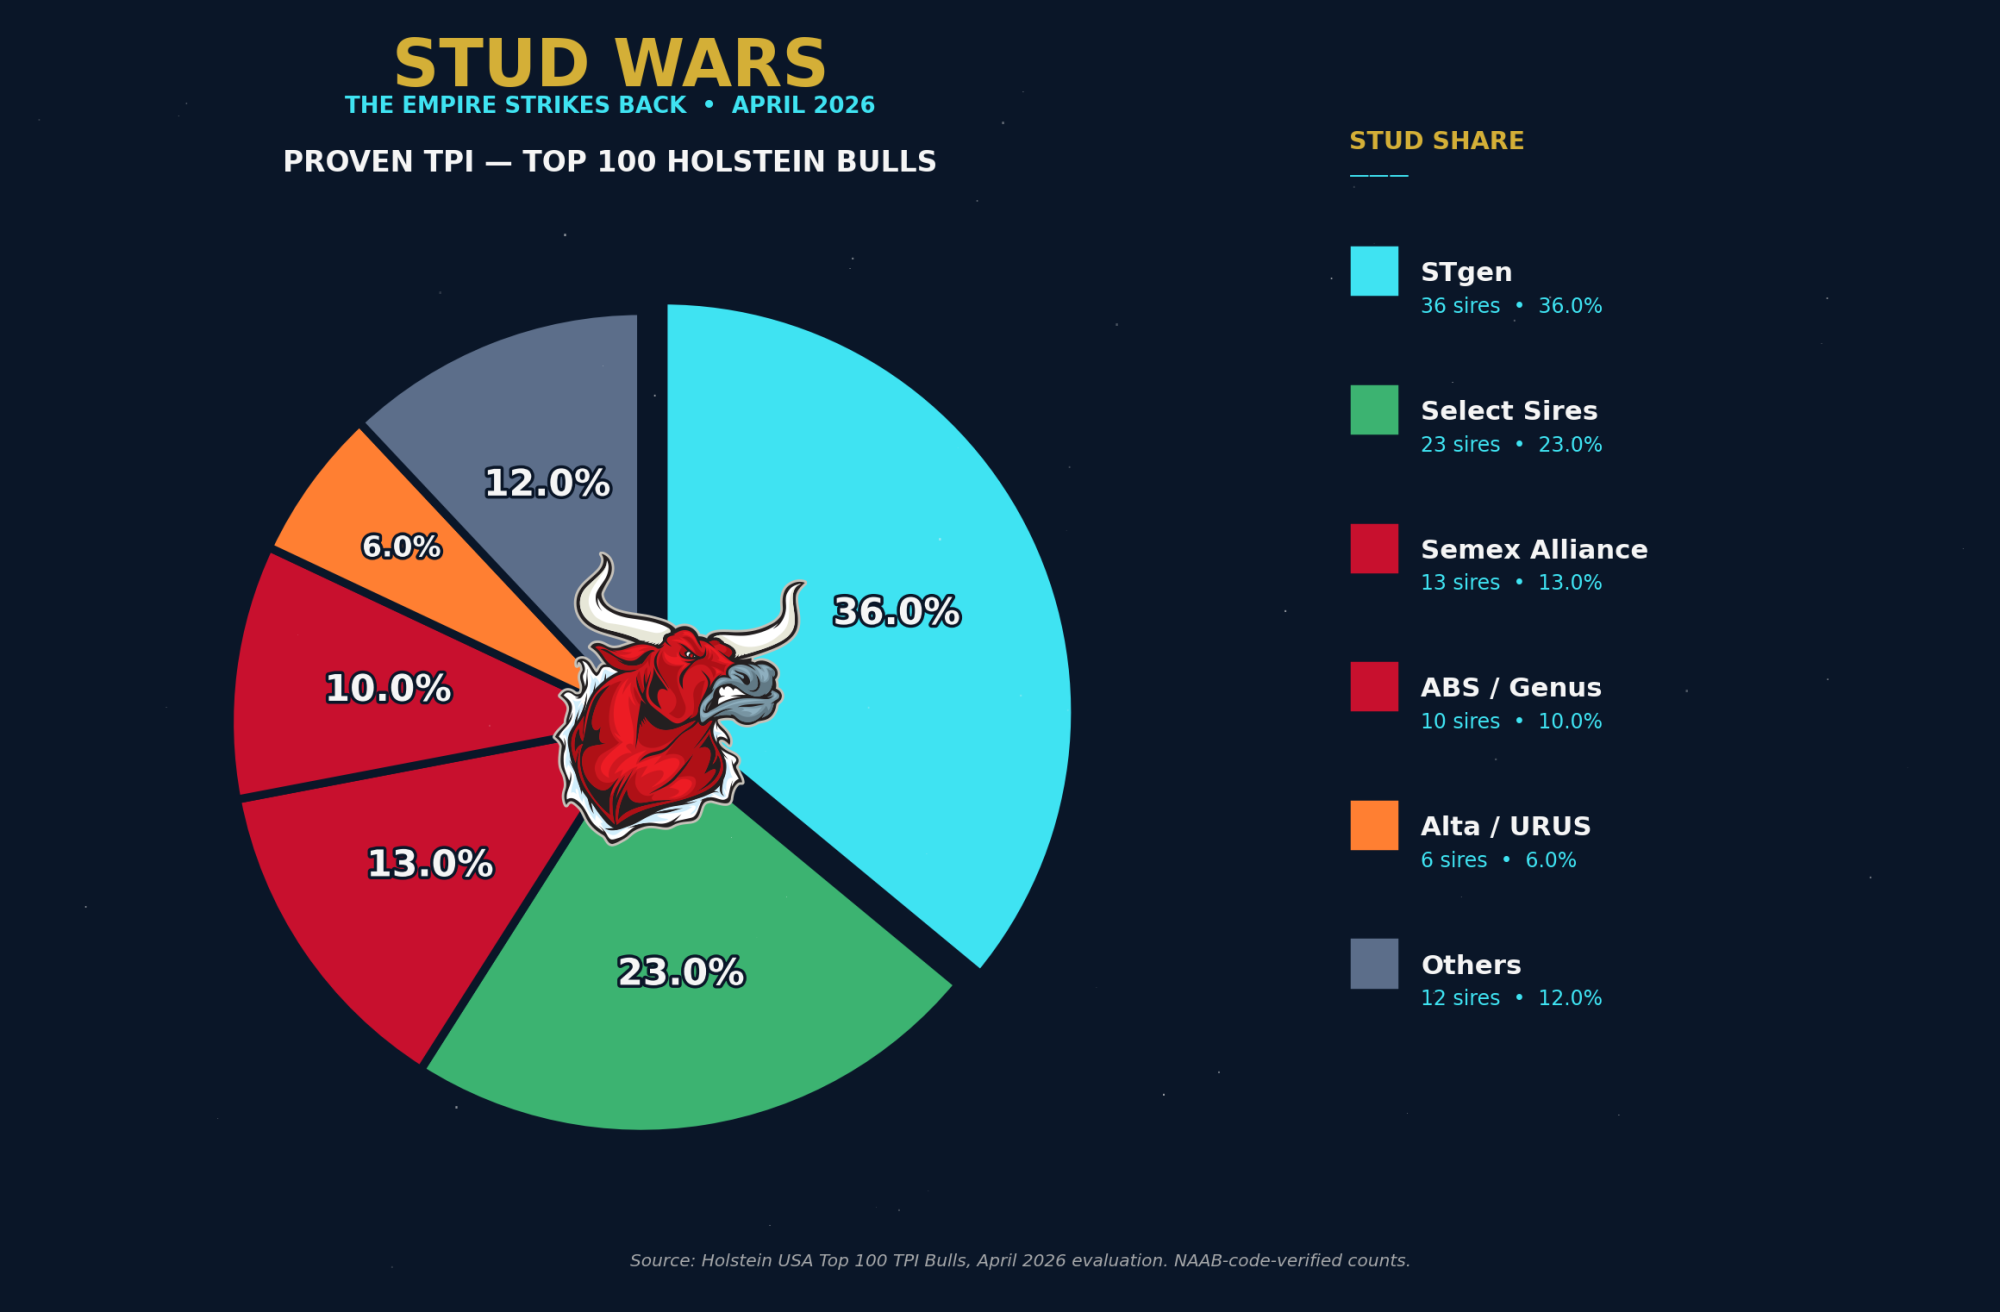
First, STgen still owns three of the top 8 proven bulls — Dominance, Captain, Garza. Sheepster lost 92 TPI points without losing a daughter. He still sits at rank #1 with 2,359 daughters and 99% reliability. Garza lost 125 points. Captain lost 72. STgen’s elite proven army took the worst formula hit of any stud’s lineup, and they’re still here.
Second, the protein-formula winners are clear. Peak Powerhouse jumped +119 TPI in a single run to become the #2 proven bull in the world (Bullvine). Powerhouse carries the 1HO primary code = GENEX Cooperative (a URUS subsidiary), with secondary URUS codes 511HO and 122HO; the bull is the same Peak-branded URUS production line as the Alta-coded bulls. Peak AltaSamson at #10 carries 11HO = Alta Genetics, also URUS. Combined, URUS owns positions 2 and 10 of the proven top 10. Cookiecutter Horseshoe at #8 is registered under the 208HO Korean code as primary, but the bull is commercially distributed in North America via Semex (secondary codes 200HO and 777HO). Peak Powerstar’s debut at #9 gives Semex a new proven top-10 entry.
Third, the depth still belongs to STgen. 36 of the top 100 proven TPI bulls carry 551HO codes — STgenetics-Inguran, the largest single-stud share in any category we measured.
URUS umbrella — Alta (11HO) + GENEX (1HO) combined = 10 sires (10.0%) of the top 100, tied with ABS/Genus.
STgen’s depth on proven TPI is the most surprising finding in this entire run. Despite Garza, Captain, and Dominance each losing ground to the formula change, the broader STgen pipeline behind those flagship names — Brockington, Capn Miguel, Cap Mad Max, Captn Penza, Cap Volos, Cap Rivera, Capn Rodman, Cap Diggory, and dozens more — held position across the top 100. Select Sires gained ground on the genomic side; STgen held depth on the proven side. Both can be true simultaneously.
Running the Numbers: What the 24P/14F Formula Costs (or Saves) Your Mating Program
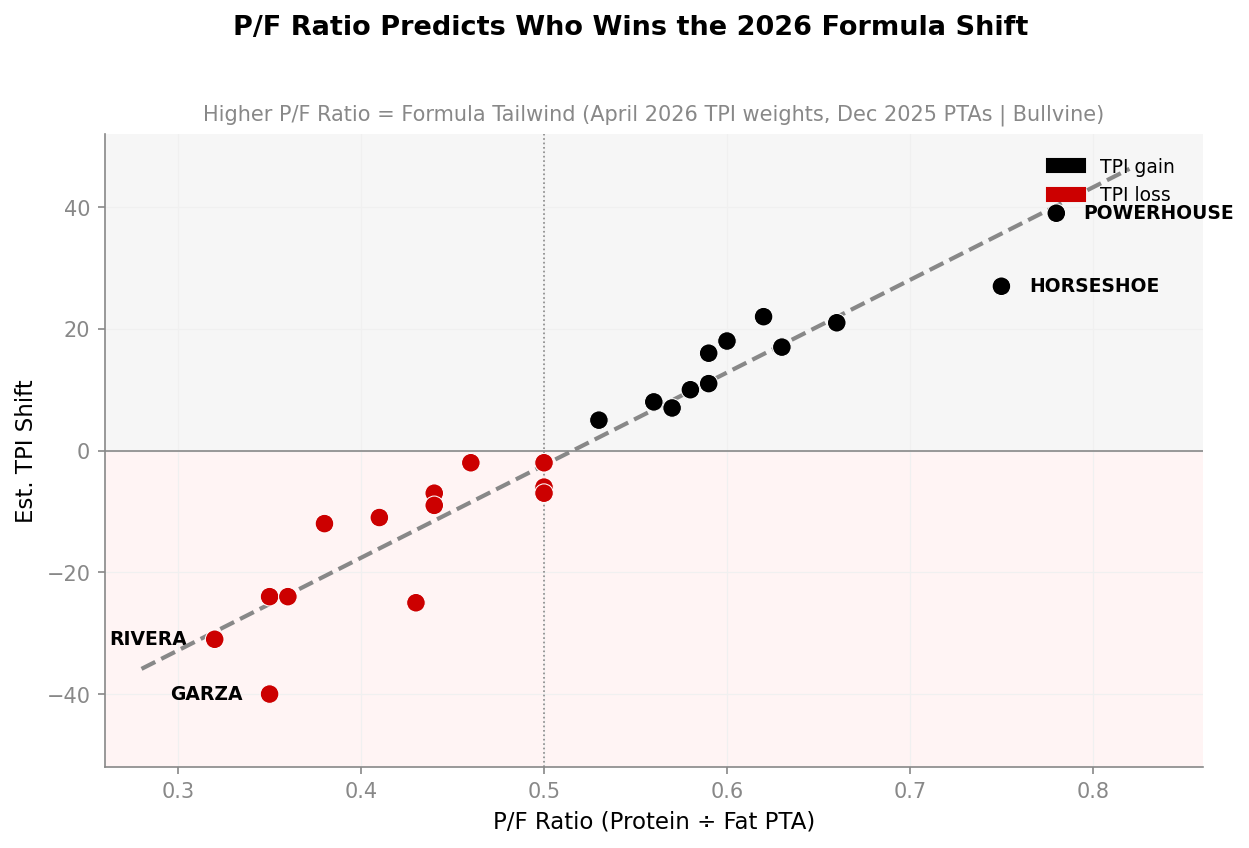
Take Garza as the worked example. SDG Cap Garza-ET sat at +3464 TPI in December 2025 and dropped to +3339 TPI in April 2026 — a −125 TPI swing with zero new daughter data. His PTA Fat (+140 lbs) and PTA Protein (+50 lbs) didn’t move. The index weighting did.
Practical impact on a 500-cow Holstein herd: if your mating program selects service sires above a +3400 TPI threshold, Garza was in in December and is out in April — same bull, same daughters, same fertility. Multiply that across STgen’s elite proven army (Captain −72, Dominance −21) plus Sheepster (−92) on the Select Sires side, and roughly 30–40% of a typical commercial farm’s previous top-tier proven sire list now sits below older threshold cutoffs.
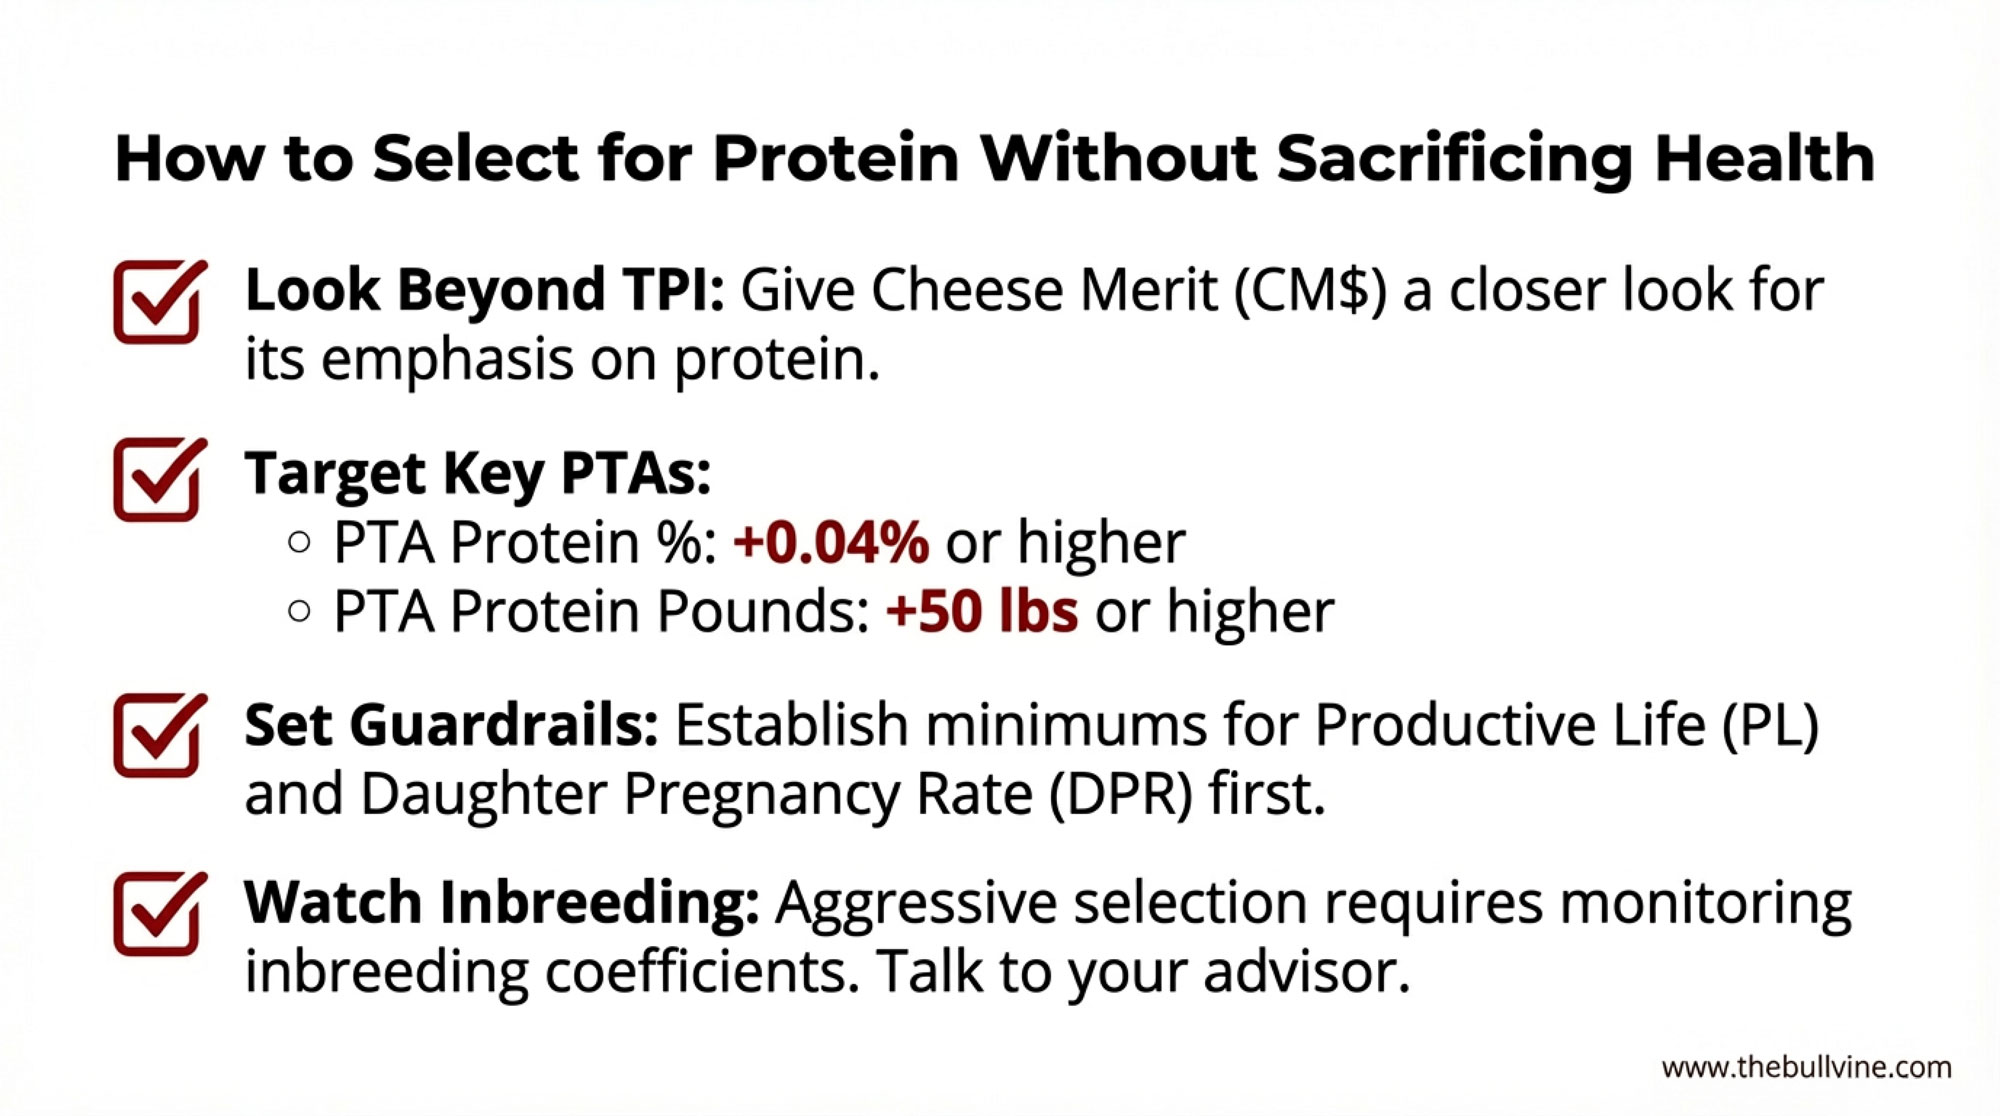
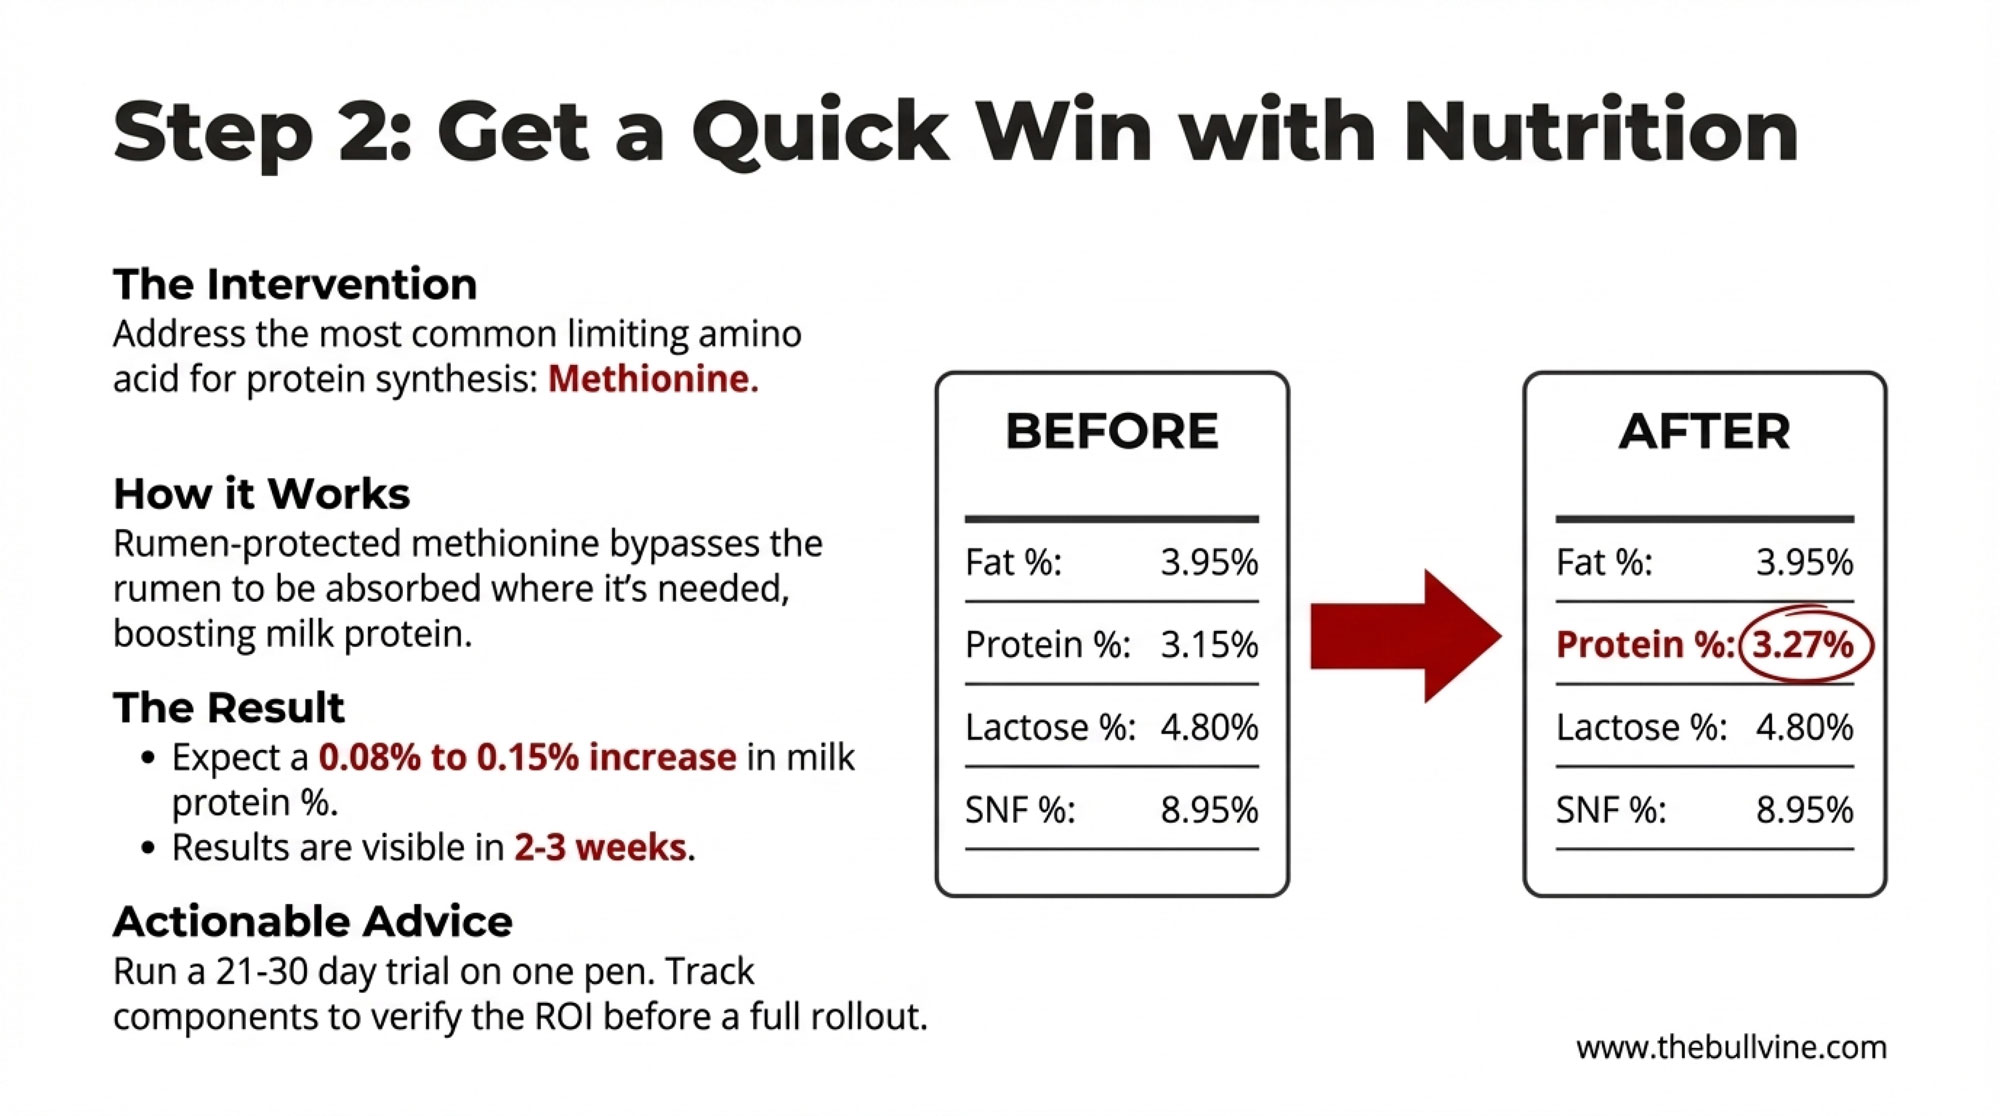
The fix is mechanical: drop your TPI cutoff by ~75–125 points, or rebuild your selection from PTA Protein and PTA Fat directly instead of relying on the headline index. The math hasn’t changed for milk in the tank. It’s changed for which bulls your computer flags as elite.
Specialty Forces: Type and Red & White
Headline gTPI and proven TPI tables tell you who’s winning the index war. Specialty rankings tell you who’s winning the niches — the breeders who keep buying for udder, feet, and frame; for component-heavy red herds; for a typier cow regardless of what TPI is doing this April. We’ve cross-referenced the EuroGenes April 2026 ranked top-50 lists for Type (PTAT) and Red & White TPI. Both pull from the same Holstein USA April 2026 evaluation as the headline gTPI lists but isolate subsets that don’t surface in the broader rankings.
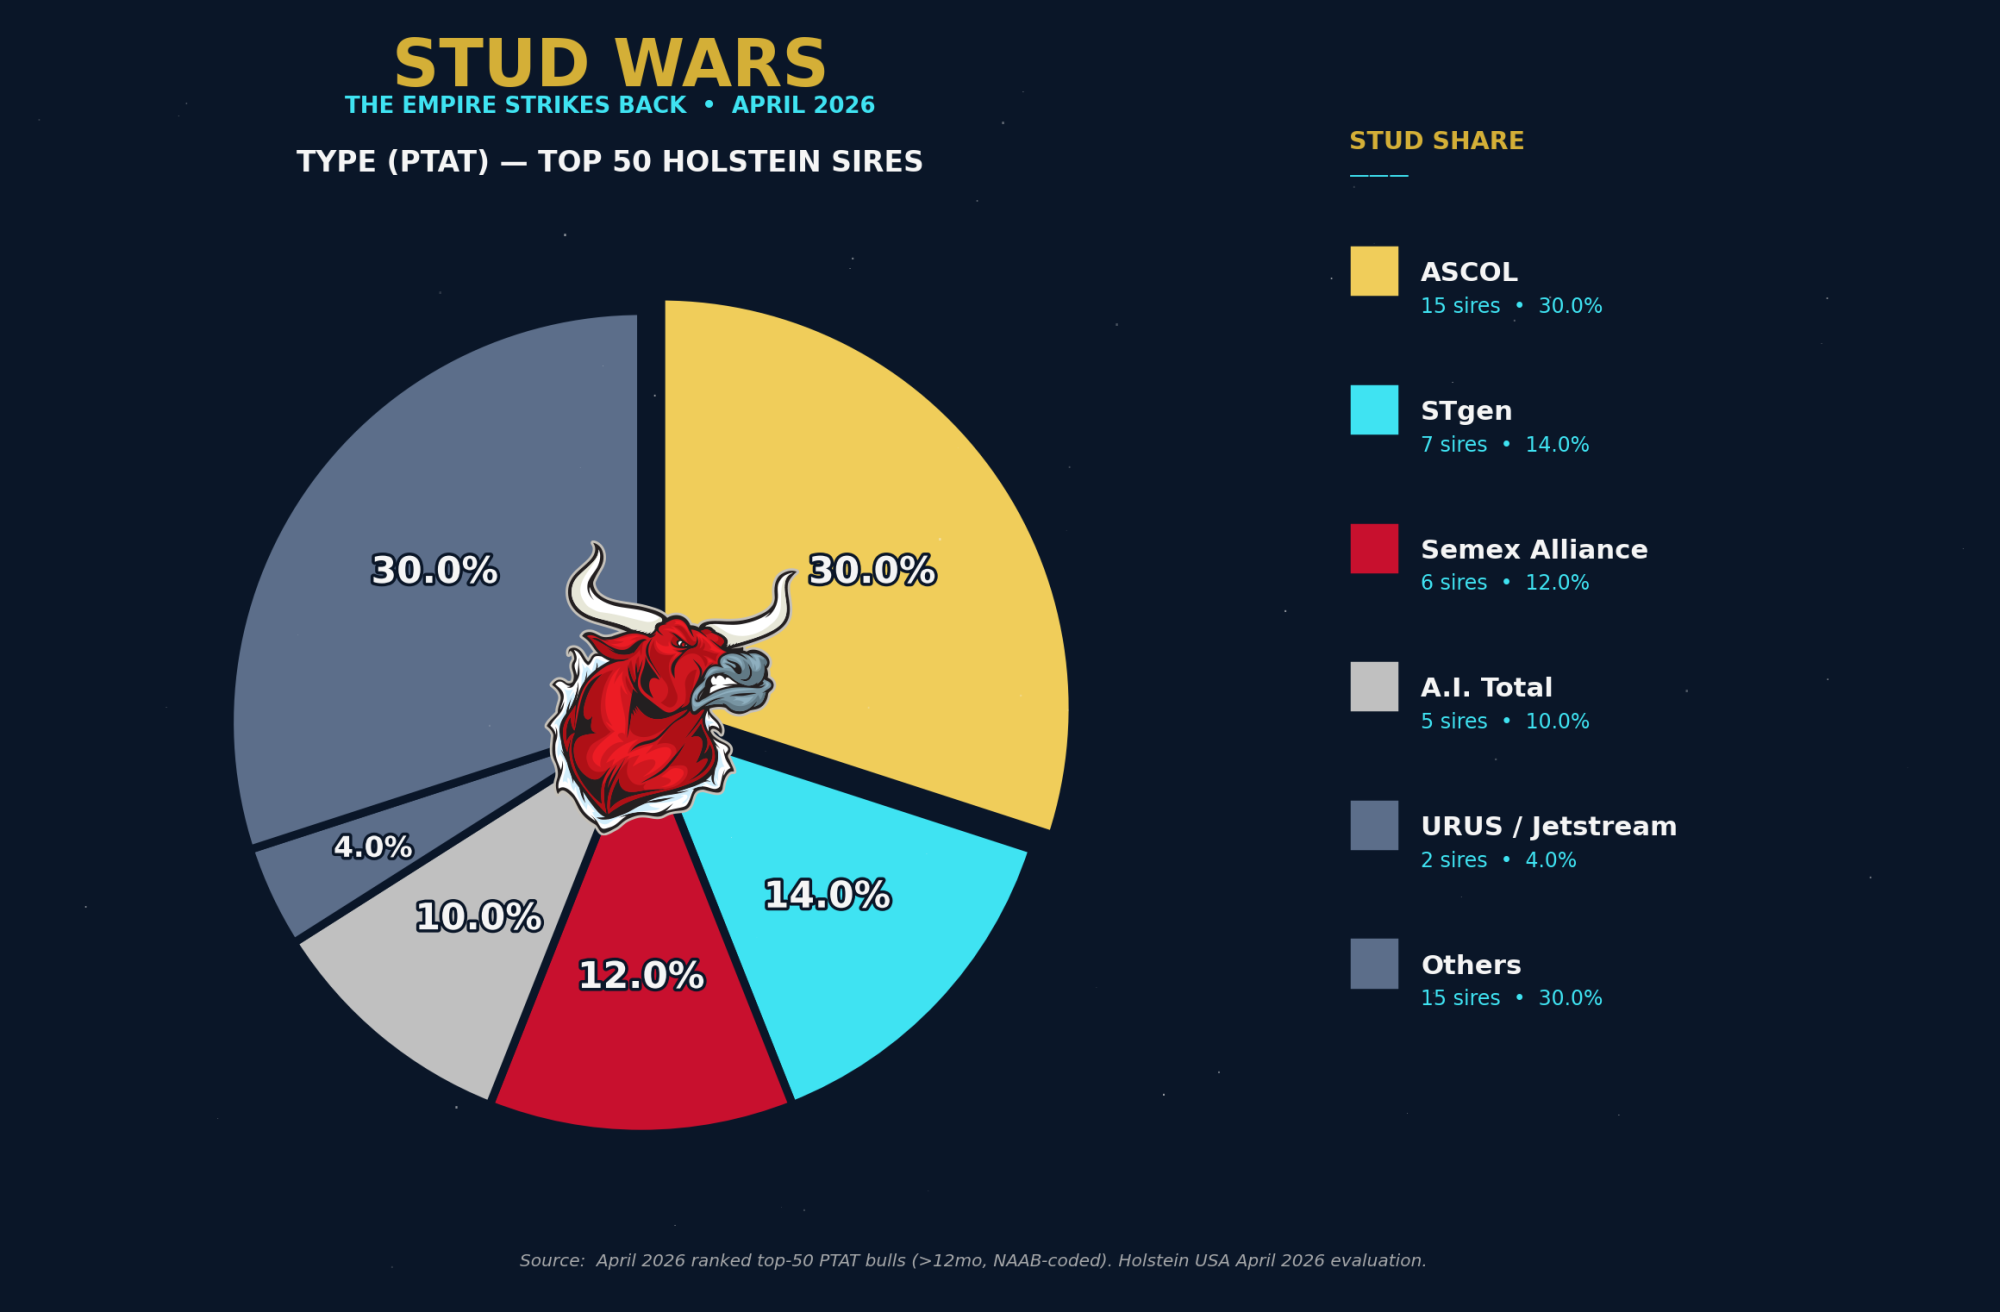
Type (PTAT): The Spanish Empire You Forgot About
Rank
Bull
NAAB
TPI
PTAT
Stud
1
Ruann Karat-45955-ET
719HO45955
+2647
+3.92
RuAnn Genetics
2
Shg Lego
515HO00486
+2307
+3.84
A.I. Total (NL)
3
Redcarpet Story Arc-ET
730HO00005
+2215
+3.78
Redcarpet Sires
4
Stone-Front Eyecandy Apollo
288HO00352
+2448
+3.72
ASCOL (Spain)
5
Genosource Seenofear-ET
551HO05904
+2791
+3.71
STgen
6
Jimtown Nelson-ET
288HO00321
+2426
+3.69
ASCOL
7
Curlys Admire
734HO00157
+2600
+3.63
URUS (Jetstream)
8
Eclipse Milio-ET
551HO03708
+1982
+3.58
STgen
9
Eskdale Hulu Shoutout-ET
288HO00364
+2889
+3.56
ASCOL
10
Mr Legacy-Ranch E Atlas-ET
100HO12395
+2423
+3.55
JLG Custom
Source: Drawn from the official Holstein USA April 2026 evaluation.
Type (PTAT) Stud Share — Top 50 Bulls
Stud (NAAB code)
Apr 2026 count
% of top 50
ASCOL (288)
15
30.0%
STgen (523, 551)
7
14.0%
Semex Alliance (200, 777)
6
12.0%
A.I. Total (515)
5
10.0%
Other independents (Showbox 744, Holstein Svc 712, AG3NexGen 733)
6
12.0%
Blondin (799)
2
4.0%
RuAnn (719)
2
4.0%
URUS / Jetstream (734)
2
4.0%
Redcarpet (730)
1
2.0%
ABS / Genus (94)
1
2.0%
Select Sires (250)
1
2.0%
Swissgenetics (196)
1
2.0%
The headline finding is the one nobody outside Europe will see coming: ASCOL — the Spanish breeder cooperative — owns 30% of the top 50 PTAT bulls in the U.S. evaluation, and 3 of the top 10. Stone-Front Eyecandy Apollo, Jimtown Nelson, and Eskdale Hulu Shoutout are all 288HO bulls, all PTAT ≥3.55. STgen has 7 (14%) and a top-10 presence with Genosource Seenofear at #5 and Eclipse Milio at #8. The big U.S. cooperatives — Select Sires (1), ABS (1), GENEX (0) — barely register at the top of the type rankings.
This is not new. PTAT has historically been the most fragmented stud-share category because elite type bulls come from individual breeder programs that license through niche distribution channels rather than the big-five cooperative pipelines. April 2026 just confirms the pattern with verified NAAB-code accounting.
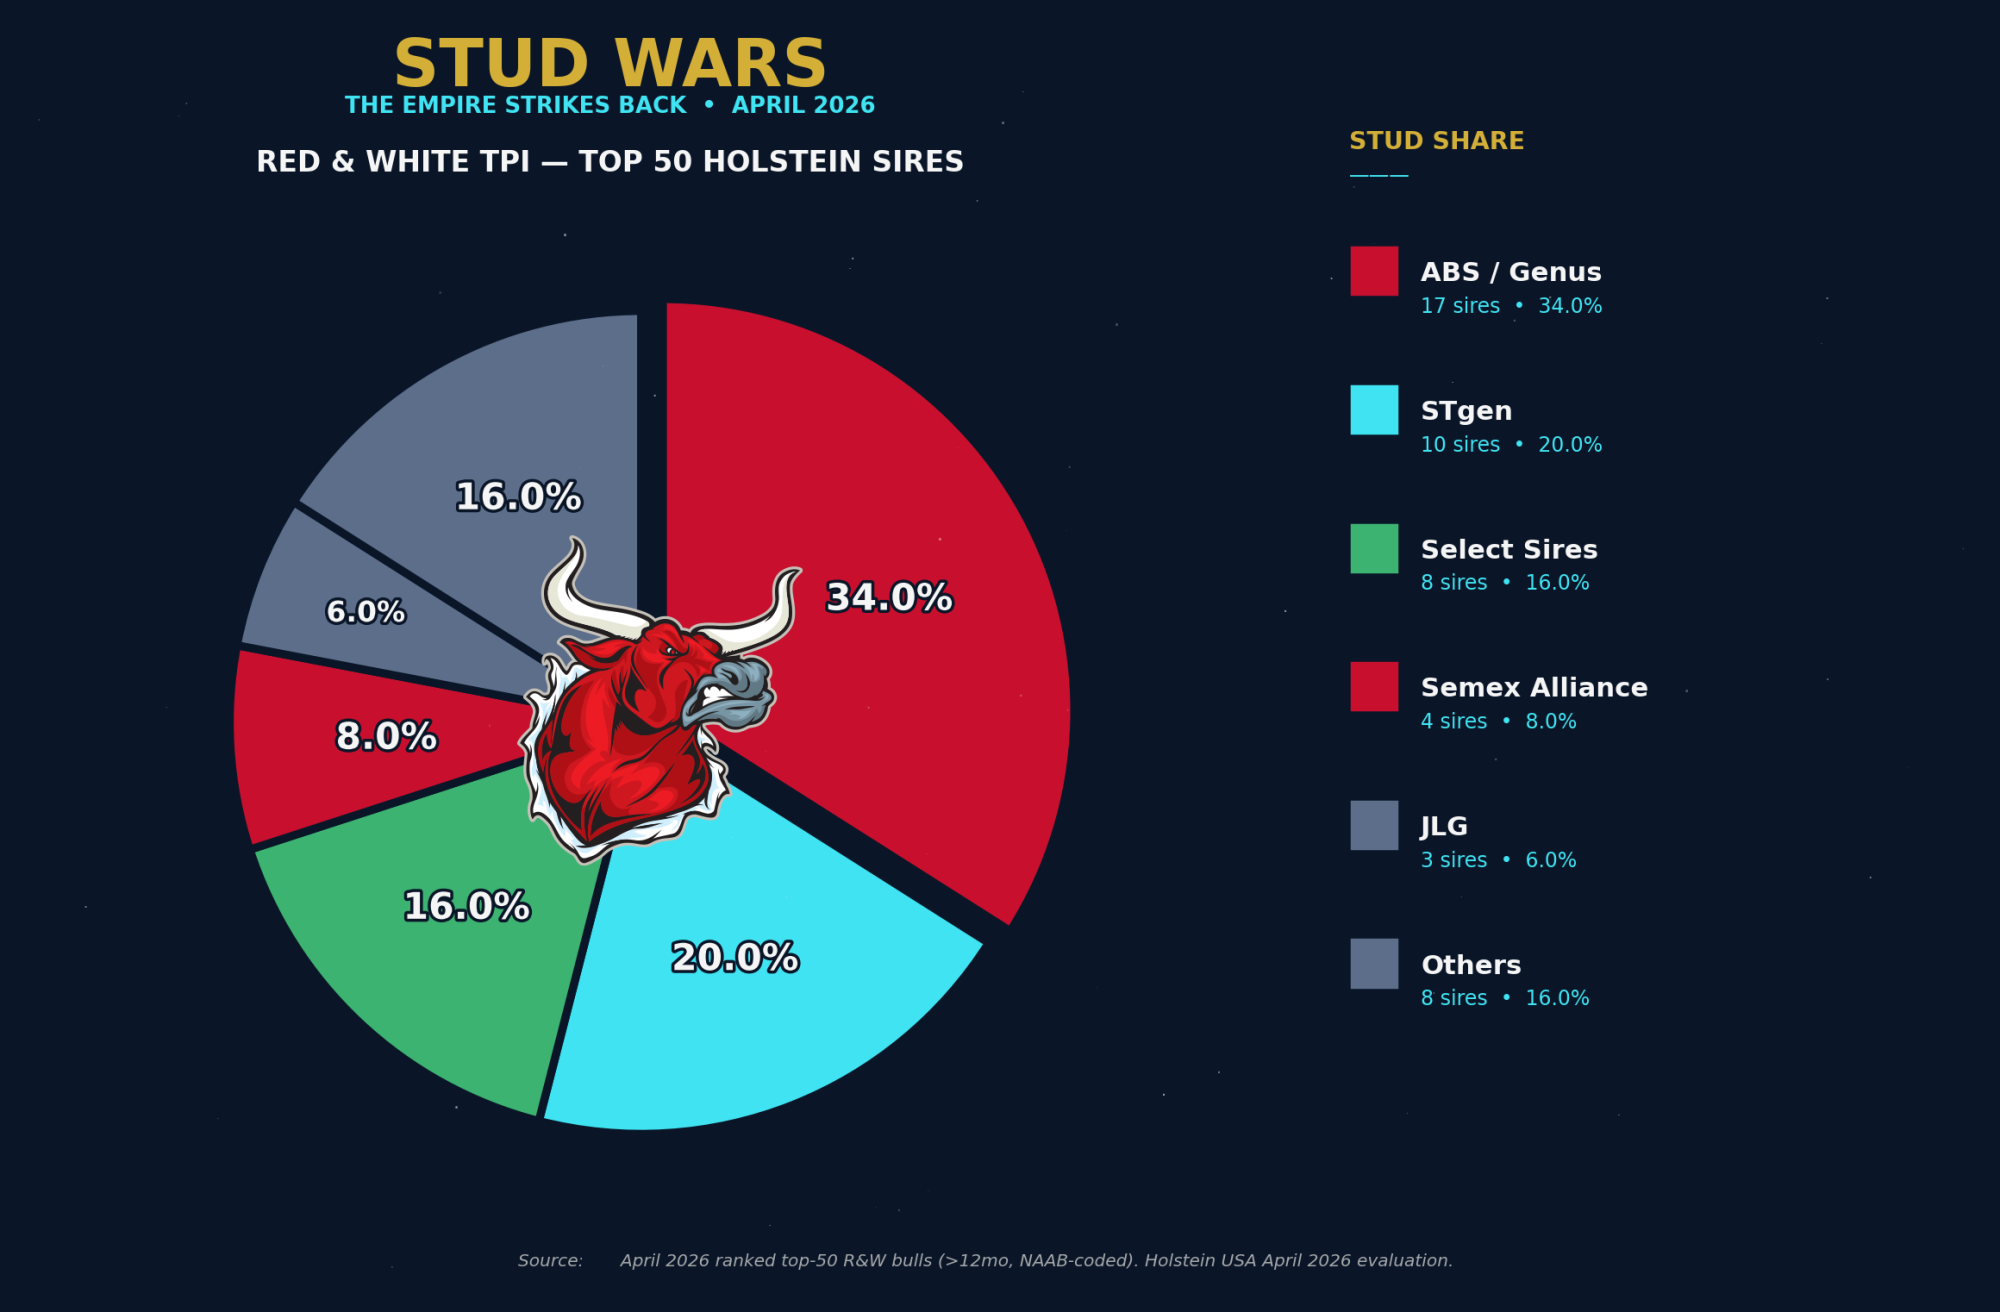
Red & White TPI: ABS’s Quiet Empire
While the gTPI top 200 reshuffled around STgen and Select Sires, the R&W lineup tells a different story — ABS / Genus owns 17 of the top 50 R&W TPI bulls (34%) including 5 of the top 10. The De Novo acquisition is showing up in the rankings.
Rank
Bull
NAAB
TPI
Stud
1
Denovo 21873 Okafor-Red-ET
029HO00951
+3194
ABS / Genus
2
Aprilday Hrok Athens-Red-ET
250HO18217
+3180
Select Sires
3
Stgen Ocean-Red-ET
551HO06846
+3179
STgen
4
Ocd Morris Spirit-Red-ET
551HO06757
+3177
STgen
5
Aprilday Orphs Aesop-Red-ET
029HO00954
+3177
ABS / Genus
6
Sfh Scudetto Red ET
029HO22554
+3177
ABS / Genus
7
3star Patser-Red-ET
200HO08526
+3175
Semex
8
Siemers Rle Papaya-Red-ET
007HO17695
+3174
Select Sires
9
Sfh Saviero Red ET
029HO22562
+3170
ABS / Genus
10
Aprilday Orph Lyon-Red-ET
029HO00956
+3168
ABS / Genus
Source: Drawn from the official Holstein USA April 2026 evaluation.
Red & White TPI Stud Share — Top 50 Bulls
Stud (NAAB code)
Apr 2026 count
% of top 50
ABS / Genus (29, 94)
17
34.0%
STgen (523, 551)
10
20.0%
Select Sires (7, 14, 250)
8
16.0%
Semex Alliance (200, 777)
4
8.0%
JLG / Holstein Svc (100, 712)
3
6.0%
Alta / URUS (11)
2
4.0%
GENEX / URUS (1)
1
2.0%
United Sires (796)
1
2.0%
Other independents (Cogent 522, Inseme 643, A.I. Total 515, Intermizoo 198)
4
8.0%
The story in this table is the consolidation of red-and-white genetics under ABS/Genus’s roof. The top R&W bull, Denovo 21873 Okafor-Red-ET (029HO00951) at +3194 TPI, is a De Novo bull — the same De Novo program ABS completed its full takeover of in early 2026. Five of the top ten R&W bulls carry 029HO codes. Of the next 40, ABS owns another 12. Total: 17 of 50 (34%) — the largest single-stud share in any specialty category we counted.
STgen’s 20% share comes from a different angle. The 551HO R&W lineup — Ocean, Spirit, Red Lion, Redwood-P, Remington, Sizzler, Genosource Morris, Silver-Elite Ferrari, Silver-Elite Malibu — reflects STgen’s bid to keep R&W relevance through the Genosource production pipeline. Select Sires shows up with 8 bulls (16%), led by Aprilday Hrok Athens-Red at #2.
If you breed red Holsteins commercially, the practical implication is straightforward: the R&W elite is concentrating, not fragmenting. ABS, STgen, and Select Sires together own 70% of the top 50 R&W TPI bulls in April 2026. Independent breeder lines that historically carried R&W (Aprilday, Denovo, Genosource, Stgen) are increasingly inside one of those three corporate umbrellas.
The Economic Theater: NM$ and the Sire-Count Totals
TPI is the breeding-decision proxy. Net Merit (NM$) is the dollars-per-cow-per-lactation proxy — USDA’s lifetime profit estimate for a daughter sired by that bull. If TPI tells you who’s winning the index war, NM$ tells you who’s winning the economics. And nobody who reads sire summaries will be surprised by what the NM$ tables show: STgen owns the NM$ rankings the way Saudi Arabia owns crude oil.
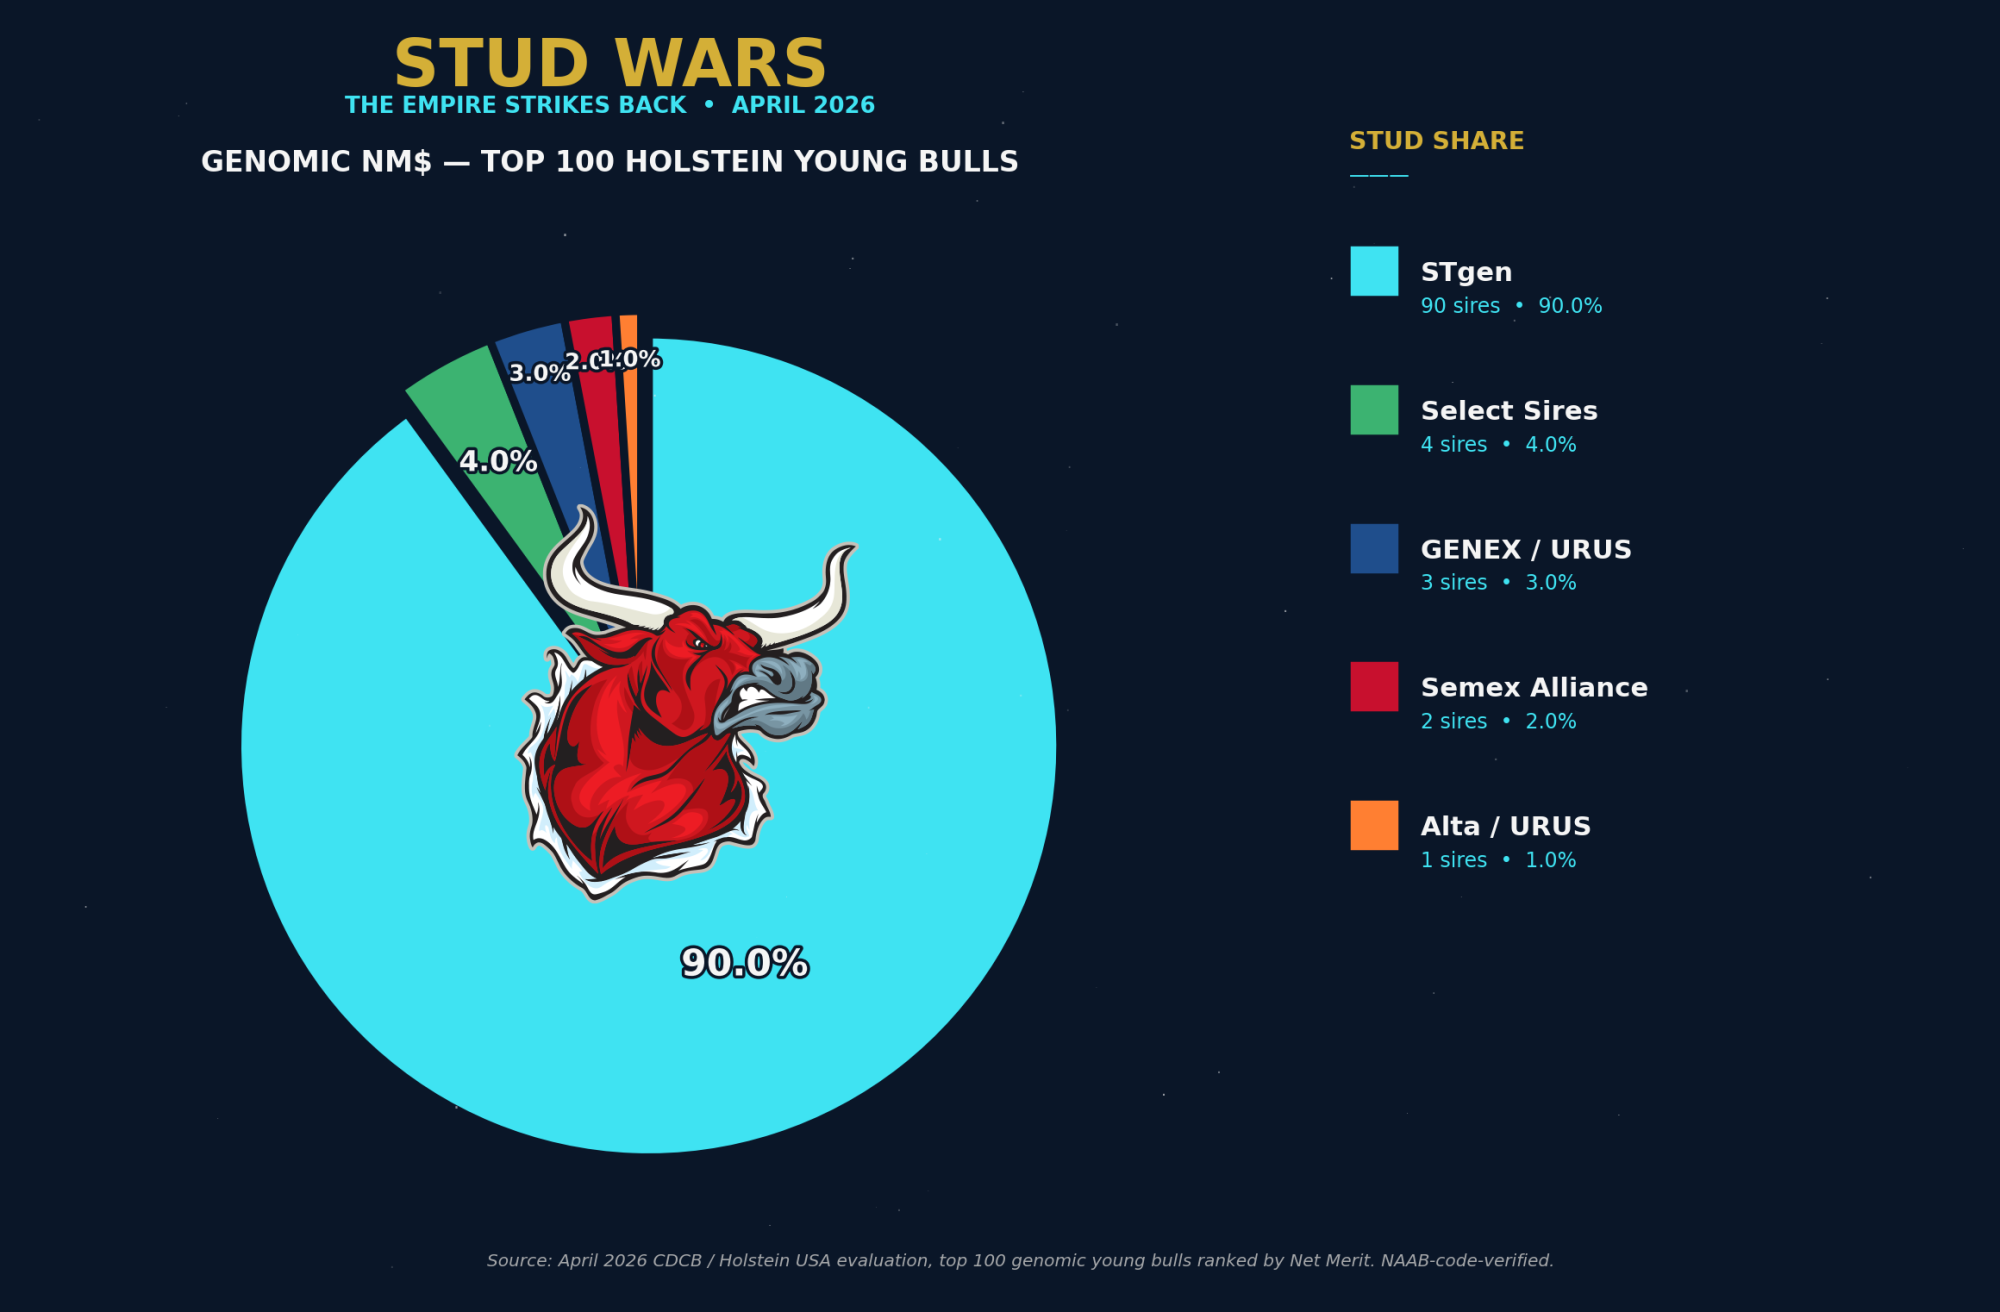
Genomic NM$: STgen’s 90% Empire
Rank
Bull
NAAB
NM$
TPI
Stud
1
Genosource Valkyrie-ET
551HO07040
+1308
+3464
STgen
2
Farnear Collateral-ET
551HO07100
+1304
+3410
STgen
Source: April 2026 CDCB / Holstein USA evaluation, top 100 genomic young bulls ranked by Net Merit. NAAB-code-verified.
Genomic NM$ Stud Share — Top 100 Bulls
Stud (NAAB code)
Apr 2026 count
% of top 100
STgen (523, 551, 558)
90
90.0%
Select Sires (7, 14, 250)
4
4.0%
GENEX / URUS (1)
3
3.0%
Semex Alliance (200, 777)
2
2.0%
Alta / URUS (11)
1
1.0%
This is not a typo. 90 of the top 100 genomic NM$ young bulls in the April 2026 evaluation carry STgen NAAB codes (551HO or 558HO). Select Sires has 4. GENEX/URUS has 3. Semex has 2. Alta has 1. Everyone else combined has zero. The Genosource production pipeline — anchored by Captain, Charl, Ripcord, Dominance, and Thorson as foundation sires — is producing genomic young bulls so deep on Net Merit that the rest of the industry barely registers.
This is also the strongest single argument for why the DOJ + Select Sires merger matters. If the deal clears, Select Sires gets distribution rights to 90% of the world’s top genomic NM$ pipeline. If it blocks, every cooperative in North America that wants to sell elite NM$ young bulls has to negotiate with STgen on STgen’s terms.
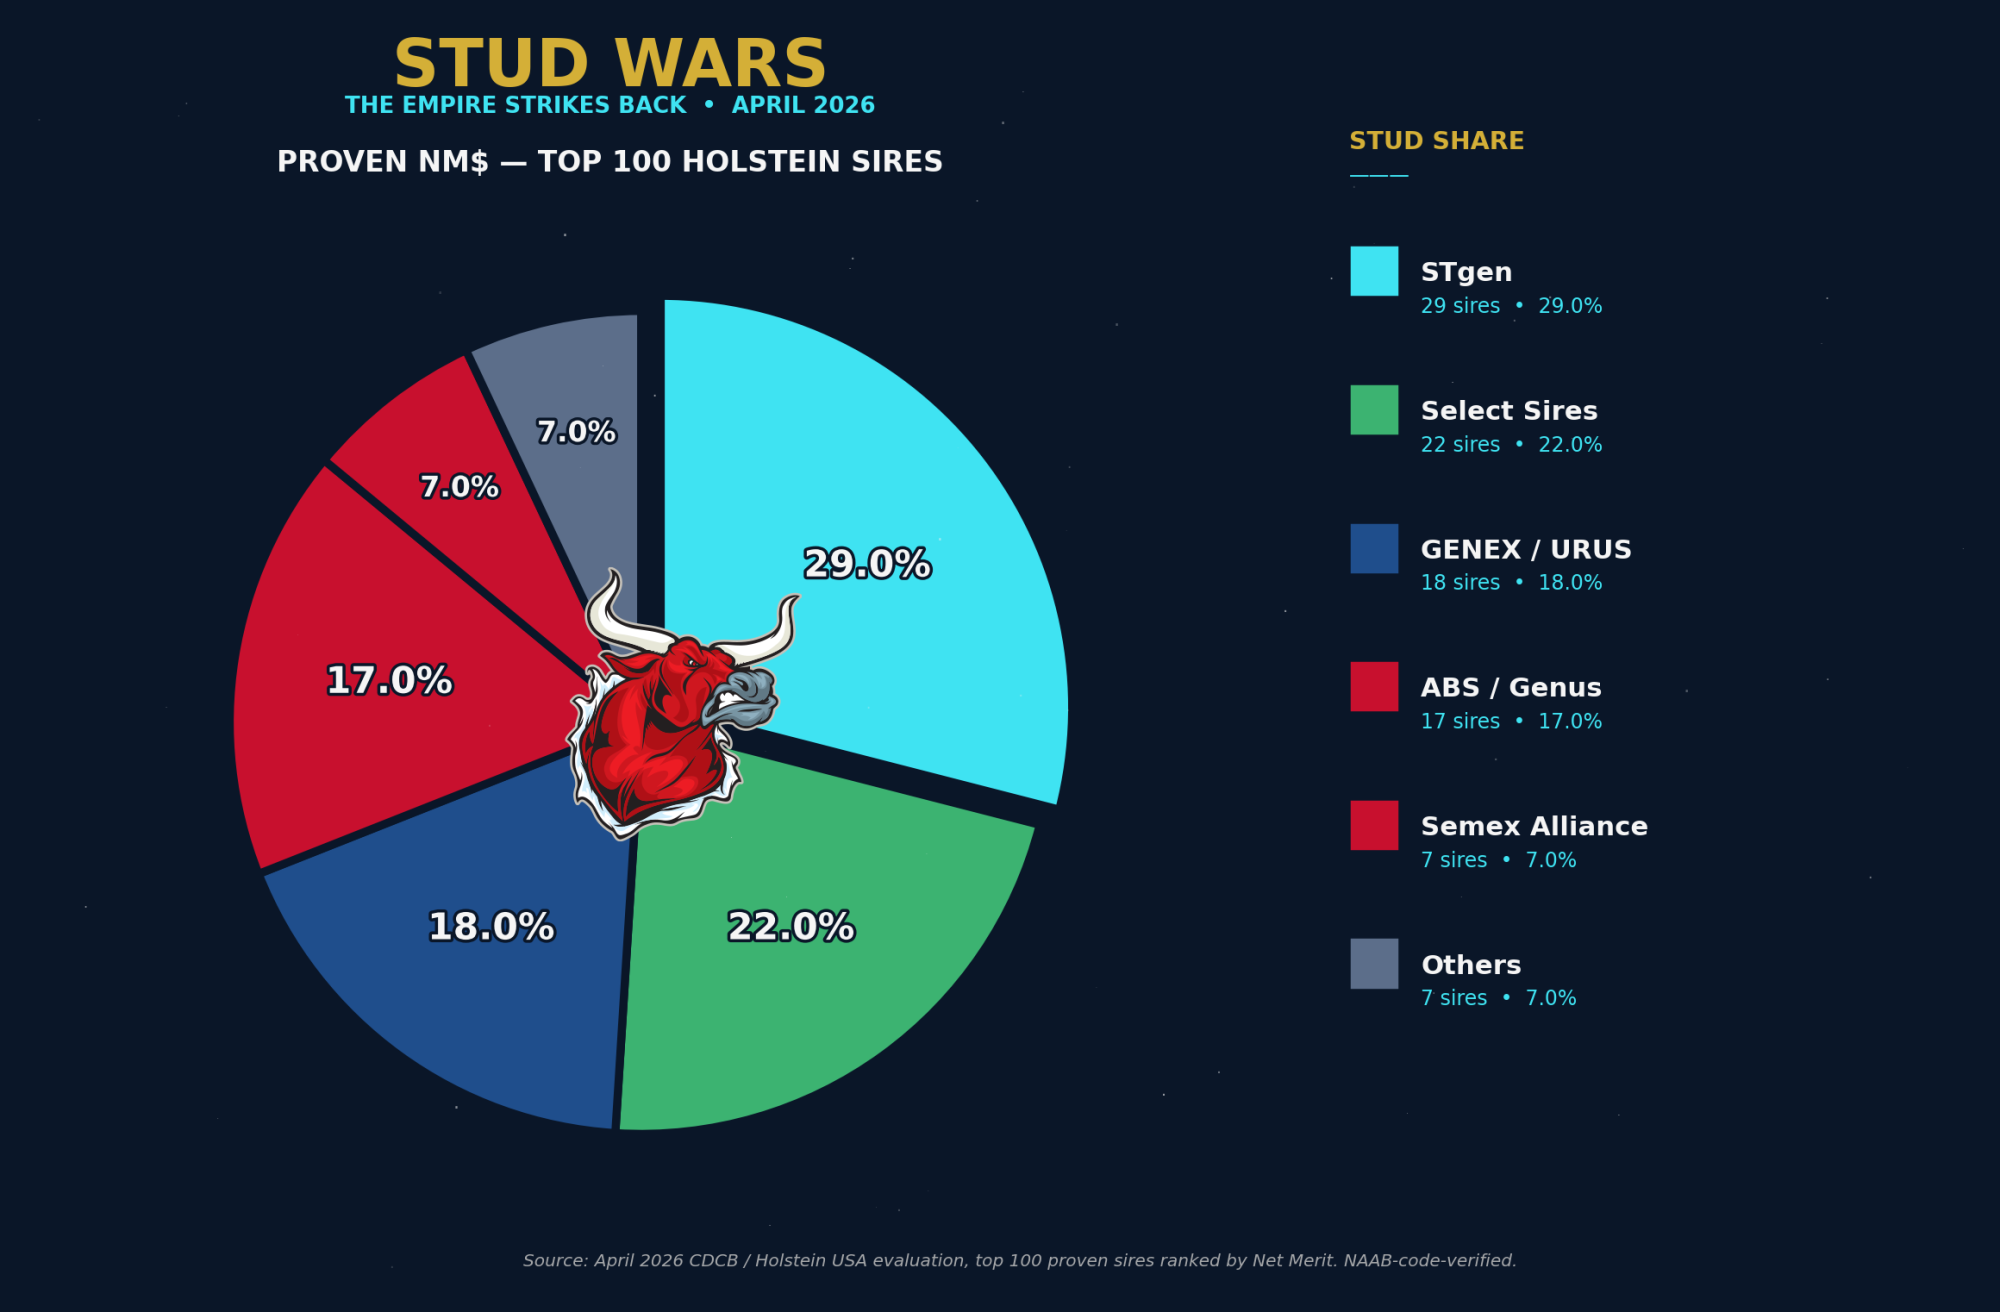
Proven NM$: A Different Five-Way Fight
The proven NM$ list is a different story — wider, more competitive, and shaped by which studs have managed to get high-NM$ Genosource-pipeline bulls daughter-proven before they age out of relevance.
Proven NM$ Stud Share — Top 100 Bulls
Stud (NAAB code)
Apr 2026 count
% of top 100
STgen (523, 551)
29
29.0%
Select Sires (7, 14)
22
22.0%
GENEX / URUS (1)
18
18.0%
ABS / Genus (29, 94)
17
17.0%
Semex Alliance (200, 777)
7
7.0%
Alta / URUS (11)
7
7.0%
Proven NM$ is the most balanced category in the entire April 2026 analysis. Six studs all sit between 7% and 29%. STgen leads at 29% — their proven Genosource pipeline (Dominance #1, Thorson #2, Garza #3, Captain, Jack, John, Vito, Brockington) sweeps the top of the list. But Select Sires (22%), GENEX/URUS via Peak (18%), and ABS/Genus via De Novo (17%) are all within striking distance. The competitive structure here is healthier than anywhere else in the article — four studs have real depth, and any one of them can compete on commercial pricing.
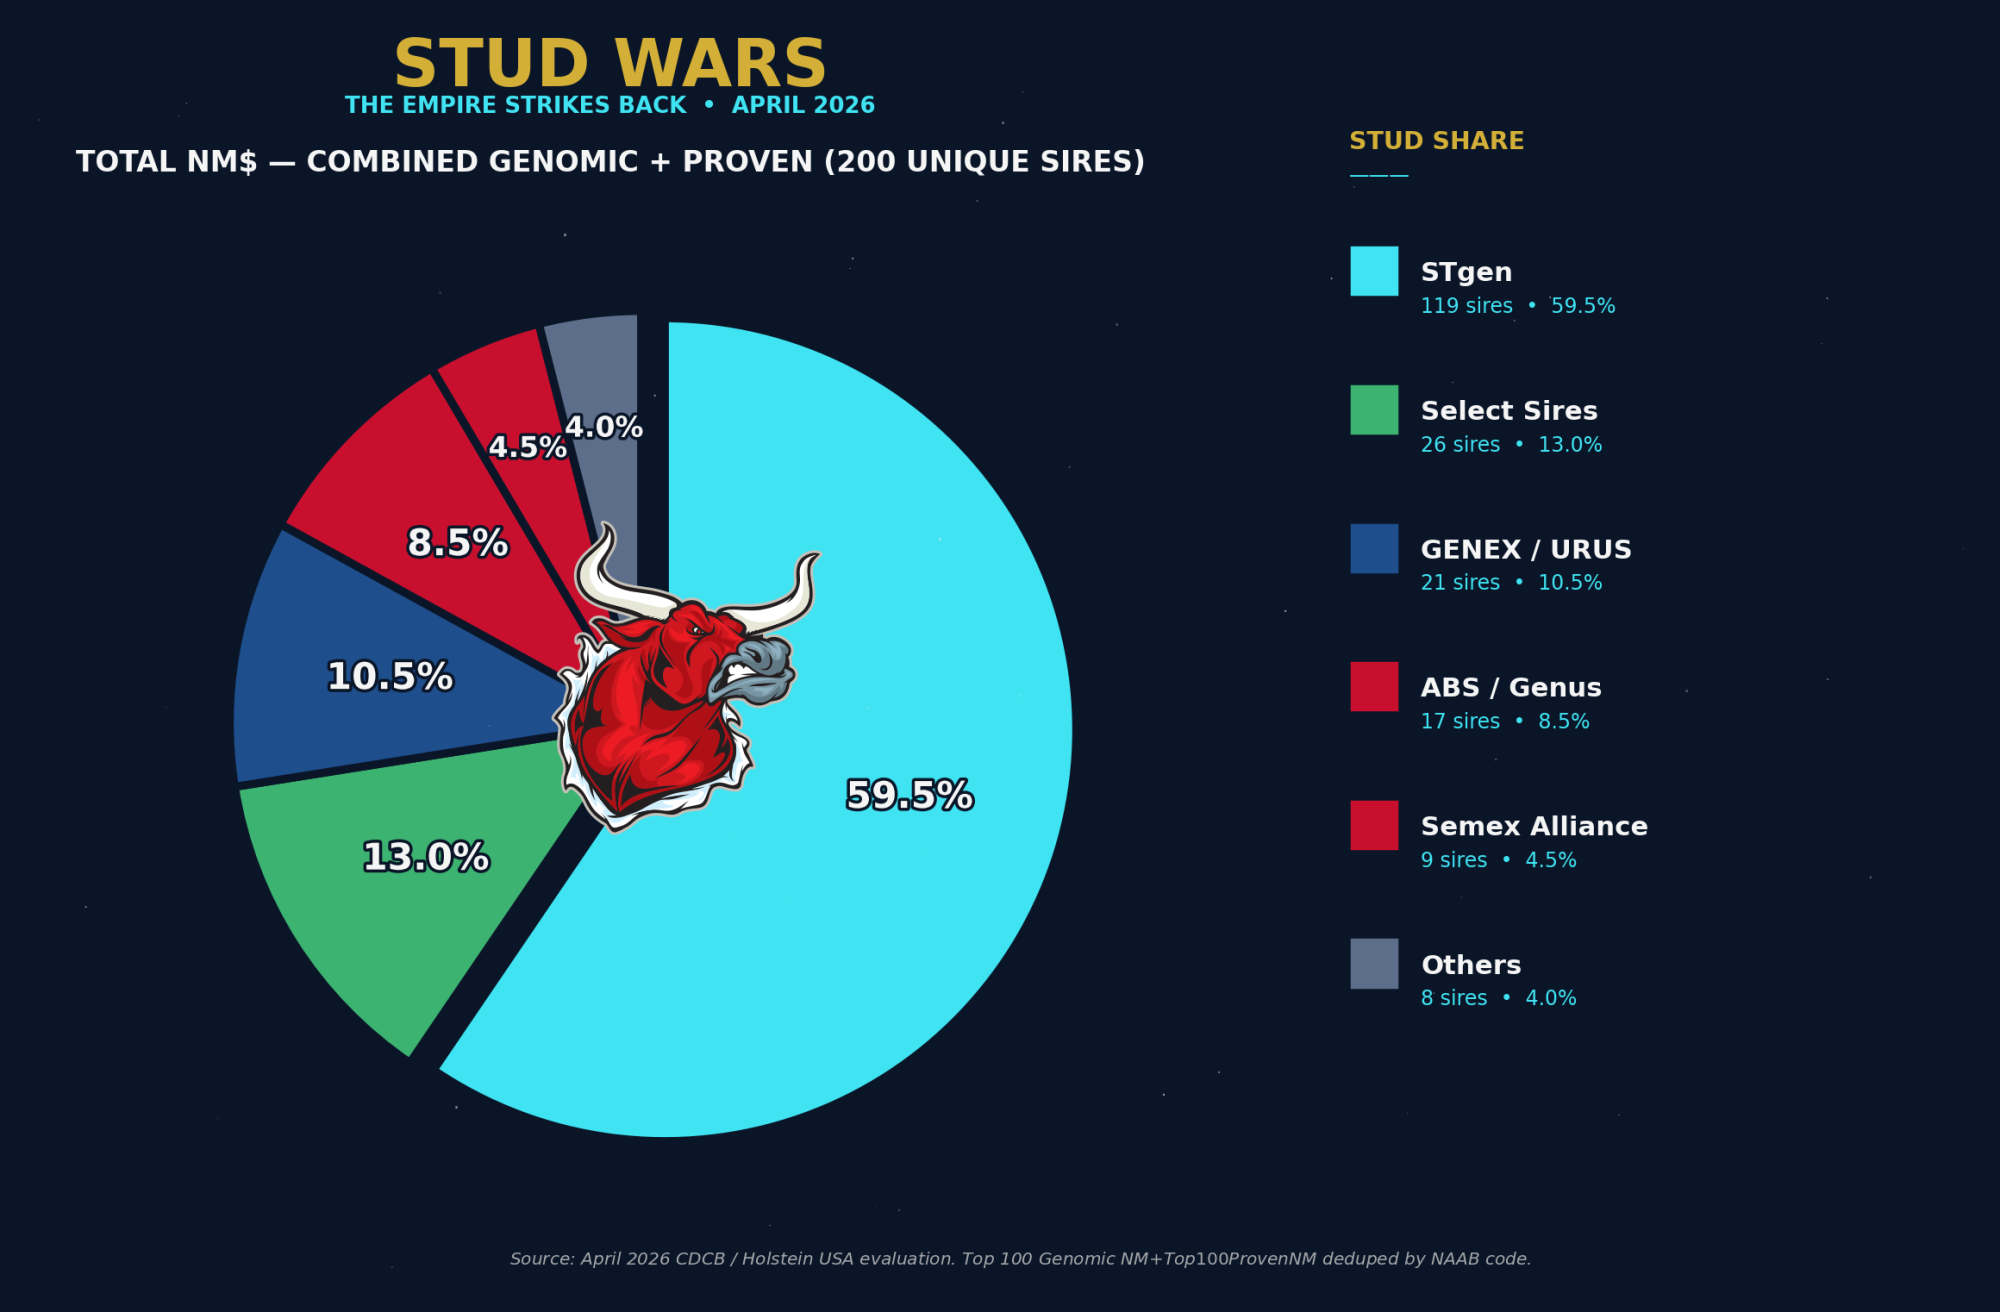
Total NM$: STgen Owns 60% of Both Lists Combined
When you dedupe the Genomic NM$ Top 100 and the Proven NM$ Top 100 by NAAB code, you get 200 unique sires(no bull appears on both lists at the same time). Of those 200, STgen owns 119.
Total NM$ Stud Share — 200 Unique Sires
Stud
Combined count
% of 200 unique sires
STgen
119
59.5%
Select Sires
26
13.0%
GENEX / URUS
21
10.5%
ABS / Genus
17
8.5%
Semex Alliance
9
4.5%
Alta / URUS
8
4.0%
STgen owns 59.5% of the combined NM$ map. Select Sires — the largest cooperative distributor in North America — owns 13%. URUS umbrella combined (Alta + GENEX) sits at 14.5%. The DOJ decision is, fundamentally, about who gets to sell the 60% slice that STgen currently produces.
The Combined Sire Count: Who Has the Deepest Bench
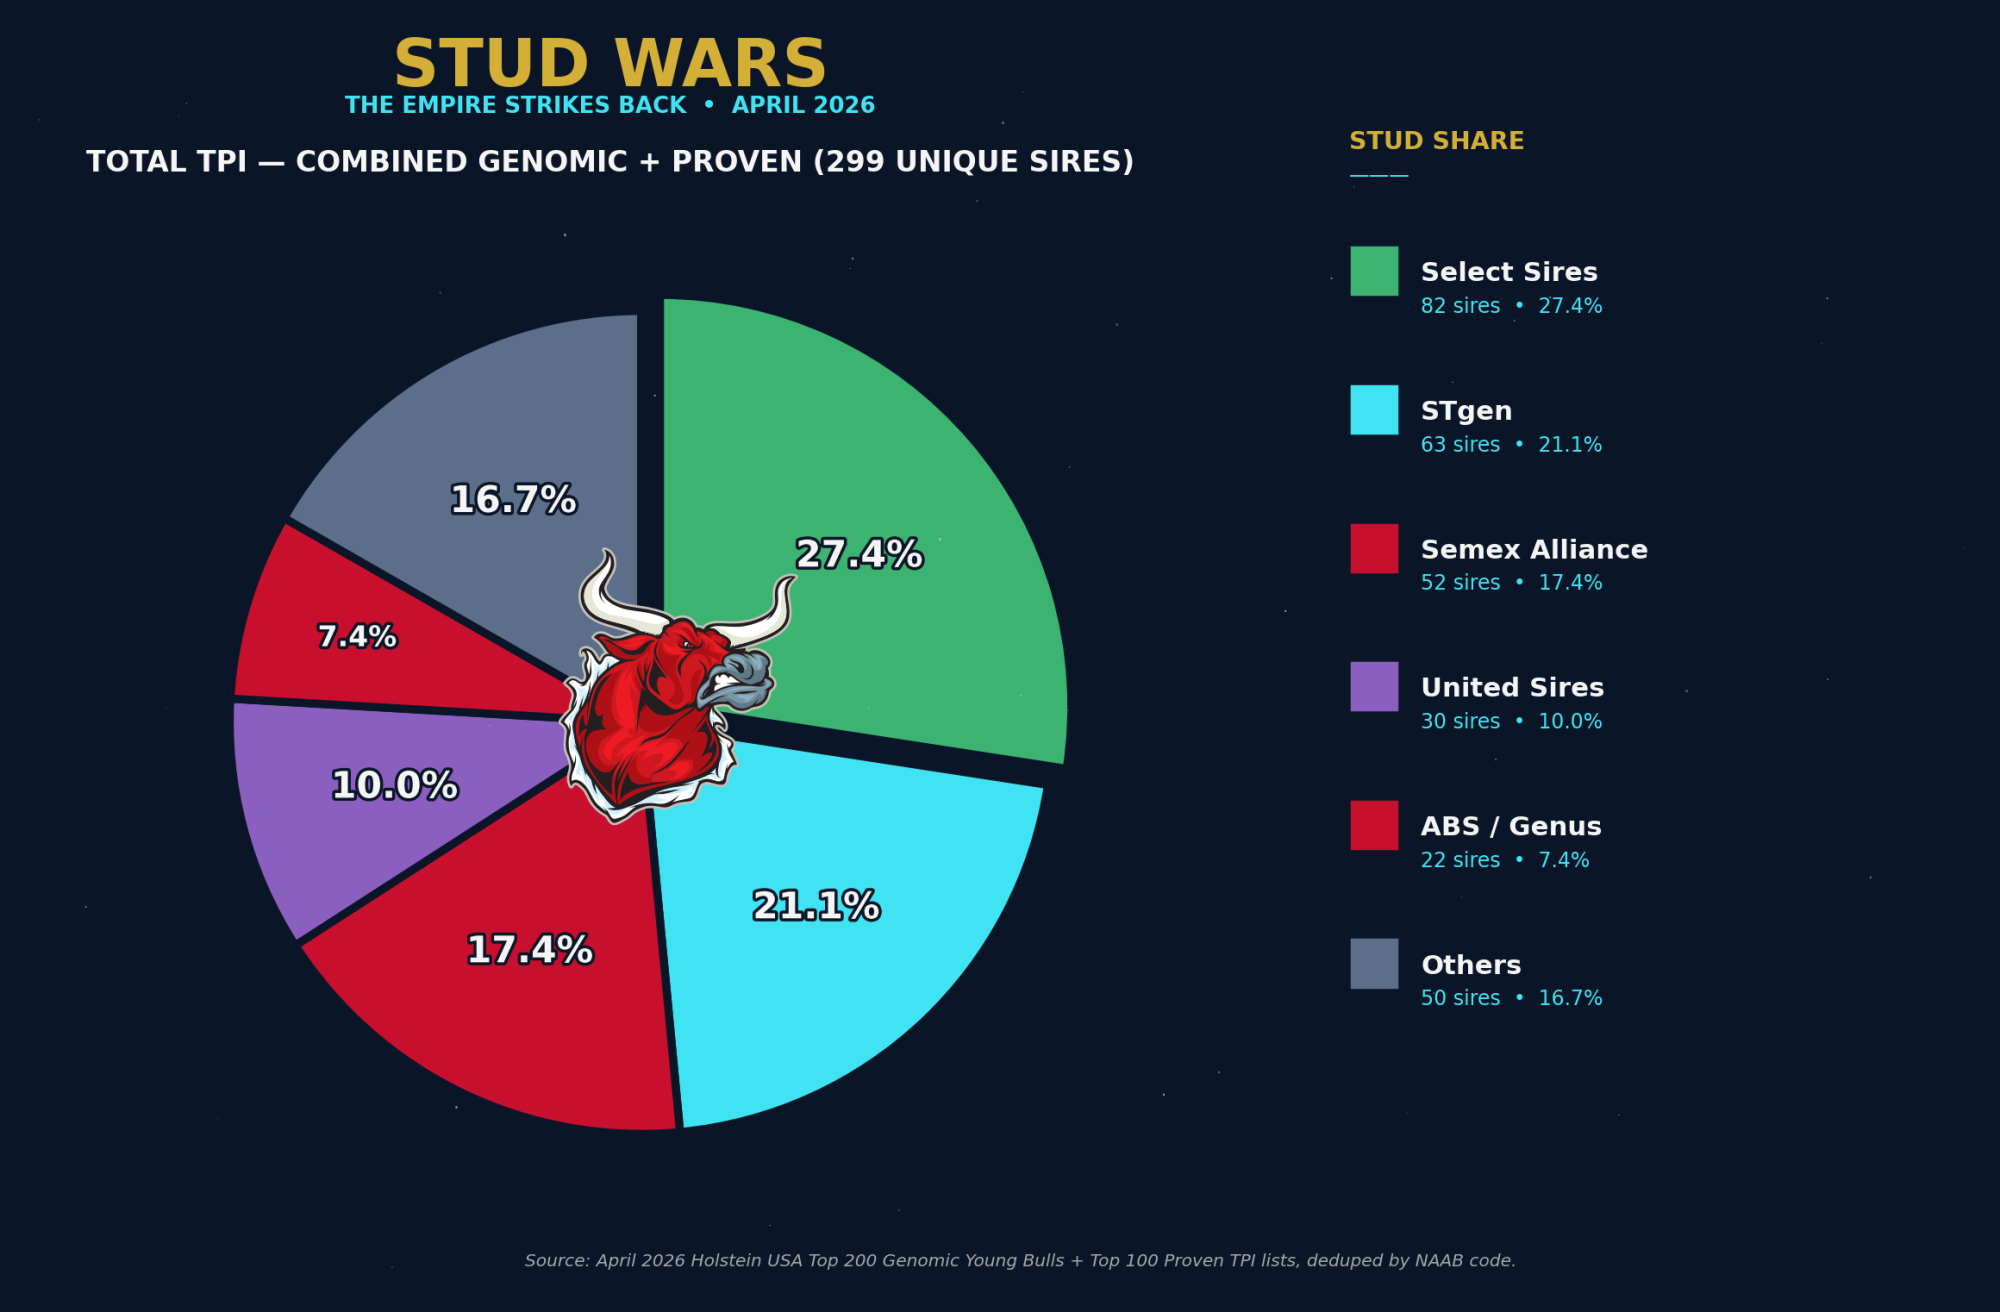
The per-category tables tell you who’s winning specific battles. The combined-count tables tell you whose bench is deepest — across every list a commercial breeder might shop from. We’ve deduped each combination by NAAB code so a bull that appears on both the TPI and the NM$ list only counts once.
Total TPI — Genomic + Proven Combined (299 Unique Sires)
Stud
Combined count
% of 299 unique sires
Select Sires
82
27.4%
STgen
63
21.1%
Semex Alliance
52
17.4%
United Sires
30
10.0%
ABS / Genus
22
7.4%
Alta / URUS
17
5.7%
GENEX / URUS
13
4.3%
CRV
13
4.3%
Independents
7
2.4%
[CHART: Total TPI — Combined Genomic + Proven (299 Unique Sires), April 2026]
Select Sires owns the broadest TPI footprint at 27.4% of all unique TPI-ranked sires (genomic + proven combined). STgen sits at 21.1% — less depth than NM$ but still substantial. Semex’s 17.4% reflects their genomic top-200 strength (40 bulls). United Sires’ 10% from a single year of operation remains the most surprising data point in the entire analysis.
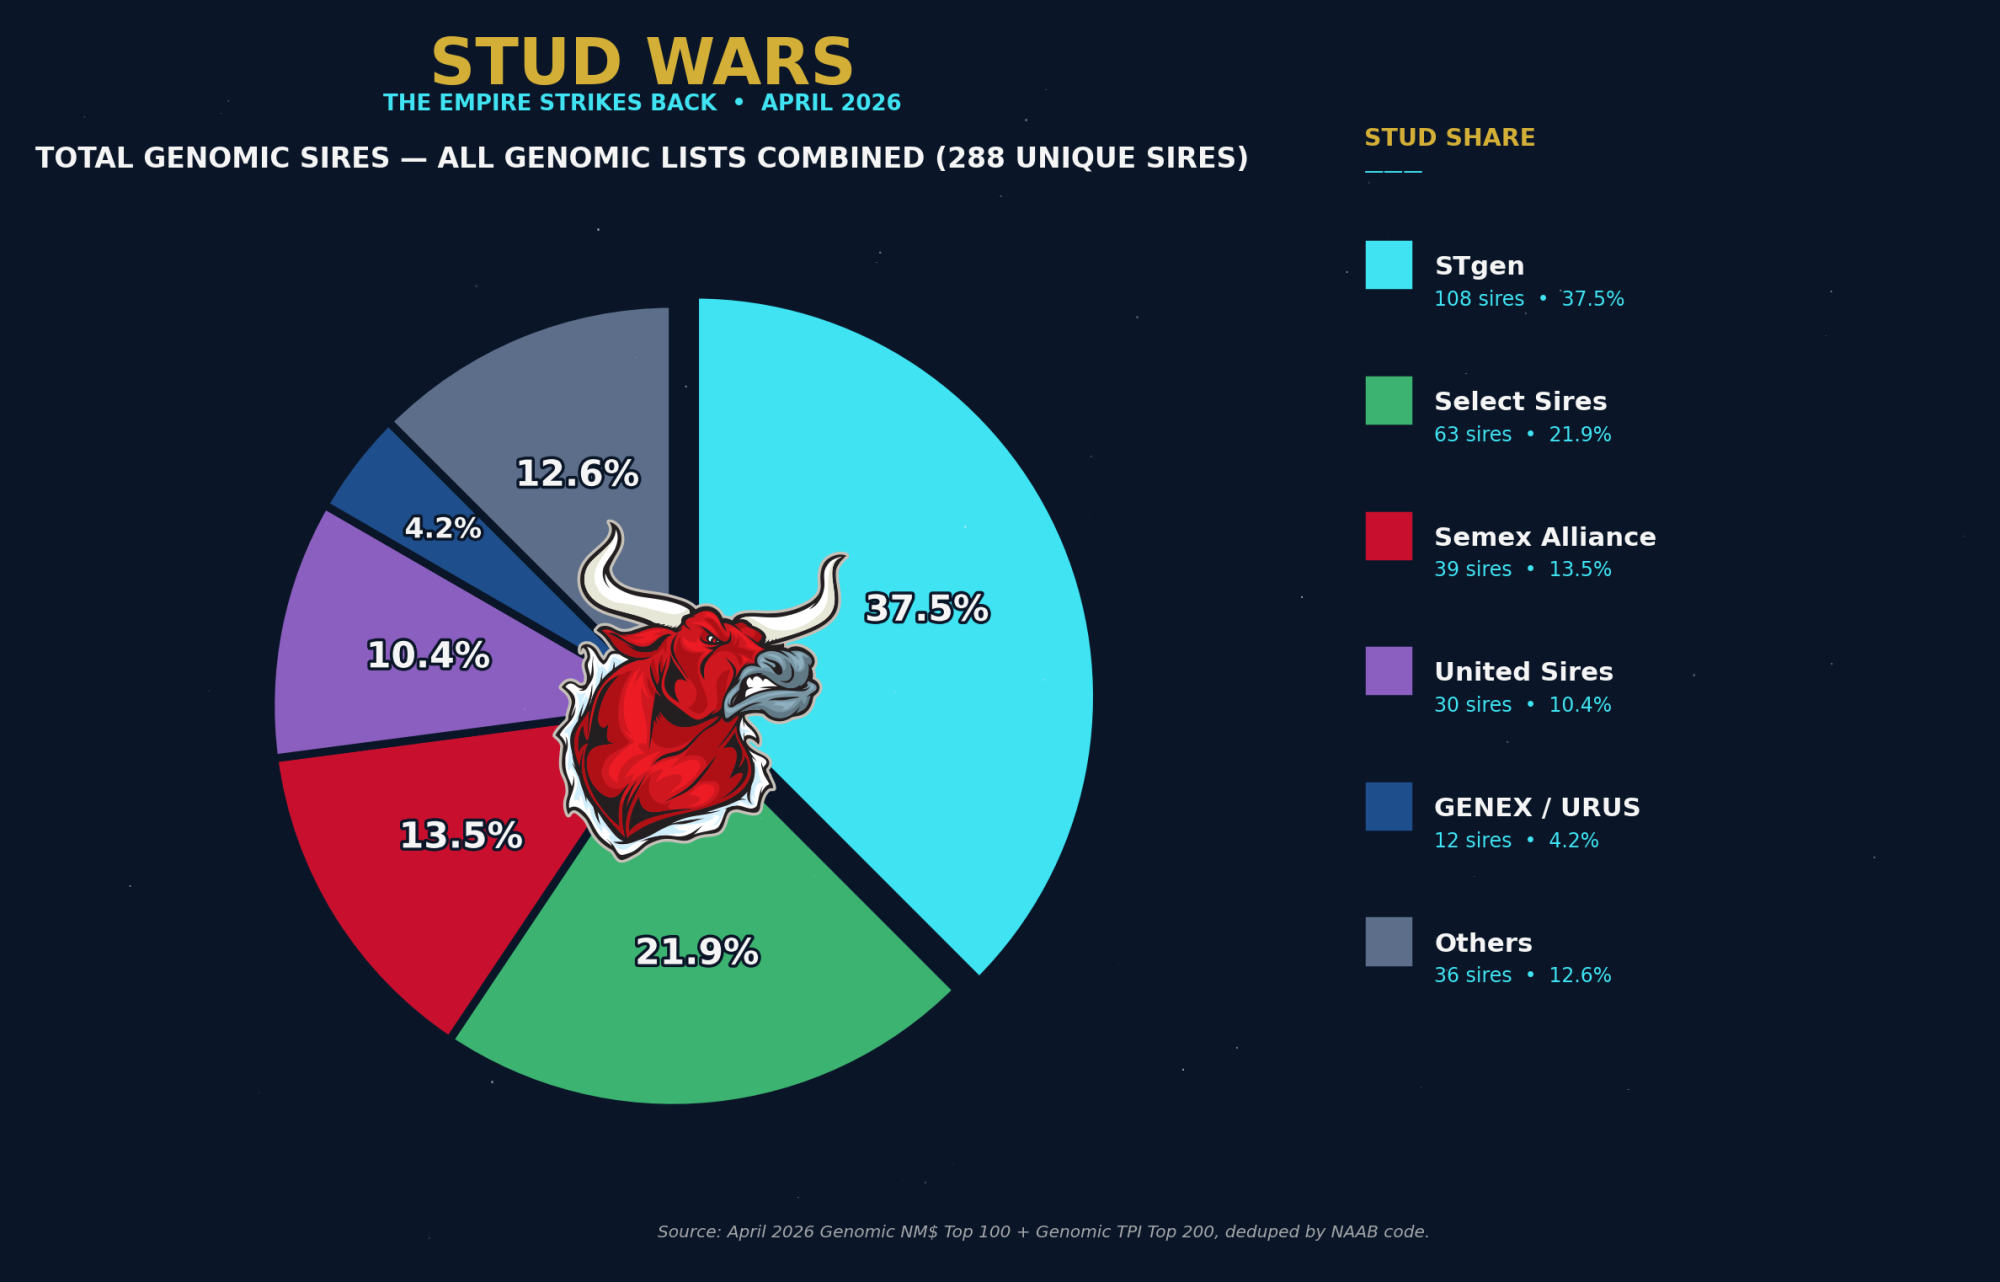
Total Genomic Sires — All Genomic Lists Combined (288 Unique Sires)
Stud
Combined count
% of 288 unique sires
STgen
108
37.5%
Select Sires
63
21.9%
Semex Alliance
39
13.5%
United Sires
30
10.4%
GENEX / URUS
12
4.2%
Alta / URUS
12
4.2%
ABS / Genus
12
4.2%
CRV
8
2.8%
Independents
4
1.4%
[CHART: Total Genomic Sires — All Genomic Lists Combined (288 Unique Sires), April 2026]
When you combine the Genomic TPI Top 200 and Genomic NM$ Top 100 — deduped — STgen pulls ahead of Select Sires at 37.5% to 21.9%. The NM$ dominance is what does it: 90 STgen genomic NM$ bulls plus 27 STgen genomic TPI bulls, deduped to 108 unique entries. The genomic future, on these two metrics combined, is overwhelmingly Genosource-pipeline genetics.
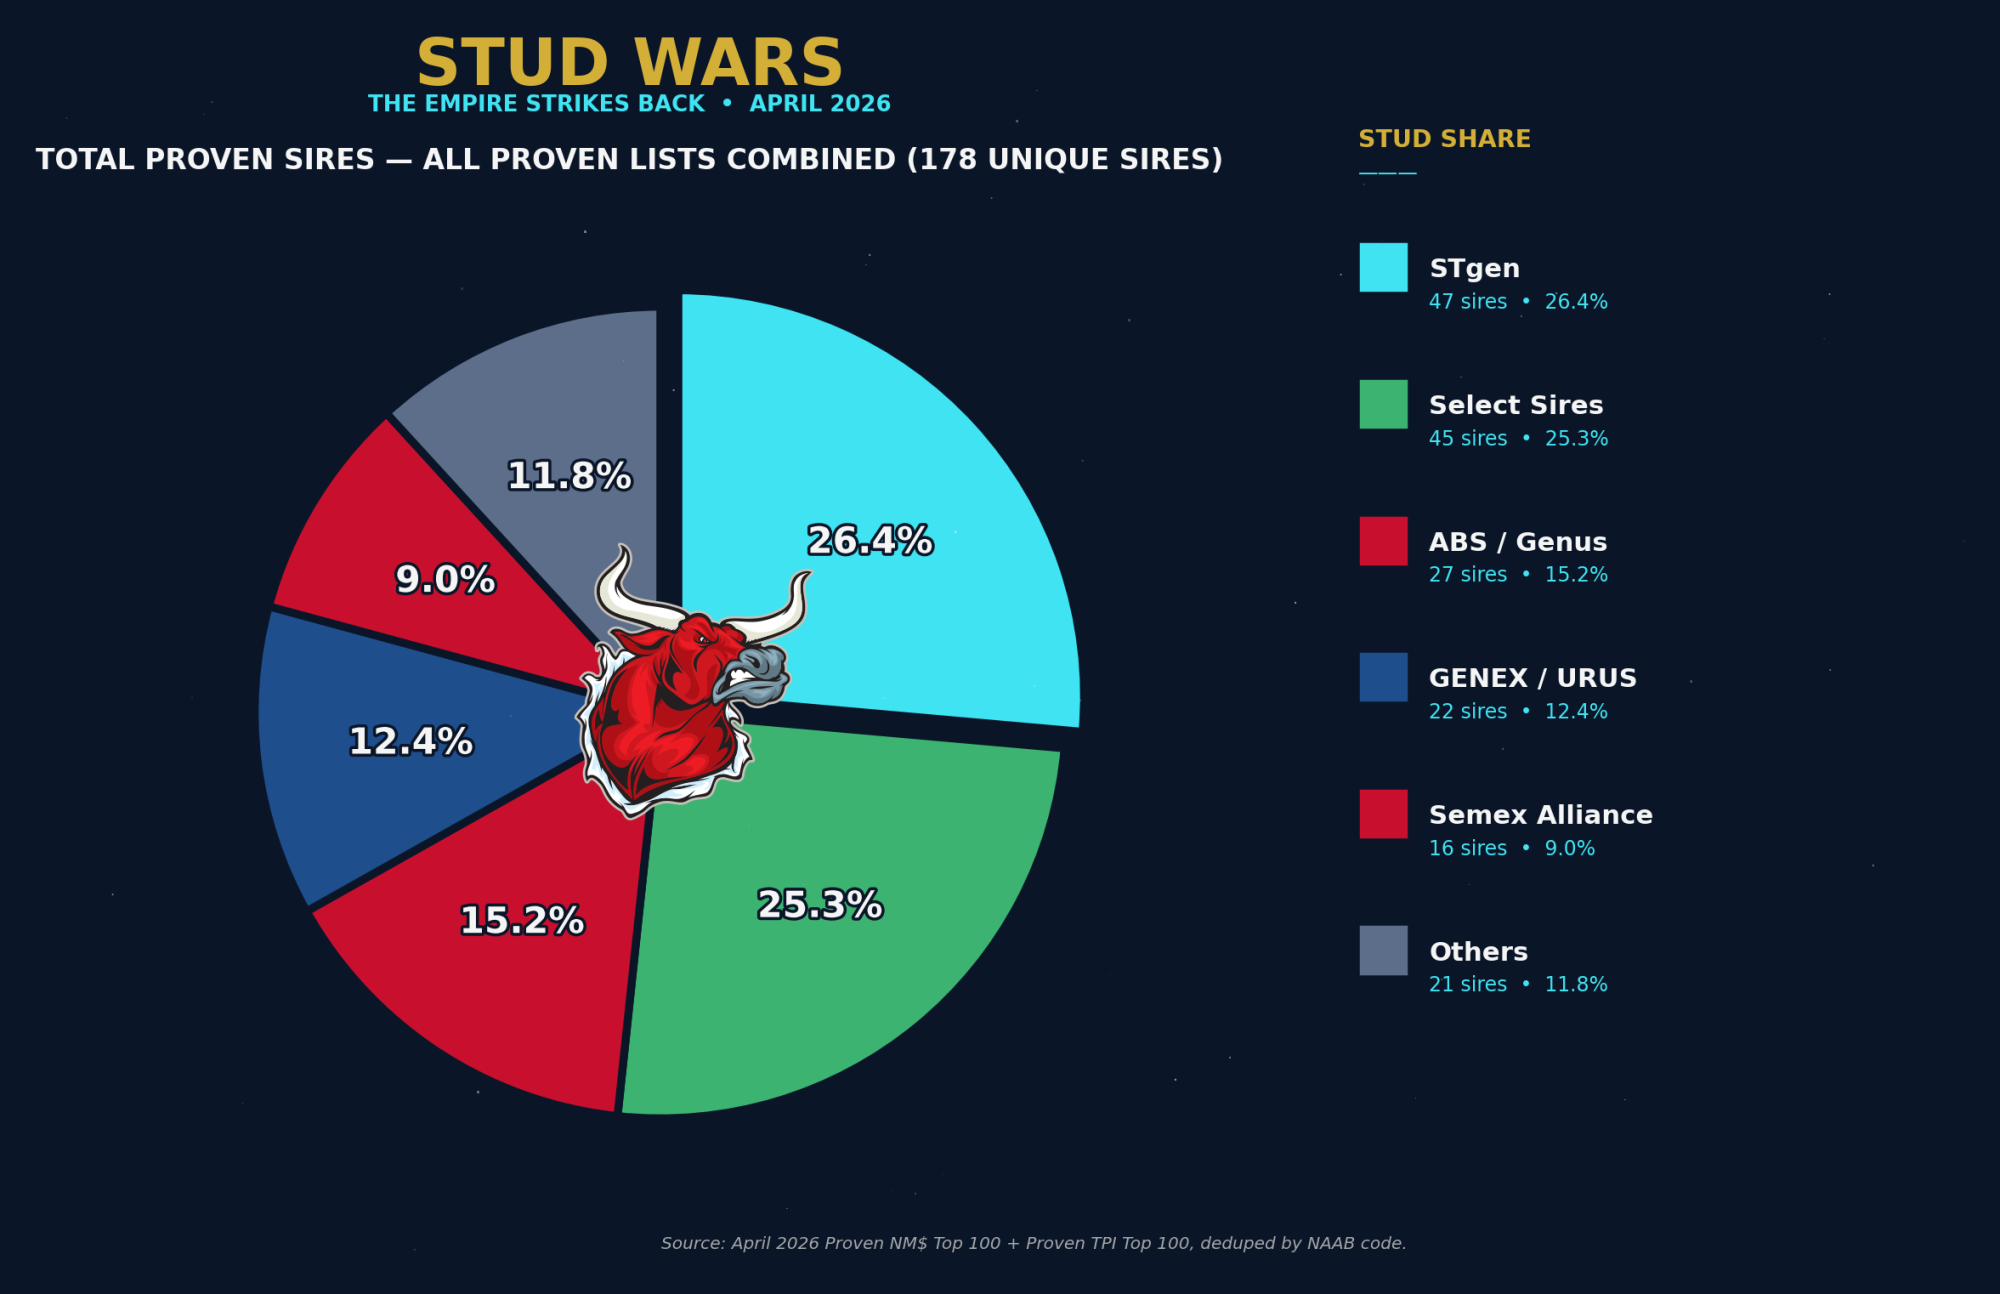
Total Proven Sires — All Proven Lists Combined (178 Unique Sires)
Stud
Combined count
% of 178 unique sires
STgen
47
26.4%
Select Sires
45
25.3%
ABS / Genus
27
15.2%
GENEX / URUS
22
12.4%
Semex Alliance
16
9.0%
Alta / URUS
13
7.3%
CRV
5
2.8%
Independents
3
1.7%
[CHART: Total Proven Sires — All Proven Lists Combined (178 Unique Sires), April 2026]
Proven sire counts — across both TPI and NM$ — are the most balanced in the entire article. STgen and Select Sires are within one bull of each other (47 vs 45). ABS, GENEX, and Semex all have meaningful proven depth. This is the category most resistant to consolidation pressure: proven sires take 5-7 years to develop, the pipeline can’t be acquired overnight, and four to five studs all have genuine elite proven inventory.
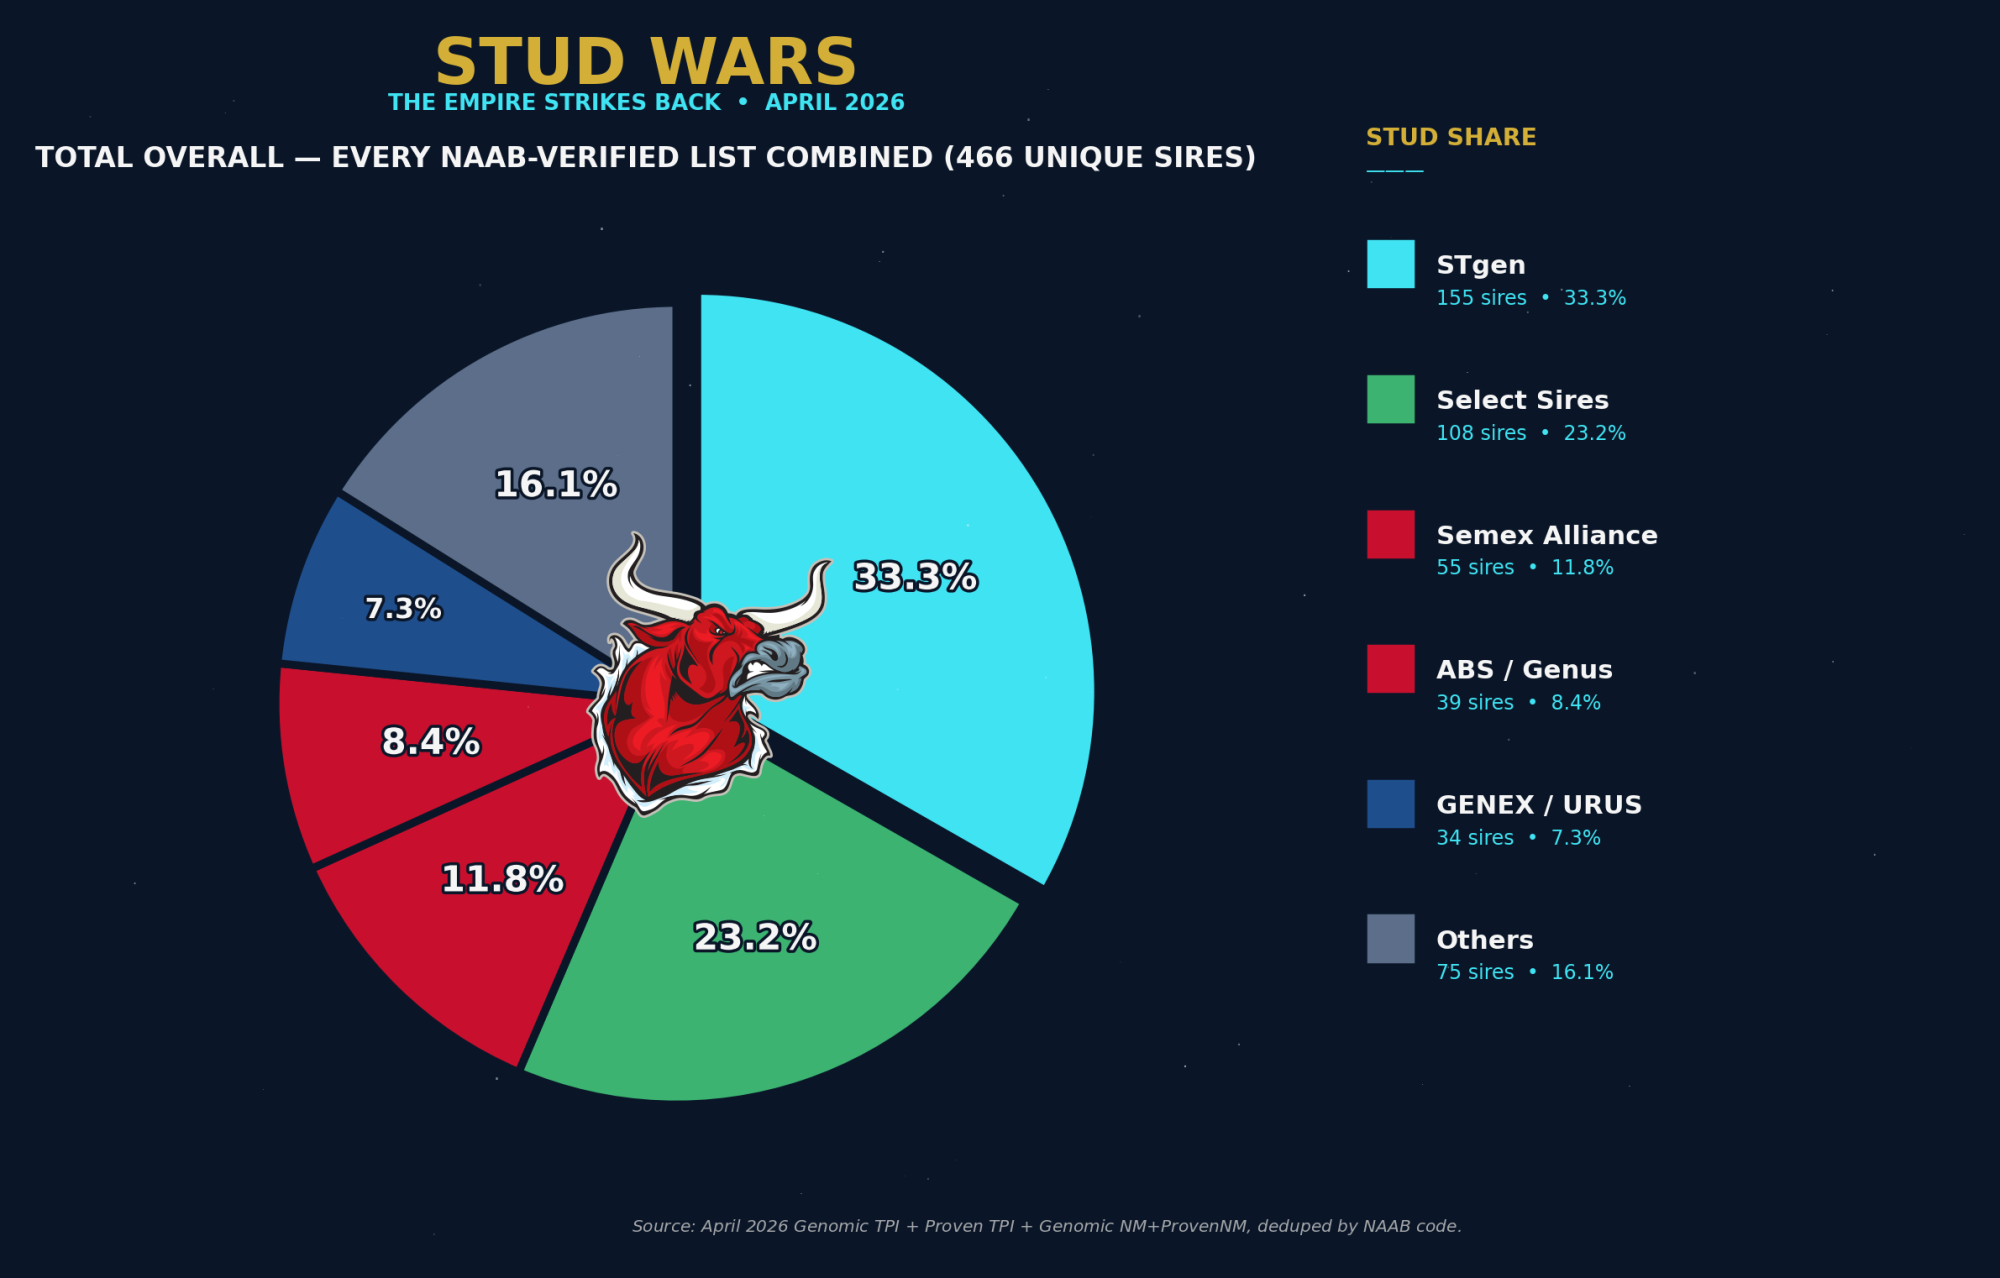
Total Overall — Every NAAB-Verified List Combined (466 Unique Sires)
Stud
Combined count
% of 466 unique sires
STgen
155
33.3%
Select Sires
108
23.2%
Semex Alliance
55
11.8%
ABS / Genus
39
8.4%
GENEX / URUS
34
7.3%
United Sires
30
6.4%
Alta / URUS
25
5.4%
CRV
13
2.8%
Independents
7
1.5%
This is the master scoreboard. Combine the Genomic TPI Top 200, Proven TPI Top 100, Genomic NM$ Top 100, and Proven NM$ Top 100 — dedupe everything by NAAB code — and you get 466 unique elite sires in the April 2026 evaluation. Of those, STgen owns 155 (one in three). Select Sires owns 108 (just under one in four). Together those two studs control 56.5% of the entire elite sire universe.
If the DOJ approves the merger, a single combined entity controls 56.5% of the elite Holstein sire population in North America — by deduplicated NAAB count, across every metric Holstein USA and CDCB rank. Every conversation about whether the merger is pro-competitive or anti-competitive starts with that number — but it’s not the whole story.
What the Rankings Don’t Tell You
We owe readers the second half of this conversation, because the rankings analysis above tells one true thing and is silent on a second, equally true one.
What the rankings tell you: who supplies the bulls that clear the elite-tier reliability and ranking thresholds Holstein USA and CDCB use to publish official lists. That’s a useful filter. If you’re looking for the deepest bench of high-NM$ genomic young bulls, the data says you go to STgen. If you’re looking for the broadest spread of TPI-ranked sires across both genomic and proven categories, you go to Select Sires.
What the rankings do not tell you: how many straws of semen each stud actually sells. And the gap between those two numbers is wider than most articles in our category admit.
The honest read — the one most stud-share articles avoid because it complicates the headline numbers — is that today’s farmers don’t buy semen on an index. They buy on minimum thresholds across multiple traits, then on price, then on relationships, then on what the rep happens to be selling that month. Index rank is a filter on the upstream side; it’s a smaller input to the downstream purchase decision than ranking articles like this one tend to suggest. Senior executives at every major U.S. stud will say that privately. Some will say it on the record. The structural argument is sound, and it’s been sound for at least a decade.
The 4,000-Bull Universe
NAAB’s 2025 year-end report — the official trade-association volume data — puts U.S. bovine semen production at just under 66 million units across all categories (NAAB 2025 Year-End Report, March 11, 2026). Holstein dairy semen alone accounts for roughly 13.8 million units, or 83.5% of total dairy units sold (dairynews.today summary of NAAB 2025).
At an industry-average of roughly 15,000 straws sold per active bull per year, doing the math says the U.S. Holstein semen market requires roughly 4,000 actively-selling bulls to produce that 60-million-unit volume. The Holstein USA Top 200 Genomic + Top 100 Proven combined represents 300 bulls. The combined NM$ Top 200 represents another 200 (with significant overlap to TPI). The full “NAAB-verified elite universe” we counted in the prior section — 466 unique sires — represents roughly 12% of the bulls that actually move semen in the U.S. market.
The other 88% — roughly 3,500 bulls — don’t appear in any of the rankings this article counts. They sell straws anyway, often in significant volume, into market segments the rankings don’t capture.
Twenty Sub-Markets, Not One
The U.S. dairy genetics market isn’t one market. It’s at least 20 sub-markets with overlapping combinations. Every farmer who has shopped a sire catalog already knows this. The rankings industry tends to flatten it:
Component-driven herds buying for fat and protein percentage
Type-focused herds buying for udders, feet, and frame regardless of TPI
Polled-only buyers paying premiums for heterozygous P/PP genetics
Sexed-conventional split decisions varying by parity and reproduction protocol
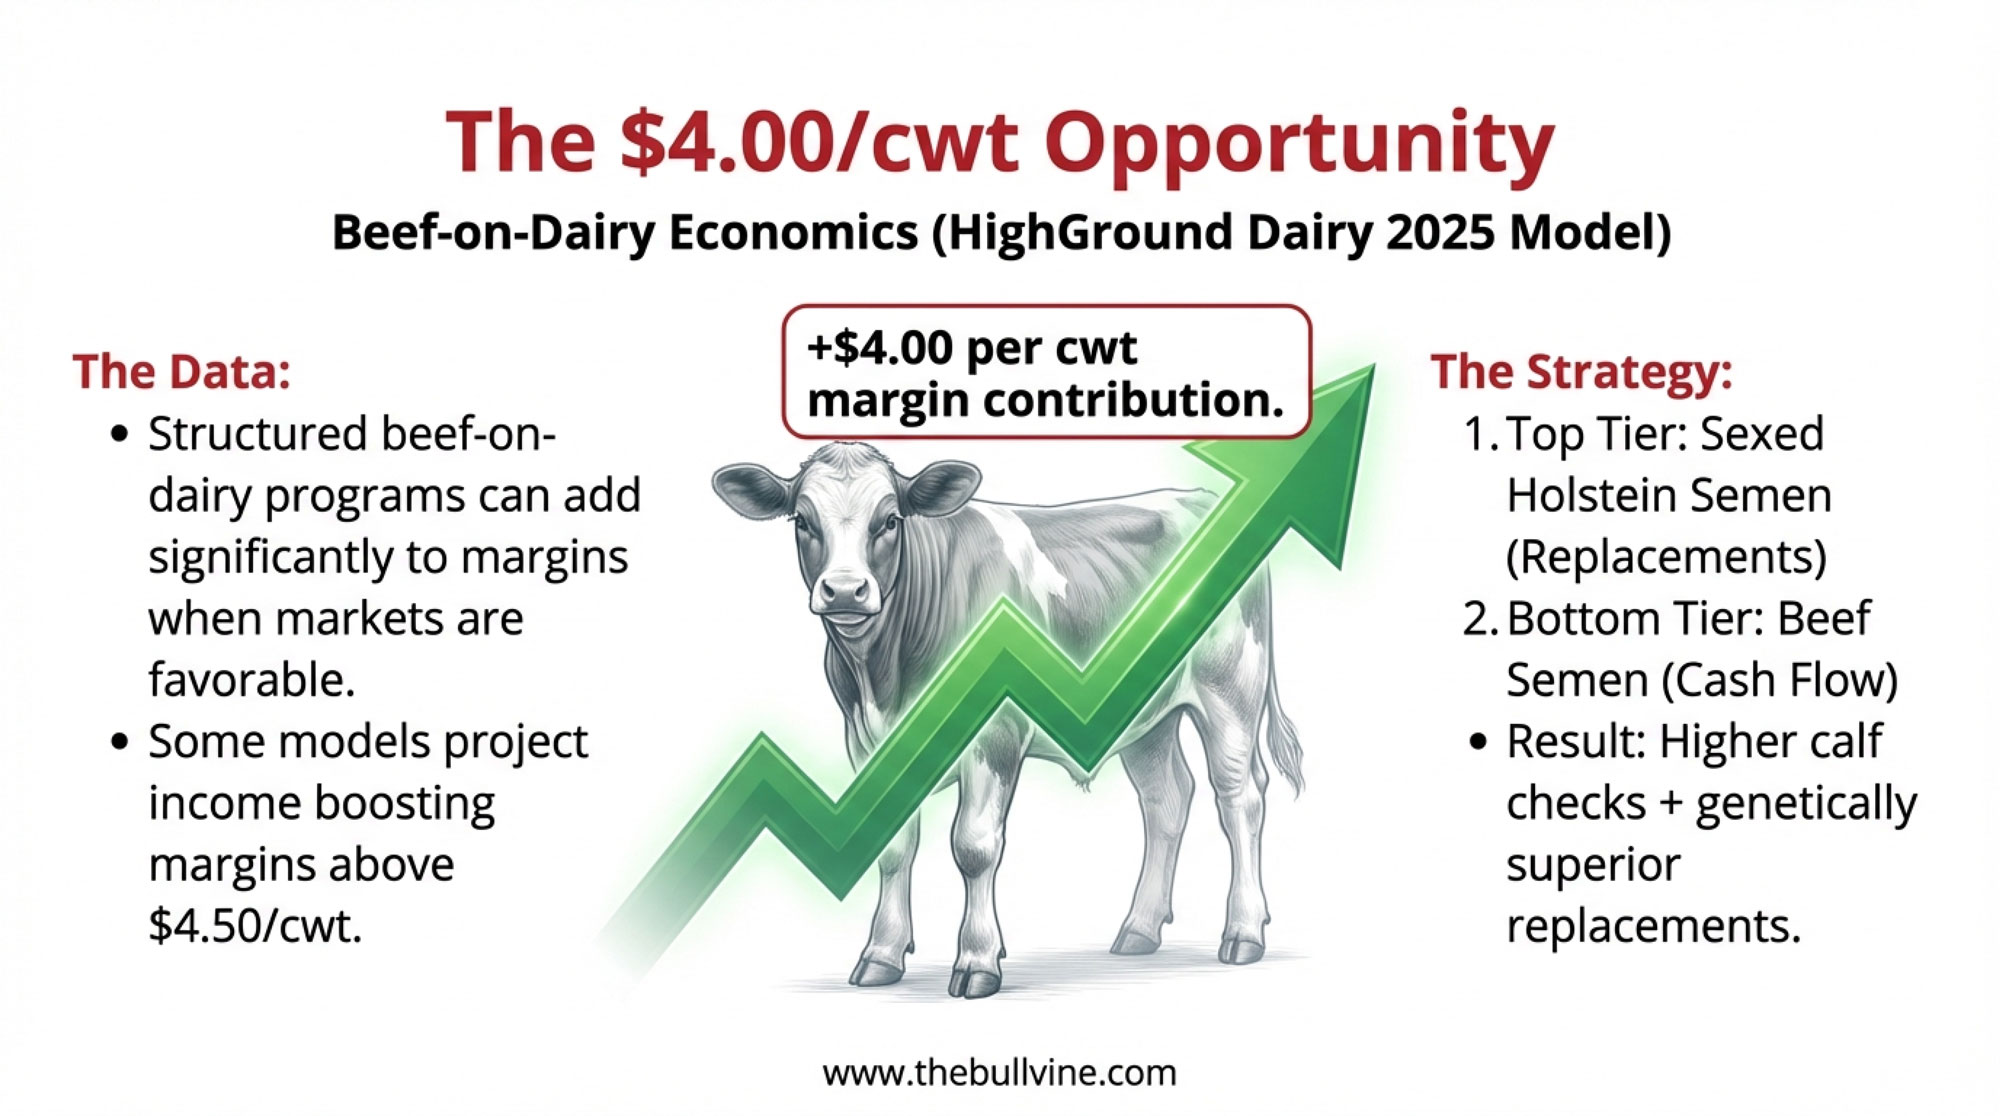
Beef-on-dairy programs filtering on terminal-cross profitability, not Net Merit
Geographic preferences — a Wisconsin component buyer and a California production buyer don’t shop the same sires
Each of those segments has its own minimum thresholds across multiple traits, its own price ceilings, and its own bull preferences. A bull ranked #50 on the genomic TPI list may be the wrong choice for 18 of those 20 sub-markets and the right choice for two. The rankings are a starting filter, not a buying decision.
Rank Doesn’t Equal Price (or Volume)
The price-list reality every commercial breeder has noticed but the rankings industry rarely addresses: the difference in semen price between a bull ranked #50 and a bull ranked #500 is, on most published stud price lists, pennies. Once a bull clears a buyer’s minimum thresholds — NM$ above some floor, PTA Protein above some floor, fertility and calving ease acceptable — price is determined more by the buyer’s price ceiling than by the bull’s rank. Studs know this. Buyers know this. The rankings industry rarely admits it.
The practical implication: a stud with 90% of the genomic NM$ top 100 does not have 90% of U.S. dairy semen market share. Not 80%. Not 70%. Not even 30%. STgen’s actual share of U.S. domestic dairy semen volume sits in the single digits by NAAB volume data, well below their 33.3% share of the deduplicated elite-rankings universe and dramatically below their 90% genomic NM$ concentration.
ABS Global is the cleanest counter-example. ABS holds roughly 6% of NAAB-verified elite genomic + proven counts (12 genomic top 200 bulls, 10 proven top 100 bulls) but commands a much larger share of actual U.S. straws sold than that ranking presence would suggest — driven by R&W depth (34% of the R&W TPI top 50), polled depth, beef-on-dairy programs, and decades of cooperative-distribution relationships with commercial herds. The rankings undercount ABS’s commercial footprint by a substantial multiple.
The Bigger Consolidation Story Sits at the Lab Level
The rankings analysis above counts bulls. The bull-distribution mergers in the next section reshuffle which studs sell which bulls. But the most consolidated structural shift in U.S. dairy genetics in 2025–26 is happening at a layer most articles in this category don’t even count: the genomic-test labs.
The Zoetis + Neogen GeneSeek merger consolidates the genomic-test infrastructure layer, not the bull-distribution layer. Neogen describes itself in its own filings as a “leader in U.S. beef and dairy genomics,” operating five labs serving 120+ countries with $90 million in annual genomics revenue (Zoetis-Neogen $160M deal coverage, March 2, 2026). Zoetis already operates the Kalamazoo, Michigan, genetics lab that processes a substantial share of CDCB-approved CLARIFIDE Plus tests.
CDCB does not publish lab-by-lab volume breakdowns publicly, so the post-merger Zoetis + Neogen share of CDCB-approved genomic-test volume isn’t independently auditable from open sources. Multiple senior industry executives we’ve talked to put the post-close concentration above 75% of U.S. CDCB-approved genomic test volume. We’re reporting that estimate as the directional industry view, not as a CDCB-published statistic. The directional case is supported by Zoetis’s stated Precision Animal Health strategy, Neogen’s self-description as the dominant U.S. genomics service provider, and the absence of any third CDCB-approved lab operating at comparable scale.
If the post-close concentration is even directionally in that range, the lab-pipe consolidation is a more concentrated structural shift than any of the bull-distribution mergers in this article. Every breeding decision driven by genomic data — whether the test is branded CLARIFIDE Plus, Igenity, GGP, or a breed association card — increasingly flows through one corporate parent’s lab infrastructure. The DOJ + Select Sires + STgenetics decision shapes who sells your bulls. The Zoetis + Neogen close in H2 2026 shapes who reads your DNA. The second is harder to escape than the first.
What This Means for How You Read This Article
Everything in the rankings tables above is verified, NAAB-coded, and accurately describes who supplies bulls that clear Holstein USA’s and CDCB’s elite-tier thresholds in April 2026. None of it tells you what straws are selling, where, at what price, to whom. The rankings are inputs to a small fraction of the buying decision. The actual U.S. dairy semen market is structured by component preferences, R&W demand, polled preference, beef-on-dairy economics, sub-regional buyer relationships, and price ceilings — and most of those signals don’t appear in any ranked list.
The studs who run the largest sire-summary marketing campaigns know this. The breed associations who publish the rankings know this. Now you know it too. Use the rankings as one filter among many, not as a proxy for who controls the market.
The Corporate Battlefield: Three Wars, One Year
Here’s where the April 2026 installment diverges hardest from any prior Stud Wars piece. The sire-share tables tell you who’s winning the bull selection war. The corporate tables tell you who controls the rules.
Battle 1: The DOJ Decision That Reshapes Everything
In August 2023, Select Sires (Plain City, OH) and Inguran LLC — better known as STgenetics — signed a letter of intent to combine production and R&D functions (Select Sires/STgen press release). The deal would marry STgen’s roughly 60 global sexed-semen sorting facilities and the patent-backed SexedULTRA 4M technology with Select Sires’ cooperative distribution to about 30,000 farmer-owners across 27 U.S. states.
The Biden DOJ shelved it. Antitrust concern: combining the dominant sexed-semen technology platform with the dominant cooperative farm-level distribution channel creates dual gatekeeping at both critical bottlenecks.
Then in July 2025, Select Sires’ annual report stated the organization was again pursuing the combination — “hoping for better chances with the second Trump administration” (Farm Progress, April 20, 2026; Beef Magazine, April 24, 2026).
As of April 2026, the DOJ is “nearing a decision.”
If the merger clears: the combined entity pairs the largest U.S. cooperative distribution network with the sexed-semen sorting technology behind roughly 30% of sex-selected semen sold globally. ABS keeps building IntelliGen, CRV keeps running its own sorting facility, and every other stud has to either license the combined entity’s sorting technology or develop independent sorting from scratch. Smaller cooperatives without access to either technology face a hard squeeze.
If the merger blocks again: STgen and Select Sires reach a strategic dead end. STgen has built sorting capacity ahead of demand it expected the merger to channel. Select Sires has been unable to acquire significant intellectual property of its own. Both organizations would need to find new strategic paths in a market where the cost-of-entry for sorting tech is climbing.
This isn’t an academic concern. The DOJ decision changes who can sell what to whom, at what cost, on what timeline, for the next decade. It’s the most consequential pending transaction in North American dairy genetics. And the call is coming.
Battle 2: Zoetis Buys the Pipes
On March 2, 2026, Zoetis Inc. announced a definitive agreement to acquire Neogen Corporation’s animal genomics business for $160 million (Neogen Investor Relations; The Bullvine).
That price — about 1.8× the unit’s annual revenue of roughly $90M — almost undersells what Zoetis is actually buying.
Neogen GeneSeek operates 5 genomic labs (U.S., Brazil, Australia, China, UK), serves customers in 120+ countries, and includes the Igenity and GGP platforms. These labs process DNA tests for AI companies, breed associations, public genetic evaluation systems, and farmers running parentage and genomic predictions. Many of those customers compete directly with Zoetis’s own CLARIFIDE Plus genomic test.
Post-close — expected second half of 2026, pending regulatory clearance — Zoetis owns:
The branded test product (CLARIFIDE Plus, DWP$)
The wellness index used to rank bulls (DWP$ — recently updated to add residual feed intake, methane, and heat resilience traits)
The lab infrastructure that processes competitor DNA
If you’re a breed association routing samples through GeneSeek labs, those labs are now owned by the company whose proprietary index (DWP$) competes with your association’s official rankings. If you’re a non-Zoetis AI company, the lab handling your young-bull screening and parentage tests just changed parents. If you’re a farmer on a Danone supply contract, the company that mandated your CLARIFIDE Plus testing also owns the lab pipeline behind it — same vendor, both ends.
This is the kind of structural move that doesn’t show up in NAAB volume tables but reshapes who has leverage at every contract negotiation for the next decade. No DOJ challenge has been announced. The deal is on track to close on Zoetis’s timeline.
Battle 3: The Gene-Editing Door Opens
On April 30, 2025, the U.S. FDA granted approval to Genus PIC’s PRRS-resistant pig (PIC press release; National Hog Farmer). On January 23, 2026, Health Canada and CFIA followed (PIC).
That’s the first FDA approval for a gene-edited food animal — period. Bigger context: Genus PLC went on to form an accelerated joint venture with Beijing Capital Agribusiness for PIC China (51% BCA / 49% Genus, formed January 31, 2026), receiving $160M in gross cash on the deal (Genus plc preliminary results; Vox Markets).
For dairy cattle genetics, the implications are direct:
The regulatory pathway works. The FDA “low-risk determination” framework is no longer theoretical. It’s been used.
The constraint on commercial gene-edited cattle is no longer FDA approval — it’s processor and retailer acceptance.
The Genus China JV structure is a working template for getting gene-edited livestock genetics into restricted markets.
Acceligen’s PRLR-SLICK heat-tolerant cattle got their FDA low-risk determination back in 2022 (FDA risk assessment). Brazil’s CTNBio approved gene-edited Holsteins in 2023, and commercial herds are in production. The UK Precision Breeding Act took full effect on November 13, 2025, covering livestock. The EU reached provisional agreement on its New Genomic Techniques regulation on December 4, 2025 — focused initially on plants, with livestock to follow.
For Stud Wars purposes: gene editing isn’t the stud-versus-stud fight yet. It’s the regulatory ceiling everyone’s waiting on. April 2025 to April 2026 is the year that ceiling started moving up.
The IVF Sub-War: URUS vs. Semex
While the headlines went to mergers and gene editing, Trans Ova Genetics (URUS subsidiary) and Boviteq (Semex subsidiary) executed parallel franchise-style IVF expansion campaigns through 2025 and into 2026. The independent IVF market is being divided between URUS and Semex on a country-by-country basis.
Operator
2025–2026 Moves
Trans Ova (URUS)
Acquired ReproLogix (Sept 2025); Quebec IVF lab with Evolygen (Sept 2025); Saskatchewan lab with Bovigen (Mar 2026); Ireland Extension Site with Target Genetics (Mar 2026); small-ruminant expansion with RSG (Mar 2026)
Boviteq (Semex)
Nosawa as Japan licensee (Jan 2025); Boviteq Arizona OPU/IVF lab at Arizona Dairy Co. (May 2025); Diamond Genetics as Netherlands partner (Feb 2026)
Vytelle, the largest non-aligned IVF player, hasn’t announced new funding in our research window but stayed active at CattleCon and rolled out its Vytelle.io data platform and ASSURE recipient screening tool (Vytelle). The independent IVF lane is narrowing.
On December 19, 2025, Semex purchased Semex Holland from Bles Dairies, effective December 31, 2025, adding direct distribution in the Netherlands, Denmark, and Belgium (Semex) — 2.6 million cows of new direct-distribution territory.
CRV (Dutch co-op) announced a 150-FTE restructuring on November 12, 2024, in response to projected decline in Dutch and Belgian dairy/beef cattle numbers (CRV). FY2024–25 results showed €3.8 million operating profit, recovering from a €4.2 million loss the prior year (CRV January 2026 update). On the bull side, CRV’s Terra-Calroy Zuri-ET sits at #5 in the Holstein USA proven top 100 — the only CRV bull in the global proven top 10.
VikingGenetics quietly executed two structural moves that won’t show up in NAAB stats for years: a direct U.S. subsidiary operationalized in 2025, and a first internal IVF lab at the Assentoft bull station in Denmark (VikingGenetics 2024 Annual Report). Total revenue €35.1 million; small absolute numbers, but structurally Viking is positioning for a direct-to-American-farmer model that bypasses traditional U.S. distribution. That’s not an Empire move. That’s a flanking maneuver.
The Volume Game: NAAB 2025 Numbers
Stud market share doesn’t pay anyone’s bills. Semen sales do. The NAAB 2025 year-end report (published March 11, 2026) shows the headline numbers North American studs are working with:
Metric
2025
YoY
Total U.S. bovine semen units
~66M
−4%
Total domestic dairy units
16.5M
+2%
Gender-selected dairy
10.6M
+6%
Gender-selected as % U.S. dairy AI
64%
+3 pts
Conventional dairy domestic
6.0M
−5%
Beef-on-dairy domestic
8.1M
0%
Heterospermic beef (pooled)
~2M
−28%
Total dairy exported
28.3M
−8%
Beef semen exported
5.5M
+13%
Total export value (record)
$327.6M
+0.6%
The story in those numbers: gender-selected dairy semen is now 64% of all U.S. dairy AI — up another 3 points in a single year and well past 60% as a permanent baseline. Beef-on-dairy looks saturated at 8.1M units, flat for two consecutive years, capped by farms unable to afford losing more replacement heifers. Heterospermic beef (pooled multi-sire) crashed 28% off its 2024 peak — the trial bubble has burst, and traditional sire-identified beef-on-dairy is reasserting.
Crucially, in February 2025, China effectively closed to U.S. semen exports through retaliatory tariffs (NAAB analysis cited in industry coverage). China was the #1 export market four years running. Total dairy exports fell 2.5 million units. Other markets and beef-semen growth absorbed the dollar value, keeping the export total at a record 7.6 million — but the volume hit landed on every major U.S. stud’s books.
For Stud Wars positioning, the volume story rewards three things in 2026: dominant sexed-semen production capacity, beef-on-dairy lineup depth, and meaningful non-China export reach. STgen has #1. Select Sires has #2. URUS and ABS are in #3 contention with growing IVF and beef-cross programs.
At-a-Glance: Where Each Stud Stands After April 2026
Stud (NAAB codes)
Genomic top 200
Proven top 100
Specialty position
Biggest 2025–26 catalyst
Select Sires (7, 14, 250)
29.5%(59/200)
23.0% (23/100)
Federation distribution; balanced TPI depth
DOJ decision on STgen merger
Semex Alliance(200, 777)
20.0%(40/200)
13.0% (13/100)
Progenesis/Beyond pipelines; 12% of Type top 50
Holland acquisition; Boviteq IVF expansion
United Sires(596, 796)
15.0%(30/200)
0.0% (0/100)
Independent breeder partnership founded 2024; Whoops/Howland-P pipeline
Emergence as 4th-largest genomic player in 18 months
STgen (523, 551)
13.5% (27/200)
36.0%(36/100)
Proven depth; gNM$ leadership
Pending DOJ + Select Sires merger; formula loss on TPI
ABS / Genus (29, 94)
6.0% (12/200)
10.0% (10/100)
R&W TPI 34% (17/50); 5 of top 10; De Novo pipeline
Genus FY25 +53% AOP; De Novo full takeover
Alta / URUS (11)
5.5% (11/200)
6.0% (6/100)
URUS Peak production line via Alta
Powerhouse +119 (carried by GENEX code)
GENEX / URUS(1)
4.5% (9/200)
4.0% (4/100)
URUS Peak production line via GENEX
Powerhouse #2 proven
URUS umbrella combined (Alta + GENEX)
10.0% (20/200)
10.0% (10/100)
Trans Ova IVF franchise; Genetics Australia JV
Powerhouse +119; Australia JV
CRV (97)
4.0% (8/200)
5.0% (5/100)
Terra-Calroy Zuri (#5 proven); data platform pivot
Restructuring; €3.8M profit recovery
ASCOL (288)
n/a (gTPI)
n/a (proven)
Type 30% (15/50); 3 of top 10 PTAT
Spanish breeder co-op dominates U.S. PTAT rankings
Independents
2.0% (4/200)
3.0% (3/100)
Niche specialty (proven: RuAnn 719, A.I. Total 515, Korea 208; genomic: El Toro 508/708, A.I. Total 515, Genesis MX 706)
RuAnn Karat #1 PTAT (+3.92); Cookiecutter Horseshoe at #8 proven
Zoetis (non-stud)
n/a
n/a
DNA lab + DWP$ + Danone
$160M Neogen GeneSeek deal
Acceligen / LIC / gene-edit
n/a
n/a
Regulatory watchers
Genus PRP FDA + Canada approvals
The Bullvine Bottom Line
This is the most structurally consequential Stud Wars installment we’ve published since the series started in 2013.
The TPI 24P/14F formula change cost STgen significant headline TPI position on the genomic young bull list and rewarded protein-tilted Select Sires, Semex, and URUS-affiliated lineups (Peak via both GENEX 1HO and Alta 11HO codes). But STgen’s proven army held — 36 of the top 100 proven TPI bulls still wear 551HO (STgenetics-Inguran). The Empire didn’t fall on the proven list. They got reshuffled on the genomic young bulls.
The DOJ decision on the Select Sires + STgen merger is the next domino. It will reshape U.S. sexed-semen access, cooperative leverage, and the cost-of-entry for every smaller stud and every farmer-owned organization for the next decade. Either outcome — clearance or block — locks the industry into a path with no easy reversal.
The Zoetis + Neogen GeneSeek transaction is the deal nobody outside genomics testing fully understood at the time. Owning the test, the index, the processor mandate, and the lab infrastructure simultaneously is a vertical lock. Neither the DOJ nor the FTC has signaled concern. That alone should worry breed associations, AI cooperatives, and farmers who care about who reads their genomic data.
The PIC PRRS-resistant pig FDA approval and Canadian clearance unlock a gene-editing pathway that cattle programs have been waiting on. Acceligen, LIC, ABS, and CRV all have programs in motion. Three to five years out, the bull catalog conversation could include polled, heat-tolerant, and disease-resistant edits — and the studs who positioned early will lead.
NAAB’s 2025 numbers tell the underlying market story. Sexed semen is 64% of U.S. dairy AI. Beef-on-dairy hit a saturation ceiling at 8 million units. China’s tariff closure took a 2.5 million unit chunk out of dairy exports. Total volume down 4%, total export dollars at record. Less semen, sold at higher prices, into more diverse markets.
The April 2026 run is the moment the genomic balance of power shifted. Semex took the genomic top 20 — 9 of the top 20 genomic young bulls in the world are 200HO. Select Sires owns the broadest genomic depth at 29.5% of the top 200. STgen still owns proven depth (36%) and gNM$ economics. United Sires — a brand-new breeder partnersip — captured 15% of the genomic top 200 in 18 months from a standing start. The IVF map is being redrawn weekly. And the corporate rules of the game are about to be rewritten by the DOJ and Zoetis, not by anyone breeding bulls.
Last April’s run was a New Hope. This April’s is the Empire striking back — not at any single bull or breeder, but at the genomic insurgency itself, through formula changes, mergers, and a vertical lock on the lab pipes. STgen’s army held the proven floor. The corporate empire is positioning to define every contract negotiation, every lab routing decision, and every cooperative’s leverage for the next decade.
And the rankings that everyone in this article has been counting? They’re a useful filter for who supplies elite-tier bulls. They’re not a measure of who sells the straws. STgen owns 90% of the genomic NM$ top 100 and a single-digit share of U.S. domestic dairy semen volume. ABS has a 6% ranking presence and a much larger commercial footprint than that suggests. The 4,000-bull selling universe is shaped by 20-some sub-markets, minimum-threshold buying, and price ceilings the rankings don’t capture. The studs know it. Now readers know it too.
In the immortal words of Yoda: “Always in motion, the future is.” Especially when Holstein USA changes the formula, the DOJ wakes up, and Zoetis writes a $160 million check.
May the Force — and a sharp eye on stud share — be with you.
What This Means for Your Operation
Re-rank your active sire list against the 24P/14F formula. Bulls you trusted on TPI in December 2025 may be 50–125 points lower in April 2026 with no daughter data shift. If your mating program drives selection from a TPI cutoff, reset the threshold or risk over-narrowing or over-widening your bull list.
Audit your single-source dependencies before the corporate rules change. Whether the Select Sires + STgen merger clears or blocks, the industry’s structure in 2027 will be meaningfully different. If you’re locked into single-source semen supply or single-source genomic testing, build optionality now.
Watch the Zoetis–Neogen close in H2 2026. If you’re on CLARIFIDE Plus, a Danone supply contract, or any breed-association DNA test routed through GeneSeek labs, your genomic data is moving to a single corporate owner. Know who reads your DNA.
Key Takeaways
24P/14F formula reshuffled the entire genomic deck: Garza −125 TPI, Sheepster −92, Captain −72, all without daughter changes. Powerhouse +119 became the run’s signature winner.
Type (PTAT) top 50 verified counts: ASCOL 15 (30.0%), STgen 7 (14.0%), Semex 6 (12.0%), A.I. Total 5 (10.0%). RuAnn Karat-45955-ET is the #1 PTAT bull at +3.92.
Red & White TPI top 50 verified counts: ABS/Genus 17 (34.0%), STgen 10 (20.0%), Select Sires 8 (16.0%), Semex 4 (8.0%). Denovo 21873 Okafor-Red-ET tops R&W at +3194 TPI — a De Novo (ABS) bull.
Genomic NM$ top 100 — STgen owns 90 of 100 sires (90.0%): Select Sires 4, GENEX/URUS 3, Semex 2, Alta/URUS 1. The single most concentrated category in the entire analysis.
Proven NM$ top 100: STgen 29 (29.0%), Select Sires 22 (22.0%), GENEX/URUS 18 (18.0%), ABS/Genus 17 (17.0%), Semex 7 (7.0%), Alta/URUS 7 (7.0%) — the most balanced category.
Total Overall (466 unique elite sires across all 4 NAAB-verified lists): STgen 155 (33.3%), Select Sires 108 (23.2%), Semex 55 (11.8%), ABS/Genus 39 (8.4%), GENEX/URUS 34 (7.3%), United Sires 30 (6.4%), Alta/URUS 25 (5.4%). Combined STgen + Select Sires = 56.5% of the entire elite sire universe.
United Sires LLC — a breeder-owned independent partnership founded in 2024 (596/796 NAAB codes) — captured 15% of the genomic top 200 from a standing start. Largest emergent player of the year.
STgen still owns the proven floor: 36 of the top 100 proven TPI bulls. Even with Garza, Captain, Dominance taking formula hits, the depth held.
Cookiecutter Horseshoe at #8 proven is registered under the 208HO Korean code as primary, but commercially distributed in North America via Semex (200HO/777HO secondary codes).
DOJ decision on Select Sires + STgenetics merger is imminent and will define 2027–2030 industry structure.
Zoetis paid $160M for Neogen GeneSeek — controlling test, index, processor mandate, and lab pipes simultaneously. Closes H2 2026.
NAAB 2025: sexed dairy at 64% of all dairy AI; beef-on-dairy flat at 8.1M units; China tariff closure cost ~2.5M dairy units of exports.
Methodology Note
All April 2026 stud-share figures are independent counts of official Holstein Association USA April 2026 evaluation lists, drawn from the official CDCB run published April 7, 2026 (CDCB). NAAB-code-to-stud assignments follow the official NAAB marketing codes table as the source of truth.
Specialty Type (PTAT) and Red & White TPI counts are independent NAAB-code counts of the April 2026 ranked top-50 PTAT and R&W bull lists, which are curated from the same Holstein USA April 2026 evaluation as the headline gTPI/proven lists but isolate the type and R&W subsets.
Genomic NM$ Top 100 and Proven NM$ Top 100 counts are independent NAAB-code counts of the official CDCB April 2026 high-ranking bull lists sorted by Net Merit. Combined-category totals (Total NM$, Total TPI, Total Genomic Sires, Total Proven Sires, Total Overall) are produced by deduplicating across each component list by NAAB code so a sire that appears on multiple lists is counted exactly once.
Polled gTPI, polled NM$, and Jersey JPI ranked lists weren’t available in the same downloadable format this run; standalone polled and Jersey stud-share tables are held until bull-by-bull verification is possible rather than relying on stud self-reports.
Key NAAB code → stud assignments used in this analysis: 1 = GENEX Cooperative; 7/9/14/250 = Select Sires; 11 = Alta Genetics USA; 29/94 = ABS Global; 97 = CRV Holding; 200/777 = Semex Alliance; 288 = ASCOL; 523/551/558/646 = STgenetics-Inguran (Sexing Technologies / Genosource collapse to a single STgen entry); 596/796 = United Sires LLC (independent breeder partnership founded 2024, no STgen relationship); 599/799 = Blondin Sires; 719 = RuAnn Genetics. Where bulls have multiple secondary codes (e.g., Cookiecutter Horseshoe primary 208 with secondary 200/777), the primary code is used for stud assignment.
The URUS umbrella encompasses Alta Genetics (11HO), GENEX Cooperative (1HO), Jetstream Genetics (534/634/664/734), Trans Ova Genetics (264), and VAS data services. We report Alta and GENEX separately at the official NAAB level and consolidate as “URUS umbrella” where editorially useful.
April 2025 baselines as published in the original Stud Wars: April 2025 used a less-rigorous methodology that lumped breeder-affiliated codes together. Year-over-year comparisons in this article have been made cautiously and are noted where the methodology has tightened.
National averages may not reflect your region or operation. Have data we got wrong? Email editor@thebullvine.com
Every week, thousands of producers, breeders, and industry insiders open Bullvine Weekly for genetics insights, market shifts, and profit strategies they won’t find anywhere else. One email. Five minutes. Smarter decisions all week.
Keigo Miwa and RESPECT HOLSTEIN of Gunma Prefecture captured their first Grand Champion title with the Hancock daughter.
RESPECT Lattes Hancock delivered a breakthrough win for Keigo Miwa and RESPECT HOLSTEIN of Gunma Prefecture, Japan, taking Grand Champion honors at the Central Japan Holstein Show.
The Hancock daughter started the day by winning the Five-Year-Old class. From there, she was named Senior Champion, then rose again to claim Grand Champion of the show.
For Miwa, it marked a first Grand Champion honor. That matters. In a show ring built on years of breeding decisions, daily work, and the nerve to bring one out when she is ready, first-time wins hit differently.
Lattes Hancock had the kind of day breeders chase. She moved from class winner to division champion to the final slap with no wasted steps. Mature cow power still counts, and this result proved it.
The show was evaluated by the Fukuya brothers. Hideto Fukuya of Elm-Lane Holsteins, Eniwa, Hokkaido, served as official judge, while Shigeo Fukuya of ST Genetics Japan, Obihiro, Hokkaido, served as associate judge. Both men previously trained at Indianhead Holsteins, adding another international layer to a Japanese show-ring result with deep global pedigree ties.
And the pedigree backs up the moment.
RESPECT Lattes Hancock is sired by Hancock and traces through Goldsun, Doorman, Godfrey Latitude Rose, Lightening, Gibson, Budjon-JK Encore Elegant EX-92-USA, and Krull Broker Elegance EX-96-USA GMD DOM.
That is not just a string of names. It is a maternal line with real show-ring gravity. The Elegance family has long been associated with the kind of dairy strength, frame, balance, and udder quality that still shows up when the championship banners are on the line.
For RESPECT HOLSTEIN, this was more than a good show. It was a statement win.
Show Highlights
Grand Champion: RESPECT Lattes Hancock Exhibitor: Keigo Miwa, RESPECT HOLSTEIN, Gunma Prefecture Class: First Place Five-Year-Old Division: Senior Champion Sire: Hancock Official Judge: Hideto Fukuya, Elm-Lane Holsteins, Eniwa, Hokkaido Associate Judge: Shigeo Fukuya, ST Genetics Japan, Obihiro, Hokkaido
Pedigree
RESPECT Lattes Hancock Hancock x Goldsun x Doorman x Godfrey Latitude Rose x Lightening x Gibson x Budjon-JK Encore Elegant EX-92-USA x Krull Broker Elegance EX-96-USA GMD DOM
Congratulations to Keigo Miwa, RESPECT HOLSTEIN, and all exhibitors at the Central Japan Holstein Show.
The Sunday Read Dairy Professionals Don’t Skip.
Every week, thousands of producers, breeders, and industry insiders open Bullvine Weekly for genetics insights, market shifts, and profit strategies they won’t find anywhere else. One email. Five minutes. Smarter decisions all week.
Pierre Boulet and Mike Berry’s “Booster” cow earns the easiest tap of the day as JP Charest rewards mammary quality, dairy strength, and rib openness from start to finish.
Grand Champion — Jersey. Lone Pine Jordan Booster celebrates the tap from Judge Jean-Philippe Charest at Expo Printemps 2026 in Victoriaville, owned by Pierre Boulet and Mike Berry. First-place 5-Year-Old and Best Udder of her class, she was — in Charest’s own words — “probably one of the easiest decisions of the day.”
If JP Charest told the crowd once, he told them five times: when this 5-year-old walked into the ring, the day was over. Lone Pine Jordan Booster, owned by Pierre Boulet and Mike Berry, was named Grand Champion of the 2026 Quebec Spring Jersey Show on Thursday, April 16, in Victoriaville — and Charest didn’t try to hide that she was, in his own words, “probably one of the easiest decisions of the day”.
A field of 117 Jerseys (88 junior, 29 senior) came through the ring in front of Charest, with Maryse, Marie-Eve and Martin Veronneau as ring masters. The day belonged to Booster, but the supporting cast — Top Gene, Homeridge, Lahetriere, Dulet — all left Victoriaville with banners worth bragging about.
Booster Was Never in Doubt
Charest pulled five exceptional cows for the Grand Champion drive, and he made his reasoning plain: Booster had the udder he wanted, the openness through the rib he wanted, and the dairy strength to win it from any angle. He gave her the nod over Intermediate Champion Top Gene Dubelmont Kandju Two on a “little bit more definition to that crease” and a rear udder that sat “a little bit higher and wider.” Over the mature cow in honorable mention, Cliric Victorious Crest, he praised Booster’s added milk, added width, and openness through the ribs — while tipping his cap to a Crest cow that “stood the test of time.”
Honestly, the whole drive felt like a coronation. Booster also won Best Udder of the 5-year-old class, and her win pushed Pierre Boulet (a fixture in Quebec Grand Champion conversations) onto the championship line twice — Grand with Booster, Honorable Mention with Crest.
The Intermediate Pull: Top Gene Runs Away with It
Intermediate Champion & Reserve Grand Champion — Jersey. Top Gene Dubelmont Kandju Two takes the tap from Judge Jean-Philippe Charest at Expo Printemps 2026 in Victoriaville. A fall 2-year-old owned by Stéphane Marceau, Marie St-Cyr, Marie Claire Girod and Select Jersey, she swept her class with first, Best Udder, and Best Bred & Owned before Charest called her a “pretty handy winner” in the intermediate drive.
The Intermediate Championship belonged to Top Gene Dubelmont Kandju Two, the fall 2-year-old owned by Stéphane Marceau, Marie St-Cyr, Marie Claire Girod and Select Jersey. She came in already wearing three banners from her own class — first, Best Udder, and Best Bred & Owned — and Charest called her a “pretty handy winner,” pointing to the open rib, the width through her parts, and a mammary system “with quality and vein” that put her over the senior 3-year-old in reserve.
That Reserve Intermediate Champion, Homeridge Channing Beaconess of Ferme Day Break, won the senior 3-year-old class on frame, panister rib, and chest width. Charest gave the slight edge to Top Gene on dairy character and bone refinement, but admitted Beaconess wasn’t far off.
Sugar Hill Kamakazi Mason — the winning winter 2-year-old for Gary & Maureen Bowers and Lencrest de la Vallée — picked up Honorable Mention Intermediate. Charest noted she had a tighter front and rear rib than Top Gene, but said the cow “has a great future” thanks to her udder.
Junior Champion: Lahetriere Lightning Eloise Edges a Tight Pull
Junior Champion — Jersey. Lahetriere Lightning Eloise gets the tap from Judge Jean-Philippe Charest at Expo Printemps 2026 in Victoriaville. The fall yearling — bred and owned by Ferme de l’Hétrière — topped her class and edged a tight five-heifer drive on clean leg structure and dairy quality.
Charest brought five heifers into the Junior Champion drive and called the top two “really tough to separate.” In the end, Lahetriere Lightning Eloise — the November-born fall yearling bred and owned by Ferme de l’Hétrière — took the tap. Charest leaned on her Hawk flexion, her straighter rear leg set, and her overall dairy quality.
Reserve Junior Champion went to Morastar Chocolate Baby of Hy-Haven Genetique, with Charest noting she showed “a bit more pop” through her rib structure than the spring yearling honorable mention. Boutch Bright Storm (Charles-Antoine Bouchard & Hy-Haven Genetique) — already wearing the Junior Honorable Mention ribbon from her class — rounded out the championship trio.
The junior pull capped a strong morning of heifer classes. The fall calf class produced Roggua Mr Bright Sassya for Ferme Roggua as the winning bred & owned heifer, while Oakriver Joel Miranda Lambert topped the deeper fall heifer class for Ferme Mibelson, Ferme Jean-Paul Petitclerc et Fils, and Jenna Eden.
Day Break Owns the Senior Banners. Hétrière and Dulet Own the Junior Side.
If you want a quick read on which programs are firing on all cylinders right now, look at the banner tally:
Senior Premier Breeder & Premier Exhibitor: Ferme Day Break (Homeridge prefix), 132 exhibitor points and 126 breeder points — comfortably clear of Ferme de l’Hétrière (94 / 73) and Ferme Monten (39) / Ferme Dulet (45).
Junior Premier Exhibitor: Ferme de l’Hétrière, with Ferme Mibelson and Ferme Dulet rounding out the top three.
Junior Premier Breeder: Ferme Dulet (Suzanne Ouellet & Francis Dumais), edging Ferme de l’Hétrière (Stephanie Jobin) and Roggua (Rachel Guay).
Day Break also took the senior Breeder’s Herd — and Charest lingered on it, saying the trio had “incredible mammary systems” and was the kind of group that “could have taken on competition” if anyone had answered the bell.
Best Bulls of the Day
Junior: Du Lait Mr Bright (46 points) over Avonlea Choco Chip (35) and Du Lait Goldorak (28).
Senior: River Valley Victorious (98 points) — a runaway — over Rejebel Barnabas Channing (58) and Avonlea Choco Chip (55).
Du Lait Mr Bright stamping the top of the junior list lines up with what the heifer classes showed. His daughters were everywhere on Saturday, and Roggua’s Mr Bright Sassya leading the winter calf class — bred and owned — only adds to the case.
What This Show Tells Us
A few things stood out from the rail:
Pierre Boulet remains the man to beat in mature Jersey classes. Grand Champion with Booster, HM Grand with Crest, and a 2nd in the spring 2-year-old class with Pierstein Boomerang Sweety. Three different partnerships, three different cow families, all in championship contention.
Ferme Day Break’s Homeridge program is in a deep, deep groove. Senior Breeder Banner, Senior Exhibitor Banner, the senior Breeder’s Herd, Reserve Intermediate Champion, plus first place wins in the 2-year-old spring class (Channing Honey, also Best Udder), the junior 3-year-old (Chococchip Lisa, Best Udder), and the 5-year-old class right behind Booster. That’s stacked.
Charest was consistent all day. Open ribs. Dairy character. Rear udder height and width. Bone quality. Cleanliness through the head and neck. He rewarded the same traits in a fall calf as he did in a 5-year-old, which is exactly what you want to see from an evaluator.
The Lahetriere prefix is stacking depth in the heifer ring. Junior Champion, Junior Exhibitor Banner, multiple class winners — Stephanie Jobin’s program is breeding the kind of females other programs are buying.
JP Charest closed the day the way he opened it — by thanking exhibitors, his wife Maryse for serving as his ring steward, his kids Louis and Juliette ringside, his family and uncle holding the fort, and the Expo Printemps committee. Then he summed the day up cleanly: “We got five exceptional cows that exemplified the Jersey breed, and how strong it is in Quebec.”
Hard to argue with that.
CHAMPIONS — JERSEY
Award
Animal
Owner
Grand Champion
Lone Pine Jordan Booster (1st 5-yr-old, Best Udder)
Pierre Boulet & Mike Berry
Reserve Grand Champion
Top Gene Dubelmont Kandju Two (1st fall 2-yr-old, Best Udder, Best Bred & Owned)
S. Marceau, M. St-Cyr, M.C. Girod & Select Jersey
HM Grand Champion
Cliric Victorious Crest (1st mature cow, Best Udder)
Net Merit told you to push fat. Canada’s LPI just told producers to pivot to protein. Your 2021 sire picks freshened this spring — and they won’t leave the herd until 2029.
Executive Summary: A 500-cow Western cheese herd whose protein-to-fat ratio has drifted from 0.82 to 0.77 is giving up $67,000 to $182,000 per year in component revenue — and the sire picks that created the mismatch won’t cycle out of the milking string until 2029. CoBank’s April 2026 analysis declared the U.S. “structurally short on protein and long on butterfat,” a shift driven by a decade of FMMO signals and NM$ weightings that rewarded maximum fat production. The NM$ 2025 revision deepened it: CDCB bumped fat’s index share to 31.8% and cut protein to 13.0%, right as CME spot butter crashed from $2.44 to $1.50/lb in fifteen weeks. Canada read the same global data and went the opposite direction — Lactanet’s April 2026 LPI revision shifted production weighting to 60% protein. The margin squeeze hits hardest at cheese-market herds where plants discount excess fat and pay up for protein, pushing well-managed operations toward or below Penn State’s $7.41/cow/day IOFC breakeven. Breeding changes made this spring won’t produce fresh heifers until late 2028, so your immediate move is pulling DHIA records, graphing your P: F trend, and demanding a protein-first custom index from your AI rep — not another NM$ top-10 list.
Butter fell from $2.44/lb to $1.50/lb in about fifteen weeks during late 2025, according to CME spot trading data. That drop hit right when holiday demand should’ve kept prices propped up, and it exposed a brutal truth for Western cheese herds: a decade of breeding for maximum butterfat now clashes with a market that’s paying you for protein.
For a 500‑cow Western cheese herd that looks like a lot of component herds in Idaho and the Central Valley, that shift isn’t theoretical. At late‑2025 component prices, it translates to roughly $130 to $190 per cow per lactation in forgone protein revenue, depending on which month’s protein price you use. Those daughters are already fresh. No breeding decision you make this spring will meaningfully affect your bulk tank before late 2028.
The Sires You Picked in 2021 Just Freshened
Here’s how the biology works. A heifer born in early 2024 — conceived from matings made in mid‑2023, using bulls selected off 2021–2022 proof runs — is freshening right now at 23 to 24 months of age. She’s the physical output of decisions made when CME butter traded above $2.80/lb, and every AI catalog, co‑op meeting, and genetics rep pointed in the same direction: fat is money.
That wasn’t wrong at the time. FMMO component pricing passed those strong butter values directly into milk checks, and Net Merit reinforced the signal. But the timeline is cruel. By the time that heifer calves and starts shipping milk, the market she was bred for has already moved on. Butter’s trading $1.75 to $2.00/lb. Protein is pulling your milk check. And she’ll be in your herd for three to four more lactations before she leaves.
Cara Murphy at HighGround Dairy was among the first analysts to publicly flag the divergence. By late August 2025, HighGround was tracking a CME spot butter market that fell roughly $0.45/lb over the month — about an 18% decline from early‑month levels. CoBank’s September 25, 2025, report, co‑authored by Corey Geiger and Abbi Prins, carried a title that read like a warning label: “While U.S. Leads Milk Component Growth, Butterfat May Be Growing Too Fast”. Geiger put it plainly: “For 10 years, the market couldn’t supply enough of it, and now there’s an oversupply — it’s almost too much of a good thing”.
By then, the genetics were settled.
The Index That Told Everyone to Double Down
The comforting story is that the index had your back. The reality: it pushed you further into the problem.
The Net Merit 2025 revision — designed by Dr. Paul VanRaden at USDA’s Animal Genomics and Improvement Laboratory and implemented through CDCB on April 1, 2025 — recalculated economic trait weights using trailing prices from the fat‑boom years. The result: NM$ 2025 increased butterfat’s share of the index from 28.6% to 31.8%and cut protein’s share from 19.6% to 13.0%. CDCB highlighted the 0.992 correlation with the previous version as a success, promising “little reranking”.
That’s the inertia of the index. By the time a lifetime‑profit index gets revised on several years of trailing prices, it’s basically a rear‑view mirror tool being used to drive a high‑speed vehicle. It smooths out noise — and locks in yesterday’s market. That’s not a design flaw if you treat NM$ as one input among many. It becomes a problem when it’s the only filter you use in a market that just repriced butterfat by roughly 40% in a single quarter.
Canada went the other way.
U.S. vs. Canada: Same Data, Opposite Signal
Feature
U.S. (NM$ 2025)
Canada (LPI April 2026, Holstein)
Fat Weighting
Increased to 31.8%
Decreased to 40% (from 60%)
Protein Weighting
Decreased to 13.0%
Increased to 60% (from 40%)
Market Signal
“Stay the course on fat.”
“Hard pivot to protein.”
Lactanet’s April 2026 changes to LPI production weights were a direct response to new component pricing in Canada’s supply‑managed system. The Canadian Dairy Commission told producers at a February 25, 2026, session to stop pushing butterfat relative to protein and to rebalance their solids. Western Canada shifted pool pricing from 85% fat / 10% protein to 70% fat / 25% protein, effective April 1, 2026, while the P5 eastern provinces restructured their own component pay with a heavy emphasis on achieving a solids‑non‑fat‑to‑butterfat ratio of 2.2 or higher.
Same global demand story. Two very different signals. One system told you to pivot toward protein. The other told you to double down on fat.
How Much Does the Genetic Lag Really Cost Per Cow?
Walk through it with barn numbers. Take a 500‑cow Western cheese herd averaging 90 lb/day and testing at 4.25% fat. At a protein‑to‑fat ratio of 0.82, that herd produces about 3.49% protein. At 0.77, it’s closer to 3.27%. You’re talking roughly 0.19 to 0.22 lb less protein per cow per day, depending on your exact test.
Running the Numbers — 500‑Cow Herd, 2025–26 Prices.
Lost protein per cow per day: ~0.19–0.22 lb (P: F 0.82 vs 0.77 on 4.25% fat at 90 lb/day).
Protein value (Class III component price, October 2025 per USDA AMS): $2.8761/lb.
Daily revenue gap per cow: 0.20 × $2.88 ≈ $0.58.
Per 305‑day lactation: ~$176 per cow.
Annual herd‑level impact (500 cows): ~$88,000.
At January 2026’s lower protein price (~$2.18/lb), that same 0.20 lb gap is roughly $0.44/cow/day — about $134/cow per lactation, or ~$67,000 for 500 cows.
If your plant is also discounting excess fat above standardization targets, the gap can push toward $1.00/cow/day, or roughly $182,000/year, once you account for both lost protein revenue and fat that isn’t being fully valued.
There’s a feed‑efficiency angle here too. High‑fat milk generally comes with a higher metabolic demand. When butterfat is cheap, and protein is where the money is, you’re not just leaving revenue on the table — you’re burning Dry Matter Intake to make pounds of fat your plant doesn’t really pay for.
Through 2025, co‑op field staff told The Bullvine their plants were handling the fat glut with weaker fat differentials, caps on premiums, and discounted rates on surplus above standardization targets. In several cases, producers shipping at around 4.3% fat and 3.0% protein found that neighbors shipping at 3.9% fat and 3.2% protein were getting better net checks. The plant’s economics reward protein and balanced solids, not maximum fat. Public contract language confirming this is scarce, but the field reports from multiple Western cheese plants were consistent.
The number that rarely shows up on a DHIA summary — and probably should — is the protein‑to‑fat ratio itself. Fat and protein percentages are on every test and every milk check. P: F as a standalone KPI rarely makes it into extension benchmarks or co‑op field reports. It hides in plain sight.
What Protein‑to‑Fat Ratio Should Western Cheese Herds Target?
Geiger told a USDA Outlook audience in February 2025 that over 80% of U.S. farmgate milk now goes into manufactured products by volume— cheese, butter, powders, yogurt. Those products depend on milk solids, especially protein. Fluid volume is secondary.
CoBank’s April 8, 2026, report called the U.S. “structurally short on protein” and argued that butterfat would have to find new markets, with exports doing a lot of the work. The August 2025–March 2026 whiplash in Class IV futures — more than $5/cwt swings in five months — was the market trying to digest that imbalance. That wasn’t a one‑off.
There’s early evidence that herds are responding on the nutrition side — but don’t mistake a ration tweak for a genetic fix. Geiger noted in an April 3, 2026, analysis that U.S. protein pounds grew 3.8% to 6.0% from December 2025 through February 2026, while butterfat growth ran 3.6% to 5.4% over the same window — meaning protein outpaced fat for three consecutive months. That’s encouraging, but it’s almost certainly a feed and management response: amino acid balancing, starch adjustments, forage quality improvements. The genetic composition of the milking herd hasn’t changed yet. It can’t — the biology won’t allow it for another two to three years.
For a 500‑cow Western herd on the wrong side of the component curve, the correction timeline is pinned by biology:
Sire changes you make in spring 2026 create heifers born early 2027, freshening late 2028 or early 2029.
Meaningful herd‑level P: F shift shows up in 2029–2030, as those corrected daughters replace 2019–2022 genetics through culling and normal turnover.
That’s a three‑to‑five‑year window where you’re structurally behind the neighbor who already fits their plant.. At $0.50 to $1.00/cow/day — the range implied by the math above — a 500‑cow operation faces roughly $91,000 to $182,000 per year in margin gap.
How much room do you actually have? The Bullvine’s analysis in “Ishler vs. Ferreira: The Feed‑Cost Trap Hiding $547,500 in Your IOFC” showed Virginia Ishler’s Penn State Extension IOFC benchmark puts breakeven at $7.41/cow/day. In March 2026, Class III prices of $16.16/cwt per USDA AMS, when applied to Ishler’s IOFC framework, put a typical well‑managed herd at roughly $6.90/cow/day in IOFC. Losing $0.50 to $1.00 off that base is a 7% to 15% margin haircut — sustained over years, not months. It pushes a lot of herds below that $7.41 breakeven.
Is Your AI Rep an Advisor or Just Moving Product?
AI companies saw the same CoBank charts, the same HighGround Dairy price curves, and the same USDA component production trends you’re seeing now. They were in a better position than any one farm to notice that NM$ was still fat‑heavy while the market started paying for protein.
From what we saw in catalogs and on‑farm conversations, many breeding programs were still leaning on fat‑heavy lists even after butter had slipped under $2.00.
That’s why the question can’t just be “when did they update my lineup?” It has to be, “Is my program built around my plant’s economics, or around whatever semen the catalog happens to be pushing?”
The CDCB board that approves NM$ revisions includes AI companies, breed associations, co‑ops, and producers. A 0.992 correlation between old and new NM$ reflects an intentional choice to prioritize stability and avoid major reranking. In practice, that stability also means existing semen inventories and marketing narratives face less disruption when economics change. When “little reranking” is celebrated as a success, it signals that the system is prioritizing index stability — sometimes at the expense of how quickly you can pivot with the market.
VanRaden’s description of NM$ as a lifetime profit index under “average U.S. conditions” is technically right. Smoothing noise is part of the design. But in a genomics era where you can change a herd’s direction every 2.5 years, an index recalculated every few years off trailing prices becomes a rear‑view mirror. If you use it unthinkingly, you’re steering by where the market was, not where your milk check is today.
How Should Western Herds Recalibrate Sire Selection in 2026?
You can’t fix the cows that have already freshened. You can stop digging the hole deeper and line up your breeding, feeding, and risk tools with where your plant is actually making money.
Timeline
Action
Target Metric
Red Flag If…
Next 30 days
Pull 24 months of DHIA, calculate P:F ratio trend
P:F ratio graphed monthly
P:F below 0.80 and trending down
Next 30 days
Get plant’s ideal composition in writing
Plant-specific P:F target
Rep can’t provide a number
Next 30 days
Audit sire lineup: flag bulls where PTA Protein < 60% of PTA Fat
% of lineup meeting threshold
More than 40% of bulls fail
Next 90 days
Switch from NM$ to CM$ or custom plant-weighted index
Primary selection index changed
AI rep won’t build a custom index
Next 90 days
Implement P:F-aware ration with nutritionist
Monthly IOFC tracking P:F, target +0.1–0.2 pt protein test
No monthly IOFC report; IOFC below $7.41/cow/day
Next 90 days
Run DRP component option analysis
Premium vs. indemnity modeling at your fat/protein tests
Using Class III coverage only when component option fits better
12-month
Genomic test heifer pipeline; sexed semen on top 50%, beef-on-dairy on bottom
% of replacements from protein-indexed matings
Still making replacements from P:F < 0.80 dams
12-month
Stress-test 3-year cashflow with $0.50–$1.00/cow/day drag
Cashflow model at current cow count
Model breaks at $0.50/cow/day drag
12-month
Evaluate breed mix / crossbreeding at current protein prices
Protein revenue per lb DMI comparison
Relying on 2021 crossbreeding math
In the next 30 days:
Pull your last 24 months of DHIA and calculate your protein‑to‑fat ratio. Not just fat. Not just protein. P: F. Graph it. If you’re below 0.80 and shipping to a cheese plant, you’ve got a problem you can put a number on.
Call your co‑op or plant field rep: “What’s your ideal milk composition for what you’re manufacturing, and where does my herd sit relative to that?” Get it in writing.
Sit your AI rep down and flip the agenda. “Show me my current sire lineup’s PTA protein relative to PTA fat. Flag every bull where protein is less than 60% of fat. Those are off the list.” Then ask for a protein‑first custom index ranked specifically for your plant’s economics, not a generic NM$ list.
Red flag: If your rep can’t build a CM$ or custom index that fits your plant’s economics — or won’t show you the list — you’re not getting true advisory support. You’re just being sold semen. Custom indexes are no longer just for the top 1% of herds; in a volatile 2026 market, they are a survival tool for the mid-sized 500-cow operation as well.
In the next 90 days:
Shift from NM$ as your primary filter to CM$ or a custom plant‑weighted index that pays for protein yield. Make PTA Protein ≥60–70% of PTA Fat your minimum bar on every bull.
Work with your nutritionist on a P: F‑aware ration. Amino acid balancing, starch management, and forage quality can raise protein tests 0.1–0.2 points without blowing fat up further — but insist on monthly IOFC reports that track P: F, not just crude component percentages. You’ll spend some feed dollars; the goal is to move the revenue side faster while genetics play catch‑up.
Run a Dairy Revenue Protection (DRP) analysis with your risk advisor. DRP’s component option lets you insure butterfat, protein, and other solids separately. In an Ohio State Extension walkthrough, a 250‑cow herd covering 5,000 cwt on the component option at 4.55% fat and 3.55% protein paid about $0.81/cwt in premium and collected an $8,775 net indemnity when component prices dropped — while the same herd on Class III coverage lost money on the premium. Federal subsidies cover roughly 44–55% of the premium at common coverage levels.
Opportunity signal: When Class III or IV futures spike on short‑term tightness, that’s your window. The August–March 2025–26 swings showed how fast that window opens and closes.
The 12‑Month Reset
Over the next year, you’re not trying to win the race. You’re trying to stop losing ground.
Genomic test and tighten your female pipeline. Use sexed semen on the top half of heifers ranked on your new protein‑aware index. The bottom half doesn’t need to make replacements. She should be making a black calf. If a cow doesn’t fit the P: F profile your plant needs, her best contribution to your business is a terminal pregnancy, not another daughter just like her.
Stress‑test a three‑year cashflow with a $0.50–$1.00/cow/day drag. Multiply that by your cow count and plug it into your IOFC and lender conversations. If the model holds at that haircut, you’ve got room to ride out the genetic lag. If it doesn’t, you need a different plan — more scale, a different market, or a different timeline.
Revisit breed mix and crossbreeding math at current component prices. Jersey and Jersey‑cross cattle naturally run 3.6%–3.9% protein with strong protein pounds per pound of DMI. At 75 lb/day and 3.7% protein, a Jersey‑cross gives you about 2.78 lb of protein. A Holstein at 90 lb/day and 3.27% protein gives you about 2.94 lb. More total protein, yes — but at a higher feed cost per pound of protein shipped. With protein at $2.00+/lb and fat under pressure, that trade‑off deserves a fresh pencil, not a 2021 one.
What This Means for Your Operation
Your P: F trend is now a strategic metric. If your protein‑to‑fat ratio has drifted down toward 0.77 while your plant wants protein, that’s a structural mismatch, not just a funny test. Graph it over the last two years and treat it like a KPI.
Your index choice is a business decision, not a religion. If you’re still picking bulls off NM$ in a high‑protein cheese market, you’re using a rear‑view mirror to steer. Talk to your AI company about CM$ and custom indexes — or find one that will.
Your cows have to earn their genetics. Any cow that doesn’t fit the plant’s P: F target probably shouldn’t be producing your next replacement. Beef‑on‑dairy isn’t just a fad; for many herds, it’s become the cleanest way to stop cloning a problem, as long as the calf market and packer access pencil out.
Your insurance should match your actual risk. High‑fat herds in a butterfat‑glut world shouldn’t be hedging like textbook “average” herds. DRP’s component option and well‑timed futures/options can be the difference between riding out volatility and letting it eat your equity.
Your advisors need to show their work. If your nutritionist can’t quantify how ration tweaks change P: F and IOFC — or your AI rep can’t show you a protein‑first sire list — that’s a performance issue, not just a style difference.
Key Takeaways
If your protein‑to‑fat ratio sits below 0.80 and you’re shipping to a cheese plant, you’re in the danger band this article describes. Run the per‑cow math with your own component prices and see what that gap costs.
If your sire lineup is still built off NM$ in 2026, you’re genetically positioned for a butterfat boom that’s already over. Rebuild your list using CM$ or a custom, protein‑weighted index and set hard PTA Protein vs Fat thresholds.
If your 2027–2029 heifer crop looks just like your 2019–2022 cows on paper, you’ve locked in three more years of margin drag. Use genomics, sexed semen, and beef‑on‑dairy to change that trajectory now.
Nobody’s getting beat up over 2021. Back then, you followed the incentives you were given. The point is to make sure you don’t repeat the same mistake in 2026 — letting a rear‑view‑mirror index and a fat‑first mindset cannibalize your milk check for another three to five years. The market’s told you what it values. The question now is whether your genetics, your feed, and your advisors are listening.
Complete references and supporting documentation are available upon request by contacting the editorial team at editor@thebullvine.com.
$3,010 Per Heifer. 800,000 Short. Your Beef-on-Dairy Bill Is Due. – Breaks down the structural reset of the U.S. heifer pipeline and the $4,000 replacement reality. It reveals how to leverage genomic testing and beef-on-dairy to secure immediate cash flow without sabotaging your herd’s 2028 survival.
The Sunday Read Dairy Professionals Don’t Skip.
Every week, thousands of producers, breeders, and industry insiders open Bullvine Weekly for genetics insights, market shifts, and profit strategies they won’t find anywhere else. One email. Five minutes. Smarter decisions all week.
Powerhouse just picked up +119 TPI while Garza dumped −125 under the protein flip — if those two are in your tank, this run just changed your semen budget math.
Executive Summary: TPI 2026’s 24P:14F protein flip just moved real money: Powerhouse gains +119 TPI, Garza drops −125, and every high‑fat sire in your tank needs a second look. All 10 genomic USA Holstein TPI leaders in April 2026 are new names and squeezed into a 37‑point band, so chasing “#1” is now a high‑volatility hobby, not a plan. On the proven side, Sheepster still leads at +3480 TPI after losing 92 points, while Captain, Zuri, and Garza reshuffle as the formula rewards protein‑heavy profiles. Woodford (+3565 TPI, +1296 NM$) and Jitters/Sabotage‑type genomics line up TPI and NM$ so closely that your “index vs profit” debate is basically over for top heifers. R&W breeders get their own shake‑up: Okafor‑Red and Ocean‑Red hold near 3200 GTPI, while RC/RW PTAT bulls like Crypto PP at +2.82 PTAT force you to choose between show udders and milk cheque. The article walks through how to re‑tier matings by herd type (high‑input, grazing, type/show, R&W), how to spot Captain/Trooper/Alta line stacking, and which bulls to push or park for the next 30 days.
The hook for April 2026 is the TPI 2026 formula flip: more weight on protein, less on fat, which quietly reshuffled both genomic and daughter-proven lists and set up the kind of bulls that now rise to the top in the Holstein USA TPI, April 2026 run. The biggest structural change is that PTA Protein now carries 24% of TPI while PTA Fat drops to 14%, so a bull with the same total CFP but more of it in protein pounds now scores materially higher TPI than a more fat‑heavy counterpart. When you run the December 2025 Holstein USA TPI proofs through that new 24P:14F production slice, you immediately see “formula winners” and “formula losers” before a single new daughter is added.
In this April 2026 USA run, that protein‑first logic shows up very clearly: genomic bulls like Aurora Gs Woodford‑ETare almost purpose‑built for TPI 2026, and on the proven side, bulls such as Peak Powerhouse‑ET gain roughly +119 TPI going from +3329 TPI (Holstein USA TPI, December 2025) to +3448 TPI (Holstein USA TPI, April 2026). At the same time, fat‑leaning sires like SDG Cap Garza‑ET lose relative ground despite still being excellent cowside options.
What Changed at the Top?
Genomic TPI leaders – April 2026
On the genomic side, the top 10 Holstein USA TPI, April 2026 bulls are all new faces compared with the December 2025 genomic top 10, reflecting both the formula change and the usual churn of new young sires.
Genomic TPI top 10 – Holstein USA TPI, April 2026
Rank (TPI)
Bull (NAAB)
TPI Apr 2026
NM$ Apr 2026
PTA Milk
PTA Fat
PTA Pro
PTAT
PL
1
Aurora Gs Woodford-ET (551HO06782)
+3565
+1296
+1498
+142
+78
+0.37
+4.5
2
Beyond Mican Hagrid-ET (7HO18312)
+3562
+984
+1351
+128
+66
+2.24
+3.7
3
S-S-I Richard Chichester-ET (7HO18102)
+3560
+1059
+1228
+112
+63
+1.54
+5.8
4
Genosource Jitters-ET (551HO07177)
+3552
+1127
+1637
+123
+68
+0.74
+4.2
5
Ocd Whoops Sabotage-ET (796HO10329)
+3551
+1076
+1274
+119
+64
+1.49
+4.6
6
S-S-I Kingdom Formal-ET (7HO18241)
+3548
+1139
+528
+129
+54
+0.91
+5.4
7
S-S-I Stagger Baelum-ET (14HO18123)
+3547
+1124
+897
+122
+62
+0.64
+5.7
8
Siemers Ssi Bridgerton-ET (250HO18331)
+3539
+1071
+1515
+110
+71
+0.96
+3.4
9
Pen-Col Gs 86807-ET (551HO06686)
+3529
+1119
+1853
+129
+73
+1.23
+3.8
10
Welcome Gustavsson-ET (200HO13730)
+3528
+997
+848
+115
+54
+1.61
+5.6
The band from Woodford at +3565 down to Gustavsson at +3528 is extremely tight – just 37 TPI points separate #1 from #10 – and all ten are new entrants versus the December 2025 genomic top 10. That tells you two things:
The shape of the ideal genomic sire under TPI 2026 is clear (high milk, strong protein, good health, functional type), but
The names at the very top are volatile and will rotate as more calves and proofs arrive.
Proven TPI leaders – December 2025 vs April 2026
On the daughter‑proven side, the story is different: it’s movement, not churn. The top proven bulls are the same characters, but they reshuffle based on the formula change and the addition of fresh daughters.
Daughter‑proven TPI top 10 – Holstein USA TPI, April 2026 vs December 2025
Rank Apr 2026
Bull (NAAB)
TPI Apr 2026
TPI Dec 2025
Δ TPI
Verdict
PTA Milk
PTA Fat
PTA Pro
PTAT
1
OCD Trooper Sheepster-ET (7HO16276)
+3480
+3572
!DROP −92
Formula loser
+1359
+133
+67
+0.86
2
Peak Powerhouse-ET (1HO16089)
+3448
+3329
!HIGH +119
Formula winner
+1937
+113
+92
+0.09
3
SDG-PH Delux Dominance-ET (551HO04795)
+3437
+3458
−21
Slight loser
+1303
+135
+64
+0.07
4
La-Ca-De-Le T Isaac 8731-ET (7HO15966)
+3396
+3390
+6
Neutral
+1336
+111
+62
+2.07
5
Peak Momento-ET (1HO16144)
+3360
+3334
+26
Formula winner
+1223
+113
+53
+0.40
6
Genosource Captain-ET (551HO04119)
+3356
+3428
!DROP −72
Formula loser
+1789
+117
+64
+0.33
7
Terra-Calroy Zuri-ET (97HO42585)
+3355
+3375
−20
Slight loser
+854
+104
+52
+1.81
8
SDG Cap Garza-ET (551HO04474)
+3339
+3464
!DROP −125
!RISK Formula loser
+1369
+140
+50
+0.03
9
Denovo 3946 Elgin-ET (29HO20623)
+3337
Outside top 10
!HIGH New entry
Formula winner
+2635
+100
+68
+0.45
10
Welcome Sensei-ET (200HO12140)
+3333
Outside top 10
!HIGH New entry
Formula winner
+1627
+97
+73
+0.87
Sheepster loses 92 points but still leads the Holstein USA TPI, April 2026 proven list at +3480 TPI, while Powerhouse is the classic “formula winner,” jumping about +119 TPI between runs thanks to his milk and protein‑heavy profile. Captain, Zuri, and Garza all surrender some ground under the new production weights but remain within the elite band.
All these proven sires meet the Holstein USA “high‑ranking sire” reliability criteria (minimum 80 traditional or 85 genomic for production and 80 for type), and the leaders are sitting in the 95–99% range on production and type, so this is the high‑reliability layer.
What TPI 2026 Is Rewarding (and Penalizing)
Protein vs fat in the new formula
Holstein USA’s TPI 2026 formula allocates 24% weight to PTA Protein and 14% to PTA Fat, shifting 5 percentage points from fat to protein compared with the previous version. Because of how the sub‑indices are scaled, Bullvine’s analysis shows that one pound of PTA Protein now exerts about 71% more leverage inside TPI than one pound of PTA Fat, turning P‑strong bulls into index winners without any change in their actual proofs.
Running the December 2025 Holstein USA TPI values through the new matrix, Bullvine highlighted several clear patterns:
Bulls with high protein and balanced or strong P/F ratios gained TPI – example case studies include:
Peak Powerhouse‑ET (1HO16089) – big milk, strong protein, climbs from +3329 to +3448 TPI between December 2025 and April 2026.
Cookiecutter Horseshoe‑ET (208HO00356) – identified by Bullvine as jumping about 10 proven ranks under the 2026 formula, even on the same December proof set.
Multiple Captain‑line bulls like Captain himself and his sons.
Bulls whose component strengths skewed more to fat than protein lost a step:
SDG Cap Garza‑ET (551HO04474) – very strong on fat; surrenders roughly 125 TPI under the new weighting (from +3464 to +3339).
Some high‑fat Captain sons and Garza‑type profiles that were standout under the old 19F:19P balance.
Bull (NAAB)
Status
PTA Pro
PTA Fat
Pro:Fat Ratio
TPI Dec 2025
TPI Apr 2026
Δ TPI
Formula Verdict
Peak Powerhouse-ET (1HO16089)
Proven
+92
+113
0.81
+3329
+3448
!HIGH +119
Winner – protein-heavy relative to fat
Peak Momento-ET (1HO16144)
Proven
+53
+113
0.47
+3334
+3360
+26
Mild winner
Denovo 3946 Elgin-ET (29HO20623)
Proven
+68
+100
0.68
Outside top 10
+3337
New entry
Winner – protein:fat balanced
Welcome Sensei-ET (200HO12140)
Proven
+73
+97
0.75
Outside top 10
+3333
New entry
Winner
Aurora Gs Woodford-ET (551HO06782)
Genomic
+78
+142
0.55
—
+3565
—
Purpose-built for 2026 formula
OCD Trooper Sheepster-ET (7HO16276)
Proven
+67
+133
0.50
+3572
+3480
!DROP −92
Moderate loser
Genosource Captain-ET (551HO04119)
Proven
+64
+117
0.55
+3428
+3356
!DROP −72
Loser – fat-leaning relative to protein
SDG Cap Garza-ET (551HO04474)
Proven
+50
+140
0.36
+3464
+3339
!DROP −125
!RISK Biggest loser – extreme fat bias
SDG-PH Delux Dominance-ET (551HO04795)
Proven
+64
+135
0.47
+3458
+3437
−21
Slight loser
Trait profiles at the top – genomics
Looking at the Holstein USA TPI, April 2026 genomic top 10, the shared trait profile is obvious:
High PTA Milk – often +1200 to +1500 lb and beyond.
High PTA Fat and PTA Protein pounds, with a P/F balance that suits the 24P:14F weighting.
Strong health (PL, LIV, cow health/Health Index) and fertility, with SCS normally in a comfortable range.
Moderate positive type – enough PTAT and udder to build functional commercial cows, not extreme show type.
A few case studies:
Aurora Gs Woodford‑ET +3565 TPI (Holstein USA TPI, April 2026) and +1296 NM$ (Holstein USA NM$, April 2026), roughly +1498 PTA Milk, +142 PTA Fat, +120 PTA Protein, strong Health Index, and moderate but positive type.
Genosource Jitters‑ET +3552 TPI (Holstein USA TPI, April 2026), +1127 NM$ (Holstein USA NM$, April 2026); big CFP with strong survival and fertility.
Ocd Whoops Sabotage‑ET +3551 TPI (Holstein USA TPI, April 2026), +1076 NM$ (Holstein USA NM$, April 2026); high production and NM$ with solid type.
Kingdom Formal, Baelum, Bridgerton, Pen‑Col Gs 86807, and Gustavsson all sit in this same high‑protein, high‑pounds, good‑health box with minor flavor differences in pedigree and trait tilt.
Trait profiles at the top – proven
On the proven side, the Holstein USA TPI, April 2026 leader board is full of “TPI 2026‑friendly” production profiles with proven reliability.
Overall, the proven top 10 tends to run 150–250 TPI points below the genomic leaders, but with 95–99% reliabilities for production and type, making them much safer anchors.
AI Companies and Bloodlines: Who Owns the Top?
Across the Holstein USA TPI, April 2026 lists, there is a clear concentration by both AI company and sire line.
On the proven TPI top 10:
OCD appears prominently with Sheepster and several Trooper/Drive descendants in the extended top group.
Peak/Alta features strongly via Powerhouse and Momento, plus multiple AltaWheelhouse/AltaZazzle offspring.
Genosource delivers Captain and several Captain‑line sons (Garza, Capn Miguel, Capn Ramble) just inside or outside the top 10.
Denovo brings in Elgin under the Envy x Riveting cross.
Pedigree‑wise, a few sire lines are clearly over‑represented in the top 10 and just beyond:
Captain (and his sons) appear in multiple proven bulls’ pedigrees – Captain himself in the top 10, and Garza, Capn Miguel, Capn Ramble, Cap Diggory, etc., in the next band.
Trooper/Drive/Topdog influence shows through OCD sires like Sheepster, Shake, Draft, and Draft‑related bulls.
AltaZazzle/AltaWheelhouse/AltaMarius show up repeatedly in the background of Peak bulls.
For genomic users, this concentration means you cannot just buy “top‑10 genomic TPI” and assume diversity; a good proportion of those bulls will trace back to Captain‑line and AltaZazzle‑line sires. For proven users, it reinforces the need to spread semen across multiple companies and sire lines – e.g., pairing Captain‑line bulls with Envy/Riveting or Taos‑line bulls like Isaac – to manage inbreeding and diversify risk.
How Volatile Are These Rankings After the Protein Flip?
At the genomic level, volatility is a feature, not a bug.
All ten bulls in the Holstein USA genomic TPI top 10, April 2026, are new compared with the December 2025 genomic top 10.
The TPI gap from #1 to #10 compressed to just 37 points (3565–3528), which means minor reliability or data shifts can shuffle ranks by several positions without any real change in bull quality.
For genomic TPI users, this means rank volatility is high and shouldn’t be over‑interpreted; you want to treat the whole top band as a portfolio of similar bulls rather than betting on the “#1” name.
On the daughter‑proven side, the picture is much calmer.
The core of the top group is stable: Sheepster, Dominance, Captain, Momento, Zuri, and Garza were already high in December 2025, and remain in the top 10 in April 2026.
Typical movement is ±20–40 TPI as more daughters arrive, with bigger shifts (Powerhouse +119, Garza −125) explained largely by the formula change rather than an abrupt change in daughter performance.
With reliabilities at or near 99% for many of these bulls, the rank band is structurally stable; a few slots of shuffling don’t change their role as cow‑makers.
For decision‑making:
Treat genomic ranks as high‑gain but high‑volatility signals: great for fast genetic progress, especially on heifers, but you should spread risk across several programs and not assume any one bull will stay #1.
Treat proven ranks as high‑reliability anchors: ideal for herds that want predictable daughters and for large semen volumes on milking cows and donors.
NM$: Economics Lined Up with TPI
The Holstein USA NM$, April 2026 genomic file confirms that TPI 2026 and NM$ are largely pointing to the same bulls.
Genomic NM$ leaders vs TPI – Holstein USA, April 2026
NM$ Rank
Bull (NAAB)
NM$ Apr 2026
TPI Apr 2026
TPI Rank
Divergence Flag
Key Trait Tilt
1
Genosource Valkyrie-ET (551HO07040)
+1308
+3464
Outside top 10
!HIGH NM$, lower TPI
High CFP, strong health; fat-forward
2
Aurora Gs Woodford-ET (551HO06782)
+1296
+3565
#1 TPI
Aligned
Protein+milk+health; dual leader
3
Genosource Viper-ET (551HO07102)
+1296
+3494
Outside top 10
Slight NM$ lead
High milk, strong protein
4
Genosource Morten-ET (551HO06777)
+1282
+3490
Outside top 10
NM$ favored
Big milk +1888, strong CFP
5
Genosource Jitters-ET (551HO07177)
+1127
+3552
#4 TPI
Aligned
High milk, solid survival
6
Ocd Whoops Sabotage-ET (796HO10329)
+1076
+3551
#5 TPI
Aligned
High-NM$ all-rounder
7
S-S-I Richard Chichester-ET (7HO18102)
+1059
+3560
#3 TPI
Aligned
Protein-/health-tilted
8
Beyond Mican Hagrid-ET (7HO18312)
+984
+3562
#2 TPI
!RISK NM$ lag vs TPI
High PTAT +2.24; type premium, lower economics
9
San-Dan On Call-ET (551HO06544)
+1218
+3525
#12 TPI
NM$ favored
Big milk +1751, PL +3.6
10
S-S-I Kingdom Formal-ET (7HO18241)
+1139
+3548
#6 TPI
Aligned
High health index; balanced
For genomics, this means that choosing bulls on TPI alone is less risky than it used to be, because the top TPI list is now almost automatically high NM$ as well; NM$ is more of an economic cross‑check than a competing philosophy.
On the proven side, top TPI sires like Sheepster, Powerhouse, Captain, and Elgin also deliver competitive NM$, albeit a step lower than the very best genomics, which is exactly the reliability vs level trade‑off you expect.
PTAT and RC/R&W PTAT: Specialist Type Tools (with Top RC/RW PTAT Bulls)
The pure PTAT lists – black‑and‑white and Red/Red Carrier – are nearly a separate universe from the TPI/NM$ tables. From the Holstein USA PTAT, April 2026 file, top PTAT sires reach +3.5 to +4.0 PTAT, with huge udders and frames, but usually 150–200 TPI and several hundred NM$ below the Woodford/Jitters type of bull. In the Red Carrier/RW PTAT file, similar-type specialists exist for the Red Carrier and Red & White space.
If your herd prioritizes show and classification, these bulls are ideal when you have a top 5–10% type cow family and are willing to sacrifice some index and NM$ on a few matings to push udders and frames to the next level. If your herd prioritizes herd profitability, you should keep PTAT specialists under 5–10% of total matings and let TPI/NM$ leaders carry the main commercial load while PTAT bulls sculpt the show string and donor group.
Top RC/RW PTAT Bulls – April 2026 and How to Use Them
For herds that want show-ring udders and frames in the Red Carrier and Red & White space, the Holstein USA RC/RW PTAT, April 2026 list provides a small group of extreme‑type tools.
Highlighted RC/RW PTAT bulls – Holstein USA RC/RW PTAT, April 2026 (12‑month bulls)
Bull (NAAB)
PTAT (Holstein USA RC/RW PTAT, April 2026)
Notes
Ruann Karat‑45955‑ET (719HO45955)
+3.92 PTAT
Extreme frames and udders; very low production and index.
Redcarpet Story Arc‑ET (730HO00005)
+3.78 PTAT
High‑type RC bull; niche show sire.
Eskdale Hulu Shoutout‑ET (288HO00364)
+3.56 PTAT
Hulu‑line type for RC cows.
Ruann Archer‑23755‑ET (719HO23755)
+3.32 PTAT
Big frames, strong show pedigree.
Dg Santinus RC (551HO00612)
+3.31 PTAT
RC type bull with modest production.
Ski‑Brite Junior P RC‑ET (288HO00350)
+3.30 PTAT
Polled RC with high PTAT, lower index.
Shg Lazer‑ET (551HO00485)
+3.25 PTAT
Show‑oriented sire for udder and style.
Le‑O‑La Chisel‑ET (551HO06531)
+3.24 PTAT
High type, low production; pure show tool.
Siemers Lazer Hambitious‑ET (288HO00339)
+3.15 PTAT
Lazer son with modern show‑cow pattern.
Sunquest Holy Crypto PP‑ET (250HO18358)
+2.82 PTAT
Homozygous polled with strong PTAT and respectable TPI.
These RC/RW PTAT bulls are not designed to compete with Woodford‑style sires on TPI or NM$; most carry negative production PTAs and lower indexes. If your herd prioritizes show or classification in Red or RC lines, you can use them strategically:
On the top 5–10% of Red and RC cows and heifers from your best type families, especially where udders and frames are already strong, and you want to push for the next level.
For breeders who still need commercial performance in Reds, bulls like Sunquest Holy Crypto PP‑ET can be used on a slightly wider group, because he doesn’t step as far off the index cliff as some pure show sires.
If your herd prioritizes profit and components, keep RC/RW PTAT-specialist usage under 5–10% of matings, and let Red index leaders (Okafor‑Red, Ocean‑Red, etc.) carry the main R&W commercial load.
Red & White: Index and Type in the R&W Space
TPI 2026 doesn’t treat Red & White differently inside the formula, but the April 2026 USA Red & White GTPI tables show a similar protein‑forward pattern among top R&W bulls.
Top R&W TPI – Holstein USA GTPI, April 2026 (selected)
Bull (NAAB)
TPI (Holstein USA GTPI, April 2026)
NM$ (Holstein USA NM$, April 2026)
PTA Milk
PTA Fat
PTA Pro
PTAT
Notes
Denovo 21873 Okafor‑Red‑ET (29HO00951)
3194
+824
+2270
+73
+31
+1.24
High‑index Red, strong CFP, good health.
Aprilday Hrok Athens‑Red‑ET (250HO18217)
3180
+595
+956
+76
+16
+0.57
Protein‑friendly Red with solid health.
Stgen Ocean‑Red‑ET (551HO06846)
3179
+792
+1906
+69
+11
+1.12
NM$‑strong Red for commercial herds.
Ocd Morris Spirit‑Red‑ET (551HO06757)
3177
+872
+1536
+81
+11
−0.06
Big fat, good protein; strong fit for milk cheque.
Compared with December 2025, bulls like Okafor‑Red and Ocean‑Red hold their ground near the top while fat‑heavier R&W sires lose some relative shine; again, the protein‑leaning bulls are formula winners.
For type in the Red space, the Red Carrier/RW PTAT bulls above (e.g., Holy Crypto PP, Story Arc, Karat, Hulu Shoutout) provide show‑caliber udders and frames that you can layer on top of R&W index sires when you want Red daughters that still classify and show.
If your herd wants Red calves with a commercial index:
Look first at Okafor‑Red, Athens‑Red, Ocean‑Red, Spirit‑Red, and similar bulls at the top of the R&W GTPI and NM$ lists.
Use RC/RW PTAT specialists sparingly on top Red females where type is high-priority.
What This Means for Your Matings This Season
This is where the April 2026 USA Holstein proof run earns its keep: turning lists into portfolio and mating moves over the next 30 days.
High‑input, housed herds chasing milk cheque and NM$
If your herd is high‑input, housed, and paid strongly on volume plus components, consider:
Heifers and genomic donors
Use Aurora Gs Woodford‑ET, Genosource Jitters‑ET, and Ocd Whoops Sabotage‑ET heavily on your top 25–40% heifers and genomic donors to maximize TPI (Holstein USA TPI, April 2026) and NM$ (Holstein USA NM$, April 2026).
Layer in Beyond Mican Hagrid‑ET or S‑S‑I Richard Chichester‑ET where you need a different program or P/F bias to manage inbreeding.
Milking cows and ET recipients
Anchor matings with OCD Trooper Sheepster‑ET, Peak Powerhouse‑ET, and Genosource Captain‑ET to lock in high CFP, PL, and reliability on cows that are already working hard.
Accept slightly lower TPI vs genomics in exchange for near‑99% reliability – especially on older cows and donor dams.
Grazing / lower‑input or fertility‑sensitive herds
If your herd prioritizes fertility, survival, and robustness more than absolute production:
On heifers, lean more into genomic bulls like Chichester, Jitters, and Sabotage that balance components with very strong health and fertility, rather than chasing the last 50–80 pounds of milk.
On cows, emphasize proven sires with strong PL/LIV and fertility – e.g., Sheepster, Dominance, Zuri, Sensei– and limit the number of high‑milk but tougher‑fertility bulls like some Captain sons on cows that already struggle to breed back.
Type/show and classification‑focused herds
If your herd is type/show‑oriented, and you’re willing to give up some TPI/NM$:
Keep TPI/NM$ leaders (Woodford/Jitters/Sheepster) as the core for commercial matings, but
On the top 5–10% of your best type cows and heifers, layer in:
High PTAT black‑and‑white bulls from the Holstein USA PTAT, April 2026 file for udders and frames.
RC/R&W PTAT bulls like Sunquest Holy Crypto PP‑ET, Ruann Karat‑45955‑ET, or Redcarpet Story Arc‑ET on elite Red or RC families to upgrade type while maintaining some index.
You gain +3.0 to +4.0 PTAT udders and frames, but you typically give up 150–200 TPI and several hundred NM$, so keep these matings targeted.
Red & White focused herds.
If your herd prioritizes Red & White genetics:
Build your main Red program on Okafor‑Red, Athens‑Red, Ocean‑Red, Spirit‑Red, and similar high‑GTPI/NM$ R&W bulls from the Holstein USA GTPI R&W, April 2026 list.
Introduce RC/RW PTAT sires only on your top R&W cows and heifers, where show/classification is the priority.
Watch bloodline stacking – spreading semen across Denovo, STgen, OCD, and Aprilday R&W bulls helps keep Captain/Trooper/Alta lines from becoming too dense in your Red base.
30‑day action list
Within the next 30 days, for any USA Holstein program using TPI and NM$:
Audit your sire list against movement
Pull your current sire lineup and, using the December 2025 and April 2026 Holstein USA TPI lists, flag any proven bull that lost ≥80 TPI (e.g., Garza) and any that gained ≥80 TPI (e.g., Powerhouse).
Decide whether those “formula losers” still fit your herd’s fat vs protein economics and whether “formula winners” deserve a higher semen share.
Check bloodline concentration
Using the pedigrees in the April 2026 proven and genomic lists, highlight how many of your active bulls trace back to Captain, Trooper/Drive/Topdog, or AltaZazzle/AltaWheelhouse as sire or grandsire.
If a single line dominates, deliberately add a couple of strong non‑Captain/non‑Trooper bulls (e.g., Envy x Riveting like Elgin, Taos‑line bulls like Isaac) to create outcross options.
Re‑tier your matings by risk.
Re‑assign at least 60–70% of milk‑cow matings to proven bulls and the remaining 30–40% to genomics if your herd is risk‑averse; invert that on your top genomic heifers if you prioritize maximum genetic gain.
Make sure each mating segment explicitly matches your herd’s economics (milk pricing, fat/protein premiums) and management style (grazing vs housed, robot vs parlor).
Key Takeaways:
The 24P:14F TPI 2026 protein flip turns Powerhouse (+119 TPI) into a proven winner and knocks fat-heavy bulls like Garza (−125 TPI) down a tier, so your semen mix needs a hard audit.
All 10 genomic USA Holstein TPI leaders in April 2026 are new names within a 37‑point band, which means rank 1 vs rank 10 is noise, and you should buy portfolios, not “the” bull.
Proven sires like Sheepster (+3480 TPI), Powerhouse, Captain, and Elgin still anchor the list with 95–99% reliabilities, trading 150–250 TPI points for far less re‑ranking risk on cows and ET work.
For high‑input herds, Woodford/Jitters/Sabotage‑type genomics align top‑end TPI with +1,000+ NM$, while grazing and fertility‑sensitive herds should lean into health‑tilted sires and cap big‑milk, tougher‑fertility bulls.
Red & White programs now pivot around Okafor‑Red/Ocean‑Red for index and Crypto PP/RC PTAT sires for show type, forcing you to pick where each Red mating sits on the profit‑vs‑pretty spectrum.
Every week, thousands of producers, breeders, and industry insiders open Bullvine Weekly for genetics insights, market shifts, and profit strategies they won’t find anywhere else. One email. Five minutes. Smarter decisions all week.
Lorenzo just landed at +874 PLI while Powerhouse quietly took #1 proven — but the only bulls that balance PLI, TM, feet, and fertility are sitting well outside the headlines
Executive Summary: Lorenzo just landed at +874 PLI in the April 2026 UK run, while 70% of the genomic top 10 turned over, and not one of them appears in the TM genomic top 100. That means the bulls driving £PLI in the UK right now are mostly negative or marginal for Type Merit, so if you’re picking only off the PLI list, you’re probably not prioritizing udders and feet while chasing milk and health. On the proven side, Powerhouse moved to +768 PLI at #1, Severus crashed 168 points to +596, and MASERATI P jumped 80 points but brings -0.08 L&F, so some “safe” sires on old mating lists now look a lot riskier. The rare balanced sires — TROPHY at +769 PLI and +2.09 TM, Taos and RENEGADE with strong PLI, TM, and feet — sit just outside the headline slots and are easy to miss if you’re only scanning the top 10s. WWS now owns 7 of the top 10 proven TM spots off closely related Parfect/Renegade lines, which is great for type but a real inbreeding trap if your semen invoices already lean WWS-heavy. For your herd, this run says: cap exposure to any single genomic PLI rocket, audit how many cows are still booked to big droppers like COYOTE P and ALTAVALUEPACK, and make sure at least a few of your main sires live in the small overlap where PLI, TM, fertility, and feet all point in the same direction.
Seven of the top 10 genomic PLI positions turned over between December 2025 and April 2026 in the UK evaluation — one of the highest-churn runs in recent memory. DENOVO 22750 LORENZO, a brand-new entrant at +874 PLI (April 2026 UK evaluation, 66% reliability), seized the #1 genomic spot from DENOVO COYOTE P, who cratered 62 points from +871 to +809 PLI and fell from first to 13th. Meanwhile, PEAK POWERHOUSE climbed to #1 daughter-proven at +768 PLI (April 2026 UK evaluation, 78% reliability), displacing OCD TROOPER SHEEPSTER, who dropped 72 points.
But here is the run’s most provocative signal: the PLI and Type Merit indexes are pulling in opposite directions at the genomic level. Lorenzo’s +874 PLI comes with a -0.21 Type Merit. OCD MANNY, the new #1 Type Merit genomic bull at +2.90 TM (April 2026 UK evaluation, 53% TM reliability), carries just +662 PLI — too low to crack the PLI top 100. Zero bulls appear in both the PLI genomic top 10 and the Type Merit genomic top 100. For breeders who care about both production economics and structural longevity, this divergence demands attention.
What Changed at the PLI Genomic Top?
The December 2025 PLI genomic top 10 was tightly bunched: the #1-to-#10 spread was just 26 points (871 down to 845). April 2026 blew that band open to 58 points (874 down to 816), with only three bulls surviving from the previous top 10.
Rank (Apr 2026)
Bull
PLI (Apr 2026, UK PLI)
PLI (Dec 2025, UK PLI)
Change
PLI Rlb
AI Company
1
DENOVO 22750 LORENZO A2A2 KCBB
874
New
—
66%
GEN
2
PEAK ALTAROTATION A2A2 KCBB
867
New
—
66%
ALT
3
PEAK ALTAVAUGHN
853
New
—
66%
ALT
4
DENOVO 6856 HOTSHOT A2A2 KCBB
846
New
—
66%
GEN
5
GENOSOURCE JUDO A2A2 KCBB
845
New
—
66%
CBL
6
OCD SHEEPSTER MIKE
828
New
—
67%
WWS
7
ADAWAY BEYOND FAITHFUL KCBB
827
860 (#6)
-33
67%
SMX
8
OCD THORSON RIPCORD A2A2
822
New
—
67%
CBL
9
DENOVO 20723 COLUMBIA A2A2 KCBB
819
864 (#4)
-45
66%
GEN
10
BADGER SIEMERS DAY TRIP
816
870 (#2)
-54
67%
WWS
The three survivors all dropped: ADAWAY BEYOND FAITHFUL fell 33 points, COLUMBIA lost 45, and DAY TRIP slid 54 points between December 2025 and April 2026. When the anchors decline, and the new entrants arrive untested, breeders should treat this top group as a hypothesis, not a verdict.
The Big Movers: Up, Down, and Out
Biggest Drops Inside the PLI Genomic Top 100
The most consequential movement happened outside the top 10. Several bulls that were generating heavy semen demand in late 2025 took significant hits:
Bull
Dec 2025 Rank (UK PLI)
Dec 2025 PLI
Apr 2026 Rank (UK PLI)
Apr 2026 PLI
Change
DENOVO COYOTE P A2A2
1
871
13
809
-62
PROGENESIS PRESTON A2A2
3
867
16
805
-62
PEAK ALTAVALUEPACK KCBB
7
860
49
766
-94
PEAK ALTAMAXIMINO KCBB
15
832
92
723
-109
PEAK ALTAREGALCROWN
31
816
Dropped out
—
—
PEAK ALTACASANOVA
72
768
Dropped out
—
—
COYOTE P’s fall — from #1 at +871 PLI (December 2025 UK evaluation) to #13 at +809 PLI (April 2026 UK evaluation) — is a textbook reminder of what 66% reliability means in practice. Sixty-two points of movement in a single run. ALTAVALUEPACK’s 94-point decline from #7 to #49 is even sharper. ALTAMAXIMINO’s 109-point plunge from #15 to #92 dropped it from a semen-demand hot list to borderline irrelevance in one evaluation cycle.
Three Alta bulls (AltaValuepack, AltaMaximino, AltaRegalcrown) took the heaviest damage in this run. This pattern could reflect daughter data accumulating in a direction that doesn’t match the genomic prediction, or it could reflect the normal variance associated with sub-70% reliabilities. Either way, any breeder who loaded mating lists with these bulls in Q1 2026 should audit their exposure.
Risers to Watch
Not everything moved down. A few bulls that were already in the December 2025 list held their ground or entered with strong profiles:
PEAK ALTATALLTALE entered at #11 (+815 PLI, April 2026 UK evaluation, 66% reliability) with a balanced TM of +0.54 and +0.61 Mammary — one of the few new PLI top-20 entrants carrying positive conformation.
DENOVO 20771 SEGMENT A2A2 held at #12 (+812 PLI, April 2026 UK evaluation), essentially stable from December’s +844 at #11. A 32-point decline, but modest relative to the carnage around it.
OCD SHEEPSTER MIKE is the most interesting new PLI top-10 arrival from a dual-purpose perspective: +828 PLI (April 2026 UK evaluation, 67% reliability) with +1.16 TM, +0.83 Mammary, +1.66 Legs & Feet, and +1.59 Locomotion. That combination of structural soundness and high PLI is rare at this level.
What PLI Is Rewarding This Run
The April 2026 PLI genomic top group has tilted decisively toward production and health economics at the expense of conformation. Across the top 3 bulls:
Average Milk: +723 kg (Lorenzo +953, AltaRotation +745, AltaVaughn +471, April 2026 UK evaluation)
Average TM: -0.21 to +0.76 — two of three carry negative or barely positive Type Merit
Average Mammary: -0.14 to +0.54 — Lorenzo and AltaRotation both carry negative Mammary composites, AltaVaughn is modestly positive
Average Fertility Index: +137 to +174 — strong reproductive values for all three
Compare that to December 2025’s top 3 (Coyote P, Day Trip, Preston), which averaged +940 kg of Milk but carried modestly higher TM scores (+0.76, -0.40, +0.93, respectively, in the December 2025 UK evaluation). The shift isn’t dramatic in production volume, but the conformation trade-off has steepened. Lorenzo and AltaRotation both carry negative TM values (-0.21 each, April 2026 UK evaluation), meaning breeders selecting on PLI alone are now actively pulling Type Merit backward at the very top of the ranking.
The Legs & Feet and Locomotion picture has also shifted. Lorenzo carries +0.82 L&F and +0.86 Locomotion — adequate. AltaRotation carries just +0.08 L&F and +0.13 Locomotion. For robotic milking herds where foot health directly impacts fetch rates, AltaRotation’s PLI rank may overstate his practical value.
How Volatile Are the UK’s PLI Genomic Rankings Right Now?
The 70% top-10 turnover rate and the band expansion from 26 points to 58 points are the two numbers that matter most for calibrating confidence in this run.
When 7 of 10 positions turn over, and all 10 bulls carry 66–67% reliability, the ranking is better understood as a probability distribution than a fixed leaderboard. Lorenzo at +874 PLI is the best current estimate of his genetic merit — but at 66% reliability, his true value could plausibly sit anywhere in a range of roughly ±50 PLI points. That means he could be a +924 bull or a +824 bull, and we won’t know for several more runs.
The three surviving anchors all moved down (FAITHFUL -33, COLUMBIA -45, DAY TRIP -54), which suggests the December 2025 genomic top group was slightly inflated relative to where the data settled in April 2026. This is normal genomic regression, not a system failure — but it reinforces why single-run PLI rankings should never be treated as definitive sire selection tools in isolation.
Key risk metric: Every bull in the PLI genomic top 10 has a reliability below 70%. No exceptions. Treat accordingly.
Whether this 70% churn rate is historically elevated or within normal UK genomic variance would require a multi-run comparison; that’s a trend line we’ll track in future proof-run coverage.
Reliability
Example Bulls
Estimated PLI Range
Practical Interpretation
Season Strategy
50–60%
OCD Manny TM (53%)
±60+ pts
Hypothesis, not a score
Max 5% of matings
66–67%
Lorenzo, AltaRotation, Hotshot
±50 pts
Good guess, will move
Max 15–20% of matings
75–80%
Powerhouse (78%), Sheepster DP (79%)
±35 pts
Solidifying
Up to 25% of matings
85–90%
Maserati P (89%), Graziano (88%)
±20 pts
Nearly final
Routine use justified
95–99%
Captain (98%), Renegade (98–99%)
±8 pts
Done moving
No cap needed
PLI Daughter-Proven: Powerhouse Takes #1 as Sheepster and Severus Fall Hard
The daughter-proven PLI list tells a more stable story — but still contains surprises. Seven of the December 2025 top 10 held their positions in April 2026, compared to just three on the genomic side. The proven top is anchored, but several high-profile bulls took heavy hits.
Rank (Apr 2026)
Bull
PLI (Apr 2026, UK PLI)
PLI Rlb
PLI (Dec 2025, UK PLI)
Dec Rank
Change
1
PEAK POWERHOUSE A2A2
768
78%
746 (#3)
3
+22
2
GENOSOURCE CAPTAIN A2A2
726
98%
696 (#7)
7
+30
3
OCD TROOPER SHEEPSTER
711
79%
783 (#1)
1
-72
4
SDG-PH DELUX DOMINANCE A2A2
698
76%
744 (#4)
4
-46
5
PLAIN-KNOLL RENEGAD TROOPER
675
85%
710 (#5)
5
-35
6
WINSTAR GRAZIANO HH6C
669
88%
694 (#8)
8
-25
7
OCD DELUXE T REX A2A2
666
75%
704 (#6)
6
-38
8
WINSTAR MASERATI P A2A2 POC
665
89%
585 (#41)
41
+80
9
COGENT KOEPON ROCKY HH6C
662
84%
New to top 10
—
—
10
DENOVO 17121 SARGENT
649
86%
New to top 10
—
—
POWERHOUSE’s Rise to #1
PEAK POWERHOUSE gained 22 PLI points (+746 to +768, December 2025 to April 2026 UK evaluation) while most of his proven peers declined. At 78% reliability, he’s building confidence with each run. His profile is high-production, moderate-type: +1,111 kg Milk, +0.07 Fat %, +0.11 Prot %, but just +0.17 TM (April 2026 UK evaluation). His Mammary (+0.14) and Legs & Feet (+0.27) are minimal — he’s a PLI-efficiency bull, not a dual-purpose one.
GENOSOURCE CAPTAIN: The Quiet Climber
CAPTAIN’s +30 PLI gain (696 to 726, December 2025 to April 2026) on 98% reliability is arguably the most trustworthy number in the entire UK evaluation right now. At near-maximum reliability, his ranking is essentially final. His profile is balanced: +973 kg Milk, +1.09 Mammary, +0.73 Legs & Feet, +1.07 Locomotion, and +0.91 TM (April 2026 UK evaluation). Not flashy, but the data is done moving.
The Big Proven Losers
The December 2025 #1 and #2 both fell hard:
OCD TROOPER SHEEPSTER: -72 PLI (783 to 711, December 2025 to April 2026 UK evaluation), #1 to #3. His TM actually improved slightly (+1.07 to +1.22, December 2025 to April 2026), but production and health traits pulled his PLI down. At 79% reliability, this drop may stabilize — but the December #1 ranking now looks like the high-water mark.
PEAK ALTASEVERUS: -168 PLI (764 to 596, December 2025 to April 2026 UK evaluation), #2 to #22. This is the single largest PLI decline in the entire top group. ALTASEVERUS went from the second-highest proven bull in the UK to the 22nd in one run. At 88% reliability, this isn’t genomic noise — it’s daughter data correcting the prediction significantly downward. His TM moved from -2.64 (December 2025) to -2.53 (April 2026) — a marginal improvement but still deeply negative. Breeders who used Severus heavily in 2025 should review progeny performance.
PEAK ALTASOLACE: -111 PLI (683 to 572, December 2025 to April 2026 UK evaluation), #9 to #32. Another Alta proven bull with a triple-digit decline.
ALL.NURE WENDAT: -112 PLI (678 to 566, December 2025 to April 2026 UK evaluation), #10 to #35.
WINSTAR MASERATI P: The Biggest Proven Riser
MASERATI P surged 80 PLI points (585 to 665, December 2025 to April 2026 UK evaluation) to crack the top 10 at #8, jumping from #41 in December 2025. At 89% reliability, this gain carries weight. His profile is health-heavy: +0.38 SCC, +0.73 Mammary — solid for housed herds focused on cell count management — but his Legs & Feet of -0.08 is a red flag for any system where mobility matters. His TM of +0.55 and production of just +392 kg Milk mean he’s not a volume bull. He’s a cell-count-and-health play at a competitive PLI level, but herds needing structural soundness should look elsewhere.
Type Merit Genomic: OCD Manny Arrives at +2.90 TM — And the PLI Overlap Is Zero
The Type Merit genomic list runs on entirely different logic than PLI, and April 2026 makes that divergence impossible to ignore. OCD MANNY debuted at #1 with a +2.90 TM (53% TM reliability, April 2026 UK evaluation), the highest genomic Type Merit score in that evaluation. His PLI of +662 doesn’t appear in the PLI genomic top 100 (minimum threshold: +715 PLI, April 2026 UK evaluation).
TM Genomic Top 10: April 2026 vs December 2025
Rank (Apr 2026)
Bull
TM (Apr 2026, UK TM)
TM (Dec 2025, UK TM)
Change
PLI (Apr 2026, UK PLI)
AI
1
OCD MANNY
2.90
New
—
662
SMX
2
SYNERGY KICKSTART A2A2 KCBB
2.75
2.93 (#1)
-0.18
426
WWS
3
NORTH-POLLED MAXUM-P RED A2A2 POC
2.61
2.75 (#4)
-0.14
193
SMX
4
CLWCH RHAPSODY EX90
2.56
2.73 (#5)
-0.17
94
UKD
5
DG PHOENIX KCBB
2.49
2.65 (#8)
-0.16
480
CBL
6
MYSTIQUE ANIMATION KCBB RDC
2.46
2.75 (#3)
-0.29
385
SMX
7
WALNUTLAWN PG BENSON A2A2
2.45
2.66 (#7)
-0.21
148
SMX
8
COGENT DG ELBA
2.44
New to top 10
—
507
ALT
9
PROGENESIS KOMET
2.40
2.49 (#14)
-0.09
305
SMX
10
STGEN PARFT ROSEVILLE
2.39
2.60 (#10)
-0.21
456
CBL
Every returning bull dropped TM this run — no exceptions among the seven anchors. SYNERGY KICKSTART fell from #1 at +2.93 TM to #2 at +2.75, a -0.18 decline that also came with a -63 PLI drop (489 to 426, December 2025 to April 2026). MYSTIQUE ANIMATION took the steepest hit: -0.29 TM (2.75 to 2.46) and -75 PLI (460 to 385).
Three bulls exited the top 10. SHELAND PARFECT LOCK transitioned from the genomic TM list (#2 at +2.77 TM, December 2025, 71% PLI reliability) to the daughter-proven TM list (#6 at +2.42 TM, April 2026, 91% PLI reliability). His TM dropped 0.35 points during the genomic-to-proven transition — a useful reference point for anyone projecting how current genomic TM leaders might look once daughter data arrives.
What the TM Top Group Looks Like
The TM genomic top 10 is a conformation-first population. Average PLI across the top 10 is just +340 — less than half the PLI genomic top-10 average of +840. Five of the top 10 carry PLI below +400. CLWCH RHAPSODY EX90 at just +94 PLI would be essentially off the radar for any PLI-focused breeding program, despite being the UK’s #4 genomic Type Merit bull.
Mammary composites run high: OCD MANNY +2.99 MAM, MYSTIQUE ANIMATION +2.71, WALNUTLAWN PG BENSON +2.29 (April 2026 UK evaluation). Legs & Feet are likewise elevated, with MANNY at +1.73 L&F and BENSON at +2.16. These are structural bulls built for classification programs and longevity-first herds.
SMX dominates the TM genomic top 10, holding 5 of 10 positions (up from 4 in December 2025). CBL holds 2, with WWS, UKD, and ALT each at 1.
Type Merit Daughter-Proven: Rimrock Takes #1 as WWS Locks Down 7 of 10 Spots
The Type Merit daughter-proven list saw dramatic reshuffling. BOMAZ RIMROCK RDC, a GEN bull, rose to #1 at +2.88 TM (89% TM reliability, April 2026 UK evaluation). He was #20 in December 2025 at +2.33 TM — a gain of +0.55 TM points as daughter data accumulated.
The December 2025 TM DP #1, SANDY-VALLEY ESQUIRE (+3.02 TM, December 2025 UK evaluation), dropped out of the top 100 of the April 2026 dedicated Type Merit DP. AOT HAMPSHIRE, December’s #2 at +3.00 TM, fell to #3 at +2.63 TM (-0.37). SIEMERS RENGD PARFECT slipped from #3 at +2.97 to #2 at +2.74 (-0.23 TM).
The defining feature of the April 2026 TM DP top 10 is WWS’s dominance: 7 of the top 10 positions are WWS-marketed bulls. Positions #2 through #9 are all either Siemers, Sheland Parfect Lock, Winstar Parfect Cirrus P, AOT Parfect Harmony, Regan-Danhof Capone, or S-S-I PR Renegade — all distributed by WWS. The Parfect/Renegade bloodlines are heavily represented, suggesting concentration risk for herds sourcing exclusively from this list.
LEANINGHOUSE TAOS, at #13 on the TM DP list (+1.98 TM, 95% TM reliability, April 2026 UK evaluation) and #15 on the PLI DP list (+613 PLI, 96% reliability, April 2026), is one of the few daughter-proven bulls that appears near the top of both rankings — a genuine dual-index performer with the reliability to back it up.
The Cross-Index Divergence: PLI and Type Merit Are Selecting for Different Animals
This is the structural story of the April 2026 UK evaluation, and it warrants explicit treatment.
Genomic: Zero Overlap
Not a single bull in the PLI genomic top 10 appears in the Type Merit genomic top 100. Not a single bull in the TM genomic top 10 appears in the PLI genomic top 100. The two indices are selecting entirely non-overlapping populations at the extremes.
PLI Genomic #1 (Apr 2026 UK PLI)
TM Genomic #1 (Apr 2026 UK TM)
DENOVO LORENZO: +874 PLI, -0.21 TM
OCD MANNY: +2.90 TM, +662 PLI
Production-first, negative conformation
Conformation-first, moderate production
66% PLI reliability
53% TM reliability
GEN
SMX
The best cross-index genomic performer in the April 2026 evaluation is TROPHY A2A2 (+769 PLI at genomic rank #46, +2.09 TM at TM rank #29, April 2026 UK evaluation). He carries +504 kg Milk, +2.54 Mammary, +2.04 Legs & Feet, +2.01 Locomotion, and a Fertility Index of +174 — the rare bull who doesn’t force breeders to choose between PLI and Type Merit. His AI company, SYN, may limit availability in some markets.
BEYOND HI-PACE (+722 PLI at #93, +1.93 TM at #39, April 2026 UK evaluation) is another dual-index bull with +1.35 Mammary, +1.01 L&F, and +0.99 Locomotion, though his PLI sits near the bottom of the top 100 and his TM is mid-pack.
Bull
PLI Rank
PLI (£)
TM Rank
TM Score
Milk (kg)
Mammary
L&F
Locomotion
Fertility
Reliability
TROPHY A2A2
#46 Genomic
769
#29 Genomic
+2.09
+504
+2.54
+2.04
+2.01
+174
66% PLI
Sheepster Mike
#6 Genomic
828
Top 100
+1.16
n/a
+0.83
+1.66
+1.59
n/a
67% PLI
Beyond Faithful
#7 Genomic
827
Top 100
+1.23
n/a
+1.50
+0.63
+0.73
n/a
67% PLI
LEANINGHOUSE TAOS
#15 Proven
613
#13 Proven
+1.98
+896
+1.79
+2.42
+2.87
n/a
96% PLI
S-S-I PR RENEGADE
#27 Proven
583
#9 Proven
+2.25
n/a
+1.54
+2.41
+2.81
n/a
98% PLI
Beyond Hi-Pace
#93 Genomic
722
#39 Genomic
+1.93
n/a
+1.35
+1.01
+0.99
n/a
66% PLI
Daughter-Proven: Slightly More Overlap, But Still Divergent
At the proven level, the gap narrows slightly:
LEANINGHOUSE TAOS: PLI DP #15 (+613 PLI, 96% reliability), TM DP #13 (+1.98 TM, 95% reliability), April 2026 UK evaluation. The most balanced proven bull in the UK system right now. His +1.79 Mammary, +2.42 Legs & Feet, and +2.87 Locomotion make him a standout structural sire, while +896 kg Milk and strong health traits keep his PLI competitive.
S-S-I PR RENEGADE: PLI DP #27 (+583 PLI, 98% reliability), TM DP #9 (+2.25 TM, 99% reliability), April 2026 UK evaluation. Near-maximum reliability on both indexes. His +1.54 Mammary, +2.41 L&F, and +2.81 Locomotion are elite linear scores with legitimate PLI backing.
PEAK POWERHOUSE (PLI DP #1, +768 PLI, April 2026 UK evaluation) carries just +0.17 TM — not in the TM DP top 100.
BOMAZ RIMROCK RDC (TM DP #1, +2.88 TM, April 2026 UK evaluation) carries just +374 PLI — not in the PLI DP top 100.
The divergence is less extreme among proven bulls than genomics, but the principle holds: the #1 on each index doesn’t rank on the other.
AI Companies and Bloodlines: Who Owns the Top and What Changed
PLI Genomic Top 10
AI Company
Dec 2025 Top 10 (UK PLI YG)
Apr 2026 Top 10 (UK PLI YG)
Direction
GEN
5
3
↓
SMX
2
1
↓
ALT
2
2
—
CBL
0
2
↑
WWS
1
2
↑
GEN’s December dominance (5 of 10) contracted to 3 of 10 in April. CBL entered the top 10 for the first time with GENOSOURCE JUDO (#5) and OCD THORSON RIPCORD (#8). ALT held two spots, but both are untested first-run bulls (AltaRotation, AltaVaughn) — fragile positions. WWS gained through OCD SHEEPSTER MIKE and BADGER SIEMERS DAY TRIP.
PLI Daughter-Proven Top 10
The proven list is more diversified: WWS (3), CBL (2), GEN (2), UKD (1), SMX (1), ALT (0 — a notable absence from the proven top 10 given Alta’s heavy genomic marketing).
Type Merit Genomic Top 10
SMX dominates with 5 of 10 positions. For classification-focused breeders, SMX is the primary semen source at the genomic level. CBL holds 2 spots.
Type Merit Daughter-Proven Top 10
WWS controls 7 of 10 positions — the most concentrated company share across any of the four rankings. The Parfect/Renegade family line runs through multiple bulls in this group (Siemers Rengd Parfect, Sheland Parfect Lock, Winstar Parfect Cirrus P, AOT Parfect Harmony). Herds building mating lists exclusively from the TM DP top 10 risk significant bloodline overlap. Cross-referencing pedigrees before committing to multiple WWS type bulls from this list is essential.
What This Means for Your Matings This Season
For Housed, High-Input Herds Prioritizing PLI
If your breeding goal is maximum economic index in a housed TMR system, LORENZO (+874 PLI, April 2026 UK evaluation), ALTAROTATION (+867 PLI), and HOTSHOT (+846 PLI) sit at the top — but all carry 66% reliability and negative or barely positive TM. Use them as part of a diversified sire portfolio, not as blanket picks. Limit any single genomic bull to no more than 15–20% of matings until reliability crosses 75%.
If you want PLI with proven confidence, GENOSOURCE CAPTAIN (+726 PLI, 98% reliability, April 2026 UK evaluation) is the safest bet in the entire UK evaluation. His numbers aren’t moving. PEAK POWERHOUSE (+768 PLI, 78% reliability, April 2026) offers higher PLI but with less certainty.
For Grazing and Lower-Input Systems
Grazing herds that need moderate production with strong fertility and structural soundness should look at TROPHY A2A2 (+769 PLI, +2.09 TM, Fertility Index +174, +2.54 Mammary, +2.04 L&F, +2.01 Locomotion, April 2026 UK evaluation). He’s the best cross-index genomic bull in this run and carries the kind of balanced profile that holds up on pasture. His SYN distribution may require proactive sourcing.
At the proven level, LEANINGHOUSE TAOS (+613 PLI, +1.98 TM, 96% PLI reliability, 95% TM reliability, April 2026 UK evaluation) is the standout. His daughter’s proof is essentially confirmed, his Legs & Feet (+2.42) and Locomotion (+2.87) are outstanding for grazing longevity, and his +1.79 Mammary supports functional udder quality alongside +896 kg Milk.
For Robotic Milking Herds
Bull
PLI (£)
TM
Mammary
L&F
Locomotion
PLI Rlb
Best Use
S-S-I PR RENEGADE
583
+2.25
+1.54
+2.41
+2.81
98%
Elite foot/leg certainty
LEANINGHOUSE TAOS
613
+1.98
+1.79
+2.42
+2.87
96%
Best overall balance, proven
SHEEPSTER MIKE
828
+1.16
+0.83
+1.66
+1.59
67%
Highest PLI + structural genomic
BEYOND FAITHFUL
827
+1.23
+1.50
+0.63
+0.73
67%
PLI + udder; weaker feet
GENOSOURCE CAPTAIN
726
+0.91
+1.09
+0.73
+1.07
98%
Proven, balanced, stable
PEAK POWERHOUSE
768
+0.17 ⚠️
+0.14 ⚠️
+0.27 ⚠️
n/a
78%
PLI leader only; not a robot pick
MASERATI P
665
+0.55
+0.73
-0.08⚠️
n/a
89%
Cell count bull; avoid on mobility herds
LORENZO
874
-0.21 ⚠️
-0.14 ⚠️
+0.82
+0.86
66%
PLI rocket; structural cost
ALTAROTATION
867
-0.21 ⚠️
-0.14 ⚠️
+0.08⚠️
+0.13 ⚠️
66%
Worst feet in PLI top 3 for robots
If you’re running robots, screen for Mammary and Legs & Feet first, PLI second. OCD SHEEPSTER MIKE (+828 PLI, +1.16 TM, +0.83 Mammary, +1.66 L&F, +1.59 Locomotion, April 2026 UK evaluation) is the clear genomic standout for robot herds — strong enough PLI to justify the pick, with the foot and leg traits that reduce fetch failures. His Mammary at +0.83 is adequate though not elite; pair him with high-MAM maternal lines where udder attachment needs reinforcement.
If your herd’s primary bottleneck is udder conformation rather than locomotion, ADAWAY BEYOND FAITHFUL(+827 PLI, +1.23 TM, +1.50 Mammary, +0.63 L&F, +0.73 Locomotion, April 2026 UK evaluation) offers better Mammary but weaker feet — a different trade-off that suits herds where locomotion is already under control.
Among proven bulls, S-S-I PR RENEGADE (+583 PLI, +2.25 TM, 98% PLI reliability, +1.54 Mammary, +2.41 L&F, +2.81 Locomotion, April 2026 UK evaluation) combines elite structural proof with legitimate PLI backing for herds that can accept a lower PLI floor in exchange for near-certainty on feet and legs.
For Type and Classification Programs
If your primary goal is classification and a show-oriented type while keeping PLI respectable, OCD MANNY (+2.90 TM, +662 PLI, April 2026 UK evaluation) is the genomic TM leader but comes with a PLI trade-off compared with the extreme PLI bulls. His +2.99 Mammary is the highest in the TM top 10. Use him for targeted structural matings, not as a universal sire of sons.
If your herd needs type but can’t give up too much PLI, SYNERGY KICKSTART (+2.75 TM, +426 PLI, April 2026 UK evaluation) is the second-highest genomic TM bull, but his PLI of +426 is a substantial economic penalty. Reserve him for cows where conformation needs outweigh production targets.
At the proven level, BOMAZ RIMROCK RDC (+2.88 TM, +374 PLI, 89% TM reliability, April 2026 UK evaluation) is a high-confidence type sire. His Red Carrier status opens crossbreeding flexibility. SIEMERS RENGD PARFECT(+2.74 TM, +418 PLI, 95% TM reliability, April 2026) offers slightly more PLI with near-maximum type reliability.
For Beef-on-Dairy Cull Programs
If you’re using beef-on-dairy on the bottom of your herd, you want the remaining dairy matings concentrated on the highest-PLI or highest-TM bulls appropriate to your goals — and aligned with this run’s data. Any cow still allocated to ALTASEVERUS (now +596 PLI, April 2026 UK evaluation, down from +764 in December 2025) or ALTASOLACE (+572 PLI, April 2026, down from +683) should be reassigned before the next breeding round.
30-Day Action Item
Pull your current UK mating list and cross-check every sire against the April 2026 PLI and Type Merit rankings. Specifically:
Flag any bull that dropped >50 PLI points this run — particularly COYOTE P (-62), PRESTON (-62), ALTAVALUEPACK (-94), and ALTAMAXIMINO (-109). Review remaining inventory allocation before your next mating cycle.
Audit bloodline concentration in your WWS type bulls if you source heavily from the TM DP list. Seven of the top 10 TM DP bulls are distributed by WWS and share overlapping Parfect/Renegade pedigrees.
Rebalance your PLI-to-TM mix. If you’ve been selecting purely on PLI, the April 2026 top group is pushing TM backward. For herds that need structural maintenance alongside economic gain, consider adding TROPHY, SHEEPSTER MIKE, or FAITHFUL as dual-purpose anchors.
Key Takeaways:
Lorenzo debuts at +874 PLI and drives a 70% turnover in the UK genomic top 10, but none of those bulls make the TM genomic top 100, so pure-PLI selection now pushes type backward.
On the proven list, Powerhouse climbs to +768 PLI at #1 while Severus drops 168 points and MASERATI P rises to +665 PLI with -0.08 L&F, making several “trusted” sires much higher risk than they looked last run.
The best all‑rounders sit off the front page: TROPHY (+769 PLI, +2.09 TM), Taos and RENEGADE combine strong PLI, TM, and feet, and are the bulls most likely to keep both your milk cheque and your cull list happy.
WWS controls 7 of the top 10 proven TM spots off Parfect/Renegade blood, which is great for type but dangerous for inbreeding if a WWS-heavy semen bill is already running through your TMR herd.
Action this run: cap exposure to any one genomic PLI rocket, pull any leftover Severus/ALTAVALUEPACK/COYOTE P from routine matings, and make sure each herd segment has at least one sire where PLI, TM, fertility, and legs all point the same way.
Every week, thousands of producers, breeders, and industry insiders open Bullvine Weekly for genetics insights, market shifts, and profit strategies they won’t find anywhere else. One email. Five minutes. Smarter decisions all week.
The Pro$ ceiling dropped ~250 points for most top bulls. If your sire lineup hasn’t changed since December, your income math has.
Executive Summary: ROZLINE just lost 626 Canada Pro$ in one run (from +2664 in December 2025 to +2038 in April 2026), while PARFECT quietly gained 58 Canada LPI points to take #1 at +3914. PATTERN stays #1 on Canada Pro$ at +2974 but gives back 237 Pro$, and CABO trims 231 Pro$ to sit at +2877, which means the Pro$ ceiling on proven sires dropped ~200–250 points for most front‑end bulls. That’s a different risk picture if you’re budgeting semen off last run’s income numbers or counting on single‑bull exposure to carry your Pro$ average. The daughter‑proven LPI and Pro$ top 10s are still anchored by many of the same names, but the big Pro$ hits to ROZLINE and GRAZIANO and the new arrival of POWERSTAR at +2854 Pro$ show how quickly “go‑to” bulls can be repriced. Genomic GPA LPI and GPA Pro$ lists remain volatile, with new bulls rotating through the top 10, so stacking too many matings on a couple of young sires is still a higher‑beta play. If your herd prioritizes income, robot‑friendly type, or inbreeding control, this run gives you clear signals on which proven sires to keep as anchors, which to demote to niche roles, and where Red/polled or alternative‑family outcrosses can keep your milk cheque and future mating options safer.
In the April 2026 Canada Holstein proof run, SIEMERS RENGD PARFECT‑ET moves to #1 on Canada LPI at +3914 (Canada Holstein LPI, April 2026) after sitting at +3856 and #5 in December 2025 (Canada Holstein LPI, December 2025). At the same time, PROGENESIS PATTERN stays #1 on Canada Pro$ at +2974 (Canada Holstein Pro$, April 2026) but drops 237 Pro$ from +3211 (Canada Holstein Pro$, December 2025). The bigger hit belongs to SIEMERS RENEGADE ROZLINE‑ET: he falls from +2664 to +2038 (Canada Holstein Pro$, December 2025 vs April 2026), a −626 Pro$ change, and from +3947 to +3810 on Canada LPI, sliding from #1 to #9 (Canada Holstein LPI, December 2025 vs April 2026).
For elite breeders and AI programs, this April 2026 Canada Holstein run matters because it compresses the top of both Canada LPI and Pro$ rankings, trims the income ceiling on several headline bulls, and shifts which sires you should treat as portfolio anchors vs. specialists over the next 6–12 months. The daughter‑proven front edge looks more stable than the genomic lists, but the magnitude and pattern of Pro$ changes still carry real implications for how you weight income vs type at the very top.
What Changed at the Top?
On the daughter‑proven side, SIEMERS RENGD PARFECT‑ET moves from +3856 (Canada Holstein LPI, December 2025, rank #5) to +3914 (Canada Holstein LPI, April 2026, rank #1), gaining 58 LPI and jumping four spots. STANTONS REMOVER PP moves from +3831 (Canada Holstein LPI, December 2025, rank #9) to +3873 (Canada Holstein LPI, April 2026, rank #2), a +42 LPI move that pushes him into the top pair. December 2025’s #1, SIEMERS RENEGADE ROZLINE‑ET, drops from +3947 to +3810 (Canada Holstein LPI, December 2025 vs April 2026), losing 137 LPI and landing at #9 in April 2026.
PEAK ALTAINSCAPE‑ET shifts from +3897 (Canada Holstein LPI, December 2025, rank #2) to +3829 (Canada Holstein LPI, April 2026, rank #7), −68 LPI, and WINSTAR MELBY‑P‑ET moves out of the April 2026 LPI top 10 from +3838 (Canada Holstein LPI, December 2025, rank #7 tied), though he remains in the top 100. Overall, roughly seven of the December 2025 Canada Holstein LPI top 10 still sit in or immediately around the top 10 in April 2026, with 3–4 bulls rotating in and out.
On Canada Pro$, PROGENESIS PATTERN holds #1 but drops from +3211 to +2974 (Canada Holstein Pro$, December 2025 vs April 2026), a −237 Pro$ change. DENOVO 16034 CABO‑ET stays #2 but falls from +3108 to +2877 (Canada Holstein Pro$, December 2025 vs April 2026), −231 Pro$. A new face, PEAK POWERSTAR‑ET, appears at +2854 (Canada Holstein Pro$, April 2026, rank #3) after not featuring in the December 2025 Pro$ top 100, while December 2025’s #3, WINSTAR GRAZIANO‑ET, drops from +3099 to +2655 and from #3 to #81 tied (Canada Holstein Pro$, December 2025 vs April 2026).
The headline shift is clear: the LPI front is reshuffled but still anchored by broadly similar bulls, while the Pro$ ceiling has been lowered by roughly 200–250 points for most top‑end sires, with ROZLINE and GRAZIANO seeing much larger income hits.
Role: daughter‑proven, high‑type, balanced‑components LPI anchor for programs that want type and functional production and can live with mid‑band Pro$.
STANTONS REMOVER PP
LPI: +3831 (Canada Holstein LPI, December 2025, rank #9) → +3873 (Canada Holstein LPI, April 2026, rank #2), +42 LPI.
Pro$: +3070 (Canada Holstein Pro$, December 2025, rank #4) → +2771 (Canada Holstein Pro$, April 2026, rank #8), −299 Pro$.
Role: polled, high‑milk, high‑component proven bull who remains a Pro$ factor even after a trim; ideal where polled is non‑negotiable, and income still matters.
PEAK POWERSTAR‑ET
Pro$: not in December 2025 Canada Holstein Pro$ top 100 → +2854 (Canada Holstein Pro$, April 2026, rank #3), new entrant.
Role: still the Pro$ reference bull but now as part of a compressed top tier; an income anchor with sufficient type and health for large, efficiency‑driven herds.
DENOVO 16034 CABO‑ET
Pro$: +3108 (Canada Holstein Pro$, December 2025, rank #2) → +2877 (Canada Holstein Pro$, April 2026, rank #2), −231 Pro$.
LPI: +3707 (Canada Holstein LPI, December 2025, rank #33) → +3611 (Canada Holstein LPI, April 2026, rank #32), −96 LPI.
Role: still attractive where very high fat % and good management traits are prioritized; no longer a top‑band Pro$ pick for general use.
What Canada LPI and Pro$ Are Rewarding This Run
The April 2026 Canada Holstein LPI top group is rewarding production and components with strong, but not necessarily extreme, type. PARFECT at +3914 (Canada Holstein LPI, April 2026) shows +894 Milk, +85 Fat, +57 Protein, +0.39%F, +0.19%P, +10 Conf, MS +4, FL +15, DS +7 — a balanced yield and type profile. STANTONS REMOVER PP at +3873 (Canada Holstein LPI, April 2026) pushes more volume with +1793 Milk, +113 Fat, +81 Protein, +0.36%F, +0.23%P, +8 Conf, MS +5, FL +9. DUCKETT PFCT HAS IT ALL‑ET at +3843 (Canada Holstein LPI, April 2026) runs +2294 Milk, +52 Fat, +65 Protein, +0.30%F, +0.10%P, +15 Conf, MS +10, FL +10, DS +16, clearly prioritizing volume and show‑type.
On Canada Pro$, April 2026 favors bulls that convert fat and protein into net income with a solid, workmanlike type. PATTERN at +2974 (Canada Holstein Pro$, April 2026) sits at +1199 Milk, +106 Fat, +71 Protein, +0.47%F, +0.23%P, +3 Conf, HL 108, DCA 104. CABO at +2877 (Canada Holstein Pro$, April 2026) is +685 Milk, +117 Fat, +73 Protein, +0.56%F, +0.27%P, 0 Conf. POWERSTAR at +2854 (Canada Holstein Pro$, April 2026) combines +695 Milk, +109 Fat, +72 Protein, +0.55%F, +0.29%P, +4 Conf, HL 105, DCA 104.
Three contrasting case studies spell out the trade‑offs:
PAZZLE (SIEMERS RZ PAZZLE 34954‑ET) +3810 (Canada Holstein LPI, April 2026), +2038 (Canada Holstein Pro$, April 2026), +16 Conf. +191 Milk, +145 Fat, +34 Protein, +1.16%F, +0.23%P, MS +5, FL +13, DS +16. Trade‑off: extreme type and fat %, solid but mid‑band Pro$ — excellent for show‑leaning programs that still care about components.
DUCKETT PFCT HAS IT ALL‑ET +3843 (Canada Holstein LPI, April 2026), +1960 (Canada Holstein Pro$, April 2026), +15 Conf. +2294 Milk with moderate components and strong MS/FL — big‑volume, high‑type, mid‑Pro$. Trade‑off: ideal for herds that monetize type and pedigree; less suited as a primary income sire.
PROGENESIS PATTERN +2974 (Canada Holstein Pro$, April 2026), +3766 (Canada Holstein LPI, April 2026), +3 Conf. +1199 Milk, +106 Fat, +71 Protein, strong health composite. Trade‑off: less eye‑catching than the extreme type bulls, but a more efficient income engine for commercial‑style and large herds.
In short, April 2026 Canada LPI still pays strongly for type and functional conformation when coupled with components, while Canada Pro$ is unforgiving about the income math and will only carry high‑type bulls when their fat/protein profiles justify it.
Stud Power, Family Power, and Outcross Space
AI stud codes in the April 2026 Canada Holstein lists show a familiar pattern. Semex 200 code bulls (PROGENESIS PATTERN, PROGENESIS MONTREAL, PROGENESIS MONTEVERDI, PROGENESIS PRAGMATIC, and others) occupy multiple slots in both the LPI and Pro$ top 100 lists. Codes 0007, 0011, and 0029 (Select, Alta/Peak, and related groups) are also heavily represented: PEAK ALTAINSCAPE‑ET, PEAK ALTACRAZE‑ET, PEAK ALTAHOTHAND‑ET, PEAK POWERSTAR‑ET, and a large set of genomic BEYOND/SHEEPSTER and Rosemary‑line bulls lead the young‑sire lists.
Bloodline concentration is particularly evident in the top 100 genomic by GPA LPI and GPA Pro$. SIEMERS SSI ROSMRY TONKS‑ET leads GPA LPI at +4179 in April 2026 (Canada Holstein GPA LPI, April 2026), with several other Rosemary‑line sires close behind. On GPA Pro$, SIEMERS RIM COBOT‑ET at +3755 and KENYON‑HILL OLYOP‑ET at +3732 (Canada Holstein GPA Pro$, April 2026) again tie back into a handful of sire stacks.
Within the daughter‑proven lists, genuine outcross space still exists:
DROUNER KL AUGUSTUS P RED at +3786 (Canada Holstein LPI, April 2026) and +2145 (Canada Holstein Pro$, April 2026) brings a Dutch Red, polled, alternative pedigree into the top 100.
KOEPON OH ROBIN RED at +3576 (Canada Holstein LPI, April 2026) and +2302 (Canada Holstein Pro$, April 2026) offers another competitive Red option with different bloodlines from the main Renegade/Parfect and BEYOND/SHEEPSTER clusters.
For ET and AI programs heavily invested in Renegade/Parfect, BEYOND, and related families, these Red and polled proven bulls — plus a handful of non‑cluster foreign codes — are where the practical outcross opportunities live, even if they sit 1–2 index tiers below the absolute top of LPI or a couple hundred Pro$ points below PATTERN/CABO.
How Volatile Are Canada’s LPI and Pro$ Rankings Right Now?
Between December 2025 and April 2026, the daughter‑proven Canada Holstein LPI and Pro$ lists show more compression than chaos. Around seven of the December 2025 LPI top‑10 bulls remain in or near the top 10 in April 2026, and a similar proportion holds for Pro$, with PATTERN, CABO, REMOVER PP, ALTAHOTHAND‑ET, and others still occupying high ranks despite level changes. The top‑end Pro$ bulls mostly lose 200–250 points (PATTERN −237 Pro$, CABO −231 Pro$, ALTAINSCAPE −245 Pro$), while ROZLINE and GRAZIANO see much larger drops (−626 and −444 Pro$ respectively).
Reliabilities for these leading daughter‑proven sires are high and in the mid‑ to high‑90s for production and conformation in both runs, as shown in the official lists. For bulls like PATTERN, PARFECT, CABO, REMOVER PP, ALTAINSCAPE, and GRAZIANO, these shifts are less about sampling noise and more about model and economic rebalancing across traits. That’s important: a 200‑point Pro$ or 60‑point LPI change signals a reset in how the index values their trait mix, but it doesn’t make existing daughters suddenly “wrong.”
The genomic lists are more volatile. OCD MILAN‑ET at +4137 (Canada Holstein GPA LPI, December 2025) gives way to SIEMERS SSI ROSMRY TONKS‑ET at +4179 (Canada Holstein GPA LPI, April 2026), with several bulls rotating in and out of the top 10. On GPA Pro$, PEAK ALTAPURPOSE‑ET at +3947 (Canada Holstein GPA Pro$, December 2025) is replaced by SIEMERS RIM COBOT‑ET at +3755 and a different mix of bulls in the +3700–3800 band (Canada Holstein GPA Pro$, April 2026). With no or very few Canadian daughters behind these bulls, this volatility is precisely the risk premium you should expect from genomic evaluations.
For portfolio planning, treat the daughter‑proven LPI and Pro$ front edge as relatively stable anchors and the genomic lists as higher‑beta tools where you spread risk across several bulls rather than betting heavily on any single name.
What This Means for Your Matings This Season
This is the section where April 2026 turns into decisions.
High-Input, Housed, Income-Driven Herds
If your herd prioritizes net income per cow in high‑input, housed systems, your starting point is Canada Holstein Pro$.
If your herd prioritizes maximum Pro$ with solid type, keep PROGENESIS PATTERN (+2974, Canada Holstein Pro$, April 2026) and DENOVO 16034 CABO‑ET (+2877, Canada Holstein Pro$, April 2026) as key anchors, and add PEAK POWERSTAR‑ET (+2854, Canada Holstein Pro$, April 2026) as a new proven income sire.
If your herd already relies on bulls that lost >250 Pro$ — ROZLINE (−626), GRAZIANO (−444), REMOVER PP (−299), ALTAINSCAPE (−245) — keep using them, but narrow them to matings where their specific strengths (type, fat %, polled, or other traits) justify the reduced Pro$.
Within 30 days, pull your active service list and flag every bull that dropped more than 250 Canada Holstein Pro$ between December 2025 and April 2026; for each, decide whether he remains a mainline income sire or becomes a targeted, trait‑specific option.
Robot Herds and Udder/Feet Priority
If your herd is on robots or runs high milking frequency with tight udder/feet requirements, you’ll put more weight on Canada Holstein LPI and Conformation.
If your herd prioritizes functional type with good components, look hard at PARFECT (+3914 LPI, +10 Conf, Canada Holstein LPI & Conformation, April 2026) and ALTAHOTHAND‑ET (+3853 LPI, +10 Conf, MS +7, FL +10, Canada Holstein LPI & Conformation, April 2026) as daughter‑proven anchors.
If your herd wants type with enough Pro$ to keep the accountant calm, PAZZLE (+3810 LPI, +2038 Pro$, +16 Conf) and HAS IT ALL (+3843 LPI, +1960 Pro$, +15 Conf) give you show‑influenced cows that still rank decently on Pro$.
Be cautious using low‑Conf, low‑MS bulls as day‑to‑day sires in robot herds, even when they’re high on Pro$. PATTERN, CABO, and POWERSTAR are all safe on that front; some other high‑Pro$ bulls are not.
Type/Show-Focused Programs
If you live off classification sheets, sales, and show results, this run confirms that the Canada Holstein Conformation list is stable and well-stocked.
If your herd prioritizes maximum Conformation, bulls like MATTENHOF HARRIS (+18 Conf, +278 Pro$, Canada Holstein Conformation & Pro$, April 2026), SWEETVIEW GRINCH P (+17 Conf), HAS IT ALL (+15 Conf), and PAZZLE (+16 Conf) remain prime options.
If your herd wants show‑type without walking away from income, focus your main matings on bulls that pair high Conf with Pro$ north of +1900 — again, PAZZLE and HAS IT ALL are prime examples — and reserve lower‑Pro$ extreme type sires for donors and best cow families.
Avoid treating ROZLINE as a top‑end Pro$ sire after his drop to +2038 (Canada Holstein Pro$, April 2026); he now fits best as a type and components tool.
Inbreeding-Sensitive ET Programs and Outcross Management
If your ET work already stacks Renegade/Parfect, BEYOND, SHEEPSTER, and Rosemary‑line bulls, the April 2026 lists are a reminder that the top of Canada Holstein LPI, Pro$, GPA LPI, and GPA Pro$ is heavily concentrated around a few families.
If your herd prioritizes inbreeding control, deliberately work bulls like DROUNER KL AUGUSTUS P RED (+3786 LPI, +2145 Pro$, Canada Holstein LPI & Pro$, April 2026) and KOEPON OH ROBIN RED (+3576 LPI, +2302 Pro$, Canada Holstein LPI & Pro$, April 2026) into donor matings as Red, alternative‑family outcrosses.
If your ET program leans heavily on a handful of genomic GPA LPI or GPA Pro$ bulls sharing similar sires and grandsires, spread risk by adding slightly lower‑ranked genomic sires with less pedigree overlap, even if their GPA LPI or GPA Pro$ is 50–100 points lower.
Within 30 days, run a quick pedigree audit on your donors against your top five service sires; any donor‑sire combination that repeats the same 2–3 sires or grandsires on both sides should have at least one Red or alternative‑family option added to the mating plan.
Genomic-Heavy Portfolios (Studs and Large Herds)
If your program leans heavily on genomic bulls, the April 2026 Canada Holstein GPA LPI and GPA Pro$ lists highlight both opportunity and churn.
If your herd prioritizes fast gain with controlled risk, you can use bulls like SIEMERS SSI ROSMRY TONKS‑ET (+4179, Canada Holstein GPA LPI, April 2026) or WELCOME GUSTAVSSON‑ET (+4064, Canada Holstein GPA LPI, April 2026) as sire‑of‑sons and key donor mates, but you should spread that exposure over multiple genomic bulls rather than anchoring on one.
If your herd wants more stability, aim to keep at least 40–50% of matings on high‑reliability daughter‑proven anchors like PARFECT, PATTERN, CABO, REMOVER PP, and ALTAINSCAPE, and use genomic sires as the “top‑up” rather than the core.
A practical threshold: if more than 60–70% of your planned matings for the next proof interval are to bulls from the top 10 of the April 2026 GPA LPI or GPA Pro$ lists, you’re probably carrying more genomic volatility than necessary for the same level of genetic gain.
Key Takeaways:
ROZLINE’s profile has flipped: he’s still +16 Conf and +3810 Canada LPI (April 2026) but lost 626 Canada Pro$ vs December 2025, so he’s now a type specialist, not a Pro$ anchor.
PARFECT (+3914 Canada LPI, April 2026) and PATTERN (+2974 Canada Pro$, April 2026) are the key proven anchors, but both sit in a compressed top band where 40–60 LPI or 200–250 Pro$ moves can reshuffle ranks without changing cow‑side reality.
GRAZIANO (−444 Canada Pro$) and several other December 2025 headliners took meaningful Pro$ trims, while POWERSTAR arrives at +2854 Canada Pro$ (April 2026), so any sire lineup built on last run’s income numbers needs a fresh audit.
Genomic GPA LPI and GPA Pro$ tops are still churning, so herds with >60–70% of matings on a handful of young sires are running higher portfolio risk than the Canada Holstein daughter‑proven lists alone would suggest.
For herds prioritizing income, robots, show type, or inbreeding control, this run clearly separates which bulls stay as everyday service sires (PATTERN, CABO, PARFECT, POWERSTAR) and which move to niche roles or outcross use (ROZLINE, PAZZLE, HAS IT ALL, AUGUSTUS P RED, ROBIN RED).
Every week, thousands of producers, breeders, and industry insiders open Bullvine Weekly for genetics insights, market shifts, and profit strategies they won’t find anywhere else. One email. Five minutes. Smarter decisions all week.
A runner-up at the biggest Holstein show in Japan doesn’t usually get a second act. This one did.
Sakuland Hasit Loewe ET — a Has It All daughter bred and owned by Naoki Miyahara, Sakuland Holsteins, Miyazaki, Japan — lines up at a Japanese Holstein show. Two years old, and the udder and frame are already delivering everything the pedigree promised.
She wasn’t the one who won at All-Japan. She was the one who almost did.
Sakuland Hasit Loewe ET — a Has It All daughter — placed second in her class at the 2025 All-Japan Holstein Show, the event Japan holds once every five years. Impressive, but not the banner. Then she sold for $27,000 USD at the Golden National Sale, shipped south to Kyushu, and landed at Sakuland Holsteins in Miyazaki Prefecture.
At the All-Kyushu Black & White Show, the wait paid off. Loewe entered the 2-Year-Old Junior class, won it, and kept going — all the way to Grand Champion.
Both Rocket and Loewe trace their maternal line back to the same foundation: C Glenridge Citation Roxy EX-97-4E-GMD — born April 15, 1968, on Lorne Loveridge’s farm at Grenfell, Saskatchewan. The pathway runs through Mil-R-Mor Roxette, the branch of the Roxy family that Bob Miller developed after purchasing Roxy in 1973.
Roxy’s career lifetime production totaled 209,784 lbs of milk at 4.5% fat and 9,471 lbs of fat — a third-generation 200,000-lb producer. She was the first cow in the world to have ten daughters classified as Excellent. Sixteen eventually scored EX. She earned the title Queen of the Breed twice, was named Top Cow of the Century and International Cow of the Century, and was part of eight All-American and All-Canadian groups.
The Bullvine’s own research into the Roxy family has documented over 381 descendants achieving Excellent classification — branches producing Grand Champions, high-genomic sires, and elite donors across North America, Europe, and now Asia.
That a Roxy-family heifer just claimed Grand Champion in Kyushu — seven generations deep and half a world away from Saskatchewan — says more about the durability of that maternal line than any genomic printout ever could.
$27,000 Was a Read, not a Gamble
Here’s what’s easy to miss: this wasn’t a long shot. Loewe placed second at the biggest Holstein show in Japan, from one of the most documented cow families in breed history, and moved to a region where she could develop and compete.
In North American show circles, $27,000 USD for this kind of pedigree depth wouldn’t raise an eyebrow. In Japan’s intensely competitive but smaller-scale Holstein show culture, it was a deliberate, conviction-driven purchase — the kind of move that only makes sense if you trust the cow and trust the bloodline.
Six months later, the cow proved the read was right.
From Hokkaido to Kyushu — That Climate Jump Matters
Hokkaido is Japan’s northern dairy heartland: cool climate, large-scale operations, conditions that feel closer to Wisconsin or the Netherlands than to anything subtropical. Kyushu sits at the opposite end of the country. Heat, humidity, and conditions that stress Holsteins hard.
Loewe made the transition and went Grand. The Roxy family has now produced Excellent and Grand Champion females on four continents, across vastly different management systems and climates — from Grenfell, Saskatchewan, in 1968 to Kyushu in 2026.
What This Means for Your Breeding Program
Show banners don’t automatically translate to profit — we’ve said it before. But deep cow families with this kind of documented, multi-generational track record aren’t just show-ring nostalgia. Over 381 EX descendants across multiple countries and management systems is evidence that the genetic floor in this family is genuinely high.
If you’re building a donor program or evaluating embryo purchases, the Roxy family’s record is worth a look. And if someone tells you cow families don’t matter in the genomic era, point them to Kyushu.
Loewe placed second at All-Japan, sold for $27,000, and went Grand Champion at All-Kyushu. The pedigree — seven generations back to Roxy EX-97 — told you she would.
The Roxy legacy is real and still growing. Over 381 documented EX descendants. Sixteen Excellent daughters from one cow. Career lifetime production of 209,784 lbs at 4.5% fat. The family keeps delivering because the genetic floor is that high.
$27,000 bought a cow family, not a placing. There’s a difference between paying for a show result and paying for seven generations of proven maternal depth.
Loewe moved from Hokkaido-bred genetics into Kyushu’s subtropical heat and went Grand. Cow families that hold up across environments aren’t just show assets — they’re breeding stock that travels.
Learn More
Glenridge Citation Roxy: The Legendary “Queen of the Breed” – The full deep dive into the cow behind Loewe’s maternal line. Breaks down Roxy’s 381+ EX descendants, the Mil-R-Mor Roxette branch, and how one Saskatchewan-born cow’s genetics ended up dominating show rings on four continents.
Every week, thousands of producers, breeders, and industry insiders open Bullvine Weekly for genetics insights, market shifts, and profit strategies they won’t find anywhere else. One email. Five minutes. Smarter decisions all week.
A bull with +40 lbs protein and 0.00% protein % isn’t a protein sire — he’s a volume sire in a protein costume. TPI 2026 just made him harder to spot.
Executive Summary:Last week we flagged the $17,500 protein trap in TPI 2026. Here’s the 25‑year stress test — and why the deeper problem is pounds vs percent. Protein has never hit 3× fat in 25 years of Class III prices, but Holstein USA’s TPI 2026 now weights protein 24% and fat 14%, effectively asking component herds to bet on that ratio anyway. Our barn math shows a modeled “high‑TPI‑protein” cow can add about 2,500 lbs of milk and roughly 0/cow/year in feed — or ,000/year on 320 cows — while actually delivering less cheese per cwt than a dense‑component cow. Even in protein‑friendly scenarios, the high‑CFP, lower‑volume herd either wins or stands so close that the extra feed and risk don’t pencil unless protein jumps to break‑even ratios the market has never sustained. The deeper problem is structural: TPI rewards protein pounds driven mostly by milk volume, while cheese plants care about protein percent and casein yield per cwt — and the fix is straightforward: penalize low protein % the same way NM$ already penalizes excess volume. If your breeding plan only works when protein is worth double or triple fat on your check, you’ll want to run the 30/90/365‑day playbook here against your own component prices before you lock in another semen order.
When that April TPI run dropped, a 320‑cow Wisconsin Holstein herd shipping to a cheese plant did what a lot of sharp breeders did. They sat down with fresh proofs, their latest milk check, and one blunt question:
When “More TPI Protein” Mostly Means More Milk in the Tank
Holstein USA framed the new TPI weights as better aligned with processor demand and modern pricing, similar to how Lactanet adjusted LPI after seeing faster genetic progress in fat than protein. Over the last five years, Lactanet’s work shows Holstein fat yield gains outpacing protein yield gains, with a positive correlation between the two at the pounds level — largely because both depend on volume.
But correlation isn’t causation. Fat % and protein % have a much weaker genetic relationship, and high‑fat bulls with mediocre or low protein % aren’t hard to find on any sire summary. You can’t count on fat selection to drag protein concentration along for the ride. If you want protein %, you have to select for it directly.
On paper, the TPI story sounds tidy:
Processors say they want more protein.
Class III formulas pay for protein.
So you weight protein higher in the index, and genetics will follow.
A lot of those sires carried numbers like +40 lbs PTA Protein, +1,200 to +1,800 lbs PTA Milk, and 0.00% or slightly negative PTA Protein %. On a catalog spread, that looks like a protein sire. In the bulk tank, it’s a volume sire. Those extra protein pounds are hitching a ride on more milk, not richer milk.
Proof Trait
Volume Sire (Protein Costume)
True Casein Sire
Red Flag?
PTA Protein lbs
+40 lbs
+30 lbs
—
PTA Protein %
0.00%
+0.04%
Red if ≤ 0.00%
PTA Milk lbs
+1,400 lbs
+300 lbs
Red if > Prot lbs × 30
PTA Fat lbs
+52 lbs
+40 lbs
—
PTA Fat %
-0.02%
+0.03%
Watch
Dilution Test (Milk ÷ Prot lbs)
35×
10×
Red if > 30×
CFP Score (Fat + Prot lbs)
+92 lbs
+70 lbs
Floor: ≥ +90 lbs
Cheese/CWT Impact
↓ (more whey, less casein density)
↑ (more casein per cwt)
Red = wrong direction
If you ship to a cheese plant that cares about vat yield per cwt, that distinction isn’t academic. Plants care how much casein they get per hundredweight of milk they pay to haul and process — not how many total “protein pounds” arrive across extra volume. Casein is what becomes cheese; whey is mostly a by‑product.
That’s the protein paradox behind TPI 2026: the index rewards protein pounds, but the plants that supposedly drove the change really need casein density — protein percent and the right ratio to fat.
Does Class III Pricing Really Support 3× Protein?
Under a lot of the “protein will catch up” talk, there’s an unspoken bet: if you load up on protein‑heavy TPI bulls now, eventually protein will be worth far more than fat, and your herd will cash in.
For that to really bail you out, you’re basically assuming a world where protein is worth about three times as much as fat on your milk check.
USDA’s Class III component price announcements going back to 2000 don’t support that.
From roughly 2000 through 2014, protein frequently beat fat in the Class III calculation. Ratios above 1.0× were common, and strong months climbed well past 1.5×. The standout month: March 2014, when AMS reported $4.52/lb protein and $2.04/lb fat — about a 2.21× ratio. That’s the best protein month in a generation of Class III data.
Then the world flipped. Around 2016–2017, butterfat took off on the back of strong demand for butter and cream. From about 2017 through 2025, protein generally traded below butterfat on Class III, only occasionally flirting with parity.
Across the entire 2000–2025 Class III component series, there isn’t a single month where protein reaches 3× the butterfat price. The market’s had plenty of time to try. It just hasn’t gone there.
The closest it came recently was in late 2025. Butter prices slumped on heavy supplies while cheese held firmer. CoBank’s December 2025 report, “Protein will drive milk checks for the foreseeable future,” flagged how the protein‑to‑butterfat ratio in US milk had slipped from 0.82–0.84 down to 0.77, and noted that cheesemakers still aim to move it back closer to 0.80 for better efficiency. Corey Geiger’s coverage of the same data underscored how hard it is to change that ratio quickly at the plant level. Component price shifts in that window nudged protein ahead of fat for a short time — but nowhere near 3×, and the gap narrowed again as butter recovered.
There’s a structural reason. Cheese and butter are co‑products of the same milk. When milk is long, both streams feel it. When milk is tight, both get expensive. You may see a wobble for a few months — like late 2025 — when inventories diverge, but you don’t build a stable world where butter stays cheap, and cheese stays sky‑high. The co‑product math keeps pulling them back together.
So when someone leans on “protein will catch up” to justify a heavy protein‑TPI stack, they’re asking you to bet your genetic pipeline on a price ratio:
that 25 years of national Class III data haven’t produced once, and
The basic structure of milk markets makes it very hard to hold.
Where Is the Break‑Even for TPI 2026 vs a Component Herd?
Herds on cheese grids don’t make breeding decisions off theory. They look at margin.
To pressure‑test the TPI 2026 shift, the Wisconsin herd above modeled two herd profiles with their advisor — not their actual CDCB numbers, but realistic composite cows based on standard genetic responses. These are modeled cows so that you can plug in your own numbers, not a disguised case study.
One profile reflected the kind of cow you build if you follow TPI’s 24P:14F production weighting for 2–3 generations.
The other reflected a herd steered by Cheese Merit (CM$), where the priority is total component yield and density, not just more volume.
High‑TPI vs High‑CFP Herds at a Glance
Metric
High-TPI Protein Herd
High-CFP Dense Herd
Winner
Milk lbs/cow/yr
~26,500
~24,000
TPI (+2,500 lbs)
Fat %
3.85%
4.20%
CFP (+0.35 pts)
Fat lbs/cow/yr
~1,020
~1,008
TPI (marginal, +12 lbs)
Protein %
3.22%
3.38%
CFP (+0.16 pts)
Protein lbs/cow/yr
~853
~811
TPI (+42 lbs)
Protein:Fat ratio
0.834
0.805
CFP (cheese-plant ideal ~0.80)
Extra feed cost @ $0.12/lb
$300/cow/yr
—
CFP saves $300
Extra feed cost (320 cows)
$96,000/yr
—
CFP saves $96k
Van Slyke Cheddar yield
9.31 lbs/cwt
9.95 lbs/cwt
CFP (+0.64 lbs/cwt)
Break-even P/F needed
1.6–3.35× (varies by fat price)
Not required
CFP (no bet required)
Best for herd type
Volume/fluid contracts
Cheese-grid herds
Depends on your check
On paper, the high‑TPI herd ships a bit more fat and about 42 lbs more protein per cow per year. But it also ships 2,500 lbs more milk per cow.
That extra milk isn’t free.
Using a conservative marginal feed cost of $0.12 per lb of extra milk — which is where a lot of freestall herds land on incremental production — those extra 2,500 lbs cost about $300 per cow per year in feed. On a 320‑cow herd, that’s roughly $96,000 per year in extra feed tied directly to breeding for volume‑driven protein.
Once you see that, the real question becomes:
At your component prices and marginal feed cost, does this “high‑TPI‑protein” cow leave more income over feed — or less?
Quick Margin Check You Can Run at Home
Here’s how to do that same math with your numbers:
Take your current herd and the kind of daughters your sire stack is building. Estimate the difference in milk per cow and in fat % and protein %.
Write down your marginal feed cost per extra lb of milk. For most herds right now, that’s somewhere between $0.10 and $0.14.
Grab your own fat and protein prices from your last 12 months of milk checks.
Calculate the extra component income for the higher‑yield cow, then subtract the extra feed cost for the extra milk.
If the higher‑TPI cows only look better when you assume protein is way ahead of fat — or if the extra protein income barely covers the feed — your own barn is telling you how narrow that path is.
The Barn Math Behind the Break‑Even
In that Wisconsin modeling exercise, the advisor pushed the comparison further. They ran both composite herds across different fat prices and protein‑to‑fat ratios to see where the high‑TPI herd finally beats the high‑CFP herd on income over feed.
Three points matter:
At $1.50/lb fat — a cheap, low‑butter world — the high‑TPI herd needed roughly a 3.35× protein‑to‑fat ratio to catch up. That ratio doesn’t show up anywhere in the 2000–2025 Class III record.
At $2.50/lb fat — closer to “normal” recent Class III butterfat levels — the break‑even dropped to about 1.9×. Still higher than almost every month from 2017 to 2025.
At $2.91/lb fat, the actual December 2024 Class III butterfat price, the break‑even settled around 1.6×. That’s roughly where late 2025 briefly landed before butter prices corrected again.
In recent Class III months, plenty of milk checks have put protein somewhere around 1.3–1.6× fat. At those ratios, under realistic feed costs, the dense‑component, lower‑volume herd either wins outright or stands so close that the extra risk and feed bill of chasing volume doesn’t look like a good trade.
Then they took one more step and ran both modeled herds through a simplified Van Slyke Cheddar yield formula.
At 3.38% protein and 4.20% fat, the high‑CFP herd delivered roughly 9.95 lbs of Cheddar per cwt. At 3.22% protein and 3.85% fat, the high‑TPI‑protein herd came in closer to 9.31 lbs per cwt. That’s 0.64 lbs more cheese per cwt from the denser herd — with less milk to haul and process.
The high‑CFP herd’s protein‑to‑fat ratio — roughly 0.805 — sits right in the neighborhood of the ~0.80 ratio CoBank and others say US cheesemakers are still trying to achieve. The TPI‑protein herd isn’t delivering that. It’s delivering more tanker loads for less cheese per cwt.
“Processors Want Casein” — But Genetics Takes the Easy Path
Cheese plant managers aren’t asking for TPI points. They’re asking for casein, vat yield, and the right protein‑to‑fat ratio at the receiving bay.
Processors want two related things:
Commodity cheese plants want milk that hits a protein‑to‑fat ratio around 0.80, so they get more cheese per cwt without excess fat to discount or dispose of.
Ingredient plants making MPC, micellar casein, and high‑protein yogurts want a higher protein % because membrane and dryer efficiency depend on concentration.
None of them are saying, “Just send us more total protein pounds by shipping more milk.” They’re saying, “Send us richer milk.”
In Holstein USA’s published TPI formula, the production piece is driven by PTA Milk, PTA Fat (lbs), and PTA Protein (lbs). PTA Protein % is available on CDCB proofs, but it isn’t a weighted component in the core TPI calculation. That’s a design choice by Holstein USA and its advisors, but it means the index can only signal “more protein” through yield, not through richer milk.
The fix isn’t complicated. TPI could add a penalty for low protein % — the same way NM$ already applies negative economic value to excessive PTA Milk. A bull posting +40 protein lbs at 0.00% protein would take a hit; a bull posting +30 protein lbs at +0.04% would be rewarded. That single adjustment would push the formula away from rewarding dilution and toward rewarding concentration, without scrapping anything else in TPI’s structure. The mechanism exists. The math exists. Holstein USA already accepts this logic in other indexes. It just hasn’t been applied to the trait processors that they actually need.
Without that penalty, the genetic response tells you exactly where the selection pressure lands. In the three‑generation modeling example above, milk climbed by about 420 lbs per cow, protein yield improved by about 21 lbs, and protein % only crept up by about 0.012 percentage points. Almost all the “extra protein” came from extra volume, not richer milk. And because fat % and protein % don’t move in lockstep genetically, you can absolutely find high‑fat bulls sitting at flat or negative protein % — assuming one drags the other along is a correlation bet, not a genetic plan.
From a cheese plant’s point of view, that’s more milk to pump, pasteurize, and set for essentially the same casein density per cwt. A long way from the way cheese plants describe their ideal milk when they talk to producers and AI companies.
For herds shipping to fluid plants or on straight volume contracts without component premiums, that trade‑off looks different. TPI’s protein‑yield emphasis may still align with the revenue model in those systems. The analysis here is aimed squarely at cheese‑grid and component‑payment herds.
The Turn: When TPI Moves to the Back of the Stack
In meetings and kitchen‑table conversations this spring, you can hear a similar pattern from component‑grid herds in Idaho, Wisconsin, and across the Western US.
They’ve used TPI for years to build sire lists. They watched bulls jump or fall 200–300 TPI points in April off a formula change none of their cows had read. Immediately after those swings, several advisors started telling clients to stop letting TPI drive the bus.
That’s pushing a quiet shift in some breeding offices. Instead of throwing TPI away, some component‑grid herds we talk to are moving it to the back of the stack:
Let CM$ or NM$ steer the bus. USDA ARS documentation on the 2021 and 2025 Net Merit revisions shows greater emphasis on fat and less on protein, and penalties for excessive milk volume through negative economic value on PTA Milk. Those indexes are built directly from economic values and explicitly treat extra volume as a cost.
Use TPI as a filter, not the driver. Once a bull passes your CM bar — and your own thresholds for health and type — his TPI rank matters a lot less than how he lines up with your milk check.
Pull PTA Protein % on every “protein bull” you’re told to use. Big PTA Protein lbs paired with big PTA Milk and flat or negative PTA Protein % is a volume profile, not a casein profile, for cheese‑grid herds.
Your 30/90/365‑Day Playbook
You can’t fix FMMO pricing from your office. You can’t make Holstein USA rebuild TPI around protein % by next week. But you do decide which semen lands in your tank.
In the Next 30 Days: Fix the Steering Wheel
Before you finalize your spring order:
Resort your bull list by CM$, not TPI. Ask your AI rep for their top CM$ bulls and start from there. Use TPI mostly to screen for structural issues or extreme health outliers.
For every bull you’re serious about, pull four numbers: PTA Fat lbs, PTA Fat %, PTA Protein lbs, PTA Protein %.
Apply two simple dilution filters if you’re on a cheese grid:
CFP floor: PTA Fat lbs + PTA Protein lbs ≥ +90 lbs combined. Below that, you’re not moving components enough to make a difference.
Dilution test: PTA Milk lbs ≤ PTA Protein lbs × 30. Around 3.2% protein, anything above that says almost all the “protein gain” is just more milk.
Treat negative PTA Protein % as a hard flag if vat yield per cwt matters to your plant. Those bulls are diluting your cheese per cwt, no matter how strong their protein‑lbs number looks.
Ask Holstein USA the uncomfortable question: If NM$ already penalizes excessive milk volume, why doesn’t TPI penalize low protein %? The mechanism exists. The math exists. The only thing missing is the decision.
A bull with +40 lbs protein, +1,400 lbs milk, and 0.00% protein % is a volume sire in a protein costume. A bull with +30 lbs protein, +0.04% protein %, and only +200–600 lbs milk is actually improving concentration.
In the Next 90 Days: Line Up Genetics With Your Actual P/F Price
Pull 12 months of component prices from your milk checks. Don’t guess. What’s your actual protein‑to‑fat price ratio? In many recent Class III months, that’s been somewhere around 1.3–1.6×.
Set a genetic P/F band that matches your grid:
If fat clearly leads and protein is discounted, target a 0.50–0.55 genetic P/F band in your sire group.
If protein has been within about 20% of fat, slide to 0.55–0.60 as a sensible hedge.
If protein is consistently ahead in your region and contract, you can justify 0.58–0.65 — but no more without a written premium.
Audit your current sire stack. If the average P/F profile pushes above 0.65 while your check shows protein at roughly 1.3–1.6× fat, that’s less a hedge and more a bet on 2–3× protein.
Over the Next 365 Days: Push Where the Index Won’t
Build a simple Concentration Score into your proof sheets. One option: (PTA Protein % ÷ PTA Protein lbs) × 1,000. Within your CM$‑screened list, give at least half your matings to bulls in the stronger half of that score if you ship to cheese or ingredients.
Start a protein‑concentration conversation with your plant. Ask your field rep directly: “If I consistently deliver higher protein %, is there room in this grid or in over‑order premiums?” Canadian P5 boards have already moved toward pricing structures that reward solids‑to‑fat ratios with explicit incentives — a November 2025 policy update shows tier‑2 protein in the P5 SNF/BF payment policy paid at the monthly Class 4a price plus $3.00/kg, effective January 1, 2026. That’s a direct premium for concentration.
Track income over feed cost (IOFC) by component, not just per cwt. If your supposed “high‑protein” cows only look good because they pump out more volume — not because they deliver more margin per lb of fat and protein at today’s prices — your own ledger is telling you the breeding plan is off.
What This Means for Your Operation
Stop letting TPI 2026 steer if you’re on a component grid. Put CM$ or NM$ in the driver’s seat and treat TPI as a filter. That move alone lines your genetics up more closely with how USDA economics actually value fat and protein today.
Don’t confuse protein pounds with protein percent — or with casein. Big PTA Protein lbs plus big PTA Milk and flat/negative PTA Protein % means you’re mostly breeding for more whey in more milk, not more casein per cwt. If your plant pays for cheese yield per cwt, that’s the wrong direction.
Don’t assume fat % selection fixes your protein %. The genetic correlation between fat percent and protein percent is at most moderate. High‑fat bulls with flat or negative protein % are everywhere. If you want concentration, you have to select for it directly — not hope it arrives on the back of another trait.
Run your own break‑even, not the catalog’s. Take your marginal feed cost and your actual component prices. If your plan only looks smart when protein is 2–3× as much as fat, you’re relying on a price relationship that your own checks haven’t shown you.
Set P/F targets off your grid, not off headlines. A small shift toward protein is a hedge. A big shift is a bet on a 3× world that Class III data and co‑product logic don’t support.
Pick one bull you planned to use heavily and pull his PTA Protein %, PTA Milk, and PTA Fat %. Is the cow he sires richer, or just louder? If the answer is “louder,” fix your list before you lock in another breeding season.
Key Takeaways
If your breeding plan only pays off when protein hits 3× fat, you’re not hedging — you’re running a long‑shot bet that 25 years of USDA Class III data don’t support.
TPI 2026’s higher protein weight mostly comes from more milk, not richer, casein‑dense milk. That means more feed, more trucking, and more processing per pound of casein — the opposite of what cheese plants are asking for.
Fat % and protein % don’t move in lockstep. Assuming fat selection drags protein concentration along is a correlation bet, not a genetic plan. If you want protein %, select for it — TPI doesn’t, but you can.
The fix at the index level is simple: penalize low protein % the same way NM$ penalizes excess volume.Until Holstein USA makes that change, component‑grid herds need to screen for it themselves.
Your most honest signal isn’t the next proof run — it’s your IOFC by component. If your “high‑protein” cows don’t deliver more margin per lb of fat and protein at today’s prices, your proofs and your milk check are telling two different stories.
One Question Before You Order Semen
You can’t control what Holstein USA does with TPI or what USDA does with Class III formulas.
But you do control which proofs end up on your short list and which heifers stay in your string. Before you sign that next semen order, lay your proof sheets beside your most recent component check and ask one straight question:
The AI companies and index committees want you to buy the “Protein Revolution.” Your milk check is asking for a “Component Reality Check.” Don’t let a formula change at a desk in Ohio dictate whether your stalls are profitable in 2028 — your own numbers should do that.
Complete references and supporting documentation are available upon request by contacting the editorial team at editor@thebullvine.com.
U.S. Dairy Genetic Evaluations Set for Historic Reset in April 2025 – Secure a massive early-adopter advantage by positioning your genetic pipeline for sustainability-driven premiums. This deep dive breaks down the historic 2025 reset and reveals the 2028 roadmap for microbiome and methane indexes.
The Sunday Read Dairy Professionals Don’t Skip.
Every week, thousands of producers, breeders, and industry insiders open Bullvine Weekly for genetics insights, market shifts, and profit strategies they won’t find anywhere else. One email. Five minutes. Smarter decisions all week.
Trace Elevation back twenty dams and you land on a cow imported from North Holland in 1879. Starbuck goes back to the same farm. So does half your herd.
On a cold Massachusetts morning in the late 1850s, a small group of state men rode up the lane to Winthrop Chenery’s Belmont farm and walked straight past the house toward the barn. They weren’t there for coffee. They were there to shoot his cows.
Rinderpest—cattle plague—had slipped into his little group of Dutch black‑and‑whites, and the Commonwealth had ordered the whole lot destroyed, sparing only one young bull in a last attempt to salvage something from the wreck. By all accounts, Chenery was a big man—six‑foot‑four, three hundred pounds—and he’d already seen enough of these cattle to know they weren’t like the native stock he’d been dealing in. One of the cows from his later shipment, Texelaar 51 H.H.B., would go on to put up a 76 lb 5 oz day and 744 lbs 12 oz in ten days in 1865, but on that rinderpest morning he was watching an earlier group of Dutch cows hit the ground one by one.
Nobody wrote down what he said while the rifles cracked. The records just tell us that, the very day the cattle were condemned, he sent word back to Holland for another lot. That’s all we really need to know about what was going through his mind.
They rode past the farmhouse with rifles, came for his Dutch cows, and still, before the day was over, Winthrop Chenery had already ordered another load from Holland.
Now, the thing about that era is that the American dairy cow was still a compromise. The typical “dairy” animal was a dual‑purpose Shorthorn or local native—good enough to pull the wagon and fill a pail, but not built for specialized commercial dairying. The Erie Canal had already turned New York into a grain corridor. After the Civil War, when grain prices sagged, you suddenly had a whole region where dairying looked like the next way to make a living. A big, true dairy cow with a stomach like a cement mixer and an udder to match made a lot more sense than a do‑everything ox.
The Dutch had already built that cow. She was big and black‑and‑white, from Friesland and North Holland, and she could outmilk almost anything in America at the time, both in pounds of milk and in butter when you put her on a seven‑ or thirty‑day test. Chenery saw that early. When the state shot his first imports, he didn’t go back to Shorthorns. He doubled down.
That stubbornness, plus one quirky error in a government report, set the stage for everything that came next.
Act I – A New Kind of Cow in a New Kind of Country
After the 1861 shipment landed—a bull and four more cows that escaped disease—Chenery finally had a little nucleus of Dutch cattle anchored by that surviving bull, Dutchman 37. He called them “Dutch cattle” in his own catalogs and letters, but in 1864 he sent an article to the U.S. Department of Agriculture in which he quoted Professor T. Low about the “Dutch or Holstein” breed. Somewhere in the editing room, “Holstein” drifted out of the quotation and into the heading.
When the first Holstein herdbook was printed in 1872, the name had stuck. A Dutch scientist, G.H. Hengeveld, fired off a letter pointing out that Holstein cattle were a different type and that these cows were actually Friesland and North Holland animals. Chenery later said he’d used “Dutch” in his original manuscript and blamed the change on officials in Washington, but he never went to war over it. The name “Holstein” rolled forward anyway, and three casual words in a government document ended up on millions of ear tags.
Chenery’s own cattle didn’t become the dominant cow families themselves—the historical record is blunt about that. His real contribution was scattering those Dutch genes into the countryside. By 1870, herds based on his cattle were operating in Vermont, Rhode Island, Connecticut, New York, Pennsylvania, Ohio, Iowa, Oregon, California, and at home in Massachusetts. His farm proved the type. Other men would prove what the type could do.
And that brings us to New York State.
If Chenery lit the match, New York was the tinderbox. New York City was the port where European cattle came ashore. The Erie Canal funneled those cattle, and everything they stood for, straight into the heart of a farm economy that was already shifting from grain to milk. Some families went west and helped build the dairy industries of Michigan and Wisconsin. Others drifted to the cities. A lot stayed put and turned to cows.
The men who started importing Holsteins into that setting weren’t fly‑by‑night speculators. They were orchardists, nurserymen, landed families, storekeepers turned breeders. The principals of Smiths & Powell already ran big nursery and fruit operations along Onondaga Lake near Syracuse. T.G. Yeomans in Walworth had 150 acres of orchards knit together with sixty miles of tile drains, with a line running within five feet of every pear tree. Gerrit S. Miller farmed land his grandfather had carved out of Oneida territory and grew up in a world where people like John Brown turned up at the house to talk about ending slavery.
Most of them had enough money—or enough nerve—to take a real risk. It cost around $300 a head to bring cattle from Holland at a time when the average man was making about $1 a day. That’s not dabbling. That’s pushing chips to the middle of the table.
Before they filled herd books and proof sheets, the first Holsteins to matter here were seasick Dutch cows on wooden decks, gambling their way across the Atlantic in rough weather.
Gerrit S. Miller – Three Great Cows and a Herd Called Kriemhild
If Chenery proved the Dutch cow could make it in America, Gerrit S. Miller showed just how far she could go.
In the late 1860s, Miller was at Harvard, studying science and the liberal arts and captaining what’s credited as the first organized football team in the country. When he walked out from Cambridge for exercise, he kept noticing a herd of black‑and‑white cows near Belmont—Chenery’s cows—and they made enough of an impression that when he went home to Peterboro he asked his father to let his brother, Charles Dudley, bring some over from Holland.
Dudley found his way to a cattle market at Weiner in West Friesland, way up at the northern tip of the Netherlands, and bought four head: the bull Hollander and the cows Crown Princess, Dowager, and Fraulein. He rode the ship back with them, took them by train to Canastota, then drove them along an old plank road to the Miller farm. That 1869 load was only the third pure Dutch shipment to the U.S., after Chenery’s 1857 and 1859 importations.
A young Charles Dudley Miller walked into a West Friesland cattle market in 1869 and walked out with four black‑and‑whites that would change North American dairying.
Dowager completed the first full annual milk record in the United States—12,681 lbs 8 oz on a record closing March 10, 1871. In a letter to Holstein pioneer Frank N. Decker, Miller explained that in 1868 a cow that did 6,000 lbs a year and 12 lbs butter in seven days was still considered exceptional. Dowager did that and then some, on two‑a‑day milking, with no grain at all in June, July, and August and grain made half of wheat bran the rest of the year. Fifty pounds of milk was her biggest day on that early record, and she hit it twice in one lactation.
Miller kept importing and selecting. In 1878 he went to Holland “with the express purpose” of buying the best milk cow he could find. He found Johanna in the herd of K.J. Akkerman in North Holland, brought her over, and in 1880 she stood first as milk cow over all breeds and ages at the New York State Fair. She wasn’t perfect on paper—a sloping rump, lots of white with specks—but she had extreme dairy quality and a big engine. Miller used her hard in his breeding program.
Two years later, while she was still in full flight at Peterboro, he turned Johanna out with another star, Empress, in the lush pasture by the Mansion House. Both old cows pushed up to 88 lbs in a day. Over a thirty‑one‑day stretch, Johanna averaged 80 lbs a day and made 2,407 lbs of milk. While she was at that height, Wisconsin breeder W.J. Gillett stopped in to buy a cow. On August 24, 1881—Miller’s diary spells it out—he wrote, “sold Johanna to Gillett & More of Wis. for $500.00.” In Gillett’s herd at Rosendale, Johanna really left her mark.
If Johanna was the workhorse, Empress was the model. Imported in 1879, she became Miller’s ideal of Holstein type. He said flat‑out that she was “the type I have been trying ever since to reproduce.” Compared with his big bull Billy Boelyn—weighing around 2,300 lbs—Empress measured twelve inches longer in body, an inch taller, and larger in every measurement except around the neck and front legs. She carried a one‑day milk record of 109 lbs and a yearly record of 19,714.5 lbs, world‑class in that time.
Then there was Ondine. Imported in 1879, she had already taken first prize as a three‑year‑old at Rotterdam in 1878. Under Miller’s ownership, she walked into the ring at the 1880 New York State Fair and beat Smiths & Powell’s previously unbeaten Netherland Queen for the championship. She then became the first Holstein cow in America to give over 90 lbs in a day, with individual records of 90½ lbs in one day and 2,545½ lbs in 31 days.
Looking back, those three cows—Johanna, Empress, and Ondine—were Miller’s Triple Crown. Everything else he bred over the next sixty years, he built around them.
Miller’s sire battery matched the quality of his cows. The foundation bull, Billy Boelyn, was chosen by a Dutch dealer with twenty years’ experience, who called him the best young bull in the country. He had the classic Dutch markings—black head, white mark on the forehead—and became the backbone of Kriemhild linebreeding. Empress and Billy Boelyn combined to produce Empire, the bull Miller rated as his best sire.
There’s a little farmyard story from Holland that tells you as much about Miller as any statistic. One day, a Dutch farmer waved him and his brother over. He said he had nothing for sale, but he’d like to show them his cows. Miller watched the herd, listened to the man talk about the cheese he was making, and one heifer caught his eye. He bought her. Only when the bill of sale was signed did the farmer put his name to it: Gerrit Smit. He suggested naming the heifer after his little daughter, Annitje. At that point Miller told him his own name—Gerrit Smith Miller—and that his grandmother and sister were both named Anne. Registered here as Nannie Smit, that heifer later headed the two‑year‑old class at the 1880 State Fair and became a key piece of the Johanna Rue branch of the family.
From these cows and sires Miller stacked generations. Johanna’s granddaughter Ononis, out of Onyx and by Empire, was sold in calf to Frederick C. Stevens. The calf, Sir Henry of Maplewood, grew into the leading show sire of the 1890s and one of the great ancestors of the breed. Sir Henry’s grandson Colanthus Abbekerk became Canada’s premier early foundation sire.
And Ondine? Her female line kept right on transmitting. About eighty years later, a bull named Round Oak Rag Apple Elevation was born. Ondine is his twentieth dam on the bottom side of his pedigree. Elevation sits at the absolute top tier of Holstein history, and his blood runs through bulls like Hanoverhill Starbuck. Starbuck, in turn, traces back not just to Ondine through Elevation, but directly to Johanna on his maternal line.
Think about that for a second. You could walk through a Canadian barn in the 1980s, look at Elevation and Starbuck daughters, and not realize you were looking at Kriemhild cows talking across a century.
Smiths & Powell – Turning Great Cows into a Population
While Miller was working away at Peterboro, a pair of nurserymen down by Onondaga Lake were paying close attention.
Wing and Judson Smith had started in cattle a year or two earlier, looking mostly for manure for their orchards and nurseries. They’d heard about a man in Madison County with a shipment of “Dutch‑Friesians” that were beating their Milking Shorthorns and brindle crosses. So they drove over to Peterboro to see for themselves.
They bought the bull Uncle Tom and the cows Aegis, Iris, Juniata, and Sappho from Miller and took them back to their operation at Lakeside Stock Farm. Those cows did exactly what the rumors said they’d do in the milk pail. The Smiths saw two things immediately: this breed was special, and Miller was making very good money. They decided to cut out the middleman and go straight to Holland.
They teamed up with William Brown Smith and son‑in‑law Edward Powell as Smiths & Powell and, starting in 1878, began importing Holsteins on a scale nobody matched. Over the years they brought in 1,293 head—about one‑sixth of all pure Dutch Holsteins imported to North America.
But here’s what really set them apart: it isn’t the number that matters as much as the names.
Their first Holland trip brought thirteen females, including Netherland Queen, who stood first as a yearling and as a two‑year‑old at the New York State Fair in 1878 and 1879 and made a 2‑year‑old yearly record of 15,614 lbs of milk. A year later they brought in her dam Lady Netherland and Lady’s calf Netherland Prince, who had been born after purchase and before shipment. They already had Netherland Princess and Netherland Duchess in the barn and later added Netherland Dowager, the paternal granddam of Prince.
From that group they built the Netherland family, known for size, strong type, and big milk with good butterfat. The bull Netherland Prince took his place alongside Neptune (from Aaggie) and Miller’s Billy Boelyn as one of the three great imported foundation sires. Prince’s sons—Netherland Monk, Prince Imperial, Netherland Carl, Netherland Statesman, Netherland Alban, and others—spread his genetics all over.
Their second major family came from a cow whose name Holstein people still say with respect: Aaggie.
Imported in 1879 as a five‑year‑old, Aaggie went on yearly test in 1880 with Aegis (one of Miller’s cows now at Lakeside). Early in lactation Aegis hit 82 lbs in a day; Aaggie topped her at 84. Over 365 days, Aegis made 16,823 lbs. Aaggie finished at 18,004 lbs, the first cow in the United States to cross the 18,000‑lb mark on a yearly record.
Her daughter Aaggie 2d, imported as a calf by their kinsmen T.G. Yeomans & Sons, produced 17,746 lbs of milk as a two‑year‑old, beating all previous records except her dam’s. Aaggie and Aaggie 2d both traced to the Dutch bull Rooker, whose blood had also yielded the record cowLady Clifden. The Smiths & Powell crew scoured Holland for daughters and granddaughters of Rooker’s sons, naming them all with the Aaggie prefix. They ended up with about 100 “Aaggie” animals.
The third pillar at Lakeside was Clothilde. Born in 1879 and imported in 1880, she produced 26,021 lbs of milk in 1885, setting a world record and proving that Holsteins could compete with Jerseys for butter production when put on proper tests. She was large, strong, and transmitted those traits. Seven of her daughters were by Netherland Prince, and their sons spread Clothilde’s blood across North America.
You can see their reach today if you open an old herdbook and walk the pedigrees forward:
Gerster 1917 H.H.B., imported by Smiths & Powell in 1881 and sold to Chapman Bros. in Ohio, stands behind bulls like Cook‑Farm Starbuck Flip, Canyon‑Breeze Allen, and Whittier‑Farms Apollo Rocket.
Aaggie Ida 2600 H.H.B., imported in 1882, shows up behind cows like Donnandale Skychief Jemima, Riverside Boast Ormsby Dad, and Southwind Bell of Bar‑Lee.
La Polka 2d 2774 H.H.B., from their 1882 imports, is back in Homestead Susie Colantha and Marshline Ormsby Blossom.
It wasn’t just that they imported a lot of cows. They imported the right cows, tested them hard on milk and butter, and then sold their sons and daughters across the country.
What most people don’t realize is that many red‑and‑white Holsteins today trace their red genes back to these same herds. After Miller brought in outcross bulls like Clothilde Monk and later used Aaggie Cornelia 4th’s Clothilde, red and white calves started appearing. Those patterns increased when Smiths & Powell leaned into the Clothilde and Aaggie bloodlines. That history is still lurking in the pedigrees of today’s roan and red Holsteins.
Henry Stevens – Reading Cows by Feel
If Miller was the master cow man and Smiths & Powell were the big engine builders, Henry Stevens of Brookside Farm was the bull man.
Brookside sat just south of Lacona, New York, on land granted to Henry’s great‑grandfather for Revolutionary War service. Henry’s first Holsteins—cows May and Juno—were bought straight out of Miller’s herd for $300 apiece. From there he built his program around four foundation cows: DeKol 2d, Netherland Hengerveld, Belle Korndyke, and Helena Burke.
On paper, each of those cows made solid official records for their day—mid‑20‑lb butter tests, strong yearly numbers. Their real magic came through their sons:
DeKol 2d’s son DeKol 2d’s Butter Boy and grandson DeKol 2d’s Paul DeKol built the DeKol line.
Belle Korndyke produced Pontiac Korndyke, a key figure in the long Pontiac bull family.
Netherland Hengerveld’s line ran through Hengerveld DeKol, linking those families together.
Helena Burke’s son DeKol Burke led to the Burke family, which eventually produced bulls like Wisconsin Admiral Burke Lad.
The twist in Stevens’ story is that he did some of his best work after he lost his sight.
An illness in middle life left him blind, but he didn’t quit. People remembered him walking down the cow alley at Brookside with a hand on the halter rope, then turning loose and letting his fingers do the judging. He’d follow the curve of a rib, feel the spring in the barrel, test the pliability of an udder, even trace hair to tell where black gave way to white. His sons trusted his hands more than their own eyes when it came time to decide which heifers stayed and which bulls went out. The records back that faith up.
Blind before his best years as a breeder, Henry Stevens still “saw” cows better than most men with sight—reading frame, rib and udder with nothing but his hands.
DeKol 2d herself was imported by B.B. Lord & Son in 1885, sold to J.B. Dutcher & Son, and later bought by Henry Stevens & Sons, Lacona. From there, her descendants spread everywhere. Holstein historians calculate that her blood is shared in common with roughly 7.2% of the modern general herd—an astonishing saturation for one cow.
By the 1920s, Henry’s sons, trading as Stevens Bros.–Hastings Company at Liverpool, New York, were running what the Importers history calls “the most influential Holstein farm of the 1920s,” anchored by the bull King of the Pontiacs. The bull power that started with those four Brookside cows and a blind man’s hands helped carry Holsteins into the machinery era.
You see “DeKol” or “Pontiac” stacked three or four times in an older pedigree, and you’re looking straight back at Brookside and a breeder who literally felt his way into the future.
B.B. Lord & Son – A Bridge North
Head west across New York and you come to Sinclairville in Chautauqua County. Just south of the little bridge over Mill Creek lies what used to be Sinclairville Stock Farm, 110 acres owned and worked by Bela B. Lord and his son Clarence.
From 1882 to 1889, B.B. Lord & Son shipped 178 head of Holsteins to Canada—about 12.5% of all Canadian imports—and many of those animals ended up as foundation cows. Working in partnership with Michael Cook & Son of Aultsville, Ontario, they put together almost all the main building blocks of the Posch‑Abbekerk strain:
Tidy of Downie, dam of Tidy Abbekerk, one of the cornerstone cows.
Aaltje Posch 4th, foundation female of the Posch family.
Hiemke 3d, dam of Abbekerk Prince 2d.
Mercena, whose female line produced Pauline Colantha Posch and ultimately King Toitilla Acme.
From those cows came the Mount Victoria Farms herd at Hudson Heights, Quebec, and sires like Prince Colanthus Abbekerk Extra, Canada’s first Class Extra bull and a worldwide influence. Another Lord cow, Disone 6268 H.H.B., went to H.M. Williams and then to A.B. Mallory. Her descendants include May Echo Sylvia (seven world records in 1916), Re‑Echo May Burke EX (world champion in 1950 at 35,314 lbs milk and 1,261 lbs fat in an 11‑year‑old 3X record), and A.B.C. Reflection Sovereign EX‑Extra, sire of multiple All‑American get‑of‑sire groups.
Even Lord cows that stayed in the States made noise. Milly 5153 H.H.B., imported in 1883, shows up as sixth dam of May Walker Ollie Homestead, dam of Sir Inka May. That ties in Shadeland Daisy and other Shadeland blood further back.
Lord’s operation gradually drifted toward horses—French Coach, Percherons, Standardbred trotters—and Holsteins slid out of focus. But by then the cattle they’d picked and shipped were already planted all over Canada and the northern U.S. If you work with Posch‑Abbekerk descendants, Pauline Colantha Posch blood, or some of the old King Toitilla Acme lines, you’ve got a little bit of Sinclairville running in your herd.
Regional Pioneers – The Web Tightens
Once the big New York pipelines were flowing, a second wave of importers stepped in. Their names might not be as famous on the surface, but if you spend any time chasing deep pedigrees, you bump into them constantly.
Take Alonzo Bradley of Lee, Massachusetts. He was a lumberman before he turned to farming and made six trips to Holland between 1879 and 1884, picking cattle off the ground himself. Among his imports were Segis 5765 H.H.B.,Pietertje 2d 3273 H.F.H.B., and Aaltje Salo 5868 H.H.B. Those cows became the headwaters of the Segis, Pietertje, Rag Apple, and Ormsby families—names that echo later in bulls like King Segis and Johanna Rag Apple Pabst. Bradley sold just twelve young females to H. Rust & Bros. in Wisconsin. From that small group came, generations later, cattle like Hanover‑Hill Triple Threat and Snow‑N Denises Dellia and the cow families they started.
Protein would have to be worth 3× fat for this TPI shift to pay. Your milk check says it isn’t. Where does that leave the bulls you’ve been loading into your tank?
[Editor note: “Mark H.” and “Sara L.” in this article are composite characters built from real barn math and industry context to illustrate decisions many 500‑cow dairies face in 2026.]
The new TPI weights don’t just tweak your sire list. They push the Holstein breed in a new direction for the next 10–15 years. This isn’t a milk check issue alone; it quietly changes the fundamental type of cow the industry breeds for over the next decade.
Holstein USA’s April 2026 TPI formula doesn’t just nudge protein; it rewards the protein‑to‑fat ratio over total output. That’s a fundamentally different breeding goal from previous iterations that treated fat and protein more evenly in the production slice. If you follow that signal unthinkingly in a US Class III component grid, a 500‑cow herd can easily leave about $17,500 a year on the table.
Mark H., who milks 500 Holsteins in New York, only saw “five‑point tweaks” when Holstein USA shifted TPI production weights to 24% protein and 14% fat, and Lactanet moved Holstein LPI production to 40% fat, 60% protein. Under pressure from reps and neighbors, he leaned into the new high‑TPI, protein‑heavy bulls — and that’s where the barn math started to disagree with his milk check.
2026 TPI Formula Changes: A Directional Shift, Not a Tweak
Holstein USA’s 2026 TPI formula update increased the weighting on PTA Protein from 19 to 24 and decreased the weighting on PTA Fat from 19 to 14. That’s the headline change in the production slice.
By early 2025, Mark’s Federal Order milk check looked like most US Class III/IV component checks. USDA Class III and IV component reports through 2023 and into 2025 often show butterfat prices near the high‑$2.80s to low‑$3.00s per lb, with protein commonly in roughly the $1.80–$2.50 per lb range, depending on the month and year. In several recent months, that’s meant fat is worth more per pound than protein on his component line.
At the same time, the TPI formula did something very different inside the index. It moved the production weights from:
19% protein, 19% fat → to → 24% protein, 14% fat.
On the surface, you see a five‑point bump to protein and a five‑point cut to fat. Simple enough.
When Mark’s nutritionist and genetics advisor, Sara L., put a pen to it at his kitchen table, she wrote one line that changed the whole conversation:
Old protein:fat leverage = 19:19 = 1.0
New protein: fat leverage = 24:14 ≈ 1.71
Inside the production slice of TPI, one pound of PTA Protein now pulls like roughly 1.7 pounds of PTA Fat. That’s roughly a 70% increase in protein’s leverage over fat, even though Holstein USA’s own description says the formula is designed to yield “additional pounds of fat and protein, with slightly more emphasis on protein.”
Because protein yield is closely tied to milk volume in most Holstein evaluations, loading selection on the P/F ratio nudges herds — and over time the breed — toward higher‑volume, more fluid‑style cows, even while most plants continue to pay based on total fat + protein sold.
The formula isn’t creating more total components — it is redistributing emphasis. A hard P/F chase moves components away from fat instead of maximizing total pounds of fat + protein you sell. TPI is now quietly rewarding the ratio more than the total output. That’s a different breeding goal than the one that built the modern high‑component Holstein.
Lactanet did something similar but more transparent. Its April 2026 bulletin spells out that shifting Holstein LPI production from 60F:40P to 40F:60P is meant to “better reflect anticipated changes in milk pricing and processor demand, particularly the growing emphasis on protein,” and that it should cause only minor reranking among top animals. Canada’s move is explicitly anchored in its quota‑based pricing math and processor demand; it’s internally consistent with that market.
Holstein USA’s change, by contrast, is big enough to push fat‑heavy bulls down the list and protein‑heavy bulls up, even when no new daughters are added. The 24P:14F production weighting behaves more like a new rulebook for which cow wins — especially in how it reshuffles bulls with very different fat vs protein profiles. Mark saw that on the spring lists. He just hadn’t tied it back to dollars or to the kind of cow he was breeding for 2036.
2026 TPI vs Total CFP: Two Paths for the Same 500‑Cow Herd
To get past the rhetoric and the rankings, Sara asked Mark to walk through two very different five‑year futures off the same starting herd. Same cows today, different sire lists from 2026 through 2030.
They agreed on a realistic starting point for his 500‑cow Holstein herd:
Fat: 1,070 lb/cow/year
Protein: 840 lb/cow/year
Total components (CFP): 1,910 lb/cow/year
That’s roughly a 26,700‑lb Holstein at ~4.0% fat and 3.1% protein — very normal for a well‑managed commercial herd.
These gains are illustrative — built to show directional outcomes, not to predict any specific bull’s future proof. Actual genetic trends will vary by herd, sire choice, and whatever comes out of the April evaluations.
Path 1: Follow the 2026 TPI Formula — Chase the Ratio
If Mark listens to the new 24P:14F signal and leans into bulls that look fantastic on updated Holstein TPI 2026 lists, he’s going to pick a lot of sires that:
Carry high PTA Protein
Have only moderate PTA Fat
Sit at P/F ratios ≥0.60
Those are the profiles that jumped when TPI changed — protein‑strong, fat‑lighter bulls that TPI now likes roughly 1.7× more per pound of protein than per pound of fat.
Looking at typical genomic bull PTAs and recent trends, Sara used conservative, scenario‑level genetic gains for a herd that picks sires that way:
+6 lb PTA Fat per year
+8 lb PTA Protein per year
Over five years of bull selection, that’s +30 PTA Fat and +40 PTA Protein at the sire level. With a realistic ~2.5‑year lag from bull usage to milking cows, about half of that gain has flowed into the cow herd by Year 5:
+15 PTA Fat, +20 PTA Protein in the herd.
Translate PTAs to actual production (roughly 2 lb actual per lb PTA on mature daughters):
+30 lb fat, +40 lb protein per cow per year by Year 5.
So if Mark “follows TPI,” his Year‑5 average cow looks like this:
Fat: 1,070 + 30 = 1,100 lb
Protein: 840 + 40 = 880 lb
Total CFP: 1,980 lb
P/F ratio (by lb): 880 ÷ 1,100 ≈ 0.80
He’s now got a prettier P/F ratio and more protein. That’s what the formula rewards.
Path 2: Follow Total Output — Anchor on Combined Fat + Protein
The alternative is boring but powerful. Ignore the TPI noise and:
Filter bulls first on a profit index that actually starts from dollars — Net Merit (NM$), Cheese Merit, or a similar economic index.
Within that filtered list, sort bulls by Fat PTA + Protein PTA (total CFP).
Keep bulls with P/F in a sane band, roughly 0.50–0.60, so you’re not accidentally tanking protein.
That’s very similar to how Lactanet positions Pro$ and LPI: as profit‑oriented tools tuned to Canada’s component pricing and costs, with the production subindex explicitly anchored to fat and protein yields.
For a herd following that logic, Sara assumed slightly different gains:
+9 lb PTA Fat per year
+7 lb PTA Protein per year
Over five years, that’s +45 PTA Fat and +35 PTA Protein among the sires, or about half in the cow herd by Year 5:
+22.5 PTA Fat, +17.5 PTA Protein.
Translate to actual:
+45 lb fat, +35 lb protein per cow per year by Year 5.
Now Mark’s “CFP‑anchored” herd is at:
Fat: 1,070 + 45 = 1,115 lb
Protein: 840 + 35 = 875 lb
Total CFP: 1,990 lb
P/F ratio: 875 ÷ 1,115 ≈ 0.79
Notice what happened: the TPI‑driven path didn’t grow total CFP faster; it just redistributed pounds from fat to protein to achieve a prettier ratio. That is the “ratio over output” trap.
Because protein yield is closely tied to milk volume in most Holstein evaluations, selecting aggressively for the P/F ratio doesn’t just shift your component ratio — it tends to nudge herds toward higher‑volume, more fluid‑style cows. You’re nudging both your herd and, if enough herds follow, the breed toward a fluid‑market cow in a component‑driven system.
2026 Selection Paths for a 500‑Cow Herd (Year‑5 Scenario)
Metric (per cow/year)
Path 1: TPI Ratio Chase
Path 2: CFP Anchor
Difference
Fat yield (lb)
1,100
1,115
–15 lb
Protein yield (lb)
880
875
+5 lb
Total CFP (lb)
1,980
1,990
–10 lb
Fat revenue @ $3.00/lb
$3,300
$3,345
–$45
Protein revenue @ $2.00/lb
$1,760
$1,750
+$10
Total components revenue
$5,060
$5,095
–$35/cow
500-cow herd annual loss
—
—
–$17,500
The $17,500 Gap: Paper Cows vs Real Cows
To keep the math honest, Sara anchored everything to real US component prices.
USDA Class III and Class IV component reports through 2023 and into 2025 often show butterfat prices near the high‑$2.80s to low‑$3.00s per lb, with protein commonly in roughly the $1.80–$2.50 per lb range. In several recent months, that’s meant fat worth more per pound than protein on a Federal Order check.
For barn‑table math, she used simple, conservative averages:
$3.00/lb fat
$2.00/lb protein
She wasn’t trying to pick a magic month. She wanted Mark to see the difference.
Using the Year‑5 cows they just built:
Ratio herd (TPI‑driven)
Fat dollars: 1,100 lb × $3.00 = $3,300
Protein dollars: 880 lb × $2.00 = $1,760
Total components revenue: $5,060/cow/year
CFP herd (milk‑check‑driven)
Fat dollars: 1,115 lb × $3.00 = $3,345
Protein dollars: 875 lb × $2.00 = $1,750
Total components revenue: $5,095/cow/year
The difference:
$35/cow/year — in favor of the boring CFP herd.
At 500 cows:
$35 × 500 = $17,500/year.
On paper, the ratio‑focused herd “improved” faster. In the tank and on the check, the CFP herd won. That’s the danger of breeding for a mathematical ratio instead of real‑world output.
If your operation is already navigating tight margins under current milk prices, that $17,500 is serious money — the kind of structural bleed the Bullvine explored in “2025’s $21 Milk Reality: The 18‑Month Window to Transform Your Dairy Before Consolidation Decides for You,” which showed how a $21.60/cwt milk price could wipe out about $125,000 a year from a typical 500‑cow dairy’s profits if nothing changes.
Using the same 26,700 lb/cow:
26,700 lb ÷ 100 = 267 cwt/cow/year
Then:
Ratio herd: $5,060 ÷ 267 ≈ $18.95/cwt
CFP herd: $5,095 ÷ 267 ≈ $19.08/cwt
While 13¢/cwt may not feel like a crisis in year one, over a decade, it represents a meaningful directional bleed — and it points the herd toward a more fluid‑style cow while your plant still pays you on components sold.
What Does the 3× Protein Break‑Even Really Mean for Your Milk Check?
Mark’s next question is probably the same one you’re thinking: “Sure, that’s with today’s pricing. What if protein really outpaces fat?”
So they stacked the deck for protein. Lactanet’s April 2026 article is explicit that they expect more emphasis on protein in Canadian milk pricing because of processor demand and SNF‑heavy products, and that LPI’s tilt is intended to reflect those anticipated pricing changes. Some specialty protein markets and niche contracts already pay a heavier protein premium than the standard Federal Order grid. The question is whether your check looks like that.
To mirror a “protein‑friendly” future, Sara tried:
$2.80/lb fat
$3.50/lb protein
That’s a world where protein is worth ~25% more per lb than fat — much more protein‑heavy than many recent US Federal Order months, but not fantasy.
Run the Year‑5 cows again:
Ratio herd
Fat: 1,100 × 2.80 = $3,080
Protein: 880 × 3.50 = $3,080
Total: $6,160/cow/year
CFP herd
Fat: 1,115 × 2.80 = $3,122
Protein: 875 × 3.50 = $3,062.50
Total: $6,184.50/cow/year
Even in that protein‑leaning grid:
The CFP herd is still $24.50/cow/year ahead.
On 500 cows, that’s about $12,250/year.
The trade behind that number:
Fat lost vs CFP herd: 15 lb × $2.80 = $42
Protein gained vs CFP herd: 5 lb × $3.50 = $17.50
Net: $24.50 worse for the ratio herd.
The milk check still doesn’t care that TPI loves Mark’s higher P/F ratio.
Sara wrote the trade on the board:
Ratio herd vs CFP herd Year 5: –15 lb fat, +5 lb protein.
For the ratio herd to make more money on components, you’d need:
5 × protein price > 15 × fat price
So the break‑even is:
protein price ÷ fat price > 3.0
Unless your component grid effectively values protein at 3× the price of fat, you’re being paid to maximize total output, not to reshuffle the ratio.
Scenario
Fat Price ($/lb)
Protein Price ($/lb)
Protein÷Fat Ratio
TPI Path Winner?
Current US avg (2024–25)
$2.95
$2.33
0.79
❌ CFP wins by $35/cow
Protein-lean month
$3.00
$1.80
0.60
❌ CFP wins by $45+/cow
Protein-heavy scenario
$2.80
$3.50
1.25
❌ CFP still wins by $24.50/cow
Break-even threshold
$2.00
$6.00
3.0
= Tie
TPI math finally pays
$2.00
$6.50+
>3.0
✅ TPI path wins
USDA Federal Order Class III/IV component data through 2024 and early 2025 doesn’t show anything remotely like that. Protein moves around. Some months it’s close to fat. For many months, it’s been cheaper. But nowhere does it sustainably hit 3× fat per lb.
Who Benefits When TPI Chases Protein?
After the 3× math sank in, Mark asked the question every producer should be asking: “If this doesn’t make sense for my milk check, who decided to do it — and who does it make sense for?”
It’s a fair question. And Holstein USA’s own numbers make it sharper than you’d expect.
TPI’s Own Economics Say Fat Is Worth More
Holstein USA’s Feed Efficiency Dollar (FE$) formula — the economic engine inside TPI — uses these component values:
Fat: $1.86/lb
Protein: $1.75/lb
Milk: –$0.0025/lb
That’s straight from Holstein USA’s published TPI formula page. Protein ÷ fat = $1.75 ÷ $1.86 = 0.94. In their own economic model, fat is slightly more valuable than protein.
But in the TPI production weighting, protein gets 24% vs fat’s 14% — a ratio of 1.71 favoring protein.
Read that again. The economics inside the formula say fat ≥ protein. The weighting applied on top of those economics values protein at 71% more than fat. Those two things can’t both be right at the same time.
And those FE$ component prices? Holstein USA’s own TPI materials show FE$ component values of $1.86 for fat and $1.75 for protein, tied to updated cheese‑market economic assumptions released since 2021. Whatever exact update cycle you use, the current published FE$ values still favor fat over protein — $1.86 vs $1.75. And compared to the April 2021 FE$ values ($1.55 fat, $1.73 protein), fat’s advantage has actually grown: fat jumped 20% while protein barely moved. The formula’s own economics are drifting toward fat even as the production weighting lurches toward protein. The FE$ values are net of feed cost, so they’re not directly comparable to AMS spot prices — but the direction is the same. In January 2025, USDA reported butterfat at $2.9460/lb and protein at $2.3267/lb, a protein/fat ratio of just 0.79. Whether you look inside the formula or outside it, fat keeps winning. The 24P:14F weighting doesn’t reflect that.
By contrast, USDA’s Net Merit 2025 update used current AGIL data and moved toward fat and away from protein. Same data agency, different conclusion.
Is This a Processor’s Index or a Farmer’s Index?
Holstein USA’s stated rationale includes alignment with processor demand for casein and the observation that genetic gains for protein have lagged behind fat in recent years. That’s a processor‑supply argument — cheese plants absolutely want more casein per vat because it drives cheese yield.
But here’s where it gets uncomfortable: a farmer doesn’t get paid on cheese yield per vat. You get paid on the total pounds of fat and protein sold, at whatever the Federal Order grid says those pounds are worth. If TPI steers the breed toward protein at fat’s expense, processors get more of the component they want for cheese yield — while farmers may end up with fewer total component dollars per cow under the actual Class III grid.
The Bullvine’s own analysis of the component revolution showed that processors are already capturing a 12.5% cheese yield windfall from higher components, and asked the pointed question: Are farmers getting their fair share of that value?
That doesn’t mean there’s a conspiracy. It means TPI may be optimizing for a processor’s view of what the breed should look like, not necessarily for the farmer’s milk check. If you’re making breeding decisions based on TPI, you should know whose economics the formula is actually serving.
Why Such a Big Swing?
If the goal was to keep protein gains from falling too far behind fat genetically, a modest adjustment might make sense. Go from 19:19 to maybe 21:17. Nudge it.
The question Holstein USA hasn’t clearly answered: if your own FE$ economics say fat ≥ protein, and AMS prices have only reinforced that since 2021, why did the production weighting move this far in the other direction?
Net Merit vs TPI 2026: Two Models, Two Directions
Mark’s not operating in a vacuum. While TPI’s production slice is shifting toward protein, Net Merit 2025 explicitly moved the other way, increasing the emphasis on fat and reducing the emphasis on protein to match observed component price trends.
Bullvine’s Net Merit 2025 analysis in “Net Merit’s $57 ‘Weight Tax’: How to Pick Holstein Bulls That Still Pay”shows:
Protein’s share of NM$ dropping from 19.6% to 13.0%.
Fat’s share is increasing from 28.6% to 31.8%.
Feed Saved rising to a combined 17.8% of NM$ when you add Residual Feed Intake and the negative Body Weight Composite (a ‑11% emphasis that acts as a $57 “weight tax” per BWC point, per daughter).
In plain language:
NM$ 2025: rewards fat strongly and penalizes big cows, aiming for smaller, efficient, high‑component animals that fit real feed and component markets.
TPI 2026: increases protein leverage over fat within the production slice and continues to favor higher body weight more than NM$, nudging toward bigger, more fluid‑type cows.
Lactanet’s LPI shift for Holsteins back to 40F:60P is explicitly anchored to “evolving industry directions and milk pricing changes” in Canada and is expected to cause only “minor reranking” of top bulls. The Canadian system is internally consistent with its own pricing math.
The bottom line: the Canadian system is internally consistent with its market. NM$ 2025 is internally consistent with current USDA economics. TPI 2026’s production slice is inconsistent with its own FE$ values or recent AMS pricing data. That’s not a small discrepancy. It’s a question the industry should be asking out loud.
If thousands of herds follow this TPI signal, we don’t just change individual milk checks; we start re‑steering the Holstein breed toward more volume and less fat density over the next 10–15 years. That’s a directional shift for the whole breed, not just a personal quirk for one 500‑cow dairy.
Index
Fat Weight
Protein Weight
Body Size Emphasis
Market Anchor
NM$ 2025 (USDA)
+31.8%
+13.0%
–11% penalty
AGIL/Federal Order economics
TPI 2026 (Holstein USA)
+14%
+24%
+4% (slight favor)
Processor casein demand
LPI 2026 (Lactanet CA)
40%
60%
Neutral/moderate
Canadian quota pricing
Cheese Merit (USDA)
Higher than NM$
Lower than TPI
Negative (like NM$)
Class III cheese yield value
The Turn: When Mark Stopped Letting TPI Drive
By the end of that kitchen‑table session, Sara hadn’t told Mark to throw TPI in the garbage. She just forced a role change.
Before this spring, Mark treated TPI as the main definition of “good bull.” If a bull climbed the list, he needed him in the tank. If a bull slid, he wondered if he’d made a mistake.
The hardest part wasn’t the math. It was the social pressure.
When a bull is all over social media and climbing the TPI list, it feels like a mistake not to use him. That pressure is real. But a bull rising because a formula changed — not because his daughters produce more total components or more dollars under your grid — isn’t a signal. It’s noise.
After walking through the 70% protein leverage inside 24P:14F, the Year‑5 scenario math, the $35/cow/year gap at realistic component prices, the 3× protein/fat break‑even that the market’s never touched, the contradiction between TPI’s own FE$ economics and its production weighting, and the biological reality that high‑protein selection leans toward more volume, Mark could see one thing clearly:
“If I let TPI steer my breeding program, I’m not actually breeding for the cow my milk check pays best. I’m breeding for the cow the index designer likes.”
So he made three quiet decisions for 2026:
Pick his steering wheel. NM$ (or Cheese Merit for his Class III plant) now decides which bulls make it to the short list; TPI is a filter, not the boss. If you want to understand how NM$, Cheese Merit, and the other CDCB indexes actually work — and why the April 2025 NM$ update already shifted weight toward fat and away from protein — the Bullvine’s “Net Merit’s $57 ‘Weight Tax’: How to Pick Holstein Bulls That Still Pay” walks through the new weights and practical filters in detail.
Stay obsessed with total CFP. Every bull on his “heavy‑use” list has to be elite for fat + protein pounds, with P/F in the 0.50–0.60 band. The ratio‑pretty but mid‑pack CFP bulls get used carefully, not across the whole herd.
Let his milk check, not the buzz, define success. If a bull looks great on high‑TPI slide decks but doesn’t add more dollars per cow under Mark’s own fat and protein prices, he’s a luxury, not a core sire.
He didn’t burn down his program. He just stopped confusing a breed index with a cheque.
The Playbook: 30/90/365 Days to Get Out of the TPI Protein Ratio Trap
You don’t have to change everything overnight. You have to stop reinforcing the bias that’s quietly bleeding your components and reshaping your herd type.
In the Next 30 Days: Stop Digging
1. Audit your top bulls for P/F bias
Pull the 5–10 sires you’ve used the most in the last 12 months.
For each, jot down PTA Fat, PTA Protein, total CFP (fat+protein), and P/F (protein ÷ fat).
Count how many of your heavy‑use bulls are P/F ≥0.65 and not in the very top tier for total CFP.
If that’s more than a couple, you’re already leaning into the ratio side of the trap.
2. Freeze new orders on extreme ratio bulls
Any bull that’s P/F ≥0.65 and only average for CFP goes on a “no reorder” list until you’ve rebalanced.
Use remaining straws on lower‑value cows or recips if you like; don’t keep filling the tank.
3. Build a CFP‑first short list from a profit index
Tell your rep exactly what you want:
Filter bulls first on NM$, Cheese Merit, or your co‑op’s profit index, not TPI.
Within that filtered list, sort bulls by Fat PTA + Protein PTA.
Keep bulls with P/F roughly 0.50–0.60 and decent PL/DPR (or Herd Life/Fertility in Canada).
If a bull is high TPI and top‑end CFP under your grid, great. If he’s only high TPI because the formula loves his P/F, be cautious.
4. Check your actual fat and protein prices
Grab your last milk check and write down:
Fat price ($/lb)
Protein price ($/lb)
Then do one quick ratio: Protein ÷ Fat.
If that number is nowhere near 3.0, a pure P/F chase isn’t justified by your pay structure. In the most recent US Federal Order Class III/IV data from 2023–early 2025, it sits well under 2.0 and often between about 0.6 and 1.2.
In the Next 90 Days: Rebalance Without Blowing Up Your Program
5. Watch the cow type you’re breeding
Look at your last group of fresh heifers:
Are your best “new genetics” cows the ones with the highest components per cwt, or the highest volume?
Are you seeing more long, big‑framed, fluid‑type heifers in the pipeline than you expected?
If you’re on a component grid, your index choices shouldn’t slowly turn your herd into cows that fit a fluid market you don’t sell into.
6. Re‑tier your sires by role
Split your bull battery into:
Core sires (60–70% of matings): High profit index, high CFP, P/F in the 0.50–0.60 range, solid fitness.
Specialty sires (10–20%): Extreme type or high‑TPI ratio bulls you still want a little of — used intentionally, not across the board.
Clean‑out sires: Ratio‑heavy or weak‑CFP bulls; finish their straws on lower‑value cows or phase them out.
This keeps your main genetic direction pointed at components and cow style that actually pay, while still letting you play with a few favorites.
7. Re‑score your genomic heifers with a custom index
Ask your genetic provider to compute a simple custom score:
Use that score for replacement vs beef decisions and prioritizing heifers for sexed semen. If two heifers are similar, the one whose parents are genuine component earners under your grid wins over the one whose parents look good on P/F.
In the Next 365 Days: Let Your Own Data Judge the Indexes
8. Tag daughters by sire group and track components
Pick a few bulls as “test cases”:
Group R (ratio): 2–3 bulls with high P/F that gained TPI spots in April 2026.
Group C (CFP): 2–3 bulls with strong total fat + protein and balanced P/F.
For daughters freshening over the next year, tag them by sire group in your records and track fat lb, protein lb, and CFP over 305 days (or good projections). You’re not trying to do a PhD. You want enough signal to see whether your ratio group or your CFP group is doing more work for your cheque.
9. Do a simple “by‑sire” milk check sanity check
Once you’ve got at least a dozen daughters per group, use your actual component prices from the past 12 months:
Calculate $/cow/year from fat + protein for Group R vs Group C.
If Group C cows are clearly ahead by more than $20–30/cow/year on components and aren’t worse on fertility/survival, that’s your own proof that CFP bulls beat P/F bulls under your grid.
If Group R genuinely beats Group C under your grid and costs, you might be one of the rare operations where a strong protein tilt actually pays. Either way, you’re making decisions off your own data, not somebody else’s formula.
10. Build your own index — and stick to it
Sit down with your advisor or rep and formalize your own weights for fat, protein, fertility, longevity, and maybe feed efficiency. Have them build a custom index in their software that matches your milk check and cull costs rather than TPI’s 24P:14F weights. Commit: new bulls get chosen on that index first, then filtered by TPI, type, or show traits as needed.
At that point, you’re not arguing with Holstein USA or Lactanet. You’re just letting them have their opinion while you follow your money.
What This Means for Your Operation
Run the P/F sanity check on your lineup. This week, pull the main bulls you’re using and calculate P/F and CFP. If most of your semen is going to P/F ≥0.65 bulls who aren’t top‑end CFP, you’re not maximizing output — you’re redistributing it away from fat instead of maximizing total fat + protein sold.
Watch the cow type you’re breeding. Your sire choices today decide whether your 2036 herd is built for a fluid market or a component market. If your plant still pays more per pound for fat than protein, you don’t want your index pushing you toward big, fluid‑style cows.
Your milk check decides your index — not the other way around. A breed index can move toward protein without your grid ever justifying the shift. If your cheque still pays more per pound for fat than for protein, you’re being paid to maximize total components, not to chase a ratio.
Use the 3× rule as a hard brake. If protein on your check isn’t worth anywhere near three times fat per lb — and in most US Federal Order markets it won’t be — a strong P/F chase won’t pay under the kind of “15 fat for 5 protein” genetic trade the 24P:14F world incentivizes.
Ask whose economics the index is actually serving. Holstein USA’s own FE$ values put fat at $1.86 and protein at $1.75 — fat wins. But the production weights say protein is 71% more important. If the formula’s own economics don’t justify the weighting, ask who benefits from the direction the breed is being steered.
Don’t assume Canada’s direction validates the US move. Canada’s formula makes sense for Canadian quota‑based component pricing. Copying the protein pivot without copying the pricing logic is how you end up selecting for the wrong cow in the wrong market.
Do one contract‑check in the next 30 days. Before you order your next semen, pull your last 12 months of checks and write down average fat and protein prices. Divide protein by fat. If that ratio doesn’t look anything like the weights inside the index you’re following, adjust how you use that index.
Key Takeaways
Directional shift, not a tweak. If a 500‑cow herd follows the 24P:14F TPI signal hard for five years, scenario math shows it can give up around 15 lb fat per cow per year to gain only about 5 lb protein — and end up roughly $35/cow/year behind a CFP‑anchored strategy under realistic US Federal Order component prices.
Market vs formula mismatch. Protein would have to be worth more than 3× fat per pound for that kind of trade to win on components alone. Recent Class III/IV data from 2022–2024 haven’t come close.
The formula contradicts its own economics. TPI’s FE$ engine values fat at $1.86/lb and protein at $1.75/lb — fat wins. But the production weighting gives protein 71% more leverage than fat. The internal economics and the external weighting point in opposite directions.
Follow the incentives. TPI’s stated rationale includes processor demand for casein. That’s a cheese‑yield argument, not a farmer‑profitability argument. Your milk check pays on total fat + protein sold, not on cheese yield per vat.
Paper vs tank. It’s now possible for a herd to look better on paper without actually selling more total pounds of components. That’s exactly what happens when a formula rewards a ratio instead of total output.
The Bottom Line
One question matters more than any list or formula: What did your plant actually pay per pound for fat and per pound for protein over the last 12 months — and do the bulls you’re buying make more money under those numbers, or under someone else’s?
Complete references and supporting documentation are available upon request by contacting the editorial team at editor@thebullvine.com.
Learn More
The Holstein Bulls Bleed Pregnancies in Arizona Heat – Gain an immediate edge in your summer reproduction program. This breakdown delivers the specific DC305 filters needed to expose the high-NM$ bulls failing your herd in the heat, arming you with a $360-per-daughter reproductive rescue plan.
Gene Editing: The Next Frontier in Dairy Cattle Breeding – Prepare for the most significant disruption in a generation. This technical roadmap reveals how gene editing for heat tolerance and disease resistance could bypass decades of traditional breeding, delivering an unfair advantage to those ready to embrace the next frontier.
The Sunday Read Dairy Professionals Don’t Skip.
Every week, thousands of producers, breeders, and industry insiders open Bullvine Weekly for genetics insights, market shifts, and profit strategies they won’t find anywhere else. One email. Five minutes. Smarter decisions all week.
Holstein USA and Lactanet both shifted toward protein in the same proof round. Your mating list doesn’t know yet.
Executive Summary: HORSESHOE is the kind of bull most people had buried in the middle of the list; under the 2026 TPI formula, he jumps an estimated 10 spots while GARZA, the current #2, slides down the rankings on the same December proofs. Holstein USA is shifting TPI to 24% protein and 14% fat at the April 2026 run, and Lactanet is flipping Holstein LPI production from 60F:40P to 40F:60P, so both major indices are now paying more for protein than fat at the same time. Bullvine reran the December 2025 top‑25 daughter‑proven TPI sires through the new weights and found that fat‑heavy bulls like GARZA, RICHE, and RIVERA lose ground, while high P/F bulls like POWERHOUSE, HORSESHOE, and CAPN MIGUEL pick up points and rank before a single new daughter is added. If more than two of your top five service sires have P/F ratios under 0.5 and weak PL or DPR, you’re effectively breeding for the old formula while semen companies and processors are already repricing around protein and longevity. The immediate risk is over‑exposure to fat‑dominant sires you’re sitting on by the 100‑unit cane; the opportunity is to quietly pivot toward bulls whose component mix and PL match where TPI, LPI, and casein markets are actually headed. The article walks through the full “winners and losers” table, a simple P/F check you can run in five minutes, and a 30‑day plan to talk with your AI rep and adjust spring matings without panic.
Last Friday, GARZA sat comfortably as the #2 daughter-proven TPI sire in the Holstein breed — 3464 TPI, fat pounds through the roof, the kind of bull that makes a lineup card look impressive. By the time you read this, the formula that produced that ranking may no longer exists. Holstein Association USA’s board just moved PTA Protein from 19% to 24% of TPI and dropped PTA Fat from 19% to 14%, effective with next week’s April 2026 genetic evaluation.
That’s a 10-percentage-point swap between your two component traits. And it lands two weeks before proofs.
If you bred heavy to bulls like GARZA and RIVERA this winter, this is the week your stomach does a little flip. Nothing about their daughters changed. No new genes appeared. But the TPI formula 2026 update just tilted the math away from fat-dominant profiles and toward protein, Productive Life, and fertility — and it did it right before spring mating decisions lock in.
Across the border, Lactanet picked the same proof round to flip Holstein LPI’s production subindex from 60% Fat / 40% Protein to 40% Fat / 60% Protein. Two different countries. Two different committees. One unmistakable direction.
TPI (Holstein USA)
LPI Production (Lactanet)
Index owner
Holstein Association USA
Lactanet (Canada)
Effective date
April 2026 evaluation
April 2026 evaluation
Fat weight — before
19%
60%
Fat weight — after
14% (↓5pp)
40% (↓20pp)
Protein weight — before
19%
40%
Protein weight — after
24% (↑5pp)
60% (↑20pp)
Net direction
Protein > Fat
Protein > Fat
Stated rationale
Align with processor demand for casein; protein lags fat in pipeline
Milk pricing signals; butterfat doesn’t need more genetic push
Correlation with old formula
“Very highly correlated” (Holstein USA)
Structural, not incremental shift
Risk to fat-dominant programs
Moderate (−5pp swing)
High (−20pp swing on LPI)
Opportunity bulls
P/F ratio > 0.60 + strong PL
Same profile; protein-dominant cows stick around
Bullvine pulled the December 2025 top-25 daughter-proven TPI sires and ran their existing PTAs through the new 2026 weights. Same proofs. New formula. This isn’t a prediction of April proofs — new daughter data will still move bulls when those drop on April 7. But it’s a clean look at where the formula alone is pushing your favorite sires before that data even hits.
What Changed in the 2026 TPI Formula?
Strip it down to the parts that hit your tank.
Holstein USA’s board approved these changes for the April 2026 TPI formula:
PTA Protein weight jumps from 19% to 24% (+5 points).
PTA Fat weight drops from 19% to 14% (−5 points).
The Health & Fertility block maintains strong emphasis on Productive Life (PL) and the Fertility Index (FI)— which rolls up DPR, CCR, HCR, and EFC — carrying forward the longevity and reproduction tilt that’s been building since 2020.
Holstein USA says the new formula is very highly correlated with the old one. Across all bulls, TPI values barely budge. Single-digit points for the average sire.
But your top-25 list isn’t “average.”
Up at the top, bulls are bunched within a handful of points. Their component profiles — how much of their genetic value comes from protein vs. fat — are wildly different. When you crank protein up and pull fat down, some names that felt untouchable suddenly have the wind in their face. Others catch a tailwind they didn’t have last week.
The TPI Ranking Table Nobody Else Will Publish
Press releases are safe. They’ll tell you “more emphasis on protein” and “continued focus on health and fertility.” They won’t tell you what that does to GARZA, POWERHOUSE, HORSESHOE, RIVERA, and the rest of the short list you’ve been breeding to.
Bullvine did the part nobody else will print right now.
We took Holstein USA’s December 2025 top-25 daughter-proven Holstein sires by TPI and reran their December PTAs through the April 2026 TPI weights. That isolates the formula pressure — the shift caused by the new weighting alone — before any new daughter data moves anything on April 7.
Quick methodology: Base list is the top-25 daughter-proven Holstein sires by December 2025 TPI (Holstein USA). Inputs are December 2025 PTAs for protein, fat, and TPI. Outputs are the estimated rank and TPI shift under the 2026 formula. This is Bullvine internal modeling, not official April proofs. Treat every estimated number as directional.
Top 25 TPI Sires: December 2025 vs. 2026 Formula Pressure
Bull
Stud
Dec Rank
Est. Rank*
Move*
Dec TPI
Est. Shift*
PTA Protein (lb)
PTA Fat (lb)
P/F Ratio
SHEEPSTER
Select Sires
1
1
—
3572
+5
70
133
0.53
DOMINANCE
STgenetics
3
2
↑1
3458
−6
65
131
0.50
CAPTAIN
STgenetics
4
3
↑1
3428
+8
67
120
0.56
GARZA
STgenetics
2
~4
↓2
3464
~−40
51
145
0.35
ZURI
Alta
5
5
—
3375
−7
54
108
0.50
POWERHOUSE
Alta / Peak
7
~6
↑1
3329
~+39
81
104
0.78
TROOPER
Select Sires (CRI)
6
7
↓1
3334
+16
53
90
0.59
BOLT ACTION
Select Sires
9
8
↑1
3324
−11
38
93
0.41
JULIUS
STgenetics
11
9
↑2
3299
+10
64
110
0.58
UNDERTONE
Select Sires
10
10
—
3304
−2
54
108
0.50
POSITIVE DELUXE
STgenetics
8
~11
↓3
3325
~−25
56
129
0.43
POWERSTAR
Semex
14
12
↑2
3275
+22
49
79
0.62
MATTERHORN
Alta / Peak
12
13
↓1
3296
−2
45
98
0.46
HORSESHOE
GENEX
24
~14
↑10
3262
~+27
70
93
0.75
CAPN MIGUEL
STgenetics
21
~15
↑6
3263
+21
57
86
0.66
INNOVATION
ABS Global
19
~16
↑3
3266
+17
70
111
0.63
EVENT
Semex
20
~17
↑3
3265
+18
50
83
0.60
PERKY
Semex
13
~18
↓5
3292
−12
35
92
0.38
PIPELINE
STgenetics
18
~19
↓1
3268
+11
62
105
0.59
CAPN ELEMENT
STgenetics
23
~20
↑3
3263
+7
56
99
0.57
BENEFIT
ABS Global
15
~21
↓6
3273
−7
48
108
0.44
T REX
Select Sires
22
22
—
3263
−9
44
99
0.44
RICHE
Select Sires
16
~23
↓7
3272
~−24
35
100
0.35
RIVERA
STgenetics
17
~24
↓7
3269
~−31
35
111
0.32
CRUSHER
Select Sires
25
25
—
3250
~−24
42
118
0.36
Est. Rank, Move, and Est. Shifts are Bullvine’s internal projections that apply April 2026 TPI weights to December 2025 PTAs. They are not official April 2026 proofs. New daughter data on April 7 will further move these numbers.
Which Bulls Does the New Formula Lean On?
Start with the P/F Ratio column. It tells the story faster than anything else in the table.
GARZA (STgenetics) carries 51 lb protein and 145 lb fat — a 0.35 P/F ratio — with a December TPI of 3464. In the formula-only rerun, he gives back roughly 40 TPI points and slides from #2 to about #4. That’s exactly what a fat-heavy profile looks like when protein picks up 5 percentage points of weight.
RICHE (Select Sires) is the same math problem: 35P, 100F (0.35) — an estimated ~24-point drop and a seven-spot slide from 16th to around 23rd. RIVERA (STgenetics) is even more exposed: 35P, 111F (0.32, the lowest P/F ratio in the top 25) with a projected ~31-point loss and a similar seven-spot fall.
None of them suddenly became bad bulls. Their daughters are the same cows they were last month. But if your winter breeding list was built around fat-dominant profiles because the old 19:19 fat/protein balance made it look smart, the new math is less forgiving.
In the middle of the pack, PERKY (Semex) at 35P/92F (0.38) drops an estimated 12 points and falls from 13th to about 18th. BENEFIT (ABS Global) at 48P/108F (0.44) takes a smaller −7-point hit and moves from 15th to around 21st. Not dramatic. But enough to change who’s on your short list and who isn’t.
The Quiet Bulls Who Just Caught a Tailwind
Flip the lens.
POWERHOUSE (Alta/Peak) is the poster boy for this formula shift: 81 lb protein and 104 lb fat — a 0.78 P/F ratio, the highest in the top 25 — with a December TPI of 3329. Under the April 2026 weights, he picks up roughly +39 TPI points and edges into about 6th. That’s a bull whose protein strength was always there. The formula just started paying for it.
HORSESHOE (GENEX) is the sleeper worth watching. Sitting down on the 24th in December with 70P and 93F (0.75), the new formula gives him roughly +27 points and a 10-spot jump to around 14th. Ten spots. On formula alone. Nobody was talking about HORSESHOE as a top-15 bull two weeks ago.
CAPTAIN (STgenetics) — already a known story to Bullvine readers — has 67P and 120F (0.56) and quietly adds about +8 points, moving from 4th to around 3rd. Then there’s the cluster of CAPN MIGUEL, INNOVATION, EVENT, POWERSTAR, and PIPELINE — all carrying P/F ratios north of 0.6 — all picking up points and rank spots. (Read more: CAPTAIN: The Bull That Rewrote the Rules for Modern Breeding)
The pattern isn’t subtle: higher P/F ratios climb under this formula; lower P/F ratios slip. Before we even talk about how PL and DPR interact with April’s new daughter data.
Does the CAPTAIN/HOMECOMING Story Repeat Here?
If you’ve followed Bullvine through the last few proof runs, you know formula changes can set off ranking earthquakes that compound over time.
In our look back at the April 2020 genomic class, GENOSOURCE CAPTAIN gained 369 TPI points between April 2020 and December 2025 as his daughters came in and multiple formula tweaks, plus a base change, played in his favor. AOT HOMECOMING lost 414 points over that same window as fertility, health, and type corrections piled up.
Those swings didn’t happen in one proof run. They were biology — real daughters, real performance — combined with three or four rounds of index adjustments and a base reset.
The 2026 TPI update won’t blow 300 points off a bull overnight by itself. What it does is set the direction of the wind.The CAPTAIN profile — strong components tilted toward protein, respectable PL, workable type, and fertility — is now more aligned with where TPI is heading. The HOMECOMING profile — production without the backside to support it — faces a tougher formula and a tougher biological test as daughters age.
Why Did TPI and LPI Both Move Toward Protein at the Same Time?
You can write off one index committee as a quirk. You can’t shrug off two.
Lactanet’s April 2026 update is blunt about the rationale: Holstein LPI’s production piece is moving from 60% Fat / 40% Protein to 40% Fat / 60% Protein. They tie it directly to evolving milk pricing signals and the message from national pricing bodies that butterfat doesn’t need more genetic push. The Canadian dairy market is telling breeders: give us protein-dense milk from cows that stick around.
Against that, TPI’s shift to 24% Protein / 14% Fat looks like the US reading the same tea leaves. Processors want casein. Consumer products are shifting toward high-protein formats. And the genetic pipeline has been quietly overdelivering on fat for years, while protein gains have lagged.
This isn’t two committees having the same idea by coincidence. It’s a structural repricing signal. If your program has been aggressively stacking fat % and shrugging at protein, the formula change isn’t a one-off nuisance — it’s an early warning that your genetics are drifting from where both indexes, and probably your processor, are headed.
Should You Change Your Spring Matings — or Wait for April 7?
This is the real question. Not what changed in the formula. What do you do about it?
If you adjust now:
You start correcting a fat-heavy lineup before you add another crop of calves conceived under a formula that no longer exists.
You can steer semen orders toward bulls whose protein strength and PL fit the new incentives.
But you’re still working off December 2025 PTAs. Some bulls will move on April 7 because their daughter data changed — not just because the formula did.
If you wait until after April 7:
You get the combined effect of new proofs + new formula before making shifts.
You won’t overreact to an estimated shift that doesn’t match what actually happens.
But you spend another month of matings optimized for a world that TPI and LPI have both moved on from.
A realistic rule that won’t blow up your program: if your own rerun under the new formula shows three or more of your top five sires losing more than about 50 TPI points, book time with your breeding advisor before April proofs to identify some protein-plus-PL alternatives. If the shifts are smaller, mark the exposed bulls and let the April proofs settle before swapping anything wholesale.
What This Means for Your Operation
Run a P/F check on your top five sires. Divide each bull’s PTA Protein by PTA Fat. If more than two of your top five sit below roughly 0.5, your lineup leans fat-heavy relative to how both TPI and LPI now reward protein. Circle any that also carry weak PL or negative DPR — they’re taking a double hit. lactanet
Sort your semen inventory by exposure. Any bull with an estimated >50-point drop and a P/F ratio in the 0.35–0.4 range deserves a hard look if you’re holding 100+ units of him. That doesn’t mean dump him. It means ask yourself whether you want to keep stacking that profile into 2026 heifers.
Have a specific conversation with your AI rep. Don’t ask “what’s hot.” Show them your list. Ask: “Which of your bulls look more like POWERHOUSE and HORSESHOE on P/F and PL, and which look more like GARZA and RIVERA in this table?” Use the formula pressure as a starting point — then let April’s proofs confirm or contradict it.
Don’t chase every shiny name in April. The bulls that deserve more use are the ones that align with the new formula and show solid daughter performance under the new weights after a couple of proof runs. Use 2026 as the year you test which sires hold up under this TPI version, not the year you jump every time a list shuffles.
If you already bred this winter, don’t panic. Calves conceived in January and February don’t retroactively become worse animals because a formula changed. But do note which sires you used heavily and track how they land on April 7. That data tells you whether to continue or pivot for summer breeding.
Key Takeaways
If more than two of your top five sires carry P/F ratios under 0.5, your lineup is leaning into fat in a world where both TPI and LPI just shifted toward protein and longevity.
Bulls like POWERHOUSE (0.78 P/F) and HORSESHOE (0.75 P/F) are exactly the profiles the 2026 TPI formula rewards — even before new daughter data hits on April 7.
This table is a formula-only stress test on December 2025 proofs, not a crystal ball. Use it to see which bulls in your tank face a headwind or a tailwind, then let April proofs tell you which ones actually held.
The synchronized TPI and LPI protein shift isn’t a coincidence. It’s a structural market signal. Fat-dominant genetic programs that don’t adjust aren’t just chasing last year’s formula — they’re building toward a component mix that processors and pricing are moving away from.
The Bottom Line
When you rerun your own sire list under the new weights on April 7, how many of your “can’t-miss” bulls are still where you thought they were? And how many of the bulls you’d never considered just climbed into the conversation? That gap — between the list you had and the list you need — is the real story of this formula change. We’ll be tracking it through April proofs and beyond.
Complete references and supporting documentation are available upon request by contacting the editorial team at editor@thebullvine.com.
Every week, thousands of producers, breeders, and industry insiders open Bullvine Weekly for genetics insights, market shifts, and profit strategies they won’t find anywhere else. One email. Five minutes. Smarter decisions all week.
Overton’s 85-herd study found a 79% heifer completion rate. That math says most herds can only afford about one-third of pregnancies as beef-on-dairy.
Executive Summary: Beef-on-dairy has been a bright spot on many milk cheques, but new numbers show plenty of herds are quietly overbreeding to beef and starving their future heifer supply. In an 85-herd dataset presented at the 2026 High Plains Dairy Conference, Mike Overton found an average 79% heifer completion rate from liveborn heifer calf to first calving, not the 90% many breeding plans assume. Layer that on top of CoBank’s forecast that U.S. dairy heifer inventories will shrink by roughly 800,000 head before rebounding in 2027, and the room for error on replacement planning almost disappears. For a typical 500-cow herd using sexed and conventional semen, realistic math often limits beef-on-dairy to about one-third of pregnancies if the goal is to avoid buying springers back at record prices instead of producing them at home. This article walks you through that “Overton reality check” step by step, then shows how to audit breeding cards for parlor drift, tighten tier-based breeding rules, and reverse-engineer your beef sire lineup from your buyer’s cheque using tools like $AxH and HOLSim. It finishes with a 30-day beef-audit checklist and annual replacement-pipeline review so you can keep beef-on-dairy as a profit center without blowing a hole in your 2028 milking string.
The breeding cards were supposed to confirm the plan.
A herd manager spread a week’s worth of cards across the office table, grabbed a red marker, and circled every beef mating. It didn’t take long before everyone in the room could see it: beef semen on cows that weren’t truly bottom‑third genetics, chronic mastitis cows bred again instead of marked DNB, and a lot more red circles than the “about 25% beef” the farm thought it was running.
That gap between the breeding plan in your head and the breeding cards in your hand is exactly where this story sits. In 2025–26, with heifer numbers tight and beef‑on‑dairy still hot, getting that gap wrong isn’t a rounding error — it’s a replacement pipeline problem waiting to surface right when you least want to be buying springers.
The 21% Leak: Why Your Heifer Pipeline Is Thirstier Than You Think
Veterinarian and dairy economist Mike Overton went looking for hard numbers on replacement risk when he analyzed data from 85 commercial U.S. herds and presented it at the High Plains Dairy Conference in Amarillo, Texas, on March 3–4, 2026.
Across those herds, the average heifer completion rate from liveborn heifer calf to first calving was about 79%, with most herds landing between 74 and 84%. Just over one in five heifer calves never make it into the milking string. Some are lost at, or shortly after birth, some in the calf and grow‑out phases, some to disease or injury, and some are culled before they ever freshen.
Overton’s point to the HPDC crowd was blunt: a lot of operations are still planning their replacement needs as if nearly every heifer calf eventually freshens. His datasets say those assumptions are quietly loading risk into every decision about sexed semen usage, beef‑on‑dairy percentage, and whether a herd will be forced to compete in a record‑high springer market a couple of years down the road.
The national backdrop doesn’t leave much margin for error. USDA’s January 1, 2025, cattle estimates put dairy heifers 500 pounds and over at 3.914 million head, the lowest count in that category since 1978. CoBank’s August 2025 Knowledge Exchange report projected dairy heifer inventories would shrink by roughly 800,000 head over the following two years before beginning to rebound in 2027, with heifer prices already at record highs and potentially moving well beyond ,000 per head in some markets as supply tightens. When $3,000‑plus springers are the new normal, pretending your herd runs at 90% heifer completion when the real number is closer to 79% is an expensive fantasy.
Parlor Drift: Is Your 4:00 a.m. Tech Killing Your Genetic Progress?
On paper, the breeding strategy in a lot of progressive herds already sounds sharp.
The binder in the office usually says something like: the top genomic tier and key cow families get sexed dairy semen; the middle third get conventional dairy; the true bottom third get beef from carefully chosen Angus or SimAngus sires; and obvious problem cows are DNB. That’s the clean terminal‑program diagram you walk through with your vet, nutritionist, and semen rep.
The decision about which straw goes in which cow doesn’t happen on that whiteboard, though. It happens at 4 a.m. in the parlor.
If today’s list says “breed these 14 cows” without telling the tech who gets sexed, who gets conventional, who gets beef, and who shouldn’t be bred at all, the plan starts to leak:
A high‑genomic heifer that missed first service on sexed gets conventional “just this once” so she’s not open again.
A third‑lactation cow, the crew is sick of treating, gets beef because she was open again, not because she’s truly bottom‑tier genetically.
A lame, stale cow that should be hard DNB gets a straw anyway because she’s already in the headlocks and the tank is right there.
A cow flagged for beef on the list gets conventional dairy because the tech grabbed the wrong tank canister, and nobody caught it until reconciliation — if reconciliation happens at all.
None of those calls look crazy in isolation. Stack them up over 52 weeks, and it’s easy for a beef target in the mid‑20s to creep into the low‑ or mid‑30s without anyone ever sitting down and saying, “Let’s change the plan.” Until someone reconciles pregnancies by semen type against the replacement math, that drift stays invisible.
If you haven’t done it recently, a simple 20‑minute “beef audit” on your breeding cards is eye‑opening. Grab a recent week, highlight every beef mating, and cross‑check those cows against your genomic or index‑based tier list and DNB list. When more than a handful of beef straws are landing on cows that aren’t truly bottom‑tier, the day‑to‑day realities in the parlor are quietly pulling the program off the plan.
The 500-Cow “Overton Reality Check.”
Overton’s 79% completion figure isn’t just an interesting stat to quote at meetings. It’s the anchor for a simple backward pipeline calculation you can run on your own herd to find your real beef‑on‑dairy ceiling.
Here’s how a hypothetical 500‑cow herd looks when you put the math side by side with typical planning assumptions:
Metric
Your Value (Est.)
The “Overton” Reality Check
Herd Size
500
500
Replacement Rate
35% (what you’d like)
37% (what many herds actually run)
Heifers Needed
175
185 (+15 buffer = 200)
Completion Rate
90% (goal in your head)
79% (85‑herd actual)
Heifer Calves Needed
194
253
Beef Ceiling
~50% of pregnancies (on paper)
~34% of pregnancies (with sexed + conventional mix)
Walking through the right‑hand column in barn‑math terms:
At a 37% annual cull/turnover rate, you need 185 replacements to stand still (0.37 × 500 = 185).
Add a modest 3% buffer for flexibility — about 15 extra heifers — and you’re targeting 200 heifers calving in per year.
At a 79% heifer completion rate, those 200 heifers require roughly 253 heifer calves born alive (200 ÷ 0.79 ≈ 253).
If 60% of your dairy pregnancies use sexed semen (≈90% heifers) and 40% use conventional (≈50% heifers), the weighted average female fraction per dairy pregnancy is about 0.74.
To get 253 heifer calves at 0.74 heifers per pregnancy, you need about 342 dairy‑sired pregnancies per year(253 ÷ 0.74 ≈ 342).
Total pregnancies per year in a 500‑cow herd vary with the reproduction program, but for illustration, say you generate around 520 pregnancies annually. In that scenario:
520 total pregnancies − 342 dairy‑sired pregnancies needed = 178 pregnancies available for beef.
178 ÷ 520 ≈ 34% of pregnancies.
That 34% isn’t a magic industry standard. It’s the ceiling in this particular example with these assumptions. If your actual completion rate is lower than 79%, your safe beef ceiling drops. Dial back sexed semen usage — or see weaker conception on sexed — and it drops again. Want more than a 3% heifer surplus to sell into a strong replacement market? It drops further still.
Overton showed how the math scales on a larger herd in that same HPDC talk. In one 2,500‑cow scenario from his presentation, he modeled using sexed dairy semen versus beef semen on the final 100 pregnancies. Once he included three‑year replacement costs, his model showed the sexed semen strategy generating about $216,000 more net value than the beef‑semen strategy on those same 100 pregnancies. Most of that difference came from not having to buy high‑priced springers into a market where $3,000‑plus per head isn’t rare.
The calf cheque from beef is visible right away. The springer cheque is delayed and much less fun to write. The arithmetic doesn’t care which one feels better.
Decision
Beef-on-Dairy Pregnancy
Sexed Dairy Pregnancy
Difference
Immediate Calf Value
+$1,200 (beef calf)
+$750 (dairy heifer calf)
+$450 to beef
Heifer Raised
0
1 @ $1,700 raising cost
-$1,700 to beef
Springer Purchased Later
-$3,200
$0
-$3,200 to beef
Net Present Value
-$2,000
+$850
-$2,850 net loss for beef
Are You Breeding for the Bull Book or the Buyer’s Cheque?
Once you’ve got a handle on how many pregnancies you can safely point at beef‑on‑dairy, the next question is uncomfortable and simple: are you picking beef bulls for your buyer, or for your semen catalog?
Plenty of herds still select beef semen on a mostly dairy‑centric checklist — calving ease, conception rate, semen price, and maybe coat color — instead of starting with the traits their calf buyer actually pays for. Meanwhile, calf buyers and feedlots are looking at a different checklist: calves that grow, hang a decent carcass, and are consistent enough they don’t need a spreadsheet to figure out what they’re feeding.
Extension and university work — including Kansas State’s analysis of Holstein and beef‑dairy cross calves in video auctions — shows that well‑bred beef‑on‑dairy calves often sell above straight Holstein steers on a per‑hundredweight basis, narrowing the gap to native‑beef calves in many sales. Generic black‑hided calves that still feed and hang like Holsteins don’t earn those premiums consistently.
Instead of guessing, start that conversation at the other end of the chain. Ask your buyer:
What breed or breed type do you actually want on these calves — straight Angus, or are SimAngus/HOLSim crosses on the table if they’re black and muscled?
Do you need predominantly black‑hided calves for your program?
Are you insisting on polled calves?
At what weight do you buy — day‑old, 250 pounds, 500 pounds, or heavier?
Are you paying primarily on live weight, or is there carcass/grid feedback that matters?
Those answers translate directly into trait priorities on the sire side: growth and feed efficiency to hit target weights, muscling and ribeye area to avoid “dairy‑type” carcasses, marbling to hit Choice or better, moderate frame consistently, and the calving ease you need on Holstein or Jersey dams. Color and horn status become hard filters, not catalog fluff.
On the genetics side, two indexes do a lot of heavy lifting:
The Angus $AxH index was developed specifically for Angus sires used on Holstein dams. It blends calving ease, growth, muscling, and marbling while penalizing excessive yearling height — directly addressing the carcass‑length and cut‑size issues common in straight Holstein steers. In one Angus Genetics Inc. summary from 2022, just 15 of 9,690 sires ranked over 150 on $AxH, which tells you how small the truly elite slice was at that point.
The HOLSim program, a joint effort between Holstein Association USA and the American Simmental Association, launched in 2019 and designates SimAngus bulls that are homozygous black and homozygous polled and exceed a Holstein‑specific terminal index threshold, balancing calving ease and carcass traits. Eligible bulls must be SimAngus with a breed composition of 3/8 to 3/4 Simmental, with the balance Angus.
Beef semen used in dairy herds has often been cheaper on average than top‑end terminal options, as Dairy Herd and Progressive Dairy have both noted. The real question isn’t whether you can save a few dollars per straw. It’s whether the sires you’re using actually work for the person writing the cheque.
For many 200‑ to 1,000‑cow herds, the practical move isn’t a 20‑bull lineup. It’s a small, consistent group — often three to five sires — that rank well on $AxH or HOLSim and match your buyer’s spec sheet. And then the discipline to stick with them. No off‑list bulls go in the tank “just this once.” No “cleaning out the tank” by throwing calves into the pipeline, your buyer didn’t ask for.
Don’t just take the cheque; demand the data. Ask for carcass or grid information back from your buyer, where possible. If your high‑index beef‑crosses aren’t consistently grading Choice or Prime, you’re giving away leverage on next year’s price discussion — and you won’t know it until you ask.
Can You Get the Beef-on-Dairy Benefit Without Fancy Tech?
A lot of the breeding‑strategy case studies making the rounds right now feature fully integrated setups: automated sort gates, activity monitors feeding into DairyComp or BoviSync, cow‑level breeding reports, semen assignment protocols. If you’re there already, great.
Plenty of 200‑ to 800‑cow herds aren’t there yet. And they’re not going to install a six‑figure tech stack to straighten out beef usage.
You don’t need another app to remove most of the slop from your program. You do need a clear, written plan, a slightly smarter breeding sheet, and a ruthless 20 minutes once a week.
The minimum viable system looks something like this:
Write a one‑page breeding policy and hang it where cows actually get bred. Define top, middle, and bottom tiers using your genomic or index ranking. In one line per tier, spell out which semen types are allowed on which services. Then list your DNB criteria in plain language — chronic mastitis, chronic lameness, multiple failed services, stale lactation, whatever fits your herd.
Print a color‑coded cow list out of your genomic file or herd software. Sort by your chosen index (NM, or a custom ranking), then tag green for top, yellow for middle, red for bottom. Put a dot or symbol next to the cows you already know should be DNB. Keep that list beside the breeding cards, not in the office drawer.
Add one column to your breeding card or work list: “Tier + Allowed Semen.” When the tech goes to breed cow 4123, they don’t just see an ID. They see “green — sexed only” or “red — beef only.” If “Angus” gets written next to a green cow, that mismatch is easy to spot on Friday.
Block 20 minutes once a week for a three‑count audit:
Count how many beef straws went to green or yellow cows instead of red.
Count how many services were sexed, conventional, and beef — and compare that mix to the replacement plan you just ran with your own numbers.
Count how many cows marked as DNB on your list still got bred.
You won’t get a slick dashboard out of this. You will get a clear yes‑or‑no answer to a hard question: is your beef‑on‑dairy program being driven by your genetic and replacement plan, or by whoever happened to be standing in the parlor with an AI gun at 4 a.m.?
What This Means for Your Operation
Think of this as a set of reality checks, not a recap:
Within 30 days, run the breeding‑card beef audit. Pick a recent week, highlight every beef mating, and cross‑check each cow against your genomic tier list and DNB list. If more than a third of your beef straws are landing on cows that aren’t truly bottom‑tier, it’s a sign the day‑to‑day realities in the parlor are quietly pulling the program off the plan.
Calculate your own heifer completion rate instead of guessing. Take a recent calf crop, divide the number of heifers that actually calved in by the number of live heifer calves born in that group. If you’re near Overton’s ~79% average — or below — your safe beef‑on‑dairy percentage is tighter than it looks in your winter planning meeting.
Run the backward pipeline math once a year. Start with herd size and actual replacement rate, add a small buffer, then work back through your real completion rate and sexed/conventional mix to find how many dairy pregnancies you need. Whatever’s left is your genuine beef ceiling. If your current beef percentage is higher than that, you’re pre‑loading a replacement deficit.
Sit down with your calf buyer or integrator before your next semen order and get their specs in writing: breed, color, horn status, target weight, and how they pay. Build your beef sire list backward from that conversation using $AxH or HOLSim bulls that fit, instead of forward from whichever bull picture looks best in the catalog.
Make the breeding sheet match your plan. If you’re asking staff to remember which cows get what semen type in their heads, you’re almost guaranteeing drift. The moment you write “green — sexed only” and “red — beef only” on the card, you’ve given people a fair chance to hit the target.
Watch the opportunity cost, not just the calf cheque. In a market where replacement heifers can sell well above $3,000 per head, that extra $150–$200 on a beef‑cross calf can disappear fast if you later have to buy a heifer to replace the one you didn’t create. The gap is on the order of a couple of thousand dollars, not a rounding error.
Key Takeaways
If you don’t know your own heifer completion rate, you’re guessing about how much beef‑on‑dairy your herd can afford — and Overton’s 85‑herd dataset suggests those guesses are often 10 points too optimistic.
If your breeding cards and your genomic tier list don’t line up on where beef semen is actually going, you’ve got more of a beef‑on‑dairy storyline than a fully enforced strategy.
If your beef sire lineup came from the bull book forward instead of from the buyer’s cheque backward, you’re likely leaving premiums on the table — especially if you aren’t tracking whether those calves are actually grading Choice or Prime once they reach the packer.
If you can’t explain — in one hallway conversation — how many dairy pregnancies you need each year to protect your replacement pipeline, it’s a sign you don’t yet have full control over how beef‑on‑dairy fits into your herd.
The Bottom Line
The heifer shortage isn’t going to disappear this year or next. Beef‑on‑dairy isn’t going away either. On Monday morning, before you do anything else with the next semen delivery, grab last week’s breeding cards, a highlighter, and your genomic list — and find out whether your beef‑on‑dairy program is protecting your 2028 milking string or just making it more expensive to buy back later.
Complete references and supporting documentation are available upon request by contacting the editorial team at editor@thebullvine.com.
Learn More
Beef-on-Dairy’s $6,215 Secret: Why 72% of Herds Are Playing It Wrong – Gain total control over your monthly margins with specific reproductive “guard rails” that separate top-tier earners from the rest. It delivers a clear Monday-morning blueprint for maximizing revenue by matching semen types to your pregnancy rate.
Every week, thousands of producers, breeders, and industry insiders open Bullvine Weekly for genetics insights, market shifts, and profit strategies they won’t find anywhere else. One email. Five minutes. Smarter decisions all week.
Holstein inbreeding hit 9.99%. Birkstead and North Florida took opposite paths to slash a $60–$ 100-per-cow leak without sacrificing genetic progress.
Executive Summary: Holstein heifers born in 2024 now average 9.99% inbreeding, and conservative barn‑math from peer‑reviewed studies puts the cost at roughly $60–$100 per cow per lactation. The article shows how that hit comes together — a little lost milk and protein, a few extra days open, shorter productive life — and why recent inbreeding does more damage than old pedigree overlap. It then uses two real herds as case studies: Birkstead Holsteins in Ontario, which pushed a 20% pregnancy rate higher and cut health problems by moving to a Holstein × Norwegian Red × Montbéliarde/Fleckvieh cross, and North Florida Holsteins, which stayed pure Holstein but built its own profit‑first index and capped how much any single bull could influence the herd. The core argument is that the real risk isn’t genomics itself, but letting catalog rankings quietly stack the same sire lines until inbreeding becomes a five‑figure annual leak. For a 300–600‑cow herd, the piece lays out a simple playbook: in the next 30 days, turn on and enforce an inbreeding ceiling in your mating program, over the next 90 days build a genuinely diverse bull team, and over the next breeding season stop raising replacements from the most inbred, lowest‑merit females. It’s written for owners and breeding decision‑makers who want to keep riding the top of the genetics wave without paying for 9.99% inbreeding on every proof run.
Canadian Holstein heifers born in 2024 now average 9.99% inbreeding, according to Lactanet’s August 2025 inbreeding update. That’s up from 9.61% the year before and the highest among the major dairy breeds in Canada. On paper, it’s just another number. In the barn, it’s the cows that don’t settle, don’t handle stress, and don’t stick around long enough to pay off their raising cost.
Thomas Wantenaar at Birkstead Holsteins in Elora, Ontario, was already seeing that drag in his own herd numbers. In 2008, with a purebred Holstein herd and a new robot barn, he was staring at an annual pregnancy rate of about 20% and, as he told Progressive Dairy, “spending half the morning just treating cows.” A thousand miles south at North Florida Holsteins, Don Bennink was looking at the same breed from the other end of the telescope: about 4,800 cows and 4,400 heifers on roughly 2,400 acres in Florida heat, and a classification and type evaluation system he publicly described as “180 degrees away from cattle that pay the bills.”
How Much Does 1% of Holstein Inbreeding Really Cost Per Cow?
You’ve heard for years that inbreeding costs money. That doesn’t help when you’re trying to decide whether one more high‑index bull out of the same sire line is worth it.
Lactanet and other summaries estimate that every 1% increase in inbreeding knocks roughly $60–$78 off a cow’s lifetime profit, once you add up lost milk, weaker fertility, and fewer productive days. Makanjuola and colleagues (2020) put a finer point on it for Canadian Holsteins: each 1% increase in genomic inbreeding cut 305‑day first‑lactation milk yield by about 40–50 kg. At typical Canadian milk prices, that’s over $40 per cow per lactationfrom milk volume alone.
That’s still fairly abstract. The real question is: if your herd is, say, 2 percentage points more inbred than you’d like, what’s the per‑cow, per‑lactation hit?
Step 1: Define “excess inbreeding”
Suppose you’d be comfortable with a herd average around 7.5% inbreeding. Instead, your young stock are coming in around 9.5%, which isn’t unusual given where Holsteins are heading. That’s 2 percentage points of excess inbreedingcompared with the level you’d like to be at.
Step 2: Milk and protein that never make it onto the truck
Doekes et al. (2019) and Makanjuola (2020) both found that each 1% increase in inbreeding reduced 305‑day milk by roughly 36–49 kg (80–108 lb). To stay conservative and easy to work with, call that about 100 lb of milk per 1%.
At 2 excess points: ~200 lb less milk per cow per lactation.
At $20/cwt: 200 ÷ 100 × $20 = $40 per cow per lactation from milk.
StrataGEN work suggests about 25 lb lifetime protein loss per 1% inbreeding, which averages out to roughly 6–7 lb per lactation. Use 6 lb per 1%.
At 2 excess points: 12 lb less protein per lactation.
At $3.50/lb: 12 × $3.50 = $42 per cow per lactation from protein.
Right there, you’re at around $82 per cow per lactation in very basic, conservative component math.
Step 3: Days open that hide inside your repro numbers
Genetic and economic work often uses about 1 extra day open per 1% inbreeding as a planning number, once you account for later first service, lower conception rates, and early embryonic loss. It’s not a hard rule, but it’s a realistic average.
At 2 excess points: assume 2.5 extra days open.
At $4 per day open (mid‑range of common $3–$5 estimates): 2.5 × $4 = $10 per cow per lactation.
You can argue the exact cost per day. You can’t honestly argue that it’s zero.
Step 4: Productive life and replacements
StrataGEN data show about 13 fewer productive days per 1% inbreeding; at 2 excess points, that’s around 26 fewer productive days in that cow’s lifetime.
Spread across a cow you expect to last around 3½ lactations, that’s about 7–8 fewer productive days per lactation. Put a conservative $10 per cow per lactation value on that in terms of extra replacement pressure, fewer older “easy money” cows, and more fresh‑heifer risk.
Step 5: Put the conservative math together
Conservative totals on 2 points of excess inbreeding per cow, per lactation:
Milk loss: ~$40
Protein loss: ~$42
Extra days open: ~$10
Shorter productive life/replacements: ~$10
That’s roughly $100 per cow per lactation.
Loss Category
Impact per 1% Inbreeding
Cost at 2% “Excess” (per lactation)
Milk Yield
~100 lb
$40.00
Protein
~6 lb
$42.00
Fertility (Days Open)
1.25 Days
$10.00
Productive Life
13 Days (Lifetime)
$10.00
ESTIMATED TOTAL
$102.00 per cow
If you squeeze every assumption down to the low end and ignore some of the lifetime effects, you can justify a smaller number in the $60–$70 per cow range. If you take the upper end of the published production losses and value days open closer to $5, you can also defend numbers over $100 without exaggerating.
Either way, on a 300‑cow milking herd, even a $60 per cow leak is around $18,000 per year until your mating strategy changes. On a 500‑cow herd, you’re looking at $30,000–$55,000 per year — not in theory, but in realistic, research‑based barn math.
At Birkstead, that money didn’t show up on a line called “inbreeding.” It showed up as a 20% pregnancy rate, more sick cows than they liked, and robots spending too much time fetching stubborn Holsteins. At North Florida Holsteins, it showed up in a Holstein system that rewarded the same narrow sire lines and type composites even as inbreeding climbed.
Why Recent Inbreeding Hurts More Than Old Inbreeding
One of the traps with inbreeding is treating all of it as doing the same damage. It doesn’t.
Doekes and co‑authors split inbreeding into “recent” (last few generations) and “ancient” (deeper in the pedigree) and then tracked what each type did to production and fitness in Holsteins. Each 1% of new inbreeding cuts fat yield by about 2.4 kg per lactation, while the oldest pedigree class had little to no negative effect — in some models, even a small positive one.
Makanjuola’s work on Canadian Holsteins using runs of homozygosity (ROH) told the same story: recent inbreeding reduced milk and protein yields, while ancient inbreeding had far weaker effects. When you turn that into dollars, you end up in that >$40 per lactation per 1% range for first‑lactation milk alone.
Why the difference?
Ancient inbreeding has already been through decades of selection. The worst double‑copy combinations have largely been purged from the population.
Recent inbreeding creates new double copies in parts of the genome that haven’t had enough generations under selection pressure, especially for fertility and health.
Irish Holstein‑Friesian work suggests that purging has been more effective for production traits than for fertility.We’ve been selecting hard for milk and components for a long time. Fertility and health only really got major index weight in the past 10–15 years. The harshest fertility and survival recessives haven’t been under the hammer as long.
Once you layer genomics on top, the curve steepens. Hansen showed that Holstein female inbreeding rose at about 0.12% per year from 2000 to 2012, then 0.25% per year from 2013 to 2016, and then around 0.4% per year as genomic selection really took over. By the early 2020s, average Holstein females were already in the 8–9% inbreeding range, and by 2024, Canadian Holstein heifers hit 9.99%.
Genomics helped us identify the top animals faster. It also helped us stack the same families faster than purging could clean up fertility and survival.
The Bottleneck Hiding Inside Every Bull Catalog
Talk about Elevation and Chief dominating Holstein pedigrees can sound like coffee‑shop folklore. The data back it up.
If your inbreeding is over 9.99% and FSAV isn’t on your proof sheet, Net Merit 2025 is using you — not the other way around.
Executive Summary: Net Merit 2025 added a $57‑per‑point “weight tax” on big Holsteins by cutting Body Weight Composite to ‑11% and lifting Feed Saved to 17.8% of NM$, pushing the breed toward smaller, feed‑efficient cows. Fat now carries 31.8% of the index, protein just 13%, and cow/heifer Livability has more pull, so the model rewards components and survival over sheer size. New calf‑health evaluations — CDCB’s DIAR/RESP and Lactanet’s Calf Health RBVs — reveal that daughters of top 5% sires stay healthy 15–18 percentage points more often than daughters of the worst bulls, and a single respiratory event costs about 121 kg in first‑lactation milk. Meanwhile, average inbreeding for Canadian Holstein heifers hit 9.99% in 2024, and JDS work shows recent inbreeding hurts longevity more than older, diluted inbreeding, raising real questions about how we’re using genomics. Rosy Lane Holsteins leans hard into NM$, FSAV, and calf‑wellness indexes, but still filters out extreme‑stature bulls and ignores classification that doesn’t help profit, showing how to use the system without letting it run the herd. The practical playbook: pair NM$ with reliability, make FSAV and calf health non‑negotiable filters, keep your top three bulls below ~40% of expected future inbreeding, and, in the next 30 days, sit down with your proofs to see if Net Merit’s priorities actually match how your farm makes money.
While you’re scraping stalls or checking heaters, three people you’ve never met just changed the value of every cow in your barn. In a quiet Maryland office park, the USDA recalculated the “ideal” Holstein — and if your cows are “too big” on Body Weight Composite, they just picked up a $57‑per‑point penalty for lifetime Net Merit.
The math lives in Beltsville. The consequences land in your parlour. The April 2025 Net Merit revision didn’t just shuffle a few bulls; it hard‑wired a new answer to a simple question: what kind of Holstein is worth breeding in 2026?
This is the story of the scientists who set that answer — and Rosy Lane Holsteins in Wisconsin, where Lloyd Holterman refuses to let those formulas be the whole story.
Quick Facts: What Changed in Net Merit 2025
Body Weight Composite (BWC): -11% emphasis in NM$.
Fat vs Protein: Fat 31.8%, Protein 13% of NM$ emphasis.
Feed costs in the model:58% of milk income (39% marginal, 19% maintenance).
“Weight tax”: +1.0 BWC = -$57 lifetime NM$ per daughter.
Genetic gain: Genomics roughly doubled NM$ gain per bull from $40 → $85/year.
Those aren’t trivia numbers. They’re the new rules your proof sheet is playing by.
From Coin, Iowa, to Every Proof Sheet in North America
The modern proof system didn’t start with DNA chips. It started with a kid from Page County, Iowa, who didn’t begin his animal breeding career until he was nearly 40.
Charles Roy Henderson grew up on a general livestock farm, served as an Army Nutrition Research Officer during World War II, and earned his PhD in genetics and animal breeding from Iowa State in 1948 at age 37. At Cornell, he developed best linear unbiased prediction — BLUP — the math that finally separated herd effect from genetic effect. It let evaluators ask: Is this cow actually superior, or just in a better barn?
USDA adopted Henderson’s herdmate comparison method in 1962, replacing the old daughter–dam comparisons. By 1989, BLUP‑based Animal Model evaluations were running in the U.S., with other countries following through the 1990s.
There was still a massive bottleneck. A young bull went into AI around two, his daughters calved, finished a lactation, and the proof didn’t publish until the bull was seven or eight. Only about 1 in 8–10 bulls “graduated” from progeny testing, and each active bull represented a $350,000–$400,000 investment in semen collection, daughter sampling, and promotion.
Genomics blew that up. Illumina’s 50K SNP BeadChip hit the market in 2007, the bovine reference sequence landed in Science in April 2009, and USDA’s Animal Genomics and Improvement Laboratory launched official genomic evaluations for Holsteins and Jerseys in January 2009. Generation interval collapsed — suddenly, you could get a genomic PTA on a bull before he was old enough to breed.
Paul VanRaden joined the USDA’s Animal Improvement Programs Laboratory after his Iowa State PhD in 1986. His name is on a long list of methods you see every time you open a proof sheet — but Net Merit is the one that hits your pocketbook most directly.
Henderson’s BLUP told you which cow was genetically better. VanRaden’s Net Merit dollar index (NM$) tells you which cow should make you more money over her lifetime. It rolls multiple production, fertility, health, and conformation traits into a single lifetime profit estimate — and every revision is another set of judgment calls about what matters, and how much.
Where the 2025 Change Hits Your Herd
The April 2025 NM$ revision increased the emphasis on butterfat and reduced the emphasis on protein, reflecting actual component price trends in recent years. It also shifted weight from Productive Life toward cow and heifer Livability, based on stronger cull cow and heifer calf markets.
The bigger jolt is in body weight and feed efficiency. New feed‑intake data from more than 8,500 Holstein and Jersey lactations showed that maintenance feed costs were higher than previous models assumed. In plain language: big cows cost more to keep milking than the old Net Merit math gave them “credit” for.
So BWC now sits at ‑11% emphasis in NM$. For every extra point of BWC, the model knocks about $57 off that cow’s lifetime Net Merit — mostly for maintenance feed, but also for housing and replacements.
Big cows = big feed bills the model sees no profit
Here’s the barn‑math version:
Your bull team averages +1.0 BWC over breed average.
NM$ says that’s about ‑$57 lifetime NM$ per daughter.
Across 100 daughters, that’s roughly $5,700 in lifetime NM$ drag for that sire choice compared to a BWC‑neutral bull.
You can argue with the model. But you can’t pretend it’s not there.
Why Did Fat Leapfrog Protein?
VanRaden’s team also re‑estimated the true genetic cost of components. Genomic and sire regressions suggested that, genetically, fat takes as much or more feed to produce than protein. That’s the opposite of what older phenotypic regressions implied when they just watched cows and feed trucks.
The feed‑side math behind this revision assumes feed costs equal 58% of milk income — 39% for marginal production and 19% for maintenance. Combine that with the new Feed Saved trait (FSAV), and you see where the wind is blowing:
FSAV is 17.8% of NM$ when you add its BWC and Residual Feed Intake components together.
If you’re not looking at FSAV on your proofs, you’re ignoring almost a fifth of the index you think you’re using.
The subtext is pretty clear: do more milk from less feed, land, and carbon, or get left behind.
Wiggans: The Infrastructure Nobody Sees
If VanRaden designed the engine, George Wiggans made sure it was street‑legal and still running when you opened your proofs this morning.
Theory doesn’t help anybody if it can’t be computed, delivered, and trusted. Wiggans spent his career sorting out genotype management, data quality control, and the nuts and bolts of turning millions of milk, type, and health records into evaluations that AI organizations can actually ship. He was central to the push that got Canadian AI studs to contribute DNA to a shared U.S.–Canada reference population before genomic proofs went live, which still underpins most North American Holstein genomic evaluations.
Every chip you send in has to survive that QC pipeline. The genotype is checked against reported parents, then against the entire database to catch swapped samples or mis‑ID’d animals. If it doesn’t add up, it doesn’t make it into the evaluations.
In a 2022 Frontiers in Genetics paper, Wiggans and Carrillo showed that the U.S. genomic‑selection era roughly doubled the rate of NM$ gain: from about $40 per bull per year (2005–2009) to roughly $85 per bull per year from 2010 onward. The genetic trend lines are real. Whether those gains match your own herd’s priorities is a different question.
What Kills Your Calves Before They Ever Milk?
John Cole is part of the generation pushing genomic evaluations into the ugly stuff that never makes it to the parlor: dead or wrecked calves.
Across multiple datasets, about 75% of preweaned calf mortality comes from just two buckets: diarrhea and respiratory disease. To put numbers on the genetics behind that, CDCB and partners pulled together 207,602 diarrhea records and 681,741 respiratory disease records from calves born between 2013 and 2024. Those data streams feed the new U.S. genomic evaluations for calf diarrhea (DIAR) and respiratory disease (RESP), officially launched in April 2026. Lactanet rolled out its own Calf Health RBVs for Holsteins in August 2025.
The heritability looks low at first glance: about 0.026 for diarrhea resistance and 0.022 for respiratory resistance. Translate that: only 2–3% of the variation in those health outcomes is explained by genetics in the current models. Zoetis’s earlier proprietary Calf Wellness index (CW$) reported slightly higher figures due to differences in traits, models, and data sources.
Cole’s message in presentations and industry pieces has been consistent: don’t let the low heritability numbers fool you. Once you’re doing the basics right on colostrum, hygiene, and housing, adding genetic resistance can still move many calves out of the treatment pen and into the parlor.
The Genetic Spread, in Real Daughters
Lactanet clearly summarized the genetic spread in an August 2025 calf health article and a companion presentation. Among officially proven Holstein sires:
For respiratory disease, daughters of the top 5% sires by calf health RBV stayed healthy (no recorded RESP case) about 71% of the time; daughters of the bottom 5% sires were healthy only about 54% of the time.
For diarrhea, daughters in the top 5% were healthy about 69% of the time, compared with roughly 53% for those in the bottom 5%.
That’s not “nice‑to‑have.” That’s a lot of treatments, mortalities, and delayed heifers tied directly to the bulls you pick.
Rosy Lane Holsteins saw similar real‑world spreads years earlier when it leaned heavily into Zoetis’s Calf Wellness index. A WW Sires case study reported that calves in the top 25% for CW$ at Rosy Lane logged about 50% fewer scours cases and roughly 32% fewer pneumonia cases than calves in the bottom 25% over a 12‑month window — tracked with ultrasound to catch subclinical pneumonia that never showed as a full‑blown “trainwreck.”
An often‑cited study summarized in Farmtario’s 2025 calf‑health coverage showed that heifers with a recorded respiratory disease event produced 121 kg less milk in first lactation. Stack that across a whole age group, and you feel it in the tank.
Genetics won’t fix sloppy colostrum or filthy hutches. But if you’re already holding preweaned mortality in the 3–4% range, calf health genetics is one of the few levers left to push toward that 1–2% elite zone.
What Data Actually Feeds Your Genomic Proof?
Data Source
What It Captures
Who Provides It
Key Blind Spot
DHI/DHIA test
Monthly production, components, SCC
Techs or automated meters
Only ~40% of U.S. herds on some form of official test
Classification
Linear type traits and composites
Breed‑association classifiers
In Canada, only first‑lactation scores feed official type proofs
Genomic labs
SNP genotypes (e.g., 50K → ~54,001 usable markers)
DNA from hair, blood, ear notch
Minor breeds have thin reference populations
Producer health records
Mastitis, metabolic disease, calf health events
Producers via herd software
Only a minority of farms consistently log calf health events
Those gaps matter. The DIAR and RESP national datasets are over 97% Holstein and Jersey — roughly 80% Holstein, 17% Jersey — which makes the models strong for those breeds and less robust for everyone else. If you’re milking registered Holsteins on test and logging health, the system sees you. If you’re off test, crossbred, or light on health records, you’re asking the index to guess.
Does the System See Your Herd — or Just the Average?
Genomic selection was intended to mitigate inbreeding. The sales pitch: if you can see exactly which genes each calf got, you can manage inbreeding smarter. In reality, progress has been messier.
Lozada‑Soto and co‑authors (2024, Journal of Dairy Science) showed that in Nordic Holstein and Jersey populations, yearly inbreeding rates increased after genomic selection took off, and the effective population size for Nordic Holsteins dropped from 54.3 to 42.8. Doekes et al. (2019, Journal of Dairy Science) found that recent inbreeding — long runs of homozygosity in the genome — hurts longevity more than older, “diluted” inbreeding.
You see that on‑farm, as good‑looking heifers that fall apart too soon for reasons you can’t fully blame on your nutritionist or hoof trimmer.
So you’re stuck with a double‑edged sword:
Genomics doubles genetic gain in traits the index rewards.
Key traits like heat tolerance, methane emissions, and temperament still don’t have official U.S. evaluations. The index can’t weigh what it doesn’t measure. If those matter on your farm, you’re into custom selection, not blind NM$ chasing.
On the Canadian side, Lactanet’s August 2025 inbreeding update pegged average inbreeding for Holstein heifers born in 2024 at 9.99% — a full percentage point higher than 2014. That’s your benchmark when you run your own mating reports.
Rosy Lane Holsteins: Using the System, Not Worshipping It
The Net Merit model is built for an “average” U.S. confinement herd. Rosy Lane Holsteins, just outside Watertown, Wisconsin, is one of the operations proving you can use that system aggressively without letting it run the show.
Lloyd Holterman and the Rosy Lane team have been clear for years: profit comes first because farming is a business.In a 2014 Bullvine profile and later Zoetis/WW Sires features, Holterman laid out a strategy that still makes some breeders twitch:
Sort bulls by NM$ first, not TPI or show‑ring appeal.
Avoid bulls that crank up Stature; favor moderate‑sized, wide, durable cows.
Stop classifying if the scores aren’t helping profit decisions.
When Rosy Lane compared its cows, Holterman told The Bullvine they found that shorter, wider, better‑conditioned cows “far outlived their higher‑scoring herd‑mates while having fewer foot problems and better fertility.” We later quoted his joking shorthand for what can happen when people chase pure type without thinking about fertility: cows that are “tall, pretty and infertile.” (Read more: ROSY-LANE HOLSTEINS – “Don’t Follow the Herd!”)
That line isn’t a scientific verdict on TPI. It’s one breeder’s sharp reminder that an index built for show cows and an index built for profit aren’t the same tool.
Rosy Lane also leaned early into Calf Wellness genetics. The Zoetis/WW Sires case study from their herd showed calves in the top quartile for CW$ had around half the scours and one third fewer pneumonia cases than bottom‑quartile calves — not because management changed, but because the sire list did. That’s exactly the kind of “make the data pay” story the Beltsville team hopes other herds can copy.
Holterman’s bottom line hasn’t changed: use the tools, but never forget your own milk cheque.
The Bullvine Verdict: Who Gets to Decide What a “Good” Holstein Looks Like?
Here’s the uncomfortable truth: if you don’t know how NM$, FSAV, and calf health evaluations work, someone else is making your breeding strategy — even if you’re the one signing the semen bill.
Beltsville’s job is to define an average profitable Holstein in 2025: moderate size, high components, better feed efficiency, fewer dead calves, and fewer young cows leaving early. That’s not a bad target.
But your farm isn’t average. Your milk contract might reward protein harder than fat. Your freestalls and robot boxes might punish tall, wide cows. Your land base might mean feed is your bottleneck, not cow numbers. Or you might be okay trading some NM$ for show‑ring presence or niche milk premiums.
Net Merit is a strong starting point. It’s just blunt. Rosy Lane is a live example of how a herd can lean hard into Net Merit, calf wellness, and FSAV — and still make their own calls about size, type, and classification.
The real question isn’t “Is Net Merit right?” It’s “Does Net Merit, as currently weighted, line up with the way money actually moves through your operation?”
What This Means for Your Operation
Always read NM$ with reliability beside it. An NM$ +1,000 bull at 75% reliability is a strong estimate; at 95% reliability, it’s a proven moneymaker relative to the base. They’re not interchangeable, and low‑reliability bulls can move 150+ NM$ in a run.
Match your index to your contract. If your cheque pays on components, CM$ or Pro$ might match better than NM$ if you’re fluid and volume-heavy. NM$ is still the best fit. The index choice isn’t a religion — it’s a business decision that should be revisited at least annually as prices shift.
Find FSAV on your sire summary — or ask why it’s missing. With 17.8% combined weight in NM$, FSAV is now a core trait, not a side note. A bull that looks good on milk and components but is weak on FSAV may not pencil once you factor in feed and maintenance.
Use genomics to diversify, not concentrate. Spreading risk across at least 5 genomic sires is cheap insurance. One young bull can re‑rank hard; a group of five rarely does. If your top 3 sires account for more than ~40% of your herd’s expected future inbreeding, that’s a practical red flag to add diversity.
Treat Net Merit as your first filter, not your only one. Rosy Lane uses NM$ as the gate, then rejects bulls that push Stature too high. You might do the same for calving ease, A2A2, polled, robot suitability, or grazing traits, depending on your system.
Put calf health on the table if you’re already nailing management. Once your basic colostrum, housing, and hygiene are solid, DIAR/RESP and tools like CW$ can start doing noticeable work in the background.
Key Takeaways
If your expected inbreeding is higher than 9.99%, it’s time to adjust your mating plan. That 9.99% is Lactanet’s average for Canadian Holstein heifers born in 2024. Run your own mating reports. If your next calf crop is well above that, add two or three outcross or lower‑inbreeding bulls before the next breeding cycle.
If a bull drops more than ~150 NM$ between proof runs, he should lose some tank share. That kind of swing is normal for low‑reliability genomic sires, but it’s your cue to slow his usage and bring in a replacement rather than riding him for another year, hoping he comes back.
If your top 3 bulls contribute more than ~40% of your herd’s expected future inbreeding, you’ve got a concentration problem. That number isn’t a magic line — it’s a simple threshold that tells you when you’ve leaned too hard on a couple of “hot” sires.
If FSAV isn’t in your sire selection process yet, you’re ignoring 17.8% of the index you think you’re using.That’s a lot of money and feed to leave on the table when you’re already fighting ration costs.
The Bottom Line
In the next month, carve out half an hour with your genetic advisor or semen rep. Pull up your proofs, look at BWC, FSAV, reliability, and expected inbreeding side by side — and ask one question: “Does the way I’m using these tools actually match how my farm makes money?”
Complete references and supporting documentation are available upon request by contacting the editorial team at editor@thebullvine.com.
Learn More
The $212,000 Bulk Tank Lie Hitting Upper Midwest Dairies – Exposes the high-test trap that’s quietly draining your bank account. You’ll gain a concrete 4-point playbook to stop chasing percentages and start shipping the component pounds that actually drive your 2026 milk check.
Every week, thousands of producers, breeders, and industry insiders open Bullvine Weekly for genetics insights, market shifts, and profit strategies they won’t find anywhere else. One email. Five minutes. Smarter decisions all week.
Your top genomic heifers probably trace to three cow families. In a $3,110 heifer market, that concentration can be a $93,300‑a‑year mistake.
Executive Summary: Replacement heifers averaged $3,110 per head in late 2025, inventories are sitting at a 47‑year low, and that makes your heifer pipeline one of the biggest financial risks on your farm. This article shows how herds like Glenn Kline’s — with every heifer genomic‑tested and beef‑on‑dairy dialed in — can still end up with most of their “best” heifers tracing back to just two or three cow families that don’t consistently last three or more lactations. When those same maternal lines also dominate your AI sires, you’re quietly concentrating inbreeding and fragility, not diversifying. On a 400‑cow herd, that concentration can mean 20–30 extra replacements every year, tying up about $93,300 in replacement capital at current prices. You get a concrete 30/90/365‑day playbook: add a cow‑family column to your data, run survival and culling by family, re‑aim sexed/IVF/beef rules at proven‑durable lines, and double-check your sire list by maternal line. The bottom line: genomics and beef‑on‑dairy still drive progress and cash flow — but adding cow family as a sorting column turns your breeding program into a risk‑management tool instead of a ,300‑a‑year gamble.
USDA’s October 2025 Agricultural Prices report pegged the average U.S. replacement dairy heifer at $3,110 per head— the highest figure ever recorded in that series. By January 2026, the national average eased to $2,860, but top springing heifers in California and Minnesota were still clearing above $4,000. U.S. replacement inventories? A 47‑year low, with CoBank estimating the country is short roughly 800,000 dairy heifers across 2025–2026.
At his Holstein herd in Pennsylvania, Glenn Kline has built exactly the kind of genomic program those prices reward: every heifer is genomic‑tested, lower performers are bred to beef, and IVF is used to multiply the top cows. “Back in 2011, we started on genomic testing, and boy, that’s made a huge difference in our herd,” he told the CDCB industry meeting at World Dairy Expo 2025. When he expanded and had to buy animals in, the gap was obvious. “There was really a significant difference with our original animals lasting longer,” Kline said.
The genomics worked. The bought‑in cows didn’t hold up. But here’s the question Kline’s spreadsheet doesn’t answer — and that most progressive breeders aren’t asking either: which cow families do his best genomic heifers actually belong to? And what does it cost when a handful of famous families quietly dominate your replacement pipeline in the tightest heifer market in five decades?
The Cull Math That Changes Everything
Penn State Extension’s cull‑rate benchmarking using USDA/NAHMS data shows how many cows never reach the point where they’ve truly paid their way. In U.S. dairy herds tracked by NAHMS, the annual combined cull and death rate is around 37–38%, with about 73% of culls involuntary — driven by infertility (23.3%), mastitis (18.6%), lameness, and other biological failures rather than planned marketing decisions.
Penn State and other economic analyses put the full heifer‑rearing cost from birth to calving in the $1,800–$2,400range, depending on system, with roughly $2,000 per head as a solid 24‑month benchmark for many U.S. herds. At that cost level, most operations need three or more lactations before a cow starts delivering a longevity dividend instead of just paying back her childhood.
But NAHMS data still shows average productive life below that three‑lactation mark in many herds, with a large share of cows leaving before they finish a third lactation. Every cow that reaches a fourth lactation saves you at least one replacement you didn’t have to rear or buy and delivers another year of mature‑cow production.
The replacement side of the equation flipped fast. CoBank’s Corey Geiger tracked national averages moving from around $1,140 per head in April 2019 to $2,660 by January 2025, then surging to $3,010 in July 2025 — a 164% jump from that 2019 low. That’s the backdrop for every breeding decision you make right now.
When your genomic‑tested heifer pen is dominated by daughters from three famous cow families, and your AI lineup is stacked with sons and grandsons of those same families, you’re doubling up maternal lines from both sides of the pedigree. The Expected Future Inbreeding (EFI) number on a bull proof might still look acceptable, but EFI is calculated against a base population that’s itself more inbred than it was a decade ago. You’re measuring water depth in a boat that’s already taking on water.
Doekes et al. (2020) analyzed Dutch Holstein Friesians and found roughly 36–99 kg less 305‑day milk per +1% increase in genome‑wide homozygosity, along with longer calving intervals and higher somatic cell scores. That’s the kind of quiet drag you feel when fresh‑pen performance doesn’t match the proofs. Misztal and Lourenco’s 2024 Journal of Animal Science review warned that genomic tools accelerate unfavorable changes in fitness traits alongside production gains, and that management alone can’t fully counteract them if inbreeding continues to rise.
Cow family tracking doesn’t fix inbreeding on its own. It lets you see where you’re stacking weight onto the same thin branches before your fresh‑cow pen and replacement budget start screaming.
What Does a $1,200 Beef‑on‑Dairy Calf Really Cost Your Replacement Program?
On paper, the beef‑on‑dairy logic is clean. You genomic‑test your heifers, rank them by index, breed the bottom slice to beef — capturing a $900–$1,400 beef‑cross calf premium in many 2024–2025 U.S. markets — and point sexed semen or IVF at the top slice to make replacements. The beef check shows up in 90 days. The genomic ranking tells you you’ve kept the “best” heifers.
Then you put the cow family on top. The picture shifts.
In a composite analysis built from several 300–500‑cow Holstein herds, one “plain” family that rarely produced chart‑topping genomic heifers quietly averaged 3.7–4.0 lactations in the parlor. Two fashionable high‑index families averaged 2.4–2.6 lactations, with disproportionate reproductive and transition‑disease culls. Those are herd‑record numbers, not theory. Your exact figures will differ, but the pattern probably feels familiar: some families stay; some don’t.
Genomics lets you see PL, DPR, and health indexes. But if your filter is still mostly “top overall index,” the families that rise fastest aren’t always the ones that handle your transition, lameness, and reproductive pressure best.
Metric
Family A (Durable)
Family B (Fragile)
Family C (Fragile)
Average lactations completed
3.9
2.4
2.6
Share of genomic-tested heifers
22%
31%
27%
Average GTPI rank (percentile)
68th
82nd
79th
Involuntary cull rate
28%
42%
39%
Top culling reasons
Mastitis, injury
Repro, transition
Lameness, repro
Running the Numbers: The Trade
Take a 400‑cow Holstein herd:
Herd size: 400 milking cows
Turnover target: 35% → about 140 replacements per year
Replacement purchase cost (national average): $3,010–$3,110 per head in mid‑ to late‑2025
Durable families: ~3.8 lactations average (turnover ~26% per year)
Fragile families: ~2.5 lactations average (turnover ~40% per year)
In a balanced scenario, overall turnover sits close to 35%. Replacement needs stay near 140 head. Now imagine your replacement pipeline is heavily tilted — 60–70% of your genomic‑tested replacements come from fragile families, rather than a more even mix. Based on the composite herd data, those herds saw replacement needs rise by 20–30 extra heifers per year.
At $3,110 per purchased replacement:
30 × $3,110 = $93,300 per year in additional capital
as long as that concentration-turnover gap persists.
Metric
Durable Families
Fragile Families
Average lactations completed
3.8
2.5
Annual turnover rate
~26%
~40%
Replacements needed (400-cow herd)
104 per year
160 per year
Extra replacements vs. baseline
—
+30 per year
Annual replacement cost at $3,110/head
$323,440
$497,600
Additional capital tied up
—
+$93,300/year
You didn’t make that choice explicitly. You made it when you set beef‑on‑dairy and IVF rules strictly by genomic rank, without asking which families actually survive in your barns.
The 400‑Cow Herd That Added the Cow Family Column
Here’s how those composite herds actually changed their breeding rules — built from several progressive Holstein operations that tracked maternal lines and shared data with their advisors.
Step 1 — Tag every female by maternal line. They added a “CowFamily” field in herd software. Every female was assigned to a family tied back to a base cow, defined strictly by maternal lineage — not marketing labels.
Step 2 — Build one combined heifer file. For every genomic‑tested heifer: ID, sire, birthdate, CowFamily, GTPI or NM$, PL/DPR/health indexes, and dam’s lactation number and culling status. For the first time, genomic scores, cow families, and real survival data lived in the same table.
Step 3 — Run family‑level stats. Average lactations completed, lifetime milk and components, primary culling reasons by family. The pattern was striking: some high‑index families had excellent longevity — gold. Others underperformed their genomic potential, with many second‑lactation exits. Several mid‑index families quietly averaged nearly 4 lactations, with fewer involuntary culls.
The lesson wasn’t “don’t trust genomics.” It was “don’t let genomics outrun what your cow families are telling you about your own barns.”
Step 4 — Rewrite three breeding rules.
Sexed semen allocation. Top heifers within each proven‑durable family got priority, even if their GTPI was mid‑pack.
IVF and donor lists. IVF on high‑index heifers from fragile families was capped; donor status went first to heifers from families that could reach third lactation under current management.
Beef‑on‑dairy targets. Beef semen was pointed at over‑represented, short‑lived families after enough replacements were secured from the durable families.
Within about two years, those herds consistently reported: no single family supplied more than ~30% of replacements, the annual increase in genomic inbreeding slowed, and a higher share of cows reached third and fourth lactation.
These aren’t randomized trials. But they’re real herd‑record results that line up with the math.
Your Sire Analyst’s Quiet Role in This
Your sire analyst isn’t out to sabotage your herd. They’re working with the same tools and incentives: genomic rankings, strong proofs, and semen that sells. When an AI program finds cow families that reliably produce top‑ranking sons, it’s logical to double down. Those families become donors and bull dams for everyone else. Over time, more bulls in your semen tank share the same grand‑dams and great‑grand‑dams, even if the sires change.
NAAB and industry reports show a concentrated semen market, with a small number of large organizations controlling most of the U.S. AI business. That’s efficient for pushing genetic gain. It also amplifies maternal‑line concentration in the client herds unless you actively steer away.
For breeders like Kline, the practical question isn’t whether AI companies are “wrong.” It’s whether their female programs are quietly overriding their own herd’s economics. If your bull list is heavy with sons of cow families that already account for a big chunk of your heifer pen, you’re not diversifying. You’re doubling down.
The Playbook: What to Do Before Your Next Breeding Cycle
In the Next 30 Days
Add the cow family column. Export your female inventory, add a “CowFamily” field, and tie each animal back to a base cow.
Run a concentration check. Pull your genomic‑tested heifer list, sort by GTPI or NM$, and look at the top 25–30%. If three or fewer families supply 60% or more of that group, you’re carrying the concentration risk this article describes.
Cross‑check your main sires. Note the cow families in their maternal pedigrees. If those match your over‑represented families, flag them as “use thoughtfully” instead of default choices.
In the Next 90 Days
Calculate family‑level survival from your own data. Average lactations completed, average lifetime milk, voluntary vs involuntary cull ratio, and top culling reasons — by cow family.
Identify your “insurance” families. Families averaging 3.5+ lactations with lower involuntary cull rates are your built‑in pipeline stabilizers.
Rewrite three core rules: Sexed semen priority goes to daughters from durable families. IVF donor lists start with high‑health, high‑PL heifers from durable families before fragile ones. Beef semen is allocated first to over‑represented, short‑lived families once replacement needs from durable families are met.
In the Next 365 Days
Audit your sire lineup by maternal line. For each bull you use heavily, record the cow family of his dam and grand‑dam. Don’t let half your semen volume come from bulls out of the same two or three families.
Set a practical inbreeding guardrail. Work with your genetic advisor to flag matings in which both the sire and dam come from your most common cow families.
Track outcomes, not intentions. As the first heifers under new rules freshen, watch average lactations completed by family, voluntary vs involuntary culling by family, and total replacements needed per year vs your target.
Timeline
Action
Output / Deliverable
Next 30 Days
Add cow family column to herd software
Every female tagged with maternal line ID
Next 30 Days
Run concentration check
% of top genomic heifers from 3 families
Next 30 Days
Cross-check main sires by maternal line
List of sires that double-up over-represented families
Next 90 Days
Calculate family-level survival stats
Average lactations, cull reasons by family
Next 90 Days
Identify “insurance” families (3.5+ lact.)
List of durable families for priority breeding
Next 90 Days
Rewrite sexed/IVF/beef rules
Updated protocols prioritizing durable families
Next 365 Days
Audit sire lineup by maternal line
Maternal diversity report for bull list
Next 365 Days
Set inbreeding guardrails with advisor
Flagged mating pairs from same families
Next 365 Days
Track outcomes by family as heifers freshen
Lactation/cull metrics by family, quarterly
Ongoing
Monitor replacements needed vs. target
Annual replacement count and cost by family
What This Means for Your Operation
Your genomic ranking list is a tool, not a verdict. It doesn’t know which cow families actually survive under your feed, facilities, and disease pressure. Your cull and longevity records do.
Replacement cost has changed the tolerance for fragility. Going from $1,140 per head in 2019 to $3,010–$3,110 in 2025 means being wrong about cow family durability isn’t a nuisance — it’s a five‑ or six‑figure swing in capital exposure.
Inbreeding penalties are already in your tank and your parlor. The depression numbers from Dutch Holsteins — up to 99 kg less milk per +1% genomic inbreeding — aren’t abstract; they describe what happens when you stack too many related lines.
Beef‑on‑dairy decisions need a family filter. Before you write next season’s beef semen rules, pull the last 50 heifers you bred to beef and tag them by cow family and dam’s lactation. If your best longevity families are taking the hit, your protocol is backwards.
IVF amplifies whatever you point it at. If you aim your IVF budget at cow families that don’t last in your system, you’re multiplying fragility in the tightest replacement window in decades.
Key Takeaways
If three or fewer cow families supply 60%+ of your top genomic heifers, you’re carrying the concentration risk this article lays out. Put a hard cap on your breeding protocols and deliberately feed replacements from underrepresented, proven‑durable families.
If your annual replacement rate has drifted above the mid‑35% range without obvious disease crashes, check whether short‑lived families are quietly driving that turnover. Run replacements‑needed per year by cow family and compare that to your longevity and cull data.
Before your next beef‑on‑dairy semen order, block out an hour to run one report: last 50 heifers bred to beef, tagged by cow family and dam’s lactation number. If durable families are over‑represented in the beef column, fix the rules before the next breeding season.
On your next call with your sire analyst, ask one extra question: “Which bulls in your lineup come from cow families we don’t already have stacked in this herd?” Make maternal‑line diversity part of the conversation, not an afterthought.
The Bottom Line
Open your genomic heifer list right now. Add a cow family column. Sort by family instead of GTPI. How many maternal lines are you actually betting your next three years of replacements on — and do the families carrying the most weight have the track record in your barns to justify it? If you’re already doing what Kline did — leaning into genomics early, pushing for better cows — this isn’t about blaming you. It’s about upgrading the tools so your cow families, not just your proofs, protect the herd you’ve worked hard to build.
Complete references and supporting documentation are available upon request by contacting the editorial team at editor@thebullvine.com.
$3,010 Per Heifer. 800,000 Short. Your Beef-on-Dairy Bill Is Due. – This analysis reveals how to survive the 800,000-heifer deficit by auditing your breeding rebalance and processor contracts. You’ll gain four concrete capital-preservation paths to ensure your operation stays in the group processors treat as long-term partners.
9.99% Inbreeding and Rising: How Blondin Sires Turned a Holstein Bottleneck into 75% Growth – Exposes the hidden 9.99% inbreeding ceiling and delivers unconventional outcrossing strategies to reclaim genetic diversity. This disruptor-focused piece breaks down how to use European genetics and niche pedigrees to flip a genetic bottleneck into a competitive growth engine.
The Sunday Read Dairy Professionals Don’t Skip.
Every week, thousands of producers, breeders, and industry insiders open Bullvine Weekly for genetics insights, market shifts, and profit strategies they won’t find anywhere else. One email. Five minutes. Smarter decisions all week.
Every time you pull up a sire list, there’s one question you almost never ask: what am I not measuring that’s already costing me money?
February 2003. Snow coming down sideways in a drafty barn at the Wisconsin Holstein Convention Sweetheart Sale. Experienced breeders — guys who’d driven hours through a Wisconsin winter to be there — were heading for the exits. The auctioneer’s voice was getting that tired, frustrated edge as bidding stalled out on a five-year-old Holstein whose rump “wasn’t entirely balanced.”
Matt Steiner called in from Pine-Tree Dairy in Ohio. He’d never laid eyes on the cow in person. Her second lactation ran 31,880 pounds at 4.1% fat and 3.2% protein — respectable, not revolutionary. He bid $8,100 for what everybody else in the room saw as just another decent cow past her prime.
Wesswood-HC Rudy Missy-ET EX-92 — the “unbalanced” Wisconsin sale cow whose $8,100 phone bid quietly rewrote Holstein genetics for the next 20 years.
But here’s the part of that story nobody tells. The same breeding system that produced Missy — the same genomic toolkit that doubled annual genetic gain to 109 kg/year for milk in registered Holsteins (García-Ruiz et al., 2016, PNAS) — was simultaneously dragging 198 fertility genes and 67 immunity genes in the wrong direction. For 20 years. And the industry didn’t catch it.
The question that should bother you: what’s getting dragged sideways in your herd right now?
How Fast the Engine Actually Runs
Before 2009, you waited five to seven years for a bull’s daughters to start milking before you knew if he was any good. Genomic selection rewired that math completely. Paul VanRaden and colleagues at USDA helped architect a system that estimates merit at birth, and the speed gain was dramatic. Across all four selection pathways that drive Holstein genetics (sire-of-bulls, sire-of-cows, dam-of-bulls, dam-of-cows), the combined generation interval dropped from 21.4 years in 2009 to 13.5 years by 2015 — a 37% reduction in just six years (García-Ruiz et al., 2016, PNAS). The sire-of-bulls pathway collapsed the fastest, from about 7 years to under 2.5.
Financially, the results are hard to argue with. Annual Net Merit gains climbed from $13 during 2000–2004 to more than $85 after 2010 (nominal dollars). Fat yield accelerated 173%. Protein yield, 156%. And the daughter pregnancy rate — which had been flat or declining for decades — finally reversed direction, rising to +0.26% per year.
Here’s a way to feel that in your bulk tank. On a 200-cow herd averaging 85 lbs/day, the post-genomic milk yield acceleration alone (from ~50 kg/year to 109 kg/year for registered Holsteins) translates to roughly an extra 130 lbs of milk per cow per year in genetic potential over what the old system would have delivered. At a $19.50/cwt mailbox price, that’s about $5,070 in additional gross milk revenue across your herd annually — and it compounds every generation. Adjust that number for your regional mailbox price, but the scale holds. The record-breaking component shifts reshaping dairy’s economics are a direct product of this acceleration.
But the engine has a blind spot. And it’s biological, not mathematical.
What Happened When Nobody Was Measuring Fertility
The University of Minnesota’s research herd at the Southern Research and Outreach Center in Waseca did something nobody else bothered to do: they maintained an unselected Holstein control line alongside the commercially selected national population from 1964 onward. Same management. Same feed. Different genetics.
By 2004, the selected population had increased milk yield by 79%, from 6,309 kg to 11,324 kg. It had also lost roughly 30 additional days for successful conception compared to the control cows living right next door (Ma, Cole, Da & VanRaden, 2019, BMC Genomics 20:128).
That fertility decline wasn’t nutrition. Wasn’t repro protocols. Purely genetic. A breeding consequence nobody planned for.
The genome-level analysis revealed the mechanism. Within 234 chromosome regions shaped by four decades of milk selection, researchers found 198 genes involved in reproduction and 67 genes involved in immune function whose allele frequencies had shifted as collateral damage. The estrogen receptor gene ESR1 decreased from 0.45 to 0.13. The MHC region on chromosome 23 — the heart of immune diversity — showed significantly decreased heterozygosity.
Category
Count
Fertility genes negatively affected
198
Immunity genes negatively affected
67
Total chromosome regions under selection
234
Nobody selected against fertility or immunity. Those genes just happened to sit near milk-boosting alleles on the same chromosomes, and they got swept along for the ride. Geneticists call it hitchhiking. Producers who lived through the collapse in conception rates in the 1990s just called it expensive.
(This hitchhiking analysis comes from a single study using the unique Minnesota control line — the only unselected comparison herd of its kind. The broader fertility decline is independently confirmed across both the U.S. and Israeli dairy populations.)
Is the Same Thing Happening to Heat Tolerance Right Now?
The fertility crash is old news — the industry course-corrected, and genomic selection actually reversed the decline. The real question: where is the same pattern building today?
Heat tolerance is eroding, and almost nobody is selecting against it. Research led by Ignacy Misztal at the University of Georgia and Luiz Brito at Purdue found that the temperature-humidity index (THI) threshold where Holsteins start losing production has dropped from 72 to 69 over the past two decades (Misztal, Brito & Lourenco, 2024, JDS Communications 6(3):464–468). Your cows start suffering heat stress at lower temperatures than cows bred a generation ago.
And the grim part: cows that maintain production during heat stress peaks show an increased likelihood of death. They’re not tolerating the heat. They’re metabolically overriding their body’s protective shutdown. The authors note that better fans, sprinklers, and tunnel ventilation may actually be masking an even larger genetic deterioration underneath.
With the exception of Australia, dairy cows are not directly selected for improved heat tolerance anywhere in the world. In Alabama, Mississippi, and Louisiana, dairy has already become economically unviable — these states don’t even appear in the 24 major dairy states NASS tracks monthly (Misztal et al., 2024). A quiet testament to how completely the industry has retreated from the Deep South.
If your herd faces more than 60 days per year above THI 68, this isn’t an abstract research finding. It’s your next fertility crash in slow motion.
The Inbreeding Bill Coming Due
Genetic diversity is narrowing faster under genomics, not slower. A study of 74,485 Italian Holstein cows found the annual inbreeding rate based on runs of homozygosity (ROH) was +0.32% per year before genomic selection. After genomic selection took hold, it jumped to +0.70% per year (Ablondi et al., 2022, Frontiers in Veterinary Science8:773985). That’s above the 1% per generation threshold FAO considers critical for long-term sustainability.
Category
Value
Pre-Genomic Annual Rate (Italy)
0.32%
Post-Genomic Annual Rate (Italy)
0.70%
U.S. Cumulative Increase 2010–2020
168%
It isn’t just an Italian problem. U.S. Holstein inbreeding climbed from about 5.7% in 2010 to 15.2% by 2020 — a 168% jump — with CDCB analysis putting the cumulative cost to the national herd at an estimated $6.7 billion (The Bullvine, 2025 year-end review).
Metric
Annual Impact (200-cow herd)
What’s Driving It
Extra Milk Revenue (Genomic Gain)
+$5,070
109 kg/year genetic gain vs. 50 kg/year pre-genomic (registered Holsteins, $19.50/cwt)
Inbreeding Drag (4% increase)
−$4,800 to −$6,400
$23–25/cow lifetime NM$ loss per 1% inbreeding, annualized over 3–4 year turnover
Net Realized Gain (Conservative)
+$270 to +$1,070
On fast-turnover herds, inbreeding wipes out nearly all the genomic advantage
Net on Fast-Turnover Herds
−$1,330 (loss)
Herds replacing >35% annually can lose more than they gain
Here’s where the barn math gets uncomfortable. Each 1% increase in inbreeding costs roughly $23–25 off a cow’s lifetime Net Merit (USDA-ARS, 2025 NM$ revision). Go back to that 200-cow herd. If your average genomic inbreeding crept up 4 percentage points over the past decade — and given that the national average jumped 9.5 points in ten years, 4% is conservative — that’s about $96 per cow in lifetime profit quietly erased. Spread across a herd that turns over every three to four years, you’re looking at roughly $4,800 to $6,400 per year leaking out through health costs, fertility failures, and shortened productive life, depending on your actual turnover rate. Remember that $5,070 in extra annual milk revenue from faster genetic gain? At most turnover rates, inbreeding depression is clawing back nearly all of it — and on herds that turn over faster, the loss actually exceeds the gain. You’re running the genetic engine harder, and a big chunk of what it produces is leaking out the other side.
(Note: the $5,070 figure is gross milk revenue at $19.50/cwt; the $4,800–$6,400 range is annualized lifetime Net Merit loss, which captures health, fertility, and longevity effects beyond milk alone. They’re not identical units, but the scale of the offset is real — and the barn-math range depends on how quickly your herd turns over.)
Options and Trade-Offs for Your Next Breeding Decisions
The fertility crash lasted 20-plus years because nobody measured the trait being eroded. Heat tolerance, inbreeding, and resilience are in a similar position today. Here’s what you can actually do about it — with the honest trade-offs attached.
Action
When to Act
What You’re Hedging Against
Trade-Off
ROH Inbreeding Audit
If genomic inbreeding >7–8%
$23–25 lifetime NM$ loss per 1% increase; $4,800–$6,400/year drag on 200-cow herd
Restricting matings may slow genetic progress 5–15%
Weight Productive Life + Livability
If you face 60+ days above THI 68
Heat tolerance declining; THI threshold dropped from 72 to 69 over 20 years
May sacrifice 3–5% genetic gain on other traits
Diversify Across 3+ AI Programs
If top 5 bulls all trace to one program
Genomic inbreeding rising 0.7%/year; 22 of top 30 NM$ bulls from one program (Dec 2025)
Aggressively avoiding related matings costs ~5–15% progress
Contribute AMS/Activity Monitor Data
If you’re running precision dairy tech
Next hitchhiking problem: feeding the reference population so crashes get caught in 5 years, not 20
Consistent data entry discipline required
Confirm you’re using CDCB’s 2025 NM$ revision — and don’t override it. The updated index rolled out alongside the April 2025 base change. It now balances 17 traits for lifetime profitability, with feed efficiency (FSAV) carrying 17.8% of total emphasis — a substantial shift from prior weightings. If your genetics provider hasn’t updated to the 2025 revision, it’s worth a quick conversation; the trait emphasis shifted enough that older weightings are optimizing for a different market than the one you’re selling into. But even the right index can’t save you from yourself: if your top five bulls all rank in the top 20 for a single component while sitting below breed average for productive life, you’re running a single-trait program no matter what the index says. David Dyment at AG3 has built his program on exactly this principle — “consistency over unpredictability,” as he puts it — betting that balanced functional genetics outlast flavor-of-the-month rankings. The trade-off: you’ll pass on some high-component bulls that look great on paper. The fertility crash is what happened when the industry overrode balanced selection often enough.
Ask your genetics advisor for your herd’s ROH-based genomic inbreeding — this month. Pedigree coefficients underestimate actual homozygosity. In Italian Holsteins, pedigree inbreeding averaged 0.07 while genomic inbreeding was more than double at 0.17 (Ablondi et al., 2022). As a general rule of thumb, many geneticists start flagging concern when genomic inbreeding crosses 7–8% for Holsteins — there’s no official industry threshold, but herds above 9% should seriously consider a diversity audit. CDCB provides genomic inbreeding estimates — if your genetics provider isn’t using ROH-based calculations in mating plans, you’re flying partly blind. Diversify your sire lineup across at least three AI organizations. The trade-off: aggressively avoiding related matings can slow genetic progress — estimates vary, but the general range is somewhere around 5–15% depending on how restrictive you get. That’s a real cost. But inbreeding depression quietly eating your gains from the inside is worse — and that $4,800-to-$6,400-a-year leak on a 200-cow herd is real money.
If you’re in a heat-stress region, start weighting for it now. Increasing emphasis on productive life, livability, and fertility provides indirect selection pressure for thermotolerance — these traits correlate positively (Misztal et al., 2024). The trade-off: you may sacrifice 3–5% of genetic gain on other traits. In a warming climate, that’s a hedge worth paying for. If you’re south of the Mason-Dixon or running herds in the Central Valley, this isn’t optional — it’s self-defense.
Contribute the data you’re already collecting. If you’re running activity monitors, AMS systems, or feed intake tracking, those records can help build the reference populations for tomorrow’s evaluations. Contact CDCB or your breed association — in Canada, Lactanet already accepts health event and AMS data. The trade-off: consistent data entry takes discipline. But incomplete data contributed widely still beats perfect data that never leaves the farm. And it’s how the next hitchhiking problem gets caught in five years instead of twenty.
Key Takeaways
If your herd’s ROH-based genomic inbreeding is trending above 7–8%, schedule a diversity audit before your next mating run. Each 1% of inbreeding costs $23–25 off lifetime NM$ per cow, and on a 200-cow herd, a 4% accumulation translates to $4,800–$6,400 a year in hidden drag, depending on your turnover rate.
If you face 60+ days above THI 68, add productive life and livability emphasis to your sire selection now. Heat tolerance is declining genetically, even as heat abatement technology improves — the infrastructure is masking the problem.
If your genetics provider hasn’t updated to the 2025 NM$ revision, have that conversation this week. The updated index rebalanced 17 traits and added feed efficiency with an emphasis of 17.8%. Older weightings mean you’re optimizing for a market that’s already shifted.
If all your top sires trace to the same program, diversify across at least three AI organizations. Genetic gain means nothing if you’re narrowing the base that sustains it.
Before your next mating run, ask one question your genetics advisor probably won’t raise on their own: “Which traits am I not measuring that might be shifting in the wrong direction?” That’s the question the fertility crash should have taught us to ask in 1985.
The Bottom Line
Steiner’s $8,100 gamble in that drafty Wisconsin barn wasn’t a bet on a cow. It was a bet on seeing what the data couldn’t yet show him. Twenty-three years later, the tools are sharper than they’ve ever been — genomic testing at birth, AI-driven mating plans, embryo tech that was science fiction in 2003. The engine runs faster every year.
But the biology is still messier than the model. And the gap between what you’re optimizing and what you’re actually affecting is where unintended consequences compound. Silently. Generationally. The only question worth asking every time you pull up a sire list: What am I not measuring that I’m going to wish I had?
Editor’s Note: Genetic gain data from García-Ruiz et al. (2016, PNAS); the 37% generation interval reduction refers to the combined total across all four selection pathways (sire-of-bulls, sire-of-cows, dam-of-bulls, dam-of-cows), not any single pathway. Hitchhiking analysis from Ma, Cole, Da & VanRaden (2019, BMC Genomics 20:128), using the University of Minnesota unselected control line at Waseca, MN. Heat tolerance data from Misztal, Brito & Lourenco (2024, JDS Communications 6(3):464–468). Inbreeding data from Ablondi et al. (2022, Frontiers in Veterinary Science 8:773985), based on 74,485 Italian Holstein cows. U.S. inbreeding trends from CDCB analysis as reported in The Bullvine (December 2025). Barn-math calculations use $19.50/cwt mailbox price; inbreeding annualization assumes 3–4 year herd turnover and should be adjusted for your operation’s actual replacement rate. Per-trait figures are for registered Holsteins; all-cow population gains were approximately half this magnitude. NM$ figures are nominal. Missy auction details from The Bullvine’s Wesswood-HC Rudy Missy feature (July 2025), cross-referenced with the Wisconsin Holstein Association’s 2020 convention report.
Executive Summary:
Genomic selection has more than doubled Holstein genetic progress, but it also proved something you feel in your own breeding records: traits you don’t measure still move, and sometimes they move against you. The same engine that helped make Wesswood-HC Rudy Missy a global brood cow quietly dragged 198 fertility genes and 67 immunity genes the wrong way for about 20 years before anyone caught it. Over those same decades, the THI threshold at which cows start losing milk slipped from 72 to 69, yet almost no one outside Australia selects directly for heat tolerance, even as better fans and sprinklers mask how fragile the genetics underneath have become. On the inbreeding side, genomic homozygosity in Holsteins is rising around 0.7% per year in some populations, and each 1% costs roughly $23–25 in lifetime Net Merit per cow — enough for a 200-cow herd to quietly leak $4,800–$6,400 a year, which can wipe out almost all of the roughly $5,070 in extra milk revenue from faster gain. You’ll see how those blind spots developed. You’ll see how those blind spots developed, then get concrete next steps: stick with the 2025 NM$ revision instead of custom tweaking, ask your genetics provider for ROH-based genomic inbreeding for your herd, and spread risk across multiple AI programs instead of loading your list from just one. If you’re staring down 60+ days above THI 68, it also explains how to lean harder on productive life, livability, and fertility as indirect heat-tolerance filters while feeding good data back into the system so the next crash is spotted in years, not decades. Underneath it all is one question this article keeps pushing you to ask every time you open a sire catalog: what am I not measuring that I’m going to wish I had?
Complete references and supporting documentation are available upon request by contacting the editorial team at editor@thebullvine.com.
211,000 More Dairy Cows. Bleeding Margins. The 2026 Math That Won’t Wait. – Breaks down the structural reset facing the U.S. herd and reveals why current beef-calf premiums are masking a dangerous replacement shortage. It prepares you to navigate a $2.00–$4.00/cwt breakeven gap before the 2027 heifer crunch arrives.
Slick Genetics Revolution: How One Gene Could Save Dairy Farmers $5,000 Per Cow Lifetime – Reveals the internal “thermal management system” that infrastructure can’t match, delivering a permanent 50–70% reduction in heat stress. You’ll gain the competitive edge to trade expensive fans and sprinklers for heritable, internal resilience that protects your production year-round.
The Sunday Read Dairy Professionals Don’t Skip.
Every week, thousands of producers, breeders, and industry insiders open Bullvine Weekly for genetics insights, market shifts, and profit strategies they won’t find anywhere else. One email. Five minutes. Smarter decisions all week.
Cargill Milwaukee never bought your calves. Tyson did. See how a 4,200-cow Wisconsin herd with 2,500 beef‑on‑dairy crosses is rewiring its sire and packer risk.
Executive Summary: Ebert Enterprises in Algoma, Wisconsin, runs 4,200 cows and raises 2,000–2,500 beef‑on‑dairy crosses a year, using beef premiums to keep inflation from chewing up their margins. The Cargill Milwaukee plant that just hit the headlines is a ground beef facility that hasn’t slaughtered cattle since 2014, so it never bought their calves — or yours. The real shock to beef‑on‑dairy economics came earlier, when Tyson shut its 5,000‑head‑a‑day Lexington, Nebraska, plant and cut capacity at Amarillo, tightening kill‑floor access as CattleFax and NAAB data show volume surging to 3.22 million beef‑on‑dairy calves and 7.9 million beef semen units in dairy herds. That mismatch is why the Eberts now track where their calves actually land, spread their marketing beyond a single buyer, and favor Angus and Simmental‑Angus sires through AI — breeds with strong documented feedlot and carcass performance. Penn State research backs that play, showing all beef × Holstein sires can hit Choice, but some deliver far better gain and marbling than others. For your herd, the message is blunt: beef‑on‑dairy still works, but only if packer capacity and carcass predictability sit right beside conception rate and calving ease in your breeding plan.
The Milwaukee headline was a ghost story. But if you aren’t looking at Nebraska, you’re missing the real monster under the bed.
Randy Ebert knows the beef-on-dairy math as well as anyone. He and Renee run Ebert Enterprises near Algoma in Kewaunee County, Wisconsin — a sixth-generation operation with son Jordan and daughter Whitney now the seventh generation at the table. They milk 4,200 cows three times a day through an 80-stall rotary parlor and farm close to 9,000 acres. The family breeds the top 20% of the herd to sexed dairy semen and puts AI Angus and Simmental-Angus bulls on the rest, raising between 2,000 and 2,500 beef cattle from post-wean to finish, depending on the cycle.
“This is one of the few things that is helping us combat inflation costs of what we do, is what beef has done to us,” Ebert told Brownfield last July.
So a packer closure in Milwaukee gets your attention when you’ve got that many beef crosses moving through the system. Here’s the problem: the plant that’s closing wasn’t buying anyone’s calves.
The Facility That Didn’t Process Your Calves
Cargill filed a WARN Act notice with the Wisconsin Department of Workforce Development on February 10, confirming the permanent closure of its facility at 200 S. Emmber Lane in Milwaukee. About 221 positions will be eliminated. Production stops around April 17, full closure by May 31.
But look at what they actually make there. The WARN filing lists job titles like “CR Production Grind,” “Grinder Operator,” “Formax Operator,” and “Patty Stacking Robot Operator.” Not a single kill-floor position. This plant takes boxed beef as an input and turns it into ground beef and value-added meat products for grocery store private labels. It doesn’t slaughter cattle. It doesn’t accept live animals.
Cargill did run a cattle harvest operation at this site once — a real one, processing 1,300 to 1,400 head per day after purchasing it in 2001. But that slaughter plant closed on August 1, 2014, when Cargill cited a tight cattle supply. The ground beef operation was the only part that stayed open. And even that production isn’t leaving the area — it’s shifting to Cargill’s Butler, Wisconsin facility about 13 miles northwest, where roughly 500 employees already make frozen ground beef patties for restaurant chains.
This isn’t a loss of packing capacity. It’s a ground beef consolidation within the same metro area.
5,000 Head a Day Gone: The Closure That Actually Matters
The event that should have your attention happened two months earlier and 600 miles west.
On January 20, Tyson Foods permanently shuttered its beef processing plant in Lexington, Nebraska. This was a full-scale cattle harvest operation — roughly 5,000 head per day, or about 5% of total daily U.S. beef slaughter capacity, according to Brownfield Ag News. More than 3,000 workers lost their jobs. Tyson simultaneously cut its Amarillo, Texas, plant to a single shift, eliminating another 1,761 positions according to a WARN notice filed with the Texas Workforce Commission.
Buck Wehrbein, president of the National Cattlemen’s Beef Association and a Nebraska cattle feeder himself, didn’t dance around it: “It’s not really a surprise that we lost those plants because the herd is down so far. We were all worried about this.”
And then the line that matters most if you’re breeding beef-on-dairy:
“The cattle aren’t in the right place.” — Buck Wehrbein, NCBA President
Fewer slaughter plants mean longer hauls for finished cattle, fewer packers bidding at the feedlot gate, and less competition working its way back to the price of your week-old beef-cross calf. That calf’s value is tethered to what a packer will pay for the finished animal 18 months from now. When fewer packers bid, the tether gets thinner.
3.2 Million Calves Need Somewhere to Go
To understand why infrastructure deserves this much attention, look at what dairy producers have built — and how fast.
CattleFax estimates beef-on-dairy calf production jumped from roughly 50,000 head in 2014 to 3.22 million in 2024. The American Farm Bureau puts national adoption at 72% of U.S. dairy farms now using beef genetics on at least part of the herd. And NAAB data confirms that of the 9.4 million units of beef semen sold domestically in 2023, 7.9 million went into dairy herds — making beef-on-dairy the second-largest category of semen used in dairy cattle behind gender-selected dairy semen. That 7.9 million figure held steady through 2024, when total domestic beef semen sales rose to 9.7 million units.
The economics driving that growth are obvious. Beef-cross calves have commanded prices as high as $1,400 day-old, compared to roughly $200 for conventional Holstein bull calves. At that kind of spread, the premium still justifies the program for most operations. But only if you’re actively managing marketing channel risk—not assuming it away.
The Eberts illustrate how that commitment plays out at the farm scale. Jordan told Dairy Star the family has been breeding beef “for over 10 years,” and Brownfield reported their beef-on-dairy efforts began roughly fourteen years ago. In 2013, they decided to start raising their own beef cattle rather than selling calves. “We make more beef calves now than dairy calves,” Jordan said. With only the top 20% of the herd designated for dairy semen, the remaining roughly 80% goes to beef bulls. Farm Progress profiled them at 2,200 beef crosses in 2021; Dairy Star reported 2,500 post-wean-to-finish in January 2024, while a Visit Algoma listing from the same year put it at approximately 2,000. They market through Equity Livestock and have even added their own harvest facility and the Ebert Grown retail brand.
That kind of commitment — breeding protocols restructured, a butcher shop and restaurant built to capture more of the value chain — doesn’t reverse easily. Which makes the question of where those calves ultimately end up a lot more than academic.
Three Pressure Points Between Your Beef-on-Dairy Calf and Its Buyer
The infrastructure challenge hits differently depending on your scale. A 200-cow dairy selling 80 beef-cross calves a year through a single local auction is more exposed to any one of these shifts than a 4,000-cow operation with multiple marketing channels. Scale doesn’t eliminate risk, but it changes where the risk concentrates.
Here’s a quick-glance look at the three facility moves shaping the landscape right now:
Facility
Location
Daily Capacity
Impact on Your Calves
Cargill Milwaukee
Milwaukee, WI
Ground beef only (ZERO live cattle since 2014)
NONE – Never bought your calves
Tyson Lexington
Lexington, NE
5,000 head/day
CRITICAL – 5% of U.S. capacity GONE
Tyson Amarillo
Amarillo, TX
Cut to single shift
HIGH – 1,761 jobs eliminated
AFG America’s Heartland
Wright City, MO
2,400 head/day (NEW)
POSITIVE – Built for dairy-beef crosses
Packing capacity is tightening. USDA’s February 10, 2026 WASDE report projects 2026 beef production at 25.987 billion pounds — about 0.3% below 2025 levels. That continues a multi-year contraction as the beef cow herd sits at historic lows. The agency has revised its 2026 forecast upward in each of the last two monthly reports, largely due to heavier carcass weights. But the direction is still down year-over-year, and when packers bleed money, they close plants. Tyson’s restructuring is Exhibit A.
Geography is getting harder. A University of Wisconsin Extension survey of 40 dairy farms using beef-cross genetics found the average herd produced 454 beef-cross calves per year, with the largest operations topping 6,200 annually. These calves move through auction barns, calf ranches, and regional dealer networks that all depend on nearby infrastructure staying intact. When a plant closes in central Nebraska, feedlot operators in that region ship finished cattle farther, and that cost works its way backward.
Marketing costs are rising on their own. Wisconsin’s DATCP proposed increasing auction barn licensing fees from $420 to $7,430 — a 1,669% jump — and livestock trucker registration fees from $60 to $370. Jason Mugnaini of the Wisconsin Farm Bureau called it “a substantial burden on markets, dealers, and truckers that will unavoidably be passed down to farmers.” Public outcry forced DATCP to scale the proposal back to a more modest inflationary adjustment, but the revised fees still leave an annual funding gap exceeding $680,000.
Not All Contraction: New Capacity With Wisconsin Roots
One major development is working in the other direction.
American Foods Group, headquartered in Green Bay, Wisconsin, opened its $800 million America’s Heartland Packing plant in Wright City, Missouri, in April 2025. The facility spans 775,000 square feet, has the capacity to harvest 2,400 head per day, and is projected to employ 1,300 workers at full capacity.
AFG president Steve Van Lannen told Brownfield before the plant opened that dairy-origin cattle were central to the business model: “A big part of our model is the dairy industry. There will be opportunities for cattlemen to feed those beef-dairy crosses.”
That’s meaningful — a Wisconsin-headquartered company building specifically to handle mixed cattle, including dairy-beef crosses. But the plant is in Missouri, not the Upper Midwest. For Wisconsin producers, the transportation math still matters.
The Bottom Line
The Cargill Milwaukee headline is a useful false alarm. It exposes a question most of us haven’t asked directly: Do you actually know the path your beef-cross calves travel from your farm to a packer’s kill floor?
But it should also sharpen a harder question about your sire stack. Because, as the Tyson closure proves, when capacity is tight, packers get picky. They aren’t just buying “beef-on-dairy” — they’re buying predictable rail performance.
Map your supply chain this month. Ask your calf buyer which feedlot your calves reach, and which packer that feedlot uses. If they can’t or won’t tell you, that gap in visibility is itself a risk.
Count your marketing channels. If more than two-thirds of your beef-cross calves go through a single auction barn or buyer, you’re overexposed. Smaller herds may find diversifying harder — which is exactly why it matters more, not less.
Move past the three C’s. The UW Extension survey found most Wisconsin producers still pick beef sires primarily for conception rate, calving ease, and semen cost. Those matter. But when fewer plants are competing for your calves’ finished product, carcass uniformity becomes the trait that separates you from the skip list.Feedlots forecast finish dates and schedule packer appointments for entire pens — inconsistent growth rates within a pen mean some animals hit the target and others miss, creating discounts for the whole group. Andrew Sandeen of Penn State Extension, relaying feedback from JBS beef plant buyers, described the challenge head-on: “Everything from the quality to the shape and size — it’s all over the board.” JBS had built strategies around the consistency of straight Holstein beef. As beef-on-dairy volume grows, that variability is becoming a real friction point for packers.
Select for what the packer actually measures. Ribeye area and shape, marbling, yield grade, and moderate frame — those are the traits that earn premiums at the rail. A 2024 Penn State study led by Basiel et al. evaluated 262 beef × Holstein steers across seven sire breeds over three years and found that, on average, all sire breed groups graded USDA Choice with yield grades of two or three. But within that average, sire selection drove meaningful variation: Angus-sired steers gained 1.76 kg/day versus just 1.39 kg/day for Wagyu-sired steers (P < 0.01), and marbling scores ranged from 4.14 (Limousin-sired) to 5.03 (Red Angus-sired). The Eberts use Angus and Simmental-Angus crosses through AI — breeds that showed strong feedlot ADG in that same research. That’s not a coincidence. It’s a marketing strategy disguised as a breeding decision.
Don’t confuse processing with packing. Cargill Milwaukee makes ground beef for grocery stores. It doesn’t buy cattle. Before you react to any plant closure headline, check whether the facility handles live animals or boxed beef. The difference determines whether the story applies to your farm.
Know your nearest packing plants — and what happened to them in the last 12 months. Tyson Lexington is gone. AFG Missouri is new. Cargill stated in November 2025 that it doesn’t intend to close any of its eight primary beef processing facilities and is investing in them. That landscape shifts. Stay current. Watch USDA’s next Cattle report and any signals on AFG Missouri’s actual throughput mix — both will indicate where beef-on-dairy infrastructure is heading through the rest of 2026.
The Eberts learned something interesting when they added on-farm meat processing through their Ebert Grown brand. Making their own sausage products, Randy told Brownfield, actually cost more than buying from a supplier. “We can still buy that product cheaper from a supplier than what we can efficiently do it,” he said. “That’s where we thought we could vertically integrate and have an advantage, and it’s actually, it isn’t that way.”
It’s a quietly important detail. The beef-on-dairy math works — the Ebert family has spent over a decade building a program with 2,000-plus head to prove it. But every link in that chain has its own economics, and assumptions about what you control versus what the system controls get tested eventually. Knowing the difference between a ground beef plant and a packing plant isn’t trivia. And neither is knowing the difference between a sire that gets your cow pregnant and one that gets your calf paid. As capacity tightens, the calves with predictable carcass performance are increasingly the ones that find homes first — and that reality should be part of every sire selection conversation you have this spring.
Key Takeaways
The Cargill Milwaukee plant that’s closing is a ground beef facility that hasn’t slaughtered cattle since 2014, so it never bought your calves and doesn’t change your day‑to‑day beef‑on‑dairy marketing.
Tyson’s 5,000‑head‑a‑day Lexington shutdown — plus cuts at Amarillo — is the real pressure point, tightening kill‑floor access beef‑on‑dairy volume has jumped to about 3.22 million calves and 7.9 million beef semen units in dairy herds.
Ebert Enterprises’ 4,200‑cow Wisconsin herd shows one workable path: know exactly where your calves go, avoid being tied to a single buyer, and use Angus and Simmental‑Angus sires with documented feedlot and carcass performance, not just the cheapest semen.
Penn State data backs that approach, finding that all beef × Holstein groups average Choice, but some sire breeds deliver significantly better gain and marbling — the kind of consistency packers remember when hooks are tight.
If you’re serious about beef‑on‑dairy, packer capacity and carcass predictability now belong in the same conversation as conception rate and calving ease every time you build your breeding list.
Complete references and supporting documentation are available upon request by contacting the editorial team at editor@thebullvine.com.
Learn More
Beef-on-Dairy’s $6,215 Secret: Why 72% of Herds Are Playing It Wrong – Stop leaving money on the table by chasing the wrong premiums. This breakdown arms you with a specific ROI framework to pivot from “just selling calves” to capturing the full margin your genetics deserve.
Processor Power Play: Is Your Milk Check Getting Squeezed? – Packer consolidation isn’t just a beef problem—it’s a dairy blueprint. This analysis exposes the structural shifts in regional processing, giving you the foresight to position your operation before the next major plant closure.
$3,010 Per Heifer. 800,000 Short. Your Beef-on-Dairy Bill Is Due. – The beef-on-dairy craze has a massive blind spot: your own replacement pipeline. Discover how maverick herds are using precision data to balance beef premiums without nuking their future dairy herd’s genetic progress.
The Sunday Read Dairy Professionals Don’t Skip.
Every week, thousands of producers, breeders, and industry insiders open Bullvine Weekly for genetics insights, market shifts, and profit strategies they won’t find anywhere else. One email. Five minutes. Smarter decisions all week.
$225K from beef‑on‑dairy, $6M digesters in the red, and 10-year permits on offer. This isn’t theory — it’s where herds are actually moving.
Executive Summary: South Dakota has become dairy’s new magnet, adding 25,000 cows in a year to hit 240,000 head by January 2026, while California Dairies Inc. shut a 99‑year‑old plant in Los Banos. The piece shows how that kind of dairy farm relocation is being driven by 10‑year CAFO permits, nine‑figure cheese investments, and genetics built for component pricing on the I‑29 corridor — and by rising water, labor, and methane‑rule friction in the West. It puts real faces on the shift: David Lemstra leaving California after 40 years to build Dakota Line Dairy in South Dakota, and California producers like Jared Fernandes and Simon Vander Woude staying put but flipping genetics, forage use, and beef‑on‑dairy strategy to make the math work. On the income side, beef‑on‑dairy crosses that bring $80–90 a head over Holsteins can add about $225,000 a year to a 2,000‑cow herd; on the cost side, $6‑million digesters and LCFS credits falling from $200 to ~$60/ton have turned many “green” projects into long‑shot paybacks. From there, it lays out three concrete paths — relocate, stay and adapt, or cash out — backed by specific rules of thumb like a $0.75/cwt 3‑year basis trigger, a 7–10‑year relocation payback window, and a 20% 21‑day pregnancy rate threshold for sexed‑on‑top/beef‑on‑bottom programs. The takeaway for 2026 is blunt: sitting in the middle — too big for niche, too small for true scale, stuck in a high‑friction state — is a choice, and probably the riskiest one on the table.
In January 2026, a load of Holstein springers from a top-tier herd — impeccable records, sexed-semen confirmation, premier genetics — sold for $3,300 a head. Two loads of heifers from custom raisers, with no birthdates, no records, and bred to natural-service Black Angus bulls, cleared $3,400. Jake Bettencourt of TLAY Dairy Video Sales, who witnessed the sale, put it plainly: “The main trend currently is, ‘What calf is a springer carrying?'”
That $100 gap is a small number with a big message. This dairy migration — the relocation of dairy farms at an industrial scale — isn’t just about geography. It’s about which regions built systems where every piece of the profit equation works together, and which ones quietly stacked friction until producers started loading trucks.
88,000 Cows in Five Years — and 25,000 More Right Behind Them
The I-29 and I-90 corridors running through South Dakota, Minnesota, Iowa, and Nebraska have become the primary growth engine for U.S. milk production. The reason isn’t abstract. It’s stainless steel.
Three processor expansions tell the story. Agropur invested $252 million to nearly triple capacity at its Lake Norden, South Dakota, plant, going from 3.3 million to 9.3 million pounds of milk per day. Valley Queen Cheese in Milbank broke ground on what was originally announced in 2022 as a $195 million expansion, its largest in 93 years. That project came in at $230 million and by late 2025 was handling 8 million pounds of milk daily. Bel Brands launched its Brookings facility, adding still more demand.
The cows came — fast. South Dakota’s milk cow population reached 215,000 as of January 1, 2025 — more than doubling in a decade, a gain of 117% that leads the nation. Some 88,000 of those cows arrived in just five years, a 69% jump. Then it kept going. USDA NASS confirms the state’s dairy herd reached 240,000 head as of January 1, 2026 — exactly the 25,000 additional cows Valley Queen’s Evan Grong had projected. South Dakota’s December 2025 milk production ran more than 11% above the prior year, the biggest increase among the 24 major dairy states — in a national herd of 9.57 million, South Dakota punched well above its weight.
Tom Peterson, executive director of South Dakota Dairy Producers, describes a deliberate effort: “About 20 years ago, South Dakota leaders and stakeholders came together with farmers and milk processors to develop a plan to not only ensure dairy industry survival in the state, but with aspirations of creating a dairy destination”. GOED Commissioner Chris Schilken estimated in early 2024 that the economic impact of 118,000 additional cows was “nearly $4 billion annually”. With 25,000 more since then, that number has only climbed.
A Genetics Gap Is Emerging
Here’s a dimension of this migration that gets overlooked: the cows moving east aren’t just changing zip codes. They’re changing what gets selected for.
The Upper Midwest model is built around cheese vats. Valley Queen, Agropur, Bel Brands: component-driven processors. That means the genetics flowing into the I-29 corridor increasingly prioritize high-butterfat, high-component cattle that fit Cheese Merit profiles — and component pricing rewards them for it. The April 2025 Net Merit revision tells the same story nationally: CDCB bumped butterfat emphasis to 31.8% (up from 28.6%) while dropping protein from 19.6% to 13.0%, and pushed Feed Saved to 17.8%. Holstein butterfat hit a national average of 4.23% in 2024, per CoBank’s Corey Geiger. Under the revised NM$ weightings, a cow with top-decile butterfat and Feed Saved genetics delivers meaningfully more lifetime profit than a volume-only counterpart — the exact dollar advantage varies by herd and market, but the directional shift is unmistakable.
For I‑29 shippers, CM$ often beats NM$ as your main index, because plants like Valley Queen and Agropur pay you on components, not volume.
The Western model may need a different genetic profile entirely. Jared Fernandes at Legacy Ranches in Tulare County made that call: he switched from Holsteins to Jerseys, cutting forage consumption by 30% and reducing water use on a 4,500-cow operation facing tight water supplies. In Merced County, Simon Vander Woude took a different approach: genomic testing since 2012, beef-on-dairy crosses on 60% of calvings, cull rate around 30%, and average lactations pushed to 2.7 — up from 2.2 when he started. “We are creating more milk with fewer cows, more components in the milk with fewer cows,” Vander Woude said. “That’s fewer mouths eating, fewer heifers”.
Dairy Migration: Two Systems, Two Sets of Friction
California’s December 2024 milk production fell 6.8% year over year — the state’s steepest monthly drop in roughly 20 years, heavily amplified by HPAI, which hit 747 of approximately 950 dairy farms. California recovered by mid-2025 — production up 2.7% in June versus 2024 —, but the episode exposed structural vulnerabilities that predate the outbreak. Idaho’s Rick Naerebout reported the cost of production “above $18.50 per hundredweight and still around $20 for many.” Oregon’s John Van Dam: “staying above water but not going anywhere”.
Upper Midwest (I-29 Corridor)
Western U.S. (CA, ID, OR, WA)
CAFO Permits
10-year state permits (SD DANR)
5-year federal NPDES cycle; annual state layers
Processing
$700M+ invested 2019–2025; coordinated with cow growth
CDI closed Artesia (2020) and Los Banos (Oct. 2024) — two plants in four years
Water
Abundant groundwater; no pumping restrictions
SGMA projected to fallow 388,000 acres, cut dairy output $2.2B by 2040
Methane Rules
Minimal state mandates
$300–$675M/year in projected losses under direct regulation
Digester Economics
N/A (not required)
$6M+ per unit; LCFS credits crashed from $200 to ~$60/MT (2021–2024)
Labor
Standard ag labor rules
CA/WA: highest minimum wages + ag overtime mandates
Legislative
Pro-dairy incentive programs (GOED)
25 anti-dairy bills killed cumulatively through 2023
Genetics
Component-driven (CM$); fits cheese processing
Under pressure to shift — Fernandes (Jersey pivot) and Vander Woude (genomic efficiency) lead
The LCFS column deserves a closer look. Digester construction averages over $6 million per unit. Those investments were supposed to pencil on strong carbon credit revenue. Instead, the green dream turned into a red-ink reality for many Western digesters. UC Berkeley professor Aaron Smith found dairy digester developers need approximately 10 years to achieve ROI on avoided methane credits — and that’s if credit values hold, which they haven’t. Anja Raudabaugh, CEO of Western United Dairies, noted that producers face “years of delay for approval and additional years of waiting for the actual money to show up”.
ERA Economics’ February 2023 analysis projects a 130,000-head reduction in California’s herd by 2040 under SGMA. A separate ERA report from September 2024 estimates 20–25% of small dairies could exit under direct methane regulation. These aren’t one-time hits. They compound annually — and they fall hardest on mid-sized commodity operations too large for niche premiums and too small to absorb six- and seven-figure regulatory overhead.
The Beef-on-Dairy Premium: A Profit Engine That Follows the Truck
The $100 springer gap Bettencourt described is the visible edge of a much larger shift. Kansas State University researchers, analyzing 14,075 feeder steer lots through Superior Livestock (2020–2021), found beef-on-dairy crosses at 550–600 pounds bringing roughly $80–90 per head more than straight Holstein steers. UF dairy economist Albert De Vries found that when 21-day pregnancy rates exceed 20%, a sexed-on-top, beef-on-bottom strategy maximizes calf income while still generating enough replacements. Below that threshold, you may not be making enough heifers to sustain the replacement pipeline.
Scale it: a 2,000-cow herd producing roughly 1,500 beef-cross calves annually at a conservative $150/head advantageworks out to $225,000 per year in extra calf revenue. That premium is location-sensitive — regions with established feedlots and packers set up for beef-on-dairy pay more consistently. The I-29 corridor has that infrastructure. And with the U.S. beef cattle inventory at a 75-year low of 86.2 million head as of January 2026, those premiums have structural support. But cattle cycles turn.
Three Paths Forward — and What Each One Costs
Path A: Move the cows to fit the system. David Lemstra did exactly this. After more than 40 years in central California, he spent nearly a decade researching alternatives before building Dakota Line Dairy in Humboldt, South Dakota. Today, the Lemstras milk 4,000 cows and ship to Agropur’s Lake Norden plant. Feed, permits, and processing” drove the move. He described leaving California as “death by 1,000 cuts”. Compare your 10-year “stay” cost to building in a growth corridor after selling your current assets. If the payback falls within 7–10 years, it pencils out. The risk: capital-intensive, and the best processor relationships won’t wait.
Path B: Change the model to fit the ground. Fernandes built a digester, went deep on regenerative ag, and made the genetic pivot to Jerseys. “We do a lot of things that you don’t hear about, that I think are sustainable,” he said at the 2025 California Dairy Sustainability Summit. Vander Woude kept Holsteins but used genomics to push average lactations from 2.2 to 2.7 while running 60% beef-on-dairy — more milk and more valuable calves from fewer animals. ERA Economics notes that digester revenue-share agreements typically provide $50–100 per cow per year, which is meaningful if volatile. The risk: heavy capital and regulatory tolerance required; niching down means brand-premium volatility.
Path C: Monetize the asset base. For operations where neither moving nor reinventing pencils, the honest option may be selling while assets still command value. ERA projects 388,000 acres could be fallowed in the San Joaquin Valley under SGMA. Selling from strength is a different negotiation than selling from distress.
Path
A: Relocate to Growth Corridor
B: Reinvent In Place
C: Monetize & Exit
Description
Move cows to I-29 corridor; build on 10-yr permits, processor contracts
Digester + genetics pivot (Jersey/genomic efficiency) + regen ag
Sell assets while value remains; avoid distressed sale
7–10 years (basis advantage + calf premium + water/compliance savings)
10+ years (digester ROI alone ~10 yrs; genetics 3–5 yrs to see full shift)
Immediate liquidity; capital preservation
Key Risks
Capital-intensive; best processor relationships won’t wait; market timing
Heavy regulatory tolerance required; LCFS/SGMA volatility; brand-premium niche risk
Timing matters—asset values eroding as Western processing consolidates
Best Fit For…
2,000+ cow herds with equity, rolling 3-yr basis drag >$0.75/cwt, appetite for scale
Established Western herds with strong brand access, regen ag commitment, high reproductive efficiency
Mid-size commodity herds: too big for niche, too small for scale, stuck in high-friction state
Your 90-Day Decision Checklist
Run your 10-year “stay” scenario. Pull your rolling 3-year basis versus the best alternative region. Add actual water and compliance cost trends. If the cumulative drag exceeds $400,000–$500,000 per year, relocation deserves a serious model.
Test your basis trigger. A rolling 3-year disadvantage exceeding $0.75/cwt means $225,000 annually on a 2,000-cow herd shipping 300,000 cwt/year. Before water, compliance, or calf value.
Audit your genetic alignment. Are you selecting for CM$ or NM$ to match your actual processor contract? The April 2025 NM$ revision puts butterfat at 31.8% — if you’re shipping into a fluid market, that may not be your index.
Check your 21-day pregnancy rate against the De Vries threshold. Below 20%, a sexed-on-top/beef-on-bottom program may not generate enough replacement heifers.
Scout destination regions before you need them. Lemstra spent nearly a decade researching before he moved. The best sites and processor relationships go to producers who are already known.
Don’t assume your current asset values are permanent. CDI closed two California plants in four years — Artesia in 2020 and Los Banos in October 2024. If processors are consolidating around you, your land’s dairy-use premium may already be eroding.
Key Takeaways
South Dakota’s dairy herd hit 240,000 cows as of January 1, 2026, adding 25,000 head in a single year — exactly matching Grong’s projection, built on 10-year CAFO permits, reinvestment incentives, and nine-figure processor expansions.
The $100 springer premium for beef-cross calves signals that calf revenue belongs in the same strategic column as milk price, basis, and water cost. Beef herd at a 75-year low supports that premium — but cattle cycles turn.
A genetics gap is emerging between component-driven Midwest herds (butterfat now 31.8% of NM$) and Western herds pivoting toward longevity and efficiency. Fernandes’s Jersey switch and Vander Woude’s genomic program show what that pivot looks like.
Western producers face compounding threats: $2.2 billion in projected SGMA losses by 2040; $300–$675 million per year in methane regulation; LCFS credits crashing from $200 to $60; and CDI closing two plants in four years.
Watch in 2026–2027: SGMA implementation deadlines, Midwest processor capacity utilization, and beef-cycle signals that could compress cross-calf premiums.
The Bottom Line
The middle ground — too big for niche, too small for scale, stuck in a high-friction state with genetics optimized for a pricing structure that’s shifting underneath you — is the most dangerous place to be in 2026. The producers hauling cattle east on I-90 have run the numbers long enough to know it. The ones staying, like Fernandes and Vander Woude, are reinventing their operations from the genetics up. Both are making active choices with their eyes open. The only losing move is standing still and hoping the spreadsheet doesn’t notice.
Complete references and supporting documentation are available upon request by contacting the editorial team at editor@thebullvine.com.
Learn More
The 90-Day Dairy Pivot: Converting Beef Windfalls into Next Year’s Survival – Arms you with a tactical 90-day blueprint to convert temporary $1,000 beef-on-dairy windfalls into long-term resilience. Reveals how top-tier herds are stacking $266/cow in extra revenue to survive flat milk checks and rising fixed costs.
211,000 More Dairy Cows. Bleeding Margins. The 2026 Math That Won’t Wait. – Exposes the structural reset of 2026, where a 20-year heifer low meets $11 billion in new processing capacity. Breaks down the $19.80 “real” break-even math to help you position your operation for the upcoming margin squeeze.
Every week, thousands of producers, breeders, and industry insiders open Bullvine Weekly for genetics insights, market shifts, and profit strategies they won’t find anywhere else. One email. Five minutes. Smarter decisions all week.
Super Bowl LX will burn $8M a spot. Your sire picks can swing $869 per cow. Still letting someone else call the breeding plays?
Executive Summary: Top‑quartile genetics are already worth $869 more lifetime profit per cow, according to a nine‑year Zoetis study on 12,952 Holsteins across 11 US dairies. This article shows how that gap has widened with the 2025 NM$ revision, where a higher weight on Feed Saved and longevity – and a 11% hit on cow size – quietly killed the idea that a show‑ring cow is also the most profitable commercial cow. Framed against Super Bowl LX’s $8 million ad slots, it argues your sire choices deserve the same level of strategy, because they move far more money across a 200‑cow herd than any 30‑second commercial. You’ll get a concrete “game plan”: a four‑slot sire roster with named December 2025 bulls, a one‑page scorecard to run every bull through, and a simple starting plan for genomic testing on your next 20 heifers. Stories from Simon Vander Woude in California, the Baileys at Moorhouse Hall Farm in the UK, and DataGene focus farms in Australia show what happens when producers stop delegating sire selection and let the numbers challenge old habits. The core message is direct: over the next five years, genetics is shifting from “nice‑to‑optimize” to a structural survival factor for any dairy paid on components.
A nine-year Zoetis study tracking 12,952 Holsteins across 11 US dairies found that cows in the top 25% of genetic profitability generated $869 more in lifetime profit than cows in the bottom 25% (Zoetis, August 2022, ranked by Dairy Wellness Profit Index). On a 200-cow herd, that gap adds up to $173,800 per cow generation. On a 100-cow herd, $86,900. That’s not a model. It’s observed data from real operations over nearly a decade.
Tonight, brands paying $8 million for 30 seconds of Super Bowl LX airtime at Levi’s Stadium have stress-tested their campaigns for months — audience-segmented, ROI-modeled, every frame data-validated. Meanwhile, a 2010 reader survey found that 46% of producers simply use whatever mating program their A.I. company provides, and only 11% match sire traits to individual cow weaknesses. That survey is 16 years old now — and given the complexity genomics has added, the delegation rate may well be higher today.
Your sire selection deserves the same analytical rigor that advertisers bring to a 30-second spot.
The Widening Genetic Gap
Genomic selection has fundamentally accelerated genetic progress in US Holsteins. Before genomics took hold, from 2005 through 2009, the average Net Merit gain for marketed Holstein bulls was roughly $40 per year. Since 2011, that rate has more than doubled. Wiggans and Carrillo documented the acceleration in a 2022 review published in Frontiers in Genetics. CDCB’s own genomic impact data tells a similar story — $40.33 per year from 2005–2010, jumping to $79.20 per year from 2016–2020. The distance between elite and middle-of-the-pack genetics grows larger with each proof round, and if you’re not actively capturing that progress, you fall further behind every cycle.
The December 2025 US Holstein genetic evaluations made the concentration at the top impossible to ignore. Genosource now holds 22 of the top 30 NM$ positions — 73% of the industry’s elite profitability bracket. The number-one bull, GENOSOURCE RETROSPECT-ET, sits at +1,296 NM$. The NM$ true transmitting ability standard deviation is $228 (VanRaden et al., NM$, January 2025), which means a single standard deviation of difference between your sire battery and the industry average shows up as real dollars at the bulk tank. Every month. For years.
Mid-size operations — 100 to 500 cows — feel this most acutely. You’re large enough that genetic differences compound into serious money, but you probably don’t have a dedicated genetics manager parsing proof sheets three times a year.
What Producers Discovered When They Stopped Delegating
Alta Genetics has built its entire product philosophy around what they call the 4-EVENT COW — a cow whose card reads FRESH, BRED, PREGNANT, DRY, and nothing else. No treatments, no repros, no vet calls between those four entries. Their Alta CONCEPT PLUS sire fertility evaluation, built on real pregnancy check data from progressive dairies across North America since 2001, identifies bulls that create more pregnancies faster — CONCEPT PLUS DxD sires deliver a 2–5% conception rate advantage over the average conventional sire on cows, and CONCEPT PLUS 511 sires add 3–7% when using sexed semen on heifers (Alta Genetics, 2025). A mating program adjusts the consistency of type traits within your herd. Sire selection determines the genetic level of the herd itself. Delegate the selection, and no mating optimization closes the gap.
The Zoetis study made this concrete. The difference between top-quartile and bottom-quartile genetics wasn’t just dollars — it was 35% more milk, 44% fewer antibiotic treatments over their lifetimes, 5% less feed for maintenance, and an estimated 10% less enteric methane. And that gap held regardless of management quality across all 11 herds studied. That’s why the conversation has shifted from “genetics is about production” to “genetics is about total cost structure.”
Simon Vander Woude’s operation illustrates how the shift actually happens on a working farm. Vander Woude owns and operates three dairies totaling 6,000 cows near Merced, California, and has run over 10,000 genomic tests with Zoetis CLARIFIDE Plus. His team started genomic testing simply to identify bottom-end heifers to sell off and get heifer inventory in line with cow numbers. But the test results revealed something uncomfortable: they’d been chasing Daughter Pregnancy Rate as a standalone trait without evaluating how it connected to the rest of the animal. “We focused on DPR pretty heavily and kind of forgot about milk for a while,” Vander Woude shared in 2022. “We’ve stubbed our toes plenty along this path.” That honest reassessment reshaped their entire program. Today, they run IVF on top genomic females — 40 to 60 embryo calves born per month — sexed Holstein semen on the next tier, and Angus on everything else. A tiered system that didn’t exist before they let the data challenge their assumptions.
The Bailey family at Moorhouse Hall Farm in Cumbria, England, had a different trigger entirely. John, Kate, and their son Chris — a full-time vet — started genomic testing their heifers after hearing Nuffield Scholar Neil Easter describe how he’d built a herd with youngstock in the top 1% for Profitable Lifetime Index. As they tested, AHDB’s broader UK analysis revealed a startling finding: around 17% of calves had their recorded sires updated when genotypes were analysed — 7% because the wrong sire was recorded, another 10% because no sire was recorded at all (AHDB, 2024). The Baileys now genomic test every heifer, breed their top-performing animals to dairy sires and the bottom 10–20% to beef, and sit just shy of the top 1% nationally for £PLI in their youngstock. “We used to always find an excuse for why a certain cow should be bred,” John Bailey told AHDB. “But now with genomics, the data gives us much more confidence in identifying the bottom performers.”
The 2025 NM$ Revision: Why USDA Rewrote the Formula
Here’s where a lot of conventional wisdom about cow size and type starts to break down.
When USDA researchers ran genomic regressions on actual feed intake data from over 8,500 lactations of more than 6,600 dairy cows in US and Canadian research herds, the number that came back caught everyone off guard: real maintenance costs were 5.5 pounds of dry matter intake 1,000 per pound of body weight per lactation. That’s roughly twice the previously used phenotypic regression estimates. Every producer who’d been selecting for bigger, taller cows had been unknowingly selecting for higher maintenance costs than anyone calculated.
So USDA rebuilt the formula. Here’s what changed (VanRaden et al., NM$, January 2025):
Feed Saved now commands 17.8% combined emphasis — 11% from body weight composite and 6.8% from residual feed intake. Productive Life carries 13% emphasis at $30 per month, and when you add Cow Livability’s 5.9%, the durability complex totals 18.9% — making longevity the largest non-yield trait group in the index. The lifetime economic values driving NM$ are $5.01 per pound of fat PTA and $3.32 per pound of protein PTA, calculated across 2.70 average lifetime lactation equivalents for Holsteins.
And the traditional type-trait weightings? They dropped hard enough to change the conversation:
Trait Category
NM$ Emphasis
Direction
What Changed
Why It Matters for Your Herd
Feed Saved
+17.8%
↑
Real maintenance costs were 2× previous estimates; emphasis jumped from ~9% to 17.8%
Bigger cows now cost you more than the old formula calculated—select for efficiency, not size
Productive Life + Cow Livability
+18.9%
↑
PL at 13% ($30/month), Livability 5.9%—longevity is now the largest non-yield trait group
Cows that last five lactations beat cows that peak high and break down by lactation three
Udder Composite
1.3%
↓
Dropped from ~5%; two decades of selection finished the job
Further emphasis yields diminishing returns on work already done—udders are largely fixed
Feet & Legs Composite
0.4%
↓
Classifier scores correlated poorly with actual lameness and hoof health
Direct health traits predict lameness better than visual scores ever did
Body Weight Composite
−11.0%
↓↓
Active penalty—NM$ now selects against excess cow size
Every extra pound of body weight costs you 5.5 lbs DMI per lactation; the show-ring cow is now a commercial liability
The math is hard to argue with: NM$ has driven a permanent wedge between the show ring cow and the commercially profitable cow. For two decades, the industry could pretend the gap wasn’t that wide. With Udder Composite at 1.3%, Feet and Legs at 0.4%, and body weight penalized at −11%, that pretense is over. You can still breed show cattle. You can still win banners. But the economics now say, clearly and quantifiably, that the traits rewarded in the ring and the traits rewarded at the bulk tank have parted ways.
The type-to-health connection runs deeper than index weightings. Dechow et al. (2003, Journal of Dairy Science) documented a −0.73 genetic correlation between Body Condition Score and Dairy Form in first-lactation Holsteins — meaning cows that score high for angular dairy character are genetically predisposed to thin body condition at calving. That predisposition elevates ketosis risk.
The traits that actually drive longevity are functional: rear udder height, teat placement, and udder depth. Not the visual sharpness that wins ribbons.
One caveat worth stating plainly: if you market breeding stock, embryos, or show cattle, you may rationally weight type traits higher than a commercial herd optimizing for tank revenue. The NM$ recalibration reflects commercial profitability priorities. Seedstock economics are different — that’s a legitimate strategic choice, not a mistake. But don’t confuse the two. And don’t let anyone tell you that a cow that scores EX-95 is automatically more profitable than a VG-86 daughter who freshens easy, breeds back fast, and milks hard for five lactations. The numbers no longer support that story.
Your Game Plan: Three Strategies Producers Are Using Right Now
Build a Complementary Sire Roster — Not a Ranked List
Think of it like building a Super Bowl roster. You don’t field a team of four quarterbacks. You need depth at every position, and each player fills a specific role. Same with your sire lineup.
The instinct is to line up your top four NM$ bulls and start breeding. But a ranked list isn’t a roster. Four bulls who share the same weaknesses leave your herd exposed in exactly the same spots.
A complementary depth chart assigns each sire a defined role:
Adebayo-P is a functional specialist, not a production leader (56M, 54F, 33P per Holstein Association August 2025 TPI list)—that’s precisely why he fills a role your franchise and component bulls can’t. All rankings may shift at the April 2026 proof run.
Verrier et al. (1993, Journal of Dairy Science) showed that factorial mating designs — where dams see several different sires — produced significantly lower inbreeding rates relative to genetic gain than single-sire approaches. And the December 2025 rankings saw considerable reshuffling, including BEYOND SHPSTR GOLLEY-ET vaulting to #2 GTPI at 3,605. A diversified roster absorbs that kind of volatility. A single-sire strategy doesn’t.
Where this can fall short: It takes more time and familiarity with trait profiles than picking one bull. If reading sire summaries feels overwhelming, you can capture roughly 80% of the benefit by setting an NM$ floor and using three bulls from different sire lines — even without position-specific assignments. For more on building genetic selection resources, start with the evaluation archives.
Genomic young sires carry reliability of roughly 70–75%, compared to 95%+ for daughter-proven bulls. Using three or four sires instead of one hedges that reliability gap — another reason the roster approach outperforms going all-in.
Your Halftime Adjustments: The One-Page Sire Scorecard
Every team makes adjustments at the half based on what the first two quarters showed them. Your sire scorecard works the same way — it forces you to look at what your herd actually needs before your next breeding play.
Before you open a catalog or take a call from your rep, answer these questions and write down actual numbers:
What are your current fat and protein pounds per cow? Pull your last three DHIA milk recording reports.
What are your top three cull reasons over the past 12 months? Most DHI software generates this in minutes.
What’s your NM$ floor? With December 2025 bulls clearing $1,200+, there’s little reason to go below $900 on any roster sire.
What’s your maximum Expected Future Inbreeding? Most geneticists suggest keeping genomic inbreeding below 7–8%.
What functional traits does your facility specifically demand? Robotic milking needs teat placement and milking speed. Grazing operations weight feet-and-legs and body weight differently than freestalls.
Tape that sheet to the wall. Next time anyone recommends a bull — your rep, a catalog, a neighbor — run him through the scorecard first.
This doesn’t replace your A.I. rep. It redirects the relationship. You direct the strategy. They source bulls that fit your framework. That’s a fundamentally different conversation than “send me what you think is good.”
One index note: If your plant pays a cheese yield premium, consider weighting CM$ alongside NM$. Under CM$, protein carries $4.73/lb emphasis versus $3.32 in NM$ (VanRaden et al., NM$, 2025). If you’re on a Class I fluid contract, FM$ may be your better primary index. Know your market before you choose your yardstick.
Genomic Test Your Next 20 Replacement Heifers
You don’t have to test every animal tomorrow. Start with the next group approaching breeding age. UK data from the AHDB showed that herds genotyping 75–100% of their heifers had an average Profitable Lifetime Index of £430 per animal in their 2023 calf crop, compared to £237 for herds testing 0–25% of heifers. That £193 gap translates to roughly £19,300 in theoretical profit potential for a typical 175-head herd — but AHDB’s analysis of actual farm business accounts revealed the real advantage at that genetic difference to be over £50,000. Those aren’t projections. They’re margins from real accounts.
Genomic Testing Rate
Avg £PLI Per Animal
Theoretical Profit Potential (175-head herd)
Actual Profit Advantage (Farm Accounts)
0–25% Testing
£237
Baseline
Baseline
75–100% Testing
£430
+£19,300
+£50,000+
The Gap
+£193 per animal
—
Real margins from UK farm business accounts, not projections
Dave Erf, dairy technical services geneticist with Zoetis, offers three ground rules for getting started: have a plan for how you’ll use the results before you test, lay out a herd roadmap of where you’re strong and where you need to improve, and test all your heifers — not just the ones you think are best. “If you just test your best ones, you can’t make a culling decision, because you don’t know,” Erf shared.
The trade-off is real, though. Testing creates a two-tier system — dairy sires on your top genomic females, beef sires on the bottom. If you test but don’t actually follow through on that split, you’ve spent the money without capturing the value. And on very small herds under 50 cows with limited replacement needs, the per-head cost may not generate enough selection differential to justify universal testing. Start with 20 and scale from there.
The Five-Year Outlook: Marginal Edge or Structural Separation
Five years out, is disciplined sire selection a nice-to-have or a survival factor?
The evidence points toward structural separation. CoBank’s lead dairy economist Corey Geiger laid out the financial logic in a March 2025 Knowledge Exchange report: “there’s a clear financial incentive for producers given that multiple component pricing programs place nearly 90% of the milk check value on butterfat and protein.” And the genetic pipeline is delivering. Butterfat in US Holsteins hit a record 4.23% in 2024, and protein reached 3.29% — both per USDA/NASS data. Between 2011 and 2024, butterfat production surged 30.2% and protein by 23.6%, both outpacing the 15.9% growth in fluid milk volume (CoBank, March 2025). For a broader context on where this is heading, see the 2025 genetic evaluation updates.
“Selecting animals for highly heritable traits and having a market incentive to do so has formed a strong foundation for dairy producers to develop their herds to produce more butterfat and protein,” Geiger wrote. “Genetics should continue to gain momentum in the coming years.”
In the UK, 112,507 cows were genomically tested in 2024 — a 19% jump over the prior year. The adoption curve is accelerating. Marco Winters, head of animal genetics at AHDB, put it bluntly: “Improving genetics is probably the cheapest and most sustainable way of making long-term improvements to any herd, and when you’re using a genetic index which has been developed specifically to increase profitability, this feeds straight through to a farm’s bottom line.”
In Australia, DataGene’s ImProving Herds project — which tracked 27 Genetic Focus Farms and 7 Herd Test Focus Farms — found that every single case study farm adopting data-informed genetic decisions reported improved business performance, even during a severe milk price crash and drought (DataGene, 2023 final report). Six of seven Herd Test Focus Farms continued testing permanently. Once the feedback loop started working, going back felt reckless.
Here’s what makes genetics different from every other efficiency tool on your dairy. Feed systems, robotic milkers, and activity monitors — they all require ongoing capital and operating expense. Genetic gains are baked into the biology. They compound without additional spend. In a margin squeeze, the operation running genetically superior cows carries a fundamentally lower breakeven. Not because they manage better. Because their cows are biologically cheaper to run.
What This Means for Your Operation
Before your next semen order, build the one-page scorecard. Thirty minutes, five questions, taped to the wall. Every sire candidate is scored against your herd’s actual needs—not catalog rankings or rep recommendations.
This month, genomic test your next 20 breeding-age heifers. Use the results to split your replacement pipeline: dairy sires on top-tier females, beef sires on the rest. Test them all — not just the ones you think are best.
At your next rep conversation, hand them the scorecard and ask them to fill four roster positions—not just recommend their current favorites. Which bull addresses your top cull reason? What’s the Expected Future Inbreeding for each sire mated to your herd? Do they have outcross options from distinct sire lines?
Every proof round (April, August, December), revisit your roster. December 2025 reshuffled the rankings significantly. A lineup built in January may need adjusting by August.
If your herd averages over 1,600 lbs body weight, the NM$ maintenance cost recalibration means your feed costs per unit of production are likely higher than your old genetic plan accounted for. With BWC now carrying −11% emphasis in NM$, selecting for lower body weight composite and positive Feed Saved isn’t optional anymore.
If you market breeding stock or show cattle, recognize that NM$ reflects commercial priorities. Weighting type traits more heavily is a legitimate strategic choice — just make it with full awareness of the trade-off in commercial efficiency.
Questions to Ask Your Genetics Rep This Week
Print this. Bring it up in your next conversation about your semen order.
Can you show me trait profiles — not just index rankings — for every bull in my current lineup?
Which of my current sires directly addresses my top cull reason?
What is the Expected Future Inbreeding for each bull when mated to my herd?
Do you have outcross options from distinct sire lines and maternal grandsires?
How does my current lineup score on Feed Saved and body weight composite under the 2025 NM$ revision?
The Longest Game You Play
Tonight’s Super Bowl ends in four quarters. Your sire decisions don’t resolve for a decade.
Vander Woude has been at this for over a decade now. He wouldn’t still be testing 6,000 cows if he didn’t believe it paid for itself. “It’s really hard to quantify how it pays for itself,” he shared. “But I have a much better herd of cows.” Dave Erf, his Zoetis geneticist, was more specific: “I’ve never seen such a good reproduction performing herd… I think genetics helped them get there.”
Know your cows. Know your numbers. Match the bull to the need. That’s the whole shift in one sentence—and the data shows most of the industry still isn’t doing it.
Your semen tank is right there. The scorecard takes half an hour. And every daughter that walks into your parlor two years from now will be the commercial that plays on repeat, for better or worse, for the rest of the decade.
Key Takeaways
Your sire choices now move $869 per cow in lifetime profit, based on a nine‑year Zoetis study of 12,952 Holsteins on 11 US dairies — that’s $173,800 a generation on 200 cows.
The 2025 NM$ changes pay you more for Feed Saved and longevity and hit you for excess cow size (−11% BWC), so chasing big, showy cows is now a direct hit to commercial profitability.
You can upgrade from “favorite bulls” to a real breeding game plan by running a four‑slot sire roster: franchise profit bull, high‑component hammer, durability/fertility fixer, and an outcross to keep inbreeding in check.
A one‑page scorecard (NM$ floor, EFI cap, top three cull reasons, facility needs) plus genomic testing on your next 20 heifers is enough to start sorting dairy vs. beef matings with confidence.
If you’re getting paid on butterfat and protein, genetics is no longer a “nice extra” — it’s one of the few levers that can permanently pull your breakeven down while feed and labor keep marching up.
Complete references and supporting documentation are available upon request by contacting the editorial team at editor@thebullvine.com.
Learn More
The $1750 Calf: Is Your 2026 Breeding Plan Leaving $800 a Head on the Table? – Arms you with a 90-day blueprint to capitalize on the $1,750 beef-on-dairy market without hollowing out your future herd. This guide delivers the specific math you need to convert surplus pregnancies into immediate, high-margin revenue.
The Next Frontier: What’s Really Coming for Dairy Cattle Breeding (2025-2030) – Breaks down the 2025–2030 roadmap of AI-driven selection and microbiome markers that promise 70% labor reductions. This vision of the future delivers a massive early-adopter advantage for producers ready to move beyond traditional production metrics.
The Sunday Read Dairy Professionals Don’t Skip.
Every week, thousands of producers, breeders, and industry insiders open Bullvine Weekly for genetics insights, market shifts, and profit strategies they won’t find anywhere else. One email. Five minutes. Smarter decisions all week.
Is your herd’s protein‑to‑fat ratio making your processor money—or quietly costing you on every 2026 milk check?
Executive Summary: Looking at 2026, what’s really moving the needle on dairy profitability isn’t just how many hundredweights you ship—it’s how much protein and butterfat are in each one. CoBank’s recent component analysis points out that U.S. herds excelled at boosting butterfat, but processors and cheese plants now need more protein, and that’s starting to change which components lead the milk check. USDA outlooks add another layer of pressure, with softer butter prices and tighter margins, meaning component value and processor fit will matter more than ever. This feature unpacks that “component economy” in plain language, explains why your herd’s protein‑to‑fat ratio matters to plant yield and standardization costs, and shows how nutrition, fresh cow management, and genetics can be tuned to support stronger protein without sacrificing fat. It also walks through how this plays out differently in Upper Midwest cheese country, Western dry lot systems, Northeast fluid markets, and under Canadian quota, so you can see your own reality in the numbers. By the end, you’ll have a clear set of questions to ask at your own kitchen table—about your milk check, your processor contracts, and your breeding and feeding strategy—so you can decide if you’re still built for the butterfat era or ready for protein to do more of the heavy lifting.
You know, after watching milk checks and component trends for a lot of years now, I’m more convinced than ever that we’re in one of those quiet turning points you only really see clearly in hindsight. In October 2025, USDA’s National Agricultural Statistics Service reported that the 24 major dairy states shipped about 18.7 billion pounds of milk, up 3.9% from the previous October, with total U.S. production up 3.7% year‑over‑year. That’s real growth on top of an already big base. What’s interesting here is that when you look under the hood, the story isn’t just about more milk—it’s about what’s in that milk, especially in terms of butterfat performance and protein yield.
The herds that read this shift right are going to hang on to more dollars per cow in 2026. The ones that don’t may find money quietly slipping away, even if the tank looks full.
Looking at This Trend From the Plant Side
Looking at this trend from the plant side, you start to see a different layer of the story. A 2025 analysis from CoBank’s Knowledge Exchange group, led by Corey Geiger—lead dairy economist at CoBank—dug into how milk components have changed over the last decade. They found that butterfat levels in U.S. milk climbed about 13.1% over 10 years, while butterfat levels in the European Union and New Zealand rose only about 2.4–2.5%. Geiger’s team linked that jump to strong domestic demand for butter and full‑fat dairy products, plus component‑based pricing in many Federal Orders that paid generously for fat. Other market coverage has pointed out that U.S. cows are shipping more total fat and protein per hundredweight today than they did a decade ago, thanks to genetics and feeding.
Year
Butterfat Growth (%)
Protein Growth (%)
Protein-to-Fat Ratio
2015
0.0
0.0
0.82
2017
3.5
1.2
0.81
2019
7.2
2.1
0.79
2021
9.8
3.0
0.78
2023
12.1
3.8
0.77
2025
13.1
3.9
0.77
On paper, that sounds great—and to be fair, it has been. Many Midwest producers will tell you there were years when butterfat premiums essentially “saved the year” on cheese‑market milk. But as butterfat kept rising, something else began to appear in the data. CoBank’s follow‑up commentary and articles in dairy media have begun asking whether the U.S. might actually have more butterfat than some processors really need, especially cheese plants that also depend heavily on protein to make both cheese and whey efficiently.
If you look at late‑2025 market coverage, you see that tension showing up in prices. News outlets reported butter falling sharply from the record territory seen in 2022, with analysts warning that lower butter values and larger supplies were helping pull down milk prices and setting up weaker milk checks moving into 2026 as production stayed strong. USDA’s own outlook work around the same time projected continued growth in milk production and lower average butter, cheese, and all‑milk prices compared with those earlier highs.
Now, here’s where components and ratios come into play. Cheesemaking research and USDA work on predicting cheese yield have shown for years that cheese and whey yields are highly sensitive to the balance of protein and fat in the vat. Plants can standardize milk, of course, but they run most efficiently when the incoming milk is already in a workable range. Industry guidance and component tables suggest that, for many common U.S. cheeses, milk somewhere just over 3% true protein and in the upper‑3s to around 4% butterfat—often yielding a protein‑to‑fat ratio near 0.80—makes life a lot easier in the plant.
It’s worth noting that this isn’t about chasing a single magic target to two decimal places. What CoBank’s report points out is the trend: for much of the 2000s and early 2010s, the U.S. protein‑to‑fat ratio hovered around 0.82–0.84, then drifted down toward roughly 0.77 as butterfat grew faster than protein. When that ratio drops, cheesemakers are forced to do more standardizing—adding protein or skimming off fat—to hit the composition they need. That extra work is routine, but it isn’t free.
In an article on “reading the signs” from milk components, Mike Hutjens—Emeritus Professor of Animal Sciences at the University of Illinois—suggests using the protein‑to‑fat ratio as a simple “dashboard light.” He notes that when herd averages sit below about 0.75, cows are often “missing milk protein,” and when they’re above about 0.90, milkfat may be depressed. That rule of thumb aligns with what cheesemakers and plant managers have been telling CoBank and others: they don’t just want high butterfat levels; they want balanced components that fit their vats and product mix.
Herd Size (cows)
Protein-to-Fat Ratio
Herd Type
Region
80
0.88
Tie-stall
Northeast
125
0.85
Organic
Northeast
150
0.76
Freestall
Wisconsin
220
0.82
Organic
Midwest
300
0.78
Freestall
Wisconsin
400
0.81
Freestall
California
700
0.74
Drylot
California
1200
0.79
Freestall
Midwest
2000
0.75
Drylot
California
So the big takeaway from the plant side is this: butterfat is still valuable, but now that we’ve pushed fat so hard, protein is starting to carry more weight in cheese and ingredient markets. And more plants are watching that protein‑to‑fat ratio than a lot of farms realize.
Looking at This Trend in Consumer Behavior and GLP‑1
You’ve probably heard plenty of noise about GLP‑1 medications like Ozempic and Wegovy and what they might do to food demand. Some general media stories make it sound like these drugs are going to hollow out the whole snack aisle and maybe dairy with it. When you dig into the food‑industry analysis that actually looks at what these consumers buy, the picture is more measured.
Analysts following GLP‑1 users’ eating habits report that, as use of these medications grows, many people do change how they eat: they generally cut overall calories, but they also tend to gravitate toward foods that deliver more protein and nutrition per bite. Several large food and dairy companies, in their own product briefings and category outlooks, have pointed to high‑protein Greek yogurts, strained yogurt drinks, cottage cheese, and cheese‑based snacks as growth areas for health‑conscious consumers. A theme that keeps coming up is grams of protein per serving and satiety in a smaller portion.
For plants making concentrated or high‑protein dairy products, that puts a premium on milk that brings strong protein content right through the door. Filtration and concentration technology can boost solids, but starting with milk that already has good protein levels makes the whole system more efficient. So instead of seeing GLP‑1 as “anti‑dairy,” it’s probably more accurate to say it nudges part of the market further toward higher‑protein, nutrient‑dense dairy products—a direction that was already building.
The Bigger Protein Story That’s Been Building for Years
Stepping back from GLP‑1 for a moment, the bigger story is that consumers have been chasing protein for quite a while. Surveys from the International Food Information Council over the last several years, including a 2025 spotlight on protein, have found that roughly seven in ten Americans say they’re actively trying to increase their protein intake. Trade coverage summarizes this as a kind of “protein obsession”—you’ve likely noticed how often “high protein” shows up on packaging now, from snack bars to coffee creamers.
Dairy naturally sits in the middle of that trend. Peer‑reviewed nutrition research has repeatedly described dairy proteins as high‑quality, with complete amino acid profiles and good digestibility. Phillip Tong, Professor Emeritus of Dairy Science at California Polytechnic State University and former director of the Dairy Products Technology Center, has emphasized in his work that milk proteins provide not just nutrition but also functional properties—gelling, foaming, water‑binding, emulsifying—that make them valuable to food manufacturers. Those properties are a big reason why whey protein concentrates, isolates, and milk protein ingredients have grown steadily in sports nutrition, medical nutrition, products for older adults, and a whole list of “better‑for‑you” foods.
So when you line these things up—consumer protein interest, functional advantages of milk protein, and CoBank’s finding that butterfat has outpaced protein growth and pulled the national protein‑to‑fat ratio downward—the pattern is pretty clear. We’re not just living in a “butterfat era” anymore. We’re operating in a component economy where protein is moving closer to center stage, especially in processing‑heavy, cheese‑oriented regions.
What Farmers Are Finding at the Feed Bunk
All right, enough big‑picture talk. Let’s bring this back to decisions you can make at the feed bunk and in fresh cow management.
Land‑grant university nutrition work—from Nebraska, Illinois, and others—has reinforced for years that butterfat and protein both respond to the basics: forage quality and chop length, effective fiber, starch fermentability, physically effective NDF, and overall energy balance. They also stress that the transition period and early fresh cow management are critical. Poor intakes, subclinical ketosis, and cow comfort problems in the first weeks after calving often manifest later in milk volume and components.
You probably know this from your own records: when energy gets tight, or rumen health slides, protein is often the first to sag while fat hangs on a bit longer. That’s a signal.
Over the last decade, a lot of herds leaned on palmitic‑rich rumen‑protected fat supplements to push butterfat performance. Research and field experience have shown that, in well‑balanced rations with healthy rumens, these products can bump milkfat percentage and, in some cases, fat yield. Combined with genetics and management, that helped drive regional butterfat averages upward. Some herds in the Upper Midwest increased their components toward 7 pounds of fat and protein per cow per day by focusing on both nutrition and genetics.
Scenario
Component
Annual Cost/Value
Result
2022 Butter Peak
Supplement Cost
-$54,000
Baseline
2022 Butter Peak
Butterfat Value @ $2.20/lb
+$43,362
Net: +$10,638
2026 Outlook
Supplement Cost
-$54,000
Baseline
2026 Outlook
Butterfat Value @ $1.35/lb
+$26,608
Net: –$27,392
Protein-Focused Alternative
Nutrition + Genomics Cost
-$30,000
Baseline
Protein-Focused Alternative
Protein Value @ $1.80/lb
+$31,200
Net: +$1,200
But as butter prices have come off their highs and more processors are paying attention to protein, it’s worth sharpening the pencil on those investments. The exact cost per cow per day and the exact response in butterfat for any one product will depend on your ration and conditions. Rather than relying on a canned example, the best move is to sit down with your own numbers:
What are you actually paying per cow per day for any fat supplement?
What change in butterfat test and fat pounds shipped have you documented when using it versus not using it?
What’s your current value per pound of butterfat on your milk check?
If, after that exercise, the extra butterfat dollars comfortably outrun the cost—and you’re not harming rumen health or protein—then that tool may still have a solid place in the ration. If the margin has narrowed or turned negative under today’s component prices, it might be time to consider shifting some of that budget into strategies that help both protein and overall efficiency, like higher‑quality forages, more precise starch and fiber balance, or amino acid balancing.
On the protein side, extension and research consistently highlight a few themes in diets that support higher true protein:
Forages harvested at the right stage and moisture, with consistent quality across the year.
A solid balance of rumen‑degradable and rumen‑undegradable protein, so microbes and the cow both get what they need.
Enough fermentable starch to fuel microbial protein production without driving subacute ruminal acidosis.
Targeted methionine and lysine supplementation when diets are limited in those key amino acids.
Strong transition and fresh cow programs that keep intakes up and cows out of deep negative energy balance.
Hutjens’ component “dashboard” fits nicely with this. When the protein‑to‑fat ratio averages below about 0.75 across a herd, there’s usually room to improve protein yield. When the ratio climbs above about 0.90, milkfat may be compromised. That gives you a simple, herd‑level way to keep an eye on how well your feeding program, fresh cow management, and genetics are working together.
So here’s a practical check that’s worth doing: pull your last 12 months of test results and calculate the average protein‑to‑fat ratio. If most of your milk goes to cheese and that ratio is consistently down in the low‑to‑mid 0.70s, it’s probably time to sit down with your nutritionist—and maybe your plant field rep—and ask whether your feeding program and your plant’s needs are still aligned.
Genetics: The Quiet Lever Behind Tomorrow’s Components
Once you’ve taken a hard look at the feed bunk, the next quiet lever is genetics.
Genetic evaluations in Holsteins and Jerseys show that fat and protein yields are positively correlated—selecting for more milk and better components generally moves both traits upward, though not always at the same rate. Economic indexes like Net Merit (NM$) put explicit economic weights on fat and protein, and USDA’s 2021 revision documented changes to those values based on updated milk and component prices. For much of the last decade, strong butterfat pricing helped push index emphasis toward fat, and that made sense in the markets at the time.
As plants and markets begin to value protein more heavily—particularly in cheese, whey, and protein ingredients—that weighting becomes worth a second look. Some recent commentary and genetic updates have already noted that bulls with strong protein proofs and overall solids are climbing in rankings as the economics shift.
Genomic testing has made it much more practical for commercial herds to act on this. Many herds now test heifers genomically, at costs typically ranging from the mid‑teens to around $50 per head, depending on the panel and country, and use those results to:
Rank replacement heifers by projected lifetime profit, including fat and protein yields.
Identify families that consistently underperform on components.
Tune sire selection so that the component profile—fat and protein percentages and pounds—matches where their milk actually goes.
Breed mix also plays a role. Typical Holstein herd averages often sit around 3.7% butterfat and just over 3.1% true protein, giving a protein‑to‑fat ratio in the mid‑0.80s. Jerseys commonly run up in the high‑4s for fat and around 3.8% protein, with a ratio just under 0.80. Crossbred herds land in between, depending on the breeds and selection emphasis. None of these profiles is “right” or “wrong” on its own. The key is whether your genetics give you a component profile that fits your market.
What I’ve noticed, looking at sire lists in a lot of herds, is that there’s still a tendency to default to a single index number and only later ask, “Does this bull actually fit my processor’s needs?” In a world where cheese plants and ingredient makers are increasingly vocal about wanting more protein to catch up with butterfat, it’s worth pulling out those proofs and asking a slightly different question: “Is my sire selection moving my herd toward a better protein‑to‑fat balance for where my milk is going?”
Region
Primary Market
Ideal Butterfat
Ideal True Protein
Target P:F Ratio
Payment Emphasis
Upper Midwest (WI, MN, MI)
Cheddar, mozzarella, whey concentrate
3.8–4.0%
3.2–3.4%
0.80–0.85
Ratio-sensitive; protein gaining
Western States (CA, ID, NV)
Mixed (cheese, powder, fluid, ingredients)
3.6–3.9%
3.0–3.2%
0.77–0.82
Volume + flexibility; less ratio-rigid
Northeast & Atlantic Canada
Fluid, yogurt, regional cheese, specialty
3.4–3.7%
3.1–3.3%
0.85–0.95
Quality premium + components vary
Canadian Quota Markets
Butter, cheese, powder (supply-managed)
3.9–4.1%
3.1–3.3%
0.78–0.82
Factors adjusted annually; quota limits output
Organic Processors
Premium fluid, specialty cheese, yogurt
3.5–3.8%
3.0–3.2%
0.80–0.88
Organic premium overshadows fine diffs
Regional Realities: One Trend, Many Local Versions
As many of us have seen, these trends don’t play out exactly the same way everywhere, and it’s important to respect that.
In Wisconsin and other Upper Midwest cheese states, the fit between components and plant needs is front and center. A large share of the milk in these regions is used to make Cheddar, mozzarella, and other cheeses, thanks to modern whey recovery systems. CoBank and regional market coverage have emphasized that cheesemakers there are especially sensitive to the protein‑to‑fat ratio and total solids because both cheese and whey yields depend heavily on those numbers. Education pieces walking through new pricing rules have shown examples where herds with modestly lower fat but stronger protein outperform very high‑fat, low‑protein herds at the same cheese plant, purely on yield and component value. That’s the kind of quiet math that makes protein more than just a “nice to have” in those markets.
In Western states like California, the picture gets more layered. Many herds are large, often in dry lot systems, and ship into a mix of cheese, powders, fluid milk, and value‑added products. At the same time, they’re operating under high feed costs, water limitations, and some of the toughest environmental regulations in the business. Market analysis and sustainability work from that region make it clear that components still matter, but they’re just one lever among many—alongside stocking density, water use, regulatory risk, and plant capacity.
In the Northeast and across Atlantic Canada, much of the milk ends up in fluid markets, regional brands, yogurt plants, and specialty cheeses. Some cooperatives and proprietary processors in these areas have moved more aggressively toward component‑based payments, including protein, while others still lean heavily on volume and quality premiums. In Canada, national supply management and quota limit total output, but planning documents from the Canadian Dairy Commission emphasize the need to manage components to meet butter and cheese requirements; component allowances and factors are adjusted accordingly.
Organic herds see yet another twist. Many have a base premium for organic milk that can overshadow fine‑grained component differentials, but processors and organic brand programs still pay attention to components because they affect product yield and cost. Some organic buyers include composition and quality benchmarks as part of their sourcing criteria, even if the pay formula is simpler.
So while the big pattern says protein is gaining importance, the way it shows up in your milk can be quite different in Wisconsin, California, New York, or Ontario. That’s why those local conversations with your nutritionist, field rep, and lender matter just as much as the national reports.
What the Outlook for 2026 Is Really Saying
When you bring together USDA’s outlooks, CoBank’s component analysis shared that the picture for 2026 is pretty consistent: it’s likely to be another tight‑margin year for many dairies. USDA projections anticipate continued growth in milk production, driven mainly by higher milk per cow, while average prices for butter, cheese, and the all‑milk price are expected to stay below the highs we saw a few years ago. Analysts have already noted that rising supply and strong component levels are weighing on prices, and that “weaker milk checks” are a real possibility if production doesn’t moderate.
At the same time, more and more people in the industry are using that “component economy” language to describe where we are. Fat and protein are being priced, managed, and in some cases hedged more independently. New or revised pay formulas are paying closer attention to how each component contributes to product yield and plant margins.
For your farm, the message is pretty straightforward: when base prices soften, the share of your milk check that comes from components, quality, and program premiums becomes more important. If protein is gradually gaining ground in your pay structure and your herd’s protein‑to‑fat ratio is drifting in the wrong direction, you can end up working just as hard for a less competitive milk check.
Year
Base Milk
Butterfat Premium
Protein Premium
Quality/Other
Total
2022
18.50
3.42
1.86
0.92
24.70
2024
18.20
2.64
2.07
0.89
23.80
2026E
17.90
2.10
2.42
0.88
23.30
Practical Questions to Ask at Your Own Kitchen Table
So, with all that in mind, if we were sitting together at your kitchen table with a stack of milk checks and test reports between us, here are the questions I’d want to walk through:
Over the past 12 months, what’s your average protein‑to‑fat ratio—not just on one test, but across the year? Are you closer to 0.72, 0.78, or 0.85? How does that compare to the 0.75–0.90 “healthy range” Hutjens and others talk about?
Looking at your milk checks, how many dollars per hundredweight in the last year came from butterfat, and how many from protein? Has that mix shifted as butter prices eased and protein held or strengthened?
When was the last time you asked your processor or cooperative, “If you could design the ideal butterfat and protein tests for your plant today, what would they be—and how would you pay for that?” Some plants and contracts are quietly adjusting to encourage the component balance they need.
Are you still spending money on fat supplements mostly to chase higher butterfat levels, and have you re‑run that ROI using your current butterfat value, actual response in your herd, and today’s feed costs?
Are you using genomic testing—or at least looking closely at sire proofs—to nudge your herd toward a component profile that matches where your milk actually ends up: cheese, yogurt, fluid, or export ingredients? Are protein traits getting the weight they deserve on your bull list?
When you look at your top sires, how many are genuinely strong on protein, not just fat and total yield?
The answers will look different for a 120‑cow tie‑stall herd in the Northeast, a 400‑cow freestall in Wisconsin, a 2,500‑cow dry lot in California, or a quota‑managed herd in Ontario. And that’s okay. The goal isn’t to chase every trend or copy the neighbor. It’s to be intentional about which trends actually matter to your milk check and which don’t.
A Balanced Way to Look at the Future
When you line up the current numbers—from USDA’s production and price outlooks, from CoBank’s component growth analysis, from IFIC’s consumer protein surveys, and from cheesemaking research and extension work—the pattern is pretty clear: protein is becoming a bigger part of how milk is valued, especially in cheese and ingredient markets. That doesn’t mean butterfat suddenly stops mattering. Butter, cream, and full‑fat dairy products still resonate with consumers, and strong butterfat performance will remain a point of pride on many farms.
What’s encouraging is that a lot of the practices that help protein also help build durable, resilient dairies in general: good forages, thoughtful starch and fiber balance, strong fresh cow and transition management, attention to cow comfort, and smart use of genetics and genomics. You’re not being asked to tear your operation down to the studs. You’re being invited to fine‑tune a few dials based on where the money seems to be heading instead of where it used to be.
For some herds, that might mean easing off an “all‑in on fat” mindset and giving protein a bit more focus in both rations and sire selection. For others, especially those already shipping to plants that pay well for protein and running healthy protein‑to‑fat ratios, it might simply confirm that the path you’re on lines up well with your market.
Either way, as you look ahead to the next few seasons, it’s probably worth pouring another coffee, spreading out those milk checks and test reports, and asking yourself a simple question: Is your herd set up for the protein pivot that’s shaping 2026 milk checks—or mainly for the butterfat boom we were cashing in a few years ago?
Key Takeaways:
Butterfat won the decade—protein didn’t keep pace: U.S. fat jumped ~13% in ten years while protein lagged, pulling the national ratio from ~0.82 to ~0.77. Cheese plants are pushing back.
Your plant needs balance, not just fat: Cheese and whey yields hinge on a ~0.80 protein-to-fat ratio. Fat-heavy milk means extra standardization—and that cost comes back to you.
Protein is about to do more heavy lifting on your milk check: Butter prices are off their highs, USDA sees tighter 2026 margins, and component formulas are shifting toward protein.
Know your number and act on it: Pull your 12-month protein-to-fat ratio. Below 0.75? Protein opportunity. Above 0.90? Possible fat depression. Tune rations, transition protocols, and your bull lineup.
One trend, many local versions: Upper Midwest cheese plants are ratio-obsessed; Western herds weigh components against water and regulations; Canadian quota adjusts factors to hit national targets.
Complete references and supporting documentation are available upon request by contacting the editorial team at editor@thebullvine.com.
Same Tag, Different Feed: The Molasses Problem – Protect your heifer investment from hidden nutritional swings that derail growth. This research breakdown exposes massive variability in common feed ingredients and delivers the critical questions you need to ask your supplier to ensure performance.
The Sunday Read Dairy Professionals Don’t Skip.
Every week, thousands of producers, breeders, and industry insiders open Bullvine Weekly for genetics insights, market shifts, and profit strategies they won’t find anywhere else. One email. Five minutes. Smarter decisions all week.
Spending $2,000 to raise a heifer because she’s got more white? Genomics says that’s a losing bet. Beef-on-dairy says there’s $4+/cwt on the table.
If we were sitting over coffee at a winter meeting in Ontario or Wisconsin, you’d probably hear someone say, “Those white cows just seem to last,” or “I like that kind of pattern; they’re my kind.” A lot of us grew up with that way of thinking. For decades, the way a Holstein looks—her color, pattern, and style—has sat right beside milk records, butterfat levels, and fresh cow management notes when we’ve made breeding decisions, just like breed associations and coat‑color labs still describe for Holsteins today, especially around the red factor and MC1R work coming out of places like the University of Saskatchewan and VHLGenetics.
Here’s what’s interesting in 2025. The ground under that old habit has shifted. Genomic evaluations, population‑genetics work on inbreeding, new heat‑stress research, and some pretty eye‑opening 2025 beef‑on‑dairy economics are all pointing in the same direction: your eye still matters a lot, but it’s no longer the sharpest tool for predicting which calves will pay back rearing costs and stay productive through multiple lactations. A big U.S. Holstein study in the journal Proceedings of the National Academy of Sciences showed that once genomic selection came in, the generation interval for sires of young bulls dropped from roughly seven years down to about two and a half, and the annual genetic gains for milk, fat, protein, fertility, and productive life basically doubled compared with the old progeny‑test era.
When you put that next to the economics, the stakes get very real. A Canadian study by CanFax and the Beef Cattle Research Council found that the average cost to raise a replacement heifer was about CA$2,904 in 2023, with a range of CA$1,900 to CA$3,800 across farms. North American dairy budgets generally put that in the US$1,800–2,500 range to get a heifer to calving, once you factor in feed, housing, labor, health, and breeding. At the same time, market analysis from HighGround Dairy in late 2025 estimated that, under strong beef markets and structured beef‑on‑dairy programs, cull cows and beef‑on‑dairy calves together could add more than US$4.00 per hundredweight of milk shipped on some operations, and in another model, they projected beef‑related income above US$4.50 per hundredweight, with several months over US$5.00.
So those breeding calls—who gets sexed Holstein, who gets beef, which heifers you raise—aren’t cosmetic anymore. They’re big‑ticket cash‑flow decisions.
What I’ve found, talking with progressive herds in Ontario, Wisconsin, the northern Plains, and over in parts of Europe, is that the farms making the most consistent progress are letting genomics and economics set the main breeding direction. Then they use their eye to manage cows and fine‑tune individual decisions, not the other way around.
As Kent Weigel, who teaches dairy cattle genetics at the University of Wisconsin–Madison and has spent years working with Holstein producers, likes to tell producer groups, genomics doesn’t replace good stockmanship; it just tells you things about a heifer you can’t see by looking at her—things like fertility, disease resistance, and how long she’s likely to stay in the herd. The eye still matters a lot for the day‑to‑day management side.
Looking at This Trend: What Color Really Tells You
Let’s start with the big myth on the coffee‑shop circuit: does coat color actually tell you anything reliable about a Holstein’s genetic merit for milk, fertility, or health?
On the black‑versus‑red side, a lot of the story runs through the melanocortin 1 receptor gene—MC1R—on chromosome 18. Geneticists have known for quite a while that MC1R is a central switch between black pigment and red/brown pigment across many species, and Holsteins fit right into that pattern. Holstein‑specific work from Canadian and U.S. labs shows that the main MC1R alleles—often called Dominant Black, Black/Red, wild‑type, and Recessive Red—largely determine whether a Holstein shows up as black‑and‑white or red‑and‑white on the outside.
A really interesting twist came in 2015, when a team publishing in PLOS ONE described a new Dominant Red coat pattern in Holsteins and tied it to a missense mutation in the COPA gene. They showed that this COPA variant acts through the pigment pathway and essentially overrides the usual MC1R signal, turning black areas red. The important point here is that their work was about coat color; they didn’t find evidence that COPA itself was a major driver of milk yield or fertility.
The classic black‑and‑white patch pattern has its own genetic story. Genome‑wide analyses in Holstein‑Friesians have repeatedly identified strong signals around the KIT gene on chromosome 6 and other pigmentation genes, such as MITF, as key players in spotting and patterning. That matches what many of us see in sire families—certain bulls stamp a recognizable pattern on their daughters.
Now, set that beside what we know about the heavy‑hitter milk genes. Large genome‑wide association studies in Holsteins, including recent work from Asia and Europe, continue to confirm major effects for milk yield, fat, and protein near DGAT1 on chromosome 14 and at several other regions. Reviews of milk‑trait genomics and meta‑analyses don’t flag MC1R or COPA as major milk‑yield QTL. They’re busy with DGAT1 and a suite of other production loci scattered around the genome.
So when you map this out, you see two fairly separate stories. One is the pigment story—MC1R, COPA, KIT, MITF. The other is the production story—DGAT1 and dozens of other loci that drive yield, fat, protein, and things like somatic cell score. Color genes just don’t show up as the big drivers of milk or fertility that we see in genomic evaluations.
That doesn’t mean you won’t find a cow family where “the red ones” or “the ones with more white” seem to be your better cows for a while. In a tight family, that absolutely happens. But genetically, what’s going on there is that you’re seeing a family package, not a universal rule. Across the breed, coat color by itself just isn’t a reliable shortcut to Net Merit, Pro$, or the overall profit indexes that matter to the milk cheque.
What Farmers Are Finding: Popular Sires and “Color Stories”
What farmers are finding, especially when you look back over a few decades of AI use, is that our “color stories” are usually really “family stories.”
Most of us can name the bulls that left a big genetic footprint in our barns: Shottle, Goldwyn, Planet, Mogul, Supersire, and now the current crop of genomic sires. Population geneticists call this “popular‑sire” or “founder” effect—when a relatively small number of bulls contribute a large share of the genes in a breed over a short period. A high‑density genomic study in Genetics Selection Evolution examined these selection signatures in Holstein‑Friesians and other breeds and found long stretches of DNA—haplotypes, where variation had been squeezed out by strong selection for milk, components, stature, and udder traits.
When you use a bull like that heavily, his daughters don’t just share his “under the hood” production package; they also share his visible stamp. So for a few generations, a particular pattern or “kind” can feel like it always goes with a particular level of performance. That’s real at the family level. But those haplotype blocks are made up of many linked genes, including both color and production loci. As time goes on and mating gets more diverse again, those blocks break up and recombine.
So inside a family, coat pattern can be a reasonable clue that you’re looking at daughters or granddaughters of a particular bull. At the breed level, the big studies just don’t support simple rules like “more white cows are always better cows.” The family resemblance is real; the population‑wide rule based on color is not.
Where Color Really Does Matter: Heat, Sun, and Lost Milk
Now, there is one place where coat color genuinely shows up in performance, and it has nothing to do with type scores or classification sheets. It’s heat.
Dark surfaces absorb more solar radiation than light surfaces; that’s just basic physics. Studies using thermal imaging and surface temperature sensors have shown that black patches of hair on cattle backs can run several degrees hotter than adjacent white patches when animals are in full sun. That extra absorbed heat adds to the load the cow has to get rid of.
A 2024 paper in the Journal of Dairy Science examined Holstein–Friesian crossbred cows in Tanzania and drew on earlier THI work on Holsteins. As the temperature‑humidity index moved into heat‑stress ranges, the researchers observed that rectal temperature, respiration rate, and panting scores all increased. At the same time, milk yield, milk fat percentage, and solids‑not‑fat percentage dropped. In other words, as cows got hotter, they gave less, and the component tests slipped too.
On pasture‑based systems in New Zealand and Australia, extension folks and researchers have seen the same basic pattern. Under heat stress, cows stand and pant more, graze less, and produce less milk unless they’ve got shade, water, and some form of cooling. Some work suggests that cows with lighter coats or slicker hair hold up a bit better under those conditions, which is why there’s been interest in breeding for heat tolerance in grazing systems.
One pretty eye‑catching example came out of CSIRO. Their team produced Holstein–Friesian calves from embryos edited at a coat‑dilution gene called PMEL. Those calves had lighter coats and, when they were put in the sun, took on less radiative heat than their darker‑coated herdmates. They’re strict research animals, not anything you’ll find on a commercial farm, but it shows how seriously some groups are taking the connection between coat, heat, and performance.
What This Means on Your Farm
Here’s how color and heat pencil out in different setups:
Your situation
Focus first on
Hot, high‑sun region or dry lot with limited shade (Central Valley, CA, parts of Texas/Florida, southern Europe)
Shade structures, fans, sprinklers, and good water access. Don’t count on breeding for more white to solve heat stress. Fix the environment first, because that’s where the biggest gains are.
Moderate climate with decent ventilation (Ontario, Wisconsin, Quebec, northern Europe)
Solid ventilation and transition‑period management first. Genomic testing and index‑based selection will move the needle more than fussing over color, though heat‑abating investments still pay on the worst days.
Pasture‑based with limited infrastructure (NZ‑style or U.S. grazing herds)
Shade and water access, careful grazing management on hot days, and—if the genetics are available—looking at heat‑tolerant and slick‑hair lines can help, especially as summers get hotter.
So yes, color does play a role in heat load, especially in hot, bright environments and in dry lot systems. It can absolutely show up as lost milk and tougher breeding if cows are constantly fighting heat stress. But even in those regions, coat color is one part of a bigger heat‑stress and cow‑comfort picture. It’s not a substitute for good ventilation, shade, or water, and it’s not a stand‑alone selection tool for profit.
What Genomics Has Actually Changed for Your Bottom Line
Now let’s talk about genomics, because that’s where the biggest shift has happened in how Holstein genetics translate into dollars.
When genomic evaluations came onto the scene in the U.S. and Canada around 2008–2010, the promise was pretty simple: use DNA information from young animals to predict their genetic merit before they have milking daughters, shorten generation intervals, and speed up genetic progress.
That big U.S. Holstein study in the National Academy Journal really put numbers to it. Once genomics was adopted, the sire‑of‑bull generation interval came down from roughly 6.8–6.9 years to about 2.4 years. Annual genetic gains for milk, fat, and protein almost doubled. For health and fertility traits such as somatic cell score, daughter pregnancy rate, and productive life, gains were three- to four‑fold.
More recent work, including a 2023 paper in the journal G3, has combined fertility traits into a single reproductive index and shown that there’s sufficient genomic signal to select for fertility, not just milk effectively. That lines up with what many of us have seen on real farms: herds that use genomic information well can walk that tightrope of driving production up while also improving fertility and udder health, rather than trading one off against the other.
So genomics gives you a much clearer window into traits your eye just can’t judge in a young heifer. You can’t see the daughter pregnancy rate or expected survival to third lactation by looking across the calf pen, but the DNA markers give you a probability estimate that, while not perfect, is a lot better than guessing.
The Cost Reality
Then there’s the math.
That Canadian heifer‑cost study we talked about pegged the average replacement cost at CA$2,904 per head, with many farms running well over CA$3,000. North American dairy budgets usually land in the US$1,800–2,500 range when you include feed for the entire rearing period, housing, labor, vet bills, and breeding costs.
On the testing side, commercial genomic panels—like CLARIFIDE and similar offerings—typically price out at US$35–50 per heifer in North America, depending on the panel and your volume.
Cost Component
Typical Range
Strategic Note
Feed (to 12–18 months)
$800–$1,200 USD
Largest single expense; improves with forage/commodity costs
Housing, bedding, utilities
$300–$500 USD
Per-heifer share of fixed barn and infrastructure
Labor (handling, health, records)
$250–$400 USD
Often underestimated; includes AI tech/vet time
Veterinary, vaccines, breeding
$200–$350 USD
Reproduction drugs, health treatments, AI straw(s)
TOTAL REARING COST (pre-calving)
$1,800–$2,500 USD
Average: ~$2,000 USD or ~$2,900 CAD per head
Genomic test (commercial panel)
$35–$50 USD
= 1.75–2.8% of total rearing cost
% of Heifers Typically Culled by Index (bottom 20–30%)
$360–$750 USD
Waste eliminated: cost of rearing low-index heifers avoided
Payoff: Genomi test cost recovered if you cull just 1–2 poor heifers per year
Break-even: ~$40–75 per year
Risk management, not a luxury
So when you step back, you’re talking about spending forty dollars to find out whether an animal is worth a two‑thousand‑dollar investment. For a lot of herds, that’s not a luxury; it’s basic risk management.
Looking at Inbreeding: Faster Progress, Tighter Gene Pools
Here’s where the story gets a bit uncomfortable. The same genomic tools that gave us faster gains have also made it very clear that tightening up the gene pool in Holsteins.
A North American Holstein study in BMC Genomics dug into runs of homozygosity—those long stretches of identical DNA on both chromosomes—and tracked them from animals born in 1990 through to 2016. They found that the average number of ROH segments at least 1 megabase long per animal went from around 57 in the 1990 cohort to about 82 in animals born by 2016. In the last five years of that period—right when genomic selection really took off—the yearly increase in these ROH segments was almost double what it had been earlier.
The authors made an important point: on a per‑generation basis, the increase in inbreeding wasn’t dramatic. But because the generation interval was so much shorter, you were stacking generations faster and building inbreeding per calendar year much more quickly.
Italian Holstein data tell a similar story. A 2022 paper in Frontiers in Veterinary Science looked at genetic diversity before and after genomic selection. Pedigree‑based inbreeding was around 7%, but genomic inbreeding, based on ROH, was clearly higher and rising faster, and the effective population size—a measure of how many “independent” genetic contributors you really have—was dropping. Follow‑up work linked higher genomic inbreeding to reduced stayability: more inbred cows simply didn’t stay in the herd as long.
So here’s the irony that’s worth sitting with for a minute. For years, a lot of us chased a very particular “look”—the Goldwyn kind, Shottle daughters, that tall, sharp cow. Then genomics came along, and many herds stopped worrying as much about that look and started chasing the top indexes instead. The data now say that in the process, we’ve pushed a lot harder on the same gene pool, faster, especially through very heavy use of a small number of elite bulls.
You look across your pens today, and the cows may not look as cookie‑cutter as those ‘90s flush families. But under the skin, genetically, they’re more closely related than most of us realize.
What You Can Do About It
The good news is that the same genomic tools that measure inbreeding can help you manage it.
A recent review from Italy on on‑farm genetic management describes how using genomic relationship matrices and “optimal contribution” strategies can balance genetic gain and inbreeding in dairy herds. What that means in practice is this: instead of just looking at pedigree inbreeding, you use the actual genomic relationships between your cows and potential sires to decide who should be the parents of the next crop of replacements.
On a real farm, that often comes down to:
Using mating programs that incorporate genomic relationship data, not just sire stacks and pedigree inbreeding.
Being careful about breeding a bull back too heavily to his own daughters and granddaughters.
Spreading your bull usage across a team of high‑index sires instead of hammering one or two “super sires.”
Sometimes, being willing to use a slightly lower‑index bull if he’s less related to your cow family and still meets your key trait goals.
It’s worth noting that no one is saying “stop selecting hard.” The point is to keep the inbreeding curve from getting too steep, so you don’t quietly paint yourself into a corner when it comes to health, fertility, or adaptability down the road.
Why the Eye Still Matters—and Where It Fits Now
So with all this talk about genomics and indexes, it’s fair to ask: where does your eye fit now?
In a lot of barns, what I’ve seen is that the role of the eye has shifted from being the primary genetic gatekeeper to being the primary management tool.
You know how this goes. You still need to walk pens and:
Spot a cow that’s just starting to limp before she’s three‑legged lame.
Watch body condition as cows move through the transition period to prevent crashes right after calving.
See how cows actually use stalls, bedding, waterers, robots, and feed lanes in your specific barn layout.
Catch fresh cows that are “just off” a bit before they show up in the software as a health case.
Genomic indexes and national evaluations can’t do that job. What they can do is take some of the guesswork out of which heifers you invest in and which cows you want daughters from.
At a genetics workshop in Ontario, one Holstein producer described that evolution nicely. He said he used to think his eye was the best tool he had. Now he sees it as his best management tool, while genomic tests tell him which heifers are actually worth raising. A lot of Midwestern and Quebec producers I’ve talked with would say something similar in their own words.
What This Means for Your Holstein Breeding Strategy
So let’s bring this back to your breeding plan, because that’s where all this needs to land.
Picture a 280‑cow Holstein freestall herd in Wisconsin or southwestern Ontario, shipping into a cheese market where butterfat and protein premiums really drive the cheque. Cows are averaging mid‑30s kilos per day with good components, the transition cows get a lot of attention, and the farm already uses some sexed semen and a bit of beef‑on‑dairy.
You could just as easily imagine a 120‑cow tie‑stall in Quebec or a 600‑cow dry lot system in California. The genetics math is the same; you just adjust the heat‑stress and housing parts.
Here’s what a practical, 2025‑ready strategy can look like.
1. Run a One‑Year Genomic Trial
One very low‑risk way to start is a “learn from your own data” trial over 12 months.
Test every heifer calf for a year. Take hair or tissue samples in the first week or two and send them to your preferred lab—Zoetis, Neogen, Lactanet, or your national provider—and ask for the main economic index your market uses, whether that’s Net Merit, Pro$, or LPI.
Keep making keep/cull and breeding decisions exactly the way you do now, based on dam performance, cow family, and what you see in the pen.
At the end of the year, sit down with your vet, nutritionist, or a genetics advisor and compare your actual decisions to the genomic rankings.
In many herds that have tried this, a familiar pattern pops up: there are some heifers you really liked visually that sit only middle‑of‑the‑pack on fertility and longevity indexes, and a few plainer heifers that rank near the top. Seeing that in your own animals tends to carry more weight than any sales pitch.
If your main criterion for keeping a heifer is how much white she has, what the genomic work and the big GWAS studies are saying is that you’re effectively betting a couple of thousand dollars on a trait that doesn’t even show up as a major driver in Net Merit or Pro$. That’s a tough bet to justify once you’ve seen your own data.
2. Let One Economic Index Be Your Compass
To keep it from being overwhelming, most herds do best if they pick one total merit index—Net Merit, Pro$, LPI, or the relevant national index—and let that act as the primary compass.
Heifer Tier (by Index Rank)
% of Herd
Semen Strategy
Expected Calf Outcome
Economic Note
Action
TOP 20–30% (High Index)
20–30%
Sexed Holstein(maximize daughters)
Female calves; all raised as dairy replacements (or top beef-cross if surplus)
Maximizes calf value ($400–600/head vs. $50–100 for dairy bull); eliminates low-merit dairy genetics; often breaks even or profitable on rearing cost
Fast-track to beef channel; NO heifer rearing; recoup heifer costs via calf value
PROBLEM COWS (repeat breeders, chronic mastitis, severe structural defects)
5–10%
Beef Semen
Crossbred calves to beef
Removes undesirable traits from breeding; converts problem cows into profitable calf source
Terminal decision; one more calf, then cull
Then you:
Rank all heifers and young cows by that index, high to low.
Decide on a cutoff—maybe the bottom 10–20% or a certain dollar amount below your herd average—below which you don’t raise heifers as dairy replacements.
Use that ranking to structure semen use:
Top tier: sexed Holstein semen on the females you want daughters from.
Middle tier: conventional Holstein semen.
Bottom tier and problem cows (chronic mastitis, very poor feet, reproduction issues): beef semen.
This is where the math really shows up. If you’re putting US$35–50 into a genomic test and US$1,800–2,500 into rearing a heifer, using that index ranking to decide who gets a replacement slot and who doesn’t will change your cost per hundredweight over the next few years.
3. Use Mating Programs to Manage Inbreeding
The next step is to ensure your mating program uses genomic data to mitigate inbreeding.
It’s worth asking your AI rep or mating service a couple of direct questions:
Are you using genomic relationship information, or just pedigree, to calculate inbreeding risk?
Can you show me the expected genomic inbreeding for each proposed mating?
Given that both the North American and Italian Holstein studies show faster increases in genomic inbreeding and more ROH in the genomic‑selection era, it makes sense to watch this. Some advisors suggest targeting expected genomic inbreeding for replacement heifers in the mid‑single digits, where practical, and only accepting higher values when you’re getting a very significant bump in other traits. The exact target will depend on your herd and sire options, but the principle is to avoid stacking closely related bulls on closely related cows over and over.
In practice, that often looks like still using the elite bulls, but spreading their use across more unrelated cow families, rotating between several high‑index sires instead of just one or two, and sometimes choosing the “second‑highest” bull on a list because he’s less related to your cows, while still very strong on your key traits.
4. Line Up Sexed and Beef Semen With Your Index and Markets
Genomics also helps answer a very practical question: which cows should make your next generation of Holstein replacements, and which should be making calves for the beef market?
Those HighGround Dairy numbers we talked about—over US$4.00 per hundredweight of milk in some scenarios from cull cow and beef‑on‑dairy calf revenue, and earlier projections with several months over US$5.00—show just how big that lever has become on the income side when beef markets are favorable. At the same time, semen‑sales trends and processor programs in North America and Europe show beef‑on‑dairy has become mainstream, especially where packers and branded programs pay up for black‑hided crossbred calves.
A genomics‑aligned plan that a lot of progressive herds are using looks like this:
Sexed Holstein semen on the top 20–40% of females by your chosen index—the ones you really want daughters from.
Conventional Holstein semen is on the middle group, where you still want some dairy bull calves and a share of replacements.
Beef semen on the bottom tier and on cows with traits you don’t want to multiply, such as chronic mastitis, repeat breeders, or severe structural issues.
Combine that with your heifer‑raising cost numbers and your local calf market, and you start to get a very clear picture of where your breeding dollars and semen investments are actually coming back to you.
5. Keep Your Eye in Its Best Role
Through all of this, your eye stays central. It’s just playing a different position on the team.
You know your cows. You know who milks through tough rations, who bounces back after a hard calving in the transition period, and who always seems to find trouble. That day‑to‑day cow sense is the piece no index can replicate.
What genomics does is help you decide which calves deserve the chance to become that kind of cow in the first place. It narrows the group, so you’re not putting full rearing costs into animals that were never likely to reach third or fourth lactation under your system.
Looking Ahead: Diversity, Climate, and the Holstein of 2050
If we zoom out past next year’s milk cheque and think about the Holstein cow of 2040 or 2050, three big forces keep coming up in both research papers and barn‑aisle conversations: genetic diversity, climate, and markets.
On the diversity side, the North American ROH work and the Italian Holstein studies send a pretty consistent message: genomic inbreeding is rising, and effective population size is shrinking in intensively selected Holstein populations. No one credible is predicting a sudden cliff, but there is a very real concern that if we keep pushing hard on a narrow gene pool, we could slowly chip away at the breed’s ability to adapt to new diseases, production systems, or environmental pressures.
On the climate side, more frequent heat waves and higher average summer temperatures are already a reality in parts of the U.S., southern Europe, and elsewhere. That 2024 Journal of Dairy Science review that pulled together heat‑stress studies put numbers on what many of you see in the barn: as THI climbs, cows eat less, energy‑corrected milk drops, and the strain shows up in both milk yield and reproduction. Some of the work digs into the biology—oxidative stress, rumen changes—but the bottom line is simple enough: hot cows don’t use feed efficiently and don’t breed as well.
On the market side, we’re seeing more beef‑on‑dairy programs, more milk cheques driven by components and quality premiums, and more processor attention to consistency and welfare. All of that favors cows that stay in the herd, handle stress, and breed back reliably, not just cows that peak high in first lactation.
What’s encouraging is that we’ve got better tools than ever to work with:
Genomic inbreeding and relationship data, not just pedigree estimates.
Mating strategies like optimal contribution that let you balance genetic gain and inbreeding.
Economic indexes that include fertility, udder health, productive life, and sometimes feed efficiency, alongside milk and butterfat.
A growing body of heat‑stress research to guide decisions on ventilation, shade, sprinklers, and water management.
Beef‑on‑dairy programs and pricing signals that can pay you properly for the right kind of crossbred calves.
The challenge is putting those tools together in a way that fits your herd size, your barns, your labor situation, and the markets you’re shipping into.
The Bottom Line
So if we’re back at that kitchen table and you ask, “Alright, what should I actually do with all this?”, here’s how I’d boil it down into concrete moves for the next year or two.
Run a one‑year genomic test trial on all heifer calves. Don’t change your decisions for that year—just compare what you did to what the index ranking suggests at the end and see where your eye and the DNA agree or disagree.
Pick one economic index—Net Merit, Pro$, LPI, or your national equivalent—and use it as your main compass to sort females into top, middle, and bottom tiers for semen strategy and replacement decisions.
Ask your mating program provider to show you genomic inbreeding for planned matings, not just pedigree inbreeding, and work together to avoid pushing replacement heifers into very high genomic inbreeding levels.
Line up sexed Holstein and beef semen use with both your index ranking and your real replacement needs, keeping today’s heifer‑raising costs and beef‑on‑dairy calf values in mind.
Take a hard look at your heat‑stress plan before next summer—especially if you’re in hot regions or dry lot systems—and ask whether your shade, fans, sprinklers, and water access match what the research and your own cows are telling you.
The herds that lean into this in the next five years will quietly build cows that last longer and earn more per stall. The ones that keep breeding by color and habit will feel it in higher heifer costs, more inbreeding‑related headaches, and fewer options when weather or markets shift on them.
What this whole development suggests is that the next chapter in Holstein breeding isn’t about arguing whether the eye or the computer is “right.” It’s about putting them in the right jobs and letting them work together.
And if we keep sharing what’s actually working—how herds are using genomic tests, indexes, mating programs, heat‑stress strategies, and beef‑on‑dairy opportunities—then, as a group, we’re in a strong position to keep Holsteins productive, profitable, and adaptable well into 2050.
As for color? It’ll probably always be part of how we talk about Holsteins and the kind of cow we like to look at. It just doesn’t need to be driving the bus anymore.
Key Takeaways:
Breeding by coat color won’t move your index. Pigment genes like MC1R and COPA are far from the major milk and fertility loci, so selecting heifers based on “more white” doesn’t reliably improve Net Merit or Pro$.
Genomics doubled genetic gain—and sped up inbreeding. Sire generation intervals dropped from ~7 years to ~2.5 years, nearly doubling annual progress, but genomic inbreeding and runs of homozygosity are climbing faster per calendar year as a result.
Color matters for heat stress, not genetic merit. In hot climates and dry lots, darker coats absorb more solar load, pushing cows into heat stress sooner and costing milk, components, and fertility when cooling falls short.
Beef-on-dairy can add $4+/cwt when done right. HighGround Dairy’s 2025 modelling shows well-structured beef programs can add more than US$4.00/cwt to margins in favorable markets—real money that changes breeding math.
A $40 genomic test protects a $2,000 bet on a heifer. With rearing costs often US$1,800–2,500, using index rankings to decide who gets sexed semen and a replacement slot is risk management, not a luxury. Your eye then shifts to its best role: daily cow management and fresh-cow troubleshooting.
Executive Summary:
Many Holstein herds are still quietly letting coat color and “kind” influence breeding decisions, even though pigment genes like MC1R and COPA sit on different parts of the genome than the big milk and fertility loci that large Holstein GWAS keep identifying. Genomic selection has roughly doubled genetic gain in U.S. Holsteins by cutting sire generation intervals from about 7 years to about 2.5 years, but North American and Italian data also make it clear that genomic inbreeding and runs of homozygosity are rising faster per calendar year as a result. New heat‑stress research backs up what producers in hot regions and dry lot systems see every summer—darker coats absorb more solar load, cows hit heat stress sooner, and milk and components slip—while 2025 modelling from HighGround Dairy shows well‑designed beef‑on‑dairy programs can contribute more than US$4.00 per hundredweight of milk shipped to margins when markets are favorable. With heifer‑raising costs often in the US$1,800–2,500 (or CA$2,000–3,000) range, spending about US$40 on a genomic test to decide which calves actually justify that investment is, in many cases, simple risk management rather than a luxury. This article gives producers a concrete playbook: run a one‑year “test every heifer” trial, use one economic index as the main compass, use genomic mating tools to manage inbreeding, and align sexed Holstein and beef semen use with both index rankings and true replacement needs. The core message is that if you stop breeding by color and start breeding by genomics, heat‑stress realities, and beef‑on‑dairy math, you give your Holstein herd a much better shot at stronger per‑stall margins between now and 2030.
Complete references and supporting documentation are available upon request by contacting the editorial team at editor@thebullvine.com.
Learn More
Selective Breeding: The Art and Science of Beef-on-Dairy – Stop guessing at the bunk and start capturing market premiums. This breakdown delivers a field-tested protocol for selecting terminal sires that guarantee the carcass quality beef buyers demand, transforming your bottom-tier cows into high-margin profit centers.
Navigating the 2025 Dairy Economy: Maximizing Margins in a Volatile Market – Master the shifting financial landscape by aligning your herd expansion goals with current global supply trends. This analysis arms you with the economic foresight to hedge against rising input costs while maximizing your milk-to-beef revenue ratio through 2028.
Gene Editing and the Dairy Industry: Beyond the Horizon – Break past traditional breeding limits by leveraging CRISPR and slick-gene technology to heat-proof your herd. This deep dive exposes the genetic advancements that will define cow comfort and performance as climate volatility becomes the new normal for global producers.
The Sunday Read Dairy Professionals Don’t Skip.
Every week, thousands of producers, breeders, and industry insiders open Bullvine Weekly for genetics insights, market shifts, and profit strategies they won’t find anywhere else. One email. Five minutes. Smarter decisions all week.
In 2006, Francisco Rodriguez didn’t own a single registered cow. A decade later, he’d bred a World Dairy Expo Supreme—and realized his real mission wasn’t trophies, it was how he’d lived that decade.
Your next great cow isn’t going to show you everything as a fresh two‑year‑old. If you listen to Francisco—the fifth‑generation Colombian behind Shakira, Marsella, and a growing tropical genetics footprint—world‑class cows and world‑class herds still come together on a ten‑year clock, not on a single proof run.
Here’s the thing. We’ve just come through a year when GLP‑1 drugs chipped away at appetite and snacking, retailers in many countries started pushing “high‑protein, lower‑calorie” options, and milk buyers everywhere began talking a lot less about butterfat and a lot more about protein yield on the milk cheque. In many regions, cheese and powder prices spent parts of 2025 in uncomfortable territory, margin pressure stayed very real, and more than a few processors—from Europe to the Americas—sent letters that felt way too much like “we need less milk, and we’ll be more selective about who we keep.” A lot of solid family herds, whether they milk 80 cows or 800, spent the fall asking the same basic question: “Will my milk still have a secure home three years from now?”
In the middle of all that noise, Francisco is quietly saying, “Slow down. Think in tens, not twos.” And with what he’s actually done, that’s not a comment you just brush off at coffee time.
From Colombian Hills to Madison
The story doesn’t start at Madison. It starts up in the Colombian hills.
While most kids were wearing out video games or hockey cards, young Francisco was wearing out bull catalogues—Starbuck, Aerostar, all the big Holstein cow families memorized long before he ever owned a purebred. Vet school led to an internship at a progressive U.S. dairy, but when he went home, he didn’t look for a safe job. He started a tiny herd with his parents and a consulting business on the side, because in his head, he was going to be a breeder and an entrepreneur, not just an employee.
Newly married and already a team—Francisco and Sofia with Colganados D Avianca-Red, a class winner in Illinois. She would go on to score EX-96, win Reserve Grand at the Royal and Grand at the All-American, and take the Type & Production Award the same year Shakira was Supreme. Two cows, one Apple family, one Decade Rule.
In 2007, two things happened at once: Francisco joined DeLaval Colombia, and the family launched Colganados with just 10 cows. One simple line they lived by—start small, think big, keep the vision wide. Over the next decade, that little hillside pilot turned into one of Latin America’s better‑known Holstein breeding programs. By Francisco’s own tally, Colganados has bred around half of Colombia’s national champions in the last ten years, the herd has run near the top of the country for production, and they hold the highest classification score in their category. The herd grew from those original 10 milkers to roughly 400. Not bad for a kid who used to read catalogues instead of comic books.
Grand and Reserve together in Bogotá: Francisco and the Colganados team celebrate their Holsteins topping the Colombian National Show—another chapter in a program that now accounts for roughly half of the country’s champions.Lined up under the Colombian hills—the recent string of National Show grand champions bred by Francisco, visual proof that Colganados’ ten-year plan now delivers champions in multiples, not one-offs.
Then DeLaval calls again. It’s 2010, and they want him in Madison, Wisconsin, helping drive robotic milking with some of the biggest dairies in the world. He describes it as feeling like a local pilot being handed the keys to a Formula 1 car. He jumps anyway. By 2011, he’s landed in the U.S.—World Dairy Expo on the doorstep, mega‑herds and robots all around, and the very cow families he used to study in print now walking past his boots. All while Colganados keeps growing back home.
That same year, 2011, he bought clone genetics from the Apple family—Apple A1—from a breeder named John Erbsen. They didn’t partner on that deal; Francisco simply saw something special and moved on it.
That’s about when The Bullvine first wrote about him, in 2012, under the headline “Passion with a Purpose.” That same year, Francisco crystallized the vision: breed a world champion. Not just dream about it—actually map out what it would take. Back then, he’ll tell you, he mostly heard the “passion” part of that phrase. “Everything I do, I love, which is passion, but everything I do has a very strong why, which is purpose,” he says now. The core hasn’t really changed. What’s changed is where that purpose points—less toward proving he can win, more toward helping others do it, too.
Ask him for a racing analogy today, and he doesn’t say “pilot” anymore. “Now I want to be the leader of those pilots,” he laughs. The guy helping the next hungry 26‑year‑old land in a foreign country, stay grounded, and build something that lasts longer than one championship season.
How the Decade Rule Really Works
Looking at this Decade Rule he keeps talking about, it didn’t come out of a strategy workshop. It came in the shower at a Colombian show.
In 2025, when Marsella—that jet‑black Diamondback daughter out of the Jacobs Goldwyn Brittany family that he and his partner, U.S. breeder John Erbsen, had carefully put together—took Colombian National Champion and then Latin American Champion, Francisco did something a lot of us promised ourselves we’d do after COVID and never quite managed. He stopped and thought.
Marsella, Colombian National Champion 2025—the Diamondback daughter that brought Apple and Brittany together and gave the Decade Rule its name.
He walked the calendar backwards. From Marsella, standing at the top of Latin America, all the way back to the conversation with John about what to do with the Shakira cheque. Here’s the thing about that timeline: they sold Shakira in 2017, and Marsella won in 2025—eight years on paper. But the reality, as Francisco points out, is that the wondering started before Shakira even sold. By the time she was a calf, he was already asking, “What cow family is next?” That’s the only way you keep your product pipeline delivering consistently. Year after year, he’s developing new projects, not waiting for one to finish before starting the next.
Then he went back and checked Shakira’s timeline. In 2011, he bought the Apple A1 clone from John. In 2012, they aligned the vision of what it would mean to breed a world champion. By 2013, they’d become partners through Snapple. In 2014, they made the mating—O’Kalibra into that Apple blood, chasing a pretty specific picture in their heads. Shakira was born in 2015. There was never any illusion that he’d own the facility or show program to keep a real superstar cow at the very top. The strategy right from the start was: build the right calf, then find the right exhibitor and environment. They sold her in 2017. Fast‑forward to 2021, and Erbacres Snapple Shakira EX-97 is Grand Champion at World Dairy Expo. By 2023, she’s Supreme. From vision to Supreme banner—roughly a decade.
And Colganados itself? From that first milking cow in 2007 to their first Colombian National and Supreme Champion in 2017, they hit that same ten‑year arc. At some point, even the most genomics‑driven among us have to admit that’s more than luck.
So he finally gave language to what he’d been living: a ten‑year cycle in two five‑year chapters. Not as a fancy framework to sell in a course. Just as a way to explain to young breeders why nothing big really happens “by next show season,” even in a fast‑moving, genomic‑heavy industry.
The First Five Years: Wonder, Invention, Discernment
The first five years are the slow part. That’s where most of us either lose patience or get distracted.
He calls that half Wonder, Invention, and Discernment.
Wonder is where you hit pause long enough to ask, “Where’s the real opportunity for my herd, in my market, with my particular gifts?” For some readers, that’s still going to be show type and banners. For others, especially after a year where GLP‑1 use kept climbing and retailers kept leaning into high‑protein messaging, the “wonder” question sounds more like: “What if I targeted 4.1–4.3% protein and built my breeding and feeding program around solid, efficient components for a local cheese plant that suddenly cares a lot more about protein yield than raw volume?”
And for more farms every hot July, Wonder is becoming, “How do I get cows that don’t fall apart every time Ontario or Wisconsin feels like a Florida dry lot?” If you talk to producers in Ontario, Michigan, and Wisconsin, many will tell you the worst 2025 heat events cost them four to six pounds of milk per cow per day and made fresh cow management a real adventure—more retained placentas, more sluggish intakes, more cows standing instead of lying when the barn turned into a sauna. It’s no longer a southern issue.
Invention is about stopping daydreaming and actually building the recipe. Which cow families line up with that goal? Which bulls? What type of matings? What kind of business model sits underneath it? That’s where he looked at Apple and Brittany and said, “What if we put these two families together and repeat what worked with O’Kalibra x Apple—only this time on a Jacobs cow?” That’s Marsella’s origin story: Apple power built into a Brittany engine.
Discernment is the bit most of us like least, because it kills pet ideas. That’s where he forces himself to ask, “What roadblocks are going to sink this? Does this plan make sense with my land base, my cash flow, my show program, my health?” He knew he was never going to own the show barn Shakira needed to stay at the top, so working with Jacobs and putting her in an environment that matched her potential wasn’t an afterthought. It was baked into the vision before she ever walked into a trimming chute in Madison.
The Second Five Years: What Everyone Sees
The second five years are what everybody else sees on social media and in the ring.
He calls that Galvanizing, Enablement, and Putting All Things Together.
Once the calf is on the ground and he’s convinced the plan is on the right track, he starts to galvanize—get people’s eyes on her without turning it into empty hype. That might mean a flush or two, some show exposure, or just quietly letting the right breeders know she exists. It’s not “influencer marketing”; it’s the old‑school version of letting the industry see a genuinely interesting young cow.
Enablement is where the cow becomes an athlete. That’s fresh cow management, comfort, nutrition, trimming, breeding, and, in the show world, fitting and travel. In Shakira’s case, Enablement meant placing her in the Jacobs program, where the environment, the barn culture, and the show miles had all been proven on other big cows. If you’ve ever watched a good cow fall short because the environment wasn’t there—wrong feed, wrong stalls, wrong show crew—you know why he treats that step like a non‑negotiable.
Putting All Things Together is what it sounds like—the part where effort, environment, cow comfort, and, as he’ll tell you without blinking, God’s blessing all line up on the same day. Looking back across his career, most of the cows that “fit” his Decade Rule hit their true peak around 5 years old. If you think back to the cows that stick in your own memory, you’ll probably see the same pattern.
He’s pretty blunt that there’s nothing mystical about this. It’s just his answer to a dairy world that fell in love with instant genomic gratification and short‑term ROI while still quietly dreaming of producing a once‑in‑a‑lifetime cow. “If it was just numbers,” he says, “anybody with a calculator could make champions.” When you talk to top herds in Wisconsin or Quebec that have been consistent for decades, you hear a lot of nodding in that direction, even from the ones running plenty of genomic bulls.
And that’s the key point: he’s not anti‑genomics at all. He uses them the way a lot of serious herds do now. He starts with cow families and breeders he trusts—families he’s seen transmit over multiple generations—and then uses both genomic and daughter‑proven numbers as a tiebreaker between bulls. Milk, fertility, health traits, functional type, all of it. But the first filter is still the dam, the sire stack, the breeder’s track record, and his own eye.
That last piece goes back to a car ride and an Angus show.
Champions, Clean Shirts, and What Really Matters
Years before he owned a Holstein, Francisco was in the Angus business and needed a hoof trimmer before a national show. Someone told him that Canadian Holstein legend David Brown happened to be living nearby. Francisco called. David’s answer was classic: “A cow is a cow.” He climbed in the truck.
Somewhere between farms, Francisco asked, “You’ve made so many champions—what’s the secret?” Brown told him, “Champions are made out of your eye, not out of the numbers. You really want to create champions? Look at the mother, look at the sire, look at the breeding pattern. That’s how you do it.”
Later, working with John Erbsen, Francisco picked up another line: “Better late and right than early and wrong.” He’s repeated that to a lot of younger breeders.
Put those two ideas together, and you get a guy who line‑breeds to Apple without losing sleep—two hits through Altitude in Shakira, two shots of Apple in Marsella, even more Apple in Delia—and just smiles when people say he’s crazy. His attitude is, “If a cow line‑breeds well, go for it without fear.” And it’s hard to argue with that when you look at how those cows have performed on the tanbark.
What really sticks with people, though, isn’t the theory. It’s how he lives it in the ring.
Francisco walks Erbacres Snapple Shakira as a bred heifer at World Dairy Expo 2016—white shirt spotless, heifer scrubbed, grinning like he’d already won. “Every time I walked in the ring with her, I was Supreme Champion,” he says. “Maybe she wasn’t yet. But I was.”
One of his favourite photos—and one a lot of us have seen floating around—shows him walking Shakira out of the ring as a yearling at World Dairy Expo. She didn’t win. She wasn’t the “hot” heifer that day; she carried a bit more condition and substance than the class favoured at the time. But you wouldn’t know it from his face. White shirt spotless, jeans clean, heifer scrubbed whiter than the wash pen, and he’s grinning like she just won Supreme.
Erbacres Snapple Shakira-ET, 2021 World Dairy Expo Supreme Champion. A decade from dream to purple blanket—and proof that vision, partnerships, and patience can outrun capital.
“Every time I walked in the ring with her, I was Supreme Champion,” he says. “Maybe she wasn’t yet. But I was a champion.” For him, that moment was about the kid from the mountains who, in 2006, didn’t own a single registered cow and used to fall asleep studying North American sales catalogues. Just walking into that ring with a homebred heifer was the dream he’d carried for twenty years.
When she finally did win, it didn’t flip some switch in him. When Jacobs had her dialed under the willows and cars were honking, people were literally chanting “Shakira” from the road, as if she were a pop star, he says he mostly felt gratitude. Gratitude for God, for his partners, for his family. “God loves me,” he wrote later. “To be that big in such a short time with such an amazing cow—it’s almost a miracle.”
Family and partners on the tanbark: Francisco, his parents, his wife, his daughter, and John Erbsen stand with Erbacres Snapple Shakira at World Dairy Expo—the moment the Decade Rule wore a purple blanket.
So then the practical question becomes: what do you do with a cheque like that?
Reinvesting the Shakira Cheque
This is where his breeder brain kicks back in.
He’ll be the first to tell you he likes experiences. He’s proud that his daughter has already traveled to more than ten countries by age six. But when Shakira sold in 2017, his first real instinct was, “We need to reinvest part of this back into the next chapter.” In his words, “Reinvest in your business.”
He and John did what serious cow people do: they went looking for the next family. They jumped on a plane to Quebec with their friend and agent, Norm Nabholz, and walked into Jacobs Holsteins with Brittany on the brain. At that point, Brittany wasn’t yet the industry icon she is now, but Francisco had watched enough to feel she’d become theJacobs cow in time. Beauty, the Sid daughter of Brittany, had just won at Madison, and he liked what Sid was doing on that cow.
They bought Bermuda, the Sid heifer out of Brittany, brought her to the States, and pushed her to VG‑87 as a two‑year‑old. Then they flushed her to Avalanche to bring Apple blood into the family—basically rerunning the O’Kalibra x Apple playbook with a different cow as the engine.
Three generations of belief in one frame: Francisco, his parents, his wife, and Sigal stand with Apple PTS Crannapple-RED-ET-EX-92, the last Apple daughter, at World Dairy Expo— Apple, the cow family that turned a Colombian dream into a global mission.
Some embryos stayed in the U.S. Four went down to Colombia. One of those became Colganados Avalanche Beauty—EX‑93, a tremendous uddered cow who, in Francisco’s eyes, still needed more raw power. For that, he reached for Diamondback: more strength, plus another shot of Apple. That mating created Marsella, the cow he now describes as “the best of Apple with the best of Brittany,” and the one that pulled the Decade Rule into focus when she won Colombia and Latin America in 2025.
What’s interesting here is that if you ask him to unpack that strategy, he barely talks in terms of individual proof numbers. He talks about families. How Apple line‑breeds. What Brittany throws. How certain crosses just keep landing on the right kind of cow. Then he fills in the rest of the picture by doing what a lot of top breeders quietly do over Christmas: sending late‑night texts to people like Mike Duckett or Jordan Siemers and asking, “How does this family really breed? Which side of the pedigree do you trust more?”
That’s pretty much how many serious herds are using genomics in 2026. They lean on the numbers to sort among bulls and to keep an eye on inbreeding, fertility, and health. But they’re still starting with cow families, breeder reputation, and what their own eyes and records tell them.
The Colganados crew in the Colombian hills—the people behind the Decade Rule, proving that world-class cows are always a team project, never a solo act.
From Doer Mode to 25–25–25–25
Now, all of that is great ring‑side talk. Where Francisco’s story really bumps up against 2025‑style farm stress is at home.
He’s pretty honest that, for a long stretch, he lived in “doer mode.” Non‑stop traveling for DeLaval. Building robotic projects. Growing Colganados. Launching side businesses. Dreaming up tropical projects in hotel rooms. Meanwhile, his wife, Sofia, was on a completely different wavelength: focused on health, mindset, homeschooling their daughter, and keeping her inner and outer lives aligned.
Like a lot of dairy marriages that went through COVID, that gap eventually hit a breaking point. “Francisco, I’m done. I need to go back home,” she told him. When he tried the classic husband question—”Is that an option or a decision?”—she made it clear: it was a decision.
That hits pretty close to home for a lot of producers who spent 2025 staring at margin squeezes, labour headaches, interest rates, and buyer uncertainty. It’s one thing to grind when milk’s solidly over $20, and everyone’s calling it a golden age. It’s another when every cost line is creeping up, your fresh cow pen is a constant triage zone, and your processor is hinting about future volume cuts.
Out of that whole crucible, he thought about something Michael Jordan once said: “You can’t be successful in just one area. Success means being successful in all areas.” That line stuck. From it, Francisco built a simple operating system for his life: 25% You, 25% God, 25% Relationships, 25% Create.
“You” is self‑knowledge, health, mindset—the 3:30 a.m. routine of prayer, meditation, and study that he says became non‑negotiable in 2025 when everything else felt shaky. “God” is his faith and his effort to live like the servant‑leader he sees in Jesus. “Relationships” is being the husband, father, son, and partner he actually wants to be remembered as. Only then comes “Create”—the businesses, cows, and projects.
“In the past, business was 80%,” he admits. “Now it’s 25%.”
At the center of that shift is Sofia, the person he calls “the most aligned human I know, for sure after Jesus.” She was the one dragging the family toward reflection, health, and alignment years before he was ready. Once he finally joined her there, through some tough moments—he says their family and business life suddenly felt “magically” aligned again.
Desert days, not just dairy days—Francisco, Sofia, and Sigal outside Dubai, living the 25-25-25-25 rule that puts family and experiences on the same level as business.
The way he talks about raising their daughter, Sigal, really shows how much his definition of success has changed. She’s homeschooled and “unschooled,” as he phrases it—not drilled on tests, but hauled along on real‑world experiences in over ten countries. At a show in Cremona, he handed her a calf and said, “You’re leading.” Just before they walked in, she whispered, “Daddy, why are my legs shaking?” He laughed and said, “That’s something all of us feel sometimes.” When they came back out, she asked the question he’d coached her to ask: “Did I do it with excellence?” His answer: “You did it with excellence.”
Sigal Rodriguez takes her calf into the ring at Cremona, with Francisco just behind her—a quiet reminder that his Decade Rule now starts with the next generation, not the next banner.
For a guy who has a Supreme banner on his résumé, you notice how often he circles back to that six‑year‑old in white pants. For him, that’s the heart of the whole winning vs. fulfillment conversation. “Winning is momentary,” he says. “Fulfillment is feeling at peace with yourself, win or lose. That’s what lets you get back up and show again next year.”
Embryos Are Transformation, Semen Is Evolution
What’s happening across the tropics might feel a long way from a tie‑stall in Ontario or a freestall in Wisconsin, but it’s worth paying attention to.
Francisco’s current vision with Proterra sits squarely in that world. If you look at places like Nigeria, most sources put the national dairy herd north of 20 million cattle, but with average milk yields in the ballpark of a liter or two per cow per day. Puerto Rico has historically imported the vast majority of its beef—older USDA and academic work pegged meat imports extremely high—and local industry folks have talked about needing hundreds of thousands of mother cows if they ever want to get serious about self‑sufficiency.
You don’t move those kinds of numbers with one more round of AI on whatever cows happen to be in the pasture. Francisco’s one‑liner for that reality is, “Embryos are transformation, semen is evolution.”
Here’s what he means—and it’s important to understand where this applies. For purebred programs, you can use embryos to transform a herd in a single generational leap. Say you’re running conventional, average Holstein genetics and you want to shift to high‑quality, heat‑tolerant, A2A2 genetics. Embryo transfer gets you there fast. Once that new genetic base is established, semen takes over—slowly, steadily evolving the herd generation after generation.
The tropical F1 crosses are a different story. With Girolando (Gyr x Holstein) or Brangus, you’re always producing F1 animals with F1 embryos—that’s the product. You go from a local zebu cow giving a liter or two to a well‑bred Girolando that can realistically reach double‑digit production under decent management. Yes, the per‑pregnancy cost is higher than a straw of semen. But when you’re doubling or tripling output in one generation, the math starts to look very different.
Francisco in his element on home turf—showing a Grand Champion Gyr in Colombia and proving that his Decade Rule mindset applies just as much to tropical genetics as it does to Holsteins in Madison.
Proterra’s running versions of these models in Puerto Rico, parts of Latin America, parts of Africa, and, interestingly enough, on some U.S. dairies using beef‑on‑dairy and heat‑tolerant Holstein crosses as part of their long‑term risk management.
From the barn to the boardroom—Francisco representing Proterra Genetics at a global food summit in Dubai, taking his “embryos are transformation, semen is evolution” message straight to the people shaping tomorrow’s supply chains.
They’re not doing it alone, either. Names Bullvine readers know—ST Genetics, Colombian‑born innovator Juan Moreno and his long history with sexed semen, and U.S. dairy leader Mike McCloskey—are all tied into different pieces of the puzzle. Francisco likes to say he sees McCloskey as the “Steve Jobs of the dairy industry” and himself as the student, which tells you a bit about how he tries to approach those partnerships.
Juan Moreno, Mike McCloskey, and Francisco Rodriguez off the coast of Puerto Rico—where “embryos are transformation” isn’t just a philosophy, it’s the business plan.
So why should a 90‑cow tie‑stall in Bruce County or a 900‑cow freestall in Wisconsin care what happens with Girolando embryos in Puerto Rico?
Because the same forces—heat, protein focus, efficiency pressure—are working their way north, just in different clothing. Producers across Ontario and the upper Midwest will tell you that the worst 2025 heat events cost them real milk and created headaches in dry cow pens, fresh cow transitions, and lame cow numbers. Research crews keep publishing papers that confirm what we see in the barn: heat‑stressed cows give less milk, eat less, lie less, and get bred back harder.
On top of that, with GLP‑1 use still projected to grow and retailers experimenting with “high protein, lower sugar” messaging, there’s an obvious scenario where processors lean harder into protein value over straight volume. A cow that keeps eating, lying down, and milking on those nasty July afternoons—while still putting out very solid protein and decent butterfat—isn’t just a nice‑to‑have. She’s part of your ability to keep shipping profitable milk into the late 2020s.
Francisco’s basic read is simple: if we all know this decade is going to be defined by protein efficiency, heat tolerance, and cost control, then keeping your breeding plan and barn design stuck in 2012 is a risky way to roll the dice. He’s not saying everyone should suddenly switch to Girolando. But he is saying, “Start folding traits like heat tolerance, fertility, and functional strength into your plan now. And be honest about cow comfort—air, shade, space, footing—because that’s where your genetics actually get to pay you.”
What This Means for Your Next Ten Years
So, sitting around a table at World Dairy Expo, what would all this mean for your semen tank and your next ten years?
First, he’d probably ask you where you are in your own decade. Are you in year two of a new direction—still in that Wonder and Invention phase—or in year eight, where, if the plan is sound, you ought to be starting to see the first big fruits of it? If you’re only three years into chasing a new show‑type profile or a different component target, beating yourself up because you don’t have a Marsella yet is pretty pointless. In his world, the really big outcomes almost never show up before year ten.
Second, he’d nudge you to flip how you use genomics. Start with the cow families and breeders you actually trust. Use your own eyes, your own DHI reports, your own fresh cow notes. Then, once you’ve narrowed it down to two or three bull options, let the numbers break the tie. That approach—blending art and science—is exactly what a lot of respected herds in Wisconsin, Quebec, and western Canada say they’re doing quietly in 2026, even while neighbors chase whatever’s at the top of the list every proof run.
Third, he’d tell you to treat the environment like it’s another trait you’re breeding and investing for. Ask, “What kind of summers am I likely to see between now and 2036?” not “What were summers like back in 2010?” If you’re already seeing cows back off feed, stand more than they lie, or struggle to rebreed on the worst weeks, start planning now for a mix of heat‑tolerant genetics and barn changes—fans, sprinklers, more airspeed, less overcrowding, better flooring. Those changes compound over a decade, just as smart breeding does.
And finally, he’d probably circle back to that 25‑25‑25‑25 framework. Not because it’s catchy, but because he’s watched enough talented people crash and burn. The herds that will still be around—and still want to be around—in 2036 won’t just be the ones with the biggest robots or the highest ECM. They’ll be the ones where the owners still talk to each other, the kids still want to be in the barn at 5:30, and the passion for cattle hasn’t been suffocated by a never‑ending list of fires to put out. For some families, that might mean making time for a kid’s 4‑H show even when the bunker needs covering. For others, it might mean carving out actual days off or accepting that “enough cows” is a valid goal.
As he tells teenagers who message him from Colombia, Europe, or small North American towns with big dreams and very little capital: “If someone tells you to be realistic, you’re talking to the wrong person. Surround yourself with dreamers, visionaries, doers, leaders.”
Winning is nice. Milk cheques matter. But in a decade where everything from GLP‑1 drugs to brutal heat waves is trying to knock you off balance, the question Francisco throws back at all of us in 2026 is pretty simple:
Are you breeding—and living—for the next ribbon, or for the next ten years?
KEY TAKEAWAYS
The Decade Rule works: Shakira took roughly ten years from vision (2012) to Supreme (2023). Marsella, Colganados—same pattern. World-class results don’t happen “by next show season.”
Use genomics as a tiebreaker, not a starting point: Start with cow families and breeders you trust. Narrow it to two or three bulls. Then let the numbers break the tie.
Heat tolerance and protein efficiency are the traits of this decade: GLP-1 drugs are shifting demand toward protein. Heat stress is costing farms 4–6 lbs/cow/day. The cows that stay profitable are the ones that keep eating and milking when July turns brutal.
25-25-25-25: Inspired by Michael Jordan’s line that “you can’t be successful in just one area,” Francisco now divides his life equally into You, God, Relationships, and Create. Business dropped from 80% to 25%. Burnout isn’t a badge of honor.
A kid from the Colombian hills bred a Supreme Champion: Francisco started with 10 cows and bull catalogues. Vision, partnerships, and patience got him to Madison’s colored shavings. Capital helps, but it’s not the only path.
EXECUTIVE SUMMARY
In 2006, Francisco Rodriguez didn’t own a single registered cow. By 2023, he’d co-bred Apple-CR Shakira Red to World Dairy Expo Supreme Champion—and realized the journey mattered more than the banner. His “Decade Rule” framework, drawn from tracking Shakira (2012 vision → 2023 Supreme), Marsella, and Colganados through roughly ten-year arcs, challenges an industry chasing quick genomic wins: start with cow families you trust, use numbers as a tiebreaker, and accept that world-class results don’t arrive “by next show season.” That message lands differently in 2026, with GLP-1 drugs shifting demand toward protein, heat stress costing farms 4–6 lbs/cow/day, and processors tightening contracts from Europe to the Americas. Beyond breeding, his 25-25-25-25 life framework—You, God, Relationships, Create—emerged when his wife told him she was done and he had to rebuild from the inside out. For breeders wondering whether to chase the next ribbon or build something that lasts a decade, Francisco’s path from the Colombian hills to Madison’s colored shavings is both proof and provocation.
Continue the Story
The Farnear Formula: How Strategic Thinking Built a Sixty-Year Dairy Dynasty – The Farnear family walks a similar path of conviction, proving that genetic excellence is a sixty-year foundation. Their story echoes Francisco’s belief that long-term strategic thinking always outlasts the noise of a single proof run.
Erbacres Snapple Shakira – The New International Superstar – This chapter carries forward the moment Francisco’s dream met reality. It captures the same spirit of partnership and persistence that transformed a kid with a bull catalogue into the breeder of an global icon.
The Sunday Read Dairy Professionals Don’t Skip.
Every week, thousands of producers, breeders, and industry insiders open Bullvine Weekly for genetics insights, market shifts, and profit strategies they won’t find anywhere else. One email. Five minutes. Smarter decisions all week.
Did genomics really deliver what you think it did—or is that extra $238,000 in profit still stuck in your semen tank?
Let’s sit with a big number for a minute: a couple thousand dollars more lifetime profit per cow. That’s the kind of difference Lactanet uses in its Pro$ examples when it compares daughters of today’s high‑Pro$ sires to daughters of a decade older, lower‑ranking bulls, because Pro$ is built to reflect expected lifetime profit per cow based on real Canadian revenue and cost data up to six years of age or disposal.
If you spread that kind of genetic advantage across a few hundred cows over several breeding seasons, you’re quickly into tens of thousands of dollars in extra lifetime profit per year, the result of breeding decisions—assuming your fresh cow management, herd reproduction, and culling strategy actually lets those genetics show up in the tank.
That’s not hype. That’s the math behind Pro$, and it aligns with what genomic selection has achieved globally, where genetic progress in milk, fat, protein, health, and longevity has accelerated by 50–100% compared with the pre‑genomic era.
What’s interesting, though, is that when you start peeling back the layers on how we got here, you see both huge wins and some red flashing lights—especially around diversity, fertility, and hidden genetic risks.
That’s what this conversation is really about.
When Banners Steered the Breeding Bus
If you look back 15–20 years, you can probably still picture the late‑2000s bull lists. In Canada, Holstein Canada sire‑usage data from that era show a relatively tight group of sires—Goldwyn, Buckeye, Dolman, and their close relatives—accounting for a significant share of registrations.
In 2008, just three bulls (Dolman, Goldwyn, Buckeye) accounted for about 12% of all registered Holstein females in Canada, and the top five sires together made up roughly 15.7% of registrations. That kind of concentration perfectly reflected the breeding philosophy of the time: moderate yield, “true type” conformation, and pedigrees that lit up both classifier sheets and show‑ring banners, but not always the enterprise balance sheet.
On many commercial freestall and tie‑stall farms, those cows were often the ones that:
Struggled harder through the transition period
Needed more care of their feet and legs
Didn’t routinely make it to that profitable fourth or fifth lactation
That isn’t just coffee‑shop talk. Work from the University of Guelph and Agriculture and Agri‑Food Canada has consistently shown that lifetime profitability is closely tied to lifetime milk revenue, length of productive life, days dry, age at first calving, and reproductive-related interventions. Cows that leave early, spend more time open, racking up vet bills, and simply don’t deliver their potential lifetime profit—even if they look great and milk well in first lactation.
Producers like Don Bennink at North Florida Holsteins have been lightning rods on this topic for years. He’s been very blunt that high production, strong health traits, and feed efficiency are the bywords for breeding profitable cows—not show ribbons—and that genomics has “increased our progress at a rate we could never have dreamed of previously,” creating a huge profitability gap between herds that use genomic information and those that don’t.
So even before we talk about SNP chips and genomic proofs, there was already a clear split between what wins banners and what pays bills in freestalls, robots, parlors, and dry‑lot systems.
From Pedigree and Type to Profit and Function
The Canadian Holstein breeding landscape has gone through one of the most profound shifts in its history since about 2008. Over 16 years, selection has moved from pedigree‑driven, visually focused decisions to a much more complete “facts‑first” approach that prioritizes profitability, health, and functionality based on accurate animal and herd data.
You can see this change clearly in which sires actually sired the most daughters in Canada. In 2008, the most‑used 20 sires accounted for about 33.5% of all registered females, and the average “top‑sire” had over 4,300 daughters. By 2024, that share dropped to around 22.6%, and the average daughters per top sire fell to roughly 2,984. At the same time, the top five sires in 2024 (Pursuit, Alcove, Lambda, Fuel, Zoar) represented only about 9.1% of registrations—down from that 15.7% level in 2008.
Overview of Top Sires of Canadian Holstein Female Registrations
Category
2008
2012
2016
2020
2024
Total Female Registrations
257,040
272,264
273,785
297,192
263,149
Five Sires with Most Daughters
Dolman
Windbrook
Impression
Lautrust
Pursuit
Goldwyn
Fever
Superpower
Impression
Alcove
Buckeye
Steady
Jett Air
Alcove
Lambda
Frosty
Lauthority
Dempsey
Bardo
Fuel
Sept Storm
Jordan
Uno
Unix
Zoar
Percent of Registrations
– Top Five Sires
15.70%
14.80%
7.30%
7.50%
9.10%
– Top Ten Sires
23.70%
22.20%
13.50%
12.60%
14.90%
– Top Twenty Sires
33.50%
30.10%
22.20%
20.20%
22.60%
– Top Thirty Sires
39.90%
34.70%
28.10%
25.90%
28.70%
Top Twenty Sires – avg # Daus
4,309
4,093
3,035
3,001
2,984
Highest Ranking Genomic Sire
30th
27th
8th
6th
5th
No. Genomic Sires in Top Ten
0
0
1
4
5
Percent of Sires – A2A2
20%
25%
35%
50%
60%
That’s not a “bull of the month” world anymore. That’s breeders intentionally spreading genetic risk, targeting specific trait profiles, and using more bulls per herd for shorter periods, while still driving genetic gain.
The underlying philosophy has evolved from two narrow extremes—high‑conformation or high‑milk two‑lactation cows that were often culled early—to a more complete target: four‑plus‑lactation, healthy, fertile, self‑sufficient, high‑solids cows that can survive modern housing, automation, and economic pressure.
What Genomics Actually Changed
When genomic evaluations hit around 2008–2009, they blew the doors off the old progeny‑testing model. Researchers like Adriana García‑Ruiz and Paul VanRaden, working with US national Holstein data at USDA‑AGIL, showed that once genomics was adopted, sire‑of‑sons generation intervals were effectively cut in half, dropping from roughly 6–10 years down to around 2.5–3 years. Canadian data tracked the same pattern.
That shorter generation interval, combined with higher selection intensity and more accurate young‑animal evaluations, is exactly why genetic gains picked up speed. Analyses of Holstein breeding programs published in the Journal of Dairy Science and the Proceedings of the National Academy of Sciences report:
50–100% higher rates of genetic gain for milk, fat, and protein in the genomic era
3–4x higher genetic progress in some health and productive‑life traits between 2008 and 2014
Metric
2008 (Progeny-Testing Era)
2024 (Genomic Era)
Average LPI (Top 20 Sires)
1,985
3,531
Average Pro$ (Top 20 Sires)
-$1,558
+$1,978
Milk Proof (kg)
-578
+860
Fat Proof (kg)
-33 (-0.10%)
+85 (+0.31%)
Protein Proof (kg)
-27 (-0.07%)
+50 (+0.15%)
Top 5 Sires’ Market Share
15.7%
9.1%
Daughters per Top Sire
4,300
2,984
Top 20 Sires’ Market Share
33.5%
22.6%
Inbreeding (Top Sires’ Daughters)
~9.5%
11.5%
Canada’s own data comparing bull April 2025 indexes on the 20 most‑used sires, 2008 vs 2024, makes this very real:
The average LPI of those bulls climbed from about 1,985 in 2008 to around 3,531 in 2024—roughly +97 LPI points per year.
Pro$ swung from about –$1,558 in 2008 to about +$1,978 in 2024—roughly +$221 per year in predicted daughter lifetime profit.
Average proofs for those sires went from roughly –578 kg milk, –33 kg fat (–0.10%F), and –27 kg protein (–0.07%P) in 2008 to about +860 kg milk, +85 kg fat (+0.31%F), and +50 kg protein (+0.15%P) by 2024.
That works out to about +90 kg of milk, +7.4 kg of fat, and +4.8 kg of protein in genetic improvement per year in the bulls that Canadian Holstein breeders actually used the most.
Year
LPI
Pro$
2008
1,985
-$1,558
2010
2,180
-$980
2012
2,420
-$340
2014
2,690
+$230
2016
2,875
+$650
2018
3,045
+$1,040
2020
3,210
+$1,380
2022
3,375
+$1,680
2024
3,531
+$1,978
Put simply: genomics, combined with LPI and Pro$, did exactly what it was supposed to do in Canada—faster genetic gain for production and overall profit.
Indexes for Twenty Sires with the Most Registered Daughters
Year
LPI
Pro$
Milk
Fat / %F
Protein / %P
CONF
Mammary
Feet & Legs
D Strength
Rump
2008
1985
-1558
-578
-33 / -.10%
-27 / -.07%
-6
-6
-4
1
0
2012
2378
-728
-415
-14 / .01%
-17 / -.02%
1
-1
0
4
3
2016
2680
173
130
6 / .00%
2 / -.05%
1
0
1
2
3
2020
3054
1016
555
45 / .21%
25 / .04%
5
3
3
4
4
2024
3531
1978
860
85 / .31%
50 / .15%
8
6
8
7
5
Change/Year
97
221
90
7.4
4.8
0.88
0.75
0.75
0.38
0.31
*Lactanet Indexes Published in April 2025
Where biology pushes back is on which traits move fastest. Higher‑heritability traits like milk, fat, and protein, as well as major type traits, make faster genetic progress than lower‑heritability traits like fertility, health, and productive life. Genomics improves accuracy across the board, but when semen catalogs and marketing materials still lead with production and type, it’s easy for those traits to keep outrunning fertility and health on the genetic trend lines.
That’s how we end up with a proof landscape that shows: extreme strength in production and conformation, modest but improving gains in fertility and health, and some nagging functional issues that still frustrate producers.
The Diversity Question: Are We Painting Ourselves Into a Corner?
One major concern that doesn’t appear directly on a proof sheet is genetic diversity.
Geneticists talk about effective population size—the number of prominent sires contributing progeny, especially genomic sires entering AI programs and daughters being used as bull dams. Dutch and Italian Holstein genomic studies have examined this closely. In one well‑cited Dutch‑Flemish analysis, effective population size in AI bulls born between 1986 and 2015 ranged from about 50 to 115 prominent sires at different periods, with lower values during times of intense selection. Italian and Nordic Holstein work using both pedigree and SNP data has reported similar patterns—effective population sizes are often below 100, with prominent sires trending downward in the genomic era.
International guidelines from the FAO and genetic diversity experts generally suggest that an effective population size of 100 or more prominent sires is acceptable. Values below about 50 for prominent sires raise concerns about inbreeding depression and lost adaptability.
At the same time, genomic and pedigree analyses across multiple countries have shown that inbreeding is rising faster each year in the genomic era—often increasing by 0.3–0.5 percentage points annually. At current generation intervals, that can mean 1.5–2.5% per generation. Pedigree studies summarized by Chad Dechow at Penn State and reported in Hoard’s Dairyman have also highlighted how a disproportionate share of modern Holstein ancestry traces back to just a handful of bulls (Chief, Elevation, Ivanhoe), underlining how concentrated the global gene pool has become.
In the Canadian context, that broader story plays out in very practical ways. The 20 most‑used sires in 2024 have daughters with an average inbreeding coefficient of about 11.5%—above a Holstein breed average already considered uncomfortably high at around 10.6%. That means the bulls delivering the most genetic progress on paper are also nudging herds further into undesirable inbreeding territory.
Practically, if you always grab the top two or three bulls on the list:
You’ll quickly improve your herd’s genetic level.
While you’ll also make your heifers more closely related to each other, especially if those bulls also share cow families.
On farm, that’s when inbreeding starts to show up in ways you feel: more fertility trouble, more health events, and cows that don’t seem as robust as the previous generation—even while milk solids and type keep improving.
Hidden Passengers: Haplotype and Recessive Stories
Another layer that genomics exposed is fertility haplotypes and single‑gene defects.
Over the past decade, collaborations between the USDA’s Animal Genomics and Improvement Lab, European institutes, and AI organizations have identified several Holstein haplotypes—HH1, HH2, HH3, HH4, HH5, HH6—and defects like cholesterol deficiency (CD/HCD) that are tied to embryonic loss or weak calves.
The pattern is pretty straightforward:
These haplotypes are stretches of DNA where homozygous calves (same version from sire and dam) often die early in gestation or are born weak and fail to thrive.
Carrier frequencies in many national populations sit in the low single digits but can reach 5–10% for some haplotypes in certain birth years and cow families.
The cholesterol deficiency story is a good cautionary tale. CD traces back to lines including Maughlin Storm and involves a mutation affecting fat metabolism; affected calves often die within weeks due to diarrhea and failure to thrive, while carriers look normal and can be high‑index animals.
The good news:
Major AI studs routinely test their bulls for these defects, and they, their breeds, and genetic evaluation centers publish the carrier status of animals.
Mating programs can automatically avoid carrier × carrier matings once herd and sire statuses are known.
If you don’t use those tools, the math can quietly bite you. Even a few percent of pregnancies lost to lethal combinations in a 400–500 cow herd can mean thousands of dollars in dead calves, extra breedings, and longer calving intervals each year—losses that are largely avoidable with the data breeders already have access to.
The 2025 Modernized LPI: A Better Dashboard
All of this—faster genetic gain, tighter diversity, more trait data, and new environmental pressure—is why genetic evaluation systems are updating how they calculate and present information.
In Canada, Lactanet launched a modernized Lifetime Performance Index (LPI) framework in April 2025. The old three‑group structure (Production, Durability, Health & Fertility) was replaced with six subindexes for Holsteins and five subindexes for the other breeds:
Production Index (PI)
Longevity & Type Index (LTI)
Health & Welfare Index (HWI)
Reproduction Index (RI)
Milkability Index (MI)
Environmental Impact Index (EII)
For Holsteins, these subindexes carry specific weightings in the new LPI formula: about 40% on Production, 32% on Longevity & Type, 8% on Health & Welfare, 10% on Reproduction, 5% on Milkability, and 5% on Environmental Impact. As well, Lactanet has an online routine where breeders can rank bulls by assigning their own weightings for the subindexes.
Two important comfort points from Lactanet:
The correlation between the current and modernized LPI is expected to be around 0.98, so the bulls you like don’t suddenly become “bad”—their strengths and weaknesses just become more visible.
Splitting Health & Fertility into Health & Welfare and Reproduction, plus the creation of a separate Milkability subindex, allows new traits such as calving ability, daughter calving ability, milking speed, temperament, and environmental traits (such as feed and methane‑related efficiencies) to be properly handled in the indexing.
For a lot of producers, the practical value is this: you can now see at a glance where a bull stands not only on overall LPI or Pro$, but on:
Reproduction
Health & Welfare
Environmental footprint
On separate scales, without having to decode 20 individual trait proofs.
What the Top 2024 Sires Miss—and What That Means for 2026 Matings
Here’s where the Canadian sire usage data really tells a story.
April ’25 Indexes for Twenty 2024 Sires with Most Registered Daughters
Category
Avg Index
Index%RK
Range in %RK
% Sires Below AVG
Lifetime Performance Index (LPI)
3531
98%RK
81 – 99 %RK
0%
Production Subindex (PI)
659
93%RK
70 – 99 %RK
0%
Longevity & Type Subindex (LTI)
678
98%RK
57 – 99 %RK
0%
Health & Welfare Subindex (HWI)
500
50%RK
02 – 93 %RK
60%
Reproduction Subindex (RI)
450
29%RK
01 – 65 %RK
75%
Milkability Subindex (MI)
516
52%RK
10 – 92 %RK
45%
Environmental Impact Subindex (EII)
475
40%RK
02 – 96 %RK
75%
When you line up the 20 sires with the most registered daughters in 2024 and score them on the new subindexes, you get a clear pattern:
They’re elite for LPI, Pro$, the Production, and the combined Longevity & Type subindexes.
They’re roughly breed average for Health & Welfare and Milkability subindexes.
They’re significantly below the breed average for Reproduction and Environmental Impact subindexes.
Their daughters are running about 11.5% inbreeding vs a breed average of 10.6%.
In plain language:
We’ve done an excellent job selecting bulls that lead the pack in production, type, and overall profit indexes.
We’ve been less aggressive on fertility, cow survival under stress, and environmental footprint.
The bulls that did the most “work” in Canadian herds in 2024 also nudged inbreeding higher.
That sets up the key question for 2026: What are you going to do when you breed those daughters?
If you continue stacking similar high‑production, below‑average‑fertility, high‑relationship sires on top of them, you’ll keep moving LPI and Pro$ up—but you may also:
Push inbreeding higher.
Put more strain on reproduction and transition‑cow programs.
Lag on traits processors and regulators are starting to reward, like feed efficiency and methane‑related performance.
The alternative is to stay aggressive on genetic gain where it matters most for your herd, while using the new LPI subindexes and genomic tools to protect functional traits and diversity.
It’s worth noting that many AI companies are now actively promoting outcross or lower‑relationship bulls and subindex “balanced” sires to help address future genetic needs. Those options are on the semen delivery truck—it just comes down to whether we actually use them.
What Progressive Herds Are Doing Differently
Across Canadian Lactanet‑profiled herds, US herds highlighted in Hoard’s and Dairy Herd, and European setups facing tight environmental rules, the most progressive operations tend to do four things with their breeding programs.
1. They Don’t Stop at the Top Line Index
Most of us have, at some point, just circled the top two or three bulls on our preferred total merit index list—LPI, Pro$, Net Merit, etc.—and then called it a breeding plan. It’s quick—and to be fair, it used to work “well enough.”
The herds that are pulling ahead now ask:
What are my top three herd problems right now—reproduction, mastitis, lameness, culling age, transition disease?
How do those problems line up with the Reproduction, Health & Welfare, Longevity & Type, and Milkability subindexes?
Then they pick bulls that are high enough on LPI/Pro$/Net Merit and are very strong where their herd is weakest.
Examples:
A Western Canadian quota herd shipping into a butterfat‑heavy market may load more weight on fat %, reproductive efficiency, and Environmental Impact (feed efficiency, methane efficiency), because contract and policy pressures are moving in that direction.
A robot barn in Ontario may rank bulls first on Milkability (speed, temperament, udder/teat traits compatible with robots), then on LPI/Pro$, because slow‑milkers drag down box throughput.
The point is: the overall index gets you in the right ballpark; the subindexes and trait profiles decide whether you actually fix the problems that cost you money.
2. They Set Clear Inbreeding and Relationship Limits
Modern mating programs—whether through AI company software or integrated herd tools—let you set an expected inbreeding ceiling per mating.
A common approach:
Target: keeping individual matings under about 8% expected inbreeding (roughly “cousin‑level” or less).
Cap: avoid using any one sire providing more than 5–10% of replacements in a given year, so you don’t wake up in five years and realize half the herd traces back to only two bulls.
Genomic relationship data give much sharper views of how closely related bulls actually are, so herds and advisors are using it to:
Avoid stacking very closely related sires on the same cow families.
Balance high‑index sires across different lines to keep the gene pool wider.
This isn’t about avoiding genomics—it’s about using genomics to capture speed without painting yourself into a corner.
3. They Treat Haplotypes and Recessives as Standard Inputs
In 2026, ignoring fertility haplotype and genetic defect data is a bit like ignoring somatic cell counts. You can do it, but it will cost you.
The practical rule of thumb:
Carrier sires are okay if they bring needed strengths.
Carrier × carrier matings are not made.
On the farm, that means:
Genomically test all replacement heifers.
Make sure genomic testing and AI reports clearly identify carrier cows and bulls for known Holstein defects (HH1–HH6, CD/HCD, and others tracked by your provider).
Turn on “block carrier × carrier” in mating programs.
Review your herd’s carrier percentages; if a high proportion of heifers carry a given defect, re‑balance the sire lineup to avoid stacking that issue deeper.
Preventing even a handful of lost pregnancies or weak calves per year more than pays for the time it takes to configure those filters.
4. They Mix “Rocket Fuel” and “Workhorse” Genetics on Purpose
A pattern that shows up in data‑driven herds is deliberate stratification of matings.
For example:
Use a select group of very high‑index “rocket fuel” sires (top LPI/Pro$/Net Merit) on the very best genomic heifers and cow families to keep the top of the herd pushing forward fast.
Use a broader group of balanced “workhorse” sires—above average for Reproduction and Health & Welfare, solid for Longevity & Type—on the rest of the herd, especially family lines that have given you trouble on fertility or health.
That way, you:
Capture the upside of genomics where it pays the most.
Build a herd that isn’t full of fragile “one‑and‑done” cows that leave before third lactation.
A Quick Ontario Illustration
Imagine a 400‑cow Holstein herd.
The numbers say:
Too many cows are leaving before their fourth lactation.
Reproduction is “okay” but not great.
The current sire used list is heavy on very high LPI/Pro$ bulls that are below breed average for Reproduction Index and only average for Health & Welfare, with some matings up around 12–14% expected inbreeding.
A revised 3–4 year strategy might look like this:
Keep one or two of those elite genomic or proven sires for your best genomic heifers and highest‑index cows.
Add three to four “workhorse” genomic or proven less inbred bulls that are at or above breed average for Reproduction Index and Health & Welfare Index, and still have solid LPI/Pro$ numbers, even if they’re 200–300 points lower than the “rocket fuel” bulls.
Set an inbreeding ceiling goal of around 8% in the mating program.
Turn on avoidance for key haplotypes and genetic defects.
Over the next few years, you’re likely to see:
Modest improvement in pregnancy rate and fewer days open.
More cows are making it into fourth and fifth lactation without a parade of health or welfare events.
Slightly slower LPI/Pro$ progress on paper, but higher actual milk shipped per cow over a lifetime, because more cows stick around long enough to exceed paying back their rearing cost and reach peak productivity.
Here’s the rough math on that last point. If shifting your sire mix means an average cow stays an extra 0.3–0.5 lactations, and each additional lactation is worth roughly $1,500–$2,000 in net margin after feed and overhead, you’re looking at $450–$1,000 extra net income per cow over her lifetime. In a 400‑cow herd turning over 30–35% of cows per year, that trade‑off can easily be worth $50,000–$100,000+ per year on the income side—money that more than offsets a slightly slower climb on paper index.
Metric
“Rocket Fuel Only” Strategy
Balanced “Rocket + Workhorse” Strategy
Difference
Avg LPI/Pro$ Annual Gain
+110 LPI / +240PRO$
+85 LPI / +190PRO$
-25 LPI / -50PRO$
Avg Productive Life (Lactations)
2.8
3.3
+0.5 lactations
% Cows Reaching 4th Lactation
32%
48%
+16 percentage points
Avg Inbreeding (%)
12.8%
9.2%
-3.6 percentage points
Pregnancy Rate (21-day)
18.5%
22.0%
+3.5 points
Extra Net Income per Cow (Lifetime)
Baseline
+$650–$900
+$650–$900
400-Cow Herd (Annual Impact)
Baseline
+$65,000–$90,000/year
+$65,000–$90,000/year
3–5 Year Cumulative ROI
Baseline
$195,000–$450,000
$195,000–$450,000
That trade‑off—slightly less “flash” for more “cows that work longer and require less individual care”—is where the real money often sits.
Three Questions to Ask Your AI Rep This Spring
If you’re not sure where to start, these questions cut through the catalog noise fast:
“Which bulls in your lineup are above breed average for both Reproduction and Health & Welfare subindexes, and still strong on LPI/Pro$?” This forces the conversation beyond the very top LPI or Net Merit names.
“Can you run a report showing my herd’s average expected inbreeding and carrier status for major Holstein haplotypes and genetic defects?” This gives you a baseline for both diversity and hidden risk.
“If I wanted to balance my sire lineup between a few elite ‘rocket fuel’ bulls and more ‘workhorse’ functional sires, what would that look like for my herd?” This turns a product pitch into a strategy discussion tailored to your data.
A Straightforward Pre‑Order Checklist
Before your next semen order or breeding push, a simple checklist ties all of this together:
Pull the last 2 years of herd data.
Look at culling reasons and ages; how many cows leave before fourth lactation?
For each bull, jot down Production, Longevity & Type, Reproduction, Health & Welfare, Milkability, and Environmental Impact scores under the new LPI structure.
Flag bulls that are strong for Production but clearly below breed average for Reproduction or Health & Welfare.
Decide on an inbreeding ceiling and diversity plan.
Work with your advisor to set a mating target (e.g., an expected inbreeding level below 8%).
Consider setting limits on how much any single bull can contribute to replacements over the next 1–2 years.
Make sure haplotype and recessive filters are turned on.
Confirm your mating software blocks carrier × carrier matings for known Holstein haplotypes and genetic defects.
Ask for a herd‑level carrier summary so you know your starting point.
Balance your sire list.
Keep a select group of elite “rocket fuel” sires for the very top females.
Add at least one or two “workhorse” sires that are clearly strong for Reproduction and Health & Welfare to shore up your everyday cows.
If you remember nothing else, remember those three pillars: protect functional traits, manage diversity, and balance elite and workhorse genetics. Together, they do more for long‑term profitability than chasing any single proof list.
So, Did Genomics Deliver? The $238,000 Answer
If we’re honest, the answer is “yes—and.”
Yes, genomics delivered faster progress and more precise selection. Studies from the US, Canada, and Europe are very clear: genetic gains in production, health, fertility, and longevity traits are higher now than in the old progeny‑testing era.
And at the same time, genomics amplified both the strengths and the weak spots in our breeding goals:
We pushed production and type forward fast.
We made positive strides in some health and fertility traits, but they still lag behind production in terms of genetic gain rate.
We leaned hard on a relatively small set of sire and cow families, tightening the gene pool and increasing inbreeding.
We uncovered haplotypes and genetic defects hitchhiking on high‑index lineages, reminding us that progress always comes with complexity.
The good news is that the tools to manage those trade‑offs—modernized LPI, Pro$, genomic testing, mating software, and herd analytics—are better than ever.
The Bottom Line
Here’s the critical point: without genomics, there is no measurable ROI on genetic improvement. In the pre‑genomic era, you couldn’t reliably capture this kind of return because you couldn’t accurately identify high‑profit genetics early enough or fast enough. Today you can—and the math works out. A 400‑cow herd making smarter breeding decisions with genomic tools can realistically capture $50,000–$100,000+ per year in additional lifetime profit from cows that stay longer, breed back faster, and require less intervention. Over a typical planning horizon of three to five years, that’s the $238,000 question answered: genomics delivered the tools; your breeding decisions determine whether you actually capture that ROI.
Most of us aren’t in this to win a banner once and sell the herd. The goal is herds we actually like milking: cows that calve in with ease, handle transition without a parade of treatments, breed back on a reasonable schedule, stay sound on their feet, and survive long enough to make heifer raising pencil out positively.
The bulls you choose this year will still have daughters freshening in your barn in 2032. The closer those daughters are to the cows you actually want in your parlor—on reproduction records, on health reports, and on your balance sheet—the more of genomics’ promise you’ll actually capture.
Genomics gave us the speed. Now the job is making sure we’re steering it in the right direction for our own future dairy enterprise.
Key Takeaways
Genomics delivered: Genetic gains for milk, fat, protein, health, and longevity have roughly doubled since 2008—faster than progeny testing ever achieved.
But there’s a catch: Intense selection on a small elite group has pushed inbreeding past 11% and narrowed the gene pool, quietly eroding fertility and robustness.
New tools help you see the trade-offs: Lactanet’s six LPI subindexes show exactly where a bull stands on Reproduction, Health & Welfare, Milkability, and Environmental Impact—not just total merit.
Progressive herds are steering, not chasing: They mix “rocket fuel” and “workhorse” sires, cap inbreeding under 8%, and block carrier × carrier matings for haplotypes and defects.
The payoff is real: A 400-cow herd using these strategies can capture $50,000–$100,000+ per year in extra lifetime profit—that’s the $238,000 answer over 3–5 years.
Executive Summary:
Genomic selection has roughly doubled the rate of genetic gain for milk, fat, and protein, while also improving health and longevity traits compared with the old progeny‑testing era. Canadian data on the 20 most‑used Holstein sires show LPI and Pro$ values rising so fast since 2008 that daughters now generate several thousand dollars more lifetime profit per cow, adding up to $50,000–$100,000 or more per year in a well‑run 400‑cow herd. The flip side is that heavy reliance on a small group of elite families has increased inbreeding and reduced effective population size, which can chip away at fertility, health, and robustness if it’s ignored. Lactanet’s modernized LPI, with subindexes for Reproduction, Health & Welfare, Milkability, and Environmental Impact, gives breeders the dashboard they need to see those trade‑offs instead of just chasing one total merit number. Leading herds are using genomics to cap inbreeding, avoid carrier‑to‑carrier matings for haplotypes and defects, and deliberately mix a few high‑index “rocket fuel” sires with more balanced “workhorse” bulls that protect functional traits. In that context, the “$238,000 question” has a clear answer: genomics really can deliver that level of return over a few years, but only for farms that actively steer their breeding programs rather than letting the proof list do the driving.
Complete references and supporting documentation are available upon request by contacting the editorial team at editor@thebullvine.com.
Learn More
The Missing Piece in Genomic Selection: Why the Best Herds Still Walk the Pens – Stop the profit drain of early exits by identifying why cows leave before paying back their $2,600 rearing costs. This breakdown arms you with a tactical checklist to filter genomics through “cow sense” and secure more third-plus lactations.
2025 Dairy Year in Review: Ten Forces That Redefined Who’s Positioned to Thrive Through 2028 – Exposes the ten structural forces—from beef-on-dairy premiums to a shrinking replacement pipeline—shaping the next three years. It delivers the strategy to treat breeding as capital allocation, positioning your operation to thrive through the most volatile heifer market in 20 years.
Every week, thousands of producers, breeders, and industry insiders open Bullvine Weekly for genetics insights, market shifts, and profit strategies they won’t find anywhere else. One email. Five minutes. Smarter decisions all week.
How a farm boy’s love of pedigrees sparked a data revolution that reshaped global dairy genetics—and why his lessons matter more than ever in 2025
Robert Chicoine at Semex Alliance headquarters. He championed indices when everyone else trusted photographs—and half the breed’s DNA proves he was right.
The young bull arrived at the Centre d’Insémination Artificielle du Québec in the fall of 1967 with papers that would make any geneticist’s heart race. Three generations of sires with AI proven positive indices in both production and conformation—an almost unheard-of alignment of genetic excellence. On paper, this calf was exactly what the testing program needed.
But here’s where it gets interesting. His dam’s photo? Disappointing. Lacked the dairy character breeders prized. And worse—much worse, actually—she wore a speckled coat pattern that most cattlemen viewed with something between annoyance and outright dread.
Now, you have to understand something about 1967. Breeders had to hand-draw the coat markings of every calf submitted for registration. Every. Single. One. The prospect of reproducing that mottled pattern on form after form, getting all those spots just right… it was enough to make most turn away without a second glance.
When 73HO101 Senator—as he’d come to be known—was offered for testing, the Quebec breeding community responded with collective indifference. Most ignored him outright. CIAQ’s inseminators eventually got instructions to use his semen when a farmer requested a test bull without naming a specific choice. A last resort for an animal nobody wanted.
What happened next would validate a philosophy that had been building for years in the mind of one young geneticist. It would prove that the future of dairy breeding lay not in what the eye could see, but in what the numbers revealed. And it would cement Robert Chicoine’s legacy as one of the most consequential figures in the history of Canadian animal genetics.
The same principle that vindicated Senator now powers the SNP chips ranking your next breeding decisions. That’s not a coincidence—that’s legacy.
The Gift of The Holstein-Friesian Journal
Long before he’d revolutionize an industry, Robert Chicoine was a boy captivated by cows on a modest mixed farm in Saint-Pie-de-Bagot, Quebec. Born in 1943, he grew up surrounded by the familiar rhythms of rural life—laying hens clucking in their coop, apple trees bearing fruit in the small orchard, maple sap running each spring for the family’s syrup. The farm’s 15 to 20 dairy cows provided the primary source of income, with their milk destined for a Montreal dairy that paid nearly double the local rate in exchange for strict hygiene protocols and consistent year-round volume.
But it was the cattle that held young Robert’s complete attention. You know how some kids gravitate toward tractors, others toward the fields? Chicoine was a barn kid through and through. Whenever his family visited relatives or friends who farmed, he had only one request: to see the herd.
People noticed. An uncle who belonged to the Holstein Association of Canada recognized something in his nephew’s eyes—that spark you see in young people who just get it when it comes to cattle. Each month, after glancing through his copy of The Holstein-Friesian Journal, he’d pass it along to the boy who waited with barely contained anticipation.
“For me, this was the most beautiful gift I could receive,” Chicoine later recalled.
He spent hours poring over those pages, memorizing the names of advertised animals and studying their performance data—individual lactations, lifetime production, fat percentages—until the information became second nature. The kind of obsessive studying that would make any modern breeder recognize a kindred spirit.
His parents, watching their son’s devotion deepen with each passing season, made him a proposition that would alter the course of his life. If he agreed to handle all the paperwork and draw the animal portraits for registration applications, they’d gradually transition their grade herd to purebred Holsteins. It was a moment of trust and responsibility—the kind that plants seeds for everything that comes after.
Around the same time, the family kept a small flock of Bantam chickens in varied colors to brighten the farmyard. What began as decoration became Robert’s first laboratory. His parents let him build a separate flock where he could control which males bred with which hens, carefully observing how traits like color passed from one generation to the next.
“My little experiments with the Bantam chickens demonstrated to me with certainty that a breeding male can influence an entire herd,” he explained, “and even a whole segment of a population with the use of artificial insemination.”
Those childhood experiences—the journals filled with performance data, the hands-on breeding experiments, the patient parents who recognized and nurtured his interests—formed the bedrock upon which everything else would be built.
A Conversion in the Lecture Hall
When Robert Chicoine arrived at Laval University in the fall of 1960, Quebec itself was transforming. The ultra-conservative Duplessis era had ended, replaced by Jean Lesage’s Liberal government and its promise to modernize the province. It was the dawn of the Quiet Revolution—a period that championed science and gave education new prominence. In agriculture, the mandate was clear: productivity must improve, and quickly.
Chicoine came to university already fascinated by the performances of high-producing cows—those exceptional animals whose records qualified them for the honor roll published annually in the Holstein Journal. But his genetics courses delivered a revelation that would become the intellectual foundation of his entire career.
Here’s the thing about phenotype and genotype that changed everything for him: what you can observe—the physical expression of an animal’s traits—is only part of the equation. Environment and management play enormous roles in shaping a cow’s performance.
Think about it this way. A bull whose daughters averaged 8,000 kg of milk wasn’t necessarily superior to one whose daughters averaged 7,500 kg—not if the first bull’s daughters happened to be in high-feeding, top-management herds while the second bull’s daughters labored under average conditions. The raw numbers, stripped of context, could deceive. We’re still wrestling with this same issue today when we compare herds running robots versus parlors, or operations in Wisconsin versus Arizona.
Quebec genetics meet Negev heat: Robert Chicoine (second from right) tours an Israeli dairy where Canadian bloodlines perform under desert sun. It’s a living lesson in why raw production numbers deceive—and why contemporary comparison became his gospel.
This insight led Chicoine to embrace a method called Contemporary Comparison. Rather than judging a bull solely by his daughters’ raw production totals, this approach compared those daughters against the daughters of other bulls of the same age, in the same herds, during the same season. It created a level playing field that isolated the genetic contribution from the noise of management and environment.
It was a conversion—from intuition to analysis, from impressions to evidence, from what his grandfather’s generation believed to what the science actually showed. And it would become the philosophy he carried into battle against decades of ingrained industry skepticism.
The Challenge Nobody Warned Him About
A summer job at CIAQ in 1963 proved to be the pivot point. Management noticed the young man’s knowledge and passion for the Holstein breed, and before his internship ended, they extended an extraordinary offer: return after completing a Master’s degree in animal breeding, and take on the task of establishing Quebec’s first young sire testing program.
Chicoine was thrilled. His Master’s research, conducted under Dr. C.G. “Charlie” Hickman at the Ottawa Experimental Farm, taught him the mechanics of managing a testing program. But it also revealed critical flaws in the research project he was observing—it ignored conformation indices, causing the physical type of the herds to regress, and it used a closed population that limited genetic diversity.
From these lessons, he extracted a principle that would guide his entire approach: “To be acceptable to dairy producers, particularly those in purebred breeding, one must offer the testing program young bulls that have the best possible indices in production, but they must also have attractive indices in conformation.”
Sound familiar? We’re still having this exact conversation in 2025—balancing production traits against longevity, health traits, fertility, and feed efficiency. The fundamentals Chicoine identified sixty years ago haven’t changed.
On March 22, 1966, Robert Chicoine walked into CIAQ with a clear mandate—and an enormous problem.
For more than twenty years, animal production specialists had been preaching a single gospel to farmers: use herd proven bulls. Artificial insemination had given ordinary producers access to the very best genetics, and the message had been hammered home at every meeting, in every article, through every extension service. Now Chicoine had to convince those same farmers to do something that seemed to contradict everything they’d learned. He had to ask them to reserve a portion of their herds for young, unproven sires from his testing program.
“It was a great challenge,” he acknowledged—with what I suspect was considerable understatement.
Winning Hearts Through Data and Mail
Chicoine launched a campaign of patient persuasion that would span years. Picture him at those meetings—a young man not long out of university, standing in front of packed halls of weathered farmers in their good boots, the smell of coffee and cow still lingering on work clothes. Skeptical faces everywhere. These weren’t academics; these were men who’d been told for decades to trust proven bulls, and here comes this kid telling them to try something different.
He wrote article after article for industry publications, explaining the science of contemporary comparison in terms that farmers could understand. He spoke at annual meetings of insemination clubs and breed associations across the vast Quebec territory—sometimes so remote that travel required small aircraft.
A particularly effective collaboration emerged with Raymond Corriveau, a fellow Laval graduate who’d joined Holstein Canada as a regional representative. Corriveau’s information days were already popular with breeders, and he regularly invited Chicoine to present alongside speakers covering nutrition and management. During these sessions, Chicoine patiently explained principles that often sparked vigorous debate—like his assertion that a cow, regardless of her raw production totals, shouldn’t be considered a bull mother unless she was positive compared to her contemporaries.
“Which often created good discussions!” he recalled with characteristic understatement.
He promoted research from the University of Guelph demonstrating that optimal genetic gain could be achieved by using young test bulls on 40% of a herd’s females and proven sires on the remaining 60%. The study’s author, Murray Hunt, had since joined Holstein Canada’s staff in Brantford, lending credibility to the formula that Chicoine preached. (Read more: Dad at 80: How Murray Hunt Revolutionized Canadian Dairy Genetics)
But perhaps his most ingenious move was the mailbox campaign. From the beginning of the program, CIAQ made a habit of mailing the pedigrees and photographs of each new young bull to every breeder whose herd qualified for genetic evaluations. Part education, part marketing, wholly effective at building anticipation and loyalty.
“Over the years, several breeders confided in me that when they were young, they waited impatiently for the arrival by mail of the pedigrees of these young bulls,” Chicoine recalled. “Thus, a bond of loyalty to the program was created from one generation to the next.”
The results vindicated his balanced approach. Of the first seven young bulls submitted to the CIAQ testing program, three achieved the coveted recognition of EXTRA bull from Holstein Canada. Breeders began noticing that test bulls’ offspring stood out at shows. Visitors—Canadian and foreign—arrived regularly to inspect the daughters of the emerging stars. The momentum was building.
But the ultimate test of Chicoine’s numbers-over-narratives philosophy was already in the barn, waiting to prove him right—or destroy his credibility entirely.
73HO101 Craiglen Sevens Senator: The speckled coat that terrified breeders. The dam’s photo that disappointed. The pedigree indices that proved everyone wrong. Today, his genetics flow through more than half of contemporary Canadian Holsteins—including Madison Grand Champions Goldwyn and Gold Missy.
Senator’s Vindication
When Robert Chicoine spotted the advertisement in the October 10, 1967, issue of Holstein World, his attention was immediately fixed on the pedigree. A young bull named Craiglen Sevens Senator was being offered in the dispersal sale of American auctioneer Harris Wilcox’s herd in New York state. The calf’s maternal grandmother, mother, and sire were all connected to bulls that showed progeny proofs with positive indices in both production and conformation from artificial insemination programs. His sire was Sevens Burke Skylark; his dam’s sire was Osborndale Ivanhoe; his second dam was a Burkgov Inka Dekol.
“I had never seen such an eloquent pedigree on the male side,” Chicoine recalled.
But the dam’s photograph told a different story. She lacked the dairy character that breeders prized, appearing disappointing in ways that would ordinarily disqualify her offspring from serious consideration. Still, the indices were too compelling to ignore. CIAQ decided to attend the auction but to make a strict evaluation of the mother’s actual conformation before deciding whether to bid.
On-site, Chicoine’s team quickly determined that the dam was far superior to what her photograph suggested. Her mammary system was excellent, and their concerns about dairy character proved unfounded. That day, while one of New York’s most renowned herds won the bidding for the mother, CIAQ became the owner of her young son.
Henceforth, the bull would carry the semen identification code 73HO101 Senator.
When the time came to offer him for testing, CIAQ prepared promotional materials highlighting the richness of the indices in his pedigree. The hope was that breeders would look past the mother’s modest production records and disappointing photograph to see the genetic potential revealed by the comparison numbers.
The hope was misplaced. Most breeders ignored the young bull entirely. The reservations were multiple: the dam’s appearance, her unremarkable production figures, and most frustratingly, the speckled coat that would require tedious hand-drawing on registration forms. The pattern terrified breeders who could imagine hours spent trying to reproduce those mottled markings.
CIAQ instructed its inseminators to always try to use Senator when a farmer requested a test bull without making a specific selection. A humbling workaround, and there were real fears that he’d never accumulate enough daughters under official control to achieve an official proof.
Then the numbers started coming in.
The genetic evaluations published in February 1973 assigned 22 daughters to Senator with positive production results. He also posted positive results in conformation. CIAQ put him back into service, presuming that his true potential exceeded what the small daughter sample revealed. As more evaluations arrived and his proof strengthened, his use as a proven bull gradually increased.
Finally, in 1978, Holstein Canada awarded 73HO101 Craiglen Sevens Senator the coveted recognition of Extra bull. The strong potential that his pedigree had promised finally expressed itself in undeniable form.
February 14, 1979, Holstein Canada’s 96th Annual Meeting: Robert, as CIAQ representative, accepted Extra sire certificates for the bull nobody wanted. Eleven years after breeders dismissed Senator over his dam’s speckled coat, the indices had been vindicated—and half the breed’s future was written into his DNA.
Yet Senator’s destiny remained tragic in certain ways. A health test returned doubtful results, and after repeated trials at the doubtful level, CIAQ removed him from the bull stud. His semen reserves were quickly exhausted just as elite breeders were beginning to take notice. He also left a few daughters who attracted attention at exhibitions.
But genetics has a longer memory than markets.
The most famous of Senator’s daughters was Proulade Ruth Senator, who at age four captured Grand Champion honors at the Quebec provincial exhibition in 1981 and earned an All-Canadian nomination that same year. In a profile of Pierre Boulet published in Holstein International, the legendary breeder credited his lifelong passion for Holsteins to his adolescence, when he helped care for and prepare that very cow for shows.
“I remember that upon reading this article, I made the reflection that if 73HO101 Senator had only sired one female who inspired the awakening of the career of the now legendary Pierre Boulet, he would have done useful work for the Holstein breed,” Chicoine observed.
But Senator’s influence extended far beyond one inspiring daughter. Several important Quebec cow families that trace back to his era carry his genetics. The most significant is surely Comestar Laurie Sheik, whose third dam was sired by Senator. (The cow Chicoine called “the best kept secret of Quebec Holstein breeding of the last 50 years.”)
Rosiers Blexy Goldwyn Ex-96, the magnificent cow who was Grand Champion at both the International Holstein Show and the Royal Winter Fair in 2017, has one of her maternal ancestors sired by a son of Senator. Eastside Lewisdale Gold Missy Ex-95, who captured Grand Champion honors at Madison and Toronto in 2011, traces her lineage to Senator twice.
“It appears to me that more than 50% of Canadian subjects whose documented ancestry goes back to the time when 73HO101 Senator was in service feature his presence in their pedigree,” Chicoine estimated. “He may have been Québec Holstein breeding best kept secret of the 70s and the 80s,” he added.
Comestar Laurie Sheik: The principal vessel that carried Senator’s genetics into countless Holstein pedigrees worldwide. Her third dam was sired by the bull nobody wanted—making her what Chicoine called “the best kept secret of Quebec Holstein breeding of the last 50 years.
The lesson from Senator’s story became a foundational principle: favorable indices with high repeatability in an individual’s pedigree were an important indicator of the animal’s genetic potential—far better than the mother’s phenotypic production values. But Chicoine also learned a pragmatic corollary: for a testing program to function effectively, young bulls’ dams must have phenotypic values impressive enough to excite breeders and ensure participation.
The indices had triumphed over impressions. But the revolution was only beginning.
Breaking the Star Brood Cow Rule
Senator’s vindication loosened one knot of tradition, but an even more stubborn one remained. For as long as anyone could remember, the dairy industry operated under an unwritten rule: a potential test bull’s mother had to be at a minimum classified Very Good, preferably old enough to have established herself through her progeny, and ideally being already recognized as a proven brood cow.
The logic seemed sound. Before superovulation and embryo transfer became commercial practices, a cow needed years to produce enough offspring to demonstrate her breeding value. By the time she earned the coveted Star Brood Cow designation, she might be nearly ten years old—and if she’d given birth to mostly males in her early years, she might not even still be alive.
When Chicoine once asked a prominent breeder—who’d later become president of Holstein Canada—whether an exception could be made for an exceptional young cow who’d suffered an accident preventing her from reaching the desired classification level, the reaction was immediate and absolute.
“It was out of the question!”
No discussion. No consideration. Just… no.
So deeply ingrained was this belief that it took CIAQ twenty years to build the institutional confidence to challenge it. Think about that—twenty years of knowing the rule was probably costing them elite genetics, but not having the nerve to buck convention. The breakthrough finally came when the organization dared to test sons from a promising young primiparous cow classified only Good Plus at 84 points—below the traditional Very Good threshold.
You can imagine the anxiety in those hallways. What if the traditionalists were right? What if this gamble destroyed the program’s credibility?
Two bulls emerged from this audacious decision: Comestar Lee and Comestar Top Gun.
Both achieved Extra bull status from Holstein Canada. But here’s where it gets remarkable—Comestar Lee transcended his origins to become one of the most used bulls in the entire history of the Holstein breed. 1.5 million doses of semen were distributed around the world.
Let that sink in. A bull from a dam who didn’t meet the traditional standard. A dam the old guard would’ve dismissed out of hand. And his genetics went everywhere.
Marc Comtois at the Royal Winter Fair with statues honoring two Semex millionaire bulls: Comestar Lee and Comestar Leader. Lee—born from a dam the old guard would have dismissed—went on to distribute 1.5 million doses worldwide. Comestar remains the only breeder with four millionaire bulls: Lee, Leader, Stormatic, and Lheros.
The phones at CIAQ must have been ringing off the hook when those proofs came back. The breeders who’d insisted on the Star Brood Cow rule—what could they say? The evidence was undeniable. Sometimes the most valuable discoveries await those willing to break sacred rules.
From Prosperity to Innovation: Boviteq
The testing program’s success created something rare in cooperative agriculture: a surplus. The identification of particularly popular bulls, such as Glenafton Enhancer, Hanoverhill Starbuck, and Kingstead Valiant Tab, generated revenues that exceeded all expectations.
Chicoine saw an opportunity—and for him, this wasn’t just institutional strategy. It was personal. If CIAQ had mastered the male side of the genetic equation through rigorous data analysis, why shouldn’t the female side deserve the same scientific approach?
Thus, Boviteq was born in 1986 with a clear mandate: research. At the time, frozen embryos rarely achieved acceptable fertility rates when implanted. Boviteq’s first mission was to improve those results—a challenge that still resonates today as IVF continues transforming how progressive dairies approach reproduction.
The new entity faced immediate resistance from three directions. The veterinary faculty at the University of Montreal believed research funds in embryology rightfully belonged to them. Veterinarians specializing in embryo collection feared a new competitor. And breeders worried that Boviteq would eventually compete with them in embryo sales.
Chicoine’s solution required structural creativity. Boviteq became a subsidiary with its own board of directors and independent management. Ann Louise Carson was appointed general manager, bringing competence and diplomacy to smooth over tensions with industry partners. Gradually, Boviteq came to be seen as a natural part of the Quebec cattle breeding community.
Looking at where Boviteq and genomics have taken us today—with gender-sorted semen commonplace and sexed embryos increasingly viable—Chicoine’s bet on female-side research seems almost prophetic.
The Alliance Forged in Crisis
If Boviteq was born from prosperity, the Semex Alliance was forged in fire.
September 1988, URCEO AI Centre, Rennes, France: Doug Blair (left) and Robert Chicoine, where a conversation about income sharing planted the seeds. Nine years and one corporate crisis later, those seeds became the Semex Alliance.
The seeds were planted in September 1988, at a seminar on Canadian genetics in Rennes, France. Robert Chicoine and Doug Blair, CEO and owner of Western Breeders Service in Alberta, found themselves discussing a persistent vulnerability: a small regional center might not always have star bulls to market, leaving it financially exposed during lean genetic years.
Blair proposed an income-sharing arrangement among Canadian centers based on each center’s share of the breed’s numbers. By pooling resources, partners could smooth out the inevitable fluctuations in genetic fortune. By January 1990, WBS, BCAI, and CIAQ signed an agreement, and Genexcel became a reality.
The early years proved the concept in an unexpected way. CIAQ, which had enjoyed brilliant success with Starbuck and his herdmates, found itself without star performers among Starbuck’s sons, while its Genexcel partners identified great stars among their Starbuck offspring. The smaller partners supported CIAQ during its dry spell, demonstrating that the sharing principle could work even when the founding major-partner organization was in need of help.
Then everything changed. Western Breeders acquired the American center Landmark Genetics, creating Alta Genetics and fundamentally altering the landscape.
Suddenly, Western Breeders possessed its own international distribution network and announced its intention to leave the Semex Canada export structure. They offered to integrate Semex Canada into Alta’s global system, with one condition that proved insurmountable: the remaining Canadian partners wanted a majority stake in any merged entity. Alta wouldn’t yield control.
The negotiations were intense. Two sessions of back-and-forth, positions hardening, stakes climbing. Finally, the Alta board chairman announced that the parties’ positions were irreconcilable.
Hours later, Semex Canada’s general manager—who’d supported Alta’s proposal—tendered his resignation and left the same day. Just walked out.
“It was quite a dramatic situation,” Chicoine recalled, “since we, the partners in Semex who had just refused Alta’s offer, did not have a clearly defined plan for the future.”
Picture that moment. The key negotiation has collapsed. Your general manager just quit. International competition is intensifying. And you’re sitting there with your partners—CIAQ, BCAI, Gencor, and EBI—looking at each other, knowing that fragmentation might mean the end of Canadian genetics’ global competitiveness.
“We don’t have a clear plan,” someone likely said.
“Then we make one,” came the response. “In the meantime, let’s try to carry on as effectively as possible.” Wilbur Shantz, who had recently retired from United Breeders, was appointed interim general manager.
Chicoine and Gordon Souter championed a radical solution: pool the ownership of all bulls into a single new legal entity. Unlike Genexcel, where a one-year notice allowed any partner to exit, this new alliance would be structured to make departure extremely difficult. The cooperative model they championed anticipated the consolidation pressures many operations face in 2025—the understanding that fragmented players can’t compete against consolidated giants.
On January 1, 1997, the Semex Alliance became a reality.
January 1, 1997: Robert Chicoine and the founding general managers seal the Semex Alliance with joined hands. Hours earlier, negotiations had collapsed and their GM walked out. This moment—born from crisis—launched nearly three decades of Canadian genetic dominance on the world stage.
“A picture of Wilbur Shantz and the four general managers of the Semex Alliance founding centres that was taken to mark this new beginning and symbolize their willingness to cooperate mutually is particularly dear to my heart,” Chicoine reflected.
That photograph captured not just five men, but the end of an era of regional competition and the beginning of unified Canadian genetic excellence on the world stage. Looking at Semex’s global presence today—still a major force despite intense competition from American and European programs—you can trace it directly back to that moment of crisis that became an opportunity.
Taking Canadian genetics global: Robert Chicoine (center) at a Japanese dairy exhibition, where the data-driven philosophy that vindicated Senator found eager buyers half a world away. The cooperative model he helped forge from crisis now competes on every continent.
The Long Ripple of One Breeding Decision
Among the many decisions Robert Chicoine made during his career, one stands out for the extraordinary distance between his actions and their impact.
In late spring of 1972, Chicoine stopped at the Sunnylodge farm while the cows were on pasture. His attention was immediately captured by a cow named Sunnylodge Janice. She possessed good general conformation and a remarkably well-preserved quality udder, despite her very superior production for her era. Her pedigree was heavily concentrated on the Rag Apple line, particularly the Montvic Rag Apple Ajax branch, known for transmitting excellent udders.
Chicoine proposed a contract mating to owner Carl Smith. The bull selected was No-Na-Me Fond Matt, whose pedigree was equally rich in the Rag Apple line. In May 1973, the mating produced a bull calf named Sunnylodge Jester.
Jester’s testing results were positive in both production and conformation, earning him regular service for a time. But his timing was cruel. He was negative for size and stature at the precise moment when Quebec breeders were working hardest to improve those very traits. His popularity suffered accordingly, and his influence on the breed remained limited.
By conventional measures, the mating that produced Jester was a modest success at best.
But the story didn’t end there.
The following year, Sunnylodge Janice was bred again to Fond Matt. On July 1, 1974, this repeat mating produced a heifer named Sunnylodge Fond Vickie.
Decades would pass before her true significance emerged.
On January 3, 2000, Sunnylodge Fond Vickie became the seventh dam of Braedale Goldwyn—one of the most unique and spectacular bulls in modern Holstein history.
The mating of Chicoine, arranged on an Eastern Ontario farm in 1972, rippled through seven generations to help produce a global genetic legend. It’s a perfect illustration of how vision in dairy breeding operates on timescales that dwarf human careers—and how the most impactful decisions may not reveal their significance for decades.
Something to think about when you’re making breeding decisions on your own operation today.
The Philosophy That Guided Everything
Throughout his career, Robert Chicoine returned to a single guiding principle when facing difficult decisions: “Necessity is the law.”
“It has nothing to do with not respecting the law,” he explained. “In a difficult situation, seeking to find the best possible solution becomes the rule to which one must adhere without hesitation.”
This pragmatism shaped his handling of every crisis, from the early skepticism toward young sire testing to the high-stakes negotiations that forged the Semex Alliance.
His core management philosophy: “Surround yourself with the most competent people possible, create a healthy and warm working climate, and analyze regularly and seriously the challenges that the company must face as well as the opportunities offered by the industry.”
Not a bad framework for anyone running a dairy operation in 2025, honestly.
One experience taught him how to apply this philosophy to failure. CIAQ invested heavily in recruiting over 1,000 new herds into milk recording programs, aiming to expand the testing pool. The initial results were painful—no star bulls emerged even as competitors identified legends from their Starbuck offspring. The board questioned whether to abandon the effort.
Chicoine argued for patience. The program’s design was sound; immediate results didn’t invalidate the long-term strategy. CIAQ persevered, and eventually the genetic evaluations of July 1996 vindicated the decision—identifying global superstars like Startmore Rudolph and Maughlin Storm.
His advice: “After having planned a project well and executed it rigorously, one should not throw in the towel too quickly if the results do not meet expectations.”
Words worth remembering when genomic predictions don’t pan out the way you expected, or when a highly-indexed young sire disappoints…
In retirement, Chicoine pursued the passions that shaped his youth—exploring the national parks of the Canadian and American West and playing bridge once or twice a week. But one hobby directly connected to his life’s work: spending countless hours tracing Holstein pedigrees back to their foundation animals and analyzing the combinations that produced exceptional individuals. He created a fund supporting graduate students at Laval University who chose the field of genomics.
“I can summarize my career by saying that I am blessed to have always been passionate about my work,” he reflected. “I went to work with enthusiasm daily.”
The Bottom Line
Today, when commercial farmers achieve rapid genetic progress in functional conformation and milk components through genomic selection, they’re building on foundations that Robert Chicoine helped lay. When breeders evaluate young sires through data-driven indices rather than subjective appearance, they’re practicing principles he championed when they were still controversial. When Canadian genetics enjoys global prestige under the Semex banner, they’re benefiting from an alliance he helped forge from crisis.
And somewhere in the DNA of perhaps half of all contemporary Canadian Holsteins, the genetics of a speckled bull that nobody wanted continue to flow.
The next time you trust an index over a photograph—whether it’s an LPI ranking or a health trait evaluation—you’re walking the path Chicoine cleared. That’s not just history. That’s the foundation of every breeding decision you’ll make tomorrow.
Key Takeaways:
Trust Data Over Appearances
Indices beat photographs. Senator’s stellar pedigree predicted genetic greatness despite his dam’s disappointing picture—a principle that now powers every genomic ranking you trust.
Environment masks genetics. An 8,000 kg cow in a top-management herd isn’t genetically superior to a 7,500 kg cow under average conditions. Strip away the environment to reveal true merit.
Challenge sacred rules. The Star Brood Cow requirement seemed untouchable until CIAQ tested sons from a primiparous Good Plus cow—producing Comestar Lee with 1.5 million doses distributed worldwide.
Lead Through Crisis
“Necessity is the law.” When Semex Canada faced collapse, Chicoine built consensus around a radical solution: pooling all bulls into a single alliance that still dominates global markets 30 years later.
Convert skeptics through results, not arguments. Instead of labeling resistant breeders as heretics, he mailed pedigrees, presented data, and let observation change minds organically.
Play the Long Game
Don’t abandon well-designed projects at the first disappointment. Operation Identification produced no star bulls initially—then delivered Startmore Rudolph and Maughlin Storm, global legends that vindicated years of perseverance.
Failure seeds future success. Those early struggles exposed the risks of operating solo and directly informed the thinking that created the Semex Alliance.
Genetics operates on generational timescales. A mating Chicoine arranged in 1972 rippled through seven generations to produce Braedale Goldwyn—proof that your best breeding decisions may not reveal their impact for decades.
Balance Progress with Practicality
Production without conformation fails. A testing program that ignores type will see physical quality regress—and lose the breeder participation it needs to function.
Select for sustainability without sacrificing productivity. On methane: give the trait all possible importance without significantly altering progress on other characters—otherwise, you need more animals to produce the same milk.
Executive Summary:
The dairy industry’s most influential genetic legacy began with a bull nobody wanted. In 1967, Quebec breeders dismissed 73HO101 Senator because his dam’s speckled coat meant hours of tedious hand-drawing on registration forms—yet his genetics now flow through more than half of contemporary Canadian Holsteins, including Madison Grand Champions Braedale Goldwyn and Eastside Lewisdale Gold Missy. Robert Chicoine spent six decades proving that indices beat photographs, breaking the sacred Star Brood Cow rule to produce Comestar Lee (1.5 million doses sold worldwide) and forging the Semex Alliance from a corporate crisis that saw the general manager walk out the same day negotiations collapsed. The same principle that vindicated Senator—trusting pedigree data over phenotypic impressions—now powers every genomic ranking guiding your breeding decisions. The next time you dismiss a high-indexed bull because his dam’s photo disappoints, remember: that’s exactly how Senator was treated, and he went on to shape the modern Holstein breed.
Complete references and supporting documentation are available upon request by contacting the editorial team at editor@thebullvine.com.
When Lightning Strikes: The Braedale Goldwyn Story That Changed Everything – The ripple effect of Chicoine’s 1972 mating didn’t stop at a single heifer; it led to the bull that eventually rewrote the Holstein playbook. Dive into the deep genomic analysis of how Goldwyn truly conquered the world.
FERME PIERRE BOULET: First Comes Love Then Comes Genetics – Chicoine often reflected that if Senator only inspired one breeder, his work was worth it. This profile of Pierre Boulet—whose legendary career was sparked by a Senator daughter—is the living, breathing proof of that enduring legacy.
The Sunday Read Dairy Professionals Don’t Skip.
Every week, thousands of producers, breeders, and industry insiders open Bullvine Weekly for genetics insights, market shifts, and profit strategies they won’t find anywhere else. One email. Five minutes. Smarter decisions all week.
Your Guernseys might be naturally A2—but if you’re not hitting 50,000 lb per run, your premium is probably disappearing in someone else’s silo.
U.S. Guernsey cattle are now officially sitting in the “Watch” category on The Livestock Conservancy’s Conservation Priority List, which is the tier reserved for breeds with fewer than 2,500 annual U.S. registrations and an estimated global population under 10,000 registered animals according to the Conservancy’s parameters. The latest list still places Guernseys in that Watch bracket, which gives you a pretty clear sense of how small the registered population has become compared with where it once was in North America.
Over roughly the same period, the business around A2 milk has gone from a niche curiosity to serious money. Precedence Research pegs the global A2 milk market at about 2.86 billion U.S. dollars in 2025 and projects it out to around 7.62 billion by 2034 if current demand growth holds, which works out to roughly an 11‑plus percent annual growth rate over that stretch. So you’ve got a rapidly growing premium segment on one hand, and on the other, you’ve got heritage breeds like Guernsey that, based on both breed descriptions and on‑farm A2 testing results, tend to show a very high frequency of the A2 β‑casein variant when samples are sent in.
The global A2 milk market is projected to nearly triple from $2.86B in 2025 to $7.62B by 2034—an 11%+ annual growth rate that explains why heritage breed owners thought they had a goldmine
On paper, you’d think those two things would line up a lot better than they have. As many of us have seen over coffee at meetings or in the bleachers at shows, they mostly haven’t.
What’s interesting here is that once you strip this back to what’s actually in the genes, how plants are built, and where the dollars really move, the answer is pretty straightforward… and a bit uncomfortable.
Looking at the genetics, not the sales pitch
Looking at this trend from the genetics side first, A2 isn’t some magical “heritage package.” It’s one specific change in the β‑casein protein coded by the CSN2 gene—a single nucleotide substitution that flips one amino acid at position 67 from histidine (A1) to proline (A2). Reviews on A2 milk from food science and nutrition researchers keep coming back to the same point: the distinction between A1 and A2 β‑casein is that single amino acid difference, not a wholesale change in the cow or in other milk proteins.
That’s very different from things like butterfat performance, fertility, or how a cow holds up through the transition period in a grazing system, which all involve many genes and years of selection pressure. A2 is more like a light‑switch trait. If you’ve got genomic tools and access to semen catalogues that clearly label A2A2 sires, you can shift the A2 status of a Holstein herd pretty quickly.
A group led by B.A. Scott in Australia pulled together Holstein genomic data and published it in 2023 in Frontiers in Animal Science. They showed that the proportion of A2A2 Holstein cows in their dataset rose from about 32 percent in 2000 to roughly 52 percent in 2017 as selection for the A2 allele increased in the population. That’s a big shift in less than two decades, driven mainly by AI studs and breeders nudging A2 sires up their lists once the trait started to matter commercially.
Holstein herds went from 32% A2A2 in 2000 to 52% by 2017 through simple genomic selection—proving that the “heritage A2 advantage” was never a sustainable moat
Once brands like The a2 Milk Company started talking about A2 in grocery aisles, studs did what they always do: they flagged A2A2 sires clearly in proofs and catalogs and, where feasible, folded A2 into their mating tools and marketing. If a bull was already strong on production, health traits, and type, A2 became one more box that was easy to tick when planning matings.
You can see how fast this can move when you look at operations like Sheldon Creek Dairy in Ontario. Their own story describes how they used Holstein genetics and careful sire selection to transition their herd to produce only A2 β‑casein, then built a bottled milk brand around that. They didn’t need to change breeds to do it.
So if you’ve been told that Guernseys or other heritage breeds had a “baked‑in A2 advantage” that nobody else could catch, the genetics really don’t support that. The initial advantage was real—many Guernsey herds do test very high for A2—but it was easy for Holstein programs to copy once there was a commercial reason to do so.
The plant math that quietly decided everything
Now, genetics is only half the story. The other half is the part that doesn’t show up in glossy brochures: how milk actually moves through a plant, and what it costs to treat a stream as “special.”
Let’s walk through two real‑world scenarios the way you’d probably talk them through around a table with a pencil and a notepad. The numbers themselves will feel familiar if you’ve ever sat down with an extension engineer or a processing consultant.
In Scenario A, imagine a 5,000‑cow Holstein herd. If you decide to test all those cows for A2 using a typical genomic panel that includes β‑casein, you’re probably looking at something in the $45–50 per head range based on current commercial lab pricing in North America. Call it roughly $225,000 to test the whole string.
If around 45 percent of those cows test A2A2—which lines up with where a lot of Holstein herds land once A2 has been on the radar for a while—that’s about 2,250 cows. If those cows are averaging roughly 70 pounds of milk per day, that subset alone is producing around 157,000 pounds of A2 milk per day. Even if a processor only pulls part of that into a dedicated stream, you’re still comfortably over the 50,000‑pound volume that makes a separate A2 run realistic.
Most large plants can justify a separate A2 run at that kind of volume, including a full clean‑in‑place cycle between the A2 product and regular milk. Processors running A2 programs in markets like the U.S., Australia, and New Zealand report premiums of $1.50 to $2.50 per hundredweight over conventional pay prices, depending on contract structure and the products they’re making. Stack that over a month, and you’re talking tens of thousands of dollars in extra revenue, without changing barns, freestall layout, dry lot systems, or core fresh cow management—just sorting cows, managing groups, and scheduling dedicated loads.
Daily production from that herd might be in the 7,500 to 9,000 pound range if cows are giving 50–60 pounds apiece, depending on components, fresh‑cow management, and days in milk. And that’s where the problem starts. In many Guernsey herds that have actually done the testing, a very high proportion of cows do come back A2A2, which matches what breed descriptions and breeders report, even though there isn’t a single global genomic survey that pins down one exact percentage.
Daily production from that herd might be in the 3,000 to 4,000 pound range, depending on butterfat performance, fresh cow management, and days in milk. And that’s where the problem starts. The same plants that are happy to schedule a special A2 run at 50,000 pounds in Scenario A can’t justify a completely separate run for 7–9,000 pounds a day from one small herd. By the time you factor in hauling logistics, testing, and the time and chemicals for a full CIP, that small stream just doesn’t carry its weight in a conventional plant.
Unless you and several neighbours can pool your milk into a unified, A2‑only stream that gets into the tens of thousands of pounds per week, your A2 milk is simply going to disappear into the regular tank. The premium doesn’t vanish because anyone dislikes Guernseys; it vanishes because the plant can’t afford to treat that small volume as a separate product under its current design.
In the Upper Midwest, for example, plant managers will tell you candidly that every new product run means lining up dedicated loads, testing them, possibly tweaking process settings, and then doing a full CIP before switching back. For many plants, a rough threshold where that becomes feasible is somewhere around 50,000 pounds per run, not as a hard rule but as the point where per‑unit costs start to look sensible.
So a lot of heritage herds find themselves at a three‑way fork:
One path is to invest in some level of on‑farm processing. When you talk to extension specialists and farmstead processors, a modest 50–150 cow setup—pasteurizer, bottling line, food‑grade processing room, cold storage, licensing, and working capital—often lands in the $175,000 to $325,000 range once everything’s on paper.
Another path is to organize a serious pooled stream with like‑minded neighbours so you can show up at the plant door with enough volume and consistency to justify a separate A2 or heritage run.
The third path, which many people end up on by default, is to accept that as long as you’re shipping into a conventional pool, A2 alone won’t change your milk cheque much, if at all.
A Vermont producer who priced all this out with advisors summed it up bluntly in a regional article: the A2 premium at the plant is real, he said, but they couldn’t see how to capture it “without becoming a completely different kind of business.” That’s a pretty honest read on the gap between the A2 sales pitch and plant‑level infrastructure.
What on‑farm processing really looks like when you sharpen the pencil
If you’re seriously kicking the tires on processing your own milk—even just part of it—those big ballpark numbers start to look a lot more real once you break them down into line items.
Extension publications and small dairy plant consultants tend to put the major capital costs into a few familiar buckets. A decent-sized batch or HTST pasteurizer, plus a filler and basic controls, might run in the $75,000–$125,000 range, depending on whether you’re buying new or reconditioned equipment. Building out or upgrading a room to meet food‑grade standards—floors, walls, floor drains, CIP‑friendly design, HVAC, and electrical—can easily add another $40,000–$80,000.
Then there’s the regulatory and compliance side. Between design review, permits, inspections, and initial lab work, many farms end up in the $15,000–$40,000 range just to get through licensing. Add in $20,000–$40,000 for packaging and cold storage—bottles, caps, labels, cases, coolers, or a small walk‑in—and whatever you’re comfortable holding as working capital for a few months of payroll and utilities, which might be another $25,000–$40,000.
Put all of that together, and that’s how so many farmstead dairies land in that $175,000–$325,000 startup range for a 50–150 cow operation. It’s a big step, especially when you’re still milking mornings and evenings and trying to keep cows moving cleanly through the transition period.
So what does that investment actually buy you on a per‑hundredweight basis?
When you talk to direct‑market farms that are selling whole milk under their own label and turning some of the tank into cheese, yogurt, or ice cream, you hear similar patterns in their back‑of‑the‑envelope math. Once they reverse‑engineer their retail sales back to the farm gate, many find that bottled whole milk is effectively returning somewhere in the high‑30s to mid‑40s per hundredweight equivalent. Value‑added products like cheese or yogurt often come out in the mid‑50s to maybe around $80/cwt equivalent in some markets, especially near cities with strong local‑food demand.
Nobody is suggesting that every farm will hit those exact numbers; it depends heavily on your location, customer base, product mix, and ability to manage both the plant and the cows. But when you blend it all together—a portion of the milk as bottled whole, some as chocolate, some as yogurt or cheese—a lot of these operations report blended returns in the roughly $48–$65/cwt equivalent range.
Compare that to a commodity price in the low‑20s per hundredweight in many recent U.S. mailbox averages, and you start to see why some heritage herds are making that jump, even if it means learning to run a pasteurizer in the afternoon instead of heading straight from the parlor to the shop.
Heritage herds that successfully process on-farm report blended returns of $48–$65/cwt versus low-$20s in bulk pools—a 2–3× multiplier that justifies the capex if you can realistically climb this ladder in your market
The real question for your yard isn’t “Is on‑farm processing a good idea?” It’s “Can I realistically see a path to that blended $45+/cwt equivalent in my own postcode with the time, talent, and markets I have—or can build?”
Who’s actually making heritage genetics pay?
What farmers are finding is that the heritage herds that are growing or at least holding steady aren’t hanging their hats on A2 alone. They’re building full business models around their cows.
Two Guernsey Girls Creamery in Wisconsin is a good example. Owner Tammy Fritsch runs a state‑licensed micro‑dairy near Freedom, milking a small Guernsey herd and processing the milk right there on the farm. The idea didn’t start with spreadsheets; it started with years of showing Guernseys at the Wisconsin State Fair and hearing visitors ask where they could still buy Golden Guernsey milk like they remembered.
Today, that operation tests cows to confirm A2 status, pasteurizes milk on‑farm, and bottles non‑homogenized milk so the cream rises in the bottle—something customers notice right away. They also make Guernsey cheese curds and other products, selling through farm pickup, local stores, and outlets that want something distinct and local. A2 is part of the story, but it sits alongside breed identity, the visible cream line, and a direct relationship between the family and their customers.
In Ontario, Eby Manor near Waterloo has done something similar with its Golden Guernsey label. Their own materials describe their Guernsey milk as naturally rich and A2, and they bottle that into milk, chocolate milk, cream, yogurt, and cheeses under their family brand. They’re working inside a quota system, but the basic approach is similar: don’t wait for a processor to create a Guernsey A2 silo—build your own lane and brand.
When you lay these examples side by side, the pattern is fairly consistent. The heritage herds that are really making it work often share a few traits:
They’ve taken control of at least some processing and packaging under their own roof.
They’ve built direct‑to‑consumer channels—farm stores, markets, local grocers, cafés, and delivery.
They’ve diversified beyond fluid milk into at least one or two value‑added products, often including cheese or yogurt.
They’re stacking A2 with other premiums like grass‑based feeding, local identity, sometimes organic certification, and the heritage angle itself.
They’ve built a community of customers who know the farm and the cows by sight.
For heritage herds that are still shipping everything into a single tanker and hoping a processor will someday decide to pay more just because the milk is A2, that’s the real gap.
The consumer confusion that muddies the water
There’s another piece here that’s easy to underestimate when you’re living in the barn: what’s going on in the consumer’s mind.
You probably know this already, but a lot of people use “lactose intolerance” as a catch‑all label for any discomfort they feel after drinking milk, even though true lactose intolerance is about low lactase enzyme levels and not about casein proteins. Reviews that look over the A2 literature point out that many consumers don’t clearly distinguish between issues with lactose and possible differences in how they respond to A1 versus A2 β‑casein.
So someone who’s genuinely lactose intolerant sees A2 milk on the shelf, hears that it’s “easier to digest,” and decides to give it a try. Since A2 milk still contains essentially the same lactose content as regular milk, that person may not feel any better. They walk away thinking, “That was just expensive milk that didn’t help me.”
At the same time, some people do report feeling better on A2 milk in controlled digestion studies, especially in terms of bloating or GI discomfort, but those are often individuals whose issues weren’t driven purely by lactose in the first place. That nuance is tough to convey in three lines on a label or in a 15‑second ad.
For small heritage herds trying to build a local A2 niche, that confusion creates headwinds. The big A2 brands have done a lot to get the term “A2” into consumer vocabulary, which helps. But they haven’t always helped shoppers understand why a local Guernsey A2 milk, sold in glass with a visible cream line and a pasture story, is another step different again.
So what stands out in conversations with farmers here is that A2 can be a door‑opener. It might be the reason someone tries your milk for the first time. But the reasons they keep coming back—flavour, mouthfeel, how they feel after they drink it, the kids’ reactions, what they see when they visit the farm—go way beyond that one gene marker.
What processors are really up against
As many of us have seen, it’s tempting to chalk all this up to processors “not getting it.” But when you actually sit in a plant office and ask how they’d make a heritage A2 run work, the answer often comes down to mechanics: plant design, labour, and scheduling.
In many Midwest plants, managers will tell you that every new product run means lining up dedicated loads, verifying composition, possibly adjusting process settings, and then performing a full CIP before switching back. That’s a lot of labour and downtime for a small stream. For many plants, the rough threshold at which this becomes feasible is around 50,000 pounds per run; below that, the extra cost per unit can erode the premium quickly.
There have been attempts in states like Wisconsin and Vermont to set up specialty pools—grass‑based pools, local pools, sometimes A2 pools. Some of those have made progress; others have run into predictable problems: not enough consistent volume, too much compositional variation, too much scheduling complexity relative to plant capacity. In California’s Central Valley, where a lot of milk moves through very large, highly optimized plants tied to big Holstein herds in freestalls or dry lot systems, there’s even less room to carve out tiny lanes for heritage milk.
So if your business plan is built on a conventional plant paying a stable, meaningful premium just because your milk is both A2 and heritage, at a relatively small volume, you’re basically betting against the way most plants are currently engineered. That doesn’t make processors villains; it just means the system wasn’t built to do what we now wish it could do.
The pasture angle we don’t want to lose sight of
It’s also worth stepping back from the plant for a minute and looking at where these cows actually earn their keep: on the ground.
Teagasc, the Irish agriculture research and advisory organization, has done a lot of work comparing straight Holstein‑Friesian cows with Holstein‑Friesian × Jersey crossbreds in grass‑based, seasonal systems. In several of those multi‑year pasture studies, the crossbreds have come out ahead on profit per cow and per hectare, mainly because of better fertility, survival, and components, even when straight Friesians had an edge on pure volume. An analysis highlighted by Agriland reported that crossbred cows at Teagasc’s Clonakilty research farm were generating around €162 more profit per cow per lactation than straight Holsteins in that grass‑based system.
Those aren’t Guernseys, but they do back up what many graziers in the Northeast and Upper Midwest have already noticed on their own farms: the cow that’s a star on a high‑input TMR in a big freestall isn’t always the cow that makes you the most money when you’re walking to the back paddock in April, dealing with wet springs, and trying to get an efficient bite off grass.
Heritage breeds like Guernsey, Ayrshire, and Brown Swiss, evolved in environments closer to those of grazing systems. The Livestock Conservancy, breed associations, and extension sources describe Guernseys as good grazers that can do well on quality pasture, hardy across a range of climates, and relatively easy to manage. Ayrshires have long been known for strong feet and legs and good performance on rougher ground. Brown Swiss carry a reputation for longevity and for producing milk with protein and casein profiles that work well for cheesemaking, especially in alpine‑style cheeses.
So if you’re in a pasture‑heavy system—think New York’s hill farms, Vermont and Quebec grazing herds, Wisconsin seasonal dairies, or coastal British Columbia—chasing A2 might be less important than asking, “Which genetics give me the best lifetime production and profit per acre on this land base?” A2 can still be part of that picture, but fertility, days in milk, hoof health, and how well a cow converts your grass into fat and protein are often the real levers.
Crossbreeding: where heritage genes quietly move into big herds
There’s also a quieter trend that doesn’t show up in breed registration numbers: heritage genetics getting into commercial herds through deliberate crossbreeding.
Many larger Holstein herds frustrated by fertility, lameness, and short productive lifespans have already considered crossbreeding with Jerseys, Montbéliardes, or Scandinavian Reds, and the literature on crossbred systems consistently shows heterosis benefits for functional traits such as fertility and survival. Adding Guernsey, Ayrshire, or Brown Swiss sires into that mix—especially sires that are A2A2—is another way to bring in hybrid vigor and some of those pasture or functional traits without flipping the whole herd overnight.
Guernsey breeders like Tom Ripley, who has worked extensively with the American Guernsey Association, have shared field reports from producers who use Guernsey sires on Holstein cows and report improvements in calving ease, component levels, and, sometimes, fertility in the resulting crossbreds. These aren’t controlled university trials, and they’re not going to show up in Journal of Dairy Science the same way Teagasc’s work does, but they do line up with the broader crossbreeding literature from New Zealand and Ireland that shows heterosis boosting “functional” traits in many three‑breed systems.
What’s encouraging about that is it opens up revenue beyond the milk cheque for heritage breeders who are paying attention. If you’ve got a Guernsey, Ayrshire, or Brown Swiss family with real performance behind it—good components, sound udders, durable feet and legs—you may have an opportunity to sell semen or breeding stock into commercial herds that want those traits, even if your own milk still goes into a conventional pool.
The bigger genetic picture and why it matters
One more piece that matters more in the long run than in any given month’s milk statement is genetic diversity.
Geneticists working on dairy cattle have been pointing out for years that the effective population size of Holsteins—the number of unrelated founders you’d need to reproduce the existing genetic variation—is relatively small compared with the actual number of Holsteins in barns. That’s what happens when you run intense selection on a fairly narrow group of elite sires for multiple generations. It’s been great for yield and components, but it has nudged inbreeding steadily upward.
Scott’s 2023 analysis of selecting for A2 in the Australian Holstein population went a step further and showed that selecting for the A2 allele alone, without careful management of relationships, could increase both regional and genome‑wide inbreeding, because it narrows the sire pool even more. That’s not a reason to avoid A2 completely, but it’s a reminder that stacking too many selection criteria on top of each other in a single breed can have side effects you don’t fully feel until years down the road.
Heritage breeds like Guernsey, Ayrshire, and Brown Swiss carry trait combinations that aren’t easy to rebuild if we lose them—heat tolerance paired with decent components, strong grazing instincts with solid structure, and cheese‑friendly casein variants, just to name a few. The fact that Guernseys sit in that Watch category, with thresholds of fewer than 2,500 annual U.S. registrations and fewer than 10,000 registered animals globally, is a quiet alarm bell that those options are not endless.
Breed
Annual U.S. Registrations
Est. Global Population
Conservation Status
Holstein
>200,000
>10 million
Not at risk
Jersey
~40,000
~1 million
Not at risk
Guernsey
<2,500
<10,000
Watch
Ayrshire
<1,000
<5,000
Threatened
Brown Swiss
~5,000
~50,000
Watch
Milking Shorthorn
<500
<3,000
Critical
Source: The Livestock Conservancy Conservation Priority List; breed association estimates
It doesn’t mean every commercial herd needs to go buy a string of Guernseys tomorrow. But it does mean that breed associations, co‑ops, and policy folks should be thinking consciously about whether they want those tools still available when our kids and grandkids are the ones making the breeding decisions.
So, where does this leave you in 2026?
Looking at this trend as a progressive producer, you start to see where the real decision points sit once the dust from the A2 hype settles.
A few things stand out:
Consumer preferences around A2, local, grass‑based, and heritage products are real in certain markets, especially urban and higher‑income areas, but they’re patchy. Survey‑based work on A2 consumer preferences in Europe and Oceania shows that some shoppers will pay a noticeable premium for A2 milk, while others don’t see enough perceived benefit to justify switching from conventional milk, which mirrors what many of us see in farm stores and markets.
Heat stress and climate volatility are already costing the dairy sector serious money in lost production and fertility, and those costs are expected to grow rather than shrink. Economic analyses of heat stress in U.S. dairy herds estimate total losses in the billion‑dollar range annually, once you add up milk yield, reproduction, and health impacts. Cows that handle heat and weather swings better are going to become more valuable in most regions.
Infrastructure support for new models is becoming increasingly flexible. Vermont’s Working Lands Enterprise Initiative, Wisconsin’s Dairy Innovation Hub, and similar programs are investing public funds in on-farm processing, small regional plants, and broader dairy innovation projects. That doesn’t guarantee success, but it does mean there’s some help out there if you want to test a new model rather than go it completely alone.
Genetic diversification remains an under‑valued hedge. Whether it’s crossbreeding, bringing in some heritage lines, or just broadening your selection goals beyond the next hundred pounds of milk, diversifying your genetics can give you more room to manoeuvre when markets, policies, or weather patterns shift.
Coffee‑table takeaways, now that the mugs are half empty
If you’re already milking heritage cows, the big takeaway is that A2 is a nice card to have, but it’s not the ace by itself. The herds that are winning with heritage breeds right now are stacking A2 on top of strong butterfat performance, good grazing fit, on‑farm processing, and deep customer relationships. Before you spend a couple of hundred thousand dollars on stainless and concrete, it’s worth asking yourself whether you can realistically see a blended return in that $45+/cwt equivalent range through bottled milk and value‑added products in your area. If you can’t, you may find that your energy is better spent tightening your grazing, strengthening your direct‑to‑consumer channels, or positioning your herd as a source of genetics for crossbreeding and semen sales.
If you’re thinking about moving into heritage breeds, it’s worth starting not with the cow but with the market. Who exactly would buy this milk? In which form? At what price? Is there a realistic path to processing either on‑farm or through a small creamery that’s willing to build a heritage or A2 brand with you? Spending a day or two with people who already made that jump—walking their plant, talking about their transition period, and listening to their cash‑flow stories—is probably one of the best investments you can make before you call a Guernsey breeder. And don’t forget to think about genetic revenue: semen, embryos, and breeding stock can all sit alongside the milk cheque if you build the reputation and the data.
If you’re looking at things more from the 30,000‑foot view—maybe you’re involved in a co‑op board, a breed organization, or a policy group—then the message is that heritage breeds aren’t going to be “saved” by the A2 boom alone. But they still have important roles to play in crossbreeding programs, in pasture‑based systems, and as a reservoir of traits we may need badly in years to come. Supporting more flexible processing infrastructure, targeted grants, and thoughtful breeding work may do more to keep those options alive than any single A2 marketing campaign.
In the end, the A2 boom didn’t so much ignore heritage breeds as flow into the channels that were already built: big Holstein herds, big plants, big distribution. That’s frustrating if you’ve been sitting on a naturally A2 herd for decades. But once you see it clearly, it also frees you up.
Instead of waiting for the system to notice and reward you, you can decide whether you want to build a different kind of business around your cows, or whether you’re better off using their genetics as one tool in a broader, more diversified strategy. It’s more work either way, no doubt about it. But as many of us have seen on farms that have made these choices with clear eyes and solid numbers, that’s also where the real, lasting opportunities tend to live.
Key Takeaways:
A2 isn’t a heritage lock‑in. It’s a single‑gene trait Holsteins copied fast once the market cared—Guernseys’ natural head start didn’t last.
Plant math decides who gets the premium. Most processors need ~50,000 lb A2 runs to justify segregation; a 150‑cow Guernsey herd’s 3–4,000 lb/day just disappears into the bulk tank.
On‑farm processing can pay, but know your numbers. Expect $175K–$325K capex and aim for $45+/cwt blended returns—if you can’t see that path in your market, stainless may not be your move.
Winning heritage herds stack premiums, not just genes. A2 opens doors, but repeat customers come back for cream‑top bottles, local identity, pasture stories, and real relationships.
Heritage genetics still matter—for crossbreeding, grazing, and the long game. Functional traits, heat tolerance, and diversity are worth more as inbreeding and climate pressure keep rising.
Executive Summary:
This feature digs into a simple question a lot of producers are asking: if A2 milk is headed toward a $7.6 billion global market, why are Guernseys still on the Watch list instead of cashing in? It shows that A2 is just a single‑gene switch Holsteins adopted quickly, while the real gatekeeper is plant design—big processors need 50,000‑lb A2 runs from 5,000‑cow herds, not 3–4,000 lb/day from 150‑cow heritage barns. You’ll see the hard numbers on on‑farm processing—typical $175,000–$325,000 capex and blended $48–$65/cwt returns—so you can tell if a bottling room pencils out for your postcode or just steals sleep and cashflow. The article profiles Two Guernsey Girls in Wisconsin and Eby Manor in Ontario to show how some herds are actually making heritage genetics pay by stacking A2 with grass‑based stories, cream‑top bottles, and value‑added products. It also walks through where heritage genes fit into crossbreeding, pasture‑based systems, and long‑term genetic diversity, especially as heat stress and inbreeding pressure keep rising. The piece ends with clear, coffee‑table style takeaways that help you decide whether your best move is chasing A2 contracts, investing in stainless, leaning into crossbreeding, or staying bulk and focusing on the cows and markets you already do best.
Complete references and supporting documentation are available upon request by contacting the editorial team at editor@thebullvine.com.
What Lactalis’s 270-Farm Cut Really Means for Every Producer – Exposes why commodity milk is effectively dead and how to navigate the 18-month decision window before major processors shut you out. Delivers a hard-nosed roadmap for transitioning into the premium specialty markets that actually pay.
Every week, thousands of producers, breeders, and industry insiders open Bullvine Weekly for genetics insights, market shifts, and profit strategies they won’t find anywhere else. One email. Five minutes. Smarter decisions all week.
$4,000 for a replacement heifer. $875 for a dairy bull calf. But 72% of farms get up to $1,450 for beef-cross calves, AND cut replacement needs by 30%. The $500K swing isn’t theory—it’s math.
Last spring, I was talking with a Wisconsin dairy producer who described a moment that’s becoming increasingly common across the industry. He’d just finished reviewing his 2024 breeding costs—nearly $38,000 between sexed semen, genomic testing, and beef genetics—and realized he was spending six times what his father had budgeted for the same line item in 2018. The question that kept him up that night wasn’t whether the investment was worthwhile. It was whether he was even measuring the right outcomes anymore.
You know, that producer’s experience captures something significant happening across North American dairy right now. For generations, farmers identified themselves by the breed they milked. Holstein operators pointed to volume records and global market dominance. Jersey advocates countered with components, feed efficiency, and longevity. These conversations shaped industry gatherings, show ring rivalries, and breeding decisions for the better part of a century.
But something’s shifted over the past decade. While traditionalists continued debating which breed was superior, many producers started asking a different question entirely: “What combination of genetics—regardless of color—maximizes my return on investment?”
The answers to that question are reshaping dairy genetics in ways that would have seemed unlikely just 15 years ago.
The Numbers Behind the Shift
The breeding landscape has changed dramatically in just five years, and the National Association of Animal Breeders’ 2024 year-end report tells the story pretty clearly. Gender-selected semen now accounts for 61% of all dairy breeding decisions in the United States—that’s 9.9 million units out of 16.1 million total domestic dairy units sold. We’ve come a long way from roughly 35% back in 2019.
Technology
2019 Rate
2024 Rate
Growth
Sexed Semen
35%
61%
+26 pts
Beef-on-Dairy
15%
72%
+57 pts
And beef-on-dairy? Those crosses have surged to 7.9 million units annually, making beef genetics the fastest-growing category in dairy barns across the country. According to American Farm Bureau analysis, 72% of dairy farms are now using beef genetics to boost the value of calves from lower-performing cows—a remarkable adoption rate for a strategy that barely existed a decade ago.
Meanwhile, USDA data confirms that replacement heifer inventories have dropped to historic lows. The January 2025 Cattle report shows heifers expected to calve this year at roughly 2.5 million head—the lowest since USDA started tracking this series back in 2001. Total dairy heifers are sitting at levels we haven’t seen since 1978.
Year
Heifer Shortage (thousands)
Springer Price ($)
2023
0
1,720
2024
-200
2,400
2025
-400
3,010
2026
-438
3,800
2027
-153
4,500
These trends connect in important ways, reshaping how dairy operations think about genetic investment, replacement economics, and long-term profitability.
How Technology Changed the Breeding Playbook
Understanding today’s genetics landscape means recognizing how fundamentally the rules have changed since 2010.
The traditional purebred breeding model rested on a straightforward biological constraint: farmers needed to produce enough replacement heifers from their own herds to maintain herd size. This meant breeding most cows to bulls of their chosen breed, creating an inherent link between breed loyalty and operational necessity.
Gender-selected semen technology changed that equation entirely.
Here’s how to think about it: The old model was essentially a closed loop—every cow bred to a dairy bull, every heifer raised as a potential replacement, every bull calf sold for whatever the market offered. Today’s model is more of a segmented herd approach. Your top 15-20% of cows get sexed dairy semen to produce your replacements. Your bottom tier gets beef genetics to produce premium calves. And your middle tier? That’s where the economic optimization happens—balancing replacement needs against beef calf revenue based on your pregnancy rate and market conditions.
This shift from “closed loop” to “segmented herd” represents a fundamental change in how dairy barns function economically.
When farmers can achieve 90%+ heifer conception rates with sexed semen—something that’s become routine with modern sorting technology—they no longer need to breed their entire herd for replacements. A 500-cow operation that needs 110 replacement heifers annually can now direct its top genetics to dairy sires and point the remaining breedings elsewhere.
For most operations, “elsewhere” increasingly means beef genetics. Research by Dr. Victor Cabrera and his team at the University of Wisconsin-Madison has documented that beef-cross calves command substantial premiums over pure dairy bull calves at auction. Current market data shows beef-cross calves bringing $1,250-$1,700 per head compared to$750-$1,000 for dairy bull calves—a premium of $500-$700 per calf that adds up fast across a herd.
Pregnancy Rate
Breeding Strategy
Beef Breeding %
Risk Level
Below 25%
FIX REPRODUCTION FIRST
0-10%
N/A – Focus on fertility
25-28%
Limited beef breeding
15-25%
Moderate
28-30%
Balanced approach
40-50%
Low
Above 30%
Aggressive beef program
60-70%
Very Low
That revenue shift matters. On a 500-cow operation producing 350+ calves from non-replacement breedings, the difference between $875 average for dairy bulls and $1,450 average for beef-crosses represents over $200,000 in additional annual revenue—before you even factor in the replacement heifer math.
The Quiet Crisis at Breed Associations
Here’s where we need to have an honest conversation about what’s happening to breed associations—and whether the current model can adapt.
Holstein Association USA CEO Lindsey Worden acknowledged the situation directly in her 2024 State of the Association address: registrations decreased 8% from 2023, and participation in core programs like Herd Complete dropped 4% in both animals and herds. What’s notable is that Worden attributed the decline directly to fewer Holstein heifers being born as more dairies breed cows to beef.
Industry data shows Holstein’s share of the U.S. dairy herd has declined from around 90% in the early 2010s. Meanwhile, crossbred dairy animals have grown significantly—Council on Dairy Cattle Breeding data shows their numbers increased from fewer than 3,000 in 1990 to over 207,000 by 2018, with continued growth since as crossbreeding programs have expanded.
Budget Category
Annual Cost
% of Total
Genomic Testing
$24,000
63.2%
Sexed Dairy Semen
$7,500
19.7%
Data Analytics/Consulting
$4,250
11.2%
Beef-on-Dairy Semen
$2,850
7.5%
Breed Association Services
$300
0.8%
Breed association fees now represent less than 1% of what commercial operations spend on genetics. When registrations, classification, and breed services capture such a tiny slice of the breeding dollar, you have to ask: Is the current association model serving today’s commercial dairy industry, or is it serving a shrinking segment that values pedigree for its own sake?
The Bullvine has been asking this question for years. As we noted in our analysis, “Are Dairy Cattle Breed Associations Nearing Extinction?” Breed associations face mounting pressure from technological advancements, shifting market demands, and environmental concerns—all while struggling with leadership transitions and declining relevance to commercial producers.
The Case for Associations: A Different Perspective
To be fair, association leaders push back on the “declining relevance” narrative—and they have some data to support their position.
Worden, in a recent interview, offered a direct counter-argument: “Animal identification is the foundation to any genetic program, and that’s our core business. From there, the goal is to make it easy for every herd, large or small, to capture value with the Holstein cow.”
She points to growth in other metrics even as registrations decline. In 2024, Holstein USA officially identified 544,438 Holsteins in the herdbook—up 16% from the prior year. The Basic ID program, which provides official ear tags, sire/dam identification, and birthdate recording at a lower cost than full registration, grew 10%.
“Basic ID is an inexpensive way for herds to get involved,” Worden explained. “With an official ear tag, sire, dam, and birthdate, plus genomic testing, we can start showing the value of having data in the national database, not just in Dairy Comp on the farm.”
She also highlighted breed performance gains: In 2024, Holstein USA’s TriStar 305-day mature equivalent averages surpassed 1,200 pounds of fat for the first time, protein topped 900 pounds, and milk hit 28,443 pounds.
“We still offer all the same programs our longtime members value,” Worden commented in a recent interview. “If someone wants to register a calf with a photo and a paper application, we’ll do that. But we’ve also streamlined programs, invested in I.T., and created automated processes for large herds. We have herds milking 10,000 cows or more, so we’ve made it as efficient and seamless as possible.”
The question isn’t whether breed associations will survive. Some will. The question is whether they can evolve from membership organizations selling breed identity to service organizations selling genetic value—and do so fast enough to remain relevant when the value proposition has fundamentally shifted.
What Crossbreeding Adopters Are Experiencing
The documented results from systematic crossbreeding programs offer useful data points for producers evaluating their options.
The ProCROSS system—a structured rotation of Holstein, VikingRed, and Montbéliarde genetics developed through collaboration between Coopex Montbéliarde in France, VikingGenetics in Scandinavia, and CRV in the Netherlands—has accumulated over a decade of commercial data across multiple countries.
A University of Minnesota study led by Dr. Amy Hazel, Dr. Brad Heins, and Dr. Les Hansen tracked 3,550 cows across seven commercial dairies from first calving through multiple lactations. Their findings, published in the Journal of Dairy Science in 2017, showed ProCROSS crossbreds produced at least as much milk solids, gave birth to more live calves, were more fertile, and returned to peak production sooner than their pure Holstein herdmates.
The economics are worth examining closely. Research published in the Journal of Dairy Science by Clasen and colleagues in 2020 calculated crossbreeding advantages, including:
€20-59 higher contribution margin per cow per year compared to pure Holsteins
30.1% replacement rate versus 39.3% for pure Holsteins—roughly 45 fewer replacements needed annually on a 500-cow dairy
Improved fertility is driving most of the economic gain, with health cost reductions adding further margin
Ongoing research at the University of Minnesota’s West Central Research and Outreach Center in Morris continues to track these outcomes. According to recent NIMSS project reports, crossbred cows in their studies show daily profit 13% higher for two-breed crossbreds and 9% higher for three-breed crossbreds compared to their Holstein herdmates, with lifetime death loss 4% lower for both crossbred groups.
From Wisconsin to California: U.S. Operations Are Implementing at Scale
It’s one thing to see research data. It’s another to see it work on commercial farms across different scales and regions.
Dornacker Prairies is a 360-cow dairy in Wisconsin run by fifth-generation farmer Allen Dornacker and his wife Nancy, in partnership with Allen’s parents Ralph and Arlene. According to VikingGenetics case study materials, the farm has embraced both crossbreeding and robotic milking as part of their strategy to future-proof the operation.
The Dornackers transitioned to robotic milking in 2018, installing Lely A5 robots, and have built their ProCROSS program alongside the technology investment. Their production runs around 9,200 kg per year, with 4.6% fat and 3.6% protein—strong component levels that align with research findings on crossbred performance. They also rear dairy-cross beef calves, capturing value on both sides of the breeding decision.
What’s notable about the Dornacker operation is how it represents a typical Wisconsin dairy in scale—the state averages around 350 cows per farm—while implementing progressive breeding and technology strategies. They’re 90% self-sufficient in feed, growing their own soybeans, alfalfa, corn, and winter wheat across 405 hectares.
But crossbreeding isn’t just for medium-scale family operations. In California—the nation’s largest milk-producing state—approximately 81% of dairy operations reported using beef semen in a 2020 survey cited in Choices Magazine research by Latack and Carvalho. These include many of the state’s large-scale operations, which run 2,000-5,000+ cows.
The scale of adoption is remarkable. According to The Bullvine’s market analysis, nearly 4 million crossbred calves were born nationally in 2024, with forecasts projecting that number could reach 6 million by 2026. Texas alone saw herd counts increase by 50,000 cows in 2024, complemented by a production spike of over 10% per cow—with beef-on-dairy breeding playing a significant role in the economics.
Tom and Karen Halton converted their 500-cow UK operation to ProCROSS roughly fifteen years ago. According to ProCROSS case study materials, Tom offered a candid perspective: “Without these cows doing what they have done, we wouldn’t still be farming.”
These results are encouraging, though it’s worth noting that crossbreeding success depends heavily on consistent implementation and appropriate genetic selection within the rotation.
When Master Breeders Face Commercial Realities
What’s particularly telling is how even elite breeders—those who’ve achieved the industry’s highest recognition—are adapting to commercial pressures.
Take Cherry Crest Holsteins in Ontario. Don Johnston and Nancy Beerwort, along with their son Kevin and wife Tammy, secured their third Master Breeder shield in 2024—a remarkable achievement made more impressive by the fact that the farm has undergone three complete herd dispersals in its history. Their philosophy prioritizes animal well-being, balanced breeding, and practical, economically sound decisions.
“The Master Breeder shield gives you the satisfaction that you’ve been making some of the right decisions,” Johnston said in an interview.
The ability to achieve elite breeding recognition despite multiple dispersals demonstrates an important point: successful breeding today requires adaptability and economic pragmatism, not just genetic idealism. The Johnstons rebuilt their program three times by consistently applying sound principles—identifying superior genetics, making economically rational decisions, and staying focused on what actually works.
This pragmatic approach is increasingly common among recognized breeders. The 2024 Holstein Canada Master Breeder class included operations running robots alongside tie-stalls, farms that started from scratch and achieved recognition in less than two decades, and multi-generational operations that have evolved their programs significantly to remain competitive.
The message from these elite breeders is clear: genetic excellence and commercial viability aren’t opposing forces. The best breeders find ways to achieve both.
The Case for Focused Purebred Programs
Crossbreeding isn’t the right answer for every operation, and some producers are achieving excellent results with focused purebred programs. This deserves equal attention.
The approach relies on intensive genomic testing of every heifer calf, strategic culling of bottom-tier genetics, and careful bull selection emphasizing productive life and fertility alongside traditional production traits. Producers with strong management systems, good facilities, and the discipline to cull strategically can build highly profitable purebred herds averaging 32,000+ pounds per cow with solid pregnancy rates.
Here’s what’s worth recognizing: the genetic tools that enable crossbreeding—genomic testing, sexed semen, data-driven selection—also enable more sophisticated purebred programs. The key consideration isn’t which approach is universally “better,” but whether a breeding program aligns with an operation’s management capacity, market access, and operational goals.
Jersey producers have seen particularly strong results in recent years. The US Jersey Journal reported in March 2025 that the breed achieved record production levels in 2024: 20,719 lbs milk with 5.08% fat and 3.77% protein on a mature equivalent basis—numbers that would have seemed ambitious a generation ago. For operations selling to processors with strong component premiums, Jersey genetics continue delivering compelling economics.
Why Components Are Driving Breeding Decisions
And those component premiums matter more than ever. According to CoBank’s lead dairy economist, Corey Geiger, multiple component pricing programs now allocate nearly 90% of the milk check value to butterfat and protein.
Here’s what that looks like in practice: Under Federal Milk Marketing Order pricing for December 2025, butterfat is valued at $1.7061 per pound according to the USDA’s Announcement of Class and Component Prices. For a producer shipping 100 pounds of milk, the difference between 3.5% and 4.5% butterfat represents roughly $1.70 per hundredweight—over $17,000 annually on a 1,000-cow dairy shipping 80 pounds per cow per day.
Real dollars at the farm level: According to MilkPay’s June 2025 component analysis, with butterfat valued at $2.66 per pound and protein at $2.48 per pound, increasing butterfat from 3.90% to 4.25% adds $0.93 per hundredweight. Increasing protein from 3.16% to 3.32% adds another $0.40 per hundredweight. Combined, that’s $1.33 per hundredweight of additional revenue—roughly $13,300 annually on a 1,000-cow operation.
Some cooperatives go further with quality incentives. Curtis Gerrits, senior dairy lending specialist at Compeer Financial, noted that Upper Midwest processors work with farmers who consistently deliver high-quality milk, offering approximately $0.85 per hundredweight in quality premiums for consistent volume and good components. That’s enough to make a real difference in margin.
The University of Wisconsin Extension’s February 2025 Dairy Market Update confirmed that U.S. butterfat tests hit 4.218% as of November 2024—up 0.088 percentage points from the prior year. Protein reached 3.29%. Both represent continued genetic progress, and both reward producers who’ve selected for components.
The message is clear: genetics that deliver components are genetics that deliver revenue. Whether that’s Jerseys, crossbreds emphasizing Montbéliarde or VikingRed, or Holsteins selected for component indexes—breeding decisions that ignore component trends are leaving money on the table.
The Genomics Paradox: Worth Understanding
This next point challenges some assumptions about genetic investment.
Genomic selection, introduced commercially in 2008-2009, promised to accelerate dairy breeding by nearly halving generation intervals. And genetic progress on paper has accelerated substantially—bulls are improving at rates that would have seemed unlikely under the old progeny-testing system.
Yet a peer-reviewed analysis by the Agricultural & Applied Economics Association in late 2024 found something worth noting: while genetic milk yield potential increased approximately 60-70% following genomic selection implementation, actual farm-level milk yield growth remained essentially unchanged at approximately 1.3% annually—the same rate as before genomics arrived.
“If your genetics are improving at 2% annually but your replacement costs are rising at 10%, you aren’t winning—you’re just running faster on a treadmill. The goal isn’t better cows in the abstract. It’s better margins on your operation.”
Why the disconnect? Management constraints often matter more than genetics—facilities, nutrition, and labor frequently limit genetic expression. Feed economics have shifted, meaning that higher production doesn’t always translate into higher profit. And inbreeding is accumulating faster under intensive genomic selection, with measurable implications for fertility and health traits.
Recent Canadian research adds another dimension. A study published in the Canadian Journal of Animal Science in December 2025 found that “While milk yield had improved, profitability had shown a negative genetic trend, which means that an exclusive focus on higher milk production is detrimental to long-term economic efficiency.”
This doesn’t mean genomic testing lacks value—for parentage verification, genetic defect screening, and informed culling decisions, it remains genuinely useful. But evaluate genomic investments against realistic expectations rather than theoretical maximums.
What Could Go Wrong: Risks Worth Understanding
Before diving into the economics comparison, let’s be honest about what could derail these strategies. No breeding approach is risk-free.
Beef market volatility is real—and it can move fast. In October 2025, cattle markets experienced a sharp correction. According to The Bullvine’s market analysis, crossbred calf values dropped significantly—an 11.5% decline in just twelve days. Drovers magazine noted that “tight supplies and strong demand could push cattle prices to even higher highs in 2025, but uncertainty is infusing more risk and volatility into the markets.”
Sexed semen isn’t foolproof. While the technology has improved dramatically, conception rates still run below those of conventional semen. According to ICBF data, the relative performance of sexed semen compared to conventional semen is about 92%. Industry data from British Dairying suggests that the current 4M technology achieves roughly 82-84% of conventional conception rates in well-managed herds. Herds that tried sexed semen and stopped reported much lower results—averaging just 37% conception with sexed versus 58% with conventional. Management and timing matter enormously.
Crossbreeding implementation failures happen. Research reviews have documented that crossbreeding programs can fail due to “insufficient funding, low return on investment in biotechnology, poor monitoring and evaluation of breeding programs.” Operations with excellent Holstein management may see less benefit from switching than operations struggling with purebred health and fertility issues.
Managing Beef Market Risk: New Tools Available
The good news? Risk management options have expanded significantly.
As of July 1, 2025, the USDA’s Livestock Risk Protection (LRP) program added a game-changing option: Unborn Calves Coverage specifically designed for beef and beef-on-dairy crossbred calves. According to Farm Credit East, this federally subsidized insurance program now allows dairy producers to lock in price protection for calves before they’re even born.
Here’s how it works: producers can protect calves intended for sale within 14 days of birth, with coverage levels allowing protection of up to $1,200 per calf. The program uses a price adjustment factor (multiplier) so producers can protect values closer to what they’re actually receiving at market.
Other risk mitigation strategies:
Forward contracting with calf buyers when prices are favorable
Diversifying beef sire selection across multiple breeds (Angus, Limousin, Simmental)
Maintaining breeding flexibility by keeping pregnancy rates high enough to shift back toward dairy replacements if beef markets weaken
Staggering calf sales throughout the year, rather than selling in large batches
What This Looks Like in Practice
Category
Traditional Approach
Sexed + Beef-on-Dairy
Annual Breeding Budget
$12,000
$38,000
Calf Revenue (200-350 calves)
$150,000 – $200,000
$437,500 – $595,000
Replacement Purchases Needed
($120,000 – $160,000)
($40,000 – $60,000)
Net Annual Position
($12,000) to +$28,000
+$340,000 to +$495,000
THE SWING
BASELINE
+$340K to +$500K
THE ECONOMICS THAT MATTER: A 500-COW COMPARISON
This is the calculation every dairy should run with their own numbers.
Traditional Approach (Conventional + Some Sexed Dairy Semen):
Replacement heifer purchases needed: 10-15 head at $4,000 = $40,000-$60,000
Net breeding/replacement position: +$340,000 to +$495,000
The Swing: $340,000 to $500,000+ difference in annual economics
Here’s the key insight: Dairy bull calves are finally worth real money—$750-$1,000 is nothing to dismiss. But beef-cross calves at $1,250-$1,700 are worth 50-70% MORE. That $500-$700 premium per calf, multiplied across 350 calves, is where the swing comes from.
RUN YOUR OWN NUMBERS
Plug in your operation’s actual figures to see where you stand:
Your Variable
Your Number
Industry Benchmark
Current pregnancy rate
___%
28-30% minimum for flexibility
Annual replacement rate
___%
30-35% typical, 25% achievable
Cost to raise a heifer
$___
$2,800-3,500
Current springer purchase price
$___
$3,800-4,200 (projected $4,500+ by 2027)
Dairy bull calf sale value
$___
$750-1,000
Beef-cross calf value (local market)
$___
$1,250-1,700
Sexed semen conception rate
___%
82-92% of conventional
Current butterfat test
___%
4.22% national average
Current protein test
___%
3.29% national average
Processor component premium
$___/cwt
$0.85-1.33/cwt typical
If your pregnancy rate is below 28%, focus there first. The best breeding strategy won’t overcome poor reproductive performance.
The Replacement Heifer Challenge Ahead: 2026-2027 Projections
One consequence of widespread beef-on-dairy adoption deserves attention for anyone planning breeding programs through 2027—and the projections are sobering.
With heifer inventories at multi-decade lows and springer prices reaching $4,000 or more in major dairy markets—CoBank reported top dairy heifers in California and Minnesota auction barns bringing upwards of $4,000 per head by mid-2025—replacement economics have fundamentally shifted.
But here’s what’s coming: According to CoBank’s modeling published in August 2025, dairy replacement inventories will not rebound until 2027. The numbers are stark:
2025 and 2026 combined: Nearly 800,000 fewer dairy replacements than needed
2026 specifically: The model predicts 438,844 fewer dairy heifers compared to 2025
2027 outlook: A potential net gain of 285,387 dairy heifers available for replacements compared to 2026—the first positive turn in years
The price trajectory tells the story. According to the USDA’s July 2025 Agricultural Prices report, dairy replacement prices have jumped from $1,720 per head in April 2023 to $3,010 per head—a 75% increase in just over two years.
University of Illinois dairy economist Mike Hutjens, in his 2026 Feed and Forage Outlook, summarized the situation: “The critical heifer shortage is expected to persist, with replacement heifer inventories projected to shrink further before a potential rebound in 2027. Farmers are already ‘hoarding’ older cows and adopting gender-sorted semen to maintain herd sizes.”
What this means for your 2025-2026 breeding decisions: Every heifer you breed to beef today affects your replacement availability in 2028-2029. The 30-month biology of dairy cattle doesn’t negotiate.
Dr. Victor Cabrera at the University of Wisconsin-Madison has modeled this extensively. His research suggests that operations need pregnancy rates of 28-30% to achieve meaningful flexibility in beef-on-dairy programs without compromising replacement availability. Herds below that threshold face harder tradeoffs.
Farmers navigating this environment are employing several strategies:
Extended productive life focus: Keeping healthy cows in the herd through 4-5 lactations reduces replacement needs by 20-30%
Precision replacement breeding: Using genomic testing to identify the top 15-20% of genetics for heifer production
Earlier breeding programs: Achieving first calving at 22-23 months rather than 24-26 months
Custom heifer partnerships: Contracting heifer development to manage capital constraints
Regional Realities: Context Matters
Optimal breeding strategies vary significantly by region, scale, and market access. There’s no universal answer.
Western mega-dairies in California, Idaho, Texas, and New Mexico, operating 3,000+ cows, often have dedicated reproduction teams and processor relationships that reward consistent volume. With 81% of California dairies already using beef semen and Texas adding 50,000 cows in 2024 alone, the Western region has embraced this shift at scale.
Midwest family operations in Wisconsin, Minnesota, Michigan, and Iowa, averaging 200-500 cows, face different considerations. Tighter labor availability and the need for management simplicity often make single-breed programs more practical. Operations like the Dornackers show that medium-scale farms can successfully implement crossbreeding—but it requires commitment and consistent execution.
Northeast and Mid-Atlantic producers contend with higher land costs and often-limited expansion options. For these farms, maximizing income per cow frequently drives breeding decisions toward higher-component breeds or crossbreeding systems emphasizing longevity.
Grazing-based operations prioritize different traits—moderate body size, strong feet and legs, and fertility under seasonal breeding pressure. These systems have long embraced crossbreeding or alternative breeds that don’t appear prominently in conventional AI catalogs.
The principle that emerges: matching genetic strategy to operational reality matters more than following any single approach.
Your Next 90 Days: Practical Steps
For farmers evaluating breeding strategies heading into 2025-2026, here are specific actions:
In the next 30 days:
Calculate your actual cost per replacement heifer—including all raising costs, not just purchase price. Many operations underestimate this by $500-800 per head.
Pull your pregnancy rate trend for the last 12 months. Is it above 28%? This single number determines how much flexibility you have.
In the next 60 days:
Get current beef-cross calf quotes from your local auction or buyer. Prices vary significantly by region and genetics—current ranges are $1,250- $1,700 for quality beef crosses.
Review what your processor is actually paying for. Check your milk statement for actual dollars per pound of butterfat and protein.
In the next 90 days:
Run the 500-cow comparison with your own numbers. See where your operation actually stands.
Talk to your AI rep about a pilot program. Start with 20% of breedings rather than a wholesale shift.
Contact your crop insurance agent about LRP Unborn Calves Coverage. The new coverage could protect up to $1,200 per calf against market downturns.
Questions to discuss with your advisors:
Can my management system capture the genetic potential I’m paying for?
Do I have the reproductive performance to support aggressive beef-on-dairy programs?
What’s my contingency if beef markets drop 15-20%?
Given CoBank’s projections of continued heifer tightness through 2026, should I be more conservative on beef breeding this year?
Looking Forward
The breed wars, as traditionally understood, may be evolving into something different. What’s emerging is a dairy genetics landscape where farmers can select from an expanding toolkit of genetic resources—purebred, crossbred, and integrated beef programs—based on what delivers sustainable profit for their specific operation.
This doesn’t mean breed identity disappears. Holstein, Jersey, and other purebred programs will continue serving producers who find success with focused genetic selection. Show rings will still draw interest. Elite breeders will still command premium prices for exceptional genetics. And as Lindsey Worden’s data shows, breed associations are finding new ways to deliver value—even if registrations decline, services like Basic ID and genomic integration are growing.
But for the commercial dairy industry—the operations producing the majority of North America’s milk supply—breeding decisions increasingly follow economic logic rather than breed loyalty alone.
The Bottom Line
That $340,000 to $500,000+ annual swing in breeding economics is real. Dairy bull calves at $750-$1,000 are finally worth something—but beef-crosses at $1,250-$1,700 are worth substantially more. The $500-$700 premium per calf, multiplied across hundreds of breedings, is where fortunes are being made or missed.
Whether that swing works in your favor depends on running the numbers—your numbers, not industry averages—and on making decisions that align with your management capacity, your market access, and your operation’s specific goals.
For producers willing to evaluate their options thoughtfully, that half-million-dollar swing represents a genuine opportunity.
KEY TAKEAWAYS:
The $500,000 breeding flip. Optimized operations capture $1,450 beef-cross calves instead of $875 dairy bulls—a $575 premium per head. Traditional approach: Still selling $875 calves when you could be netting $1,700. The annual swing on 500 cows: $340,000-$500,000+.
72% already pivoted. The 28% are leaving money on the table. Three-quarters of U.S. dairies use beef genetics. Haven’t switched? You’re missing $500-$700 per calf while competitors capture it.
Pregnancy rate is the gating factor. Below 28%? Fix reproduction—beef-on-dairy won’t save a broken repro program. Above 30%? Every dairy-bred bottom-tier cow costs $500-700 in missed calf premium per year.
Today’s breeding decision locks in 2028 economics. CoBank: heifer inventories won’t recover until 2027. Springers: $4,000+. The 30-month biology of cattle means this quarter’s breedings set replacement costs for three years.
New hedging tools match the strategy. USDA’s LRP Unborn Calves Coverage (launched July 2025) protects beef-cross calves up to $1,200/head—critical after October 2025’s 11.5% market correction.
EXECUTIVE SUMMARY:
The $500,000 question every dairy faces: Are you capturing the beef-on-dairy swing, or funding your competitors’ replacement heifers? Seventy-two percent of U.S. farms have already pivoted—using sexed semen on top genetics for replacements while turning bottom-tier breedings into $1,250-$1,700 beef-cross calves instead of $750-$1,000 dairy bull calves. The result: an annual economics flip of $340,000 to $500,000+, transforming breeding from modest revenue to a major profit driver. But timing matters—CoBank projects heifer inventories won’t recover until 2027, springer prices have hit $4,000, and every beef breeding today locks in your 2028 replacement position. This analysis delivers the complete breakdown: the threshold pregnancy rates that determine if beef-on-dairy works for you (hint: below 28%, fix that first), the October 2025 market correction that exposed downside risk, and a concrete 90-day action sequence. The 28% of operations still breeding traditional aren’t just missing upside—they’re leaving $500-$700 per calf on the table while subsidizing the heifer market for everyone else.
Complete references and supporting documentation are available upon request by contacting the editorial team at editor@thebullvine.com.
Learn More
Beef-on-Dairy’s $6,215 Secret: Why 72% of Herds Are Playing It Wrong – Delivers a tiered implementation roadmap that transforms breeding from a guessing game into a high-margin system. Use these specific pregnancy rate benchmarks to stop wasting sexed semen and start capturing maximum calf revenue immediately.
Every week, thousands of producers, breeders, and industry insiders open Bullvine Weekly for genetics insights, market shifts, and profit strategies they won’t find anywhere else. One email. Five minutes. Smarter decisions all week.
What dairy breeders are discovering about the gap between traits that theoretically eliminate bulls and the ones that actually prevent collection and sale
EXECUTIVE SUMMARY: The traits that should disqualify bulls increasingly don’t—and that gap is costing commercial producers real money. While genomic screening has driven lethal haplotype carriers below 2% according to Lactanet data, problematic traits like elevated SCS and marginal udders now get marketed with management caveats rather than screened out. Operations ranging from small tie-stalls to 20,000-cow multi-state enterprises share a striking philosophical alignment: cow families and validation matter more than catalog numbers alone. GenoSource tracks cow families across generations—their matriarch, Miss OCD Robust Delicious, Holstein International Cow of the Year in 2018, still contributes embryos today. McCarty Family Farms discovered that roughly a quarter of their parentage records were incorrect before implementing systematic tracking that now achieves compliance in the mid-to-high 90s. Canadian operations like Walnutlawn, Lovholm, and Bosdale have bred World Dairy Expo champions while focusing on cow families rather than chasing the latest rankings. Their shared conviction: genomics tells you what genes an animal carries, but pedigree analysis reveals whether families actually transmit predictably. Commercial producers can close this gap through greater sire diversification, realistic expectations about young genomic predictions, and systematic tracking of what actually works in their own herds.
Here’s a number that caught my attention when I first saw it: according to a 2023 paper in Animals describing the BullVal$ decision-support model developed at the University of Wisconsin-Madison, when researchers applied their economic framework to actual AI company inventory, they recommended culling 49% of bulls because their projected net present value was negative.
Nearly half. That’s not a typo.
Whether those bulls were actually removed from service? The paper doesn’t say. And honestly, that gap between “should cull” and “actually culled” tells you a lot about how knockout traits really work today.
For decades, the industry operated on a pretty straightforward premise: certain genetic weaknesses could render an otherwise elite bull unmarketable. Terrible udders on a high-production bull? Knockout. Daughters that couldn’t get pregnant despite great indexes? Knockout. These single-trait failures were supposed to disqualify bulls regardless of their other merits.
But the reality has gotten more nuanced. The traits that actually prevent bull collection have narrowed considerably, while the traits that probably deserve more scrutiny often get marketed around rather than screened out. With component prices holding strong and butterfat premiums rewarding production efficiency, the economic stakes of genetic decisions have rarely been higher. Understanding this dynamic matters whether you’re running 200 cows in Vermont or 5,000 in the Central Valley.
What Actually Constitutes a Knockout Trait Today
Let’s start with what genuinely prevents a bull from being collected and marketed. Based on industry data and published research, true knockouts fall into surprisingly narrow categories.
Physical impossibilities remain absolute barriers. Bulls that can’t produce viable semen, have poor libido, or produce semen that doesn’t survive freezing simply can’t generate revenue. Studies on breeding bull disposal consistently show that subfertility issues—especially poor semen quality, inadequate libido, and poor semen freezability—are among the leading reasons bulls get culled from AI programs. These physical limitations account for the vast majority of young bull removals, not genetic trait concerns.
Genomically verifiable defects create binary decisions. Haplotypes like HH1 through HH6, which cause embryonic loss or calf mortality, are now routinely screened via genomic testing. Genetic evaluation centers like CDCB publish carrier status for these defects on most bulls marketed in North America—it’s become standard practice.
The screening has been effective. Lactanet reports that for Canadian Holsteins born between 2020 and 2023, carrier frequencies for HH1 through HH4 are now below the 2% level. HH5 carriers have dropped to close to 5%, and HH6—discovered only in 2019—has reached nearly 2% for 2023 births. The newer concern is Early Onset Muscle Weakness Syndrome (MW), which Lactanet added to its routinely published evaluations in 2024. Because it’s a more recent addition to screening panels, carrier frequency remains higher and warrants continued attention. But for the established haplotypes, genomic testing has largely solved the problem before bulls ever reach collection—exactly what the technology was supposed to do.
Trait Category
Industry Performance
Current Status
Feedback Loop Speed
Farmer Action Needed
Lethal Haplotypes (HH1-HH4)
✓ Solved
Below 2% carriers
Immediate (genomic test)
Trust genomic screening
HH5 Haplotype
⚠ Improving
~5% carriers
Immediate (genomic test)
Verify carrier status
Somatic Cell Score (SCS)
⚠ Unresolved
Bulls >3.00 SCS still marketed
1-2 lactations
Apply personal cutoffs
Inbreeding Accumulation
✗ Worsening
Doubling annually vs. pre-genomic era
3-5+ generations
Diversify bloodlines now
Young Bull Prediction Accuracy
✗ Overstated
Common 100+ NM$ downward drift
5-6 years (daughter proof)
Mentally discount 10-15%
Stature Extremes
✓ Self-corrected
Market shifted to moderate
1-2 lactations
Select <+2.0 stature
You either carry the mutation, or you don’t. There’s simply no gray zone to work around.
Market-specific requirements have emerged as conditional knockouts—and they vary more by geography than most North American producers realize.
For Jersey programs in some regions, sexed semen production capability has become nearly essential. In VikingJersey herds, sexed semen usage reached 72% of all dairy inseminations by March 2021, according to VikingGenetics. In Norway, 99% of VikingJersey semen sales are sexed. In the United States, the trend is growing but less dramatic—Journal of Dairy Science data shows Jersey sexed semen usage increased from 24.5% to 32.1% between 2019 and 2021. Still, a Jersey bull that can only produce conventional semen faces a shrinking market regardless of his genetic merit.
Market/Region
Breed
Sexed Semen Usage (%)
Implication for Bulls
Norway
Jersey
99%
Cannot produce sexed = unmarketable
VikingJersey Herds (Mar 2021)
Jersey
72%
Sexed capability near-essential
United States (2019)
Jersey
24.5%
Conventional bulls still viable
United States (2021)
Jersey
32.1%
Growing pressure for sexed capability
A2A2 status has become essential for producers targeting A2 milk premiums—a consideration that barely existed ten years ago.
In Dutch and Flemish markets, the NVI total merit index places substantially more weight on functional traits—longevity, health, udder health, fertility, and claw health—than on production, according to CRV documentation. That’s a fundamentally different emphasis than TPI’s production-heavy weighting. Buyers in these markets apply stricter thresholds for feet and legs, udder health, and milking speed than typical US selection criteria.
What does that fragmentation mean practically? A bull that ranks elite on TPI may look mediocre on NVI or RZG because those indexes weigh traits so differently. Getting a sire that fits all systems requires more, not less, due diligence, as genomic selection has expanded internationally.
The Gray Zone: Traits That Deserve Attention But Don’t Stop Collection
Experienced breeders often report similar patterns when it comes to somatic cell score. Bulls with SCS predictions around 3.00 or higher tend to leave daughters with noticeable cell count issues. The correlation isn’t perfect, but it’s consistent enough that many elite operations treat elevated SCS as a serious concern regardless of other merits.
You’ve probably noticed this in your own cows. Genetic evaluations consistently show that higher SCS breeding values are associated with a higher genetic predisposition to mastitis, which is why many breeders treat elevated SCS as a red-flag trait when choosing sires.
But here’s the market reality—elite genetics operations represent a small fraction of total semen purchases. When a breeder decides not to use a bull because of concerning SCS, the AI company’s sales numbers barely register the difference. They’ve already moved thousands of units to commercial operations that evaluated the NM$ ranking and placed orders.
Regional Threshold Differences
What constitutes a knockout varies substantially by market—and understanding those differences matters if you’re selling genetics internationally or evaluating bulls developed for other markets.
European buyers, particularly in the Netherlands and Belgium, tend to apply harder cutoffs on functional traits than North American selectors. The Dutch-Flemish NVI devotes substantial weighting to health, fertility, longevity, and conformation, with claw health and saved feed costs explicitly included since 2018. A bull borderline on udder health or feet and legs might move thousands of units in Wisconsin but struggle to gain traction in the Dutch-Flemish market. Conversely, some international markets still use raw milk volume as a primary screening threshold—which might seem outdated to producers focused on fat-plus-protein economics, but reflects local pricing structures.
The practical implication: when evaluating an imported bull or one heavily marketed for “global” appeal, check how he actually ranks in his home market’s index system. Elite TPI doesn’t guarantee elite LPI, RZG, or NVI performance—and the gaps can be substantial.
Industry geneticists at major AI companies acknowledge that severely negative mammary scores effectively disqualify bulls in most international markets. That sounds like a knockout trait. But what actually happens when an elite genomic bull tests at + with a slightly negative udder composite?
In practice, the marketing materials emphasize his exceptional production genetics and outstanding feet and legs. The udder concern gets mentioned—but perhaps framed as “best suited for herds with excellent management protocols.” Let me be direct about what that language means: when a catalog says a bull is “best suited for excellent management,” it’s a signal that his daughters will need him. The bull gets collected. The semen gets sold. And to be fair, in many well-managed operations, those daughters may perform just fine.
This isn’t meant as criticism of AI companies—they’re responding to market signals and customer demand. But it does mean commercial producers benefit from understanding that “knockout trait” and “marketed with management caveats” represent different categories.
The Stature Correction: How Trait Priorities Actually Shift
Perhaps no trait better illustrates how genetic priorities evolve—and why some corrections happen faster than others—than stature.
For decades, the dairy industry selected for taller cows. Show rings rewarded height. Classification systems scored it positively. The prevailing assumption was that a bigger frame meant bigger capacity for high production.
That’s changed. Tall bulls that would have commanded premiums a decade ago now face resistance in many markets—a change driven largely by commercial producer feedback rather than show ring preferences.
What changed wasn’t the underlying biology. What changed was that commercial producers—particularly those with freestall facilities—accumulated enough direct experience to question the institutional preference for height. Many breeders with freestall operations learned the same lesson independently: their tallest cows didn’t hold up as well in the stalls, often ending up moved to alternative housing or culled earlier than expected.
Research eventually caught up to what farmers were observing. A Canadian Dairy Network analysis found that stature had essentially no meaningful correlation with herd life compared with other functional traits—despite decades of positive selection for tall cows. European research has similarly shown that very heavy cows are often less efficient than moderate-weight animals, producing less milk per unit of feed intake at the extremes of body size.
Why did the stature correction actually work? A few key characteristics made the difference:
The problem was visible within individual herds. Farmers could see their tall cows go lame, struggle with stall fit, and get culled earlier. Attribution was relatively clear—tall cows had specific, observable problems that were harder to blame on nutrition or management alone. The solution was straightforward: select for moderate stature. And crucially, there was no competitive penalty—shorter bulls still carried high genetic merit for production.
This last point matters enormously. When you can address a problem without sacrificing production, the market tends to self-correct. When fixing a problem means accepting lower genetic merit… those corrections stall. Sometimes for decades.
The Problems That May Not Self-Correct
Here’s where the conversation gets more complicated—and more important for long-term planning.
Inbreeding rates are increasing. A 2022 study in Frontiers in Veterinary Science analyzing Italian Holstein populations found that genomic inbreeding has been increasing measurably since the adoption of genomic selection, with annual genomic inbreeding growth roughly doubling compared to the pre-genomic era. Studies in Dutch-Flemish, French, and North American populations show broadly similar patterns.
Why doesn’t this trigger a market correction like stature did? Probably because inbreeding depression manifests through diffuse symptoms—slightly lower fertility here, slightly higher disease incidence there, somewhat shorter productive life. No individual producer can easily identify inbreeding as the specific cause of their herd’s challenges. The effect appears real, but it’s invisible primarily at the individual farm level.
Genomic predictions for young bulls tend to be optimistic. Canadian and US evaluation centers have documented that daughter proofs for genomically preselected sires often drift downward relative to their original genomic predictions. The mechanism makes sense: when you genomically test millions of animals and select the absolute best fraction of a percent as bull mothers, you’re selecting from an already pre-selected population. The genomic model assumes something closer to random sampling. Reality works differently.
We’ve seen this pattern play out as daughter data accumulates. Several heavily-used young sires from 2021-2022 have come in meaningfully below their original predictions—in some cases by 100 points or more on NM$. The pattern isn’t universal—some bulls hold or even improve—but the downward drift is common enough that mentally discounting those catalog numbers reflects reality better than taking them at face value.
What does this mean practically? Consider this scenario: if you’re selecting bulls at +900NM$ expecting +$900 performance, but reality delivers something closer to +$720, that’s a meaningful gap in genetic merit you’re not capturing. Across 100 replacement heifers per year, that kind of shortfall adds up to real money—potentially tens of thousands of dollars annually in genetic value you expected but didn’t receive. That’s not a published industry average; it’s a realistic scenario producers should be prepared for when relying heavily on young genomic bulls.
Heat tolerance is becoming increasingly relevant. Genetic and management research has highlighted a tension between high production and heat tolerance. Higher-producing cows generate more metabolic heat, making them more vulnerable to heat stress in hot, humid conditions—a relationship that Lactanet and other organizations have flagged in their heat-tolerance extension materials.
This tension between genetic selection and climate adaptation may not self-correct through normal market mechanisms. The feedback is slow, attribution is difficult, and any producer who prioritizes heat tolerance typically accepts some trade-offs in production metrics. For operations in the Southeast or Southwest, this is already pressing. Upper Midwest operations have more runway, but increasingly intense summer heat events are changing that calculus.
The Feedback Loop Challenge
What really distinguishes problems that get market correction from problems that persist?
Stature got corrected because problems became visible in 1-2 lactations, cause-and-effect was reasonably clear, solutions didn’t require sacrificing production, and individual farmer decisions aggregated into a market signal.
Challenges like inbreeding accumulation, genomic prediction bias, and heat tolerance adaptation may persist because problems emerge gradually across 3-5+ lactations, attribution is genuinely difficult at the individual herd level, solutions often involve trade-offs against genetic merit, and there’s no clear mechanism for individual observations to aggregate into market pressure.
Here’s a concrete timeline that illustrates the problem: A bull marketed heavily in early 2021 produces daughters that start calving in late 2022. You get meaningful first-lactation performance data by mid-2024. By the time you have enough information to evaluate whether he delivered on his genomic promise—late 2025—you’ve already bred to his sons and grandsons for two or three generations. If there’s a problem, it’s already propagated through your herd before you knew it existed.
Genomic selection compressed generation intervals to 2.3 years—bulls have grandsons breeding before their daughters even finish first lactation. Meaningful validation requires 5-6 years, creating a catastrophic timing mismatch
Genomic selection now proceeds in 2-3 year cycles—generation intervals have dropped from around 5 years pre-genomic to as low as 2.3 years for some selection pathways. But daughter performance feedback still takes 5-6 years to accumulate. The math doesn’t work in the producer’s favor.
To be fair, genomics has delivered substantial progress on many traits—something AI company geneticists rightly point to when defending the system. US data from CDCB and Holstein USA show that rates of severe calving difficulty have dropped substantially over the past few decades as breeders have consistently selected for calving ease. But calving ease had characteristics that enabled rapid correction: immediate feedback, clear attribution, and universal agreement that it was worth addressing.
The traits that concern forward-thinking breeders today often lack those same characteristics.
What Elite Operations Do Differently
Two operations—one placing around 200 bulls into AI annually from a large Iowa herd, the other managing the largest registered Holstein herd in the United States across multiple states—share a striking philosophical alignment with smaller, elite breeders: cow families and validation matter more than catalog numbers alone.
The Genomic Validators
“We’re not afraid to mate apparent opposites. Progress requires calculated risks,” says Kyle Demmer, COO of GenoSource, a family-owned Iowa operation that’s become a global genetics powerhouse since eight families combined their herds in 2014. But those calculated risks aren’t blind bets on genomic numbers—they’re grounded in cow-family evaluation spanning generations.
When GenoSource CEO Tim Rauen discusses his favorite cow, the answer isn’t their highest-testing heifer. It’s T-Spruce Jaela 47718 VG-87. As Rauen explained in The Bullvine’s profile of the operation: “Out of her, already more than 50 sons, grandsons, and great-grandsons have left for AI, so she will truly have a lot of influence.” That’s not a genomic prediction—that’s multi-generational transmitting consistency you can actually verify.
Their legendary Miss OCD Robust Delicious proves the point even more dramatically. Named Holstein International Cow of the Year in 2018, this bovine matriarch still contributes valuable embryos to their program today. Her genetic fingerprint is evident across their top GTPI sires. Rauen notes that Delicious combines high genetic merit with strong mammary traits and efficiency, which is why her influence shows up in so many of GenoSource’s highest-ranking bulls. In an industry where youth often reigns supreme, Delicious demonstrates that longevity and productivity can validate genomic promise—but only if you’re tracking results long enough to see it.
GenoSource’s approach to show cattle reinforces this philosophy. Their three-time World Dairy Expo champion Ladyrose Caught Your Eye-ET isn’t just a show animal—sixteen of her daughters score VG-87 or higher and are productive members of working herds, according to The Bullvine’s coverage. That’s the kind of validation genomics alone can’t provide.
The operation tests a large number of bull candidates annually, placing around 200 in AI programs with companies such as Select Sires, Semex, ABS, and others. But what separates GenoSource from operations that simply chase genomic numbers is their insistence on tracking cow families across generations—verifying whether genomic promise translates into barn performance.
The Data-Driven Approach at Scale
At McCarty Family Farms—2025 World Dairy Expo Dairy Producers of the Year, operating the largest herd of registered Holsteins in the United States across Kansas, Nebraska, and Ohio—the approach scales differently, but the principle holds.
“Unlike managing by feel, we allow the data to drive many of our decisions,” Ken McCarty has explained. But critically, that data isn’t just genomic predictions—it’s actual performance systematically tracked across their operation.
When the McCartys first implemented comprehensive genomic testing, they discovered something sobering: roughly a quarter of recorded parentage in their herd was incorrect. As Ken reflected in interviews, how can you drive appropriate genetic progress or make the breeding decisions that will propel your business forward with that kind of foundational error? Today, after overhauling data capture and mating systems, their monthly compliance reports for mating recommendations consistently reach the mid-to-high 90% range.
McCarty’s standardization approach offers a template for commercial operations. Each farm operates the same synchronization protocols, treatment protocols, breeding strategies, and vaccination strategies. This consistency across their multi-site operation creates the statistical power to identify which sire families actually deliver—and which disappoint.
Since the early 2010s, they’ve increased both milk yield and overall output per cow substantially as the operation expanded, reflecting the combined impact of genetics, nutrition, and management changes. Their focus on genetic enhancement of milk protein content, which is notably harder to improve via diet than butterfat, serves both customer demand and sustainability goals.
Ken acknowledges they haven’t abandoned traditional cow sense—they’ve augmented it with technology and analytics. Being able to sharpen the focus on traits where the herd may be deficient has been transformational, he notes. Their newest facility in Rexford, Kansas, completed in 2023, reflects this commitment to both scale and precision management.
The Common Thread
What GenoSource and McCarty share with smaller elite breeders isn’t rejection of genomics—both operations embrace genomic testing extensively. What they share is a conviction that validation matters.
GenoSource tracks cow families across generations. Jaela’s 50+ descendants to AI, Delicious still producing and contributing embryos, Captain’s daughters showing up in global herds while his grandsons continue the legacy. McCarty standardizes protocols specifically to enable performance comparison—consistent data entry, identical definitions across locations, real-time feedback on what’s actually working. Both prioritize multi-generational transmitting consistency over single-point genomic tests.
Rauen captures the philosophy when discussing their flagship bull GenoSource Captain: “Captain’s consistency across generations is unprecedented. His daughters dominate global herds while his grandsons, like Garza, continue the legacy.” Consistency—that’s what genomic predictions alone can’t guarantee.
The practical application for commercial producers is clear: when evaluating bulls, verify how the cow family has performed across multiple generations and multiple environments. Check if daughters from that line actually delivered on the genomic promise in similar operations to yours. Elite operations at every scale don’t trust catalog numbers alone.
Proof of Concept From Small Herds
While operations like GenoSource and McCarty demonstrate these principles at commercial scale, it’s worth noting what smaller operations have accomplished. Recent Bullvine profiles have highlighted Canadian herds such as Walnutlawn, Lovholm, and Bosdale, which have bred World Dairy Expo champions and amassed impressive numbers of Excellent-classified cows relative to their herd sizes.
“Cow families are probably number one,” says Michael Lovich of Lovholm Holsteins. “If I don’t like the cow family the bull comes from, we won’t use him. When I see bulls that are out of three unscored dams, I don’t care what the numbers are.”
Their cows average considerably longer productive lives than the industry norm. When you can keep cows productive that much longer than average, your entire economic model shifts.
The common thread across all these operations—whether 72 cows or approaching 20,000—is disciplined focus on cow families and consistent transmission, not just chasing the latest bull rankings.
Practical Strategies for Commercial Operations
Given these market realities, what can commercial producers actually do? You can’t completely insulate yourself from system-wide dynamics—but you can meaningfully reduce your exposure.
Strategy
Bulls Used
Avg. Genetic Merit
Risk if 2 Bulls Disappoint
Annual Cost/Cow
Verdict
Concentrated “Elite”
4-6 bulls
Top rankings (+NM$)
$20,000-$40,000 lossacross 3-4 years(40-50% of breedings affected)
$0 genetic trade-off+ high disappointment risk
High risk
Diversified Insurance
10-15 bulls
85th-95th percentile(20-30 NM$ lower)
$4,000-$8,000 lossacross 3-4 years(15-20% of breedings affected)
Diversify more than conventional wisdom suggests. If you’re currently using 4-6 bulls, consider spreading across 10-15. The genetic merit trade-off is real—you might average 20-30 NM$ lower across breedings compared to concentrating in your top picks. On a 500-cow herd, that’s foregone genetic potential.
But here’s the math that matters: if two of your concentrated bulls disappoint significantly—which happens more often than catalog marketing suggests—you’ve absorbed that loss across a large portion of your herd. When you spread breedings across more sires, individual disappointments hurt less. The insurance usually wins.
Recognize which predictions deserve more confidence. Production traits (milk, fat, protein) and linear type traits have relatively strong genomic prediction accuracy—reliability often above 70%—because they’re highly heritable and measured on enormous reference populations.
Trait Category
Reliability(%)
Confidence Level
Milk production
75%
High – Trust prediction
Fat production
75%
High – Trust prediction
Protein production
73%
High – Trust prediction
Linear type traits
68%
High – Trust prediction
Somatic cell score
40%
Medium – Moderate confidence
Longevity
15%
Low – Skepticism warranted
Metabolic resilience
8%
Low – Skepticism warranted
Daughter fertility (DPR)
4%
Very Low – Near guesswork
Daughter fertility (heritability around 4%), metabolic resilience, and longevity have substantially lower prediction accuracy. When choosing between bulls with similar production indexes, consider breaking the tie based on proven functional traits from older bulls in the pedigree.
Develop your own red flag checklist:
SCS above +2.8 (potential mastitis pressure—could cost $100-200/cow annually based on university extension estimates)
Stature above +2.0 (mobility and facility-fit considerations)
Extreme production combined with a negative udder composite (potential antagonism)
Heavy concentration of single bloodlines in recent generations (inbreeding risk)
Consider the 85th-95th percentile rather than chasing top rankings. Bulls in the 85th-95th percentile typically deliver strong genetic gain without the extreme trait combinations that sometimes accompany absolute top rankings. You might sacrifice 50-100 pounds of milk per lactation—call it $8-15 per cow annually at current component prices—but potentially avoid antagonisms that accompany extreme selection.
Track performance systematically in your own herd. Most modern DHI programs and herd management software—DC305, PCDART, DairyComp, BoviSync—can generate sire-based performance reports when appropriately configured. After 3-4 years, you’ll start seeing patterns emerge. When three consecutive bulls from the same bloodline show similar problems in your operation, that’s a signal worth acting on.
Learn from operations that actually track results. McCarty’s discovery that roughly a quarter of their parentage records were incorrect before implementing systematic tracking should concern every producer who hasn’t verified their own data quality. Their subsequent improvement to compliance in the mid-to-high 90s shows what’s possible when you take data integrity seriously.
Use proven bulls strategically. You can’t use daughter-proven bulls exclusively without falling behind on genetic progress. But for your best cow families, your older cows that have already proven their value, and animals with reproductive challenges? The predictability of proven genetics has genuine worth.
What This Means for Your 2026 Breeding Decisions
With the spring breeding season approaching and proof updates coming in April and August, here’s how to put this analysis to work.
Before your next semen order: Pull your current bull lineup and honestly assess concentration. How many distinct sire lines are you actually using? If fewer than 8-10, you’re probably overconcentrated.
Apply realistic expectations. When evaluating young genomic bulls, remember that daughter proofs often come in below initial predictions. If a bull is still attractive, assuming some regression from his current numbers, proceed. If your enthusiasm depends entirely on that top-end number being accurate, that’s a warning sign.
Ask better questions of your AI rep. Instead of “who’s your hottest young bull,” try: “Which bulls have you seen daughters from, and how are they holding up?” Good reps appreciate being treated as consultants rather than order-takers.
For Southeast and Southwest operations: Heat tolerance should already be a significant factor in your bull selection. Don’t wait for more data—the direction is clear.
For Upper Midwest and Northeast operations: You have more runway on heat tolerance, but start tracking summer performance by sire now. The data you collect this year will inform decisions in 2027-2028.
For Canadian producers: The same principles apply to LPI—the prediction mechanics and preselection dynamics work the same way, even if the index construction differs.
Looking Ahead
Heat tolerance is transitioning from academic interest to practical necessity. Lactanet and other organizations are beginning to publish heat tolerance metrics worth monitoring.
Feed efficiency selection is entering mainstream genetic programs, which introduces complexity. French national research has highlighted the importance of preserving robustness and reproductive performance while pursuing efficiency gains—flagging concerns about excessive body condition loss during the transition period when cows are genetically selected for extreme efficiency.
Early data on residual feed intake shows it’s heritable (estimates generally range from 0.12 to 0.38), which means we can select for it. Whether aggressive selection before we fully understand the reproductive and health implications makes sense is worth careful consideration.
Regional data-sharing cooperatives represent one mechanism that could strengthen market feedback. If 10-15 commercial dairies in your area agreed to pool anonymized daughter performance data by sire, you’d collectively have enough statistical power to identify performance patterns years before official evaluations reflect them. Your local DHI cooperative or breed association can tell you what’s available in your region.
Six Things to Do This Breeding Season
The system won’t protect you from genetic disappointment. AI companies are doing their job: selling semen. Your job is the hard part—living with the results. A 72-cow tie-stall operation has bred World Dairy Expo champions by trusting cow families. A 20,000-cow operation discovered that a quarter of its parentage records were incorrect before fixing them. Your job is to find your own version of that balance: diversify against the bulls that won’t deliver, be realistic about predictions that may be optimistic, and track what actually works in your barn. That’s not cynicism. That’s what people who breed elite cattle have been doing all along.
This week: Pull your current bull lineup. Count distinct sire lines—if you’re under 8-10, start planning to diversify.
Before your next order: Be realistic about young bull predictions. If he’s still your pick, assuming some regression from catalog numbers, proceed with confidence.
This breeding season: Reserve your proven bulls for your top 20% cow families and any animals with reproduction challenges.
Within 90 days: Set up sire-based reporting in your herd management software. The capability is probably there—you just haven’t configured it yet.
This season: Verify your parentage data before trusting it for your genetic decisions. What McCarty found wasn’t unique; it’s what they found when they actually looked.
This year: Start a conversation with 3-4 neighboring operations about comparing sire performance informally. Shared observations over coffee can reveal patterns that help everyone.
Your cows are generating information about which genetics actually work in your operation. The question is whether you’re capturing that information systematically—and whether you trust it as much as you trust the marketing materials.
Key Takeaways
True knockouts have shrunk to physical impossibilities and verified genetic defects. Lactanet data shows haplotype carriers HH1-HH4 are now below 2% in recent Holstein births. Meanwhile, traits like elevated SCS and marginal udders get marketed with “best suited for excellent management” caveats—translation: his daughters will need it.
Be realistic about young bull predictions. Canadian and US evaluation centers have documented that genomic proofs for heavily preselected sires often decline when daughters are added. That gap between expectation and reality can cost you meaningful genetic progress over time.
Validation beats prediction at every scale. GenoSource tracks cow families across generations—Delicious is still contributing embryos after being named the 2018 Cow of the Year. McCarty discovered roughly a quarter of their parentage records were wrong before implementing mid-to-high 90s mating compliance. Canadian operations have bred WDE champions by focusing on cow families rather than catalog rankings. The common thread: multi-generational transmitting consistency.
Diversify harder than you think you should. Use 10-15 bulls, not 4-6. When concentrated bulls disappoint, you’ve absorbed that loss across a large portion of your herd. Spreading breedings means individual disappointments hurt less. The insurance math usually wins.
Your cows are generating data—use it. Elite operations from small tie-stalls to multi-state enterprises track sire performance systematically. The question isn’t whether that information exists; it’s whether you trust your barn data as much as the marketing materials.
Complete references and supporting documentation are available upon request by contacting the editorial team at editor@thebullvine.com.
The Year Dairy Lost $6.7 Billion: The Bullvine’s Top 15+ Articles of 2025 – Arms you with the “survival architecture” industry disruptors use to defy consolidation. This analysis exposes the GenoSource and McCarty playbook for collective investment and vertical integration, providing the blueprint for building a resilient, multi-generational business moat.
The Sunday Read Dairy Professionals Don’t Skip.
Every week, thousands of producers, breeders, and industry insiders open Bullvine Weekly for genetics insights, market shifts, and profit strategies they won’t find anywhere else. One email. Five minutes. Smarter decisions all week.
The dairy genetics business that built family operations for generations? It’s been restructured. $1.5M down to $150K. But some breeders are finding new paths. Here’s what they figured out.
I was talking with a third-generation Holstein breeder from central Wisconsin not long ago, and what he shared really stayed with me. Back in 2012, his operation moved about $900,000 in genetics—semen, embryos, and a handful of elite females. Last year? Around $85,000. Same dedication, arguably better cows, and he’s generating roughly a tenth of what he used to.
His story isn’t unusual. Based on conversations across the industry and market data, a well-managed seedstock operation with 50 elite cows could realistically generate over $1.5 million annually from genetics sales. Today, that same operation might see $100,000 to $200,000. The genetics haven’t declined. If anything, they’ve improved considerably. But the economics have shifted in ways that caught many breeding families by surprise. (Read more: Master Breeder Killed in Triple Homicide and Who Killed The Market For Good Dairy Cattle?)
What’s worth understanding here isn’t simply that the industry changed—it always does. The more useful question is where the value actually went, and what realistic options remain for producers navigating this new landscape.
AT A GLANCE: Key Numbers Shaping Dairy Genetics
$170 million — What URUS paid for Trans Ova Genetics back in 2022
9.99% — Average inbreeding level for Canadian Holstein heifers born in 2024
400% — Growth in U.S. grass-fed organic dairy farmers since 2016
$8.5 billion — U.S. organic dairy and egg sales in 2024, up 7.7% from the year before
18% — Portion of Holstein PTA changes now tied to inbreeding adjustments
$14.78 billion — Where the global animal genetics market is headed by 2032
How the Breeding Model Changed
Dimension
2012 Model
2025 Model
Bull Ownership
Breeder retains full ownership; collects and markets semen independently
An AI company typically controls collection rights; the breeder may own the animal, but not the revenue stream
Elite Female Sales
Direct sales to other breeders at market-negotiated prices; ongoing relationships
24-month purchase options at preset prices; females enter corporate nucleus herds
Revenue Streams
Semen royalties, embryo sales, show winnings, private treaty females, consulting
Primarily one-time sale; limited ongoing participation in genetic value
Perpetual, royalty-free licenses to AI companies through testing agreements
Market Access
Direct relationships with commercial farms and other breeders
Corporate distribution channels; limited independent marketing
Capital Requirements
Moderate investment in facilities and marketing
$2-5 million+ to compete at the elite level with JIVET infrastructure
The Technology That Reshaped Everything
The transformation really began with genomic testing around 2009, though the full impact emerged when reproductive technologies matured enough to compress generation intervals in ways few anticipated.
Here’s the development that matters most: Juvenile IVF—sometimes called JIVET—now allows oocyte recovery from heifer calves as young as two to three months old. Consider what that means. Traditional breeding required waiting until an animal reached puberty, typically 10 to 14 months, before any embryo work could begin. That single advancement compressed generation intervals from roughly 36 months down to around 12 months for operations with the capital and infrastructure to implement it.
The Council on Dairy Cattle Breeding has documented how genomic selection approximately doubled the rate of genetic progress compared to the pre-genomic era—a finding confirmed by research published in Frontiers in Genetics and validated through years of industry data. Combine that with shortened generation intervals through juvenile IVF, and you’re looking at genetic advancement rates that simply weren’t achievable under the previous model.
Dr. Paul VanRaden—the research geneticist with USDA’s Animal Genomics and Improvement Laboratory—noted in CDCB documentation that the April 2025 genetic base change reflects the improvements in genetics and management accumulated over the previous five years. Those gains are real, and commercial farmers are genuinely benefiting from better cattle arriving faster than ever before.
But here’s the catch: the technology that accelerated genetic progress also concentrated its benefits. Running a competitive juvenile IVF program generally costs $1,500 or more per attempt, with success rates showing considerable variability—often ranging from 10 to 30 percent for transferable embryos, depending on stimulation protocols and individual donor response. At scale, those economics work well. For individual operations without that scale, each attempt carries meaningful risk.
Technology Compressed Generation Intervals by 67%—And Changed Who Wins” — Juvenile IVF and genomics slashed breeding cycles from 36 months to 12, tripling genetic progress. But only operations with $2-5M in capital can compete at this speed
Technology Era
Generation Interval (months)
Annual Genetic Gain (%)
Pre-Genomic (2008)
36
1.0
Early Genomic (2012)
30
1.5
Genomic + IVF (2016)
22
2.0
JIVET Era (2020)
15
2.8
Current (2025)
12
3.2
Following the Corporate Realignment
The past seven years have brought consolidation that has significantly restructured market access. For those who haven’t been closely tracking corporate developments, here’s the landscape.
In 2018, URUS formed through the merger of Koepon Holding (Alta Genetics’ parent company) and Cooperative Resources International, which owned GENEX. That created the second-largest global cattle genetics company. Four years later, URUS acquired Trans Ova Genetics—North America’s leading embryo transfer and IVF services provider—for $170 million in upfront cash plus a potential $10 million earnout. Those figures come directly from the SEC filings for the deal, which closed in August 2022.
David Faber, the veterinarian who serves as Trans Ova’s CEO and President, explained at the time that the company looked forward to working with URUS to add strategic resources that would further enhance their reproductive technology capabilities.
Meanwhile, ABS Global—owned by UK-based Genus PLC—moved to full ownership of De Novo Genetics in September 2024, consolidating control over its elite female nucleus. Genus PLC’s 2025 annual report showed the ABS division with adjusted operating profit up 53 percent year-over-year. That’s substantial growth in a mature industry segment.
What does this mean practically? When a single company controls elite females, IVF infrastructure, semen distribution, and genomic evaluation tools, the traditional breeder’s role in that value chain changes considerably. That’s neither inherently good nor bad—it’s just different from how things worked before, and it requires different strategies.
The Contract Terms Worth Understanding
Contract Element
Breeder Retains (2012 Model)
Breeder Retains (2025 Model)
Value Transfer to Corporate
Bull Semen Rights
100%
0%
Complete
Elite Female Purchase Options
100%
0%
Complete
Genomic Data Ownership
100%
0%
Complete
Male Offspring Sales
100%
15-25%
Substantial
Ongoing Royalties
100%
0-5%
Near-Complete
Modern elite genetics programs typically come with contractual arrangements that differ from how breeding partnerships worked a generation ago. While terms vary by program and continue evolving, here’s what many current structures look like.
Under programs in the past, breeders using elite genetics generally sign contracts that transfer the rights to collect semen to the AI company. The breeder may own the bull, but the company controls—and captures revenue from—semen production and sales. Male offspring from elite matings are typically directed to beef markets or sold to the AI company at predetermined prices. Breeders usually cannot retain bulls for independent semen collection or sell them to competing operations.
For elite females, purchase options often extend 24 months, during which the genetics company holds first right of refusal at preset prices—frequently in the $40,000 to $100,000 range for top-ranked animals based on current market activity. After that transaction, the cow typically enters a corporate nucleus herd, and the original breeder captures no further value from her offspring.
Genomic testing agreements generally grant AI companies perpetual, royalty-free licenses to use all submitted genetic data. That information—aggregated across thousands of herds—becomes the proprietary database that powers genetic indices and breeding recommendations.
These arrangements are disclosed in publicly available terms and conditions. Understanding them before committing helps breeders make informed decisions about whether specific programs align with their business objectives.
BEFORE YOU SIGN: Questions for Elite Genetics Programs
Who controls semen collection rights if I raise a high-genomic bull?
What are the purchase option terms and timeline for elite females?
How is my genomic data used, and do I retain any ownership rights?
What happens to male offspring from elite matings?
Are there restrictions on selling genetics to competing programs?
Want more detail? Download our expanded Contract Negotiation Guide at thebullvine.com/resources—including term-by-term analysis, red flags to watch for, and questions your attorney should ask before you commit.
The Inbreeding Question
One development that deserves attention alongside consolidation is the acceleration of inbreeding within major dairy breeds. It’s a pattern that accompanies rapid genetic progress under concentrated selection, and it warrants thoughtful monitoring.
Lactanet’s August 2025 inbreeding update reports that average inbreeding levels for Canadian Holstein heifers born in 2024 reached 9.99 percent, with Jerseys at 7.56 percent. U.S. figures from CDCB show similar patterns, with genomic inbreeding in Holsteins running notably higher than a decade ago.
The April 2025 CDCB genetic base change revealed something worth noting: Expected Future Inbreeding adjustments now account for roughly 18 percent of PTA changes in Holsteins. As the National Association of Animal Breeders explained in their base change documentation, CDCB introduced additional changes to their genetic evaluations that weren’t included in earlier estimates, including updated EFI calculations.
What this means, practically, is that a portion of apparent genetic progress is offset by inbreeding depression. Industry estimates, including those from the Holstein Association USA, suggest each percentage point of inbreeding costs approximately $22 to $24 per cow per lactation in reduced productivity, health, and fertility.
Breed
Current Inbreeding %
Cost per 1% ($/cow/lactation)
Total Annual Cost per Cow ($)
Warning Level
Holstein
9.99%
$23
$230
High
Jersey
7.56%
$22
$166
Elevated
Brown Swiss
6.80%
$23
$156
Moderate
Ayrshire
5.20%
$22
$114
Acceptable
Is this tradeoff problematic? Not necessarily. Faster genetic gain may still outweigh inbreeding costs for most operations, particularly those using crossbreeding strategies or careful mating programs. But the calculation isn’t as straightforward as index numbers might suggest—something worth considering for breeders making long-term decisions about bloodline diversity.
Real-World Adaptations
I’ve been watching how different operations respond to these shifts, and the approaches vary considerably based on scale, goals, and regional markets. What’s encouraging is that several breeders are finding genuine opportunities in segments the major programs don’t prioritize.
The grass-fed and organic dairy sector offers a compelling example. According to Market Growth Reports, the global grass-fed milk market reached approximately $63.7 billion in 2024, with projected compound annual growth exceeding 20 percent through 2033. North America represents the largest share of that consumption.
The Organic Trade Association reported that organic dairy and egg sales rose 7.7 percent to $8.5 billion in 2024, with organic yogurt growing 10.5 percent—what they called the second highest growth rate in the category in more than 15 years.
Why does this matter for genetics? Corporate programs optimize primarily for high-producing operations using concentrate-based feeding systems. Grass-fed operations need different trait combinations: grazing efficiency and forage intake capacity; metabolic stability across seasonal pasture variations; component percentages (butterfat and protein performance on grass-only diets); fertility and calving ease with minimal intervention; and structural soundness for pasture locomotion across multiple lactations.
Those traits don’t receive priority in mainstream selection indices. Which creates a genuine opportunity for breeders willing to specialize.
A University of Vermont survey led by researchers Heather Darby and Sara Zeigler found that U.S. grass-fed organic dairy farmers have expanded by over 400 percent since 2016. The Northeast Organic Dairy Producers Alliance reports continued movement toward grass-fed certification, with companies like Maple Hill actively signing new farms in Pennsylvania and New York.
Some breeders are already building genetics programs around these requirements. Jersey and Jersey-cross genetics perform well in grazing systems due to component density and moderate frame size. Scandinavian Red influence—Norwegian Red, Swedish Red, VikingRed—contributes health and fertility traits developed under Nordic grazing conditions. Careful selection within Holstein for grazing efficiency, emphasizing moderate stature, strong feet and legs, and metabolic resilience, can effectively serve this market segment.
For breeders positioned to develop genetics suited explicitly to these systems, there’s an addressable market that larger programs haven’t captured.
The Mid-Size Challenge—And an Unexpected Opportunity
What’s becoming clear is that genetics questions can’t be separated from broader farm economics. Many mid-size operators are navigating this tension daily.
Industry analysts have observed that dairies without defined strategic plans tend to lose equity gradually through deferred maintenance, inefficiency, and missed opportunities—a pattern that compounds over time. It’s the gradual erosion that proves most damaging.
A 600-cow operator from southern Minnesota described it well at a Dairy Strong conference session: “We thought doing nothing was the safe move. Turns out, the slow leak was killing us.”
USDA data shows significant dairy consolidation continued through 2024, with over 1,400 operations exiting, resulting in a roughly 5 percent annual decline. Many of those closures were concentrated among mid-size operations caught between rising costs and tighter credit without the scale advantages of larger competitors.
But here’s something that’s changed the math for a lot of those 600-cow herds: beef-on-dairy. The numbers have gotten hard to ignore.
CattleFax estimates that crossbred calf production exploded from just 50,000 head in 2014 to 3.22 million in 2024, according to American Farm Bureau analysis. That’s not a trend—that’s a transformation. A 2024 Purina survey found that 80 percent of dairy farmers now receive a premium for beef-on-dairy calves, with reported revenues of $350 to $700 per head over straight dairy calves. USDA-verified auction reports show beef-cross calves selling for $680 to $1,160 per head at markets like New Holland, Pennsylvania.
Year
Crossbred Calves Produced (millions)
Revenue per 600-cow herd ($)
2014
0.05
$9,000
2016
0.4
$60,000
2018
1.2
$126,000
2020
2.1
$189,000
2022
2.8
$231,000
2024
3.22
$253,500
For mid-size operations, the economics add up quickly. University of Wisconsin research led by Dr. Victor Cabrera found that herds maintaining 30 percent or higher pregnancy rates can generate over $6,200 in net calf income per month through optimized beef-on-dairy programs. University extension services are documenting operations that implemented beef-on-dairy strategies in early 2024, projecting $100,000 to $150,000 in additional annual revenue from crossbred calves alone.
The genetics piece matters here, too. Beef semen sales to dairy operations reached 7.9 million units in 2024, according to NAAB data—up dramatically from 3.7 million total beef units in 2014. That creates demand for breeders who understand both sides of the equation: which beef genetics produce calves that finish efficiently, grade well, and don’t create calving problems on Holstein or Jersey dams.
This isn’t the traditional seedstock model, but it’s a way mid-size operations can leverage genetic knowledge to generate real revenue without competing directly with corporate nucleus herds for elite dairy genetics.
For seedstock operations specifically, the challenge compounds differently: genetic income has compressed while production economics have tightened simultaneously. The wait-and-see approach carries increasing risk. But diversification—whether into grass-fed genetics, beef-on-dairy optimization, or vertical integration—offers paths forward that pure dairy genetics increasingly doesn’t.
A Note on Regional Dynamics
Most of what I’ve covered here reflects the reality for operations in the Upper Midwest and Northeast—where the traditional seedstock model developed and where most family breeding operations still operate. But it’s worth acknowledging that dairy economics look quite different in other parts of the country.
According to Progressive Dairy statistics, dairy herds averaged more than 2,000 head in several Western states—including New Mexico, Arizona, and Texas—while seven additional states averaged more than 1,000 head. The locational contrast is stark—states with small herds are concentrated entirely in the Midwest and Northeast, while Western dairy states operate at substantially larger scale.
Texas added 50,000 cows to its dairy herd in just 12 months, growing from 640,000 to 690,000 head according to USDA state-level data. That single-state expansion accounted for 56 percent of the entire national herd growth in 2024. Idaho ranked fourth nationally in milk production, accounting for about 7.5 percent of U.S. output, according to Capital Press reporting. Meanwhile, Kansas posted 11.4 percent production growth, emerging as another major expansion center.
California remains the national leader with 1.7 million cows and a $23.2 billion economic contribution to state GDP in 2024, according to the California Milk Advisory Board and UC Davis research. But the state’s regulatory environment—including methane reduction mandates and LCFS credit changes—is creating consolidation pressure that an ERA Economics analysis suggests could push 20 to 25 percent of small California dairies to exit.
These Western mega-dairy operations face different genetics decisions than a 200-cow Wisconsin seedstock farm. Their scale allows direct negotiation with AI companies, in-house reproductive programs, and purchasing power that smaller operations can’t match. The consolidation dynamics—and the opportunities for independent breeders—may look quite different in those markets.
We’re planning a follow-up piece exploring how genetics economics play out differently in California’s mega-dairy environment and the rapidly expanding Texas and Idaho sectors. If you’re operating in those regions and have insights to share, reach out—we’d like to hear your perspective.
Strategic Options Worth Considering
Looking at what’s working for breeding operations in this environment, several approaches show promise. The right choice depends on individual circumstances, available capital, and where you see opportunity.
Market Segment
Growth Rate 2016-2025 (%)
Corporate Dominance (%)
Breeder Opportunity
Traditional Elite Genetics
-65%
95%
Limited
Grass-Fed/Organic
+400%
15%
Strong
Beef-on-Dairy
+6,400%
25%
Strong
A2/A2 Specialty
+180%
30%
Moderate
Crossbreeding Programs
+225%
20%
Moderate
Premium market specialization means building genetics for segments that corporate programs underserve. Grass-fed, organic, A2/A2 milk, alternative breeds for specific production systems—these markets are smaller but growing faster than commodity dairy, and they offer pricing flexibility that commodity genetics typically don’t provide.
The capital requirements are substantial. Current market conditions suggest a range of $2 to $5 million to build a competitive reference population and marketing infrastructure. But the economics can work for well-positioned operations. A heifer bred specifically for grass-fed systems might command $5,000 to $8,000 versus $2,500 to $4,000 for a comparable commodity Holstein. Embryos can move at $1,500 to $3,000 rather than $500 to $800.
Cooperative and collaborative models draw inspiration from European structures such as the Alpine Genetic Evaluation Team, which coordinates breeding programs across multiple countries through shared infrastructure, phenotype recording, and research partnerships. This approach requires substantial coordination and typically depends on public research support, making North American implementation more challenging. But it represents a proven alternative for breeders willing to invest in collective infrastructure.
Vertical integration means using elite genetics to build your own production operation rather than relying on genetic sales as your primary source of revenue. Income flows perhaps 80 percent from milk or beef, 20 percent from surplus genetics. You become your own multiplier, independent of external semen sales volatility.
Strategic exits remain viable for operations with genuinely elite bloodlines. Corporate genetics companies are active acquirers. Breeders with exceptional genetics may find that well-timed sales—whether specific cow families or entire herds—capture more value than competing independently in consolidated markets.
Market research, breed adaptation, and direct customer relationships
Moderate—market growing, but competition emerging
Regional network + shared values
Cooperative model
Coordination capacity, public research partnerships, and long-term commitment
Low—but requires a 3-5 year development horizon
Elite genetics + production infrastructure
Vertical integration
Milk market access, management bandwidth, and capital for expansion
Low—can implement gradually
Top-tier bloodlines + exit timeline
Strategic sale to an AI company
Professional valuation, legal counsel, and timing awareness
High—value erodes as consolidation continues
Mid-size herd + reproductive efficiency
Beef-on-dairy optimization
Pregnancy rate management, beef sire selection knowledge, and calf marketing
Low—can start immediately
Under $200K genetics revenue + no clear edge
Accelerated decision
Honest assessment, financial planning, family alignment
Critical—12-month decision window
What the Numbers Suggest Going Forward
Fortune Business Insights projects the global animal genetics market will grow from $8.31 billion in 2024 to $14.78 billion by 2032. That growth will flow predominantly through corporate channels—the infrastructure investments are already in place, and competitive advantages compound over time.
For commercial dairy farmers focused on milk production, the consolidated system delivers genuine value: faster access to genetics, sophisticated breeding tools, and reduced complexity in sourcing genetics. The August 2025 CDCB evaluations showed continued progress on production, health, and fertility traits. That benefits most producers directly.
For breeding operations, the calculation differs. The traditional model—developing elite genetics and capturing value through semen sales, embryo production, and female marketing—faces structural headwinds unlikely to reverse.
Practical Implications
For commercial operations:
Current genetics delivery systems offer real advantages in accessibility and genetic progress
Match selection to your specific production system and management approach
Monitor inbreeding levels when making mating decisions, particularly in purebred Holstein programs—Lactanet’s inbreeding calculator and similar tools help identify concerning combinations
Consider whether alternative breeds or crossbreeding strategies might benefit your specific goals
For seedstock operations:
Operations generating under $200,000 in genetic revenue need a 12-month decision timeline—not a five-year plan
Evaluate niche market positioning in segments where corporate programs are less dominant
Assess whether vertical integration economics compare favorably to a continued genetic sales focus
Review contract terms thoroughly before committing to elite genetics programs
Recognize that strategic options narrow as consolidation continues—the window for positioning is measured in years, not decades
For the industry broadly:
Genetic diversity management deserves increased attention as selection intensity rises
Public genetic evaluation systems like CDCB and Lactanet remain valuable reference points alongside proprietary indices
Alternative breeding approaches, even at a smaller scale, provide resilience and options that pure consolidation doesn’t
The Bottom Line
The dairy genetics industry has always evolved. Proven sires gave way to genomics, conventional AI gave way to IVF, and distributed breeding gave way to concentrated nucleus herds. Each transition created winners and losers, opportunities and challenges.
What distinguishes this moment is the pace of change and the scale of capital required to remain competitive at the elite level. Understanding that reality—neither resisting it nor ignoring it—is the starting point for any strategic decision about where breeding fits in your operation’s future.
The genetics are better than they’ve ever been. The infrastructure to deliver them has never been more sophisticated. And for producers willing to work within the new system, access has never been easier.
But if you’re a breeder who built something over generations—who selected, culled, tested, and refined bloodlines that carry your family’s name—the question isn’t whether the new system works. It’s whether there’s still a place in it for you.
That answer isn’t written yet. But the window to write it yourself is closing faster than most people realize.
Key Takeaways
The money moved—it didn’t vanish — Seedstock revenue dropped from $1.5M to $150K for many operations. Value shifted to corporate infrastructure because technology changed who captures genetic gains—not because the genetics got worse.
Read the contracts before you sign — Elite programs often transfer semen rights, lock in female purchase options at preset prices, and claim perpetual licenses to your genomic data. Know whether you’re sharing in value creation or just supplying raw material.
Inbreeding carries a real cost — Holstein heifers now average nearly 10% inbreeding. At $22-24 per cow per lactation per percentage point, this quietly offsets the genetic progress everyone’s celebrating.
The old model closed—but new ones opened — Grass-fed genetics (400% market growth since 2016), beef-on-dairy programs ($100K+ annual revenue), and vertical integration are working for breeders who’ve repositioned.
Your window is measured in months, not years — operations with $200K or less in genetics revenue need a 12-month action plan. Strategic options narrow as consolidation continues. Waiting is its own decision.
Executive Summary:
Here’s the reality facing dairy breeders: a seedstock operation that generated $1.5 million in genetics revenue a decade ago might see $150,000 today—even with better cows. The money didn’t disappear. It moved. Genomic testing and juvenile IVF compressed generation intervals from 36 months to 12, while corporate consolidation put companies like URUS and ABS Global in control of elite females, reproductive infrastructure, and genetic data. Commercial producers benefit through faster access to improved genetics at lower complexity. Independent breeders face a harder calculation—compressed margins, restrictive contracts, and rising inbreeding levels approaching 10% in Holsteins. But genuine opportunities exist for those willing to adapt: grass-fed and organic genetics serving a market that’s grown 400% since 2016, beef-on-dairy programs adding $100,000+ in annual revenue, and strategic repositioning before options narrow further. The window is measured in years, not decades. This analysis traces where value migrated, breaks down the contracts worth scrutinizing, and maps which paths are actually working for breeding operations in 2025.
Complete references and supporting documentation are available upon request by contacting the editorial team at editor@thebullvine.com.
Learn More
The 90-Day Dairy Pivot: Converting Beef Windfalls into Next Year’s Survival – Arms you with the exact math to convert temporary $1,000 beef-on-dairy windfalls into long-term operational resilience. It reveals the $26,600 “stacking” opportunity that mid-size dairies must capture before the current market window slams shut in 2026.
The McCarty Magic: How a Family Farm Became the Dairy Industry’s Brightest Star – Breaks down the high-stakes strategy of on-farm processing and vertical integration used to scale from 15 to 20,000 cows. It gives you the roadmap for capturing the value chain through the “DIRT” management principles and 75% logistics savings.
The Sunday Read Dairy Professionals Don’t Skip.
Every week, thousands of producers, breeders, and industry insiders open Bullvine Weekly for genetics insights, market shifts, and profit strategies they won’t find anywhere else. One email. Five minutes. Smarter decisions all week.
Every breeding decision you’ll make next year connects to lessons buried in this year’s best journalism. A $260,000 gamble from 1926 that critics called insanity. A bankruptcy that produced three generations of World Dairy Expo champions. A bull whose daughters added $6,500 per head in today’s dollars, while his modern genomic evaluation shows negative Net Merit—a $2,117 swing from December 2025’s top bull. These aren’t just stories – they’re the strategic frameworks top breeders reference when everyone else is guessing.
Look, we published over 300 feature articles this year. Breeder profiles, sire spotlights, donor stories, industry investigations. When our editorial team sat down to identify which ones actually mattered—not which got the most clicks, but which ones readers bookmarked, shared with their herd managers, or referenced in breeding meetings—ten articles kept coming up.
These pieces combined a strong readership with lasting impact. Our Elevation story generated over 340 comments and was shared more than 2,800 times across platforms. The Blackrose piece prompted eight separate emails from readers who’d reconsidered their approach to dispersal auctions. The “Death of Get Big” article? At least a dozen producers told us they’d shared it with their lenders.
That’s the standard we used. Months after publication, readers were still emailing about these stories, arguing about them, applying them.
If you’re planning your 2026 breeding strategy, reviewing dispersal auction opportunities, or just trying to understand why certain genetic decisions matter more than others, these articles deserve your attention. Your competitors have probably already read them twice.
Here’s the thing about Holstein history—most of us think we know it. We can name the big bulls, recite a few famous prefixes. But this article did something different. It traced four distinct breeding philosophies through five legendary figures and showed how each remains valid today.
Take T.B. Macaulay’s gamble on Johanna Rag Apple Pabst in 1926. According to Bank of Canada inflation calculations, that $15,000 purchase represents roughly $260,000 in today’s dollars—for one animal, in a post-WWI economy when farmers were still digging out from agricultural depression. The critics thought he’d lost his mind.
And here’s what makes this relevant to your operation right now: Holstein Canada pedigree records confirm that virtually every registered Holstein walking the planet today carries that bull’s blood.
Why Macaulay’s Math Still Works
What made Macaulay different? He came from actuarial science, not cattle breeding. He was doing progeny testing—evaluating bulls by their daughters’ actual performance—decades before Holstein Association formalized the practice in the 1930s. The man treated genetic improvement like a math problem while everyone else bred on gut instinct and show-ring appearance.
The article pairs Macaulay’s data-driven approach against Stephen Roman’s empire-building through marketing muscle, Roy Ormiston’s patient cow-family development, and Heffering and Trevena’s paradigm-shifting partnership at Hanover Hill.
The question worth asking yourself: Are you breeding like Macaulay (data-first), Roman (marketing-first), Ormiston (cow-family-first), or some combination? Your answer shapes every semen purchase you’ll make in 2026. Knowing your bias reveals your blind spots.
You can’t have a serious conversation about Holstein breeding without talking about Elevation. But this article went beyond the usual tribute piece—it interrogated his legacy while respecting it. That tension is exactly what makes it Editor’s Choice material.
Born in 1965 on a modest Virginia farm from what the article calls “a questionable mating,” this unassuming black-and-white calf became the most significant genetic influencer Holstein breeding has ever seen. His bloodline now runs through nearly 9 million descendants. Almost every glass of milk you’ve ever enjoyed likely came from a cow with some connection to this sire.
His numbers were off the charts for the era: daughters averaging 29,500 pounds of milk during their first lactations—beating their peers by 15%—while sporting picture-perfect udders described by Charlie Will of Select Sires as having “high and wide rear udders with exceptional shape and symmetry”.
Here’s where it gets interesting for your bottom line. Those udders stayed attached for 2-3 lactations longer than average, translating into an extra $1,200 in profit per cow in 1970s dollars. Adjusted for inflation, that’s roughly $6,500 per cow today—the difference between a profitable and breakeven herd on longevity alone.
The Paradox Every Breeder Should Understand
What sets this piece apart is how it handles the tension between Elevation’s historical importance and his modern genomic evaluation. His current CDCB summary shows a Net Merit of -$821. Compare that to December 2025’s #1 Net Merit bull, Genosource Retrospect-ET, sitting at +$1,296 NM. That’s a $2,117 swing—representing six decades of genetic progress built on Elevation’s foundation.
That seems damning until you understand—as the article carefully explains—that these numbers compare him to a modern Holstein population he helped create. As Will put it: “Elevation’s genes form the baseline against which we measure progress—you can’t delete the foundation of a skyscraper and expect it to stand”.
Six decades after his birth, his DNA still runs through 14.5% of active proven Holstein sires. Understanding why matters when your genetics rep is pushing the latest trendy lineup. Foundation sires created the genetic architecture you’re building on. Ignoring that context leads to concentration mistakes.
READER ACTION: Before your next mating batch, review CDCB’s relationship tools to understand how heavily your current herd relies on Elevation and Chief genetics. Concentration you don’t see is concentration you can’t manage.
This is the kind of story conventional dairy media won’t touch—financial ruin, bankruptcy, bull calves sent to slaughter just to keep the electricity on. But it’s also a story about vision, opportunity recognition, and the staying power of superior genetics.
Picture it: mid-80s, brutal January morning. Jack Stookey—once a larger-than-life figure who owned some of North America’s most elite cattle—can’t scrape together payroll. Decades of careful breeding sitting in legal limbo. And Louis Prange looks at that situation and sees a buying opportunity where everyone else sees disaster.
Prange worked out a deal with the bankruptcy trustee: lease the best cows, flush embryos, split proceeds three ways. His vision was what breeders call a “corrective cross”—mating two animals whose strengths perfectly complement each other’s weaknesses. He wanted to breed the red-and-white champion Nandette TT Speckle to To-Mar Blackstar, a production powerhouse who needed help on the structural side.
On March 24, 1990, Stookey Elm Park Blackrose came into this world.
From $4,500 Purchase to Dynasty
Sold as an 18-month-old for $4,500—about $10,400 in today’s money—she grew into a commanding presence that dominated wherever she went. Her numbers: 42,229 pounds of milk at five years old, 4.6% butterfat, 3.4% protein, EX-96 classification. She won All-American honors as both a junior two-year-old and a junior three-year-old, then captured the Grand Champion title at the Royal Winter Fair in 1995, joining an exclusive club of U.S. cows to win Canada’s most prestigious show.
But what really earns this story Editor’s Choice status is tracing Blackrose’s influence forward. Her descendants include Lavender Ruby Redrose-Red, who in 2005 became the first and only Red & White cow ever named Supreme Champion over all breeds at World Dairy Expo. And Ladyrose Caught Your Eye—a Unix daughter born in 2019 who’s won World Dairy Expo three consecutive years (2021-2023) with 16 milking daughters classified VG-87 or higher.
Financial disaster. Genetic gold. Same story, same cow family. If you’re not looking at dispersal auctions and bankruptcy sales as potential genetic opportunities, this article might change your mind.
READER ACTION: Before your next dispersal auction, ask: what second-chance genetics might be available that well-funded operations are overlooking? The Blackrose story suggests financial distress creates buying opportunities—if you know what you’re looking for.
“Have you ever gotten one of those calls that just stops you cold? Mine came the day after Christmas, 2013. Hardy Shore Jr. was gone.”
That opening line sets the tone for something different—not just a breeder profile, but a meditation on legacy, creative genius, and the personal costs of relentless pursuit of excellence.
The Shore story spans four generations, from William H. Shore’s leap into purebreds in 1910 (when most thought he’d lost his mind) to Hardy Jr.’s embryo exports in the genomic era. It’s a century of dairy evolution through one family’s decisions.
Why This History Matters Right Now
What really struck me, rereading this article, is how it mirrors challenges producers face today. Consider William’s decision to buy those first purebred Holsteins from Herman Bollert when mixed farming was safe, predictable, and profitable. Sound familiar? How many of us are weighing similar pivots right now with robotic milking systems, precision nutrition protocols, or carbon-neutral initiatives?
The genetic throughline is extraordinary. Follow it from Hardy Sr.’s twin bulls Rockwood Rag Apple Romulus and Remus, through Shore Royal Duke, to Fairlea Royal Mark—described as “possibly the best bull to come out of Western Ontario”—and you’ll find it leads directly to Braedale Goldwyn. Breeding decisions made in the 1940s shaped the breed through to the 2000s and beyond.
The article doesn’t shy away from Hardy Jr.’s personal struggles either. “The same creative fire that produced breakthrough genetics also fueled personal demons that few understood”. The industry’s response—celebrating his contributions while acknowledging his difficulties—showed the best of our community.
That’s nuanced, human storytelling. The dairy industry deserves more of it.
If Elevation changed everything, Chief changed it alongside him. According to CDCB data cited in this article, up to 99% of AI bulls born after 2010 can be traced back to either Round Oak Rag Apple Elevation or Pawnee Farm Arlinda Chief. That’s not influence—that’s near-total genetic dominance of the modern Holstein population.
This piece opens with a pregnant cow traveling 1,152 miles by train from Nebraska to California in 1962, then traces how her calf would revolutionize milk production worldwide. Chief contributed nearly 15% to the entire Holstein genome—a level of genetic concentration unprecedented in livestock breeding.
The Question That Makes This Essential Reading
What earns this story Editor’s Choice status isn’t just the historical account—though that’s compelling. It’s the article’s willingness to honestly interrogate the legacy.
Chief transmitted tremendous production, yes. But he also passed along udder conformation challenges that breeders spent decades managing. The piece asks a provocative question: would Chief still have become the most influential Holstein sire in history if today’s genomic tools had been available? Would we have managed his genetics differently if we’d known what we know now from the start?
That’s not second-guessing history. That’s learning from it. And it’s exactly the kind of uncomfortable question we exist to ask.
READER ACTION: Run your herd through CDCB’s haplotype and relationship tools. Understanding your concentration on foundation sires like Chief helps you make smarter outcross decisions—and avoid repeating mistakes the breed made when we couldn’t see what we were building.
For years, the industry’s biggest voices told mid-size dairies to expand or exit. This article asked: what if that conventional wisdom was incomplete—and what if the data revealed something more nuanced?
Every decade has its orthodoxy. For the past fifty years, dairy’s orthodoxy has been scale. This piece challenged it directly, examining how mid-size operations leveraging precision technology achieve profitability metrics that compete with operations several times their size in specific market conditions.
Now, to be clear: scale advantages are real. Recent USDA data shows larger operations generally achieve lower per-unit costs, and the correlation between size and overall profitability remains strong in aggregate. The article didn’t dispute that.
What the Article Actually Found
What it documented was more specific: certain 500-cow operations in the Upper Midwest using robotic milking, precision feeding, and intensive management protocols were achieving component yields and margin-per-cwt figures that challenged the assumption that they were simply waiting to be consolidated out of existence.
The key variable wasn’t size—it was technology adoption intensity and management focus. Operations that couldn’t compete on scale were competing on precision.
That’s a different argument than “small is better.” It’s an argument that technology can substitute for some—not all—of the scale advantages when management intensity matches the investment.
The response from readers was telling. At least a dozen producers emailed us about sharing this article with their lenders when justifying technology investments over expansion. One Wisconsin producer credited the piece with helping secure $180,000 in automation financing instead of a $2.4M expansion loan that would have stretched his operation thin.
If you’re running a mid-size operation and feeling pressure to “grow or go,” this article offers a more nuanced framework for evaluating your options.
The Human Stories: Hearts, Tragedy, and Triumph
Not every Editor’s Choice selection centers on breeding decisions and production records. Two articles this year reminded us why the human element matters—and earned their place through reader impact rather than genetic analysis.
This Youth Profile documented young dairy farm girls battling extraordinary health challenges while their families remained committed to dairying. What struck readers wasn’t just the adversity—it was the community response. The article traced how neighboring operations stepped in during medical crises, how 4-H networks mobilized support, and how the fabric of rural dairy communities showed its strength when tested.
The piece generated more reader emails than any other youth profile we’ve published. Several readers mentioned sharing it with family members who questioned why they stayed in dairy when the economics got tough. It captured something data can’t measure—the emotional core of agricultural life, the values that keep operations running when spreadsheets say they shouldn’t.
This profile showed how setbacks can catalyze the kind of focused intensity that produces greatness. Bons’s trajectory—tragedy, rebuilding, excellence—provided both inspiration and a practical framework for breeders facing their own obstacles.
The article documented specific decisions Bons made during his lowest points that positioned him for later success: doubling down on cow families he believed in when others suggested selling, maintaining classification standards when cutting corners would have been easier, and building relationships that paid dividends years later.
For anyone dealing with challenges right now—and honestly, between labor pressures, feed costs, and processor consolidation, who isn’t?—this piece offers more than motivation. It offers a model.
Some topics require going beyond surface-level reporting. The competing visions for Holstein breeding’s direction—the economic forces, policy implications, and philosophical tensions shaping the breed’s future—demanded exactly that treatment.
This article examined the battle lines between different approaches to genetic improvement: index-driven selection versus holistic breeding programs; concentration of elite genetics versus diversity; and short-term gains versus long-term sustainability. It named the tensions other publications dance around—including specific industry voices pushing concentration and the researchers warning against it.
Whether you’re navigating US component pricing shifts, EU Green Deal compliance costs, Canadian quota considerations, or NZ emissions regulations, the strategic questions this article raises apply across markets. The breed’s direction isn’t being set in a vacuum. Policy, economics, and genetic decisions interact in ways this piece helped readers understand.
The article generated exactly the kind of productive disagreement we aim for—readers with strong opinions engaging substantively rather than nodding along. When industry professionals argue thoughtfully about something we’ve written, that tells us we hit a nerve worth hitting.
If your genetics rep is pushing hard for one approach, this article gives you a framework for asking better questions and evaluating whether their recommendations align with your operation’s long-term interests.
Trade policy isn’t sexy. We made it essential reading anyway.
By connecting Canada’s supply management debate to real-world implications for American producers, this article transformed dry policy discussion into a story about survival, fairness, and the future of family farming. It examined the evidence honestly—acknowledging both legitimate criticisms of supply management and the genuine problems it addresses that free-market systems struggle with.
The response was polarized. Some readers sent passionate disagreements, arguing that any government intervention distorts markets and punishes efficiency. Others thanked us for finally explaining a system they’d heard criticized but never understood—and pointed to the stability Canadian producers enjoy while American operations ride brutal price cycles.
Both responses tell us the same thing: this was journalism that mattered to people trying to understand their competitive environment.
Whether you think Canadian dairy policy is a model worth studying or a cautionary tale about protectionism, understanding how it actually works—rather than relying on political talking points from either side—makes you a better-informed decision maker.
Articles That Almost Made the List
A few pieces came close and deserve mention for readers looking to go deeper:
Bell’s Paradox: The Worst Best Bull in Holstein History examined a bull who excelled in production traits while transmitting significant type faults—challenging comfortable assumptions about what “best” even means in genetic evaluation. Strong engagement, genuine controversy, but slightly narrower application than our final selections.
The Robot Truth: 86% Satisfaction, 28% Profitability—Who’s Really Winning? found that robotic milking adopters reported high satisfaction rates, but far fewer achieved projected profitability targets within expected timeframes. If you’re considering automation investments, add this to your reading list before signing anything.
The Silent Genetic Squeeze documented inbreeding coefficients in the Holstein population rising steadily over recent decades, with specific data on haplotype frequency changes that affect fertility and calf survival. Important reading for anyone concerned about where genomic selection’s concentration is taking the breed.
The Bottom Line: Your 2026 Reading List
Looking at this collection, patterns emerge. We gravitate toward stories that challenge assumptions rather than reinforce them, connect historical decisions to present-day implications, humanize the industry without losing analytical rigor, and tackle uncomfortable topics when the evidence demands it.
You can read publications that confirm what you already believe, or you can read the ones that make you uncomfortable enough to improve. These ten articles fall in the second category. That’s why they earned Editor’s Choice.
The conversations these articles started aren’t finished. Genomic selection keeps evolving—as the December 2025 proofs showed, with Genosource capturing 22 of the top 30 Net Merit positions and reshaping the competitive landscape overnight. The tension between consolidation and resilience intensifies. Component pricing shifts and processor relationships tighten. And the human stories—the triumphs, the setbacks, the stubborn persistence of people who believe in this industry—keep unfolding.
We’ll be here to cover them. Starting in January with our deep-dive into what the December 2025 proof run means for your spring matings—and why three bulls everyone’s talking about might not deserve the hype.
With data. With nuance. And with the same commitment to making you think rather than just nod along.
That’s what these ten articles delivered in 2025. That’s what we’re aiming for in 2026.
EXECUTIVE SUMMARY:
‘We published 300 articles in 2025—these ten are the ones readers bookmarked, argued about, and shared with lenders and genetics reps months later. Inside: the $260,000 gamble that put one bull’s blood in every registered Holstein alive today, a bankruptcy that spawned three consecutive World Dairy Expo champions, and data showing tech-savvy 500-cow dairies beating mega-farms on margin-per-cwt. You’ll find Elevation’s $6,500/cow longevity advantage explained against his -$821 Net Merit—a $2,117 swing from today’s #1 bull representing sixty years of progress built on his foundation. Each piece delivers actionable breeding frameworks for 2026, not just history. One Wisconsin producer used our scale article to secure $180,000 in automation financing instead of a $2.4M expansion loan. Your competitors already read these twice—have you?
The Sunday Read Dairy Professionals Don’t Skip.
Every week, thousands of producers, breeders, and industry insiders open Bullvine Weekly for genetics insights, market shifts, and profit strategies they won’t find anywhere else. One email. Five minutes. Smarter decisions all week.
How One Iowa Grandfather’s ‘Best Bull, Not Cheapest Bull’ Principle Built GenoSource Into a 4,000-Cow, Genetics Powerhouse
There’s a photograph I keep coming back to.
Eight families standing together in front of their Blairstown, Iowa operation. The Carrolls, the Simons, the Rauens, the Demmers. Husbands and wives. Partners who became family. Three generations of dairy people captured in a single frame.
The GenoSource partnership: Eight families, one philosophy. From left: Steve Rauen, Kyle Demmer, Tim Rauen, Bill Rauen, Tom Simon, Pat Carroll, Rick Simon, and Matt Simonstand in front of their Blairstown, Iowa facility—the operation built on Joe Simon’s 63-year conviction that it costs the same to feed a bad cow as a good one.
What moves me isn’t the scale of what they built—though 4,000 cows producing 93 pounds daily at 4.8% butterfat and 3.6% protein is genuinely extraordinary. What moves me is that they’re all still standing there together. Eleven years into a partnership that most consultants would say couldn’t work. Eight families who somehow agreed on the one thing that matters most.
Joe Simon started it all.
Here’s the part of this story I can’t stop thinking about: Joe lived to see everything. He passed away in September 2025 at age 97—just three months before the Dairy First Award was announced.
I find myself turning that timing over in my mind more than I probably should. Ninety-seven years old. Sixty-three years of living by a principle most people would’ve abandoned the first time it got expensive. And he left just before this final piece of validation arrived.
I don’t know if that’s tragic or perfect. Maybe both. Maybe by the time you’ve watched two of your bulls win Premier Sire at the same World Dairy Expo—which happened in October 2024, less than a year before he passed—maybe you’ve already seen everything you needed to see. Maybe the award was just paperwork at that point.
The Simon family philosophy has always been clear: never use the cheapest bull—use the best bull.
I’ve covered this industry long enough to know that everyone claims to believe in quality. What moves me about this story is that these families actually lived it—through market crashes, through a derecho that destroyed half their farm, through every moment when the cheap option sat right there waiting.
That philosophy changed everything for these families. It might change something for you, too.
The Man Who Refused to Compromise
Joe Simon founded Farnear Holsteins in 1962 with a principle so simple it almost sounds naive: invest your resources wisely, because it costs the same to feed a bad cow as it does a good one.
I imagine him saying it—probably in a barn somewhere, probably to one of his ten children or forty grandchildren who’d just suggested cutting corners on a breeding decision. The kind of quiet wisdom that doesn’t feel revolutionary until you try to actually live by it when money gets tight, and the cheap option is sitting right there.
Joe lived by it for sixty-three years. Right up until the end.
Tom Simon (center, holding banner) and the Farnear team celebrate a historic achievement at the 2024 World Dairy Expo, where Farnear Delta Lambda-ET and Farnear Altitude Red-ET were both named Premier Sires—a testament to sixty years of strategic breeding.
I think about what his face must have looked like when he heard that two Farnear-bred bulls had won Premier Sire at World Dairy Expo in October 2024. Delta-Lambda taking the black-and-white honor. Altitude Red is claiming the red-and-white title. The same show, the same year, the same family philosophy validated twice over.
In his late nineties at that point. Watching his life’s conviction proven on the biggest stage in dairy.
There’s a moment in every family when wisdom stops being “what Grandpa says” and becomes “what we believe.” Joe Simon didn’t just live long enough to see that moment—he lived to see it matter.
We all pay lip service to quality. But when milk checks shrink, and feed costs rise, “quality” is usually the first line item cut from the budget. That’s where the Simon family differed.
Joe held onto it anyway. And somehow, that stubbornness (because that’s what it is—a kind of holy stubbornness) passed down through the family like genetics itself.
The Conversation That Started Everything
I wish I could have been there in 2014 when the eight families first sat down together.
Pat Carroll. Tom Simon. Rick Simon. Matt Simon. Tim Rauen. Bill Rauen. Steve Rauen. Kyle Demmer. Their spouses, their hopes, their fears about what they were considering.
I picture the scene: maybe someone’s kitchen table, coffee going cold as the conversation stretched longer than anyone expected. Probably some uncomfortable silences. Definitely some hard questions about money, risk, and what happens if this doesn’t work. Someone’s kid wandering through asking when dinner would be ready, not understanding that the adults were deciding something that would shape their family’s next fifty years.
Tim Rauen, who would become CEO, describes their founding vision this way: “GenoSource was founded to create a modern, efficient cow capable of excelling in free-stall environments with few health issues and high feed efficiency. Each of our partners already had a start on their own genetic lines, and we believed bringing these bloodlines together could ultimately create a great genetic offering not only to our farm but to dairymen across the country.”
I don’t know if everyone said yes immediately. I’d be surprised if they did—eight families means eight different risk tolerances, eight different financial situations, eight different ideas about what “quality” actually means when you’re writing checks. But somehow, through whatever conversations I wasn’t there to hear, they found their way to the same answer.
That’s the part that still amazes me.
They formed GenoSource LLC with three cousins at the helm: Tim as CEO, handling vision and genetics strategy; Matt as CFO, managing the financial weight of their collective bet; and Kyle as COO, turning philosophy into daily operational reality.
“We don’t want to milk just any cow,” Tim explains. “We want to milk the best cow.”
What strikes me about that quote is who’s saying it. The conviction runs so deep now that it doesn’t matter whose grandfather first said it. That’s the thing about principles you actually mean—they don’t stay in one family. Somehow, they spread until everyone owns them.
The eight families didn’t just agree to use good genetics; they agreed to live by it. They agreed that “best bull, not cheapest bull” would be the non-negotiable foundation of every decision they’d make together.
“It costs the same to feed a bad cow as a good cow, so invest your resources wisely.” — Joe Simon, founding philosophy of Farnear Holsteins, 1962
When Teams Actually Work
Here’s something Matt Simon shared earlier this year that I keep thinking about: “Each member of our partner team brings their own area of expertise, whether it’s genetics, milk markets, finances, construction, cow care, or other specialties. We depend on each other to offer the best solutions, collaborating openly.”
That sounds like corporate boilerplate until you hear what comes next.
“With such a diverse team of partners and employees, we approach challenges with a focus on what’s best for the farm, leaving emotions aside. Disagreements or better suggestions don’t hold us back; we understand that everyone shares the same ultimate goal. We have discussions, make decisions, and move forward together.”
Eleven years. Eight families. “We have discussions, make decisions, and move forward together.”
The fact that they made it work for eleven years says something profound about what shared conviction can accomplish. Or maybe they’re all just really good at group texts.
I’ve seen partnerships like this fracture over less—over one family wanting to exit when another wanted to expand, over different ideas about debt tolerance, over whose kids get leadership roles and whose don’t. Eight families is a lot of futures to keep aligned.
But they did it. And six of their original team members have been with them since 2014. That kind of loyalty doesn’t happen by accident.
When Everything Falls Apart
Five years ago, the skies over Iowa darkened.
A derecho—a wall of wind with hurricane-force intensity—tore across the state in August 2020. When it passed, half of GenoSource lay in ruins.
[IMAGE: Aerial view of GenoSource facility damage following the August 2020 derecho]
Matt described the moment of decision that followed: “We had to decide whether to make quick fixes or invest in long-term improvements. True to GenoSource’s style, we chose to invest and started making upgrades.”
That’s not a small sentence. “True to GenoSource’s style” means they saw a destroyed farm and an opportunity to build something better. Most operations would have patched what they could and moved on. These eight families decided to rebuild toward a vision rather than back toward what they’d lost.
“Since then, we’ve been in a continuous state of construction,” Matt continued. “We’ve added stalls to all our barns, installed tunnel ventilation with smart controls, built a new 90-stall rotary, created a sand separation facility, and incorporated numerous cattle monitoring systems.”
They’re still not done. A methane digester is coming online. A state-of-the-art maternity barn is in progress.
“When we set our minds to something, we dive in fully.”
That’s the same philosophy Joe Simon lived by for sixty-three years. Never the cheapest option. Never the easy path. Always the best choice for the long term, even when the short term is screaming for relief.
The derecho didn’t break them. It revealed what they were made of.
The Numbers That Tell the Story
Today, GenoSource milks 4,000 cows in that 90-stall rotary parlor, with plans to expand to 4,500. They milk three times daily—a practice most large dairies avoid because the labor economics seem impossible. They’re producing 18,000 embryos annually from a donor group of about 250 head and placing around 200 bulls into AI collection each year.
Their herd averages 93 pounds per cow daily at 4.8% butterfat and 3.6% protein. Those aren’t just impressive numbers individually—achieving them consistently across 4,000 cows is where management discipline and genetic foundation intersect in ways that matter.
And here’s the detail that shows me the philosophy actually works at scale: they test every female calf genomically. Every single one. All to identify which animals carry the legacy forward and which don’t.
Kyle Demmer captures the mindset driving all of this: “If you are not progressing, you are dying. We don’t believe in sitting still in any space of our business.”
Most operations would call genomic testing on every calf excessive. GenoSource calls it the whole point.
When Welfare and Economics Stop Fighting
Here’s something that surprised me in researching this story.
GenoSource milks three times daily across all 4,000 cows—not just the elite genetics tier, not just the registered animals, but everyone. That’s expensive. That’s labor-intensive. Most large operations avoid it because the math doesn’t seem to work.
Running a 90-stall rotary three times daily means cows are moving through that parlor around the clock—early morning, midday, and evening. It means staffing patterns that most operations can’t sustain. It means every cow, every day, getting that third milking, whether she’s a $50,000 donor or a commercial animal. No exceptions. No shortcuts.
But three-times-daily milking reduces udder pressure. It improves cow comfort. It lowers mastitis risk when properly managed. At their component levels—4.8% fat, 3.6% protein—the extra production from 3x milking actually pays for the additional labor.
They didn’t choose 3x milking because it was profitable. They chose it because it was right for the cows—and then they built a system where being right for the cows also happened to be right for the business.
Tim puts the broader philosophy this way: “Our milk check tells the story. Higher pregnancy rates, lower vet costs, and premium components all trace back to smart genetics.”
That’s not an accident. That’s what happens when you start every decision with “what’s actually right?” instead of “what’s cheapest?” Sometimes—not always, but sometimes—you discover that right and profitable aren’t as far apart as everyone assumes.
The Recognition That Kept Coming
The validation came in waves during 2024 and 2025—each one a quiet answer to sixty-three years of conviction.
First, Tim Rauen was named Holstein Association USA’s 2025 Distinguished Young Holstein Breeder. Then came the 2024 World Dairy Expo, where Farnear Delta-Lambda-ET won Premier Sire of the International Holstein Show and Farnear Altitude Red-ET won Premier Sire of the International Red & White Show. Two Premier Sires from the same breeding program in the same year. That almost never happens.
Joe Simon was still alive for that. In his late nineties, watching his philosophy proven on the biggest stage in dairy.
Then, in December 2025—three months after Joe’s passing—Boehringer Ingelheim announced that GenoSource had won the 2025 Dairy First Award for their commitment to milk quality and animal welfare.
I’ll admit I’m always a little skeptical when pharmaceutical companies hand out awards. There’s usually a business relationship underneath, and recognition programs are rarely pure altruism. But here’s what matters: GenoSource had actually to perform to be award-worthy. You can’t fake 4.8% butterfat across 4,000 cows. You can’t fake the three-times-daily milking commitment when there’s no one watching.
Tim Rauen’s response captures something real: “We take great pride in the products we create for the end user. Whether it’s the milk or cheese, or selling semen around the world, we’re producing the best products to the best of our abilities, and feel really proud of what we’re doing.”
Pride. That word echoes through this whole story. Not pride in the scale—though the scale is impressive. Pride in knowing that every cow in that rotary, whether she’s registered elite or commercial milk, gets the same 3x milking, the same baseline of care. Pride in the philosophy holding up when it would’ve been easier to let it slip.
The Uncomfortable Math Most Farms Face
I want to be honest about something that bothers me about award stories: they can make success seem inevitable. They can make the distance between “you” and “them” feel unbridgeable.
So let me be clear about what GenoSource has that most farms don’t.
They have 63 years of genetic inventory, which began with Joe Simon in 1962. You can’t replicate that in a decade. They have eight families’ combined capital cushion—enough to absorb bad years, fund long-term investments, and rebuild after a derecho without betting the whole operation.
They have scale economics that make technology investments cost far less per cow than they would on a smaller operation. They have relationships with genetics companies that took years to build—partnerships with STgenetics, Select Sires, Semex, ABS, and others developed through consistent performance.
A 200-cow dairy reading this story cannot simply “do what GenoSource does.”
I need you to hear that, because pretending otherwise would be dishonest.
But—and this is the part I keep coming back to—a 200-cow dairy can absolutely do what Joe Simon did.
You can decide, today, that you’ll never use the cheapest bull again. Premium semen versus budget options might cost several thousand dollars more annually, but the genetic gain compounds over decades.
You can genomically test your top heifer calves and make smarter culling decisions. That’s a few thousand dollars per year for information that used to be impossible to get.
You can identify your elite cows and produce embryos for regional sales. That’s investment for genetics revenue that most farms leave on the table.
You can focus on milk components that earn premium pricing and invest in welfare practices that reduce health costs while improving cow comfort.
That’s not GenoSource at 200-cow scale. That’s Joe Simon at any scale—a commitment to something better, applied to whatever you’re working with.
The eight families didn’t start with 4,000 cows. They started with a shared belief. The cows came later.
What Keeps Me Up at Night
Here’s the question nobody asks at award ceremonies: What happens next?
Eight families can agree on a philosophy when they’re building something together. It’s harder to stay aligned when you’re protecting something valuable, and everyone has different ideas about how to do so.
The generation with direct memory of Joe Simon is getting older. Tim, Matt, and Kyle are running the operation beautifully. But their kids are growing up too—some already showing cattle on the national circuit. Within ten years, they’ll be in their 30s, asking their own questions about what “best bull” means in 2035.
Some families will have kids ready to enter the business. Some will be approaching retirement. Some will have children with no interest in dairy. What happens when those interests diverge?
Tim said something earlier this year that gives me hope: “We want to pass our farm down to our kids and in order to do that we have to make all our decisions count.”
That’s not just about genetics. That’s about building something durable enough to survive the transitions that break most partnerships.
I don’t know how that story ends. Nobody does. That’s the article someone will write in 2035.
But here’s what gives me hope: they’ve already done the hard thing once. They’ve already proven that eight families can share one vision, that cousins can lead together, that a grandfather’s wisdom can scale beyond anything he imagined. They’ve already rebuilt from a derecho that would have ended most operations.
If they did it once, maybe—just maybe—they can keep doing it.
What This Story Actually Means
I’ve been thinking about why this matters to farmers who will never have 4,000 cows, produce 18,000 embryos, or win industry awards.
It matters because Joe Simon’s principle isn’t really about bulls at all.
“Never use the cheapest—use the best” is a decision framework for life. It applies to the genetics you choose, yes. But it also applies to the people you hire, the equipment you maintain, the corners you refuse to cut, the standards you hold when nobody’s watching.
Every dairy farmer faces that choice daily. The easy path or the right path. The cheap option or the quality option. Good enough or actually good.
Kyle Demmer captures this mindset: “If you are not progressing, you are dying. We don’t believe in sitting still in any space of our business.”
The choices add up. Joe Simon understood that in 1962. His grandchildren proved it in 2024. And somewhere in the math of sixty-three years of breeding decisions, the compounding became undeniable.
The Photograph, One More Time
Look again at those eight families standing together in Blairstown, Iowa.
Pat Carroll. Tom Simon. Rick Simon. Matt Simon. Tim Rauen. Bill Rauen. Steve Rauen. Kyle Demmer. Their spouses. Their children. Their shared conviction.
What you’re seeing isn’t just a 2025 award winner. You’re seeing a sixty-three-year experiment in whether the choices actually add up, whether families can stay united around shared principles, whether a grandfather’s simple stubbornness can survive industrialization and scale, and whether a derecho that destroyed half of everything they’d built can be overcome.
The experiment is still running. The next generation is already learning the philosophy—some of them probably rolling their eyes at another “Grandpa Joe story” while secretly taking notes. The future is already being shaped by decisions made today.
Joe Simon isn’t here to see what comes next. He passed in September 2025, at 97, having witnessed more validation of his life’s philosophy than most people ever do. Two Premier Sires. An operation that kept his principle at its center. Eight families still standing together. Grandchildren who speak his wisdom as their own.
And somewhere, right now, a farmer is reading this story and thinking about next spring’s breeding decisions. Not because they’ll ever have 18,000 embryos or win industry awards. Because they recognize the truth in what Joe Simon figured out before most of us were born.
Joe bet sixty-three years on a simple idea. Eight families bet their futures on it. The awards and the photograph already answered whether they were right.
The question is what you’ll bet on, the next time you’re standing in front of a choice that could go either way.
Unlock Hidden Dairy Profits Through Lifetime Efficiency – Cut your feed costs by $251 per cow using the specific RFI genetic selection and nutrition protocols detailed here. This guide moves beyond theory to show you exactly how efficiency compounds on your balance sheet, regardless of milk price volatility.
Bred for Success, Priced for Failure: Your 4-Path Survival Guide – Decide your operation’s future before the market decides for you. We break down the only four viable business models left in the genomic era—from hyper-scale to specialized niche—so you can stop guessing and start positioning your farm for 2030.
The Epigenetic Edge: How UK Herds Are Achieving a 7:1 ROI – See the technology that makes standard genomic testing look outdated. Discover how European herds are generating a 7:1 return by measuring gene expression (not just potential), delivering a 22% yield bump that most U.S. producers don’t even know is possible yet.
The Sunday Read Dairy Professionals Don’t Skip.
Every week, thousands of producers, breeders, and industry insiders open Bullvine Weekly for genetics insights, market shifts, and profit strategies they won’t find anywhere else. One email. Five minutes. Smarter decisions all week.
New research puts hard numbers on the hidden price tag of genetic progress—and what a 10-year crossbreeding study reveals might change how you think about your next breeding decisions.
Executive Summary: Inbreeding in Holsteins has tripled since 2014—silently adding an estimated $200-400 per cow in lifetime losses. These costs are not reflected in any report but appear as extra breedings, transition problems, and productive cows culled too soon. A 10-year University of Minnesota study tracked seven high-production herds averaging nearly 30,000 lbs. The finding: crossbred cows made 9-13% more profit per day. Every herd. No exceptions. That doesn’t make crossbreeding right for every operation—but it does change the math. For purebred programs, strategic outcrossing can slow the trend. For those open to alternatives, a decade of data demands attention. Both paths start with understanding what your genetics are actually costing you.
Here’s a number that probably isn’t on your radar: $200 to $400 per cow.
That’s the estimated lifetime profit you may be losing to inbreeding depression—losses that never show up on a breeding report, never get their own line item, and rarely get blamed on genetics. They show up as the cow that took an extra breeding. The calf that didn’t quite thrive. The cow you culled in the third lactation instead of the fifth. Most of us have seen these patterns in our herds without necessarily connecting them to genetics.
And here’s what makes this worth a closer look: Holstein genomic inbreeding has climbed dramatically over the past decade. The Council on Dairy Cattle Breeding’s trend data shows genomic inbreeding in young Holstein bulls has roughly tripled since 2014, with current averages pushing into the mid-teens percentage-wise. Lactanet Canada’s August 2025 update puts the average for Holstein heifers born in 2024 at 9.99%—nearly double what it was fifteen years ago. John Cole walked through this acceleration in detail at the 2024 Beef Improvement Federation symposium—and honestly, the rate of change caught even some industry veterans off guard.
Now, I want to be clear from the start: genomic selection has been one of the most valuable tools our industry has ever had. The genetic progress over the past decade has been remarkable. But there’s a growing body of research suggesting we need to look at the full picture—both the gains and the costs. And increasingly, producers I talk to are asking a fair question: What’s the net benefit when you account for everything?
Let me walk through what the research actually shows, what’s driving these trends, and what options might make sense for different operations.
What Inbreeding Is Actually Costing You
Let’s start with the economics, because that’s ultimately what matters when you’re making decisions for your operation.
Back in 1999, researchers at Virginia Tech—Cassell, Adamec, and Pearson—published a study in the Journal of Dairy Science that’s still the benchmark for understanding inbreeding costs. They found that each 1% increase in inbreeding reduces lifetime net income by $22-24 per cow, depending on whether you’re selling into fluid or cheese markets.
That study is over two decades old now, and I’ll be upfront about that. The underlying biology hasn’t changed, but dollar values certainly have. A rough inflation adjustment would put that figure somewhere around $40-45 per cow per percentage point in today’s terms—though I should note that’s a back-of-envelope calculation, not a formal research finding. We could really use an updated economic study on this, and I know several universities have been discussing it.
So, when genomic inbreeding rises substantially over a decade You’re potentially looking at $200-450 in lost lifetime profit per cow. For a 200-cow dairy in Wisconsin or a 500-cow operation in California’s Central Valley, that adds up to real money—$40,000 to $90,000 or more in economic impact that’s essentially invisible on your monthly reports.
Inbreeding depression silently steals profit from dairy producers because it is expressed mostly for traits that are not readily noticeable, such as embryo loss, less disease resistance, and shortened survival. That word “silently” is important. These aren’t losses you see on a vet bill or a milk check. They’re distributed across your operation in ways that are genuinely hard to track.
Production losses add up quietly. Research published in Genetics Selection Evolution—including detailed work by Doekes and colleagues in the Netherlands—found that every 1% increase in genomic inbreeding costs roughly 26-41 kg of milk per lactation. Doekes specifically documented a 36.3 kg decrease in 305-day milk yield per 1% increase in runs of homozygosity. Not dramatic for any single cow. But across a herd and over multiple lactations? It compounds.
Fertility takes a hit, too. That same body of research shows 0.19-0.48 additional days in the calving interval per 1% inbreeding increase. I know—sounds small. But if your herd is averaging 8-10% more inbreeding than a decade ago, that’s potentially 2-4 extra days open per cow. Talk to any reproductive specialist, and they’ll tell you what that costs over time.
Health resilience erodes. U.S. research involving hundreds of thousands of Holstein cows has documented significant inbreeding depression for reproductive and metabolic disease traits. The cows aren’t necessarily falling over sick, but they’re not quite as resilient as they could be. Fresh cow challenges. Transition period issues. Mastitis susceptibility. All of these have genetic components that inbreeding can compromise. I’ve had several producers tell me their fresh cow management seems harder than it used to be, and while there are many factors involved, this may be part of the picture.
Longevity shortens. Inbred cows tend to have shorter productive lives. And you know what replacement heifers cost these day, prices jumped from around $1,990 to $2,850. Getting four lactations instead of five from each cow changes your economics significantly.
Here’s what I find particularly telling: these are exactly the kinds of traits that don’t show up well on genomic evaluations. They’re low in heritability, hard to measure consistently, and easy to attribute to management rather than genetics.
The Numbers at a Glance
Metric
Data
Holstein genomic inbreeding trend
Roughly tripled since 2014
Current Holstein heifer average (Canada)
9.99% for 2024-born animals
Cost per 1% inbreeding
$22-24/cow lifetime (1999 dollars)
Potential herd impact (200 cows)
$40,000-90,000
Annual rate of increase
Approximately 0.35-0.44% per year
Data from Council on Dairy Cattle Breeding trend reports; Lactanet Canada August 2025; Cassell et al. 1999, Journal of Dairy Science; Doekes et al. 2019, Genetics Selection Evolution
What’s Behind the Trend
So why has inbreeding accelerated so dramatically? Several factors are working together, and here’s what’s worth understanding—each one made sense as an individual decision.
Genomic selection changed the timeline. Before genomics, progeny testing meant waiting 5-7 years to know if a bull was actually delivering what his numbers promised. Now we can identify elite genetics essentially at birth. That’s genuinely powerful, and it’s driven tremendous progress. But it also means popular sire lines spread through the population much faster than they used to. Bulls that would have taken a decade to significantly influence breed genetics now achieve similar penetration in 3-4 years. The genetics are better—but they’re also more concentrated.
Sexed semen reshaped breeding patterns. The technology has been transformative for heifer inventory management. Data from the UK’s Agriculture and Horticulture Development Board shows sexed semen now accounts for 84% of all dairy semen sales in Great Britain—with Holsteins specifically hitting 88-89% by April 2024. North American adoption continues climbing, too. The economics make sense for individual operations. But here’s the tradeoff: before sexed semen, breeding elite cows with conventional dairy semen produced roughly 50% bull calves, giving AI organizations a large pool of potential sires to evaluate. Today, that pipeline has narrowed considerably.
Beef-on-dairy became standard practice. And for good reason—those calves are worth real money, and the quality has improved dramatically. The National Association of Animal Breeders reported that beef semen represented about 31% of total semen sales to dairy operations in 2023, and Farm Bureau data from early 2025 indicates 72% of dairy farms now use beef genetics on at least part of their herd. That’s a rational economic decision for most operations. But combined with sexed semen on your top-end genetics, it means fewer Holstein matings overall. Canadian data from Lactanet shows Holstein-on-Holstein breedings have dropped from the mid-90s percent range to around three-quarters of matings in recent years
Industry structure evolved. This one’s worth understanding because it affects sire availability. Lactanet Canada’s analysis shows that between 2014 and 2019, bulls from AI-owned dams increased from 34% to 52% of marketed young bulls. I want to be clear about something: this isn’t a criticism of AI companies. They’re doing what makes business sense—investing in elite genetics and accelerating progress. And they’ve developed real tools to help manage inbreeding. But the concentration does have implications for genetic diversity that are worth being aware of when you’re making breeding decisions.
The Industry Perspective
It’s worth acknowledging that AI organizations aren’t ignoring this issue—far from it. Most major companies now offer mating programs that calculate genomic relationships and help avoid closely related matings. Tools like ABS’s Genetic Management System, Semex’s OptiMate, and similar platforms from other organizations are designed specifically for inbreeding management. These tools work, and they’re more sophisticated than what was available even five years ago.
And the industry has delivered real value. Various analyses suggest genomic selection has generated substantial economic benefit—potentially billions of dollars—through accelerated genetic progress over the past decade. That represents genuine improvement in production, health traits, and efficiency, as shown by milk checks and herd performance.
Here’s where it gets complicated, though. USDA geneticist Paul VanRaden and others have noted the fundamental tension: accepting slower genetic progress to manage inbreeding means potentially watching competitors move faster. For individual operations, using the highest-ranking bulls often makes economic sense regardless of relatedness. But when everyone does that, breed-wide inbreeding accelerates. It’s a classic collective action problem—individual optimization can lead to collective challenges.
Some countries have approached this differently. Nordic breeding programs in Denmark, Sweden, and Finland have historically weighted health, fertility, and longevity more heavily in their selection indexes—and their inbreeding trajectories look different as a result. Now, it’s not a perfect comparison. Different population sizes, different market conditions, different payment systems. But it does suggest that how we design selection indexes has real consequences for genetic diversity over time.
The question isn’t whether genomic selection has been valuable—it clearly has. The question is whether we’re fully accounting for all the costs alongside the benefits, and whether there are adjustments worth considering.
What a Decade of Crossbreeding Data Actually Shows
Here’s where the conversation gets really interesting: while most of the industry focused on maximizing genetic indexes in purebred Holsteins, researchers at the University of Minnesota spent 10 years collecting data on an alternative approach.
This wasn’t some small-scale grazing experiment or low-input system. These were seven high-producing herds averaging just under 30,000 lbs milk per cow—freestall confinement operations that would look familiar to commercial dairies across the Upper Midwest and beyond. The kind of herds where management is tight, and expectations are high.
The findings, published by Amy Hazel, Brad Heins, and Les Hansen in the Journal of Dairy Science, got my attention:
“For all seven herds in the study, the ProCross cows had more profit per day than their Holstein herdmates,” the researchers concluded. Not some of the herds. All seven.
Performance Metric
Holstein (Baseline)
Crossbred Advantage
Daily Profit
Baseline
+9-13% higher
Herd Life
Baseline
+153 days
Health Treatment Costs
Baseline
23% lower
Days Open
Baseline
12-17 fewer days
Stillbirth Rate
Baseline
Lower
Lifetime Death Loss
Baseline
4% lower
Now, I can hear the question you’re probably asking: “What about production?” Fair point. Crossbred cows in these studies did produce somewhat less milk per day than their purebred Holstein herdmates—typically 3-8% less in early generations, depending on the specific cross and lactation.
But here’s what the data showed: the lower production was more than offset by reduced costs and longer productive life. The crossbreds weren’t winning on any single metric—they were winning on total economics. Lower vet bills, fewer reproductive interventions, and more lactations per cow.
Producer Case Study: Cunningham Dairy, Iowa
Kelly and Christy Cunningham lost their fluid milk market in 2017 and began looking for a cow that would produce high components with a moderate size. Their search led them to the ProCross program. After purchasing cattle from three established ProCross herds through Creative Genetics and beginning their own breeding program, they now keep detailed comparative records on their crossbred and Holstein groups.
Their results:
Days open: ProCross cattle are open 22 days less than Holsteins
Pregnancy rates: 4-5 percentage points higher than Holsteins
Fresh cow health events (ketosis, metritis, DA, milk fever, retained placenta): Half of what they experience with Holsteins
Mastitis and pneumonia: More than 50% less than Holsteins
Health costs: $0.28/cow/day, lower than Holsteins
Dry matter intake: 4-10% less for ProCross cows
Components: +0.3% fat and +0.2% protein compared to Holsteins
“We are very pleased with the ProCross cattle,” Kelly says. “We have realized better components, better health, better reproduction, and lower herd turnover rate. As our ProCross herd matures, milk volume and ECM are improving compared to Holsteins.”(Source: Creative Genetics of California / ProCross testimonials)
Performance Metric
Holstein
ProCross
Winner
Days Open
Higher by 22 days
Baseline
ProCross
Pregnancy Rate
Lower by 4-5%
Baseline
ProCross
Fresh Cow Health Events
2× higher
Baseline
ProCross
Mastitis & Pneumonia
2× higher
Baseline
ProCross
Health Cost/Cow/Day
Higher by $0.28
Baseline
ProCross
Dry Matter Intake
Higher by 4-10%
Baseline
ProCross
European research published in the Journal of Dairy Science found similar patterns, noting that crossbreds achieved what researchers called a “win-win trade-off” on milk yield and fertility, while purebred Holsteins tended to show opposing trade-offs between the two. You could optimize heavily for one or the other, but getting both simultaneously was harder.
The mechanism behind this is well established in animal breeding: crossbreeding captures heterosis—hybrid vigor—which delivers approximately 5% improvement in production traits and 10-15% improvement in fertility, health, and survival. Those happen to be exactly the traits most affected by inbreeding depression. In a sense, crossbreeding reverses the inbreeding penalty while adding hybrid vigor on top.
Why More Farms Aren’t Crossbreeding
Given those results, you might wonder why rotational dairy crossbreeding remains relatively uncommon. I’ve had this conversation with producers across the country, and the reasons are worth understanding:
Index comparisons get complicated. Crossbred animals can’t be directly compared to purebreds on TPI or NM$, making it harder to evaluate genetic merit with the tools most of us rely on. For operations that use indexes as their primary selection framework, this creates genuine uncertainty. How do you track progress generation over generation when you can’t use the same yardstick?
Registration doesn’t fit. Breed associations require high purity thresholds—typically 87.5% or higher—for registration. If you’re selling breeding stock or involved in shows, crossbreds don’t work within that system.
Semen availability takes more effort. The breeds used in successful crossbreeding programs—Viking Red, Montbéliarde—aren’t as widely distributed through major North American AI organizations. You have to seek them out, work with specialized suppliers, and sometimes pay more for shipping.
Cultural factors are real. The dairy industry has deep roots in purebred genetics, and there’s social pressure—whether spoken or not—around breeding decisions.
For commercial operations focused primarily on milk production economics rather than registered genetics or show competition, these barriers may matter less than the profitability data suggests. But they’re real considerations, and I don’t think it’s helpful to dismiss them.
Practical Options for Your Operation
So what does this mean for your breeding decisions? It depends on your goals, your market, and honestly, your appetite for doing something different from your neighbors. Here’s how I’d think through the options:
If You’re Staying Purebred
Strategic outcrossing offers a middle path that many operations are exploring. The concept is straightforward: identify bulls with high genetic merit but low genomic relationship to your herd. You’re prioritizing diversity alongside performance rather than just chasing the highest index numbers.
What that looks like in practice:
Ask your AI representative for genomic relationship data, not just rankings. Most mating programs can generate this information—you just need to request it specifically.
Look at bulls’ pedigrees for underutilized sire lines. Sometimes the second or third-ranked bull is a better fit for your herd’s genetic profile than the top option.
Consider international genetics—Nordic, European, and New Zealand—that may be less related to dominant North American bloodlines.
Use mating programs that penalize inbreeding, not just maximize index. Most major AI organizations offer this setting, but it’s not always the default.
What about cost? Here’s something worth knowing: outcross bulls aren’t necessarily more expensive than top-ranked conventional options. Pricing depends more on proof of reliability and demand than on relatedness. In many cases, you can find bulls with strong genetic merit and lower relationship to your herd at comparable prices—you just have to ask specifically for that combination. Your AI rep can run the numbers for your situation.
Another option worth considering: use conventional semen on some of your top genetics. Sexed semen makes sense for maximizing heifer production, but using conventional semen on elite cows preserves the option for producing bull calves—potentially valuable if you’re interested in contributing to genetic diversity or selling to AI organizations looking for outcross genetics.
And here’s something important: for herds with high genetic merit that actively sell breeding stock into competitive registered markets, intensive purebred selection may remain the right strategy despite higher inbreeding levels. The premium prices for elite genetics can offset the inbreeding costs, and your market position depends on staying at the leading edge. Know your situation and your numbers.
If You’re Considering Crossbreeding
A measured approach lets you learn without betting the whole operation:
Start with 20-30% of your herd. This gives you enough animals to genuinely evaluate performance under your specific conditions—your feed program, your facilities, your management style—without a wholesale transformation. You’ll learn a lot in three years.
Choose breeds with research backing. Three-breed rotations using Holstein × Viking Red × Montbéliarde have the strongest long-term data behind them. The UMinn research specifically validated this combination in high-production environments.
Plan for the timeline. First crossbred daughters will calve approximately 3 years after initial breeding decisions. This isn’t a quick fix—it’s a strategic shift that requires patience.
Focus on commercial females. Crossbreeding strategies work best for cows whose daughters will enter your milking herd rather than the breeding stock market.
Organizations like Creative Genetics and Viking Genetics offer crossbreeding-focused programs and technical support if you want to explore this direction seriously.
Regardless of Which Direction You Go
Track your herd’s genomic inbreeding over time. Request runs of homozygosity (FROH) data from your genomic testing provider—Zoetis, Neogen, whoever you’re working with. Compare your herd average to breed benchmarks, and watch how it trends over generations.
And have a direct conversation with your AI rep. Ask specifically: “What are my outcross options? Which bulls in your lineup would reduce my herd’s average relatedness?” You might be surprised at what’s available when you ask the right questions.
A Few Things I’m Watching
A few developments worth keeping an eye on over the next several years…
Effective population size is a metric geneticists use to gauge long-term genetic health. Research published in the Journal of Heredity and elsewhere suggests that when effective population size drops below 50, populations face accelerated genetic drift and loss of rare alleles—genetic variation that can’t be recovered once it’s gone. Various studies estimate Holstein effective population size somewhere between 50 and 100, depending on methodology, which is why researchers are paying closer attention than they were a decade ago.
Evaluation systems may evolve. Some European breeding programs have begun incorporating inbreeding penalties into their selection indexes, rewarding bulls that combine high genetic merit with genetic diversity. If North American programs move in this direction—and there’s been discussion about it—that could shift which bulls rise to the top of rankings.
The math that keeps me up at night: At current accumulation rates of 0.35-0.44% per year, breed-average inbreeding will add another 2-3.5 percentage points by 2030. That’s $44-158 per cow in additional silent losses—already baked in unless breeding decisions change. The cows being bred this year will be milking through that reality.
Here’s how I think about it: You don’t buy fire insurance because you expect your barn to burn down. But you’re glad you have it if something unexpected happens.
Reader Challenge: What’s Your Herd’s Inbreeding Level?
Here’s something I’d genuinely like to know: What does your herd’s average genomic inbreeding look like?
Pull up your latest genomic herd report—whether it’s from Zoetis, Neogen, or another provider—and find your herd’s average FROH (runs of homozygosity) or genomic inbreeding percentage.
Drop your number in the comments below. No judgment here—we’re all dealing with the same industry trends. But seeing where different operations land could start an interesting conversation about what’s realistic to manage and what strategies are actually working.
If you’ve been actively using outcross sires or implementing crossbreeding, I’d especially like to hear how your numbers compare to where you started.
Not sure where to find this data? Your genomic testing provider can generate a herd inbreeding summary—you just need to ask for it.
Key Takeaways
The economics are real, even if they’re hard to see. Research from Virginia Tech found that each 1% increase in inbreeding costs approximately $22-24 per cow in lifetime profit. With breed-average inbreeding up substantially over the past decade—Lactanet Canada now reports 9.99% for 2024-born Holstein heifers—that represents meaningful money. Potentially $200-400 per cow that doesn’t appear on any line item but affects your bottom line.
Crossbreeding data is more compelling than many realize. The University of Minnesota’s 10-year study found crossbred cows delivered 9-13% higher daily profit across seven high-producing commercial herds. The advantages came from longer productive life, lower health costs, and better fertility. This was a decade of real data from real operations.
You have options within purebred programs. Strategic outcrossing—prioritizing bulls with high merit and low relationship to your herd—can slow inbreeding accumulation while maintaining genetic progress. The tools exist, outcross genetics are often competitively priced, and good AI reps can help you use them.
Track what matters to your operation. Request genomic inbreeding data on your herd and watch trends over time. Ask your AI representative specifically about outcross options, not just top rankings.
Match your strategy to your goals. Crossbreeding makes most sense for commercial operations focused on milk production economics. If you’re selling registered breeding stock into competitive genetic markets, intensive purebred selection may still be your best path. Neither approach is wrong. They’re optimizing for different outcomes.
The goal isn’t to abandon genomic selection—it’s delivered tremendous value to our industry. But making breeding decisions with full awareness of the trade-offs helps ensure short-term genetic gains don’t come at the expense of long-term herd profitability and resilience.
As with most decisions in dairy farming, the right answer depends on your situation. What’s changed is that we now have more data than ever to inform those decisions. The question is whether we’re willing to look at all of it, not just the parts that confirm what we’re already doing.
Key research referenced: Cassell, Adamec, and Pearson (1999), Journal of Dairy Science; Hazel, Heins, and Hansen, Journal of Dairy Science (ProCross study); Doekes et al. (2019), Genetics Selection Evolution; Council on Dairy Cattle Breeding trend data; Lactanet Canada August 2025 Inbreeding Update; AHDB sexed semen market reports; American Farm Bureau Market Intel.
Complete references and supporting documentation are available upon request by contacting the editorial team at editor@thebullvine.com.
Learn More
Does Your Breeding Program Fit Your Milk Market? – Stop overpaying for genetic potential your market won’t reward. This guide delivers a tactical five-step audit to align your sire selection with processor payouts, exposing the hidden inbreeding drags that quietly siphon $190,000 from your annual revenue.
2025 Dairy Year in Review: Ten Forces That Redefined Who’s Positioned to Thrive Through 2028 – Future-proof your operation against the 27-month supply constraint. This briefing exposes the structural forces reshaping the industry through 2028, arming you with the long-term capital allocation strategies needed to thrive while heifer scarcity drives replacement costs upward.
Genetic Revolution: How Record-Breaking Milk Components Are Reshaping Dairy’s Future – Gain a first-mover advantage as the genetic goalposts shift. This analysis breaks down how AI and microbiome PTAs are transforming selection, revealing the emerging tools that will define high-efficiency, climate-resilient herds by the turn of the decade.
The Sunday Read Dairy Professionals Don’t Skip.
Every week, thousands of producers, breeders, and industry insiders open Bullvine Weekly for genetics insights, market shifts, and profit strategies they won’t find anywhere else. One email. Five minutes. Smarter decisions all week.
Congress just reversed the whole milk ban—$4.3 billion and 13 years after dairy farmers first called it out. But here’s the uncomfortable truth: the farms best positioned to profit aren’t the ones that fought for it. Your 90-day playbook to change that.
Executive Summary: Whole milk won—13 years and $4.3 billion too late. Congress reversed school milk restrictions in December 2025, finally acknowledging what a 28-study meta-analysis proved in 2020: children who drink whole milk have a 40% lower risk of obesity than those who drink skim. The catch for most producers: school contracts require 500+ gallons daily, effectively locking out two-thirds of U.S. dairy farms. But the opportunity is real if you know where to look—mid-sized operations should be pushing cooperatives toward whole milk school packaging lines, smaller farms can tap a $2.15 billion premium market where marketing fat as a feature beats hiding it, and component-focused genetics now align with both institutional and consumer demand signals. This playbook segments 90-day action steps by herd size because the market opportunity from this shift is unevenly distributed. The lesson that outlasts whole milk: surviving in dairy means building operations resilient enough to weather the years between when science proves you right and when policy finally catches up.
Thirteen years of watching kids push away skim milk cartons. $4.3 billion in estimated industry losses. Roughly one-third of U.S. dairy farms are gone.
And now, finally, whole milk is coming back to schools.
The U.S. Senate passed the Whole Milk for Healthy Kids Act by unanimous consent on November 20, 2025. The House followed on December 15. But before you celebrate, here’s the uncomfortable truth: the farms best positioned to capture this win aren’t necessarily yours—unless you’re running several thousand cows or you’ve already built direct consumer relationships.
So what can the rest of us actually do with this?
The Policy Shift at a Glance
2012 Restrictions
2025 Reversal
Flavored milk
Fat-free only
Whole and 2% permitted
Unflavored milk
Fat-free or 1% only
All fat levels permitted
Saturated fat rules
Milk counted toward weekly limits
Milk exempted from sat-fat caps
Scientific basis
1980s-era low-fat consensus
A 2020 meta-analysis showing 40% lower obesity risk with whole milk
Market access
Favors large processors
Still favors large processors
The Component Math: Why This Actually Matters to Your Milk Check
Let’s talk numbers—because this is where the policy shift translates into real economics.
Whole milk contains 3.25% butterfat. Skim milk? Essentially zero. That’s a 3.25-pound butterfat difference per hundredweight.
According to the USDA’s November 2025 component price announcement, butterfat is currently priced at $1.71 per pound. That means whole milk in school channels carries approximately $5.56 per cwt additional butterfat valuecompared to skim.
Milk Type
Butterfat %
Nov 2025 Value/cwt
Jan 2025 Peak Value/cwt
Skim milk
0.0%
Baseline ($0)
Baseline ($0)
1% milk
1.0%
+$1.71
+$2.95
2% milk
2.0%
+$3.42
+$5.90
Whole milk
3.25%
+$5.56
+$9.59
Here’s where it gets interesting: butterfat prices have been volatile this year. Earlier in 2025, butterfat ran as high as $2.95 per pound back in January, which would put that same differential at roughly $9.59 per cwt. Even at today’s lower prices, the component value difference is meaningful.
Quick ROI comparison—Premium Channel Economics:
Channel
Price per cwt
Annual Revenue (100 cows, 23,000 lbs/cow)
Commodity (Class III, Nov 2025)
~$17.18
~$395,140
Premium direct/organic (based on Intel Market Research organic grass-fed pricing, typically 2-3× conventional)
~$40-50
~$920,000-$1,150,000
Difference
$525,000-$755,000
The math explains why producers willing to build direct relationships are capturing fundamentally different economics—even if the transition requires significant upfront investment.
The Genetics Connection: Breeding for a Whole Milk Future
Here’s something worth considering for those of you making breeding decisions right now: the whole milk policy shift adds another data point to an already strong case for component selection.
According to CDCB, the April 2025 genetic base evaluation showed unprecedented gains—Holsteins improved by 45 pounds for butterfat and 30 pounds for protein. The butterfat number’s almost double any number that’s taken place in the past.
The drivers are clear: genomic testing has improved selection accuracy, and multiple-component pricing allocates the majority of milk check value to butterfat and protein—the two components that drive your check under current FMMO formulas. With 61% of all dairy semen sold in the U.S. now coming from sexed categories, producers can accelerate genetic progress by creating heifer calves from top-component females while using beef semen on the rest.
Industry analysts projects that genetic selection could push average butterfat content above 5% within the next decade if herd nutrition can keep pace with genetics.
The practical takeaway for breeding programs: The whole milk policy shift reinforces demand signals that already favor component-focused genetics. If you’re not already emphasizing butterfat and protein in your sire selection, the economics increasingly favor that direction. Top Holsteins are now adding 45 lbs butterfat per genetic base reset—that’s real money showing up in component checks.
How We Got Here
The original policy wasn’t arbitrary. When the Healthy, Hunger-Free Kids Act passed in 2010, policymakers were responding to real concerns—childhood obesity had tripled since the early 1970s, climbing from around 5% to 15% by 2000, according to CDC data.
And you know what? The people who designed these policies weren’t acting in bad faith. They were working within the scientific framework available at the time. The problem? That framework had blind spots that dairy farmers spotted immediately.
Kids stopped drinking the milk. Schools added sugar to improve palatability. The anticipated health benefits never materialized.
When we chatted with a producer who runs a 650-cow operation near Fond du Lac, Wisconsin—who is a third generation on his family’s farm—he put it to me pretty directly: “We knew something was off within the first year. You’d watch the trash cans fill up with barely-touched cartons. The nutritionists were telling us fat was the problem, but we could see with our own eyes that kids just wouldn’t drink the stuff. My dad used to say the same thing about the low-fat push in the ’80s—consumers know what tastes right.”
It’s a sentiment I’ve heard echoed across dairy country, from Vermont to California.
What the Research Actually Found
The turning point came in February 2020. Dr. Jonathon Maguire, a pediatrician at the University of Toronto’s St. Michael’s Hospital, led a meta-analysis published in the American Journal of Clinical Nutrition that encompassed 28 studies across seven countries.
The findings were striking:
Children drinking whole milk had 40% lower odds of being overweight or obese
Not a single study showed that reduced-fat milk is associated with a lower obesity risk
The biological mechanism makes intuitive sense: dietary fats support satiety; remove them, and kids end up consuming more calories elsewhere
What I found particularly frustrating in this research was the timing. A 2013 University of Virginia study had already pointed in this direction—preschoolers who drank 1% or skim milk had higher odds of being overweight than peers who drank whole milk.
That study came out just one year after the restrictions took effect. It took seven more years for the Toronto meta-analysis and five more for the policy reversal.
Which raises an uncomfortable question many of us have asked ourselves: how many farms might still be operating if the policy had responded to evidence more quickly?
The Economic Damage
The American Farm Bureau’s analysis documents the consumption collapse pretty clearly:
School milk use fell from 4.03 cartons per student per week (2008) to 3.39 (2018)—a 15% drop
Rate of decline accelerated 77% after the 2012 rule change compared to the years before
An industry analysis by The Bullvine estimated a total economic impact of around $4.3 billion (though, like any economic model, that involves assumptions about multiplier effects and competitive dynamics)
“A policy that takes 13 years to correct can put an operation out of business long before the evidence wins out.”
The farm-level damage has been severe. USDA analyses show licensed U.S. dairy farms have fallen by roughly one-third over the past decade. You probably know some of those families personally.
Wisconsin: Steady reduction throughout the decade, particularly among smaller herds
California: Fewer but larger operations capturing an increasing production share
Canadian producers operate under different economic conditions—quota systems insulate them from some commodity volatility but create constraints on fluid milk innovation. The whole milk policy shift is a U.S.-specific development, but Canadian producers watching cross-border trends should note the demand signals. If American consumers are increasingly seeking full-fat dairy products, that sentiment doesn’t stop at the border. Some Ontario and Quebec processors are already watching U.S. premium channel growth with interest, and there may be lessons here for Canadian direct-market producers positioning their own operations.
A third-generation Vermont producer who transitioned to organic during this period described the frustration I’ve heard from many in the region: the school milk situation was just one piece of the economic pressure, but it was the piece that felt most frustrating because producers could see with their own eyes it wasn’t working.
What the Reversal Actually Means for Markets
Here’s where we need to be realistic with each other.
The Farm Bureau projects whole milk could shift 2-3% of U.S. butter production into higher-value bottled milk channels. That’s meaningful volume—but it’s not transformational on its own.
The adoption timeline is going to stretch out:
Early 2026: Districts start releasing procurement RFPs
Spring 2026: Contract bids due
July 1, 2026: First-wave contracts begin
Year 1: Maybe 40-50% district adoption, realistically
Year 3: Perhaps 50-60% adoption
School milk procurement requires a minimum of 500 gallons per day and favors operations that can consistently meet volume and delivery demands. For herds under 300 cows—roughly two-thirds of remaining U.S. dairy farms—direct school contracts just aren’t realistic. The logistics don’t pencil out.
The “Missing Middle” Problem—And What to Do About It
If you’re running 300 to 1,000 cows, you’re in a tough spot. Too small for institutional school contracts. Too large (and too busy) for a farmers’ market stand on Saturday mornings.
But you’re not without options. And frankly, your cooperative’s board probably isn’t thinking about this as hard as you are. That’s your job to push them.
Pressure your cooperative to innovate. Farmers own their co-ops—you can sit on the board, attend meetings, and push for change. Major cooperatives, including DFA, Land O’Lakes, and California Dairies, all offer forward contracting and risk management programs for members. Land O’Lakes launched its Dairy 2025 Commitment, a sustainability and processing innovation initiative. Some specific asks worth raising at your next member meeting:
School-specific packaging lines for whole milk that your co-op can bid on district contracts
Higher-fat fluid product development—the demand signal from this policy shift is clear
Regional processing partnerships that keep more value closer to member farms
Consider cooperative processing arrangements. One Minnesota cooperative involving four farms with a combined 1,800 cows reports routing 25% of collective production through a small processing facility they financed together, according to a recent Bullvine analysis of mid-sized farm strategies. That portion generates roughly twice the commodity price. The remaining 75% continues through traditional channels, so they’re not betting the whole operation on one approach.
“We didn’t have the scale individually to make processing investment work,” one participating farmer explained. “Together we did.”
This isn’t quick or easy—figure 24-36 months for facility build-out and $200,000-$500,000 in shared investment. But for operations with geographic proximity and complementary goals, it’s worth having a feasibility conversation over coffee with neighboring farms.
What if you do nothing? Let’s run those numbers honestly. If you’re in the 300-1,000 cow range, shipping commodity milk at ~$17/cwt while premium channels deliver $35-50/cwt, every year of inaction leaves roughly $200,000-$400,000 on the table (depending on herd size and component production). Over a five-year window, that’s potentially $1-2 million in foregone revenue—capital that could have funded the very infrastructure needed to access premium markets. The cost of waiting isn’t zero, even if it feels safer in the short term.
Advocate for policy that helps mid-sized operations. The school milk win came from organized industry pressure sustained over the years. The same approach applies to FMMO reform, processing infrastructure grants, and cooperative development programs. Individual voices get lost; collective voices get heard.
Your 90-Day Action Checklist
For operations under 300 cows (direct-to-consumer potential):
[ ] Contact your state dairy promotion board about marketing support programs—Midwest Dairy, American Dairy Association Northeast, Southeast Dairy Association, and regional councils often have resources specifically for small-scale direct marketing
[ ] Research farmers’ market requirements and seasonal milk subscription models in your region
[ ] Calculate your break-even point for premium channel investment (licensing, packaging, refrigeration)
Direct school district contracts + institutional positioning
Contact cooperative about 2026 school RFPs; request school milk bid timeline; explore branded whole milk partnerships
Immediate (contracts start July 1, 2026); leverage existing volume
The Premium Opportunity: Marketing the Fat
Here’s where smaller operations have a genuine advantage—if they understand what’s actually working out there.
Market research from Intel Market Research estimates the U.S. organic grass-fed milk market at $2.15 billion in 2025, projected to reach $3.28 billion by 2032 at roughly 7.3% annual growth. Subscription-based delivery models grew 92% over the past year alone.
But here’s what I’ve noticed watching the producers winning in this space: they’re not just producing premium milk. They’re marketing the fat. That’s a meaningful distinction.
Take Painterland Sisters, a fourth-generation Pennsylvania organic dairy. According to a recent Forbes profile, co-founder Stephanie Painter puts it directly: “We aimed to change the narrative surrounding milk fat.”
Their skyr yogurt contains 6% milkfat—double cream. According to Dairy Processing, each 5.3oz container holds the equivalent of four cups of milk. The sisters have emphasized that those healthy fats are central to their product’s nutritional profile—it’s a feature, not something to minimize or apologize for.
The result? Over 6,000 stores in all 50 states, including Whole Foods, Sprouts, and Publix. Forbes’ “30 Under 30” list. The fastest-growing yogurt brand in the natural foods space.
Their insight is instructive: the whole milk vindication isn’t just about returning to what was—it’s about actively marketing fat as a feature.
“Our story is what sets us apart on the shelves,” they told in a recent interview. “Every detail on the cup is designed to tell a story, bridging the gap between the farm and the fridge.”
For farms considering this pathway: launching farmers’ market sales, subscription programs, or an on-farm store requires real investment in licensing, packaging, and refrigeration. Your state dairy promotion board or cooperative extension office can connect you with producers who’ve made similar transitions in your region.
The honest question to ask yourself: Do you have the temperament for direct customer relationships, the capital for infrastructure, and the patience to build a brand? It’s not for everyone—and that’s okay. But for farms that fit the profile, the whole milk story provides a ready-made narrative that consumers genuinely want to hear right now.
Why Policy Correction Takes So Long
Understanding this dynamic helps prepare for whatever comes next—methane regulation, climate requirements, antibiotic restrictions. There’s always something on the horizon.
Research published in 2022 in the journal Public Health Nutrition examined the Dietary Guidelines Advisory Committee. The finding: 19 of 20 members (95%) had at least one documented financial or professional relationship with actors in the food or pharmaceutical industries.
Now, this doesn’t mean committees are corrupt or that members are consciously biased. What it illustrates is something more structural: these committees naturally draw from pools of credentialed experts who’ve built careers within existing consensus frameworks. Challenging established positions carries professional risk. Confirming them is safer. The incentive structure doesn’t reward rapid revision, even when new evidence accumulates.
The result? A system that changes slowly, regardless of how compelling the contradicting evidence becomes.
For producers, the takeaway isn’t that experts can’t be trusted. It’s that policy timelines operate on a different clock than farm economics. Plan accordingly.
Practical Lessons for What Comes Next
Build flexibility into your revenue structure. The farms that survived the last 13 years weren’t entirely dependent on a single market channel. Diversification provides a cushion when policy shifts unexpectedly against you.
One California producer I spoke with recently—running about 2,200 cows in the Central Valley—described it as “not putting all your milk in one tank.” He’s got relationships with three different buyers, plus a small direct-sales operation his daughter runs. When one channel gets disrupted, the others absorb the shift. It’s not complicated, but it requires intentionality.
Consider your story as an asset. If you’ve been farming through these years, you have credibility with consumers who’ve grown skeptical of institutional guidance. A farm that can authentically say “we knew whole milk was nutritious when experts said otherwise” has differentiation that larger operations simply can’t replicate.
Engage policy discussions before consensus hardens. The dairy industry’s organized response to school milk restrictions gained real momentum only after substantial damage had already accumulated. For emerging issues—such as methane regulation and climate requirements—earlier engagement yields better outcomes.
Plan for policy timelines, not evidence timelines. You might be right about the science for years before policy catches up. Your operation needs to survive that gap. That means capital reserves, operational flexibility, and revenue diversification that doesn’t depend on regulatory environments being rational.
The Bottom Line
The immediate market impact from whole milk’s return will be modest—a few percentage points of butterfat utilization, phased in over several years as districts convert.
But the broader lessons apply to whatever comes next:
Policy corrections take longer than farm economics can absorb. Build flexibility to survive the gaps.
Being right doesn’t automatically translate to market benefit. Thousands of farms closed while dairy farmers were correct about whole milk.
Market opportunity distributes unevenly. Large operations win on institutional contracts; small operations can win on premium positioning; mid-sized farms need cooperative innovation or collective processing strategies.
Direct consumer relationships provide policy insulation. And marketing the fat—not just producing it—is what’s actually working in premium channels.
Genetics reinforce the direction. Component-focused sire selection aligns with both premium market demand and institutional whole milk needs—top Holsteins are now adding 45 lbs butterfat per genetic base reset, and that’s real money showing up in component checks.
And honestly, that’s what this whole 13-year story comes down to. The farms that thrive going forward will likely be those that learned from this experience: not just that whole milk was right, but that surviving in this industry requires building operations resilient enough to weather the gaps between when evidence emerges and when policy finally responds.
That’s the real lesson here. Not just vindication—preparation.
We’ll be tracking school district adoption rates and Class I utilization by FMMO region throughout 2026—watch for quarterly updates on how whole milk demand is actually showing up in producer checks.
KEY TAKEAWAYS
$4.3 billion too late: Whole milk won in December 2025—but one-third of U.S. dairy farms closed during the 13 years policy ignored the science that proved them right
School milk isn’t your opportunity (yet): Contracts require 500+ gallons daily, locking out two-thirds of farms. Push your cooperative to bid on school packaging—that’s how mid-sized herds access this market
Your 90-day move by herd size: Under 300 cows → premium direct channels (organic grass-fed is $2.15B, growing 7.3%). 300-1,000 cows → cooperative pressure + shared processing ($200K-$500K). 1,000+ cows → 2026 school RFPs start soon
Butterfat math favors whole milk: At $1.71/lb, whole milk carries $5.56/cwt more value than skim. Top Holsteins now add 45 lbs butterfat per genetic base reset—component breeding pays regardless of channel
Build resilience before the next policy fight: Thirteen years between science and policy correction is normal, not unusual. Methane rules, climate mandates, antibiotic restrictions—your operation needs to survive the next gap, not just celebrate this win
Complete references and supporting documentation are available upon request by contacting the editorial team at editor@thebullvine.com.
Learn More
Whole Milk is Back in Schools. Here’s Why Only 834 Dairy Farms Will Really Win. – Exposes the brutal administrative reality of school contracts and delivers a segmented ROI analysis. This breakdown arms you with specific volume thresholds to determine if institutional bidding actually pencils out for your specific herd size.
$2 Milk or $20 Milk: The Simple Testing Strategy Creating 1000% Premiums – Breaks down the unconventional testing protocols that allow smaller herds to unlock thousand-percent price premiums. It delivers a proven blueprint for transforming regulatory transparency into a high-margin brand that completely bypasses the commodity price squeeze.
The Sunday Read Dairy Professionals Don’t Skip.
Every week, thousands of producers, breeders, and industry insiders open Bullvine Weekly for genetics insights, market shifts, and profit strategies they won’t find anywhere else. One email. Five minutes. Smarter decisions all week.
Three years ago, the FDA cleared gene-edited cattle. Today, early adopters have data. Late adopters have… assumptions. Which are you betting your genetics program on?
EXECUTIVE SUMMARY: Dairy farmers estimate 60% of consumers reject gene-edited products. Research shows only 18% are firmly opposed. That perception gap may be the most expensive blind spot in your genetics program. Three years after the FDA cleared SLICK heat-tolerant cattle, early adopters have data—late adopters have assumptions. For heat-stressed herds, the cost of waiting runs $200-250/cow annually, with genetic improvements compounding each generation you delay. But the math isn’t universal: California operations losing $275/cow face a different decision than Wisconsin herds at $75-80. Meanwhile, Indonesia and Pakistan are now importing heat-tolerant genetics—positioning matters. This analysis delivers the research, the regional economics, and a threshold framework to help you decide: adopt, wait, or pass. Your answer depends on your numbers, not industry noise.
Three years and potentially $200-250/cow in heat-stress savings later, North American dairy producers are weighing a decision that’s less about the science itself and more about competitive timing. Here’s what the emerging data suggests—and why the assumptions driving most producers’ hesitation may be years out of date.
Mark Thompson (name changed at his request) runs 650 Holsteins outside Fresno, California, where summer temperatures routinely top 105°F. Last July, he watched his herd’s conception rates drop to 18%—down from 42% in the cooler months. His cooling infrastructure costs nearly $85,000 in electricity alone annually.
“I’ve been following the SLICK genetics conversation for two years now,” Thompson told me when we spoke in early December. “My AI rep keeps bringing it up. But every time I think about pulling the trigger, something holds me back. It still feels like we’re early on this.”
You know, Thompson’s hesitation reflects what I’m hearing from producers across the country—a reasonable caution about adopting new technology balanced against growing questions about what waiting might cost. That push-and-pull is worth unpacking.
Semen premium at current pricing: ~$60/breeding × 200 breedings = ~$12,000/year
Net potential benefit: ~$167,000/year (before accounting for multi-year genetic lag)
Your numbers will be different. That’s exactly the point.
Region
Annual Heat Stress Cost per Cow
Typical THI Days >72
SLICK Break-Even at $60 Semen Premium
Adoption Priority
California (Central Valley)
$250-275
90-120
Year 1
High
Texas (South)
$220-240
85-110
Year 1
High
Arizona
$260-280
95-125
Year 1
High
Wisconsin
$75-80
25-35
Marginal
Evaluate
Minnesota
$60-70
20-30
No
Low
Pacific Northwest
$50-65
15-25
No
Low
What European Regulatory Shifts Signal for You
European regulatory shifts on gene-edited crops signal where livestock rules may eventually head—but if you’re tracking this space, don’t expect quick clarity. The EU has been moving toward a more permissive framework for new plant genomic techniques, though several member states, including Germany and Austria, remain cautious. Livestock-specific regulations are still being worked out, and Germany’s retail sector may create de facto barriers regardless of what Brussels decides.
Here’s what matters for your planning: A 2024 survey commissioned by the German Association for Food without Genetic Engineering (VLOG) and conducted by the Civey polling institute with over 5,000 respondents found that 84% of German voters want mandatory labeling for new genetic engineering in food. That’s a significant number, and it creates real tension between regulatory permission and actual market acceptance.
German retailers have shown they’re willing to go beyond what regulations require. Back in 2022, ALDI’s German chains committed to shifting their private-label fresh milk to higher Haltungsform animal welfare tiers, and since then, they’ve steadily moved away from lower-tier sourcing—using welfare labeling as a competitive signal to consumers. Industry observers expect similar dynamics could develop around gene-edited dairy, where regulation might eventually permit it, but major retailers will continue to differentiate based on production methods.
In practice, this probably means Europe’s gene-edited dairy market—whenever it materializes—will develop as a two-speed structure. Denmark, the Netherlands, and parts of France appear more receptive to the technology. Germany and Austria may maintain de facto barriers through retail positioning, regardless of what Brussels ultimately permits. For North American producers thinking about export opportunities down the road, this regional variation matters.
Canadian producers face additional considerations given Health Canada’s separate regulatory process for novel foods and animal products—another variable for cross-border operations to track.
The Performance Data That’s Accumulating
While European regulators deliberate, North American genetics companies have been building a meaningful head start. SLICK genetics—the naturally occurring mutation in the prolactin receptor gene that produces a shorter, slicker coat for better heat dissipation—have been commercially available in beef cattle since the FDA issued its low-risk determination and chose enforcement discretion in March 2022. That’s three years of real-world performance data.
Dr. Raluca Mateescu, professor of quantitative genetics at the University of Florida and one of the lead researchers on SLICK cattle, has documented the performance differences in studies published in the Journal of Dairy Science and Journal of Heredity. Research from her team and collaborators in Puerto Rico has shown that slick Holsteins hold milk production better during hot months and demonstrate shorter calving intervals under tropical conditions compared with their herd-mates—indicating measurable advantages for both production and fertility in heat-stress environments.
I spoke with a producer in south Texas who adopted SLICK genetics two years ago. “The first summer, I wasn’t sure I was seeing much difference,” he told me. “The second summer, when we had that brutal August, my SLICK-sired heifers held production while everything else dropped. That’s when it clicked for me.” His experience isn’t universal—results vary by operation and climate—but it reflects the pattern researchers are documenting.
What’s particularly worth considering is how genetic advantages compound over generations. Producers implementing SLICK genetics in 2026 will have daughters producing by 2028. Those daughters provide lactation data that refines selection for subsequent generations. A producer starting in 2030 enters four years behind operations that have already completed multiple breeding cycles.
Dr. Mateescu framed it this way: “The genetics that go into your herd this year produce daughters that lactate in 2027-2028. Every year you wait, you’re a year behind the producers who didn’t wait. And unlike other management decisions, you can’t accelerate genetics. Biology sets the timeline.”
That’s a consideration worth weighing—though it needs to be balanced against the legitimate questions some producers have about technology maturity and market acceptance.
The Case for Deliberate Waiting
Not everyone is convinced the timing pressure is as urgent as some suggest, and those perspectives deserve serious consideration.
I spoke with a third-generation dairy operator in central Wisconsin who has deliberately decided to hold off. “My heat stress losses run maybe $75-80 per cow in a bad year,” he told me. “Most years it’s less. At current semen premiums, the math just doesn’t work for my operation. I’m not opposed to the technology—I’m just not going to pay a premium for a problem I don’t really have.”
His point is worth sitting with. A Wisconsin producer at $80/cow heat losses and a Fresno producer at $280/cow are facing fundamentally different math. For Upper Midwest, Northeast, and Pacific Northwest operations, where heat-stress events are less frequent and less severe, the economic case looks fundamentally different.
There’s also a reasonable argument for letting early adopters work through the learning curve. “Someone has to be first,” another producer in Minnesota mentioned. “But that doesn’t have to be me. I’d rather see three or four more years of commercial data before I commit my breeding program.”
That’s not resistance to technology—it’s rational risk management.
Beyond Heat Stress: The Broader Genetic Shift Coming
Heat tolerance represents the first commercially available application of gene editing in cattle, but it’s not the only trait in development. The same precision editing techniques are being applied experimentally to other welfare-relevant traits—and this broader shift may reshape how consumers and producers think about genetic technology altogether.
Gene editing has already been used experimentally to produce polled dairy calves—born without horn buds—which, if commercialized at scale, could eliminate the need for traditional dehorning. According to USDA’s 2014 NAHMS Dairy study and related welfare research, roughly 94% of U.S. dairy operations disbud or dehorn heifer calves. No commercial timeline for polled gene-edited dairy cattle has been announced, but the research is progressing.
As these alternatives approach availability, an interesting question arises: How will consumers view operations that continue traditional procedures when genetic alternatives exist? I don’t think anyone knows the answer yet, but it’s worth considering.
Work from Dr. Candace Croney’s team at Purdue University’s Center for Animal Welfare Science suggests that when gene editing is explicitly tied to animal welfare benefits—such as reduced pain or better heat comfort—consumer acceptance rises noticeably, and a substantial share of consumers report they’d be willing to pay more for those products.
Consumer Segment
No Context (%)
Heat Comfort Benefit (%)
Polled Benefit (%)
Firmly Opposed
22%
18%
15%
Skeptical but Persuadable
28%
20%
18%
Neutral
30%
25%
22%
Supportive
15%
24%
28%
Strong Supporters
5%
13%
17%
The Perception Gap You Should Know About
This brings me to something genuinely surprising from the research—and it’s worth paying attention to.
European consumer research, including work from the University of Copenhagen published in peer-reviewed journals, has found that when benefits are clearly explained, only about one in five consumers express firm opposition to gene-edited dairy products—substantially lower than most farmers estimate.
When farmers in those same studies estimated consumer response to gene-edited dairy, most thought only 30-40% would accept it. The research suggests acceptance runs considerably higher than that.
Think about that: most of us have been making breeding decisions based on consumer resistance assumptions that the research says are roughly twice the actual level. That’s a meaningful blind spot.
Why might this be? Anti-GMO messaging is organized, visible, and gets significant media coverage. But across multiple consumer studies on GM and gene-edited foods, researchers commonly find a relatively small but vocal minority who are strongly opposed, while a much larger middle group is either neutral or open to these technologies once they understand the benefits—particularly when those benefits relate to animal welfare.
There’s also loss aversion to consider. Behavioral economics research consistently finds people weight perceived losses roughly twice as heavily as perceived gains when evaluating new decisions—a pattern that applies to technology adoption in agriculture. The immediate $50-75 premium for gene-edited semen feels more significant than a delayed annual benefit per cow—even when the math clearly favors adoption over time.
Dr. Nicole Olynk Widmar at Purdue, who’s done extensive published work on agricultural technology perceptions, put it to me this way: “Producers are making rational decisions based on the information environment they’re in. But that information environment is heavily weighted toward vocal opposition. The silent majority of consumers who are neutral or positive just don’t show up in the same way.”
Consumer attitudes can shift, and survey responses don’t always predict purchasing behavior. But the size of this perception gap suggests many producers may be working with assumptions that are years out of date.
The Global Picture—And Why It Matters for Your Genetics
For those of you tracking export genetics opportunities, here’s the global context in brief.
Indonesia has set a target of importing around 1 million dairy cattle by 2029 under their Fresh Milk Supply Road Map, according to Agung Suganda, director general of livestock and animal health at Indonesia’s Ministry of Agriculture. The opportunity isn’t selling commodity milk—it’s supplying heat-tolerant genetics that make tropical dairy production viable.
In May 2025, University of Florida researchers shipped the first SLICK Holstein genetics to Pakistan, working with a commercial operation called DayZee Farms in Bahawalpur, Punjab province, where temperatures routinely exceed 115°F in summer. Traditional Holstein genetics struggle in those conditions—this is exactly the kind of market where heat-adapted genetics could become essential.
China is building domestic breeding capabilities rather than remaining dependent on Western genetics. And recent trade actions—China imposed provisional duties of up to 42.7% on EU dairy products effective December 23, 2025, according to multiple news sources, including Reuters and ABC News—suggest the country views dairy increasingly through a strategic lens.
Operations building heat-adapted genetics now are positioning for export markets that may become significant—but that window may not stay open indefinitely.
Running Your Numbers: A Decision Framework
So what does this mean for your operation? Here’s how to think through it:
As a rough threshold: Operations seeing heat-stress losses above $150/cow annually in an average year are likely candidates for serious evaluation. Those below $75/cow may find the current semen premium harder to justify. Between those numbers? That’s where your specific circumstances—facilities, climate trajectory, breeding goals—really matter.
Understand your actual heat stress economics. Pull DHI records from the last three summers. Identify days when your Temperature-Humidity Index exceeded 68-72. Calculate the production drop compared to your spring and fall baseline. When Thompson dug into his records, he estimated that heat stress was costing him about $250-300 per cow annually. The Wisconsin producer pegged his at $75-80. Those aren’t national benchmarks—they’re individual calculations that show how sharply the economics diverge by region.
Have the availability conversation. SLICK genetics are commercially available through university programs and select AI providers, with availability expanding. Ask your rep about current sire offerings and pricing in your market, and whether they can connect you with producers in your region who’ve made the switch.
Factor genetics into infrastructure decisions. If you’re planning significant upgrades to cooling infrastructure, consider model genetics as a partial alternative. SLICK genetics won’t eliminate cooling needs in serious heat-stress environments, but they may deliver a meaningful portion of the benefit at lower cost.
Document your baseline. Whatever you decide, keep detailed records. If you adopt, you’ll want data showing improvement. If you wait, you’ll want to understand what that decision cost—or saved—you.
Heat Stress Loss ($/cow/year)
Years to Break Even
Annual ROI
Economic Verdict
Typical Regions
$50-75
5-7 years
Low (10-15%)
Hold – Wait for cost decline
PNW, Upper Midwest
$75-125
3-4 years
Moderate (20-30%)
Marginal – Evaluate closely
Wisconsin, N. Minnesota
$125-175
2-3 years
Strong (35-50%)
Favorable – Consider adoption
Iowa, S. Wisconsin, N.Y.
$175-250
1-2 years
Very Strong (60-80%)
Strong – Adopt strategically
Missouri, S. Texas
$250+
<1 year
Exceptional (90%+)
Compelling – Delay costs money
CA, AZ, S. TX
Your Next 30 Days
Pull DHI records for the last three summers—calculate your actual heat stress cost per cow
Call your AI rep and ask specifically about SLICK sire availability and current pricing
If cooling infrastructure investment is on your horizon, model genetics as a partial alternative
Watch for processor/retailer sustainability messaging shifts in your market
Document your 2025 baseline so you can measure whatever you decide
Finding the Right Path for Your Operation
The gene-editing question isn’t really about whether the science works—the accumulating data from the University of Florida and commercial operations suggest it does. And it’s increasingly less about whether consumers will accept it—the research shows most will when benefits are explained, though some uncertainty remains.
The question is about timing, risk tolerance, and competitive positioning. And reasonable people can reach different conclusions.
Thompson called me last week with an update. He’s planning to breed 30% of his heifers to SLICK sires starting this spring. “I’m not going all-in,” he said. “But I’m done waiting for perfect certainty. The cost of being wrong looks a lot smaller than the cost of being late.”
That’s one framework—partial adoption that builds experience while maintaining flexibility. The Wisconsin producer is taking a different approach, deliberately waiting until the economics make more sense for his climate. The Minnesota dairyman wants more commercial data before committing.
Each of these can be the right decision depending on circumstances.
What’s clear is this decision deserves fresh evaluation—not because adoption is right for everyone, but because the assumptions driving most producers’ hesitation may be three years out of date. The landscape has evolved. In a global market, you’re either the one setting the pace or the one wondering where the margin went. Your 2026 breeding list is the first signal of which one you intend to be. Choose based on your math, not your neighbor’s comfort zone.
Key Considerations for Your Decision
Your heat stress threshold matters most. Above $150/cow in annual heat losses? Serious evaluation warranted. Below $75/cow? Current premiums may not pencil. Know your number before deciding.
Consumer resistance is lower than you probably think. European research consistently shows that only about one in five consumers firmly oppose gene-edited dairy when benefits are explained. Most farmers estimate roughly half that acceptance level—a meaningful blind spot worth correcting.
The welfare narrative is shifting. When gene editing is framed around animal welfare benefits, consumer acceptance increases substantially. Watch for shifts in processor messaging in your market.
Genetic improvement compounds. Decisions made in 2026 produce results in 2028; subsequent generations build on that. Biology sets the timeline—you can’t accelerate later.
European markets are fragmenting. German retail dynamics may create barriers even with EU regulations in place. Factor this into export genetics calculations.
Deliberate waiting can be rational. For cooler climates with minimal heat stress, or operations wanting more commercial data, waiting may be appropriate. The right answer depends on your math, not industry hype.
The Bottom Line
Here’s my take: Gene editing in dairy isn’t a question of if anymore—it’s a question of when and whether it fits your operation. The producers I respect most aren’t rushing in or digging in their heels; they’re running their own numbers, watching the early data, and making decisions based on their specific circumstances rather than industry hype or outdated fears.
KEY TAKEAWAYS
You’re likely 3X wrong on consumer rejection. Farmers estimate 60% oppose gene editing. European research shows 18%. That gap may be the most expensive assumption in your genetics program.
Your threshold: $150/cow in heat-stress losses. Above that annually? Gene editing math likely works. Below $75? It probably doesn’t. In between? Your specific numbers decide.
Genetics compound. Delay doesn’t. 2026 semen → 2028 daughters → 2030 granddaughters. Wait until 2030 to start, and you’re four years behind the herds that moved now.
Same technology, 4X different economics. A Fresno operation losing $275/cow and a Wisconsin herd at $75/cow aren’t facing the same decision—even when the pitch sounds identical.
Deliberate waiting is thoughtful. Defaulting to “not yet” isn’t. If you’re holding off based on your climate and math, that’s a strategy. If you’re holding off based on 2019 assumptions, that’s a blind spot.
Complete references and supporting documentation are available upon request by contacting the editorial team at editor@thebullvine.com.
Learn More
Genetics vs Management: The Multi-Million Dollar Dairy Tug-of-War – Reveals exactly where management failures mask your genetic potential. This guide breaks down the “profit leak” audit, ensuring you stop wasting elite genetics on facilities that simply cannot support the extra production.
The Global Dairy Outlook: Strategic Positioning for 2025 and Beyond – Exposes the structural shifts in global trade that will favor “cleaner” genetics. It arms you with the foresight to position your herd for premium export markets before the window of opportunity slams shut.
Gene Editing: The Next Frontier in Dairy Cattle Breeding – Delivers a technical roadmap for the traits following heat tolerance. Understand the commercial timeline for disease-resistant edits, giving you the competitive edge to pivot your breeding program before the rest of the industry reacts.
The Sunday Read Dairy Professionals Don’t Skip.
Every week, thousands of producers, breeders, and industry insiders open Bullvine Weekly for genetics insights, market shifts, and profit strategies they won’t find anywhere else. One email. Five minutes. Smarter decisions all week.
$97,500. That’s what weight-loss drugs are worth to a 500-cow dairy. Here’s how to capture it.
Executive Summary: $97,500 annually. That’s what a 500-cow dairy can capture by responding to the protein shift—a market realignment most producers haven’t traced to its source. GLP-1 weight-loss drugs have reached 41 million Americans who now consume high-protein dairy at triple the normal rate, reshaping what your milk is worth. Protein premiums have hit $5/cwt at cheese facilities, and December’s Federal Order update raised baseline protein to 3.3%—meaning below-average herds now subsidize neighbors who ship higher components. The opportunity stacks three ways: nutrition optimization ($8,750-$15,000), protein-focused genetics ($17,500-$22,500), and processor premiums ($24,000-$60,000). The catch: breeding decisions this spring won’t reach your bulk tank until 2029, rewarding producers who move early. The math is clear, the window is open, and this analysis shows exactly how to capture it.
A number worth sitting with: households taking GLP-1 weight-loss medications are consuming yogurt at nearly three times the national average. Not 20% more. Not double. Three times.
That data point comes from Mintel’s 2025 consumer tracking. It tells you something important about where dairy demand is heading—and raises questions worth considering if your breeding program has been focused primarily on butterfat.
Something meaningful is shifting in how the market values what comes out of your bulk tank. This isn’t a temporary blip or a pricing anomaly. What we’re seeing appears to be a structural change driven by forces that weren’t on most of our radars even five years ago—pharmaceutical trends, aging demographics, and global nutrition demands all converging at once.
This creates opportunities for producers positioned to respond. It also creates challenges for those caught off guard. The difference often comes down to understanding what’s actually driving these changes.
THE QUICK MATH: What’s This Worth?
For a 500-cow herd positioned to capture the protein shift:
Opportunity
Annual Value
Nutrition optimization (amino acid balancing)
$8,750 – $15,000
Genetic improvement (protein-focused selection)
$17,500 – $22,500
Processor premiums (above-baseline protein)
$24,000 – $60,000
Combined Annual Opportunity
$50,000 – $97,500
These figures assume: 500 cows, 24,000 lbs/cow annually, current component price relationships, and access to a processor paying protein premiums. Individual results vary based on current herd genetics, ration, and market access.
The Pharmaceutical Connection
When GLP-1 drugs first hit the market, I didn’t give much thought to dairy implications. Weight-loss medications seemed pretty far removed from breeding decisions and component pricing.
That thinking needed updating.
As of late 2025, roughly 12% of Americans—about 41 million people—have used GLP-1 medications like Ozempic, Wegovy, or Mounjaro. That figure comes from a KFF poll reported in JAMA in mid-2024, with subsequent tracking by RAND and others confirming the trend has held. Market projections for these drugs range from $157 billion to $324 billion by 2035, depending on which analyst you ask. This isn’t a niche trend anymore. It’s a mainstream pharmaceutical category reshaping eating behavior at a population level.
What makes this relevant to your operation is how these medications change consumption patterns. GLP-1 drugs work by slowing gastric emptying—patients feel full faster and eat much less. But their protein requirements don’t drop. If anything, clinical guidance suggests they increase.
Obesity medicine specialists now recommend GLP-1 users consume 1.2 to 1.6 grams of protein per kilogram of body weight daily—backed by research in the Journal of the International Society of Sports Nutrition and clinical practice guidelines from multiple medical organizations. That’s substantially higher than typical recommendations. The reasoning? Rapid weight loss without adequate protein intake leads to significant muscle wasting.
And this is where it gets clinically important: studies published in peer-reviewed journals indicate that between 25% and 40% of weight lost on these medications can come from lean body mass rather than fat. A 2025 analysis in BMJ Nutrition, Prevention & Health quantified this at “about 25%–40%” as a proportion of total weight loss. That’s a real concern for patients and their physicians—and it’s driving specific dietary recommendations.
So you have millions of people who can only eat small portions but genuinely need concentrated protein sources. What foods fit that profile?
High-protein dairy fits it remarkably well.
The consumption data supports this. According to Mintel’s tracking, Greek yogurt and cottage cheese consumption has increased significantly among GLP-1 users, while higher-fat dairy categories have moved in the opposite direction. Reports in June 2025 showed that “plain dairy and protein powders hold steady” while “processed goods are taking the biggest hit.” The exact percentages vary by study, but the directional trend is consistent.
There’s also a bioavailability dimension worth understanding. The DIAAS score—Digestible Indispensable Amino Acid Score, the FAO-recommended measurement method—indicates how efficiently the body uses different protein sources. According to research by the International Dairy Federation and the Global Dairy Platform, whole milk powder scores around 1.22 on DIAAS, while other dairy proteins consistently score 1.0 or higher. Compare that to soy at roughly 0.75-0.90, depending on processing, and pea protein at 0.62-0.64. For someone eating limited quantities, that efficiency difference matters considerably.
What does this means practically? This isn’t just a preference shift—there’s a physiological basis driving these patients toward nutrient-dense protein sources. Dairy happens to fit that need particularly well.
Reading Your Milk Check Differently
So consumer preferences are shifting. What does that actually mean for component pricing?
The answer depends partly on your market, but broad trends are worth understanding.
Looking at USDA component price announcements over recent months, protein has traded at a meaningful premium over butterfat. Through late 2025, the protein-to-fat price ratio has been running in the range of 1.3 to 1.4—a notable departure from historical norms. For much of the past two decades, these components traded closer to parity, with fat often commanding a slight premium.
I recently spoke with a Wisconsin producer who’d been closely tracking this shift. “I started paying attention about two years ago,” he told me. “Once I saw the ratio consistently above 1.25, I went back and looked at my sire selection. Realized I’d been leaving money on the table.”
That experience isn’t unusual. Many producers look at their check, review the component breakdowns, and maybe note whether fat or protein prices have changed from last month. But they’re not calculating what the spread actually means for breeding strategy over time.
Let me put some illustrative numbers on it, using late 2025 component price relationships as a guide.
Consider a 500-cow operation producing 24,000 pounds per cow annually. If you compare a fat-focused breeding approach averaging 4.0% fat and 3.1% protein against a protein-focused approach averaging 3.7% fat and 3.4% protein, the difference in total component value can run $35 to $45 per cow annually from the bulk tank alone (these figures shift as component prices move, but the general principle holds when protein maintains its current premium over fat). For that 500-cow herd, you’re looking at roughly $17,500 to $22,500 in annual difference from genetics alone.
That’s before considering processor premiums that cheese and ingredient plants often pay for high-protein milk. Factor those in, and the opportunity can be larger still.
I want to be measured here. I’m not suggesting everyone immediately overhaul their breeding strategy. What I am suggesting is that this ratio deserves more attention than most producers have been giving it.
The Federal Order Update
Another dimension affects how money flows through the pricing system.
The June 2025 updates to Federal Milk Marketing Order formulas—finalized by USDA in January 2025 after the producer referendum—adjusted baseline composition factors to reflect current herd averages. According to the USDA Agricultural Marketing Service final rule, protein moved from 3.1% to 3.3%, other solids from 5.9% to 6.0%, and nonfat solids from 9.0% to 9.3%. The composition factor updates became effective December 1, 2025.
Why does this matter practically? Processors now assume your milk contains 3.3% protein as the baseline. If you’re consistently shipping 3.0% or 3.1%, you’re not just missing premiums—you may be contributing to the pool that pays premiums to higher-component herds.
I’ve spoken with producers who didn’t fully grasp this dynamic at first. They knew their components were “a little below average” but figured it wasn’t significant. When we worked through their position relative to the pool, they were surprised to see how much value was being transferred out of their operation each month.
The system isn’t unfair—it’s designed to reward quality. But you need to understand where you stand within it.
Genetic Strategies Worth Considering
For operations looking to improve protein production, genetic selection offers the most durable path forward. The challenge, as we all know, is that results take time to show up in the bulk tank.
The timeline reality looks something like this:
From Breeding Decision to Bulk Tank Impact
Select high-protein sires (January 2026) → Semen in tank
Breed cows (Spring 2026) → Conception
Gestation (Spring 2026 – Winter 2027) → Calf born
Heifer development (2027 – 2028) → Growing replacement
First calving (Late 2028) → Enters milking string
First full lactation data (2029) → Bulk tank impact measurable
Phase
Timing
Months from Decision
Sire Selection
January 2026
0
Breeding/Conception
Spring 2026
3–6
Gestation
Spring 2026 – Winter 2027
12–15
Heifer Development
2027 – 2028
24–30
First Calving
Late 2028
33–36
Measurable Bulk Tank Impact
2029
36–48
If you breed a cow this spring, her daughter won’t enter the milking string until late 2028 at the earliest. That’s just the biology. So breeding decisions you make in the next few months will shape your herd’s component profile three to five years from now.
Metric
Fat-Focused Strategy
Protein-Focused Strategy
Avg Fat %
4.0%
3.7%
Avg Protein %
3.1%
3.4%
Component Value/Cow/Year
$1,245
$1,290
Processor Premium/Cow/Year
$0
$120
Total Annual Herd Revenue (500 cows)
$622,500
$705,000
Revenue Advantage
—
+$82,500
This is why genetics is a long game—but it’s also the only permanent solution. Nutrition can help capture more of your genetic potential today, but it can’t exceed what the genetics allow.
One development that’s accelerating this timeline for some operations: genomic testing. If you’re testing heifers at a few months of age, you can identify your high-protein genetics earlier and make culling decisions before investing in two years of development costs. It doesn’t change the biological timeline, but it does let you be more selective about which animals you’re developing in the first place.
Selection Index Considerations
Most producers default to Total Performance Index (TPI) when evaluating Holstein sires, and it remains useful for balanced selection. But if protein improvement is a specific priority, Cheese Merit (CM$) rankings warrant closer scrutiny.
Trait Category
Minimum Threshold
Protein-Focused Target
Why It Matters
PTA Protein %
+0.03%
+0.04% to +0.06%
Improves concentration—the key to premiums
PTA Protein Pounds
+40 lbs
+50 lbs or higher
Ensures volume doesn’t drop as % increases
PTA Fat %
No minimum
+0.01% to +0.03%
Hedges against protein premium narrowing
Productive Life (PL)
+2.0
+3.0 or higher
Cows must last long enough to justify investment
Daughter Pregnancy Rate (DPR)
+0.5
+1.0 or higher
Poor fertility destroys genetic progress
Somatic Cell Score (SCS)
2.90 or lower
2.85 or lower
High SCC kills premiums faster than low protein
Inbreeding Coefficient
—
Monitor: keep below 6.25%
Aggressive protein selection can concentrate genes
Selection Index
—
Use CM$ or updated NM$
Better protein weighting than traditional TPI
CM$ places greater emphasis on protein per pound and protein percentage than TPI does. It was designed for operations shipping to cheese plants, where protein drives vat yield. The updated Net Merit (NM$) formula has also adjusted component weightings in recent years to reflect market realities.
General Thresholds to Consider
When evaluating individual sires for protein improvement, what many nutritionists and AI representatives suggest—keeping in mind these are general guidelines, not hard rules:
PTA Protein %: Bulls at +0.04% or higher are generally considered strong for protein concentration. Bulls above +0.06% are moving the needle meaningfully.
PTA Protein Pounds: Targeting +50 lbs or higher helps maintain total protein production while improving percentage.
Combined approach: The ideal sires show positive values in both categories. Bulls that improve percentage by diluting volume aren’t actually helping you.
One important caution: don’t chase protein so aggressively that you sacrifice health and fertility traits. A cow that burns out after 1.8 lactations isn’t profitable regardless of her component profile. Setting minimum thresholds for Productive Life and Daughter Pregnancy Rate before optimizing for components makes sense. Talk with your AI rep about what fits your specific situation.
Intervention Strategy
Low Estimate
High Estimate
Timeline to Impact
Nutrition Optimization (amino acid balancing)
$8,750
$15,000
2–4 weeks
Genetic Improvement (protein-focused sires)
$17,500
$22,500
3–5 years
Processor Premiums (high-protein milk)
$24,000
$60,000
Immediate (if available)
TOTAL ANNUAL OPPORTUNITY
$50,250
$97,500
Varies by strategy
A Note on Inbreeding
Another consideration doesn’t get discussed enough: selecting heavily for narrow trait clusters can accelerate inbreeding. Pennsylvania State University’s Dr. Chad Dechow, who has extensively studied genetic diversity in Holsteins, notes that intense selection for specific traits can accelerate genetic concentration faster than many producers realize—as he’s put it, “if it works, it’s line breeding; if it doesn’t, it’s inbreeding.” Research published in Frontiers in Animal Science found that selection for homozygosity at specific loci (like A2 protein) significantly increased inbreeding both across the genome and regionally. The takeaway: if you’re selecting aggressively for protein traits, monitor inbreeding coefficients and work with your genetic advisor to maintain adequate diversity in your sire lineup.
The Beef-on-Dairy Angle
There’s strategic flexibility that comes with the current beef market. Beef-on-dairy calves have been commanding strong prices—industry reports from late 2025 show day-old beef-cross calves going for $750 to over $1,000 in many markets, with well-bred calves sometimes topping $1,600 depending on genetics and condition. Dairy Herd Management reported in August 2025 that Jersey beef-on-dairy calves were fetching $750 to $900 at day of birth, with the market remaining robust through the fall.
Some producers are using this strategically: breed your top 40-50% of the herd to high-protein dairy sires for replacements, and use beef semen on the bottom half. You capture immediate cash flow from beef calves while concentrating genetic improvement on animals that will actually move the herd forward.
A California producer I spoke with recently has been doing exactly this for three years. “It changed my whole approach to replacement decisions,” she said. “I’m more selective about which genetics I’m actually keeping in the herd, and the beef calves are paying their own way.”
It’s not the right approach for every operation, but it’s worth thinking through.
The Nutrition Bridge
Genetics determine the ceiling for what your cows can produce. Nutrition determines how close you get to that ceiling. And unlike genetics, nutrition interventions can show results within weeks.
The most targeted intervention for protein production involves amino acid supplementation—specifically rumen-protected methionine.
The background: in typical U.S. dairy diets built around corn silage and soybean meal, methionine often becomes the limiting amino acid for milk protein synthesis. You can feed all the crude protein you want, but if the cow runs short on methionine, she can’t efficiently convert it to milk protein. The excess nitrogen gets excreted.
Rumen-protected forms of methionine—coated to survive rumen degradation—allow the amino acid to reach the small intestine, where absorption actually happens.
What the Research Shows
University trials—including work from Cornell, Penn State, and Wisconsin dairy extension programs—have demonstrated that rumen-protected methionine can boost milk protein percentage, often by 0.08% to 0.15% within 2 to 3 weeks of implementation. Results vary by herd and baseline diet, so verifying response on your own operation before committing fully makes sense.
Run a trial with one pen of mid-lactation cows for 21-30 days. Compare their component tests to a control group or their own pre-trial baseline. Work with your nutritionist on the economics—supplement costs, expected response, and whether it pencils at current protein prices. If you’re seeing the expected response, roll it out more broadly. If not, you haven’t invested much to find out.
One thing I’ve noticed, talking with nutritionists across the Midwest and Northeast, is that the response tends to be most consistent in herds that haven’t previously optimized their amino acid balance. If you’ve already been balancing for methionine and lysine, the incremental gain may be smaller. Fresh cows and early-lactation groups often show the most dramatic response, since that’s when protein synthesis is competing most with other metabolic demands during the critical transition period.
For a 500-cow herd seeing a 0.10-0.12% protein increase, that can translate to $8,750 to $15,000 annually in additional component value at current prices—often exceeding the supplement cost by a meaningful margin.
An additional benefit: because you’ve addressed the limiting amino acid, you may be able to reduce total ration crude protein slightly without sacrificing production. That can offset some or all of the supplement cost.
Processor Relationships
This dimension deserves more attention than it typically gets.
Not all processing facilities are equally equipped to capture the value of high-protein milk. Before making significant changes to your breeding program, it’s essential to understand what your buyer can actually afford.
Cheese plants—particularly the large cooperative facilities across Wisconsin’s cheese belt and specialty operations in California’s Central Valley—are generally the most straightforward. Higher protein concentration means more cheese per gallon processed. A plant can increase output without expanding capacity simply by sourcing higher-protein milk. Clear economic incentive exists to pay for it.
Processor Type
Protein Threshold
Premium per CWT
Annual Value (500 cows)
Commodity Powder Plant
No premium
$0.00
$0
Regional Cheese Co-op
3.3%
$0.50–$0.75
$60,000–$90,000
Large Cheese Facility (WI)
3.3%
$1.00–$1.50
$120,000–$180,000
Specialty Protein Plant
3.35%
$2.00–$3.00
$240,000–$360,000
Direct Contract (High-volume)
3.4%
$3.00–$5.00
$360,000–$600,000
Cheese plant managers I’ve spoken with confirm they’re actively seeking higher-protein milk supplies. One plant manager in central Wisconsin told me their facility has increased protein premiums twice in the past eighteen months, specifically to attract higher-component milk. “We’re competing for that milk now,” he said. “Five years ago, we weren’t having that conversation.”
What Premiums Actually Look Like
Processor premiums vary considerably by region and facility, but here’s what the market data shows: USDA Dairy Market News reports the average protein premium is around $1.25 per hundredweight above baseline. Some producers shipping to cheese-focused cooperatives report premiums in the $0.50 to $0.75/cwt range for modest improvements, while direct contracts with protein-hungry facilities can reach $3.00 to $5.00/cwt for milk consistently testing above 3.35% protein—though these premium contracts typically require volume commitments and consistent quality.
For a 500-cow herd producing 120,000 cwt annually, even a $0.50/cwt premium adds $60,000 to the annual milk check. At $1.00/cwt, that’s $120,000. The math quickly draws producers’ attention.
Ingredient and filtration plants making whey protein concentrates, milk protein isolates, and similar products also value protein highly. Operations in Idaho and across the West are specifically tooled to extract and monetize protein fractions. These facilities serve the growing functional nutrition market, including products for GLP-1 users.
Fluid milk bottlers and commodity powder dryers may have less ability to monetize elevated protein. If a bottler standardizing for the Southeast fluid market is already adjusting milk to regulatory specifications, excess protein beyond those specs doesn’t necessarily yield premium returns.
PROCESSOR CONVERSATION CHECKLIST
Download and bring to your next meeting with your milk buyer:
☐ Premium Structure
“What protein threshold triggers premium payments?”
“Is there a cap on protein premiums, or do they scale continuously?”
“How is the premium calculated—per point above threshold, or tiered brackets?”
☐ Testing & Verification
“How frequently is my milk tested for components?”
“Can I access my component test history for the past 12 months?”
☐ Plant Capabilities
“Does your plant have protein standardization capability?”
“What’s your target protein level for incoming milk?”
☐ Market Trends
“Are you seeing increased demand for high-protein products from your customers?”
“Do you anticipate changes to your premium structure in the next 12-24 months?”
☐ Contract Options
“Are direct premium contracts available for consistent high-protein suppliers?”
“What volume and consistency requirements would apply?”
Keep notes from this conversation—the answers should inform your breeding and nutrition decisions.
The answers might influence how aggressively you pursue protein genetics. If your buyer caps premiums at 3.3%, there is less incentive to push for 3.5%. If they’re paying meaningful premiums with no cap because they’re expanding ingredient production, that’s entirely different information.
A Decision Framework
Given this complexity, a framework for thinking through whether an aggressive protein pivot makes sense:
Consider aggressive protein focus if:
You ship to a cheese plant or ingredient facility
Your current herd averages below 3.25% protein
Your buyer explicitly pays protein premiums without caps
You have flexibility in your replacement strategy
Your herd health metrics are already solid
Consider a balanced approach if:
You ship to a fluid bottler or a diversified cooperative
Your herd already averages 3.3%+ protein
Your buyer caps protein premiums at a specific threshold
You’re still working on fertility or longevity genetics
You operate in a region with limited processor options
Consider maintaining the current strategy if:
Your processor has no protein premium structure
Switching buyers isn’t practical for your location
Your herd has significant health or fertility challenges to address first
You’re already at or above pool averages for both components
There’s no single right answer here. The key is matching your genetic strategy to your actual market circumstances.
Your Current Situation
Aggressive Protein Focus
Balanced Approach
Maintain Current Strategy
Processor pays protein premiums?
Yes, uncapped or high cap
Yes, but capped at 3.3–3.4%
No premium structure
Current herd protein average
Below 3.25%
3.25–3.35%
Above 3.35%
Milk buyer type
Cheese/protein plant
Diversified co-op
Fluid bottler/powder plant
Herd health & fertility status
Already solid (DPR >20%)
Some challenges
Significant problems to fix first
Ability to switch processors
Yes, within 50 miles
Limited options
Locked into current contract
Replacement strategy flexibility
Can use beef-on-dairy
Raising most replacements
Must raise 100% replacements
Risk tolerance
Willing to commit 3+ years
Moderate
Conservative
RECOMMENDATION
Go aggressive: aim for 3.4–3.5% protein
Incremental improvement: target 3.3–3.4%
Focus on other profit drivers first
Regional Considerations
This analysis doesn’t apply uniformly across all operations and regions—something worth acknowledging.
Upper Midwest herds shipping to Wisconsin cheese plants are positioned differently than Southeast operations serving fluid markets. A 3,000-cow operation in the San Joaquin Valley faces different economics than a 100-cow farm in Vermont or a grazing dairy in Missouri.
Those shipping to cheese-focused cooperatives in Wisconsin and Minnesota have generally been tracking protein-to-fat ratios more closely—some for several years—and have adjusted breeding programs accordingly. In conversations with producers in these areas, I’ve repeatedly heard that neighbors who were initially skeptical are now asking about sire selections.
But producers in fluid-heavy markets often take a more measured approach. If your buyer can’t pay for high protein, breeding for a premium you can’t capture doesn’t make economic sense. Watching trends while maintaining flexibility is entirely reasonable.
Both perspectives make sense given their circumstances.
The fundamental trends—GLP-1 adoption, component pricing shifts, global protein demand—are real regardless of location. But how you respond depends on your specific situation: current herd genetics, processor relationship, cash flow position, and risk tolerance.
The Global Context: America’s Protein Export Opportunity
What’s happening domestically aligns with broader international patterns—and positions the U.S. dairy industry for a significant strategic shift.
New Zealand’s dairy industry—historically the world’s dominant dairy exporter—has hit production constraints. Environmental regulations capping nitrogen runoff have effectively frozen their national herd. Rather than competing for market share in commodity whole milk powder, they’ve pivoted toward high-value protein products.
According to a 2023 report from DCANZ and Sense Partners, protein products rose from 8.6% to 13.2% of New Zealand’s export mix between 2019 and 2023. DairyNZ reported that protein product exports increased 120% over that period, reaching $3.4 billion. That’s a deliberate strategic shift, not an accident.
Here’s what’s interesting for U.S. producers: we’re no longer just a dairy exporter—we’re increasingly becoming a protein exporter. According to the International Dairy Foods Association, U.S. dairy exports reached $8.2 billion in 2024, the second-highest level ever recorded. That’s a remarkable transformation. As IDFA noted in their February 2025 analysis, “After being a net importer of dairy products a decade ago, the United States now exports $8 billion worth of dairy products to 145 countries.”
The composition of those exports is shifting in telling ways. Brownfield Ag News reported in November 2025 that high-protein whey exports rose nine percent, led by sales to Japan. Farm Progress confirmed in July 2025 that “high-end whey exports continue to grow both in volume and value,” specifically noting that whey protein concentrates and isolates with 80% or more protein are driving the growth. According to the U.S. Dairy Export Council’s reference materials, the United States is now the largest single-country producer and exporter of whey ingredients in the world, with total whey exports reaching 564,000 metric tons in 2023—up 14% from 2019.
The industry is investing, and strong growth prospects have led to $8 billion in new processing plant investments set to increase production over the next two years. By mid-2025, nearly 20 million additional pounds of milk were flowing through new facilities, with much of that capacity focused on cheese—and the whey protein streams that come with it.
This matters for producers because U.S. dairy protein must increasingly meet global specifications. The U.S. Dairy Export Council has been working with the American Dairy Products Institute to develop industry standards for U.S. products and with the International Dairy Federation to develop worldwide technical standards. The National Milk Producers Federation prompted an investigation in 2025—through the U.S. International Trade Commission—into global competitiveness for nonfat milk solids, including milk protein concentrates and isolates.
Why does this matter at the farm level? Asian markets have evolved. China’s domestic milk production has grown, reducing the need for basic powder imports. What they’re purchasing now are specialized high-protein ingredients: lactoferrin for infant formula, protein isolates for clinical nutrition, functional ingredients for the growing urban fitness market.
With New Zealand capacity-constrained and the U.S. investing heavily in protein-processing infrastructure, there’s a genuine opportunity—but only if we’re producing what global buyers want. They’re not paying premium freight costs to import commodity milk. They want protein density that meets international quality standards. The farms supplying that milk are part of an increasingly export-oriented value chain, whether they realize it or not.
Balancing Opportunity and Risk
Any time someone presents a market opportunity, you should ask: “What if the assumptions don’t hold?”
Fair question.
What if the protein premium narrows?
It could happen. Processor capacity might expand. Consumer trends might shift. The protein-to-fat ratio could drift toward historical norms.
My thinking: even if protein premiums moderate, protein is unlikely to become less valuable than fat on a sustained basis. The fundamentals—bioavailability advantages, consumer demand for functional nutrition, processing economics—support continued protein value.
More importantly, breeding for combined solids rather than protein alone provides insurance. Bulls that improve both fat and protein percentages protect against shifts in the ratio. The market has never penalized producers for shipping high total solids. The risk is in low-component production, not in being wrong about which component the market favors most.
What if GLP-1 adoption plateaus?
Possible, but current trajectory suggests otherwise. These medications are being prescribed not just for weight loss but for diabetes management and cardiovascular protection. Insurance coverage is expanding. Pill formulations are entering the market. The user base appears to be institutionalizing rather than peaking.
But even setting GLP-1 aside, other demand drivers—aging populations seeking muscle preservation, fitness culture emphasizing protein intake, Asian markets wanting protein imports—remain intact.
Practical risk management approaches:
Use Net Merit (NM$) rather than extreme protein indexes for a balanced hedge
Maintain health and longevity trait minimums regardless of component goals
Keep some flexibility through beef-on-dairy rather than raising 100% of replacement heifers
Consider nutrition interventions (reversible) before genetic changes (permanent)
Monitor inbreeding coefficients when selecting heavily for protein traits
Practical Takeaways
Bringing this together into actionable items:
Understanding Where You Stand
Calculate the protein-to-fat price ratio from your last few milk checks
Compare your herd’s protein percentage to the Federal Order pool average (now 3.3%)
Have an explicit conversation with your milk buyer about protein premiums and thresholds
Evaluating Genetic Options
Review your current sire lineup for protein trait emphasis
Consider CM$ or updated NM$ rankings alongside traditional TPI
Set minimum thresholds for health and fertility traits before optimizing for components
Look for bulls positive in both protein percentage and protein pounds
Work with your AI rep on what makes sense for your herd
If you’re genomic testing heifers, use protein traits in your retention decisions
Monitor inbreeding levels when concentrating selection on protein traits
Near-Term Nutrition Interventions
Discuss rumen-protected methionine with your nutritionist
Consider a 21-30 day pen trial before full implementation
Track component response carefully to verify ROI on your operation
Pay particular attention to fresh cow and early lactation response
Timeline Expectations
Nutrition changes: visible results in 2-4 weeks
Genetic changes: first daughters milking in 3+ years
Spring 2026 breeding decisions will shape your 2029 bulk tank
Questions to Keep Asking
Does my processor have the infrastructure to pay for high-protein milk?
Am I positioned above or below the pool average for components?
What’s my risk tolerance for genetic strategy changes?
Am I tracking the protein-to-fat ratio, or just looking at absolute prices?
The Bottom Line
The dairy industry has navigated plenty of transitions over the decades. What makes this moment noteworthy is the convergence of forces—pharmaceutical, demographic, and economic—pointing in a consistent direction.
I’m not predicting that butterfat will become worthless or that every operation needs to overhaul its breeding program immediately. What I am suggesting is that assumptions many of us have operated under for the past decade deserve fresh examination.
The market is sending signals. Processors are paying premiums for protein that would have seemed unusual five years ago. Consumer demand is shifting in ways that favor nutrient density over volume. Global buyers are seeking protein ingredients, not commodity powder. And American dairy is increasingly positioned as a global protein exporter, not just a domestic commodity producer.
The combined opportunity is real. For a 500-cow herd that optimizes nutrition, adjusts genetic selection, and captures processor premiums—we’re talking $50,000 to $97,500 annually in additional value. That’s not theoretical. It’s math based on current market conditions and achievable improvements.
Producers who take time to understand these dynamics—and thoughtfully evaluate what they mean for their specific operations—are well positioned. Those who assume the old rules still apply may find themselves wondering why neighbors’ milk checks look different.
This isn’t about chasing trends. It’s about recognizing when fundamental market structures are shifting and responding accordingly. For some operations, that response might be modest adjustments. For others, more significant changes might make sense. Either way, understanding what’s actually happening is the essential first step.
That protein-to-fat ratio on your milk check? It’s telling you something.
Complete references and supporting documentation are available upon request by contacting the editorial team at editor@thebullvine.com.
Learn More
The $4.78 Spread: Why Protein Premiums Won’t Last Past 2027 – Gain an immediate competitive edge with a targeted 60-day action plan for capturing surging protein premiums. This breakdown delivers the exact math on amino acid balancing and arms you with a high-impact “Must-Do” list for Monday morning.
Your 0.77 Ratio Is Wrong: The $67,500 Component Fix That Can’t Wait Until 2028 – Reveal the hidden structural flaw in your bulk tank that could be costing you $67,500 annually. This strategic analysis exposes why breeding for butterfat alone is a losing bet and positions your herd for the 2028 processor requirements.
The GLP-1 Gold Rush: Why Dairy Protein is Pharma’s New Best Friend – Step inside the high-stakes worldwhere pharma meets the milk check. This deep dive into functional nutrition reveals how A2A2 and Kappa-Casein genetics are securing exclusive 15% premiums through new multi-billion dollar weight-loss support contracts.
The Sunday Read Dairy Professionals Don’t Skip.
Every week, thousands of producers, breeders, and industry insiders open Bullvine Weekly for genetics insights, market shifts, and profit strategies they won’t find anywhere else. One email. Five minutes. Smarter decisions all week.
The same genetics cost one farm $190,000/year and make another farm $57,000. The difference? Market alignment.
Here’s something I’ve been thinking about quite a bit lately. After spending time reviewing proof sheets and talking with dairy farmers from Wisconsin to California, I keep coming back to the same observation: there’s a growing gap between what the catalogs celebrate and what actually drives profitability on individual farms.
Don’t get me wrong—the numbers look impressive. Genetic progress is accelerating. Index values keep climbing. But sit down with producers who’ve been making these decisions for two or three decades, and they’ll share something the marketing materials tend to leave out: genetics that work beautifully on one operation can quietly underperform on another.
What’s interesting here isn’t that some bulls are better than others. It’s that every elite sire represents a specific vision of where dairy is headed—and whether that vision aligns with your milk market, your management approach, and your economic reality is really the question worth exploring.
The Three Gears That Must Mesh
Think of profitable breeding decisions as three interlocking gears: Genetics, Market, and Management. When these gears mesh smoothly, genetic investments translate into income over feed cost and long-term herd health. When they don’t—when you’re selecting for traits your market doesn’t reward or your management can’t support—you’re essentially paying for genetic potential you can’t capture.
As many of us have seen, that’s how you end up with cows that look great on paper but don’t quite pay their way in your specific system.
The visual is simple enough to sketch on a napkin: three gears touching. Genetics turns Market turns Management. If one gear is spinning in the wrong direction—or sized wrong for the others—you get grinding instead of progress.
Gear Misalignment Example
Midwest Freestall — Class III Cheese Plant Contract — Volume-Focused Genetics
Picture a 600-cow Midwest freestall operation shipping exclusively to a cheese plant on a Class III contract. The processor pays heavily on components—protein especially, since that’s what drives cheese yield. At current prices, protein is worth $3.01 per pound and butterfat $1.71 per pound.
The breeding program, though, has been chasing milk volume for years. High-production sires. Big milk numbers. The tank is full, but the tests are running 3.6% fat and 2.95% protein—below the current Holstein breed average of 4.15% fat and 3.36% protein, according to the Canadian Dairy Information Centre’s 2024 data.
Where money leaks out:
Lost protein premium: At 2.95% protein instead of 3.2–3.3%, this herd leaves roughly $0.75–$0.90 per cwt on the table compared to a component-focused herd at similar production levels. On 60 lbs/cow/day, that’s $140–$195 per cow per lactation in foregone protein revenue alone.
Butterfat gap: The 0.3–0.4% fat test difference adds another $95–$125 per cow per year in missed premiums.
Feed efficiency drag: High-volume, low-component cows often require more DMI per pound of milk solids produced. Using USDA’s NM$ 2025 values, moving that extra water through the system costs feed dollars without generating proportional component revenue.
Estimated annual cost for this 600-cow herd: Approximately $150,000–$190,000 in component revenue the cheese plant would have paid—if the genetics matched the market.
The cows aren’t “bad.” The bulk tank isn’t empty. But the breeding program was optimized for a fluid milk check that no longer exists. The Genetics gear is turning toward volume. The Market gear is turning toward components. They’re grinding against each other instead of working together.
Understanding What You’re Actually Buying
Looking at three sires that represent distinctly different breeding philosophies helps make this concrete.
Denovo 2776 Leeds from ABS is built on a premise that resonates with many operations right now: labor is expensive and increasingly difficult to find, so invest in genetics that reduce calving interventions. His pedigree runs through Sandy-Valley Laker back to the De-Su Frazzled 6984 cow family—the same family that gave us Gateway, Hercules, Ajax, and Skeet, according to ABS pedigree records. With essentially flat components, Leeds isn’t designed to transform your butterfat levels. His value proposition centers on strong calving-ease and a solid productive life from a family known for commercial functionality.
Denovo 6856 Hotshot takes a completely different approach. His pedigree traces through Pine-Tree Shadow to the Bomaz Perfect-P line—part of what ABS describes as “one of the premier cow families of the breed for longevity.” Hotshot isn’t positioned as a production leader. He’s built around health, livability, and keeping cows productive through the transition period and beyond.
Urzokari from Synetics represents yet another direction—explicit optimization for robotic milking systems. Emphasizing teat position, udder balance, and locomotion traits that influence whether cows visit the robot voluntarily or need fetching.
Producers are discovering that none of these bulls represents a universally optimal choice. Each makes excellent sense for some operations and may quietly cost money on others. The question isn’t which bull is “best,” but which breeding philosophy fits your particular three gears.
Where NM$ and TPI Fit—And Where They Don’t
Before we go further, it’s worth talking about how this framework relates to Net Merit and TPI, since that’s how most of us were taught to think about genetics.
The April 2025 NM$ revision—documented in detail by Paul VanRaden and colleagues at USDA’s Animal Genomics and Improvement Laboratory—now places 31.8% emphasis on butterfat, 13% on protein, and a combined 17.8% on Feed Saved, which includes body weight composite and residual feed intake. The remaining emphasis spreads across productive life, health, fertility, calving, and conformation traits.
Here’s what’s important to understand: NM$ is designed to maximize lifetime profit for an average U.S. Holstein herd selling into average market conditions. It’s a remarkably well-constructed tool for that purpose. Canadian producers working with LPI or Pro$ face similar considerations—different weightings, different assumptions, same fundamental question of whether those assumptions match your operation.
How the Major Indexes Compare
The differences between selection indexes reflect different market realities and breeding priorities:
NM$ (U.S.) places heavy emphasis on components—31.8% on butterfat alone in the 2025 revision—reflecting the cheese-heavy U.S. processing sector. Feed efficiency gets significant weight at 17.8% combined.
TPI (U.S.) weights production, type, and health traits differently, placing greater emphasis on conformation. Operations selling breeding stock or show cattle often weight TPI more heavily.
Pro$ (Canada) incorporates Canadian market conditions and pricing structures. The formula accounts for Canadian component pricing ratios, which—as we’ll see—are shifting significantly.
LPI (Canada) takes a different approach to balancing production, durability, and health traits within the Canadian context.
The point isn’t that one index is “right,” and others are wrong. It’s that each embeds assumptions about markets, management, and priorities that may or may not match your operation.
A Global Trend, Not Just a North American One
This isn’t just a North American consideration. Globally, component emphasis is intensifying—and the herds that have been selecting for it are pulling ahead.
In Ireland, milk fat content reached 4.51% and protein hit 3.58% in January 2025, according to the Central Statistics Office—both up from the prior year. New Zealand’s Fonterra bases its milk price calculations on standardized 4.2% fat and 3.4% protein, as documented in the Commerce Commission’s September 2025 review—benchmarks that reflect decades of component-focused breeding in pasture-based systems. And across the EU, butter prices hit record highs in early 2025, reaching €7,422 per metric ton in January according to CLAL data—a 36.5% increase over the same month in 2024. Industry analysts describe the fat premium as becoming “structural, not some temporary blip.”
The takeaway? Market alignment isn’t a U.S. phenomenon. It’s a global reality that’s reshaping which genetics deliver returns, regardless of where you farm.
When “Average” Doesn’t Describe Your Situation
But “average” may not describe your situation. If you’re shipping Class III milk to a cheese plant with strong component premiums, NM$ may actually underweight the traits driving your revenue. If you’re in a fluid market with minimal component pay, the 31.8% butterfat emphasis in NM$ could be steering you toward genetics that don’t match your milk check.
The framework in this article doesn’t replace NM$ or TPI—it complements them by asking: Does this index’s assumptions match my actual market, management, and constraints?
Think of NM$ as an excellent starting filter. But the final selection—especially for your top sires getting heavy use—benefits from the three-gear alignment check.
The Concentration Question Worth Understanding
Looking at this trend at the breed level, something jumps out that doesn’t get nearly enough airtime.
Multiple studies have estimated the effective population size of Holsteins—a measure of genetic diversity based on how animals are actually related—at 66-79 animals, despite millions of Holstein cows walking into parlors around the world. Geneticists generally view an effective population size below 50 as the line where long-term adaptability becomes a serious concern, so we’re not over that cliff—but we’re closer than many would guess.
Dr. Chad Dechow, Associate Professor of Dairy Cattle Genetics at Penn State University, has been writing and speaking about this for years. His work shows that genomic selection—for all its tremendous benefits in accelerating genetic improvement—has also sped up how quickly we concentrate genetics in fewer lines.
Why does this matter for your next semen order?
Because the bulls marketed as “outcrosses” today often trace back to the same handful of influential sires, once you unfold the pedigree far enough. And the economic bite of that concentration isn’t theoretical—it’s been quantified.
The Mogul Example: When Success Creates Its Own Risk
Mountfield SSI Dcy Mogul—the youngest Holstein sire to exceed one million units sold. His daughters delivered. His influence now appears throughout the breed’s pedigree, making genuine outcrosses increasingly difficult to find.
Mountfield SSI Dcy Mogul is one of the most influential Holstein sires in breed history. Select Sires announced in September 2017 that he’d exceeded 1 million units sold at just seven years of age, making him the youngest bull to reach that milestone. His impact as a foundation sire for subsequent generations has been enormous.
That success wasn’t accidental. Mogul daughters delivered. But the sheer scale of his use means his genetics now appear in a substantial percentage of the breed’s pedigrees—often multiple times per animal when you trace back six or seven generations.
The concern isn’t that Mogul was a poor bull. He wasn’t. The concern is that when any sire achieves that level of market penetration, finding genuinely unrelated genetics becomes progressively harder. Research by Doublet and colleagues, published in 2019, documented annual inbreeding rates rising to 0.55% per year in the genomic era—roughly double the rate considered sustainable in the long term.
For individual herds, this means that selecting a “new” high-ranking bull may actually be deepening your connection to Mogul, O-Man, Planet, or Supersire rather than diversifying away from them. Checking kinship data isn’t paranoia—it’s due diligence.
What Inbreeding Actually Costs
Italian research from Ablondi and colleagues, published in the Journal of Animal Science in 2023, found that a 1% increase in genomic inbreeding—specifically measured via runs of homozygosity (FROH), which captures actual stretches of identical DNA—is associated with about 134 pounds (61 kg) less milk over a 305-day lactation, along with lower fat and protein yields.
German work from Mugambe and colleagues in the Journal of Dairy Science in 2024 found similar patterns:
32–41 kg less milk per 1% increase
1.4–1.7 kg less fat
1.1–1.3 kg less protein
Calving intervals stretched by roughly a quarter-day per 1% increase
I recently talked with a Wisconsin producer milking about 400 cows who’s been tracking inbreeding and performance for a decade. His take was pretty straightforward: “The daughters are producing more milk than their dams, so the genetic progress is real. But conception rates and feet-and-leg issues have gotten harder to manage. I’m not sure the net gain is as large as the proof sheets suggest.”
The Component Premium Question
The shift toward component-focused genetics has really picked up speed in recent years, especially with the 2025 NM$ revision, which placed 31.8% emphasis on butterfat alone. On paper, that makes a lot of sense given recent price trends. In practice, it depends heavily on where your milk check comes from.
The November 2025 USDA Agricultural Marketing Service announcement showed protein at $3.0143 per pound and butterfat at $1.7061 per pound—a very different picture from a year earlier, when butterfat was over $3.00 a pound. Class III settled at $17.18 per hundredweight. Those relationships move, sometimes dramatically.
Processor Contracts Are Tightening
And processor expectations are tightening—that’s something worth paying attention to. Western Canadian provinces—British Columbia, Alberta, Saskatchewan, and Manitoba—announced through the BC Milk Marketing Board a major component pricing ratio shift effective April 1, 2026, moving from 85% butterfat / 10% protein / 5% other solids to 70% butterfat / 25% protein / 5% other solids. That’s a significant rebalancing toward protein that will reward herds already selecting for it and penalize those who aren’t.
In the U.S., the story is similar. New processing capacity often comes with stricter contract requirements. Today’s direct contracts increasingly expect consistent volume, protein tests above 3.2%, and premium somatic cell counts. If your genetics have been drifting away from protein while you’ve been chasing other traits, the next contract renewal window may deliver an unwelcome surprise.
Quick Math Check: What’s Your Component Revenue Share?
Pull your last six milk checks. Add up the component premiums (fat + protein payments above base). Divide by total milk revenue.
Above 25%: Component genetics is likely paying well for you. The 2025 NM$ emphasis on butterfat aligns with your market.
15–25%: Mixed picture. Component genetics help, but don’t over-rotate away from production.
Below 15%: You may be over-investing in component genetics. Consider whether volume-focused or balanced sires deliver better returns in your specific market.
This 5-minute exercise can save thousands in misaligned genetic decisions.
Red Flag Checklist: 5 Warning Signs Your Genetics Don’t Match Your Market
Your fat or protein test has dropped 0.2%+ over 3 years while selecting high-NM$ bulls. NM$ emphasizes components, so if your tests are declining despite following index rankings, something in your selection isn’t translating to your tank.
Your component revenue share (from the Quick Math Check) is under 20%, but you’re heavily using component-focused sires. You may be paying for genetic potential your market doesn’t reward.
You can’t find a prospective sire with less than 8% relationship to your herd. Genetic concentration has narrowed your options more than you realize—time to seek outcross genetics actively.
Your processor has mentioned tightening component thresholds or premium structures in recent communications. With Western Canadian provinces shifting to 70/25/5 (fat/protein/other) pricing in April 2026 and U.S. processors increasingly requiring 3.2%+ protein for premium contracts, genetic decisions made today need to anticipate tomorrow’s standards.
You’re using beef genetics on more than 40% of your herd but haven’t genomic-tested to identify your true top-tier replacements. With dairy heifer inventories at 20-year lows—2.5 million head as of January 2025, according to HighGround Dairy—the cows you keep replacements from matter more than ever.
If you checked two or more: Your three gears may be grinding. Consider a formal review of your breeding program’s alignment with your current market before your next semen order.
The Feed Efficiency Factor
There’s another dimension to this calculation that’s getting more attention in 2025: feed efficiency. The April 2025 NM$ revision now includes 17.8% combined emphasis on Feed Saved, which incorporates both body weight composite and residual feed intake—a significant increase from previous versions.
Here’s what the research tells us: residual feed intake has moderate heritability, typically estimated between 0.15-0.25 in Holstein populations, making it a meaningful selection target over time. And USDA research used in the NM$ calculations shows that feed costs average about 58% of milk income, broken down into 39% for production costs and 19% for maintenance. That’s not “a big part” of the budget; it’s often the biggest lever you have.
Detailed Per-Cow, Per-Lactation Example
Let’s put real numbers to a side-by-side comparison using November 2025 Class III prices and the economic values from the 2025 NM$ revision.
Scenario: Two cows in the same 500-cow Midwest Class III herd
Factor
Cow A (Volume-Focused)
Cow B (Component-Aligned)
Daily milk
62 lbs
56 lbs
Fat test
3.7%
4.2%
Protein test
3.0%
3.3%
305-day milk
18,910 lbs
17,080 lbs
305-day fat
700 lbs
717 lbs
305-day protein
567 lbs
564 lbs
Revenue calculation (Class III component pricing):
Cow A: Fat (700 × $1.71) + Protein (567 × $3.01) + Other solids ≈ $2,904
Cow B: Fat (717 × $1.71) + Protein (564 × $3.01) + Other solids ≈ $2,927
Component advantage for Cow B: ~$23/lactation
Feed cost calculation (using USDA’s NM$ 2025 values of $0.13/lb DMI and requirements of 0.10 lbs DMI per pound of milk, 8.0 lbs per pound of fat, and 6.5 lbs per pound of protein):
Feed cost difference: 375 lbs × $0.13 = $49/lactation advantage for Cow B
If Cow B also has 3% better residual feed intake (genetic feed efficiency): Additional savings: ~325 lbs DMI × $0.13 = $42/lactation
Total advantage for component-aligned Cow B in Class III market: $23 (components) + $49 (baseline feed) + $42 (RFI) = ~$114/lactation
Over a 500-cow herd: That’s roughly $57,000/year in additional margin from aligned genetics—not from buying “better” bulls, but from buying bulls that fit the operation’s market and management.
In a fluid market with minimal component premiums, this math reverses. Cow A’s extra 1,830 lbs of milk volume generates more revenue, and the feed efficiency advantage shrinks because you’re not capturing the component value. The same genetics, completely different financial outcome.
What Specialization Actually Costs
Every specialized sire carries trade-offs embedded in his genetic package. The proof sheet highlights the specialization; it doesn’t spell out what you’re giving up.
Leeds’ calving-ease strength comes from specific physical characteristics—smaller, finer skeletal structure, lower birth weight calves, and reduced pelvic dimensions. For operations genuinely struggling with calving difficulty—assisted births over 18–20%—the trade-off often pencils out. For herds where calving assistance is already well-managed, the structural compromise might cost more than the calving-ease saves.
Hotshot’s emphasis on longevity reveals a different dynamic. His moderate milk proof looks more like a genetic ceiling than a starting point. When bred heifers bring $4,000 or more at auction, and raising costs run around $1,700–$2,400 per head, keeping cows in the herd for more lactations makes sense on paper. But if those cows are giving 6–8 lbs/day less than alternatives, whether longevity genetics pay off depends on your culling rate, replacement strategy, and feed costs.
A Northeast grazing operation I spent time with last spring leaned into longevity-focused genetics five years earlier and were genuinely happy with the outcome. “The per-cow production dropped some,” the producer told me, “but with lower replacement costs and better cow health, we’re actually keeping more of what we make.”
Sire Type
Intended Benefit
Hidden Trade-Off
Best Fit
Expensive Misfit
Calving-Ease (e.g., Leeds)
Lower assisted births, reduced labor during calving, fewer injury losses
Smaller frame, reduced mature size, often comes with 6-8 lbs/day lower lifetime production
First-calf heifers; herds with assisted calvings >18%; operations with limited labor for calving supervision
Well-managed herds with <10% assisted births; operations where replacement heifers cost $4,000+ and production matters more than calving ease
Longevity-Focused (e.g., Hotshot)
Extended productive life, lower replacement costs, better transition cow health
Moderate milk proofs often represent genetic ceiling, not starting point; slower genetic progress on production traits
High replacement costs ($2,200+ per heifer); grazing operations; herds targeting 3.5+ lactations; limited heifer inventory
Operations with strong cull cow markets; herds breeding beef-on-dairy on bottom 40%; processors paying volume bonuses; low feed costs favoring higher production
Robotic-Optimized (e.g., Urzokari)
Improved voluntary robot visits, better teat positioning, reduced fetch time
Emphasis on udder/teat traits may sacrifice component genetics or production potential; value only captured if robots utilized efficiently
Robotic dairies; operations struggling with fetch rates >15%; herds prioritizing labor efficiency over per-cow production
Conventional parlor operations; herds with no robot plans; component-paying markets where udder traits matter less than tests
When Realignment Pays Off: A Recovery Story
What happens when a producer recognizes the mismatch and corrects course? I talked with a 550-cow operation in central Minnesota that went through exactly that process.
“We’d been chasing TPI for about eight years,” the herd manager explained. “Good bulls, good genomics, no complaints about the genetics themselves. But we were shipping to a cheese plant, and our protein test just kept sliding—went from 3.25% down to 3.05% over that stretch. Meanwhile, the premiums for protein kept going up.”
When they ran the numbers in 2022, they realized they were leaving close to $180 per cow in component revenue on the table annually. “That’s when it clicked. We weren’t using bad genetics. We were using the wrong genetics for our market.”
They shifted their sire selection criteria—still using high-ranking bulls, but filtering hard for positive protein deviation and component balance. Three years later, their protein test is back to 3.22% and climbing.
“The genetic progress feels slower on paper,” he admitted. “But the milk check is bigger. That’s the number that actually matters.”
Regional Considerations
Where you farm changes these calculations more than most proof sheets acknowledge.
In the Southeast and Southwest, producers dealing with persistent heat stress often find that moderate production with stronger health and fertility traits out-earns elite production genetics that struggle through extended summers. In the Upper Midwest and Northeast, grazing-heavy systems face different realities—a cow built for a California dry lot isn’t always the cow you want walking hillsides in Vermont.
The Beef-on-Dairy Connection
The three-gear framework applies to more than just which dairy sires you’re using—it also shapes your beef-on-dairy strategy.
The 2024 NAAB semen sales report shows 7.9 million beef semen units flowing into U.S. dairy operations, representing over 80% of all beef semen sales. Meanwhile, dairy heifer inventories expected to calve dropped to 2.5 million head as of January 2025—the lowest level since USDA began tracking this data, according to HighGround Dairy analysis. CoBank research projects 357,490 fewer dairy heifers for 2025 compared to the prior year, driven largely by beef-on-dairy breeding decisions.
Here’s where the gears mesh—or grind: If you’re using beef genetics on your bottom-tier cows, you’ve already made a three-gear decision. You’re saying those animals don’t fit your Genetics goals (not worth keeping daughters from), don’t justify the Management investment of raising replacements, and the Market for beef calves currently rewards that choice.
But the framework cuts both ways. With heifer supplies this tight, the cows you do keep replacements from matter more than ever. Beef Magazine’s November 2025 report notes that beef-on-dairy cattle now represent 12–15% of all fed slaughter—the crossbreds have become an indispensable part of the beef supply chain. That’s fine, as long as your top-end genetics are truly aligned with your dairy operation’s market and management. Using beef on low-merit cows makes sense; accidentally breeding beef on cows that should be producing your next generation of high-component replacements is a costly mistake that compounds over time.
Finding Genuine Genetic Diversity
While genetic gains have more than doubled in the genomic era, breeding for diversity inside Holsteins now takes real effort.
For Purebred Holstein Operations
Seek out niche Holstein lines. Legacy maternal lines like Hanover-Hill, Landmark, Meteor, Durham, or Elegant, which were prominent 20–30 years ago but don’t dominate today’s rankings, can bring different genetics to the table.
Request genomic kinship data. Most major AI companies can show you how closely a prospective sire is related to your herd’s core cow families. CDCB offers inbreeding tools as well. For operations that haven’t genomic-tested their cows yet, current testing runs around $40–50 per head—a worthwhile investment if you’re serious about managing inbreeding across your herd.
Unfold pedigrees further back. Many so-called outcross sires look different in the first three generations, then converge on Mogul, O-Man, Planet, or Supersire once you get back to generation six or eight.
Consider the National Animal Germplasm Program. USDA’s germplasm program maintains semen and embryos from older, less-represented lines to preserve genetic diversity for long-term breed health.
“I’ve stopped looking at the top 10 TPI list entirely. If a bull doesn’t have positive deviation for protein and decent feet-and-legs, he doesn’t enter my tank, regardless of his rank. The proof sheets tell you what a bull can do genetically. They don’t tell you whether those genetics fit your parlor, your market, or your management. That’s the part you have to figure out yourself.”
— Wisconsin producer, 650-cow operation
A Framework for Matching Genetics to Your Operation
Five Questions Before You Pick a Bull
1. What’s my actual milk market? How much of your check comes from components versus volume?
2. What’s my primary constraint? Is involuntary culling above 25%? Are assisted calvings over 18%? Is production lagging?
3. Does this sire truly address that constraint? If calving isn’t a major issue, calving-ease sires might just be giving away production.
4. How closely is this bull related to my herd? Check genomic kinship or pedigree overlap.
5. What does the five-year math look like? Account for production, components, feed costs, replacements, and health.
The Larger Perspective
When you put all of this together, what’s interesting is how much breeding has shifted from “Which bull is best?” to “Which bull best fits what I’m actually trying to do here?”
The Holsteins that maximize returns on a 3,000-cow California dry lot shipping Class III milk are not the same Holsteins that fit a 200-cow Wisconsin grazing herd shipping mostly fluid milk. Both operations might reasonably use bulls like Leeds or Hotshot—but in very different proportions, for very different reasons, and with very different expectations.
Three Actions Before Your Next Semen Order
Calculate your component revenue percentage from your last six milk checks. If it’s under 15%, reconsider heavy use of component-focused sires.
Request kinship reports on your top 5 prospective sires from your AI representative. Flag any showing an elevated relationship to your existing cow families or heavy Mogul/O-Man/Planet ancestry.
Identify one genuine outcross sire from an underrepresented maternal line for 5–10% of your matings—not to chase diversity for its own sake, but to maintain options as the breed continues to concentrate.
The tools to make smarter, more aligned decisions exist—genomic kinship, feed efficiency data, inbreeding metrics, and diverse sire options. The challenge, and the opportunity, is taking the time to line those tools up with the reality of your own farm.
The Bottom Line
What’s been your experience with specialized genetics? Have calving-ease, longevity-focused, or component-heavy sires delivered the returns their proofs suggested under your conditions? The most useful lessons often come from comparing what the proofs promised with what actually showed up in the bulk tank and the balance sheet.
Key Takeaways
Fit beats rank. The same genetics can cost one farm $190,000/year and add $57,000 to another—the difference is market alignment, not genetic quality.
Misalignment drains profit quietly. Volume genetics in a cheese market can leave $150,000–$190,000 annually on the table, even when production looks strong.
NM$ is designed for the average herd. The 2025 revision puts 31.8% emphasis on butterfat. If your market doesn’t reward components, you’re paying for genetic potential you can’t capture.
Inbreeding costs compound. Each 1% increase means ~134 lbs less milk plus weaker fertility—and at 0.55% annually, the breed is accumulating it faster than ever.
Before your next semen order: Calculate your component revenue share (5 minutes), request kinship data on prospective sires, and reserve 5–10% of matings for genuine outcrosses.
EXECUTIVE SUMMARY:
The same genetics can cost one operation $190,000 a year and add $57,000 to another. The difference isn’t genetic quality—it’s market alignment. This article introduces a three-gear framework (Genetics, Market, Management) that helps producers evaluate whether their breeding program actually fits their milk check. Drawing on USDA’s April 2025 NM$ revision and peer-reviewed research, it demonstrates how misaligned genetics can quietly drain profitability even when production looks strong. Practical tools include a 5-minute component revenue analysis, five questions to ask before selecting any sire, and strategies for finding genuine diversity as the breed concentrates. The goal isn’t finding “better” bulls—it’s finding bulls that fit your operation.
Complete references and supporting documentation are available upon request by contacting the editorial team at editor@thebullvine.com.
Every week, thousands of producers, breeders, and industry insiders open Bullvine Weekly for genetics insights, market shifts, and profit strategies they won’t find anywhere else. One email. Five minutes. Smarter decisions all week.
How Net Merit changes, fairlife’s $7.4 billion success, and the premium pivot are reshaping what your genetics are worth.
Executive Summary: For the first time since 2009, fluid milk sales grew in 2024—up 0.8%, ending a 14-year decline. The turnaround didn’t come from better marketing of commodity milk; it came from building what consumers actually wanted: lactose-free, high-protein, premium products that command real price premiums. fairlife proved the model works spectacularly, generating $7.4 billion in total value for Coca-Cola and reshaping the value of dairy genetics. The April 2025 Net Merit revision tells the story: butterfat emphasis jumps to 31.8% while protein drops to 13.0%—volume-only genetics are losing economic ground. But here’s the hard truth: 40% of U.S. dairy farms exited between 2017 and 2022, and premium market access isn’t equally distributed. The strategic question for every producer is no longer whether this shift is real—it clearly is—but whether your operation’s genetics, scale, and processor relationships position you to capture value from it.
After decades of falling fluid milk sales, the industry posted growth in 2024 for the first time since 2009. The story behind that turnaround holds lessons for every farmer making decisions today.
By the Numbers: Dairy’s Turnaround at a Glance
Metric
Then
Now
Per capita fluid milk consumption
247 lbs (1975)
141 lbs (2020)
2024 fluid milk sales vs. 2023
14-year decline
+0.8% growth
U.S. dairy farms
39,303 (2017)
24,082 (2022)
Milk from farms with 1,000+ cows
60% (2017)
68% (2022)
Holstein butterfat average
3.9% (2019)
4.23% (2024)
fairlife annual retail sales
$90M (2015)
$1B+ (2022)
Net Merit protein emphasis
19.6% (2021)
13.0% (April 2025)
Net Merit butterfat emphasis
28.6% (2021)
31.8% (April 2025)
Here’s something that caught a lot of people off guard last year. Fluid milk sales actually grew in 2024—not just stabilized, but genuinely increased. USDA data show total U.S. fluid milk sales were up about 0.8% from 2023, ending a 14-year streak of annual declines. The National Milk Producers Federation called it the first year-over-year gain since 2009.
That’s worth sitting with for a moment.
What’s interesting here isn’t just the number itself. It’s what had to happen to get there. This wasn’t a lucky break or some temporary consumer fad. The growth came after roughly a decade of strategic decisions that ran counter to almost everything the dairy industry had believed about competition and survival.
I’ve been watching this unfold for years now. The more you dig into what actually changed, the more you realize there’s a playbook here that matters to producers navigating what comes next.
Understanding How Deep the Decline Really Was
To make sense of the comeback, you need to understand how challenging things had gotten. Not just the headlines—the structural shift that was reshaping the entire category.
Between 1975 and 2020, per capita fluid milk consumption in the United States dropped by nearly 43%, according to Federal Milk Market Administrator data. We went from around 247 pounds annually down to about 141 pounds per person. Penn State Extension’s dairy trends research shows similar figures—they tracked a decline from 247 pounds in 1975 to 134 pounds by 2021. That’s not a temporary dip. That’s a generational shift away from a product that used to be on every breakfast table in America.
The reasons were accumulating, as many of us observed firsthand. Beverage options multiplied—sports drinks, bottled water, energy drinks, and the expanding coffee culture. Plant-based alternatives began to claim serious shelf space in the mid-2010s. Younger consumers, especially, seemed to be reconsidering whether dairy belonged in their daily routine.
And the financial pressure kept building. Class III prices dropped below $14 per hundredweight multiple times during 2018 and 2019. The Class III average for 2018 was just $14.61, the lowest in years. If you were shipping milk during those months, you remember.
Then came Dean Foods. The largest fluid milk processor in the country filed for Chapter 11 bankruptcy on November 12, 2019, in the Southern District of Texas—USDA’s Agricultural Marketing Service confirmed the filing date in subsequent proceedings. When a company of that size goes down, it sends a signal about industry direction. Or at least, that’s what everyone assumed at the time.
The Strategic Pivot: Asking a Different Question
The turning point, looking back, came when industry leadership started asking a fundamentally different question.
Instead of “How do we convince people to drink more regular milk?”—which promotion campaigns had been attempting for years—they asked: “What do modern consumers actually want that dairy could provide better than alternatives?”
Why does that distinction matter? Because it shifts the entire strategic framework.
Dairy Management Inc., the organization that manages the national dairy checkoff, commissioned extensive consumer research starting around 2014-2015. According to DMI’s published partnership reports, what they found reshaped the entire strategic approach.
Here’s what the research revealed: consumers weren’t rejecting dairy’s core benefits—protein, nutrition, taste. They were rejecting the format and the limitations. The National Institutes of Health estimates that somewhere between 30 and 50 million American adults are lactose intolerant—MedlinePlus and federal health resources have consistently cited this range. Many of those people wanted dairy’s nutritional benefits but couldn’t tolerate conventional milk. Others wanted higher protein for fitness goals, lower sugar for health reasons, or longer shelf life for convenience.
This consumer insight work became the foundation for everything that followed. DMI announced more than $500 million in fluid milk partnerships with seven major companies—Dairy Herd and other industry publications covered the announcement extensively. What’s particularly noteworthy is the leverage structure: most of that investment came from partners putting money into processing plants and infrastructure, while the checkoff’s direct commitment was about $30 million. That ratio—partners investing roughly $15 for every checkoff dollar—represents a fundamental strategic pivot from defending commodity milk to building new categories where dairy had natural advantages.
The fairlife Case Study
No single product illustrates the transformation better than fairlife, which has become Coca-Cola’s fastest-growing brand acquisition. The timeline is worth examining because it shows what patient long-term investment actually looks like in practice.
fairlife launched as a joint venture in 2012 between Select Milk Producers—a Texas-based dairy cooperative with just 99 member farms, as confirmed by multiple industry sources, including the Texas Agricultural Council and the University of Guelph—and Coca-Cola, which took an initial 42.5% ownership stake. The product uses ultrafiltration technology (not new technology exactly, but newly commercialized at scale) to concentrate protein, remove lactose, and reduce sugar while maintaining dairy’s nutritional profile.
National rollout came in late 2014, after test markets in Denver showed something remarkable. Coca-Cola’s Mike Saint John, speaking to industry groups, noted that the Denver test showed fairlife driving a 4% increase in fluid milk sales—not just capturing share from other brands, but actually growing the category. That distinction matters considerably when you’re trying to reverse a multi-decade decline.
The growth trajectory tells the story. By the mid-2010s, fairlife had reached about $90 million in annual sales. Industry estimates put 2019 sales at around $500 million. In January 2020, Coca-Cola acquired the remaining 57.5% stake for $979 million, according to SEC filings.
Here’s where the economics get striking. fairlife surpassed $1 billion in annual retail sales by 2021-2022, as Dairy Reporter and Coca-Cola’s earnings communications confirmed. The company’s SEC filings now show that total payments for fairlife—including the original acquisition plus performance-based earnouts—have reached approximately $7.4 billion. That earnout structure meant Coca-Cola paid more because fairlife exceeded financial targets.
Year
Retail sales (USD billions)
Cumulative value/investment (USD billions)
2015
0.09
0.50
2019
0.50
1.50
2022
1.00
5.00
2024
1.20
7.40
Today, fairlife sells at a clear premium to conventional milk in most retailers. High Ground Dairy’s analysis highlights these strong price premiums, while USDA retail price tracking shows conventional milk averaging about $4.39 per gallon in 2024. Consumers are paying meaningful premiums for a product delivering 50% more protein, 50% less sugar, no lactose, and a longer shelf life.
But Can Other Cooperatives Replicate This?
Here’s the question many producers are asking: Is the fairlife playbook actually replicable, or do you need Coca-Cola’s balance sheet to make it work?
The honest answer is complicated.
fairlife didn’t just have good milk—it had a partner with essentially unlimited capital, global distribution networks, and decades of beverage marketing expertise. Select Milk Producers brought the supply chain and dairy knowledge; Coca-Cola brought everything else. That’s not a model most regional cooperatives can simply copy.
fairlife’s own FAQ clarifies the supply structure: “As a milk processor, fairlife does not own farms or cows. We partner with dairy co-ops in geographies where we have plant locations to source milk.” All supplying farms must meet fairlife’s specific animal care requirements and maintain both FARM and Validus third-party certifications. That creates a meaningful barrier for farms not already connected to fairlife’s supply network.
Consider this: Select Milk Producers has just 99 member farms. That’s a deliberately small, carefully managed supplier base—not an open door for any operation wanting premium market access. And when Organic Valley, the largest organic dairy cooperative in the country, added new farms in 2023, they brought on just 84 operations, according to Dairy Herd reporting. Premium market access is growing, but it’s not unlimited.
For mid-sized cooperatives exploring this space, the entry barriers are substantial: processing infrastructure for ultrafiltration runs into the tens of millions; third-party certification programs require ongoing investment; and finding a retail or foodservice partner willing to commit long-term distribution adds another layer of complexity.
That said, some regional cooperatives are finding their own paths. Cobblestone Milk Cooperative in Virginia built its model around exceptionally high-quality standards—bacteria and somatic cell counts far below industry norms, as Dairy Herd has documented—creating differentiation without the use of ultrafiltration technology. The approach requires different capabilities than the fairlife model, but it shows there’s more than one route to premium positioning.
The key insight: fairlife’s success proves the premium fluid milk market exists and can grow. Replicating it requires either a massive corporate partnership or finding alternative differentiation strategies appropriate to your cooperative’s scale and capabilities.
The Genetics Angle: Why “Volume-Only” Selection Is Losing Ground
For Bullvine readers, here’s where the story gets especially relevant. The shift toward premium, composition-focused products isn’t just changing processor strategies—it’s fundamentally reshaping what genetics are worth money.
The April 2025 Net Merit revision from CDCB clearly tells the story. According to the official USDA-AGIL research document “Net merit as a measure of lifetime profit: 2025 revision,” the updated NM$ formula shifts emphasis significantly:
Trait
2021 NM$ Weight
April 2025 NM$ Weight
Direction
Protein
19.6%
13.0%
↓ Decreased
Fat
28.6%
31.8%
↑ Increased
Feed Saved
12.0%
17.8%
↑ Increased
Productive Life
11.0%
8.0%
↓ Decreased
Why the shift? Dr. Paul VanRaden, Research Geneticist at USDA and lead author of the Net Merit revision, describes NM$ 2025 as “a strategic response to the evolving dairy industry,” integrating recent economic data and market signals. Butterfat emphasis increased because consumer demand for butter and high-fat dairy products has strengthened. Protein emphasis decreased partly because the cheese market has matured, and premium fluid products like fairlife actually remove some protein during ultrafiltration.
The real-world expression of these genetic shifts is already visible. Corey Geiger with CoBank told Brownfield Ag News that Holstein butterfat levels reached a record 4.23% in 2024, while protein levels were 3.29%. The April 2025 genetic base change reflects this: Holsteins saw a 45-pound rollback on butterfat—that’s 87.5% higher than the 24-pound adjustment in 2020, and the largest base change in the breed’s genetic history. Protein rolled back 30 pounds.
Geiger’s projection is striking: he told Brownfield he believes butterfat levels “could pass five percent in the next decade” based on current consumer demand and genetic momentum.
What this means practically: bulls selected purely for milk volume without strong component percentages are becoming less valuable relative to high-component, high-health-trait sires. TPI formula adjustments reflect similar trends—Holstein Association USA has been increasing emphasis on fat and protein pounds while rebalancing type traits.
For breeding decisions today, the implications are clear:
Component percentages matter more than ever. A sire with +0.10% Protein and +0.35% Fat commands attention in ways volume-only genetics don’t.
Feed efficiency is gaining weight. The Feed Saved emphasis increase from 12% to 17.8% in NM$ reflects tighter margins and environmental pressure.
Health and longevity traits remain important but are being rebalanced against productivity gains.
The premium pivot isn’t just about finding a processor who’ll pay more for your milk. It’s about recognizing that the entire genetic selection framework is shifting toward what those premium products require.
The Two-Tiered Reality: Who Actually Benefits?
This brings us to what might be the most uncomfortable part of the story. The premium pivot and genetic evolution I’ve been describing don’t affect all operations equally. In fact, there’s a reasonable argument that these trends are accelerating the exit of smaller producers who can’t afford the entry costs.
The numbers are sobering. The 2022 USDA Census of Agriculture found just 24,082 U.S. dairy farms—down from 39,303 in 2017. That’s nearly a 40% decline in five years, as Brownfield Ag News and Dairy Reporter both reported. Lucas Fuess, senior dairy analyst at Rabobank, points out that 68% of U.S. milk now comes from farms with 1,000 or more cows—operations that represent only 8% of total farms.
Category
2017
2022
Number of U.S. dairy farms
39,303
24,082
Share of milk from farms with 1,000+ cows
60%
68%
Estimated share of farms with 1,000+ cows
6%
8%
Cost advantage of >2,000-cow farms vs. 100–199
$8/cwt cheaper
$10/cwt cheaper
The cost dynamics are stark. USDA data show farms milking more than 2,000 cows can operate roughly $10 per hundredweight cheaper than farms with 100-199 cows. That’s not a small gap—it’s the difference between profitability and struggling to break even.
Meanwhile, the 50-99 cow category—traditionally the heart of family dairy—has seen dramatic declines according to USDA census data, with the segment nearly halving between 2017 and 2022. Dr. Frank Mitloehner at UC Davis has noted that one of the main reasons smaller dairy farms are disappearing is “ever-tightening profit margins,”—and larger farms’ cost advantages enable them to “achieve much higher net returns,” as Dairy Global reported.
Peter Vitaliano, economist for the National Milk Producers Federation, told Brownfield that 2023 saw nearly 6% of licensed dairy farms exit, and he expected “an even higher rate of dairy farm closures” in 2024. Industry analysts project that this consolidation trend will continue, with production increasingly concentrated on the largest operations.
So when we talk about genomic testing at $25-50 per head, third-party certification programs, and processor relationships that require data transparency and infrastructure investment—who can actually afford that?
For a 2,000-cow California operation, genomic testing the replacement heifer crop might run $50,000-100,000 annually—a meaningful but manageable investment against a multi-million dollar revenue base. The same testing for a 150-cow Vermont farm costs $3,750-7,500—proportionally similar, but coming out of a much tighter margin with far less negotiating leverage on the premium side.
The infrastructure requirements for premium programs add another layer. FARM certification, video monitoring at handling points, sustainability documentation, and unannounced audit preparation—these require administrative capacity that larger operations can absorb more easily than smaller ones running lean.
Does “Collaborative Competition” Help the Small Producer?
The DMI partnership model—where checkoff dollars leverage private investment—has clearly grown the premium category. But does that growth help the 150-cow operation, or does it primarily benefit the large farms and cooperatives already positioned to capture that value?
The evidence is mixed.
On one hand, composition-based pricing tiers are expanding across cooperatives of various sizes. FarmFirst, Foremost Farms, and DFA all have programs that, in theory, reward any member farm that ships high-component milk. Genetic improvement is available to everyone who chooses to pursue it.
On the other hand, premium market access often requires scale. fairlife’s supplier base is deliberately limited to 99 member farms in Select Milk Producers. Organic Valley added just 84 farms in 2023 despite significant producer interest. The infrastructure investments driving premium product growth—like fairlife’s $650 million Webster, New York facility—create jobs and markets, but they don’t automatically open doors for every nearby farm.
The most honest assessment: the premium pivot has created new opportunities, but those opportunities aren’t equally accessible. Farms with existing cooperative relationships, geographic proximity to premium processors, capital for certification and genetic investment, and administrative capacity for compliance requirements are better positioned than those without. The “collaborative competition” model has grown the pie, but the slices aren’t being distributed equally.
For smaller operations, the strategic question becomes: what premium pathways are actually accessible given your scale, location, and cooperative membership? Direct-to-consumer sales, farmstead processing, local food networks, and quality-differentiated regional cooperatives like Cobblestone may offer more realistic paths than trying to break into fairlife’s supply chain.
Navigating the Fair Oaks Crisis
Every turnaround has a moment where the whole thing nearly falls apart. For dairy’s innovation strategy, that moment came in June 2019.
The Animal Recovery Mission, an animal welfare organization, released undercover footage from Fair Oaks Farms—one of fairlife’s primary milk suppliers in Indiana. The footage showed systematic mistreatment of calves, and Dairy Reporter, along with other trade publications, covered the story extensively.
The response from retailers was immediate. Industry reporting confirmed that major chains, including Jewel-Osco, Tony’s Fresh Market, and several others, pulled fairlife from shelves within days. Consumer boycotts gained momentum. Class action lawsuits were filed alleging deceptive marketing around animal welfare claims.
What happened next offers lessons for crisis management across the industry.
Rather than minimize the situation or deflect blame, fairlife and Coca-Cola chose transparency. They immediately suspended all milk deliveries from Fair Oaks Farms. Dairy Reporter confirmed they increased unannounced audits at supplier farms from once annually to 24 times per year—a dramatic escalation in oversight. They installed video monitoring systems at animal handling points and commissioned independent investigations of all supplying farms.
fairlife’s 2024 Animal Stewardship Report, as covered by Food Dive, notes the company has invested, along with its suppliers, nearly $30 million in its animal welfare program since the crisis. The company eventually paid $21 million to settle related litigation—Food Dive called it one of the largest settlements ever in an animal welfare labeling case.
It was expensive. It was risky—admitting failure often accelerates brand damage in the short term. But the approach preserved something more valuable: trust in the brand and in the category. By 2020-2021, fairlife had returned to most retail shelves. By 2022, it reached $1 billion in sales.
Practical Implications for Producers
So that’s the industry-level narrative. But what does it mean for someone actually running a dairy operation? That’s the question that matters most.
The shift affecting producers most directly is the changing economics around milk composition. The traditional model rewarded volume—more pounds shipped meant more revenue. The emerging model increasingly rewards components and quality characteristics that premium products require.
I’ve talked with several Upper Midwest producers who are seeing this play out in real time. Farms focusing on protein percentage and butterfat rather than volume alone are reporting meaningful improvements in their milk checks—even when shipping slightly less total volume. It requires a different way of thinking about what you’re actually producing.
Here’s the practical reality. Current Class III prices have been running in the mid-to-upper teens per hundredweight according to USDA milk pricing data, with month-to-month variation. Farms meeting premium composition targets through preferred supplier programs can access additional premiums, though specific rates vary considerably by processor and region.
Metric
Herd A – Volume Focus
Herd B – Premium Components
Avg. milk shipped/cow/day
90 lb
82 lb
Butterfat / Protein test
3.7% F / 3.05% P
4.2% F / 3.25% P
Base milk price
$18.00/cwt
$18.00/cwt
Component & quality premiums
$0.40/cwt
$1.30/cwt
Net mailbox price
$18.40/cwt
$19.30/cwt
Regional dynamics matter here. Upper Midwest cooperatives like FarmFirst and Foremost Farms have been building out composition-based pricing tiers, according to their published producer communications. California’s larger operations often negotiate directly with processors. Southeastern producers working through DFA have seen new preferred supplier programs emerge over the past couple of years. Pacific Northwest operations shipping to Darigold have their own regional dynamics. The opportunity exists, but access varies.
What many producers are discovering is that capturing these premiums requires intentional decisions rather than hoping the bulk tank tests well:
Genomic testing is typically the starting point. Testing replacement heifers for protein traits, A2 beta-casein status, and kappa-casein genotype generally runs in the $25-50 range per animal through commercial services, though prices vary by service level and volume. University extension dairy genetics research confirms these trait associations translate to real composition differences in the bulk tank over time. For a 100-heifer crop, you’re looking at a few thousand dollars—an investment that can return value within the first year of improved milk checks if you’re making culling and breeding decisions based on the results.
Sire selection follows from testing—and this is where the Net Merit shifts become directly actionable. Bulls ranking high on protein percentage, fat percentage, A2A2 genetics, and kappa-casein BB genotypes are increasingly valuable. A2A2 milk commands premiums in some markets because consumers perceive it as easier to digest. Research published in the Journal of Dairy Science confirms that kappa-casein BB genetics improve the processing characteristics of milk for ultra-filtered products.
Given the April 2025 NM$ revision, which emphasizes butterfat (+31.8% weight) and feed efficiency (+17.8% weight) while de-emphasizing protein pounds, sire selection strategies should reflect these economic realities. Volume-only genetics—high milk pounds without strong component percentages—are losing ground in the index and in the marketplace.
It’s worth noting that these genetic shifts take time. We’re talking about a 3-5 year timeline before you see the full expression in your herd. Decisions made today won’t show up meaningfully in bulk tank averages until 2028-2030. That’s the reality of cattle genetics—no shortcuts available.
Processor relationships are becoming strategic rather than purely transactional. I’d encourage any producer reading this to contact your processor’s sourcing or sustainability department and ask directly: What composition targets are you looking for? What premiums do you offer for hitting them? Do you have a preferred supplier program?
Some processors—DFA, Darigold, Land O’Lakes, and others—have formal programs that offer price premiums, contract stability, and technical support to farms that commit to composition targets and data transparency. These programs aren’t always well-publicized, but they exist.
Certification requirements are expanding as well. fairlife, Horizon Organic, and other premium brands increasingly require third-party sustainability verification from their suppliers. FARM certification, DHI participation, and documented environmental practices are becoming baseline expectations rather than differentiators.
Challenges and Uncertainties Ahead
It would be incomplete to discuss this turnaround without acknowledging the challenges that remain. Success creates its own vulnerabilities.
Capacity constraints are affecting the market right now. fairlife is production-limited, according to Coca-Cola’s Q3 2024 earnings commentary. CEO James Quincey explicitly stated they couldn’t meet demand until new capacity comes online. Cowsmo reported on a 745,000-square-foot, $650 million facility under construction in Webster, New York, that should help, but it’s been a bottleneck.
Policy changes create uncertainty. The Federal Milk Marketing Order reform, taking effect in 2025, is expected to affect milk pricing in various ways. The exact impact depends on your region and class utilization, so it’s worth checking with your cooperative or university extension for current projections specific to your situation.
Plant-based competition continues. The category keeps growing, with various market research firms projecting continued expansion through the early 2030s. Growth has moderated from the rapid 2018-2020 period, but oat milk in particular continues gaining ground with younger consumers.
Consolidation pressure isn’t easing. The trajectory from the 2022 census—40% fewer farms in five years—continues to pressure mid-size operations caught between the flexibility of small farms and the cost advantages of large ones.
Complacency may be the biggest risk. The discipline that built the turnaround—long-term research investment, consumer-centric product development, collaborative strategy—is exactly what successful industries tend to abandon once growth returns. If checkoff boards redirect funding from innovation to short-term promotion, or if processors reduce R&D as margins improve, the momentum could stall.
The Underlying Lesson
Looking at this entire arc, there’s a counterintuitive insight that applies beyond dairy.
The instinct when an industry faces decline is to work harder at the existing business. Cut costs. Improve efficiency. Fight for market share. Promote more aggressively.
Dairy tried all of that for years. It wasn’t sufficient—because when the market itself is shifting away from your core product, being better at the old thing only delays the inevitable.
What changed around 2014-2015 was a fundamental acceptance that commodity fluid milk, as traditionally sold, was unlikely to return to growth. Instead of fighting that reality, industry leaders asked what they could build that consumers actually wanted, using the infrastructure and supply chain already in place.
Same farms. Same cows. Same processing facilities. But instead of trying to sell more commodity milk at mid-teens per hundredweight, the focus shifted to creating categories where dairy had genuine advantages: ultra-filtered, lactose-free, high-protein, composition-specific products commanding meaningful premiums.
Volume is flat or slightly declining. Revenue per farm is higher. Margin per cow improved. Farm sustainability is better—for those who can access the premium markets.
That last qualifier matters. The turnaround is real, but its benefits aren’t flowing equally to all producers. The strategic question for any individual operation isn’t whether the premium pivot worked at the industry level—it clearly did—but whether and how you can position to capture some of that value given your specific scale, location, genetics, and cooperative relationships.
The Bottom Line
The dairy industry in late 2025 sits at an interesting inflection point. The turnaround appears real—2024’s growth wasn’t an anomaly, and analysis suggests the trajectory is continuing. Premium categories are expanding. Consumer perceptions of dairy are improving among key demographics. Genetic selection is evolving to support composition-focused production.
But the foundational work isn’t complete. New processing capacity is still coming online. Composition-focused genetics will take another 3-5 years to express in herds that are now fully selecting. Policy and trade uncertainty could affect even well-planned operations. And the consolidation pressure that’s eliminated 40% of U.S. dairy farms since 2017 shows no sign of reversing.
For producers, the practical implications come down to several key considerations:
Assess your herd’s genetic profile if you haven’t already. The information shapes every breeding decision going forward. With NM$ now emphasizing butterfat and feed efficiency more heavily, your selection criteria may need updating.
Initiate conversations with your processor about composition premiums. Programs exist but aren’t always well-publicized. Ask specifically what they’re seeking and what they offer for hitting targets.
Be realistic about premium market access. Not every farm can break into fairlife’s supply chain or join Organic Valley. Understand which premium pathways are actually accessible given your scale and cooperative membership—and consider alternatives, such as quality-focused regional cooperatives or direct marketing—if the major premium programs aren’t realistic options.
Plan for the 2028-2030 timeframe, not just next year’s milk check. Genetic decisions compound over time. Processor relationships require time to develop. The farms positioned well three years from now are making those decisions today.
Watch the consolidation dynamics. If you’re a mid-size operation, clearly understand whether your cost structure and market access can remain competitive as larger operations continue to gain share.
The turnaround didn’t happen because someone discovered a compelling marketing message that made consumers embrace commodity milk again. It happened because the industry stopped trying to preserve something consumers had moved past and started building what they actually wanted.
That’s perhaps the most transferable insight here. Not the specific technology or product. The willingness to accept that what worked for 50 years may not work for the next 20—and to build something new while there’s still time.
Key Takeaways
The 15-year decline is over. Fluid milk sales grew 0.8% in 2024—driven by premium products like fairlife, not commodity milk marketing.
Your genetics are being repriced. April 2025 Net Merit boosts butterfat to 31.8% and cuts protein to 13.0%. Volume-only bulls are losing economic ground.
$7.4 billion proves the premium model. Coca-Cola’s total fairlife investment shows the upside is real—but capturing it requires scale, certifications, and cooperative positioning most farms don’t have.
40% of U.S. dairy farms are already gone. Operations dropped from 39,303 (2017) to 24,082 (2022). Premium market benefits are concentrating in larger herds.
The question has changed. It’s no longer whether this shift is real—it’s whether your operation’s genetics, processor relationships, and market access position you to benefit from it. The farms winning in 2028 are making those decisions now.
Complete references and supporting documentation are available upon request by contacting the editorial team at editor@thebullvine.com.
This Dairy Innovation Just Made Gatorade Look Like Sugar Water – And It’s Now at Costco – Demonstrates how ultrafiltration technology is opening massive new retail categories beyond fluid milk. Learn how “waste” permeate is being transformed into high-value sports nutrition products, creating significant revenue opportunities for progressive operations.
The Sunday Read Dairy Professionals Don’t Skip.
Every week, thousands of producers, breeders, and industry insiders open Bullvine Weekly for genetics insights, market shifts, and profit strategies they won’t find anywhere else. One email. Five minutes. Smarter decisions all week.
Bred for $3 fat. Paid $2.50. The 5-year genetic timing gap just got real—and the smartest dairies are already adapting.
Executive Summary: October 2024 delivered record U.S. butterfat at 4.30%—genomic selection is doing exactly what it promised. The problem is timing: those genetics were chosen when fat topped $3.00 per pound, and today’s market pays $2.50. This 5-7 year gap between breeding decisions and bulk tank reality is dairy’s toughest planning challenge, made more complex by an April 2025 Net Merit $ revision that increased butterfat emphasis just as prices softened. Factor in heifer inventories at 20-year lows—CoBank projects 800,000 fewer replacements through 2027—and record cheese exports making protein the processing bottleneck, and genetic strategy looks different than it did three years ago. The producers navigating this well are leaning on economic indices rather than chasing premiums, building health traits into their programs, and treating extended productive life as the new margin strategy. The window for assessing your positioning runs through 2026—before current selections fully express into whatever market awaits.
You know what struck me when I was looking at the October milk production numbers? That month delivered the highest butterfat production in U.S. dairy history. We’re talking 1.947 billion pounds at 4.30% concentration—that’s straight from USDA’s November report. By any measure, genomic selection delivered exactly what it promised. The science worked.
But here’s what’s interesting. Those genetics trace back to breeding decisions made in 2021-2022, when butterfat was running north of $3.00 per pound on CME spot markets. Some of you probably remember that October 2022 peak at $3.18. Farmers making aggressive butterfat selections back then were doing exactly what the numbers told them to do. Made perfect sense at the time.
Now those genetics are expressing into a market paying $2.50-2.80 per pound. That’s just how it played out.
And look, this isn’t about second-guessing anyone. It’s about understanding something we all have to work with: genetic cycles run on 5-7-year timelines, while commodity markets… well, you’ve seen how fast those can shift. That timing mismatch creates challenges, no matter how sound the original thinking was.
QUICK TAKE: The Numbers That Matter
4.30% butterfat — October 2024’s record test, up from 4.08% five years ago
0.77 protein-to-fat ratio — Below the 0.82-0.84 optimal range for cheese plants
$3,000-$4,000 — Current replacement heifer prices (75% increase since April 2023)
508,808 metric tons — Record U.S. cheese exports in 2024, first time exceeding 1 billion pounds
800,000 head — Projected dairy heifer inventory decline through 2026-2027
Let me walk through the data, because there’s a nuanced story here worth understanding.
U.S. dairy cows hit 4.30% butterfat in October—up from 4.08% just five years back.
That 5.4% increase in concentration doesn’t sound like much until you multiply it across 9.36 million cows producing roughly 226 billion pounds of milk a year. That’s a real shift in what’s going into bulk tanks nationally.
Now, it’s worth noting that October typically shows higher butterfat tests anyway—fall milk tends to run richer than summer production due to temperature effects on cow metabolism and feed intake patterns. But even accounting for seasonal variation, we’re seeing a structural increase that goes beyond normal fluctuation. The trend line has moved.
Protein’s held pretty steady at 3.30%, which brings us to what might be the most telling metric:
The protein-to-fat ratio has dropped to 0.77 — and that matters more than it might seem at first glance.
If you’ve spent any time around cheese operations—and many of you have—you know processors generally like to see that ratio closer to 0.82-0.84 for optimal standardization and yield. Dr. David Barbano over at Cornell has published extensively on this in the Journal of Dairy Science, and his milk standardization work documents these ranges pretty clearly.
When milk comes in heavy on fat relative to protein, plants have to adjust. Dr. John Lucey at the Center for Dairy Research in Madison describes it as “real operational adjustments at the plant level—not unmanageable, but it affects processing economics in ways that eventually work back through the value chain.”
I’ve heard similar things from cooperative procurement managers in the Upper Midwest. One large regional co-op’s field services director told me their standardization costs have increased noticeably over the past two years, which is starting to factor into component premium structure discussions at the board level. The genetic decisions we made five years ago are genuinely showing up in plant economics today. It’s worth being aware of.
The Timing Question—And the Ironic Twist in the 2025 Index Update
The Timing Trap: How Genetic Decisions Lag Market Reality by 5-7 Years
Here’s something I’ve been thinking about a lot lately. Genetic selection success depends heavily on when decisions get made—not just what traits you’re selecting for.
And here’s where it gets really interesting—even our selection tools were caught in this timing paradox.
The April 2025 Net Merit $ revision, documented in USDA-AGIL’s technical report, actually increased emphasis on butterfat and decreased emphasis on protein compared to the 2021 formula. Why? Because NM$ economic weights are based on recent price trends—specifically, the previous three-year average. Butterfat prices from 2021-2024 averaged $2.88 per pound, well above the $2.10 forecast used in the 2021 index. Meanwhile, protein prices averaged only $2.27, below the $2.60 that had been projected.
The Ironic Index Trap: How April 2025’s NM$ Formula Emphasized Butterfat Just as Prices Fell
So the index that’s supposed to help us hedge against market uncertainty was itself responding to high butterfat prices—just as those prices were beginning to soften. The 2025 NM$ formula now places 31.8% relative emphasis on fat and only 13% on protein for Holsteins. There’s a certain irony in that timing.
This doesn’t mean NM$ is broken—far from it. The 2025 and 2021 formulas correlate at 0.992, meaning most animals rank similarly. But it does illustrate how even our best tools reflect backward-looking price data. Nobody’s crystal ball works perfectly.
Consider two groups of producers who approached genomics differently.
The early adopters—those who started genomic testing between 2010 and 2015—were operating in a different world entirely. Back then, reliability scores for production traits in young animals ranged from 41% to 50%. That’s from VanRaden’s foundational work in the Journal of Dairy Science. Better than parent average, sure, but with enough uncertainty that most folks spread their selection emphasis across multiple traits almost by necessity.
I was talking with a producer in southwest Wisconsin not long ago—a third-generation operation running about 650 Holsteins. “We started genomic testing in 2012 and were pretty conservative about it,” he told me. “The reliability numbers just weren’t high enough to justify betting heavy on any single trait. We focused on steady progress across the board.”
That approach, whether he planned it that way or not, positioned his herd well for different market scenarios. Including this one.
The more recent selectors—those making decisions in 2021-2023—faced different conditions. Genomic reliability had improved to 70-78% on young animals according to CDCB documentation. The tools were more precise. And butterfat prices were at historic highs. The economic signals seemed pretty clear.
Dr. Kent Weigel at UW-Madison, who’s done as much genomic selection research as anyone, puts it this way: “When you’re looking at butterfat premiums that high, and you’ve got genomic tools with that kind of reliability, the math seems obvious. The challenge is that nobody can reliably predict commodity prices five to seven years out. The genetics will do what the genetics do. Markets are another matter.”
Both approaches made sense given what people knew at the time. That’s important to acknowledge.
The Breed Diversity Conversation
There’s been more discussion lately about genetic diversity in Holsteins, and it deserves thoughtful consideration. Not alarm, not dismissal—just honest assessment.
The breed has achieved remarkable progress. CDCB’s periodic genetic base adjustments document substantial merit increases. That’s a real achievement, and we shouldn’t lose sight of it.
But that progress has come alongside increasing genetic concentration. Dr. Chad Dechow at Penn State has researched this extensively—his work in the Journal of Dairy Science shows Holstein inbreeding levels around 8% on average now, with young bulls running somewhat higher at 9-10%.
“What we’re seeing is the natural consequence of intense selection on a relatively narrow genetic base,” Dr. Dechow explains. “The bulls ranking highest on TPI and NM$ tend to be related to each other, so when everyone selects from the top of the list, inbreeding accumulates. It’s not a crisis yet, but it’s a trend worth monitoring.”
The Hidden Cost of Genetic Progress: Why Inbreeding Now Costs $23 Per Percentage Point Per Cow
It’s worth noting that we’re not alone in grappling with this. Dairy industries in New Zealand and across the EU have been addressing similar questions about genetic diversity within their own populations. The Dutch, in particular, have invested significantly in maintaining broader genetic bases in their Holstein-Friesian herds, and there’s been interesting research coming out of Wageningen on balancing selection intensity with diversity preservation. Different systems, different approaches—but the underlying challenge is universal when you’re selecting intensely from elite genetics.
The practical effects show up gradually. Published research from several groups—Pryce’s team in 2014 and Smith’s in 2019, both in the Journal of Dairy Science—has documented that each percentage point of inbreeding correlates with roughly 0.2-0.3 additional days in the calving interval. Not dramatic on its own. But it compounds over time, as many of us have seen.
What’s encouraging is that tools now exist to proactively manage this. CDCB publishes Expected Future Inbreeding scores through uscdcb.com that help identify high-merit genetics with less relationship to your existing herd. Several AI organizations have built mating programs around this. These are practical solutions for folks who want to stay ahead of the trend.
What Seems to Be Working
I’ve had a lot of conversations with producers and consultants across the Midwest and Northeast over the past year. Some patterns keep coming up among operations that seem to be navigating current conditions well.
Letting Economic Indices Do the Heavy Lifting
The operations that appear best positioned aren’t chasing whatever component pays best this month. They’re using economic indices—particularly Net Merit $—as their primary guide.
What makes NM$ useful is that USDA updates those economic weights periodically based on current conditions. Yes, those updates lag the market somewhat—as the April 2025 revision illustrates—but over time, the adjustments provide more systematic hedging than trying to guess where prices will be in five years.
A producer I know in Sheboygan County, Wisconsin—400-cow operation—made this shift about three years back. “We used to lean into whatever component was paying well,” he said. “Now we focus on NM$ and let the index handle the economic weighting. Our genetic progress has actually been more consistent.”
You hear variations of this story across different regions. California, Upper Midwest, Northeast—the specifics vary, but the principle holds.
Rethinking Replacement Economics
Here’s something that’s changed the math for a lot of operations—and it ties directly to one of the biggest structural shifts in our industry.
With heifer prices sustained at $3,000-$4,000 across many markets, herd turnover economics look dramatically different than they did five years ago. USDA data shows a 75% increase in heifer prices from April 2023 to mid-2025, moving from $1,720 per head to over $3,000—reaching unprecedented levels.
The driver? The beef-on-dairy trend has fundamentally reshaped our replacement pipeline. According to CoBank’s August 2025 analysis, dairy replacement heifer inventories have fallen to a 20-year low and could shrink by an estimated 800,000 head through 2026-2027 before beginning to recover. The National Association of Animal Breeders tracked the shift: of 9.7 million units of beef semen sold in 2024, 7.9 million went to dairy farmers—up from 5 million of 7.2 million units in 2020.
The Replacement Reckoning: How 800,000 Missing Heifers Reshape Genetic Strategy
The Financial Reality
Any genetic strategy conversation has to acknowledge what most of us are actually dealing with. Dairy farms generally run on tight margins with real debt service obligations. That’s just the reality.
Annual summaries consistently document substantial debt across dairy operations. When milk prices run in that $22-23 per cwt range—roughly where USDA forecasts have pointed for early 2025—margins support current operations but don’t leave much cushion for experiments.
Dr. Weigel acknowledges this: “You have to be realistic about financial constraints. The best genetic strategy doesn’t matter if it creates a cash flow problem. For most operations, the answer is gradual adjustment—incorporating diversity and health traits incrementally while maintaining production genetics that support current obligations.”
What seems to work is matching the strategy to your actual situation:
If you’ve got some balance sheet flexibility: Consider incorporating Expected Future Inbreeding scores in selection. Explore health trait emphasis. Build reserves that give you room to adjust.
If margins are tighter: Focus first on extending herd life to reduce replacement costs. Use economic indices rather than chasing component premiums. Address refinancing conversations while conditions are favorable.
Both approaches make sense—they just align with the circumstances.
The calculation that keeps coming up: extending herd average from 2.2 to 2.5 lactations through improved fertility and health genetics can reduce heifer purchases by 10-15%. On a 500-cow operation, that potentially keeps $100,000-$150,000 annually in the business rather than flowing out for replacements.
The genetic tools to support this exist. Productive Life and Livability carry reasonable genomic reliability. The daughter pregnancy rate directly influences how long cows stay productive. It’s a different way of thinking about genetic investment—through cost reduction rather than just chasing more production.
Taking Health Traits Seriously
This is one area where the tools have really improved. Modern genomic evaluations include predictions for health traits that weren’t reliably measurable a decade ago. CDCB documentation shows mastitis resistance predictions now achieving around 40% reliability. Lower than production traits, sure, but meaningful enough for selection purposes.
Research from Canadian dairy genetics programs—including University of Guelph work in the Journal of Dairy Science—has documented that herds emphasizing health traits can achieve substantially lower lifetime antibiotic use alongside improved productive life. The economic benefit often runs $150-200 per cow annually when you factor in reduced vet costs and culling.
Dr. Filippo Miglior at Lactanet Canada sees this as the emerging opportunity: “Health traits are where I think we’ll see the most practical progress over the next decade. The genomic tools have become reliable enough for meaningful selection, and the economic payback is real even when it’s harder to see on individual milk checks.”
That resonates with what I’ve seen on farms.
The Export Picture—And Why Protein Is Becoming the Bottleneck
One more piece worth understanding, because it adds important context to the milk composition discussion.
U.S. cheese exports are on a historic run. According to the U.S. Dairy Export Council, 2024 set a new record at 508,808 metric tons—the first time ever exceeding 1 billion pounds. That’s 17% above the previous record set in 2022. As USDEC president Krysta Harden noted, “U.S. suppliers posted record-high cheese exports, strengthened their presence across Latin America, lifted U.S. dairy export value, and demonstrated their commitment to global markets.”
U.S. suppliers set records in several key markets in 2024, including Mexico, Central America, South America, and the Caribbean. Strong demand continues across Asia, particularly in Southeast Asian markets.
Here’s why this matters for milk composition: cheese production is protein-limited, not fat-limited. When we’re shipping record volumes of cheese overseas—and new processing capacity keeps coming online—protein becomes the bottleneck. Our current high-fat, relatively lower-protein milk actually creates challenges for exporters trying to maximize cheese output.
So while we’ve been genetically optimizing for butterfat premiums, the export market that’s driving so much of our growth needs protein. That’s not to say fat doesn’t matter—it absolutely does, especially for butter exports, which rebounded strongly in 2024 with AMF shipments more than doubling year-over-year according to USDEC data. But it does suggest that balanced milk composition may have more strategic value than we’ve been pricing in.
Dr. Mark Stephenson at UW-Madison, who directs dairy policy analysis, notes that “the export growth reflects genuine U.S. competitiveness on price and quality. Maintaining that position long-term depends partly on genetic resources—having flexibility to produce milk that meets diverse market specifications.”
As we compete globally, our ability to produce milk suited to different end uses becomes a competitive factor. Our genetic flexibility—or lack of it—shapes what market opportunities we can pursue.
Some Questions Worth Asking Yourself
As genetics selected in 2023-2024 move toward full expression in 2026-2028, there’s time to evaluate where you stand.
What’s happening with inbreeding in your herd? CDCB provides coefficients at uscdcb.com, and AI organizations often do herd-level analysis. If you’re trending toward 8-9%, it might be worth a conversation with your genetic advisor.
How balanced is your selection emphasis? Heavy concentration in any single area creates market exposure. Looking at where you stand across production, health, and fertility gives a useful perspective.
What’s your replacement rate telling you? Elevated involuntary culling often signals underlying fertility or health issues that compound over time. Sometimes it’s worth addressing root causes at the genetic level.
How dependent is your milk check on specific premiums? Understanding what happens if butterfat premiums compress further helps inform genetic emphasis going forward.
Looking Ahead
Timing matters as much as trait selection. That 5-7 year expression cycle means today’s decisions meet future conditions we can’t fully predict. October’s record butterfat illustrates this pretty clearly.
Even index formulas chase prices. The April 2025 NM$ update increased butterfat emphasis based on recent high prices—just as those prices were softening. It’s a reminder that all our tools are, to some degree, backward-looking.
Economic indices still offer systematic hedging. Despite their limitations, NM$ balances multiple trait values and adjusts as conditions change. Generally beats trying to forecast commodity prices years out on your own.
Breed diversity warrants attention. Progress has been remarkable, and tools exist to balance improvement with diversity maintenance. Expected Future Inbreeding scores make this practical.
The heifer shortage is real and structural. With replacements at 20-year lows and 800,000 fewer heifers projected through 2026-2027, extending productive life through genetics has never been more valuable.
Protein matters more than we’ve been pricing. Record cheese exports mean protein is increasingly the bottleneck. Balanced composition may have strategic value beyond what component premiums currently reflect.
Assessment time is now through 2026. Genetics selected will fully express in a few years. Evaluating your positioning while there’s time for adjustments makes sense.
The Bottom Line
Today’s genomic tools are genuinely more capable than anything we’ve had before. What experience keeps teaching us is that effective use requires careful consideration of timing, market uncertainty, and the development of genetic flexibility that works across different conditions. The producers who seem to navigate these cycles best tend to balance ambition with appropriate humility about what any of us can actually predict.
For ongoing coverage of genetic trends, market analysis, and practical strategies, visit www.thebullvine.com.
Resource Note
CDCB offers several free tools at uscdcb.com—Expected Future Inbreeding scores, individual inbreeding coefficients, and genetic evaluations across production, health, and fertility. Your AI rep can help interpret these for your situation. Most organizations can also pull a herd-level inbreeding trend report that shows where you’ve been heading over the past several breeding cycles.
Key Takeaways:
Timing beats genetics: The $3 butterfat genetics you selected in 2021-2022 are now producing into a $2.50 market—the 5-7 year cycle creates risk no breeding decision can fully hedge
Even the indices lag: April 2025’s Net Merit $ revision increased fat emphasis based on recent high prices—just as those prices softened. All tools look backward.
Productive life is the new ROI: Heifer inventories at 20-year lows and 800,000 fewer replacements through 2027 mean extending herd life now pays faster than chasing production gains
Protein is the emerging bottleneck: Record 2024 cheese exports—first year over 1 billion pounds—mean processors need balanced composition more than current component premiums suggest
Your window is now through 2026: Genetics selected today will fully express by 2028-2030. Assess your herd’s positioning while adjustment time remains.
Complete references and supporting documentation are available upon request by contacting the editorial team at editor@thebullvine.com.
Learn More:
2025 Genetic Reset: How Rigid Bull Selection Could Cost Your Herd $147,000 – This tactical guide provides a five-step checklist for recalibrating sire benchmarks post-April 2025. It demonstrates how to use adaptive thresholds and breed-specific Z-scores to avoid the costly inbreeding and production losses caused by outdated selection rules.
The 800,000-Heifer Shortage Reshaping Dairy: Why Some Farms Will Thrive While Others Exit – This strategic analysis explores the economic fallout of the historic 20-year low in replacement inventories. It provides essential frameworks for understanding how component-focused “fortress farms” are securing their future while navigating structural expansion constraints and plant capacity shifts.
2025 Dairy Year in Review: Ten Forces That Redefined Who’s Positioned to Thrive Through 2028 – This review highlights emerging solutions to the industry’s most pressing challenges, including the “27-month supply trap” and the revolutionary shift in culling math. It reveals how progressive operators are using precision genetics to convert heifer constraints into long-term capital efficiency.
The Sunday Read Dairy Professionals Don’t Skip.
Every week, thousands of producers, breeders, and industry insiders open Bullvine Weekly for genetics insights, market shifts, and profit strategies they won’t find anywhere else. One email. Five minutes. Smarter decisions all week.
Andrew grew up on a dairy farm in southern Ontario — which means he learned about herd management, hard work, and tight margins long before it became a career. He went on to build an animal genetics marketing company, running campaigns that actually moved the needle in a notoriously tough-to-reach industry. Today he channels that background into The Bullvine, where he writes about genetics, farm business, and the decisions that separate profitable operations from struggling ones. He doesn’t pull punches, and dairy farmers seem to appreciate that.
To provide the best experiences, we use technologies like cookies to store and/or access device information. Consenting to these technologies will allow us to process data such as browsing behavior or unique IDs on this site. Not consenting or withdrawing consent, may adversely affect certain features and functions.
Functional
Always active
The technical storage or access is strictly necessary for the legitimate purpose of enabling the use of a specific service explicitly requested by the subscriber or user, or for the sole purpose of carrying out the transmission of a communication over an electronic communications network.
Preferences
The technical storage or access is necessary for the legitimate purpose of storing preferences that are not requested by the subscriber or user.
Statistics
The technical storage or access that is used exclusively for statistical purposes.The technical storage or access that is used exclusively for anonymous statistical purposes. Without a subpoena, voluntary compliance on the part of your Internet Service Provider, or additional records from a third party, information stored or retrieved for this purpose alone cannot usually be used to identify you.
Marketing
The technical storage or access is required to create user profiles to send advertising, or to track the user on a website or across several websites for similar marketing purposes.
To provide the best experiences, we and our partners use technologies like cookies to store and/or access device information. Consenting to these technologies will allow us and our partners to process personal data such as browsing behavior or unique IDs on this site and show (non-) personalized ads. Not consenting or withdrawing consent, may adversely affect certain features and functions.
Click below to consent to the above or make granular choices. Your choices will be applied to this site only. You can change your settings at any time, including withdrawing your consent, by using the toggles on the Cookie Policy, or by clicking on the manage consent button at the bottom of the screen.
Functional
Always active
The technical storage or access is strictly necessary for the legitimate purpose of enabling the use of a specific service explicitly requested by the subscriber or user, or for the sole purpose of carrying out the transmission of a communication over an electronic communications network.
Preferences
The technical storage or access is necessary for the legitimate purpose of storing preferences that are not requested by the subscriber or user.
Statistics
The technical storage or access that is used exclusively for statistical purposes.The technical storage or access that is used exclusively for anonymous statistical purposes. Without a subpoena, voluntary compliance on the part of your Internet Service Provider, or additional records from a third party, information stored or retrieved for this purpose alone cannot usually be used to identify you.
Marketing
The technical storage or access is required to create user profiles to send advertising, or to track the user on a website or across several websites for similar marketing purposes.


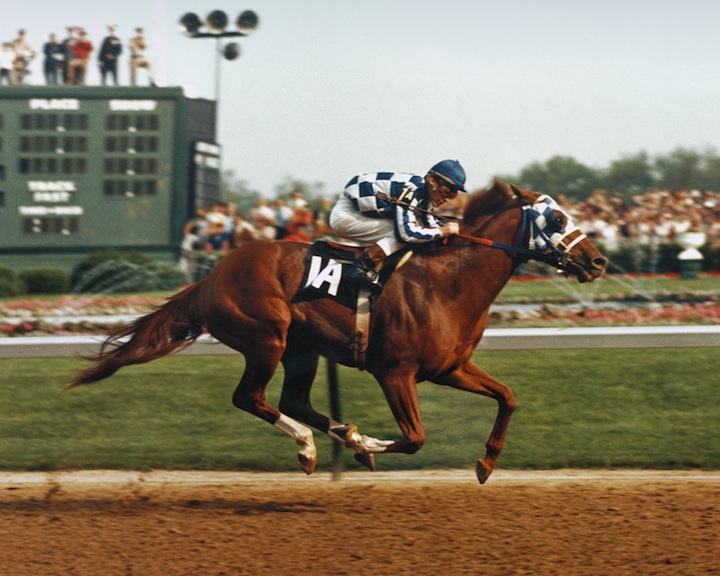
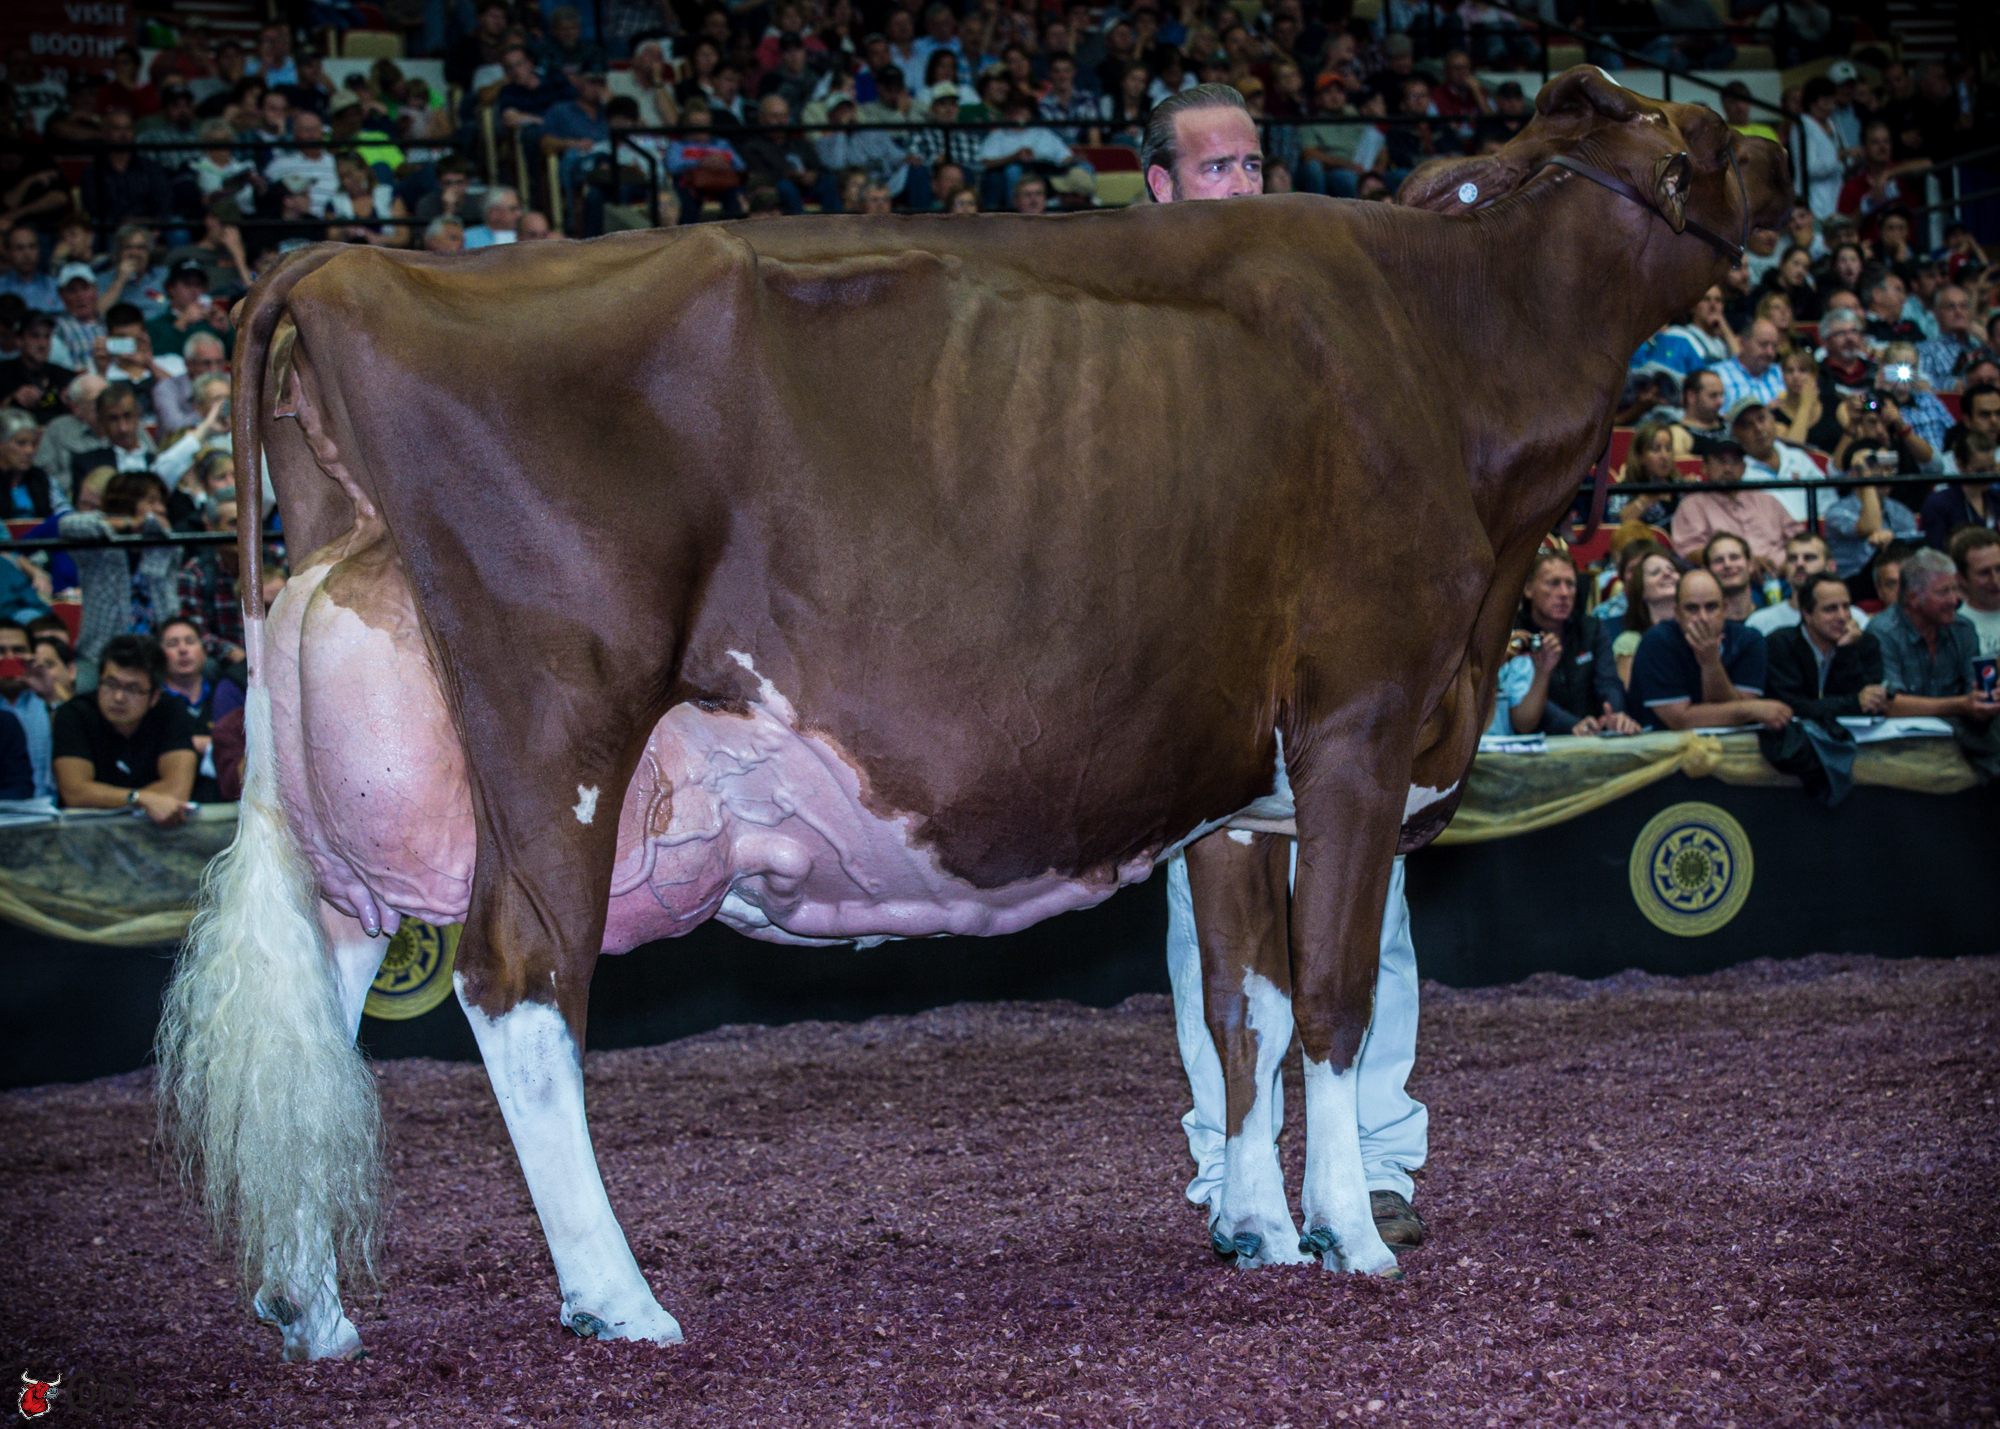
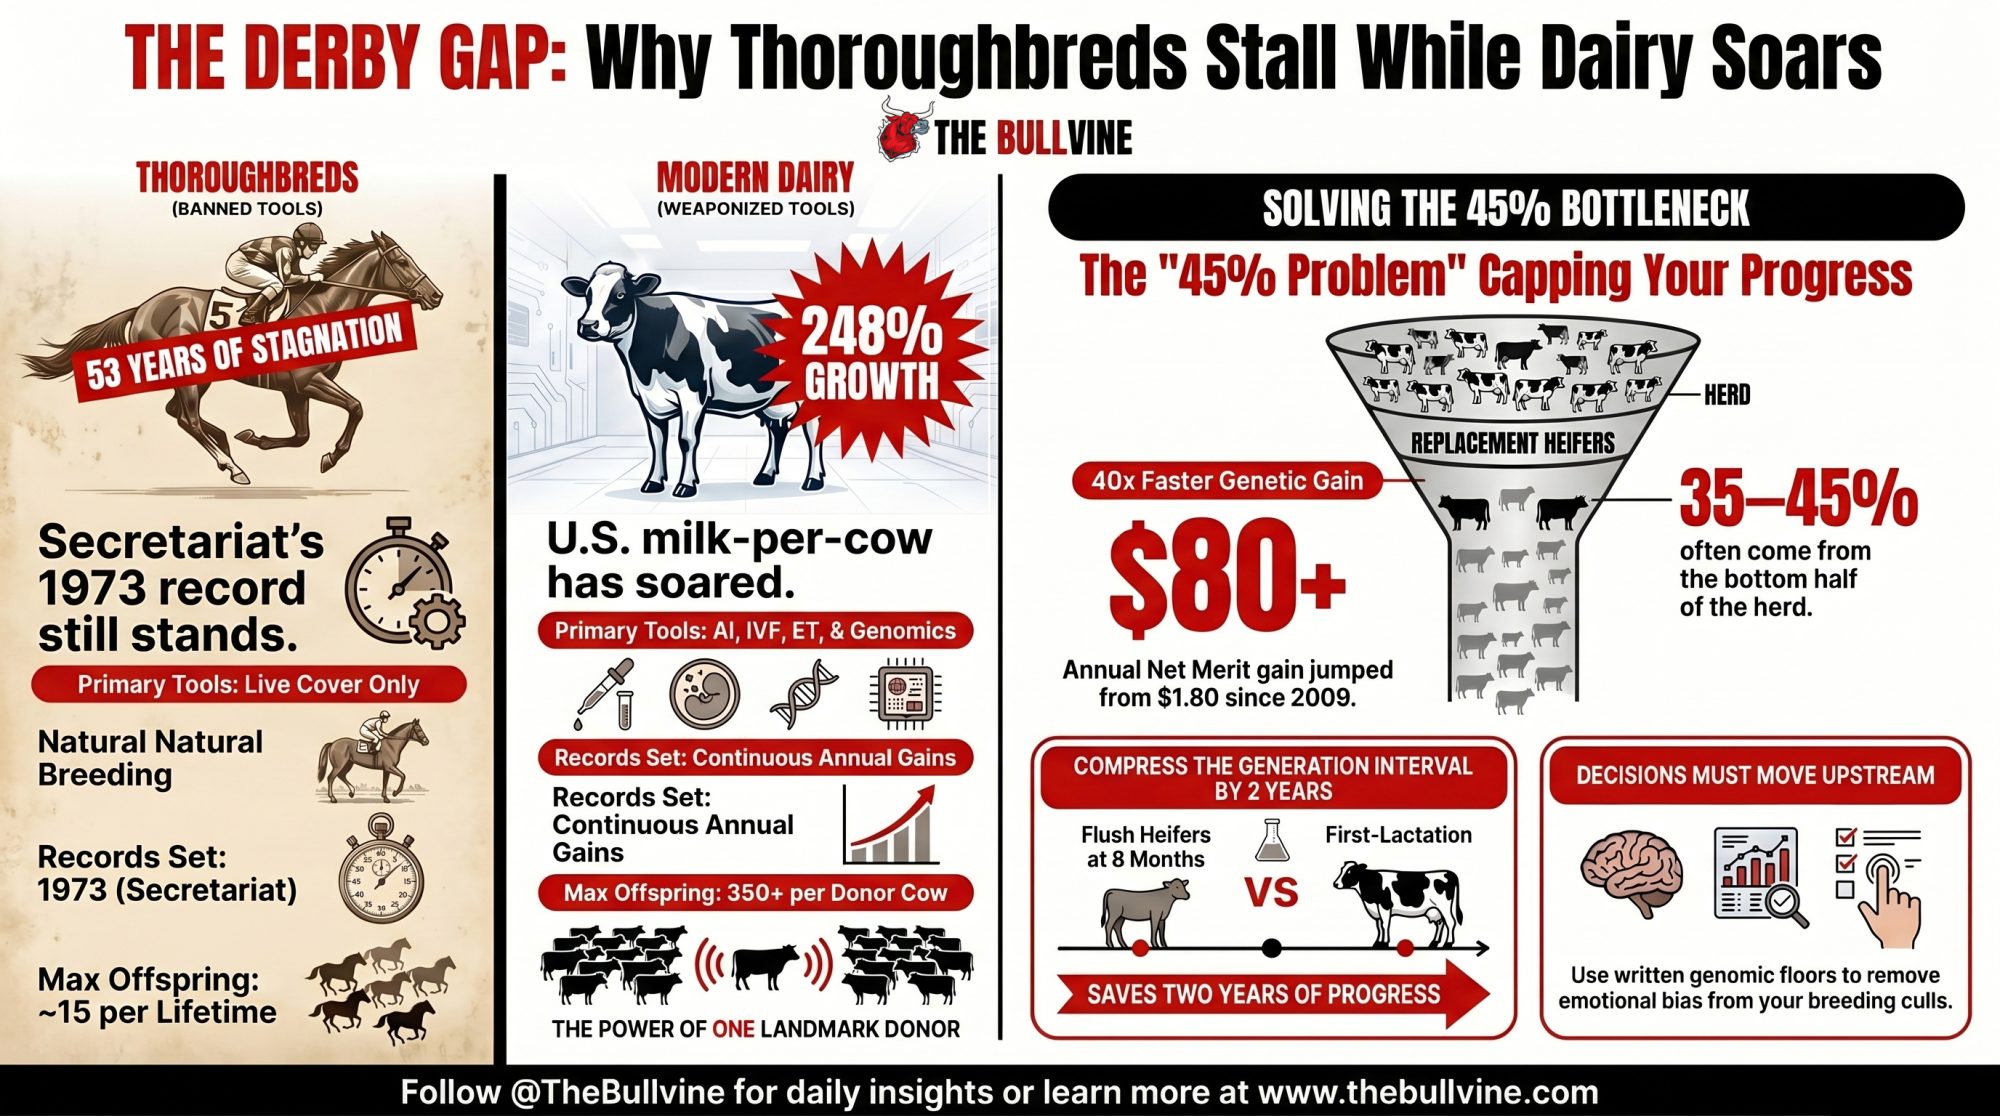
 The Sunday Read Dairy Professionals Don’t Skip.
 The Sunday Read Dairy Professionals Don’t Skip.