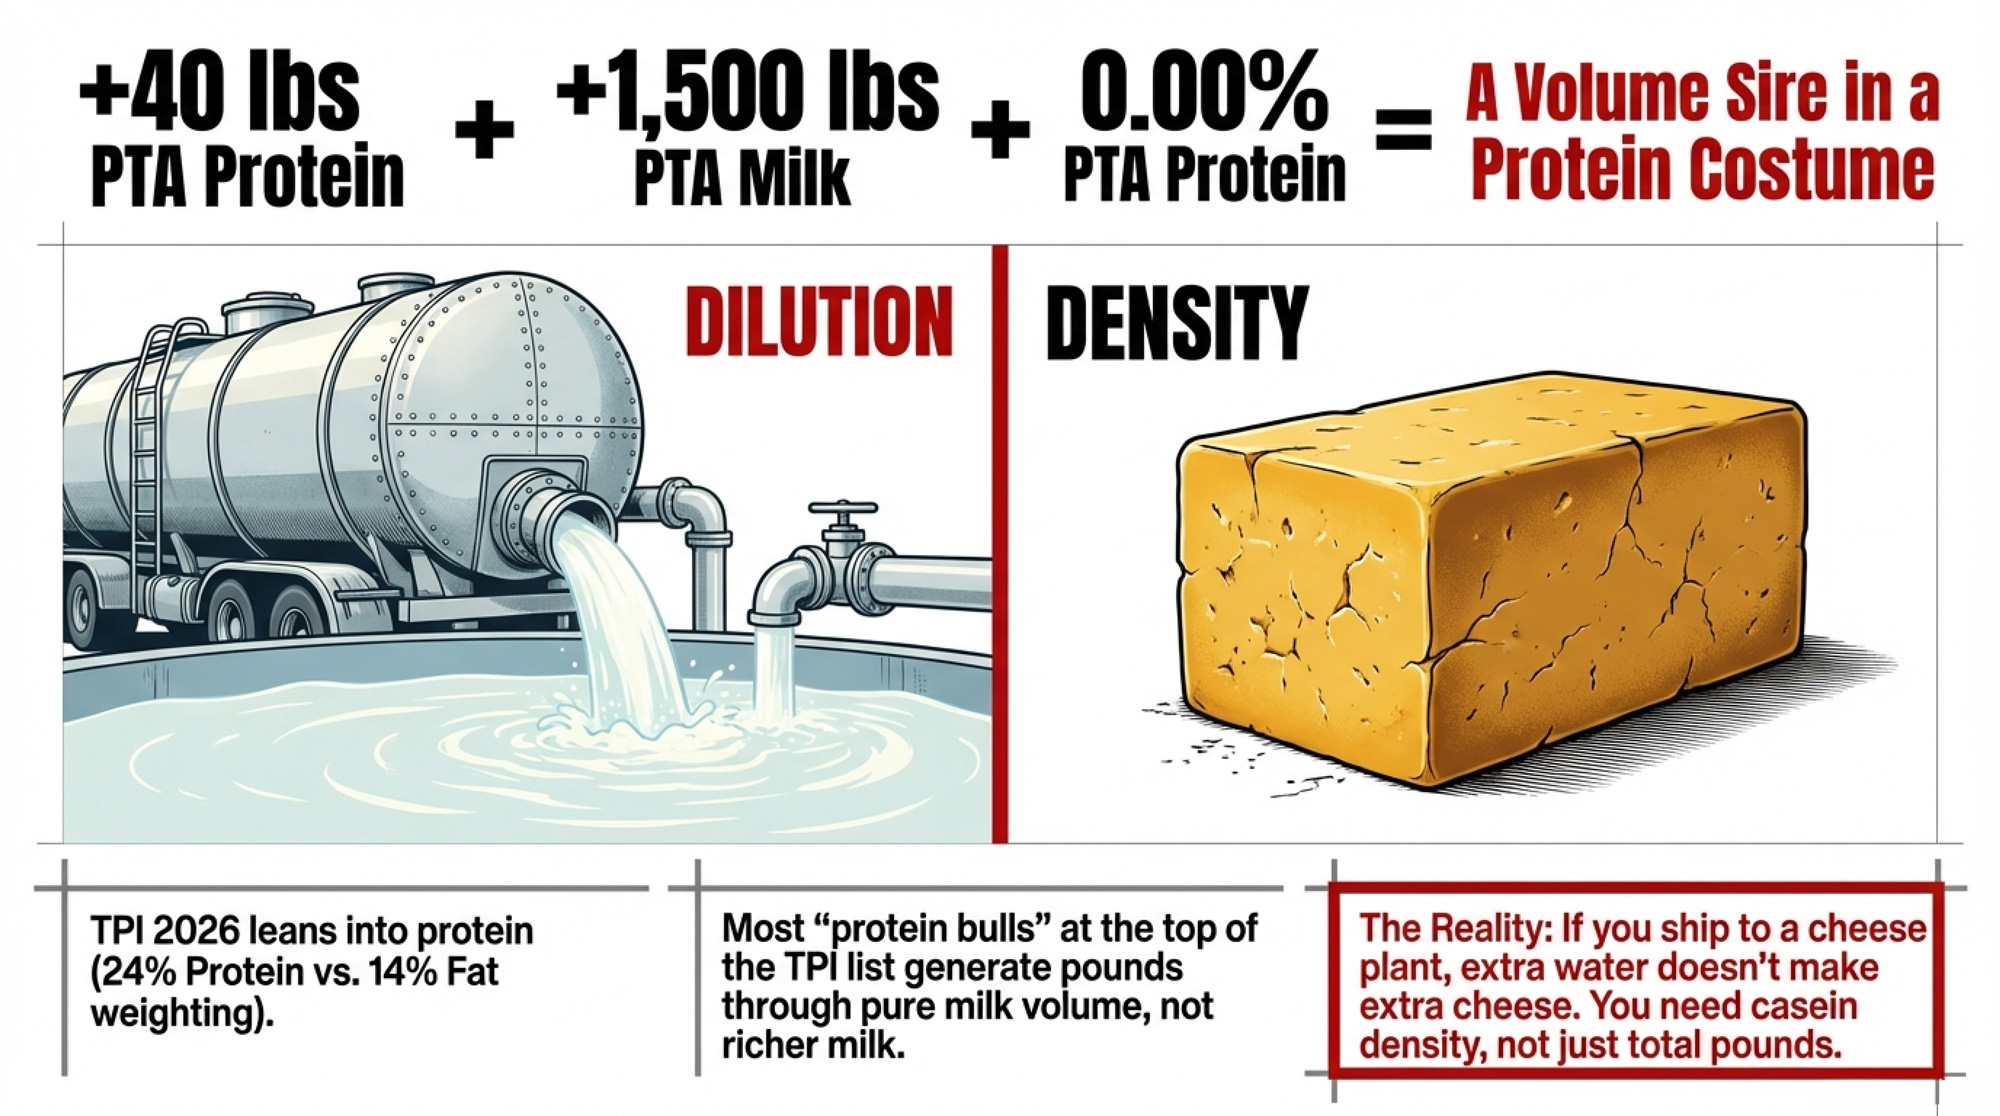
A bull with +40 lbs protein and 0.00% protein % isn’t a protein sire — he’s a volume sire in a protein costume. TPI 2026 just made him harder to spot.
Executive Summary: Last week we flagged the $17,500 protein trap in TPI 2026. Here’s the 25‑year stress test — and why the deeper problem is pounds vs percent. Protein has never hit 3× fat in 25 years of Class III prices, but Holstein USA’s TPI 2026 now weights protein 24% and fat 14%, effectively asking component herds to bet on that ratio anyway. Our barn math shows a modeled “high‑TPI‑protein” cow can add about 2,500 lbs of milk and roughly 0/cow/year in feed — or ,000/year on 320 cows — while actually delivering less cheese per cwt than a dense‑component cow. Even in protein‑friendly scenarios, the high‑CFP, lower‑volume herd either wins or stands so close that the extra feed and risk don’t pencil unless protein jumps to break‑even ratios the market has never sustained. The deeper problem is structural: TPI rewards protein pounds driven mostly by milk volume, while cheese plants care about protein percent and casein yield per cwt — and the fix is straightforward: penalize low protein % the same way NM$ already penalizes excess volume. If your breeding plan only works when protein is worth double or triple fat on your check, you’ll want to run the 30/90/365‑day playbook here against your own component prices before you lock in another semen order.

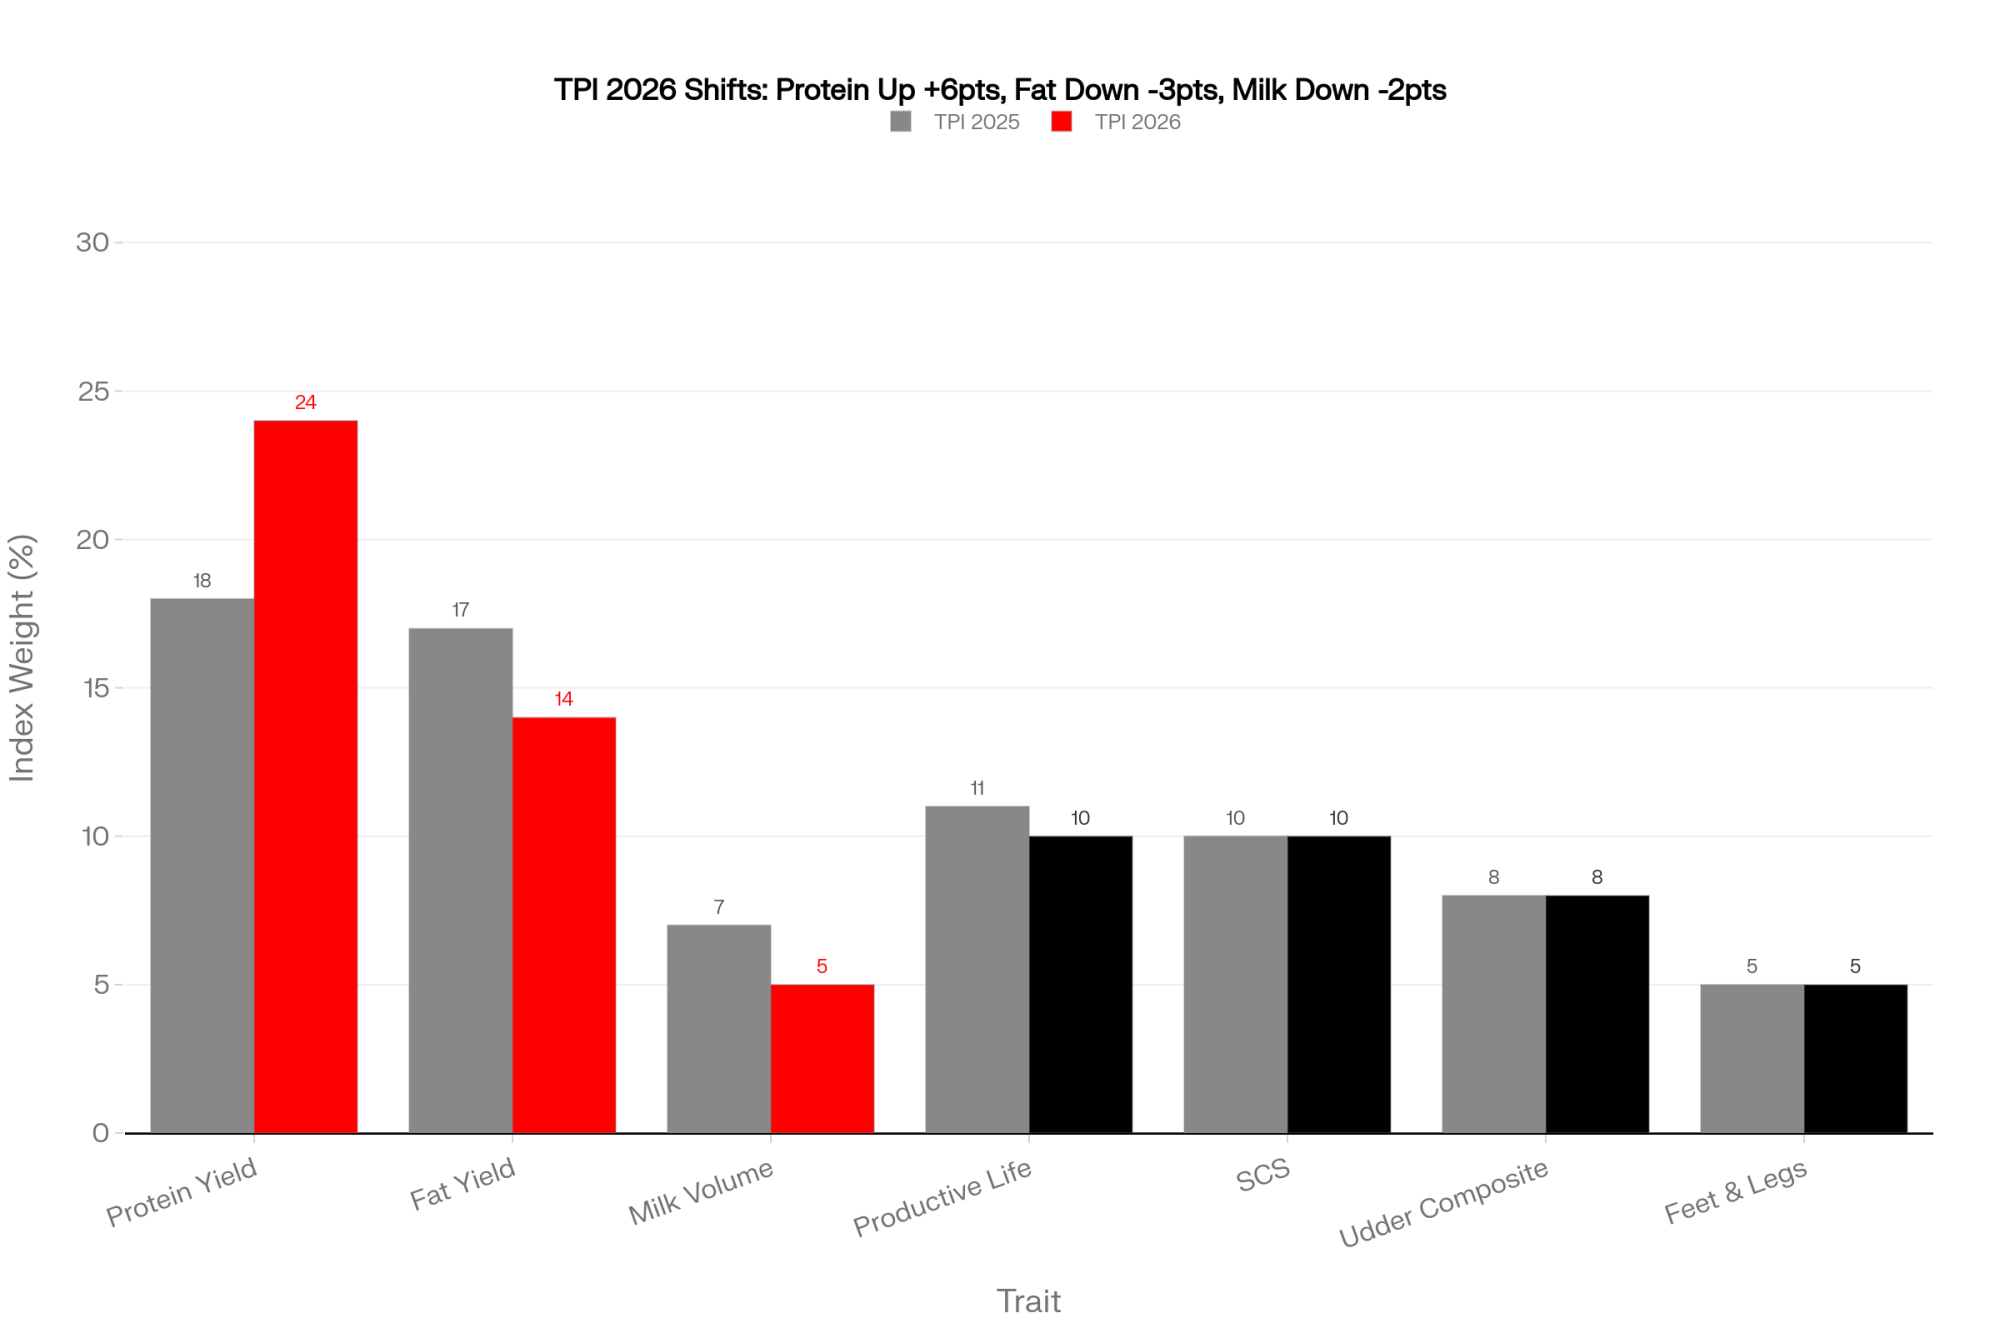
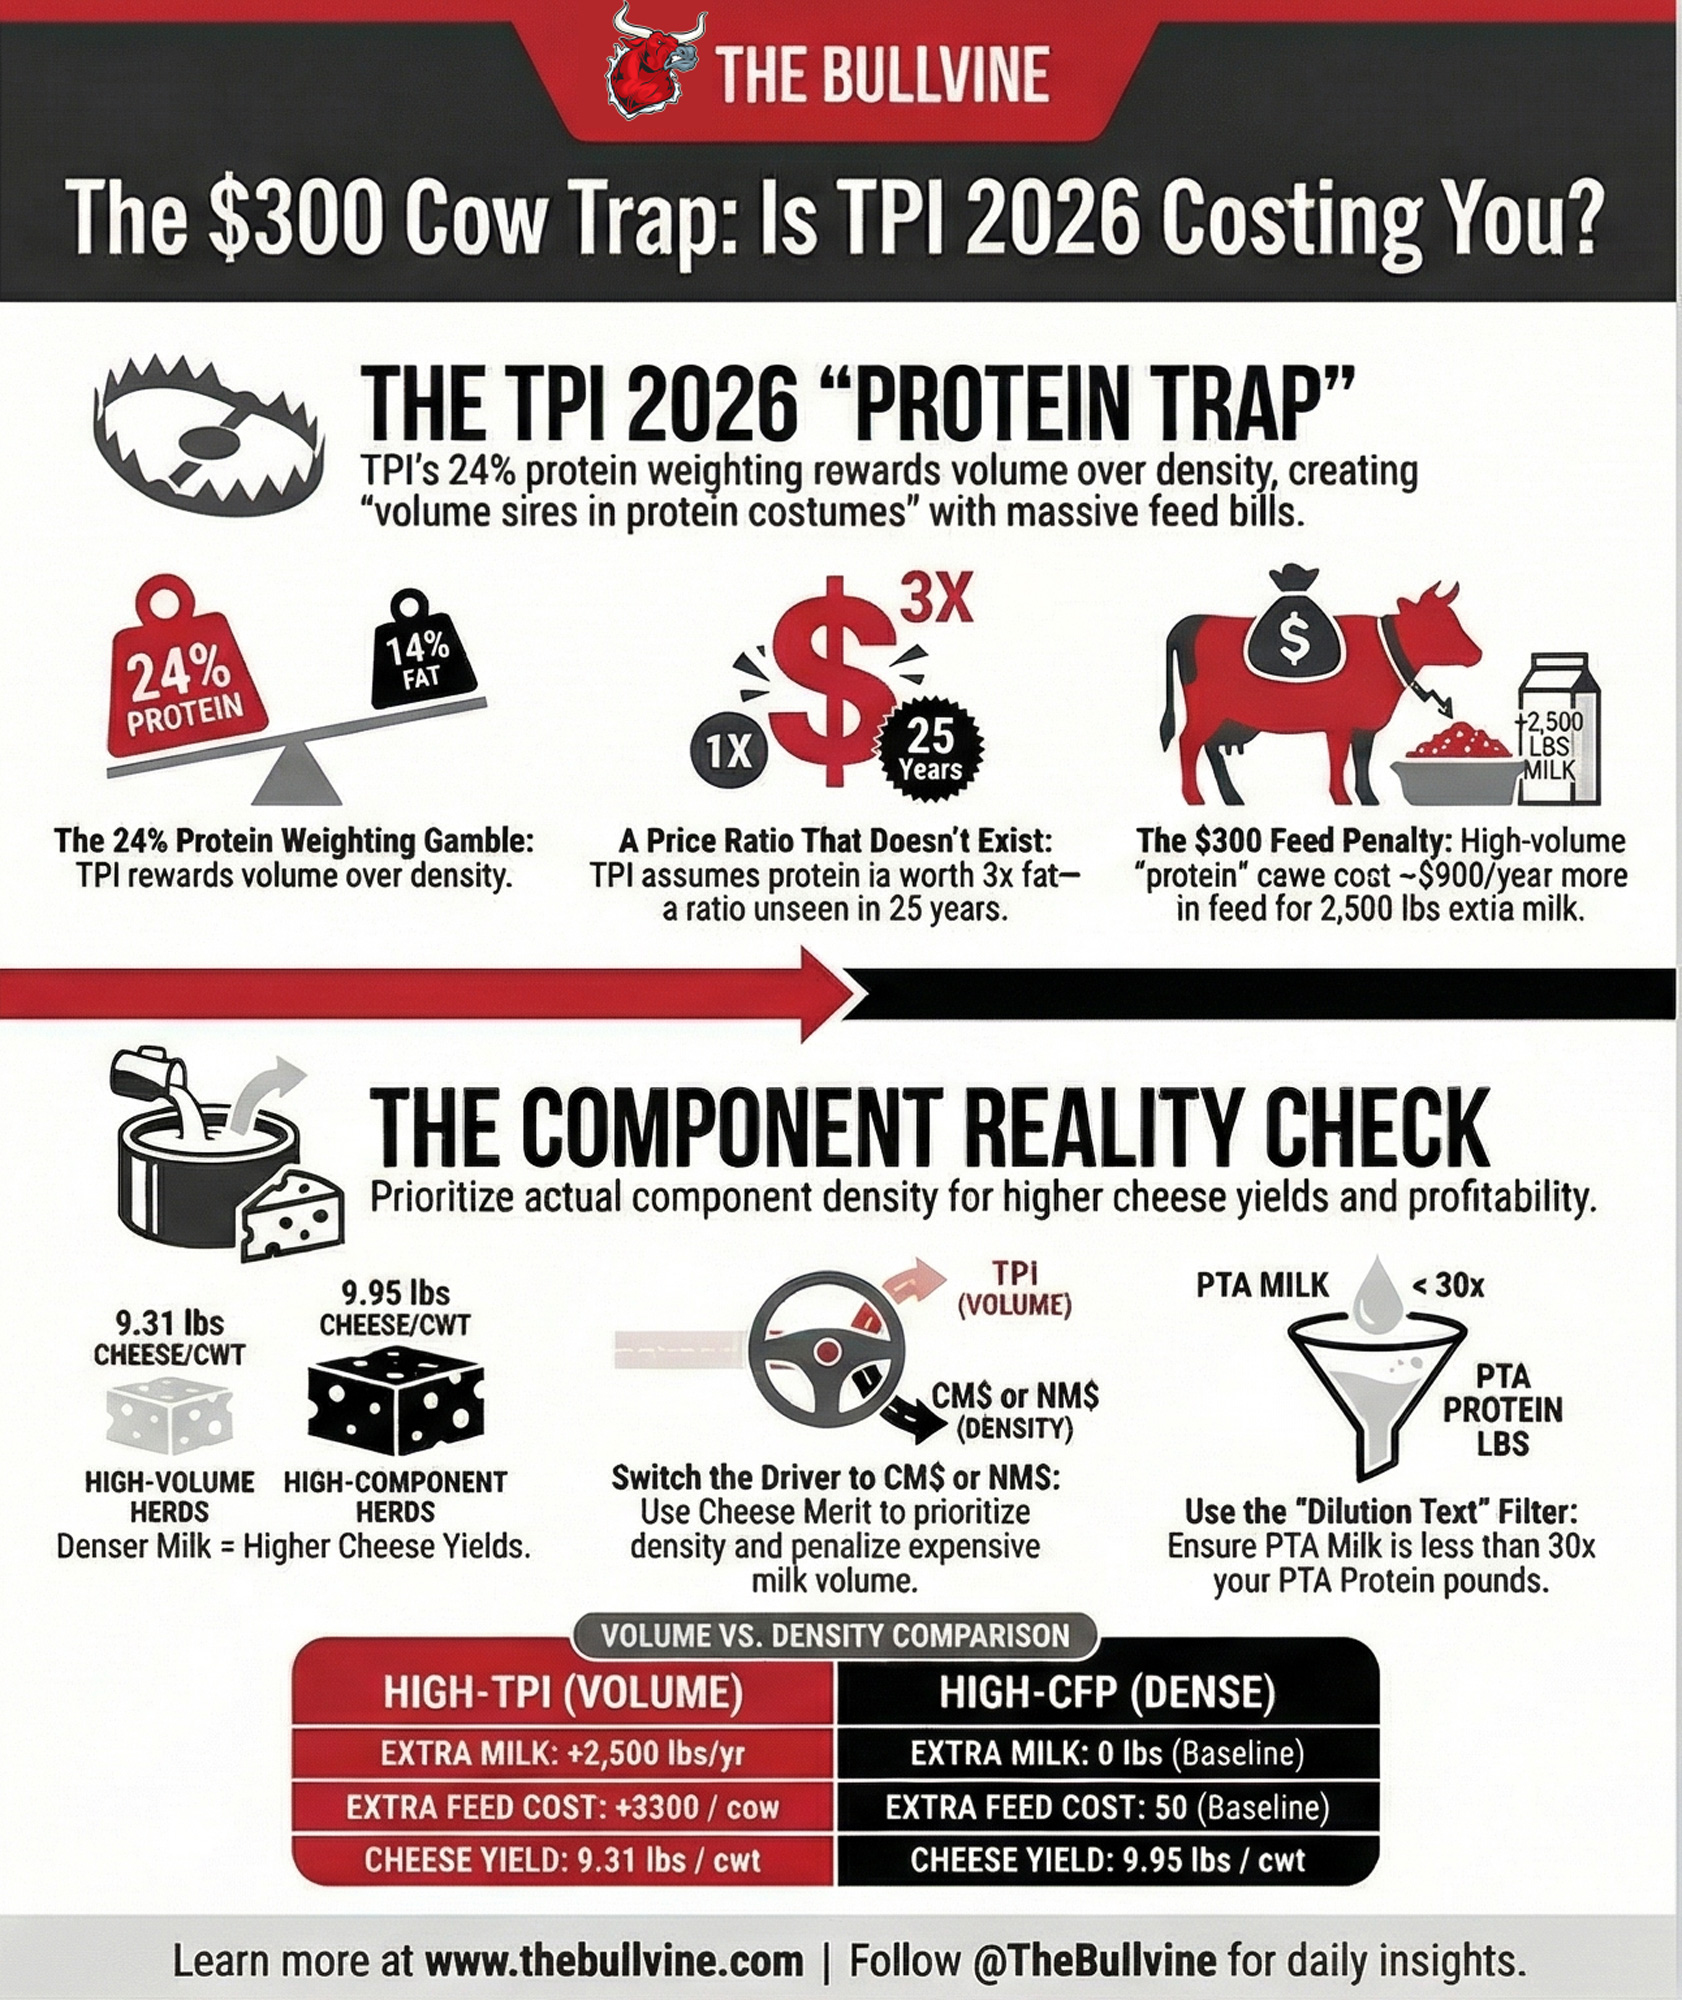
Holstein USA’s 2026 TPI update leans harder into protein — 24% on protein yield vs 14% on fat yield in the production slice — on the theory that processors want more protein and the market will pay for it. For herds selling on cheese‑plant component grids, that bet only pays if protein hits a price ratio the market hasn’t produced in 25 years. And even then, most of the genetic response comes through more milk, not richer milk.
When that April TPI run dropped, a 320‑cow Wisconsin Holstein herd shipping to a cheese plant did what a lot of sharp breeders did. They sat down with fresh proofs, their latest milk check, and one blunt question:
If we chase this new protein weighting with our spring matings, does it actually make our milk check better — or does it just make our cows louder?
When “More TPI Protein” Mostly Means More Milk in the Tank
Holstein USA framed the new TPI weights as better aligned with processor demand and modern pricing, similar to how Lactanet adjusted LPI after seeing faster genetic progress in fat than protein. Over the last five years, Lactanet’s work shows Holstein fat yield gains outpacing protein yield gains, with a positive correlation between the two at the pounds level — largely because both depend on volume.
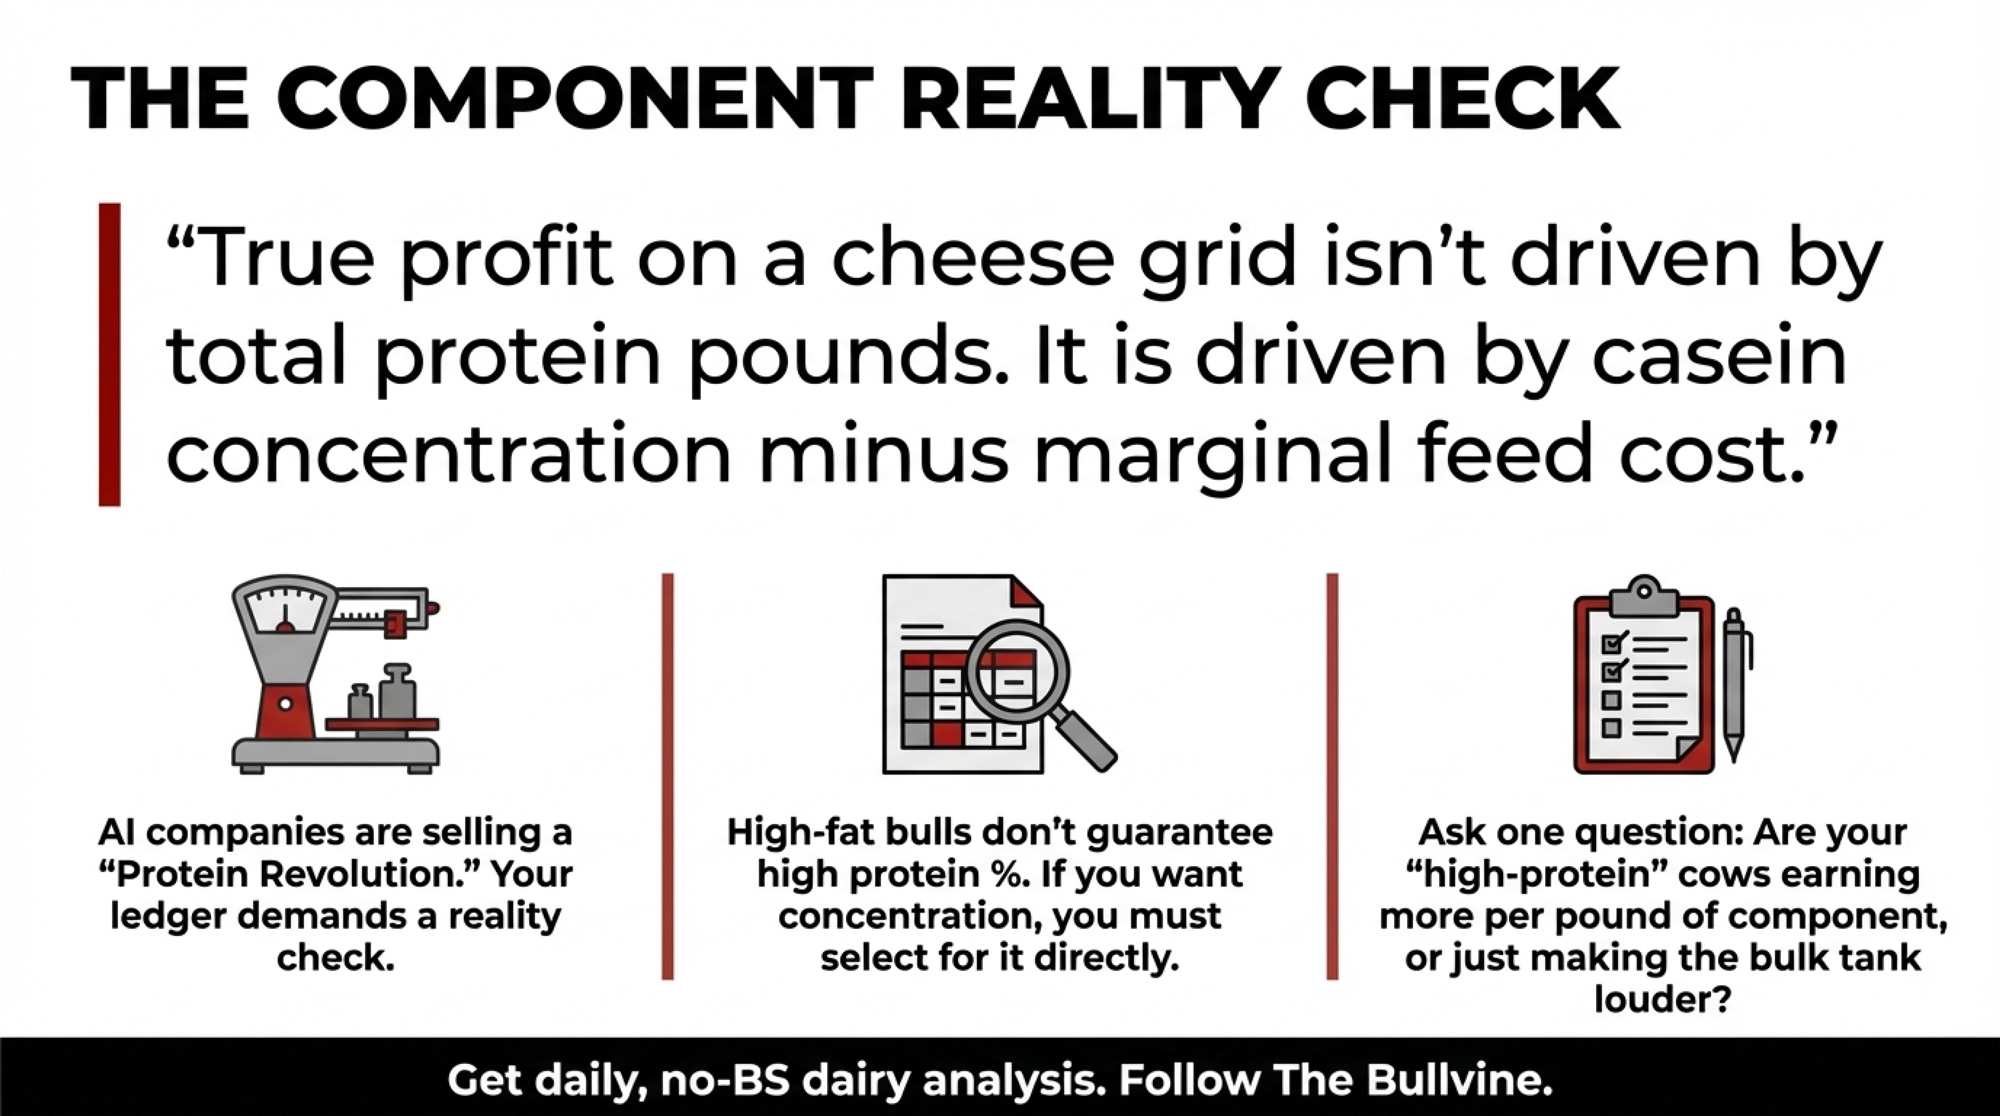
But correlation isn’t causation. Fat % and protein % have a much weaker genetic relationship, and high‑fat bulls with mediocre or low protein % aren’t hard to find on any sire summary. You can’t count on fat selection to drag protein concentration along for the ride. If you want protein %, you have to select for it directly.
On paper, the TPI story sounds tidy:
- Processors say they want more protein.
- Class III formulas pay for protein.
- So you weight protein higher in the index, and genetics will follow.
But when herds like this Wisconsin operation and their genetic advisors dug into the proofs behind the new “protein bulls” at the top of the TPI list, the pattern was hard to ignore.
A lot of those sires carried numbers like +40 lbs PTA Protein, +1,200 to +1,800 lbs PTA Milk, and 0.00% or slightly negative PTA Protein %. On a catalog spread, that looks like a protein sire. In the bulk tank, it’s a volume sire. Those extra protein pounds are hitching a ride on more milk, not richer milk.
| Proof Trait | Volume Sire (Protein Costume) | True Casein Sire | Red Flag? |
|---|---|---|---|
| PTA Protein lbs | +40 lbs | +30 lbs | — |
| PTA Protein % | 0.00% | +0.04% | Red if ≤ 0.00% |
| PTA Milk lbs | +1,400 lbs | +300 lbs | Red if > Prot lbs × 30 |
| PTA Fat lbs | +52 lbs | +40 lbs | — |
| PTA Fat % | -0.02% | +0.03% | Watch |
| Dilution Test (Milk ÷ Prot lbs) | 35× | 10× | Red if > 30× |
| CFP Score (Fat + Prot lbs) | +92 lbs | +70 lbs | Floor: ≥ +90 lbs |
| Cheese/CWT Impact | ↓ (more whey, less casein density) | ↑ (more casein per cwt) | Red = wrong direction |
If you ship to a cheese plant that cares about vat yield per cwt, that distinction isn’t academic. Plants care how much casein they get per hundredweight of milk they pay to haul and process — not how many total “protein pounds” arrive across extra volume. Casein is what becomes cheese; whey is mostly a by‑product.
That’s the protein paradox behind TPI 2026: the index rewards protein pounds, but the plants that supposedly drove the change really need casein density — protein percent and the right ratio to fat.
Does Class III Pricing Really Support 3× Protein?
Under a lot of the “protein will catch up” talk, there’s an unspoken bet: if you load up on protein‑heavy TPI bulls now, eventually protein will be worth far more than fat, and your herd will cash in.
For that to really bail you out, you’re basically assuming a world where protein is worth about three times as much as fat on your milk check.
USDA’s Class III component price announcements going back to 2000 don’t support that.
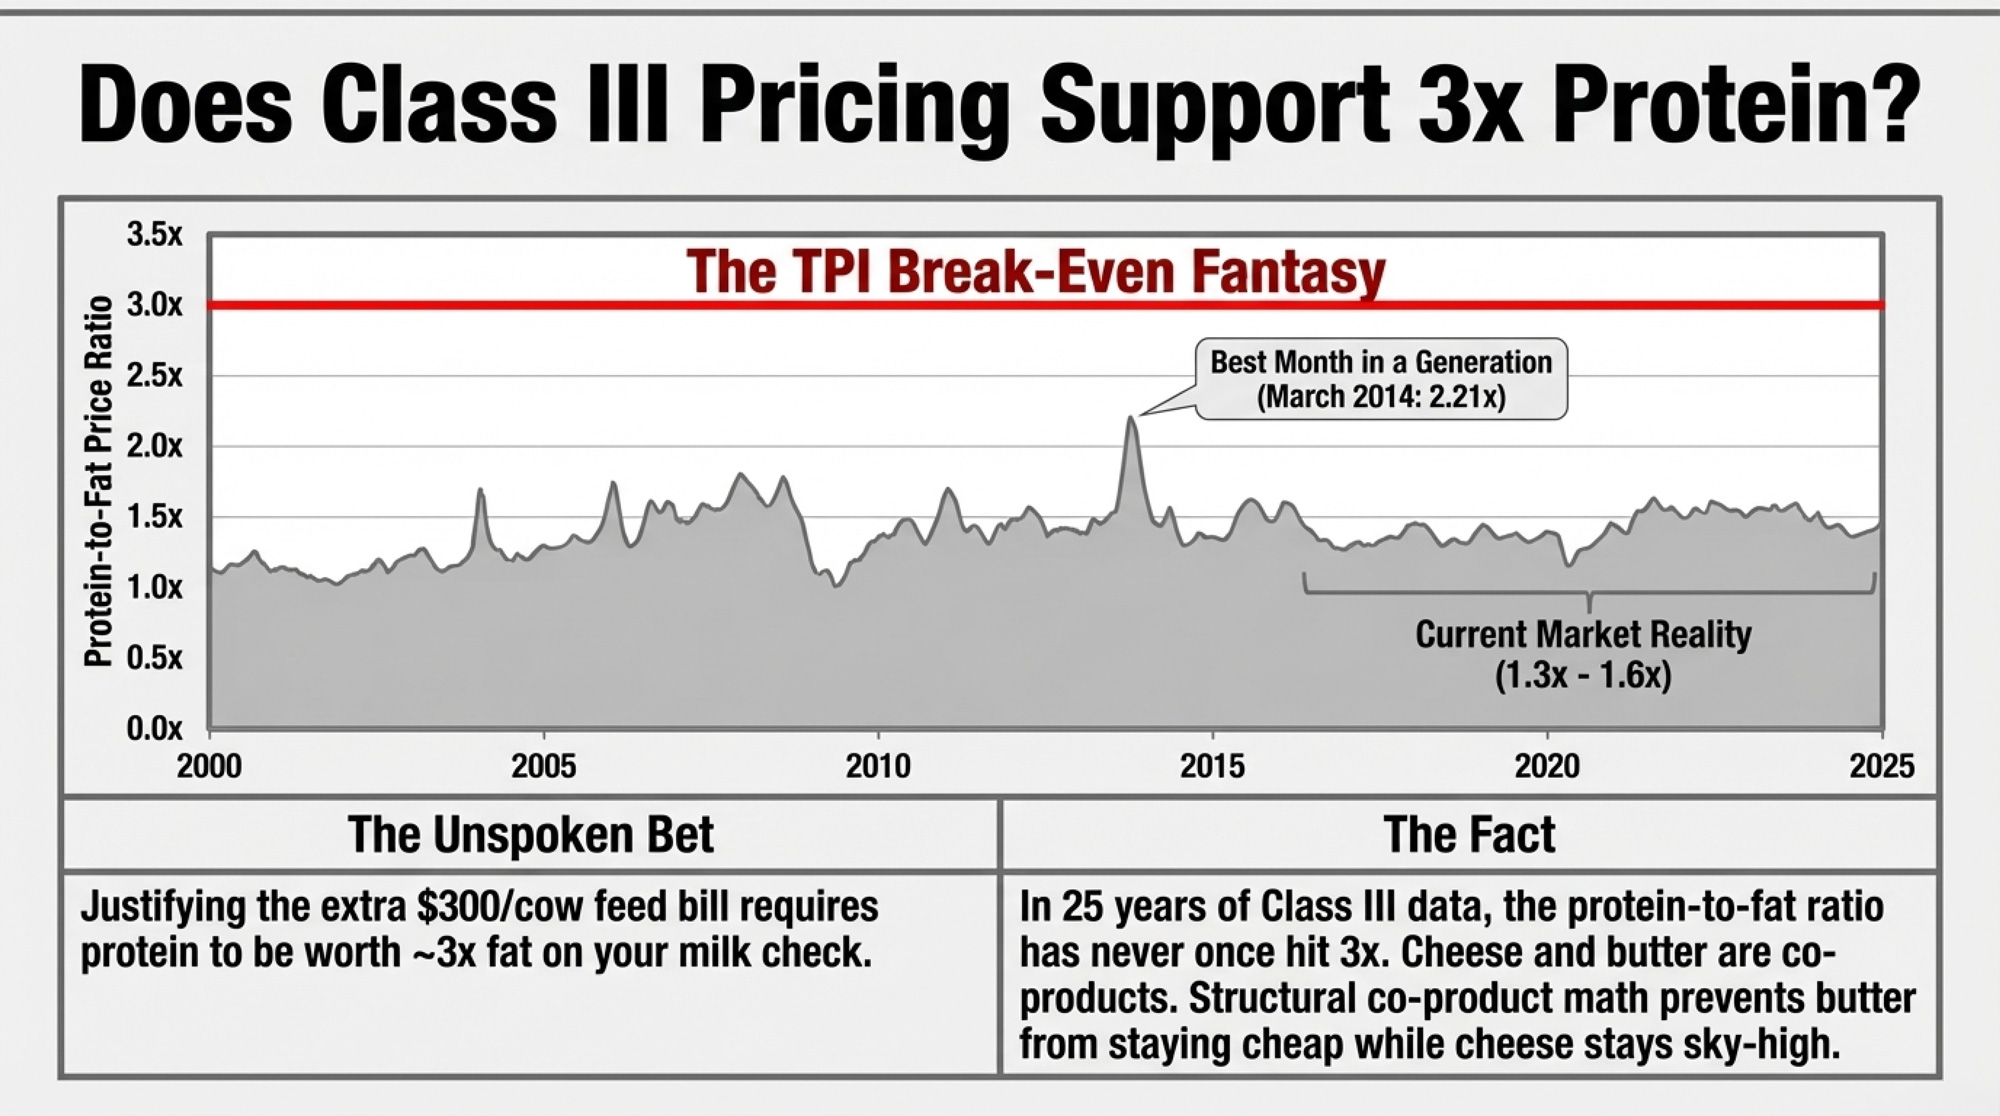
From roughly 2000 through 2014, protein frequently beat fat in the Class III calculation. Ratios above 1.0× were common, and strong months climbed well past 1.5×. The standout month: March 2014, when AMS reported $4.52/lb protein and $2.04/lb fat — about a 2.21× ratio. That’s the best protein month in a generation of Class III data.
Then the world flipped. Around 2016–2017, butterfat took off on the back of strong demand for butter and cream. From about 2017 through 2025, protein generally traded below butterfat on Class III, only occasionally flirting with parity.
Across the entire 2000–2025 Class III component series, there isn’t a single month where protein reaches 3× the butterfat price. The market’s had plenty of time to try. It just hasn’t gone there.
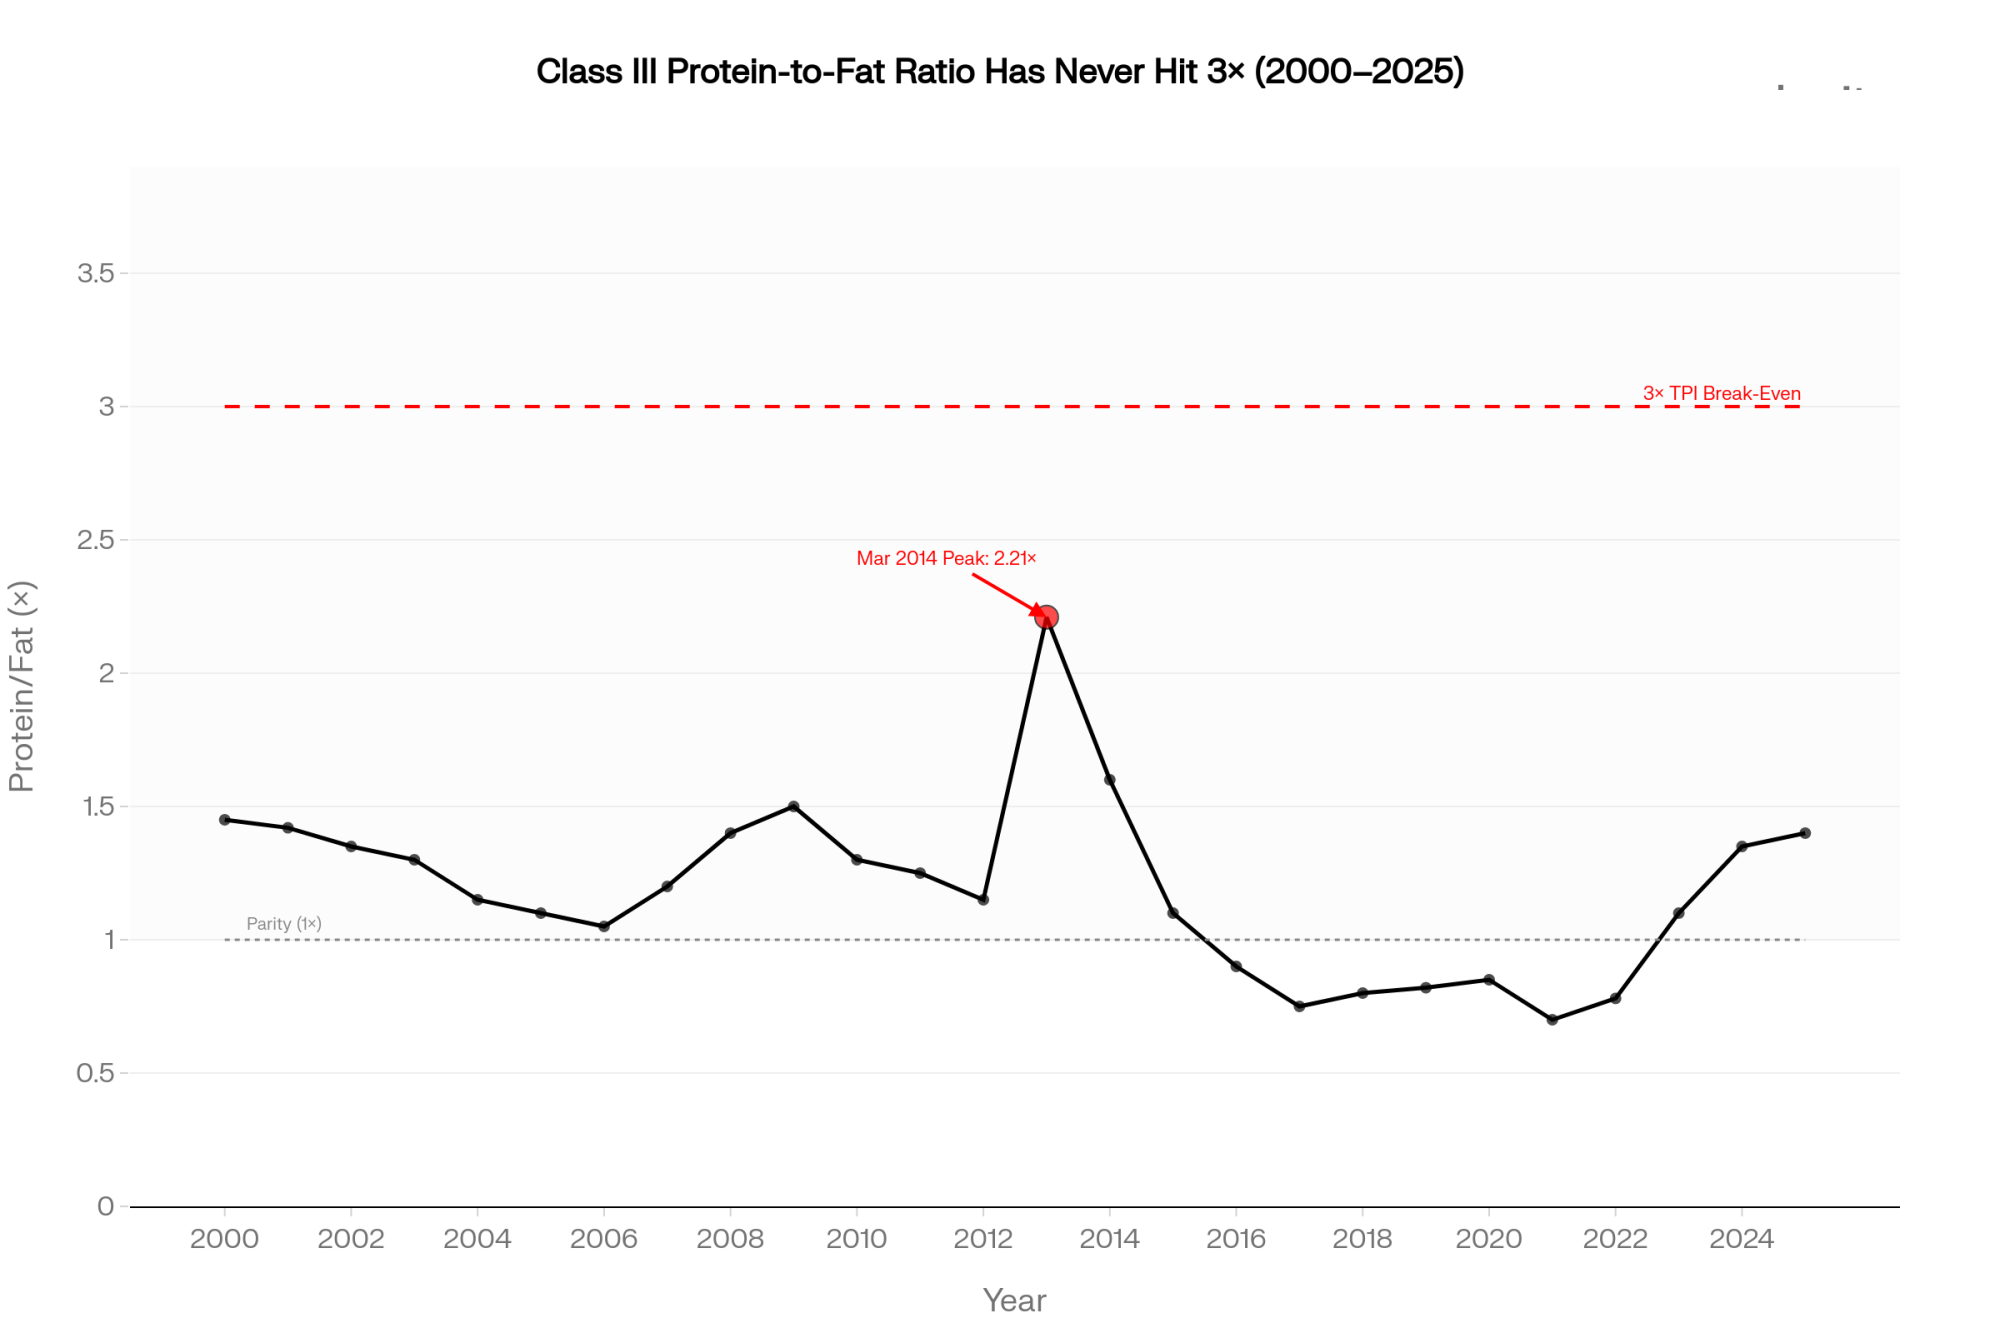
The closest it came recently was in late 2025. Butter prices slumped on heavy supplies while cheese held firmer. CoBank’s December 2025 report, “Protein will drive milk checks for the foreseeable future,” flagged how the protein‑to‑butterfat ratio in US milk had slipped from 0.82–0.84 down to 0.77, and noted that cheesemakers still aim to move it back closer to 0.80 for better efficiency. Corey Geiger’s coverage of the same data underscored how hard it is to change that ratio quickly at the plant level. Component price shifts in that window nudged protein ahead of fat for a short time — but nowhere near 3×, and the gap narrowed again as butter recovered.
There’s a structural reason. Cheese and butter are co‑products of the same milk. When milk is long, both streams feel it. When milk is tight, both get expensive. You may see a wobble for a few months — like late 2025 — when inventories diverge, but you don’t build a stable world where butter stays cheap, and cheese stays sky‑high. The co‑product math keeps pulling them back together.
So when someone leans on “protein will catch up” to justify a heavy protein‑TPI stack, they’re asking you to bet your genetic pipeline on a price ratio:
- that 25 years of national Class III data haven’t produced once, and
- The basic structure of milk markets makes it very hard to hold.
Where Is the Break‑Even for TPI 2026 vs a Component Herd?
Herds on cheese grids don’t make breeding decisions off theory. They look at margin.
To pressure‑test the TPI 2026 shift, the Wisconsin herd above modeled two herd profiles with their advisor — not their actual CDCB numbers, but realistic composite cows based on standard genetic responses. These are modeled cows so that you can plug in your own numbers, not a disguised case study.
One profile reflected the kind of cow you build if you follow TPI’s 24P:14F production weighting for 2–3 generations.
The other reflected a herd steered by Cheese Merit (CM$), where the priority is total component yield and density, not just more volume.
High‑TPI vs High‑CFP Herds at a Glance
| Metric | High-TPI Protein Herd | High-CFP Dense Herd | Winner |
|---|---|---|---|
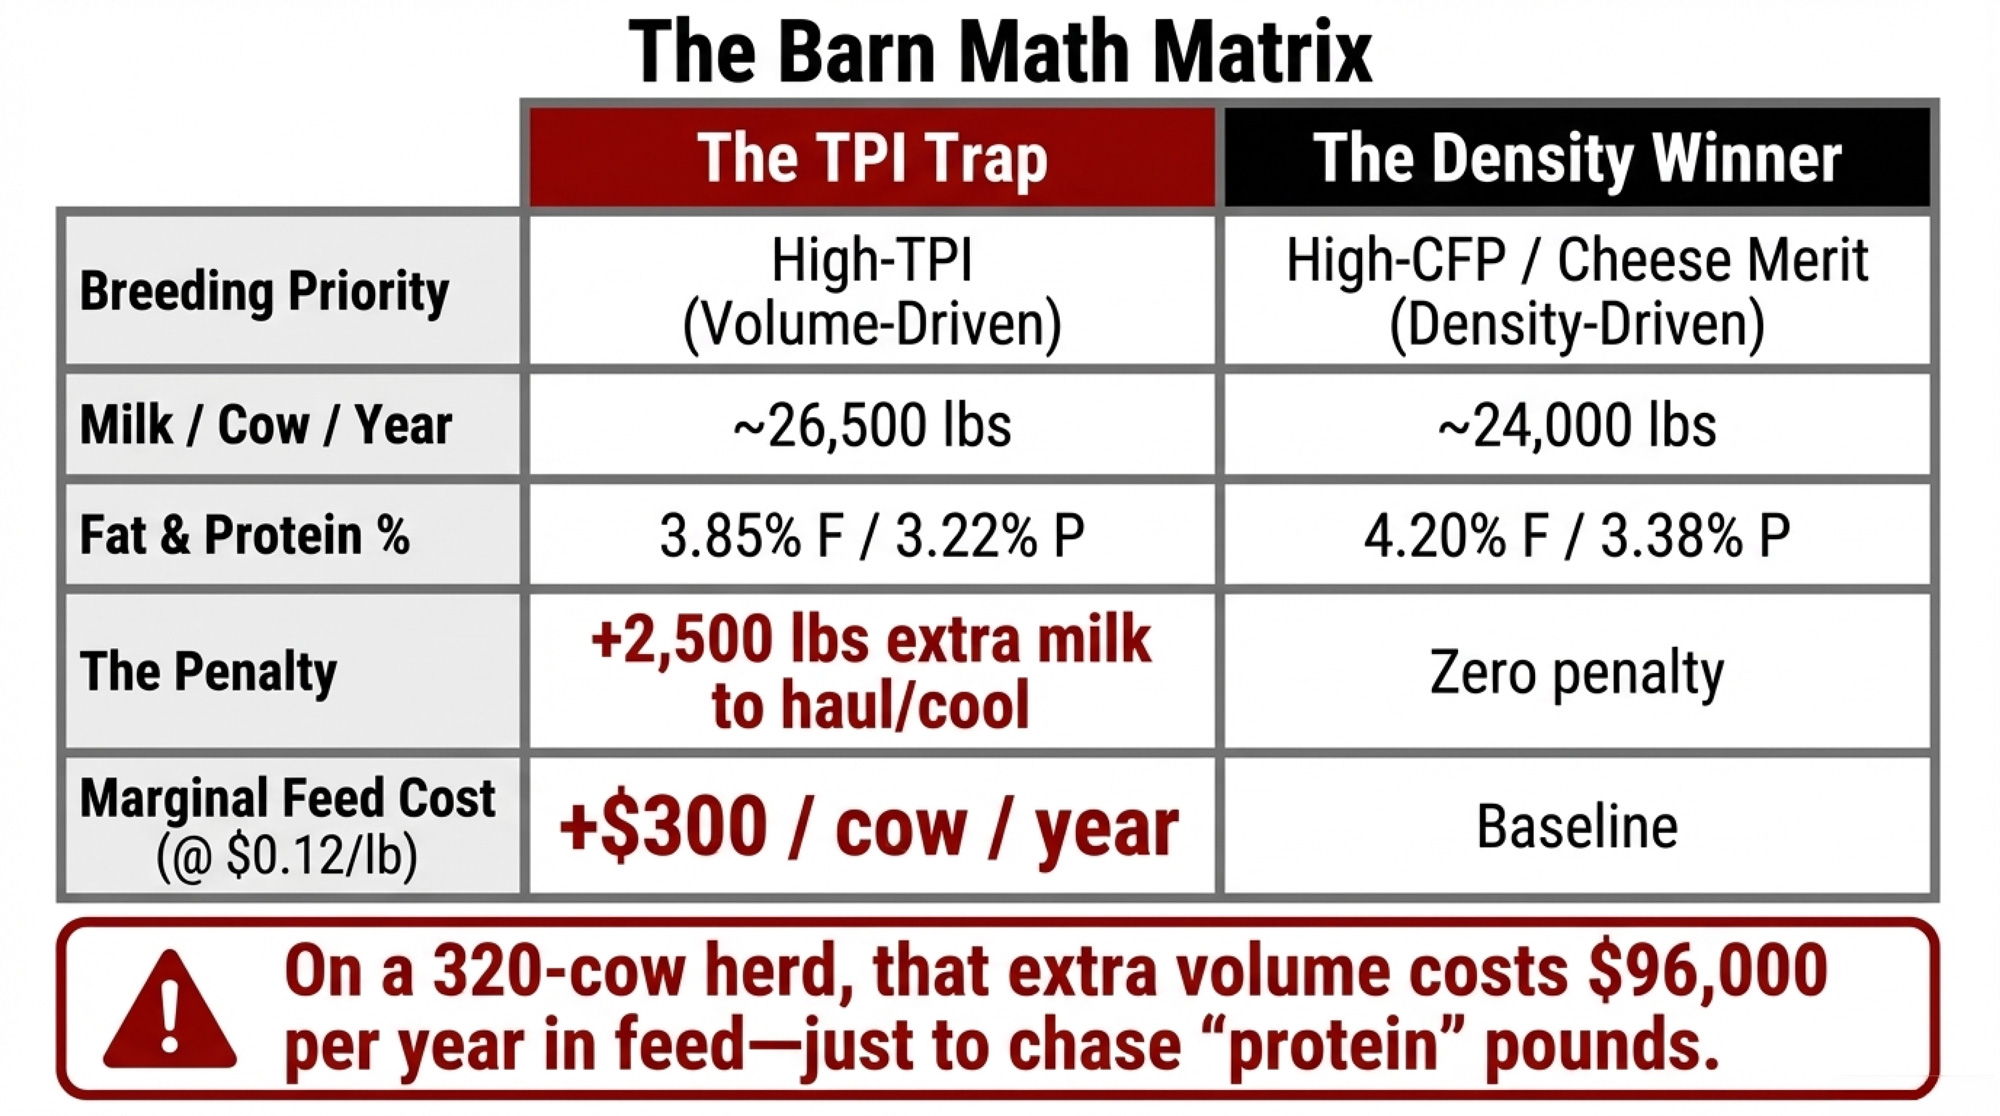
| Milk lbs/cow/yr | ~26,500 | ~24,000 | TPI (+2,500 lbs) |
| Fat % | 3.85% | 4.20% | CFP (+0.35 pts) |
| Fat lbs/cow/yr | ~1,020 | ~1,008 | TPI (marginal, +12 lbs) |
| Protein % | 3.22% | 3.38% | CFP (+0.16 pts) |
| Protein lbs/cow/yr | ~853 | ~811 | TPI (+42 lbs) |
| Protein:Fat ratio | 0.834 | 0.805 | CFP (cheese-plant ideal ~0.80) |
| Extra feed cost @ $0.12/lb | $300/cow/yr | — | CFP saves $300 |
| Extra feed cost (320 cows) | $96,000/yr | — | CFP saves $96k |
| Van Slyke Cheddar yield | 9.31 lbs/cwt | 9.95 lbs/cwt | CFP (+0.64 lbs/cwt) |
| Break-even P/F needed | 1.6–3.35× (varies by fat price) | Not required | CFP (no bet required) |
| Best for herd type | Volume/fluid contracts | Cheese-grid herds | Depends on your check |
On paper, the high‑TPI herd ships a bit more fat and about 42 lbs more protein per cow per year. But it also ships 2,500 lbs more milk per cow.
That extra milk isn’t free.
Using a conservative marginal feed cost of $0.12 per lb of extra milk — which is where a lot of freestall herds land on incremental production — those extra 2,500 lbs cost about $300 per cow per year in feed. On a 320‑cow herd, that’s roughly $96,000 per year in extra feed tied directly to breeding for volume‑driven protein.
Once you see that, the real question becomes:
At your component prices and marginal feed cost, does this “high‑TPI‑protein” cow leave more income over feed — or less?
Quick Margin Check You Can Run at Home
Here’s how to do that same math with your numbers:
- Take your current herd and the kind of daughters your sire stack is building. Estimate the difference in milk per cow and in fat % and protein %.
- Write down your marginal feed cost per extra lb of milk. For most herds right now, that’s somewhere between $0.10 and $0.14.
- Grab your own fat and protein prices from your last 12 months of milk checks.
- Calculate the extra component income for the higher‑yield cow, then subtract the extra feed cost for the extra milk.
If the higher‑TPI cows only look better when you assume protein is way ahead of fat — or if the extra protein income barely covers the feed — your own barn is telling you how narrow that path is.
The Barn Math Behind the Break‑Even
In that Wisconsin modeling exercise, the advisor pushed the comparison further. They ran both composite herds across different fat prices and protein‑to‑fat ratios to see where the high‑TPI herd finally beats the high‑CFP herd on income over feed.
Three points matter:
- At $1.50/lb fat — a cheap, low‑butter world — the high‑TPI herd needed roughly a 3.35× protein‑to‑fat ratio to catch up. That ratio doesn’t show up anywhere in the 2000–2025 Class III record.
- At $2.50/lb fat — closer to “normal” recent Class III butterfat levels — the break‑even dropped to about 1.9×. Still higher than almost every month from 2017 to 2025.
- At $2.91/lb fat, the actual December 2024 Class III butterfat price, the break‑even settled around 1.6×. That’s roughly where late 2025 briefly landed before butter prices corrected again.
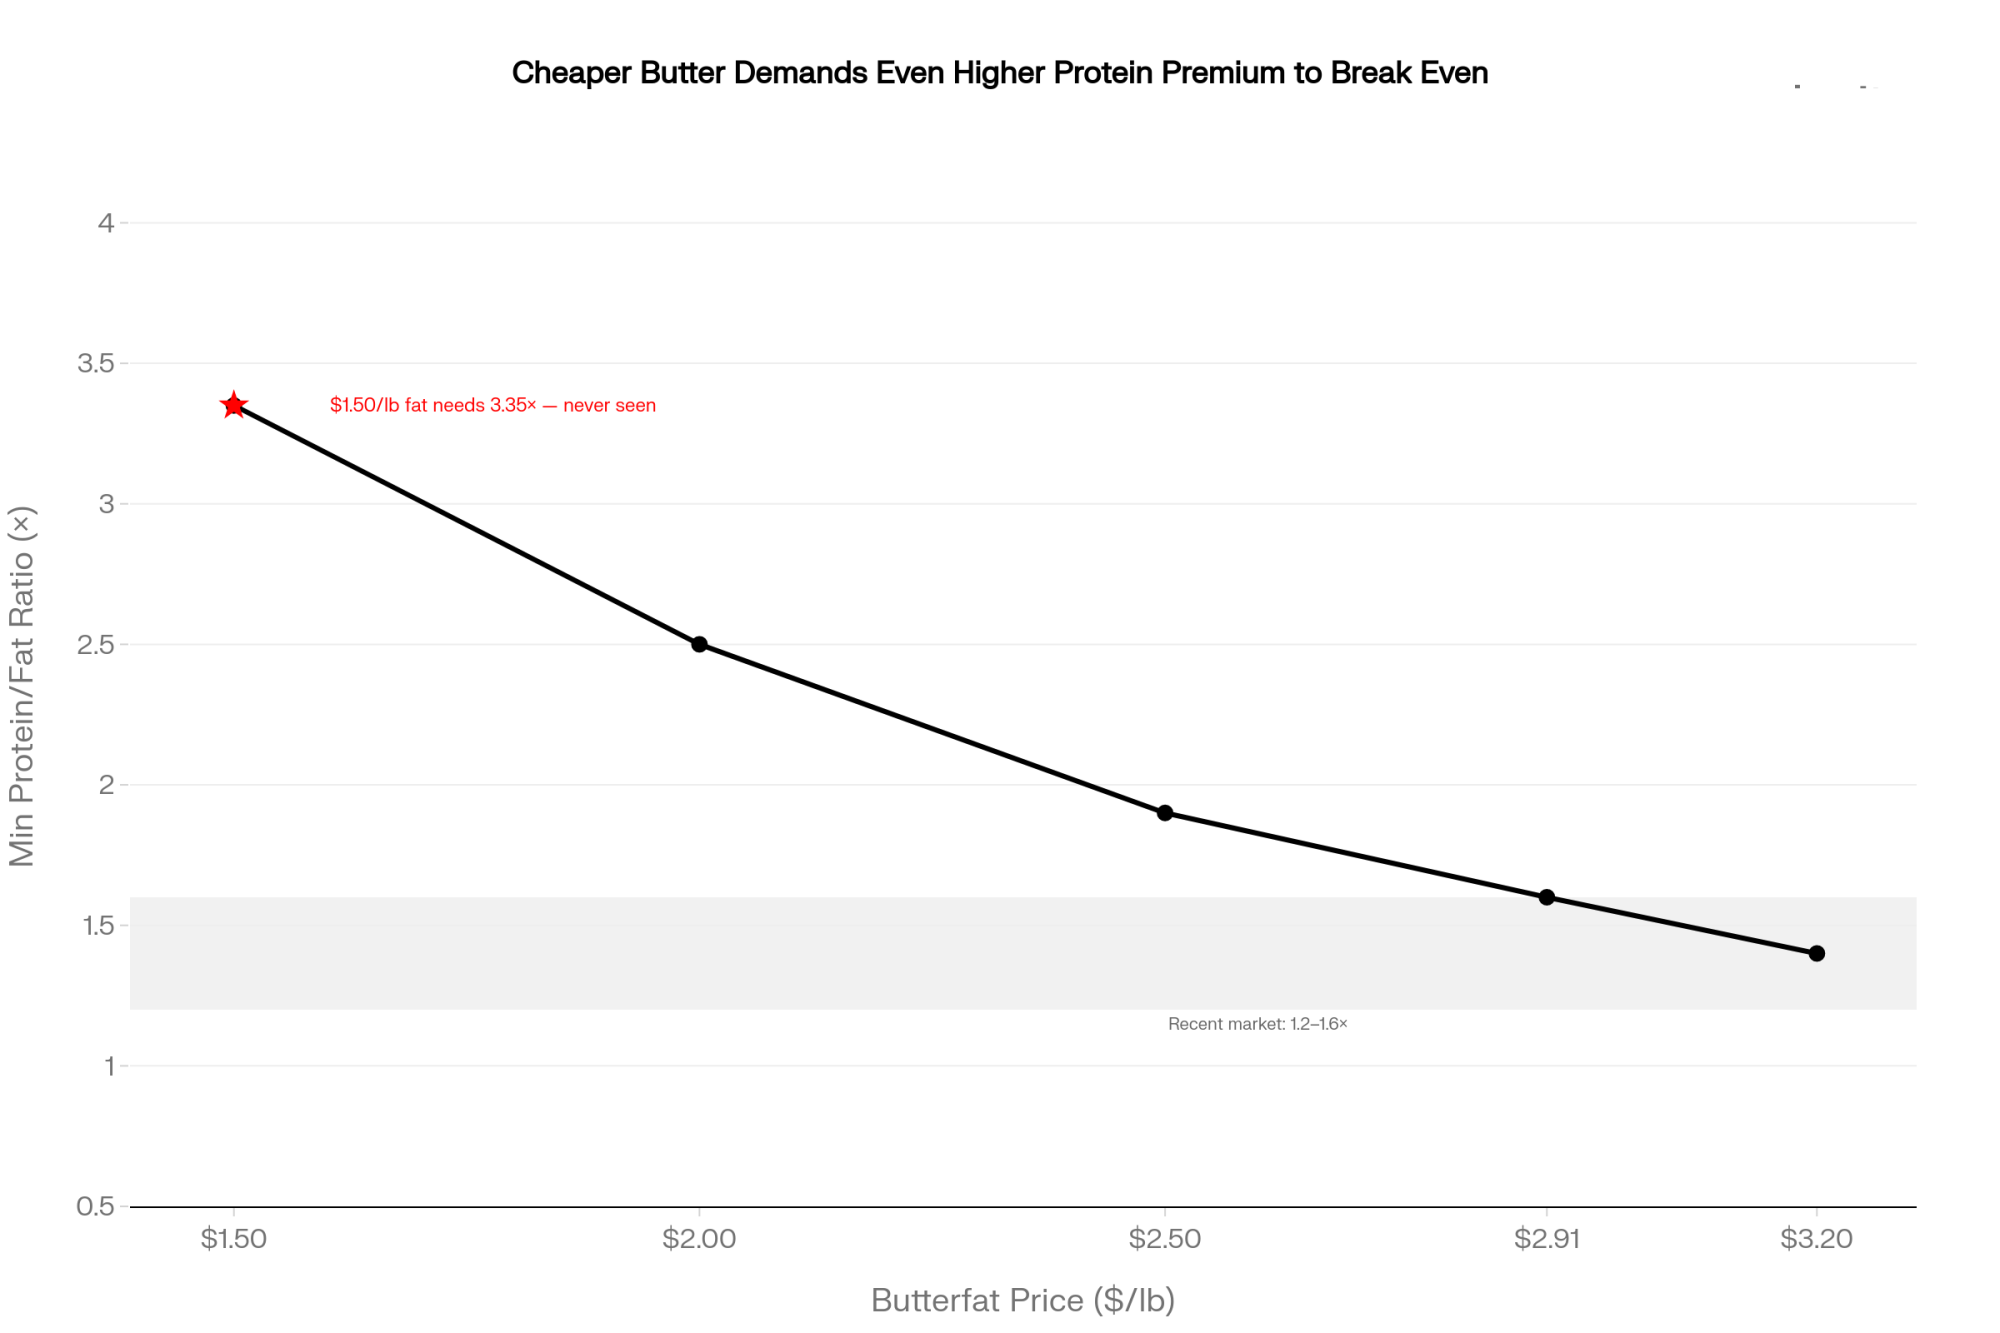
In recent Class III months, plenty of milk checks have put protein somewhere around 1.3–1.6× fat. At those ratios, under realistic feed costs, the dense‑component, lower‑volume herd either wins outright or stands so close that the extra risk and feed bill of chasing volume doesn’t look like a good trade.
Then they took one more step and ran both modeled herds through a simplified Van Slyke Cheddar yield formula.
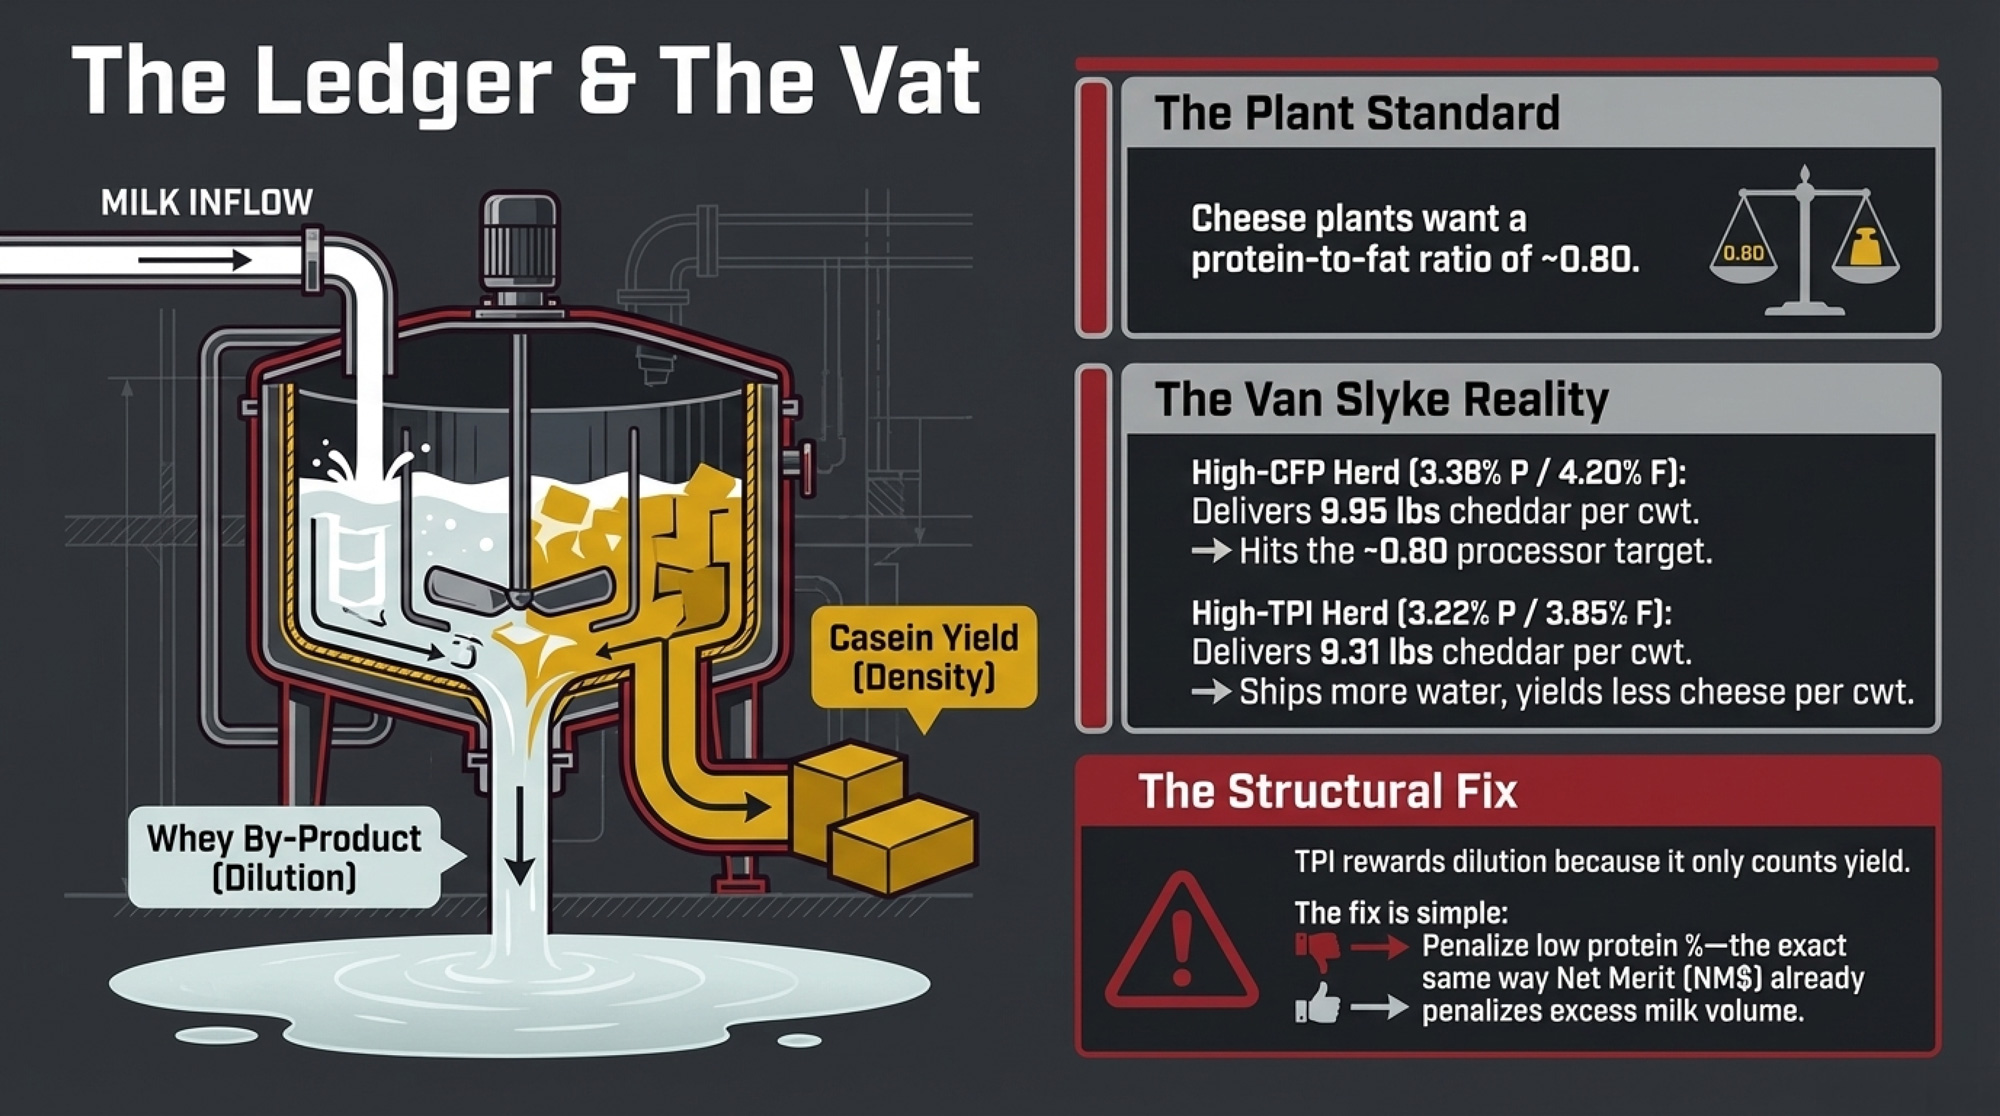
At 3.38% protein and 4.20% fat, the high‑CFP herd delivered roughly 9.95 lbs of Cheddar per cwt. At 3.22% protein and 3.85% fat, the high‑TPI‑protein herd came in closer to 9.31 lbs per cwt. That’s 0.64 lbs more cheese per cwt from the denser herd — with less milk to haul and process.
The high‑CFP herd’s protein‑to‑fat ratio — roughly 0.805 — sits right in the neighborhood of the ~0.80 ratio CoBank and others say US cheesemakers are still trying to achieve. The TPI‑protein herd isn’t delivering that. It’s delivering more tanker loads for less cheese per cwt.
“Processors Want Casein” — But Genetics Takes the Easy Path
Cheese plant managers aren’t asking for TPI points. They’re asking for casein, vat yield, and the right protein‑to‑fat ratio at the receiving bay.
Processors want two related things:
- Commodity cheese plants want milk that hits a protein‑to‑fat ratio around 0.80, so they get more cheese per cwt without excess fat to discount or dispose of.
- Ingredient plants making MPC, micellar casein, and high‑protein yogurts want a higher protein % because membrane and dryer efficiency depend on concentration.
None of them are saying, “Just send us more total protein pounds by shipping more milk.” They’re saying, “Send us richer milk.”
In Holstein USA’s published TPI formula, the production piece is driven by PTA Milk, PTA Fat (lbs), and PTA Protein (lbs). PTA Protein % is available on CDCB proofs, but it isn’t a weighted component in the core TPI calculation. That’s a design choice by Holstein USA and its advisors, but it means the index can only signal “more protein” through yield, not through richer milk.
The fix isn’t complicated. TPI could add a penalty for low protein % — the same way NM$ already applies negative economic value to excessive PTA Milk. A bull posting +40 protein lbs at 0.00% protein would take a hit; a bull posting +30 protein lbs at +0.04% would be rewarded. That single adjustment would push the formula away from rewarding dilution and toward rewarding concentration, without scrapping anything else in TPI’s structure. The mechanism exists. The math exists. Holstein USA already accepts this logic in other indexes. It just hasn’t been applied to the trait processors that they actually need.
Without that penalty, the genetic response tells you exactly where the selection pressure lands. In the three‑generation modeling example above, milk climbed by about 420 lbs per cow, protein yield improved by about 21 lbs, and protein % only crept up by about 0.012 percentage points. Almost all the “extra protein” came from extra volume, not richer milk. And because fat % and protein % don’t move in lockstep genetically, you can absolutely find high‑fat bulls sitting at flat or negative protein % — assuming one drags the other along is a correlation bet, not a genetic plan.
From a cheese plant’s point of view, that’s more milk to pump, pasteurize, and set for essentially the same casein density per cwt. A long way from the way cheese plants describe their ideal milk when they talk to producers and AI companies.
For herds shipping to fluid plants or on straight volume contracts without component premiums, that trade‑off looks different. TPI’s protein‑yield emphasis may still align with the revenue model in those systems. The analysis here is aimed squarely at cheese‑grid and component‑payment herds.
The Turn: When TPI Moves to the Back of the Stack
In meetings and kitchen‑table conversations this spring, you can hear a similar pattern from component‑grid herds in Idaho, Wisconsin, and across the Western US.
They’ve used TPI for years to build sire lists. They watched bulls jump or fall 200–300 TPI points in April off a formula change none of their cows had read. Immediately after those swings, several advisors started telling clients to stop letting TPI drive the bus.
That’s pushing a quiet shift in some breeding offices. Instead of throwing TPI away, some component‑grid herds we talk to are moving it to the back of the stack:
- Let CM$ or NM$ steer the bus. USDA ARS documentation on the 2021 and 2025 Net Merit revisions shows greater emphasis on fat and less on protein, and penalties for excessive milk volume through negative economic value on PTA Milk. Those indexes are built directly from economic values and explicitly treat extra volume as a cost.
- Use TPI as a filter, not the driver. Once a bull passes your CM
bar — and your own thresholds for health and type — his TPI rank matters a lot less than how he lines up with your milk check.
- Pull PTA Protein % on every “protein bull” you’re told to use. Big PTA Protein lbs paired with big PTA Milk and flat or negative PTA Protein % is a volume profile, not a casein profile, for cheese‑grid herds.
Your 30/90/365‑Day Playbook
You can’t fix FMMO pricing from your office. You can’t make Holstein USA rebuild TPI around protein % by next week. But you do decide which semen lands in your tank.
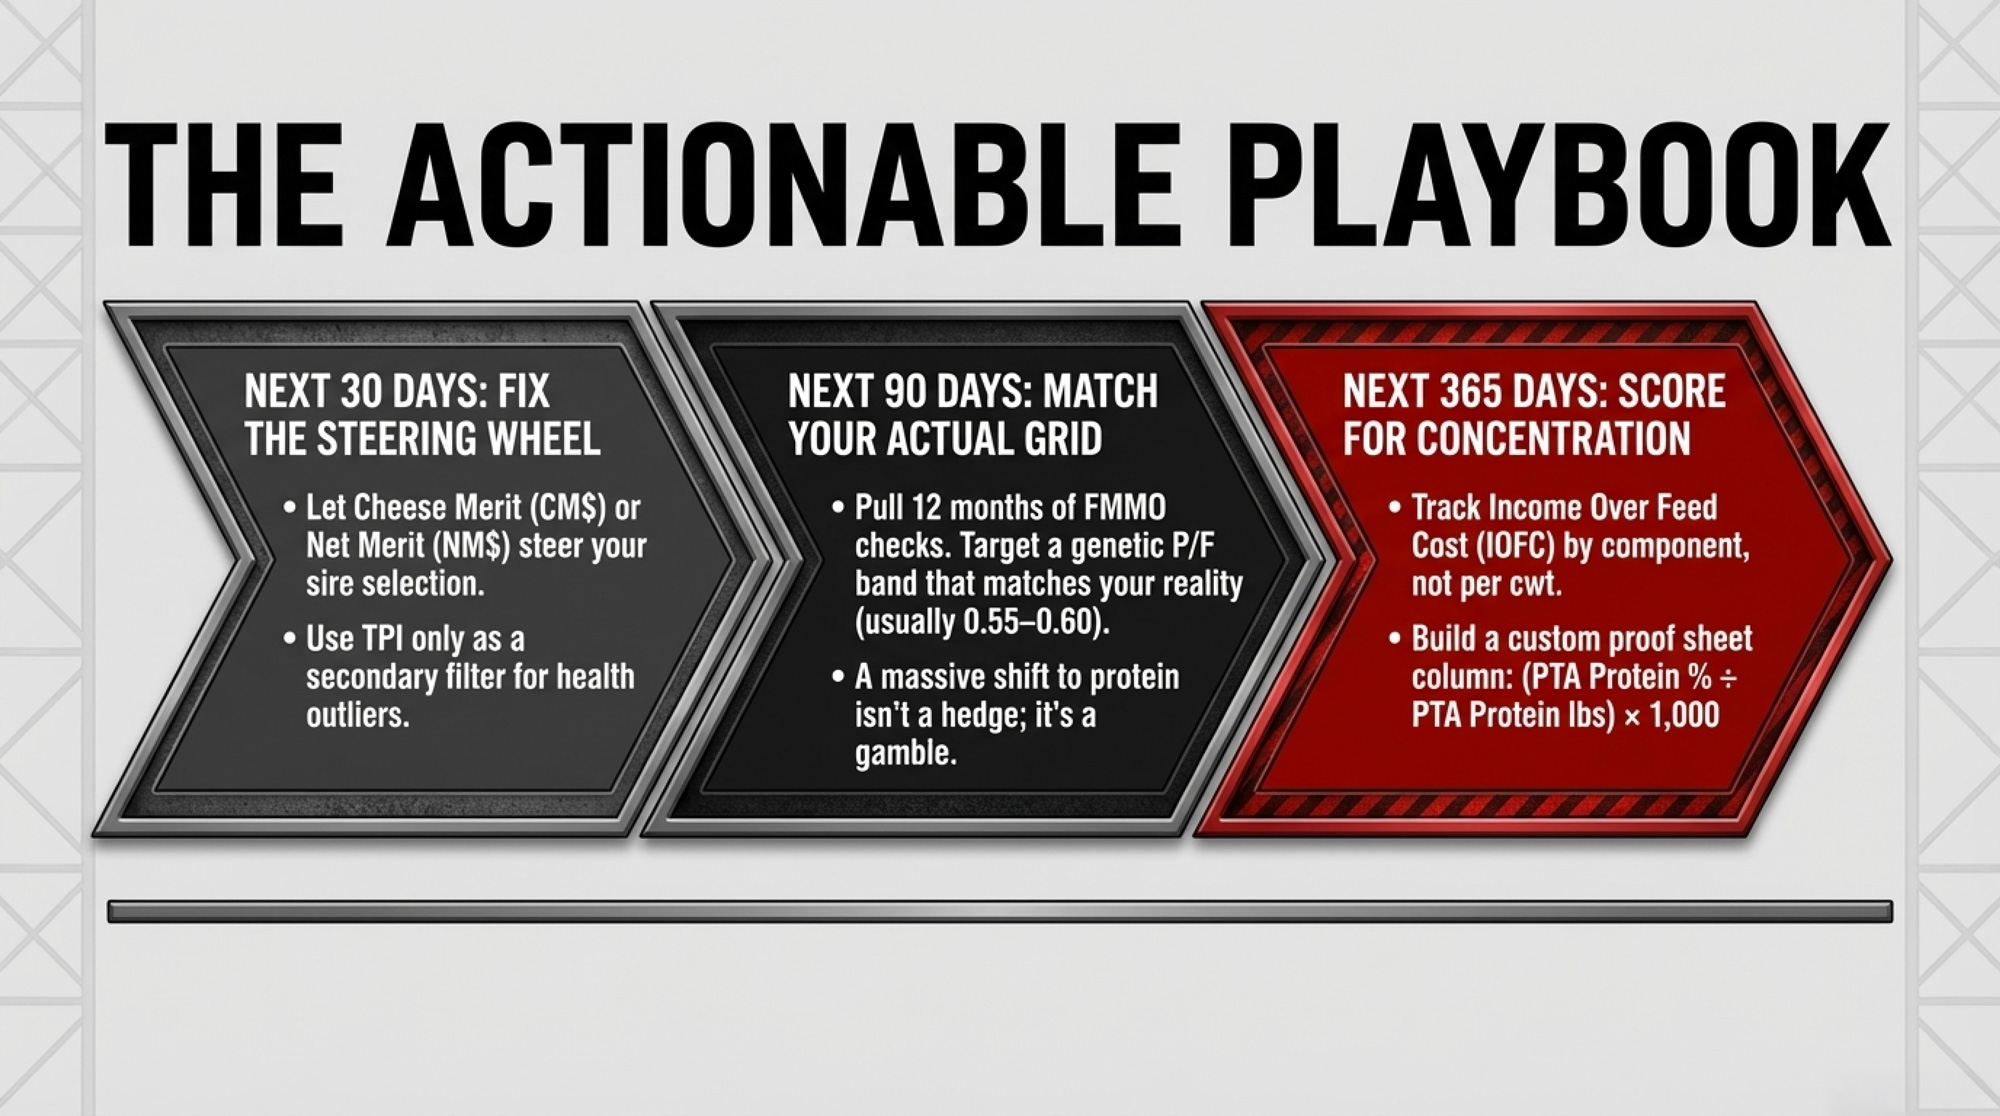
In the Next 30 Days: Fix the Steering Wheel
Before you finalize your spring order:
- Resort your bull list by CM$, not TPI. Ask your AI rep for their top CM$ bulls and start from there. Use TPI mostly to screen for structural issues or extreme health outliers.
- For every bull you’re serious about, pull four numbers: PTA Fat lbs, PTA Fat %, PTA Protein lbs, PTA Protein %.
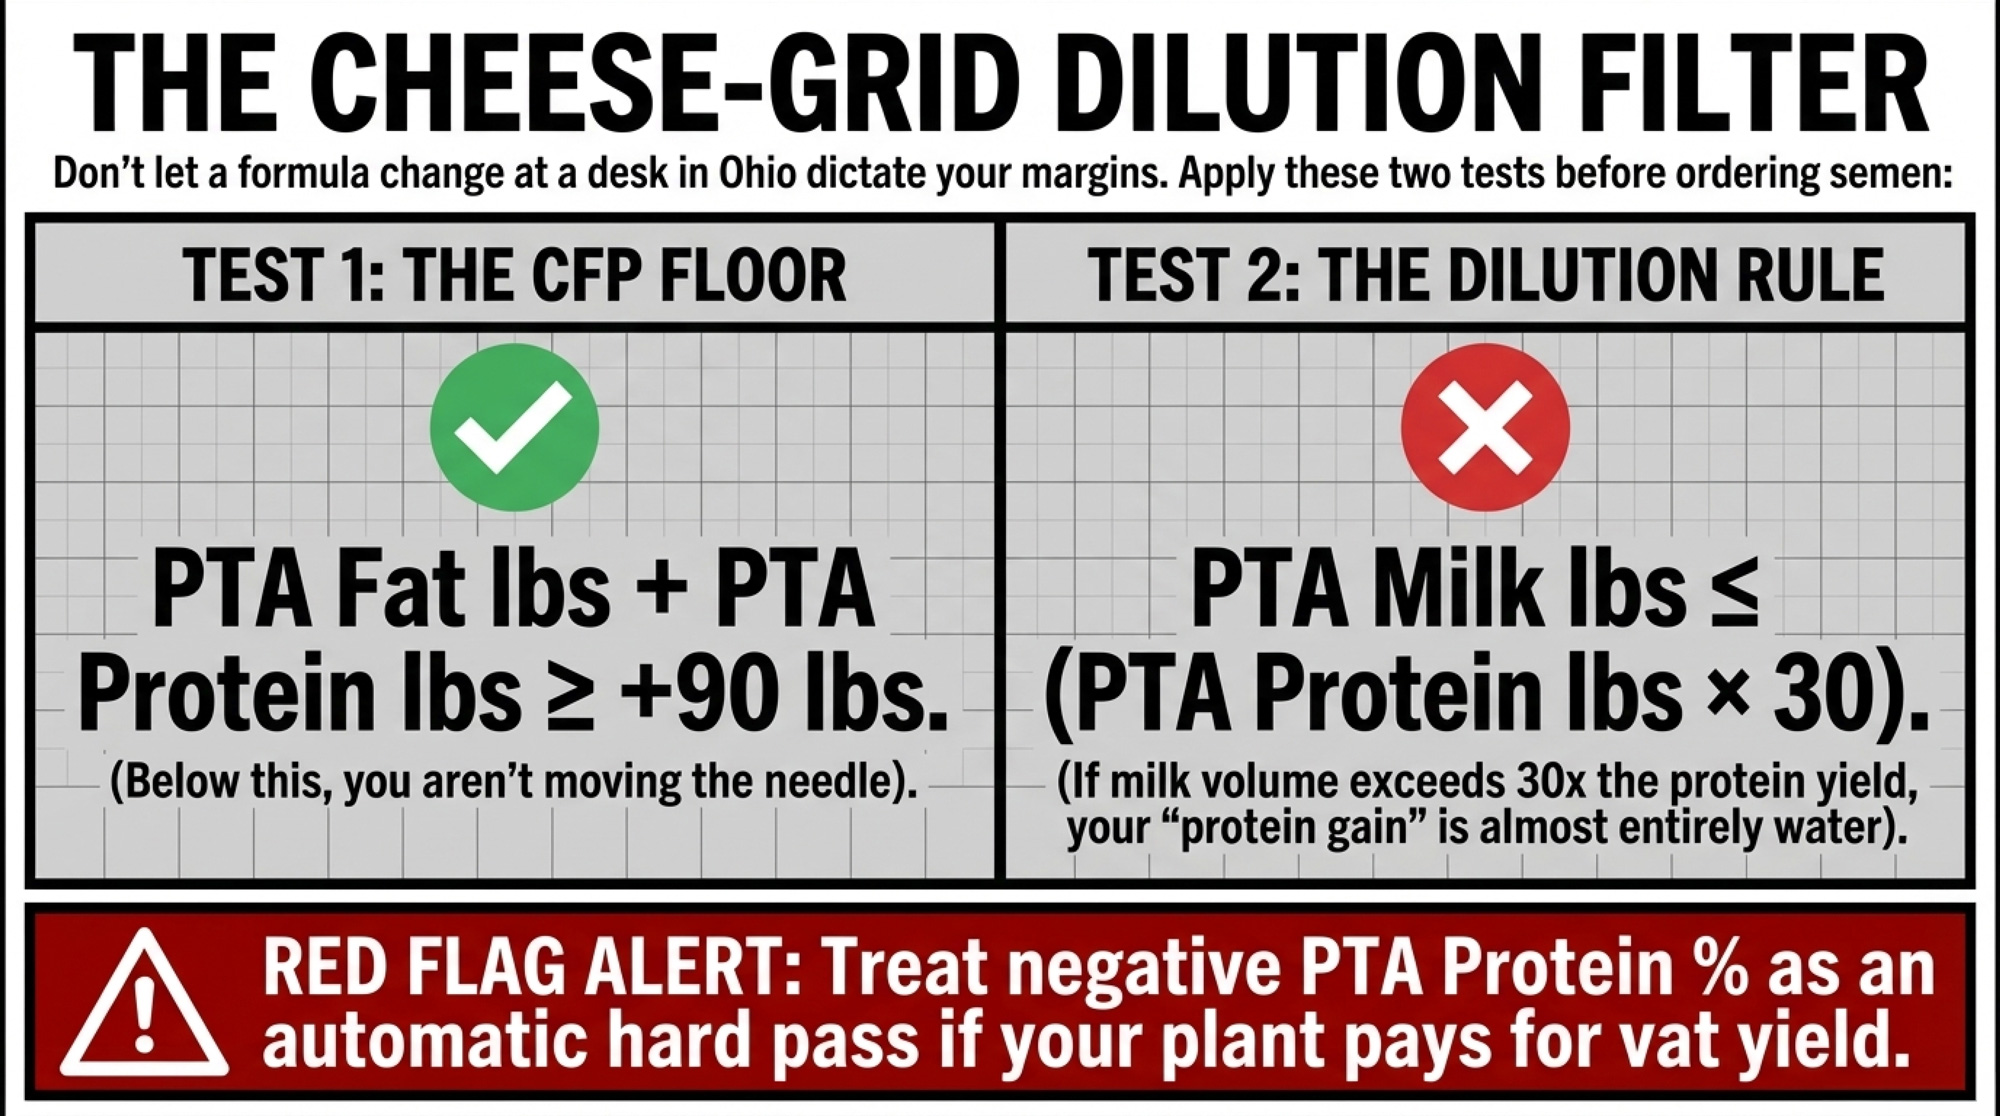
- Apply two simple dilution filters if you’re on a cheese grid:
- CFP floor: PTA Fat lbs + PTA Protein lbs ≥ +90 lbs combined. Below that, you’re not moving components enough to make a difference.
- Dilution test: PTA Milk lbs ≤ PTA Protein lbs × 30. Around 3.2% protein, anything above that says almost all the “protein gain” is just more milk.
- Treat negative PTA Protein % as a hard flag if vat yield per cwt matters to your plant. Those bulls are diluting your cheese per cwt, no matter how strong their protein‑lbs number looks.
- Ask Holstein USA the uncomfortable question: If NM$ already penalizes excessive milk volume, why doesn’t TPI penalize low protein %? The mechanism exists. The math exists. The only thing missing is the decision.
A bull with +40 lbs protein, +1,400 lbs milk, and 0.00% protein % is a volume sire in a protein costume. A bull with +30 lbs protein, +0.04% protein %, and only +200–600 lbs milk is actually improving concentration.
In the Next 90 Days: Line Up Genetics With Your Actual P/F Price
- Pull 12 months of component prices from your milk checks. Don’t guess. What’s your actual protein‑to‑fat price ratio? In many recent Class III months, that’s been somewhere around 1.3–1.6×.
- Set a genetic P/F band that matches your grid:
- If fat clearly leads and protein is discounted, target a 0.50–0.55 genetic P/F band in your sire group.
- If protein has been within about 20% of fat, slide to 0.55–0.60 as a sensible hedge.
- If protein is consistently ahead in your region and contract, you can justify 0.58–0.65 — but no more without a written premium.
- Audit your current sire stack. If the average P/F profile pushes above 0.65 while your check shows protein at roughly 1.3–1.6× fat, that’s less a hedge and more a bet on 2–3× protein.
Over the Next 365 Days: Push Where the Index Won’t
- Build a simple Concentration Score into your proof sheets. One option: (PTA Protein % ÷ PTA Protein lbs) × 1,000. Within your CM$‑screened list, give at least half your matings to bulls in the stronger half of that score if you ship to cheese or ingredients.
- Start a protein‑concentration conversation with your plant. Ask your field rep directly: “If I consistently deliver higher protein %, is there room in this grid or in over‑order premiums?” Canadian P5 boards have already moved toward pricing structures that reward solids‑to‑fat ratios with explicit incentives — a November 2025 policy update shows tier‑2 protein in the P5 SNF/BF payment policy paid at the monthly Class 4a price plus $3.00/kg, effective January 1, 2026. That’s a direct premium for concentration.
- Track income over feed cost (IOFC) by component, not just per cwt. If your supposed “high‑protein” cows only look good because they pump out more volume — not because they deliver more margin per lb of fat and protein at today’s prices — your own ledger is telling you the breeding plan is off.
What This Means for Your Operation
- Stop letting TPI 2026 steer if you’re on a component grid. Put CM$ or NM$ in the driver’s seat and treat TPI as a filter. That move alone lines your genetics up more closely with how USDA economics actually value fat and protein today.
- Don’t confuse protein pounds with protein percent — or with casein. Big PTA Protein lbs plus big PTA Milk and flat/negative PTA Protein % means you’re mostly breeding for more whey in more milk, not more casein per cwt. If your plant pays for cheese yield per cwt, that’s the wrong direction.
- Don’t assume fat % selection fixes your protein %. The genetic correlation between fat percent and protein percent is at most moderate. High‑fat bulls with flat or negative protein % are everywhere. If you want concentration, you have to select for it directly — not hope it arrives on the back of another trait.
- Run your own break‑even, not the catalog’s. Take your marginal feed cost and your actual component prices. If your plan only looks smart when protein is 2–3× as much as fat, you’re relying on a price relationship that your own checks haven’t shown you.
- Set P/F targets off your grid, not off headlines. A small shift toward protein is a hedge. A big shift is a bet on a 3× world that Class III data and co‑product logic don’t support.
- Pick one bull you planned to use heavily and pull his PTA Protein %, PTA Milk, and PTA Fat %. Is the cow he sires richer, or just louder? If the answer is “louder,” fix your list before you lock in another breeding season.
Key Takeaways
- If your breeding plan only pays off when protein hits 3× fat, you’re not hedging — you’re running a long‑shot bet that 25 years of USDA Class III data don’t support.
- TPI 2026’s higher protein weight mostly comes from more milk, not richer, casein‑dense milk. That means more feed, more trucking, and more processing per pound of casein — the opposite of what cheese plants are asking for.
- Fat % and protein % don’t move in lockstep. Assuming fat selection drags protein concentration along is a correlation bet, not a genetic plan. If you want protein %, select for it — TPI doesn’t, but you can.
- The fix at the index level is simple: penalize low protein % the same way NM$ penalizes excess volume.Until Holstein USA makes that change, component‑grid herds need to screen for it themselves.
- Your most honest signal isn’t the next proof run — it’s your IOFC by component. If your “high‑protein” cows don’t deliver more margin per lb of fat and protein at today’s prices, your proofs and your milk check are telling two different stories.
One Question Before You Order Semen
You can’t control what Holstein USA does with TPI or what USDA does with Class III formulas.
But you do control which proofs end up on your short list and which heifers stay in your string. Before you sign that next semen order, lay your proof sheets beside your most recent component check and ask one straight question:
At your marginal feed cost and your actual fat and protein prices, are your “high‑protein” cows really earning more per pound of component — or just more per cow?
The AI companies and index committees want you to buy the “Protein Revolution.” Your milk check is asking for a “Component Reality Check.” Don’t let a formula change at a desk in Ohio dictate whether your stalls are profitable in 2028 — your own numbers should do that.
Complete references and supporting documentation are available upon request by contacting the editorial team at editor@thebullvine.com.
Learn More
- Super Bowl LX and the $869-Per-Cow Sire Gap: The Breeding Strategy Your Dairy Can’t Ignore – Gain a field-tested game plan to capture an $869 per-cow profit advantage. This guide arms you with a one-page sire scorecard and four-slot roster strategy to slash maintenance costs and boost long-term durability.
- Breeding Into a Moving Market: What Butterfat’s Crash Reveals About Dairy’s Genetic Timing Problem – Build a flexible breeding hedge that protects your margins against volatile component price reversals before they hit. This strategic analysis exposes the 5-7 year “timing trap” where genetic decisions outlast five-month market cycles.
- U.S. Dairy Genetic Evaluations Set for Historic Reset in April 2025 – Secure a massive early-adopter advantage by positioning your genetic pipeline for sustainability-driven premiums. This deep dive breaks down the historic 2025 reset and reveals the 2028 roadmap for microbiome and methane indexes.
 The Sunday Read Dairy Professionals Don’t Skip.
 The Sunday Read Dairy Professionals Don’t Skip.
Every week, thousands of producers, breeders, and industry insiders open Bullvine Weekly for genetics insights, market shifts, and profit strategies they won’t find anywhere else. One email. Five minutes. Smarter decisions all week.