










USDA’s bringing 236.6 billion pounds of milk to market while more than 5.8 million of your best dairy customers disappear from SNAP — and almost nobody is running that math.
Executive Summary: USDA’s forecasting a record 236.6 billion pounds of milk in 2026 — right as more than 5.8 million people have dropped off SNAP since January 2025, gutting one of the biggest buyers of basic dairy in the country. That matters because SNAP households over-index on fluid milk and make up roughly a third of U.S. grocery sales, so when their benefits get cut, the demand hit lands squarely in the low-margin, high-volume staples you ship. Washington’s calling it a fraud crackdown, but the math doesn’t hold — 41,476 fraud disqualifications can’t explain 5.8 million people gone, which means this is structural demand loss, not housekeeping. Hoard’s pegged a 28% SNAP cut at roughly a 0.8% dairy-demand hit — sounds like a rounding error until it stacks on record supply and $20.00/cwt all-milk. On a 500-cow herd, even a 50¢/cwt demand-driven softening runs about $73,000 off the top in a year, and the exposure isn’t even — Arizona shed 43% of its caseload and Florida lost nearly 300,000 recipients, so Sunbelt fluid shippers are standing closest to the fire. If you’re budgeting 2027–2028 on a stable domestic floor, this is your cue to price a DRP quarter now and ask your co-op exactly where your milk lands.
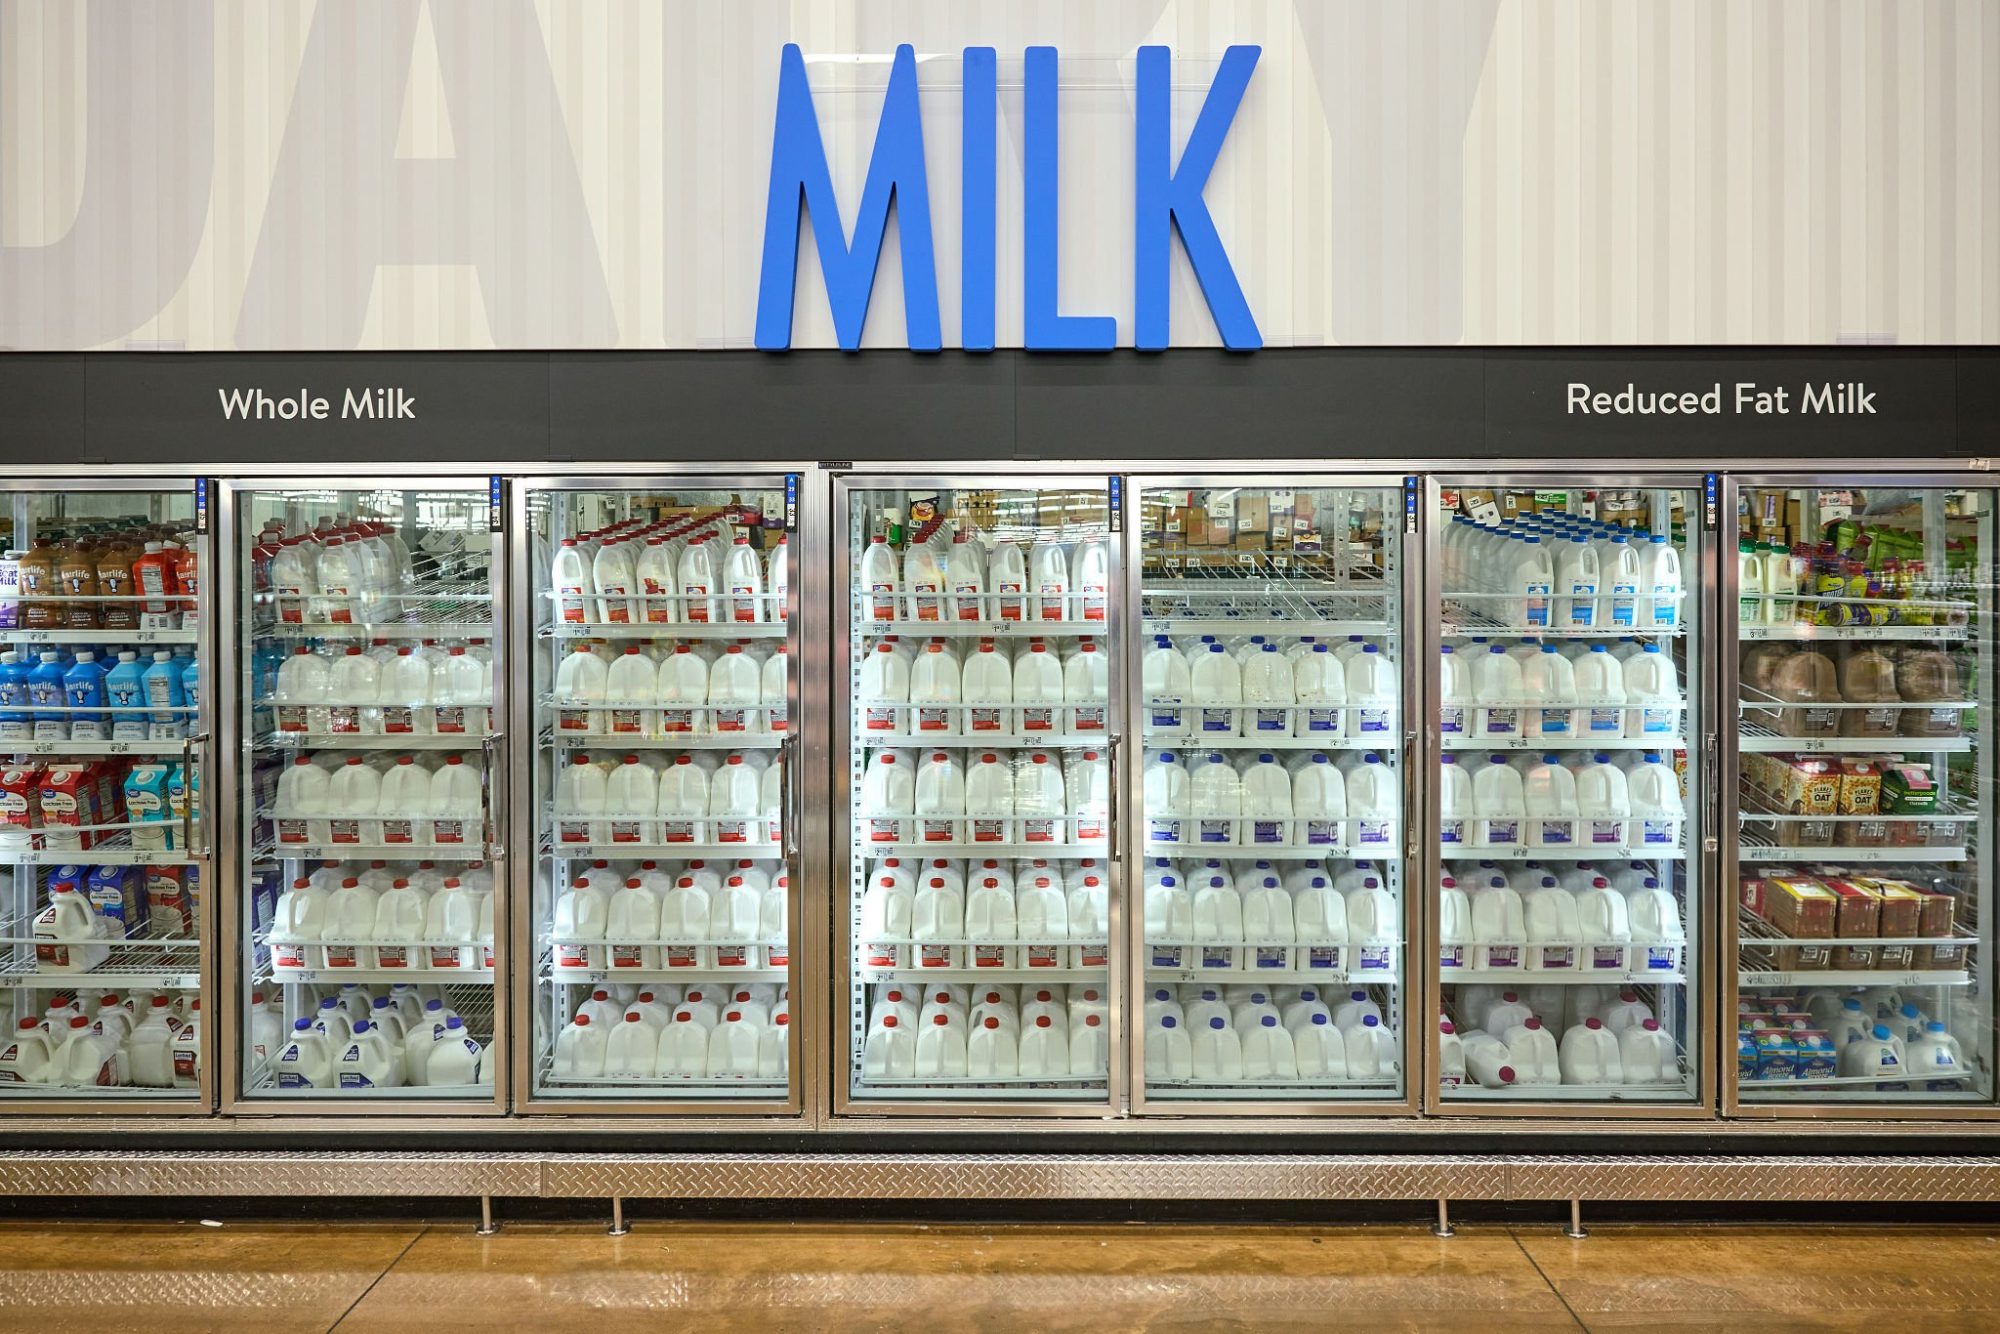
Editor’s note: The 500-cow Phoenix-corridor operation described below is a composite scenario modeled from multiple Sunbelt fluid-market dairies, not a single named farm. Every market, policy, and financial figure in this article is real and sourced.
Picture a composite 500-cow dairy shipping into the Phoenix retail corridor — a stand-in for the Sunbelt fluid-market operations facing this squeeze. Nothing’s changed in the barn — same cows, same components, same trucks rolling out at dawn. But in the stores that move that milk, something’s shifting under the surface. Arizona’s SNAP caseload fell 43% in a single year — the steepest state-level drop in the country after the new federal rules took hold — and the corner grocers in lower-income ZIP codes felt it first. That kind of operation won’t ever see a line item called “SNAP” on its milk check. It’ll just see a domestic floor that isn’t holding the way it used to — and by the time it does, the price path is already set.
That’s the story dairy hasn’t been telling itself. SNAP — the program most of us still call food stamps — has quietly been one of the biggest buyers of basic dairy in the country. And right now it’s contracting hard, at the exact moment USDA is forecasting a wall of milk. Record supply. Softening prices. A demand floor with a crack in it. Three arrows, all pointing the same way.
What’s Changing and Why
Start with the supply side, because that part isn’t in dispute. USDA’s Economic Research Service pegs 2026 U.S. milk production at 236.6 billion pounds, climbing to 238.1 billion in 2027. More cows, more milk per cow, low cull rates — this is a deliberate expansion, not an accident. And more milk means softer prices. As of its July 2026 outlook, ERS put the 2026 all-milk forecast at $20.00/cwt — 70 cents below its prior estimate — with cheese expected to “overhang the market this year and next.”
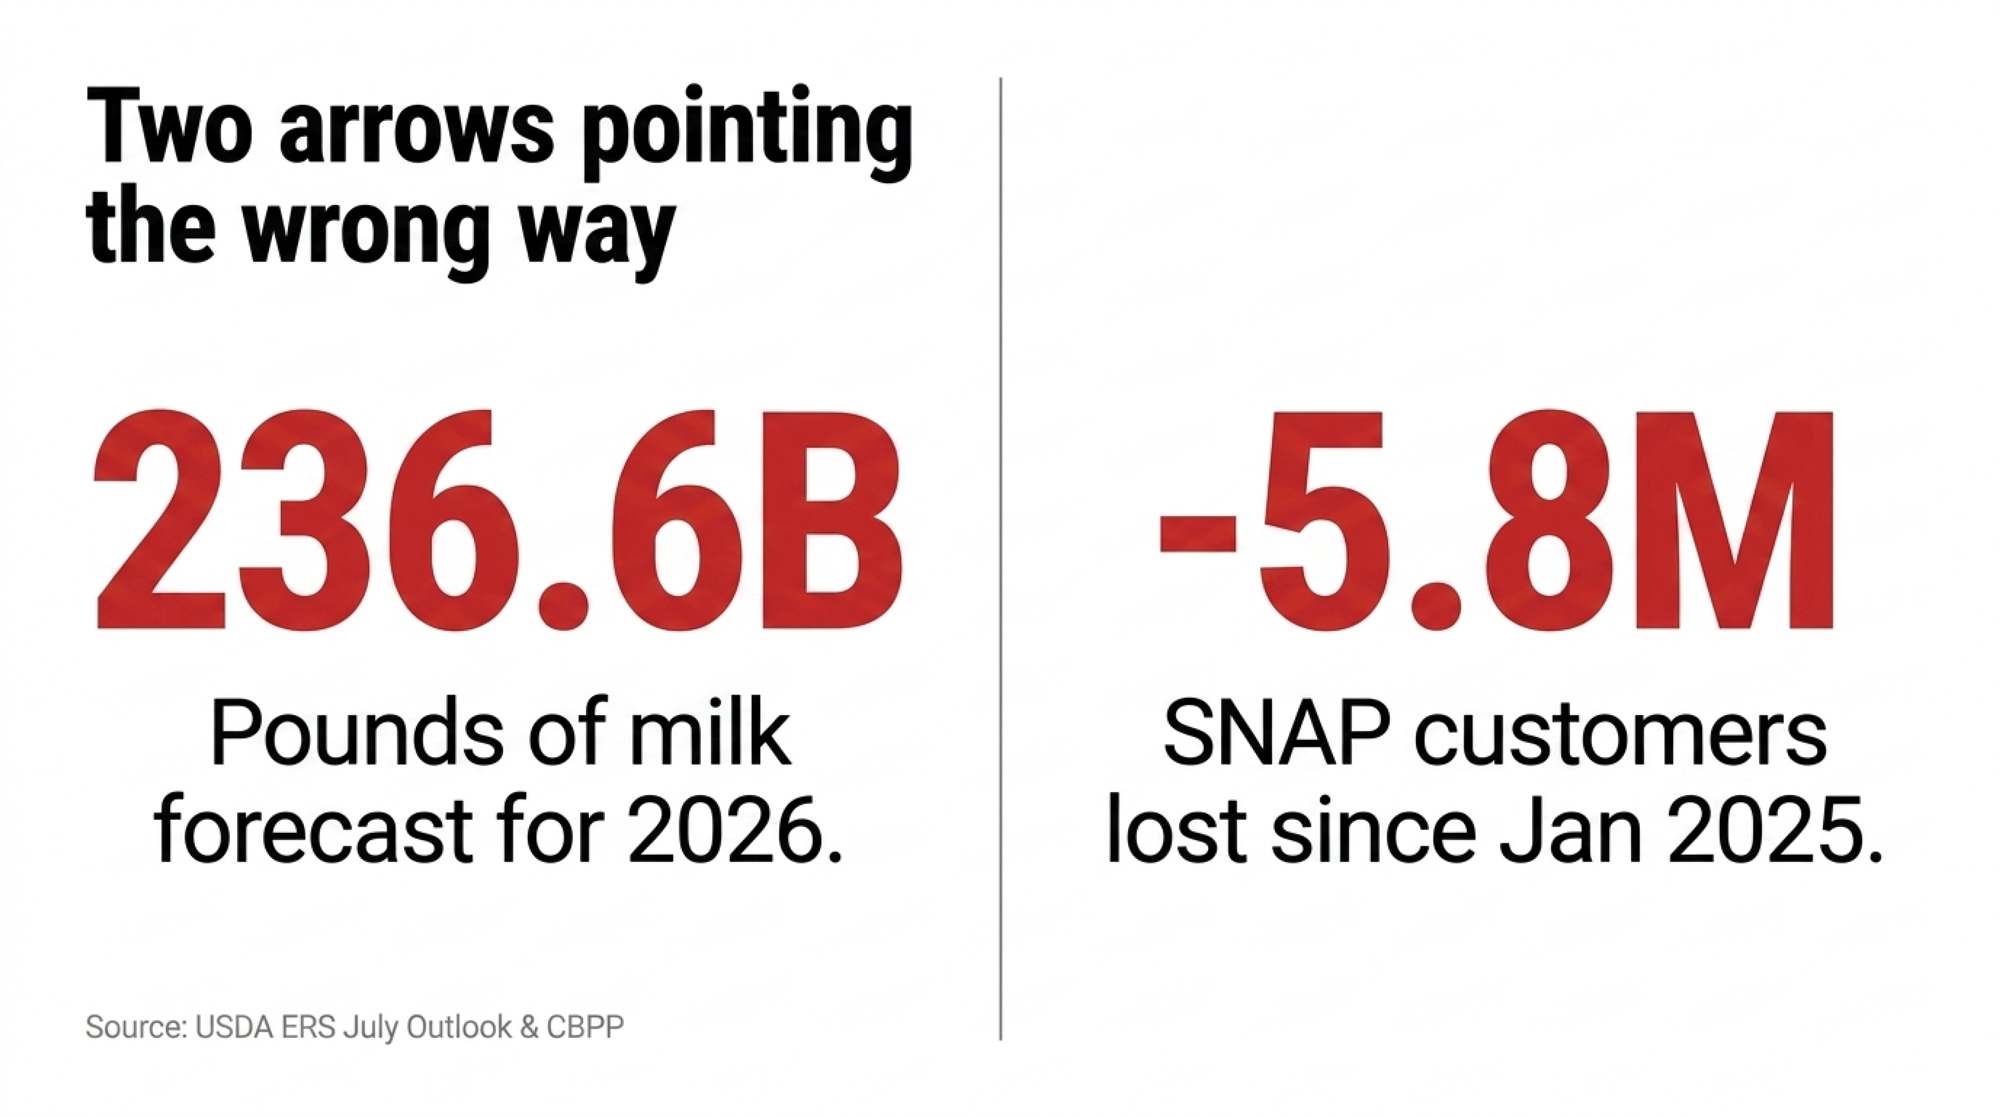
Now the part almost nobody in dairy has priced in. SNAP participation dropped from roughly 42.8 million people in January 2025 to 37,011,096 by April 2026 — a fall of more than 5.8 million people. Most of that came after July 2025, when the reconciliation law (H.R. 1, the “One Big Beautiful Bill Act”) kicked in. The Center on Budget and Policy Priorities found March 2026 participation already sitting 4.7 million below the fiscal 2025 average — bigger than the Congressional Budget Office’s own forecast.
Here’s why that lands on dairy in particular. SNAP households make up about a third of U.S. retail grocery sales, and roughly 70% of SNAP dollars go to food and beverages. They spend 23–26% more per year on packaged food and drink than non-SNAP households, and USDA data show they buy more fluid milk — partly because they’ve got more kids at the table. Milk sits dead center in the SNAP staple basket. When that basket shrinks, dairy’s standing in the blast radius.
How This Plays Out on Real Farms
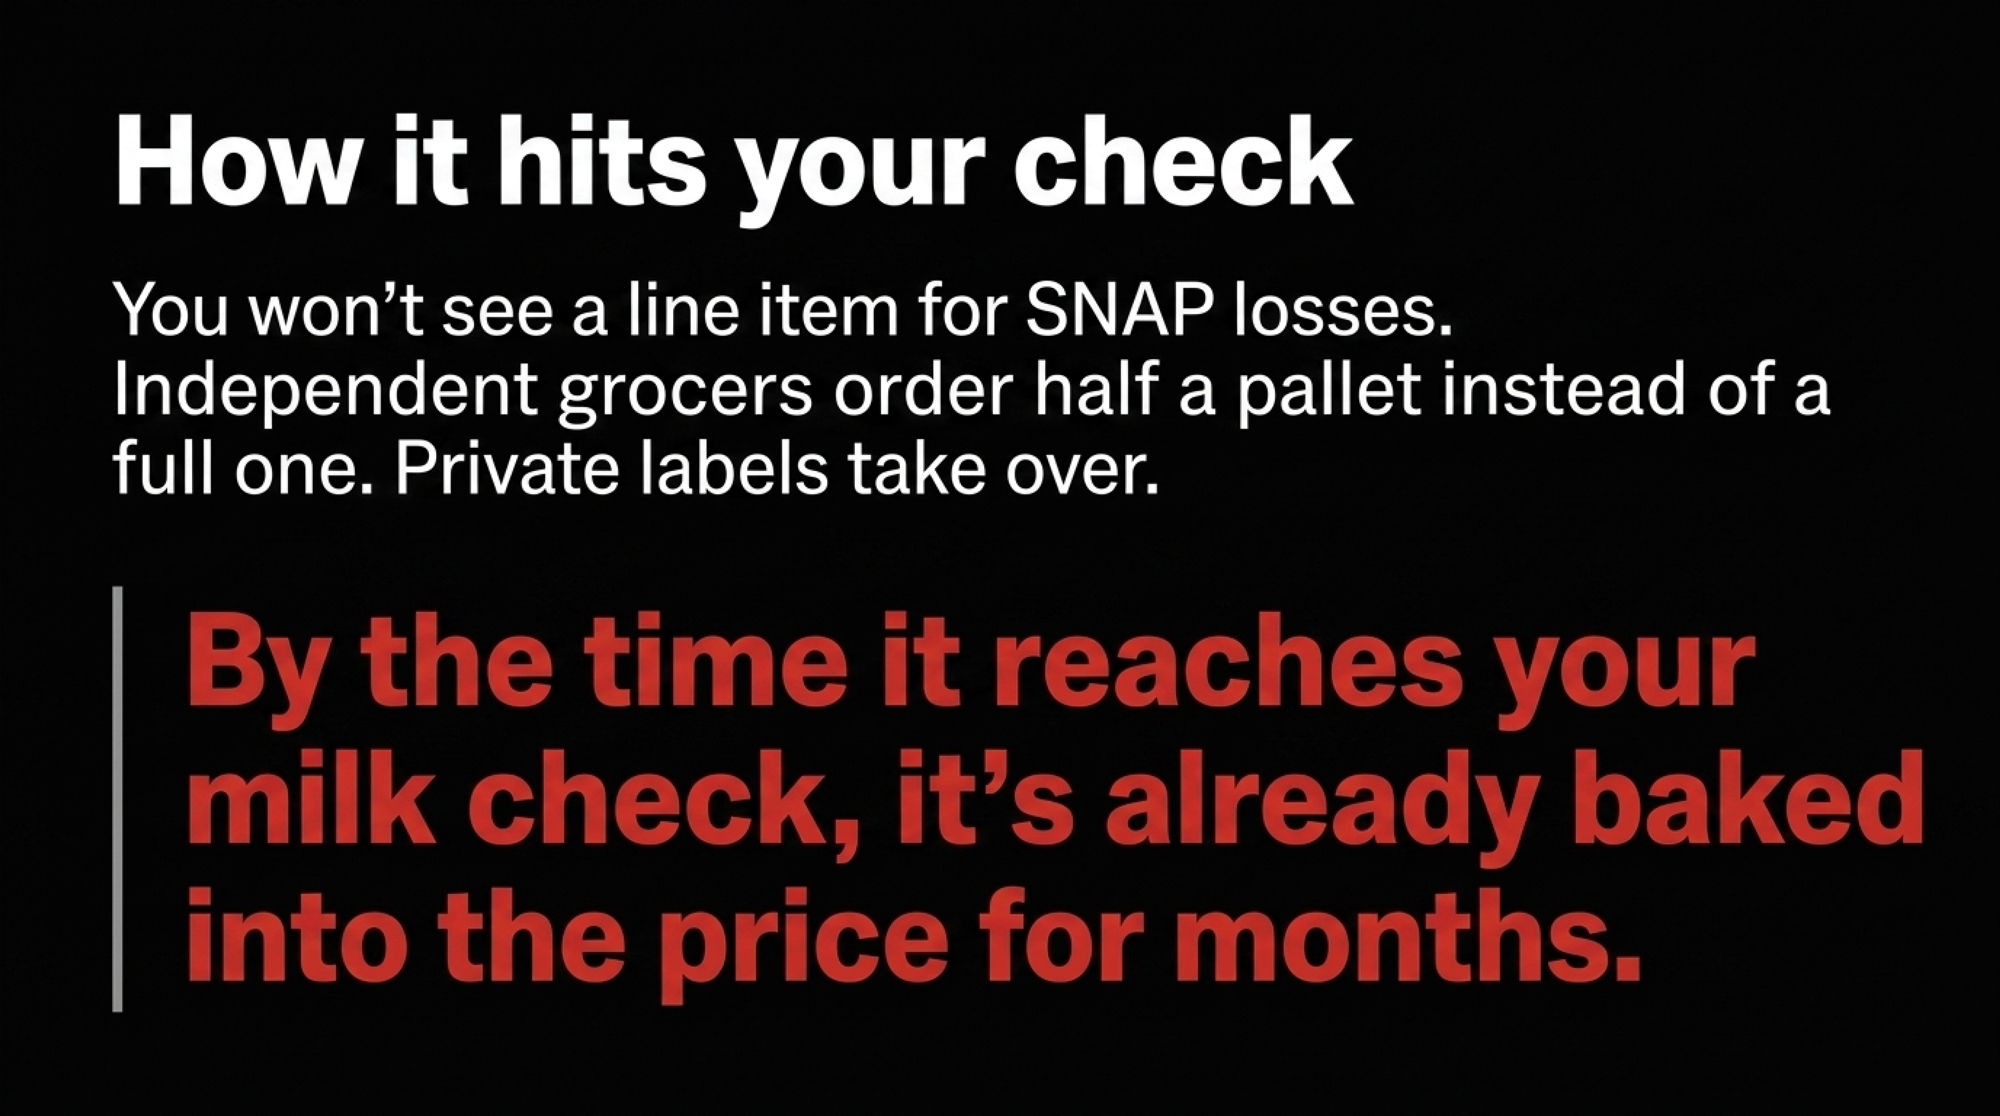
The uncomfortable part is that this arrow doesn’t hit like a bad futures print. It hits slow. First, a retail partner mentions SNAP weeks are running flatter. Then private-label picks up more of the shelf. Then the independent grocer who used to move a pallet of gallons a week moves half — and nobody sends you a memo about it. By the time it reaches your milk check, it’s already baked into the price for months.
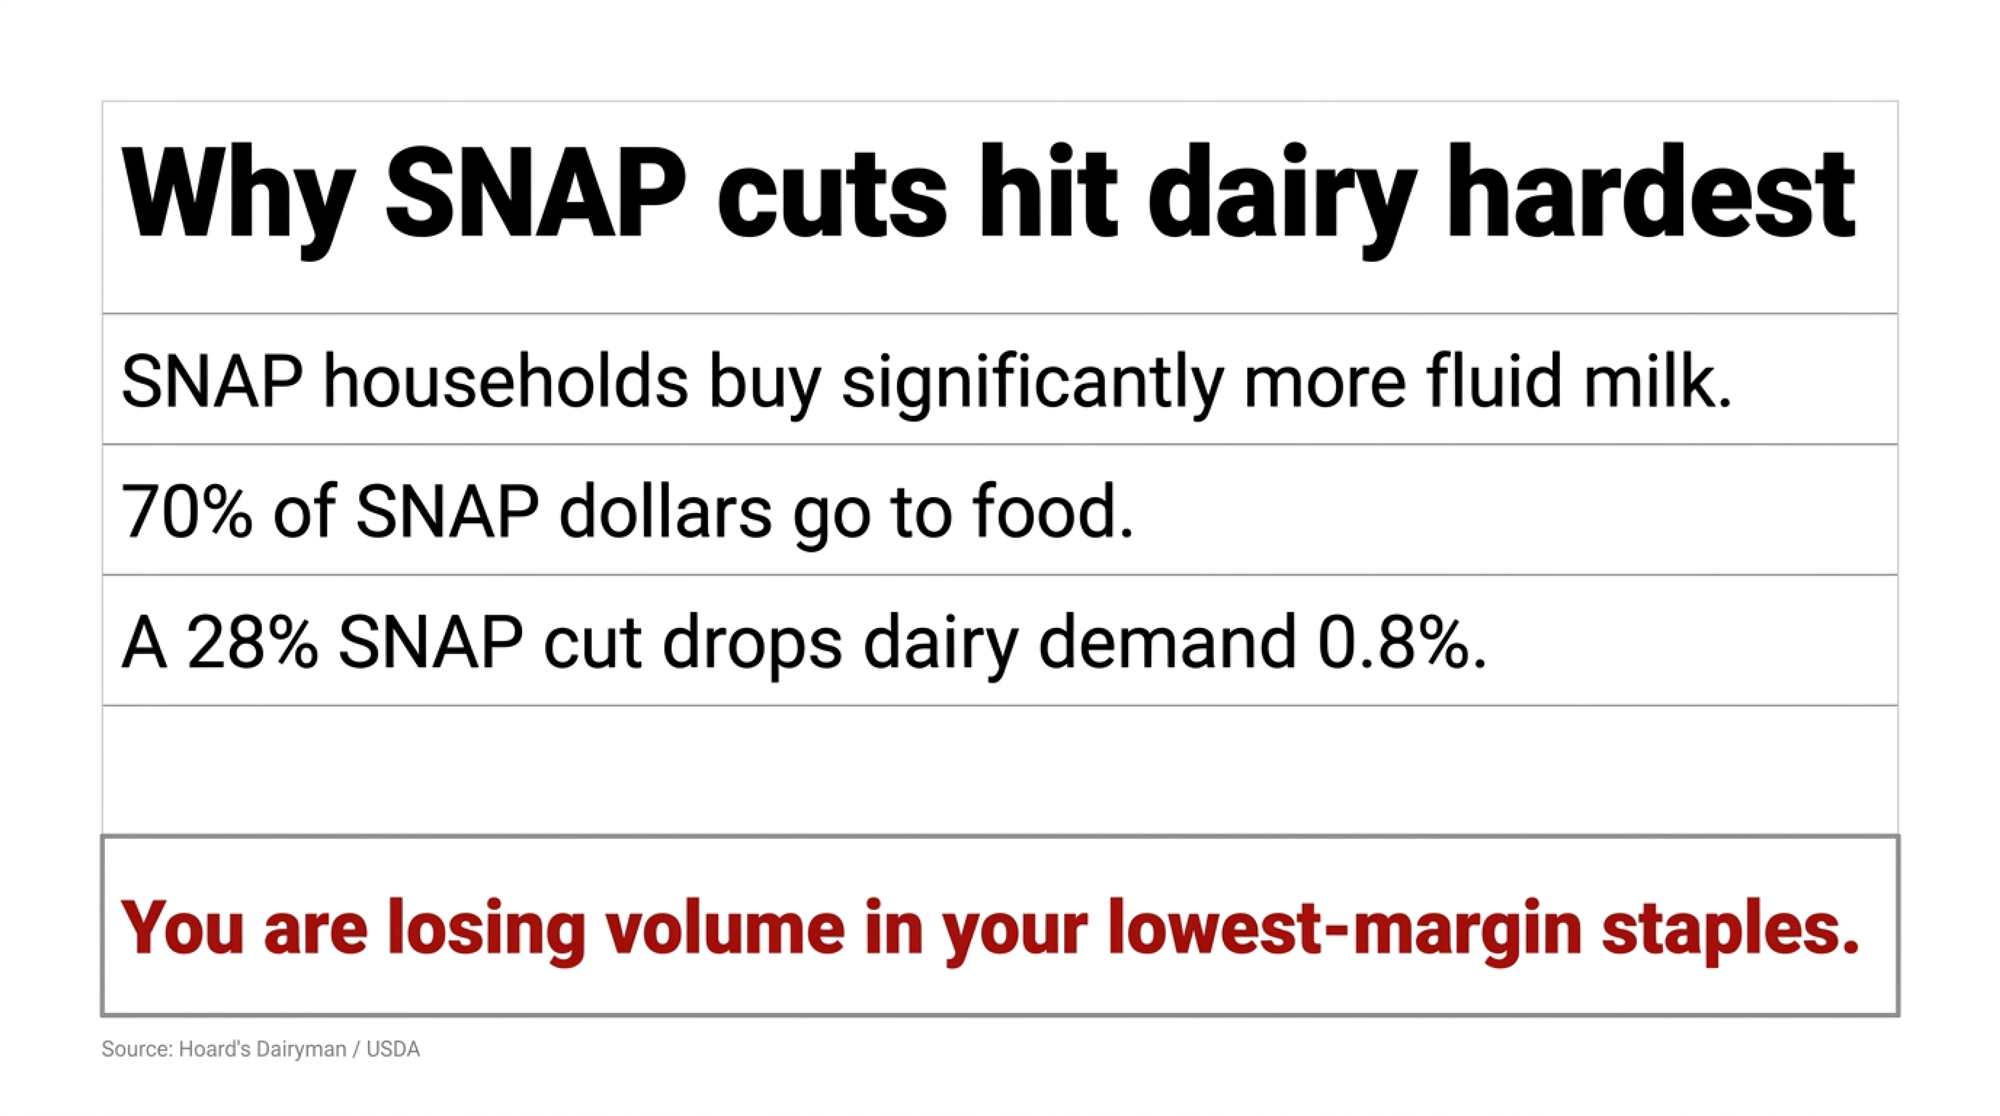
So how big is the hit, honestly? Nobody has a cleanly measured number yet, and you should be wary of anyone who claims they do. But Hoard’s Dairyman ran the math back in June 2025: using SNAP’s share of at-home food spending, they estimated a 28% cut in benefits would trim total U.S. dairy demand by about 0.8%. Sounds like a rounding error. It isn’t — not when it lands on top of record supply.
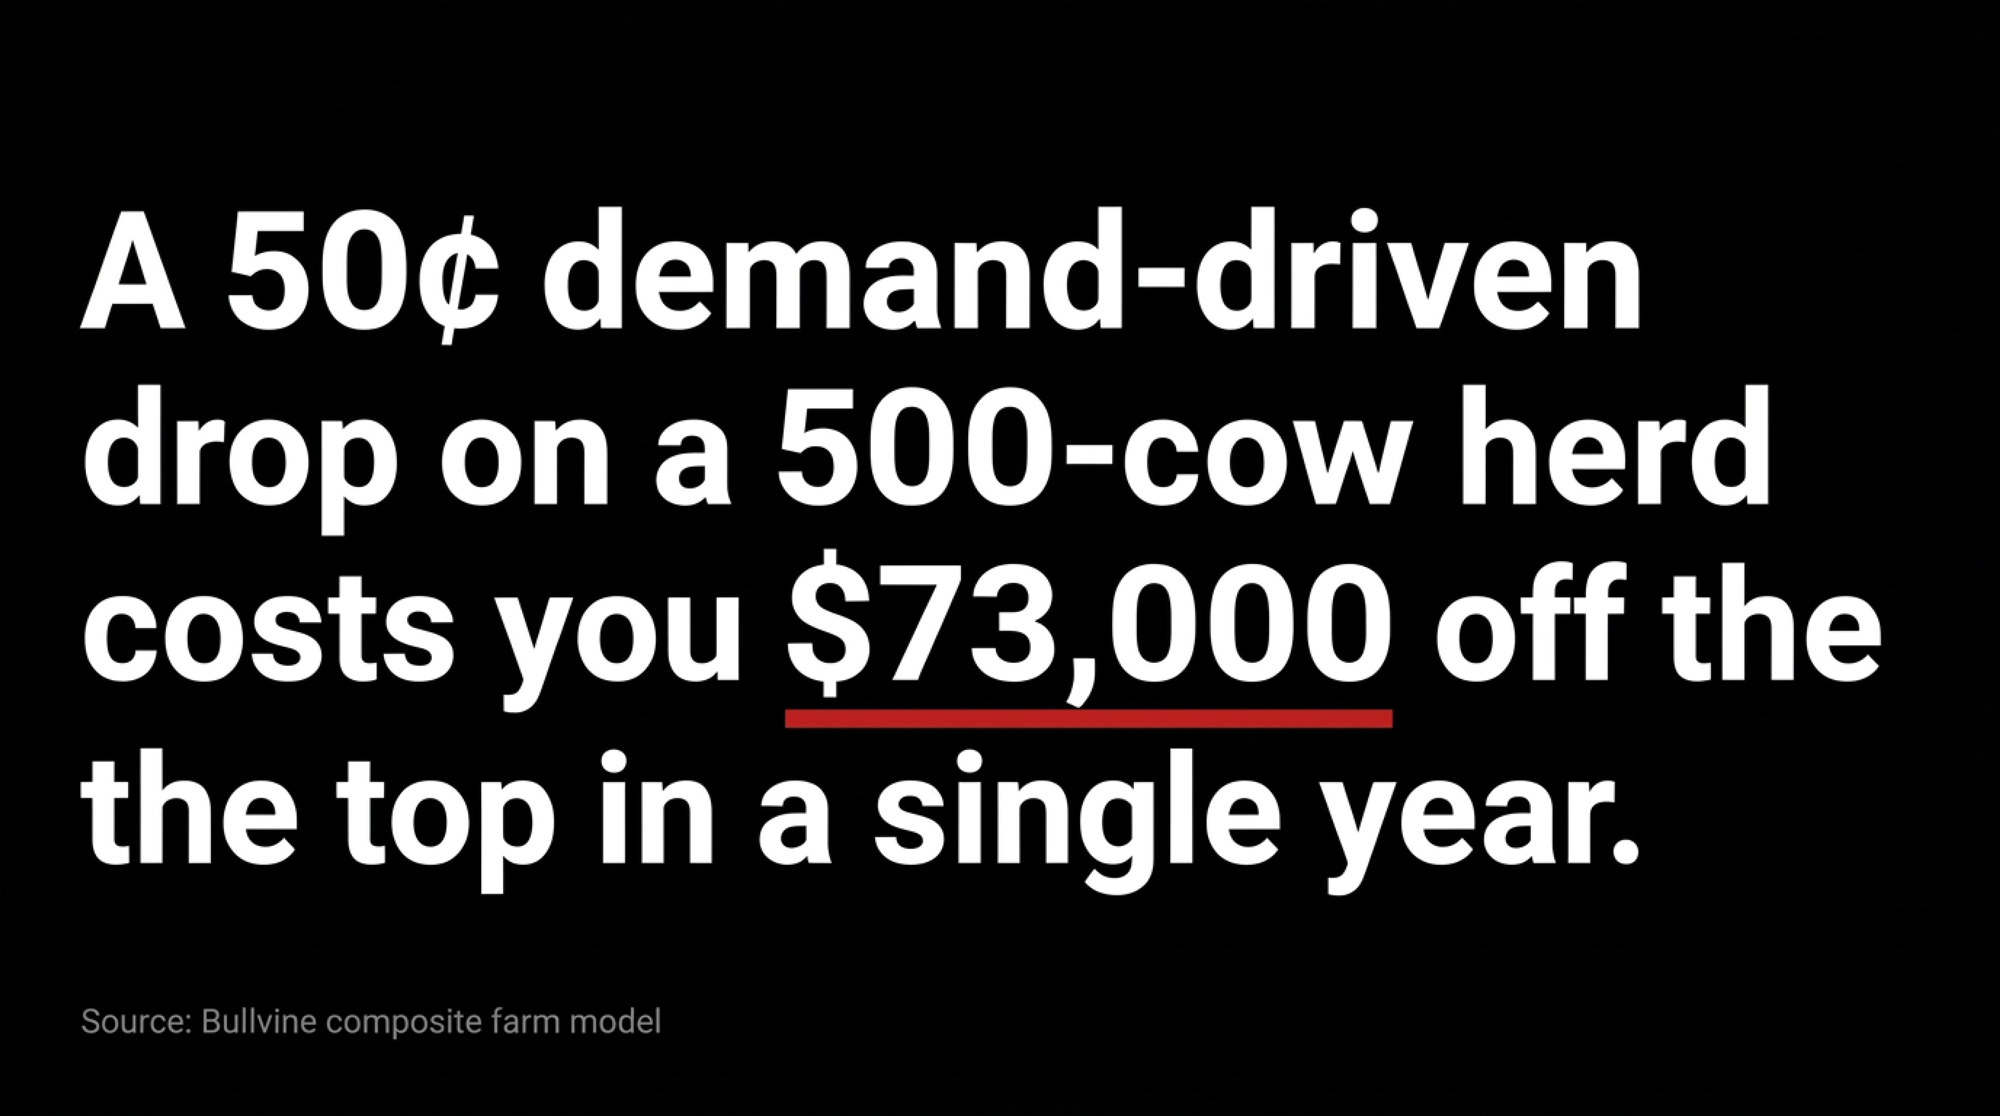
💡 Barn-Math Box 500-cow herd × ~80 lbs/cow/day ≈ 14.6 million lbs/year. A demand-driven softening of even 50¢/cwt on that volume ≈ $73,000 off the top in a single year. Treat it as an illustration, not a forecast — it’s the swing a weak domestic floor helps cause, stacked on top of the $250K-plus risk The Bullvine already flagged for mid-size herds running their 2026 numbers.
Is the “Fraud” Story Costing You More Than You Think?
Here’s where a lot of producers get talked out of paying attention. The official line from USDA Secretary Brooke Rollins is that SNAP is shrinking because of fraud reduction and a stronger economy — nearly 4.3 million people cleaned off the rolls. It’s a tidy story. And if it’s mostly fraud, there’s nothing structural to plan around — the whole thing becomes housekeeping.
The numbers don’t back that up. You don’t need an economics degree to see the gap:
41,476 people disqualified from SNAP for fraud (USDA, FY2023) — under 1% of the 42 million on the program.
5,800,000+ people gone from the program since January 2025.
As the AP’s fact-check put it: fraud “is insufficient to explain such a drastic reduction in participation.”
USDA also points to tighter work requirements and a stronger labor market — not fraud alone — as reasons for the decline. And that’s exactly the point for your operation. Whether it’s work rules, paperwork friction, or the benefit-formula changes in H.R. 1 — which CBO scored as cutting participation by 2.4 million people a month on average through 2034 — the people leaving are the same either way. FRAC calls it “a deliberate policy design”. Those aren’t fraudsters walking out of the dairy aisle. They’re customers — families who lost food help, which is exactly why the demand they represented was real.
The Mechanics Behind the Outcome
Strip away the politics and the mechanism is simple. Fewer people on SNAP means fewer dollars flowing into the exact staple categories — fluid milk, basic cheese, yogurt — where dairy has the least room to raise price and the most volume to move. It’s not a demand shock you can hedge with a single futures contract. It’s a slow leak in the floor everyone assumed was solid. Fluid milk was already sliding before any of this — see the longer arc in where domestic dairy demand is really heading, and the deeper policy backstory in SNAP Cuts Target $267 Billion: Here’s What Dairy Farmers Aren’t Being Told.
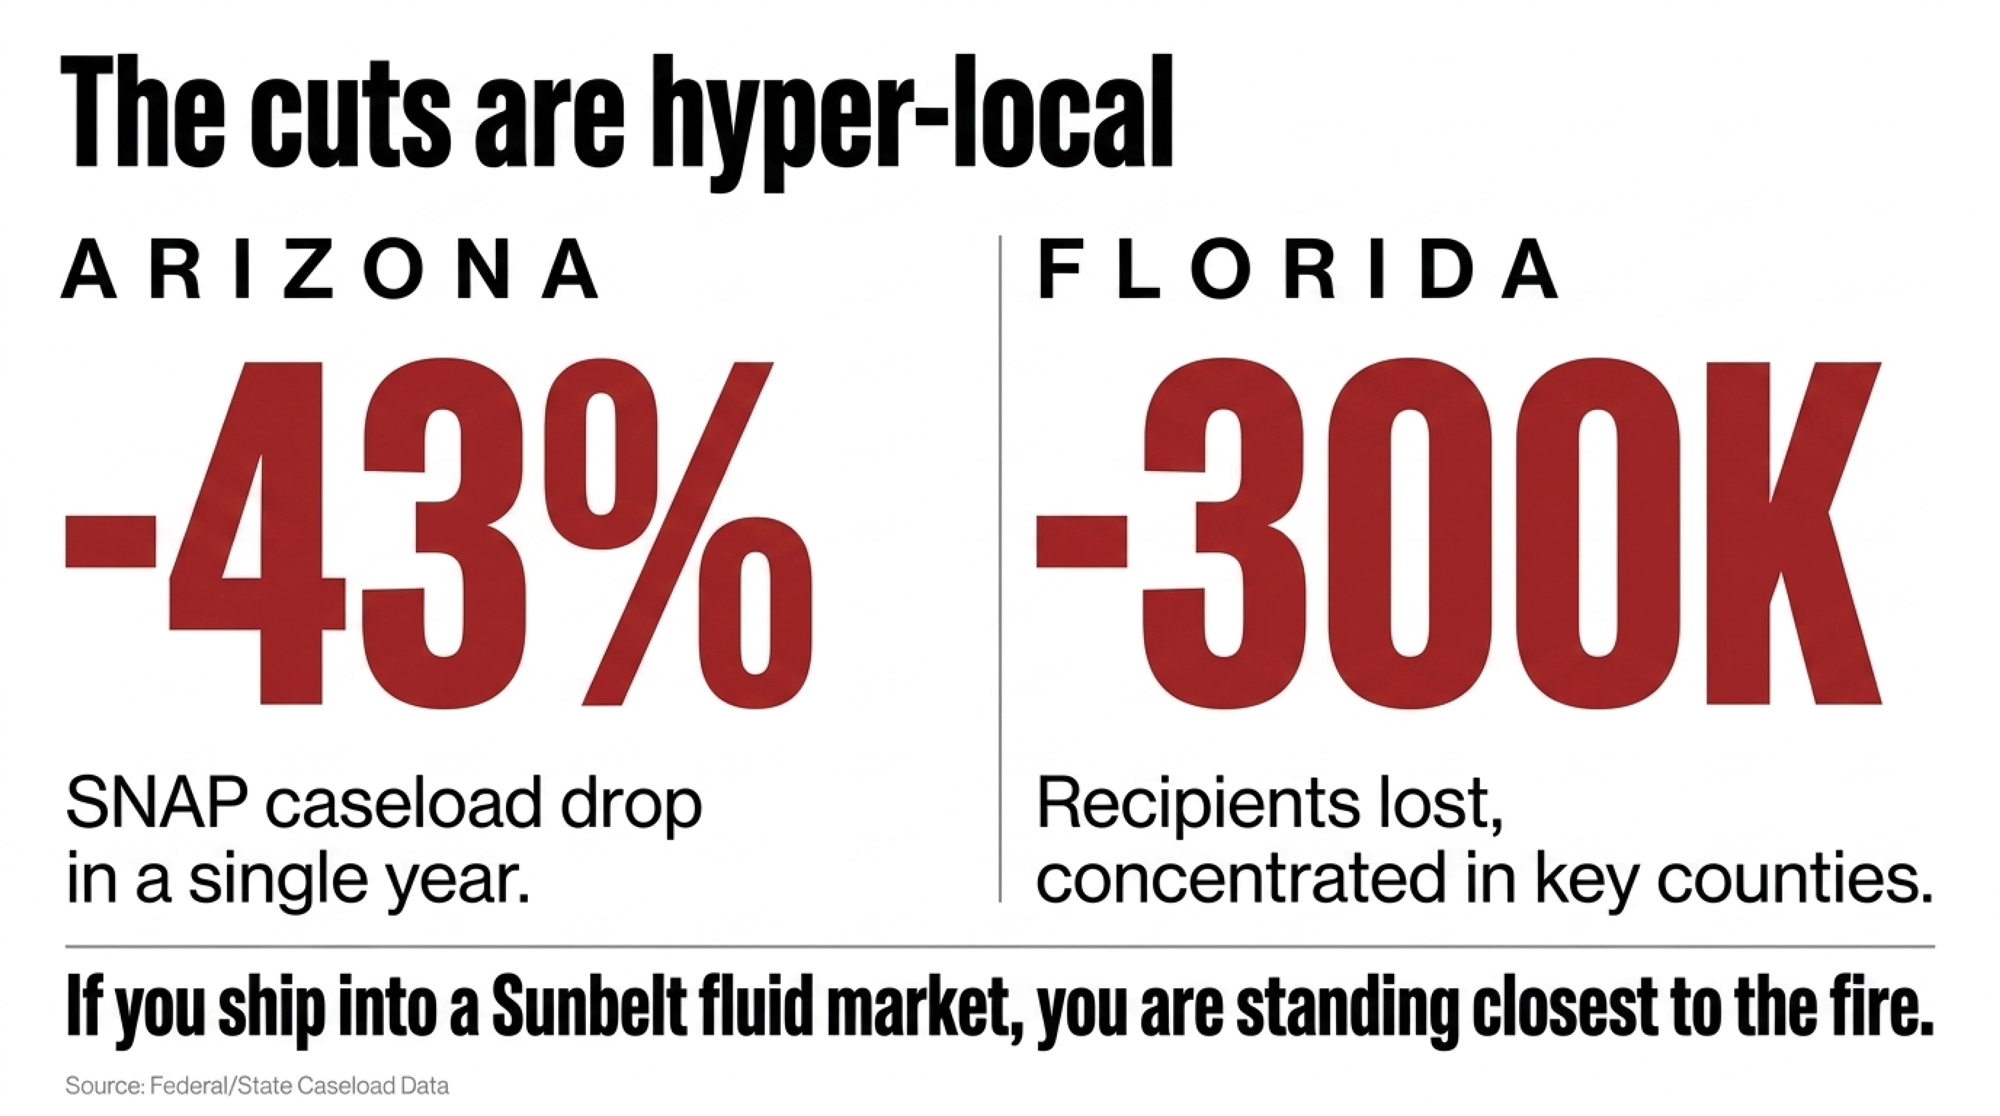
And the geography matters as much as the total. The cuts aren’t spread evenly — they’re concentrated in specific states and specific counties. Florida lost nearly 300,000 recipients, with the sharpest declines in Monroe and Collier counties. Arizona shed 43% of its caseload in a year. If your milk moves through a Sunbelt fluid market, your exposure looks very different from a herd shipping into a cheese plant in the Upper Midwest. Same national number, wildly different farm-level consequence.
| Exposure Factor | Sunbelt Fluid Shipper (AZ/FL corridor) | Upper Midwest Cheese Shipper |
| SNAP caseload decline | 43% (AZ), ~18% (FL) image.jpg | ~8% (regional est.) |
| Primary product | Fluid milk (staple basket) | Cheese / value-added |
| SNAP demand sensitivity | High — over-indexes on fluid | Lower — export & VAP buffer |
| Pricing power on volume | Thin (low-margin staple) | Moderate (differentiated) |
| Near-term tailwind | Limited domestic floor | Exports growing through 2027 Bullvine Four-Row Tier-Mix Template v1.md |
What Can You Actually Do About It This Month?
You can’t lobby your way out of this one — that ship has largely sailed. But you can stop treating domestic demand as a fixed given and start managing it like the variable it’s become. A few paths producers and co-ops are weighing right now:
| Feature | Dairy Revenue Protection (DRP) | Dairy Margin Coverage (DMC) |
| 2026 availability | Open — rolling quarterly | Closed Feb 26, 2026 |
| Protects | Milk revenue | Margin over feed |
| Next action window | This month (July) | Re-enroll ~Jan 2027 |
| Tier 1 ceiling | N/A | Expanded 5M → 6M lbs |
| Best for | Flooring a specific exposed quarter | Smaller volumes, $9.50 tier |
- Price a Dairy Revenue Protection quarter — this is the 30-day move. DRP sells through USDA’s Risk Management Agency and your crop insurance agent on a rolling quarterly basis, so, unlike DMC, it’s a tool you can actually act on in July, not just in the January window. When it makes sense: if you want to floor a specific quarter’s milk revenue against a softening domestic market. What it takes: a call to a livestock insurance agent and a look at the current quarterly endorsements. The catch: it protects revenue, not margin over feed, and premiums move with the market — so run the quarter you’re most exposed on first.
- Mark the 2027 DMC window and re-run your numbers now. The 2026 Dairy Margin Coverage enrollment closed February 26, 2026, so you can’t sign for this year — but coverage runs through 2031, the Tier 1 production ceiling expanded from 5 to 6 million pounds, and the $9.50 tier triggered payments early in 2026. When it makes sense: almost always, for smaller volumes. What to do now: pull your 2021–2023 marketings and price the $9.50 tier so you’re ready the day the next window opens, typically in January.
- Engage co-op leadership on channel risk. Push your co-op or processor to tell you where your milk actually lands — how much moves through the small independent grocers most exposed to benefit cuts versus value-added and export-ready channels. When it makes sense: on a 2–3 year horizon, and it starts with a single conversation. What it takes: raising channel-level SNAP exposure at your next board or patron meeting and asking for the data in writing. The trade-off: shifting toward more resilient channels can cost you flexibility and near-term price — but exports are projected to keep growing through 2027, which is the tailwind here. It’s a co-op-scale decision, not a solo one, which is exactly why leadership has to own it.
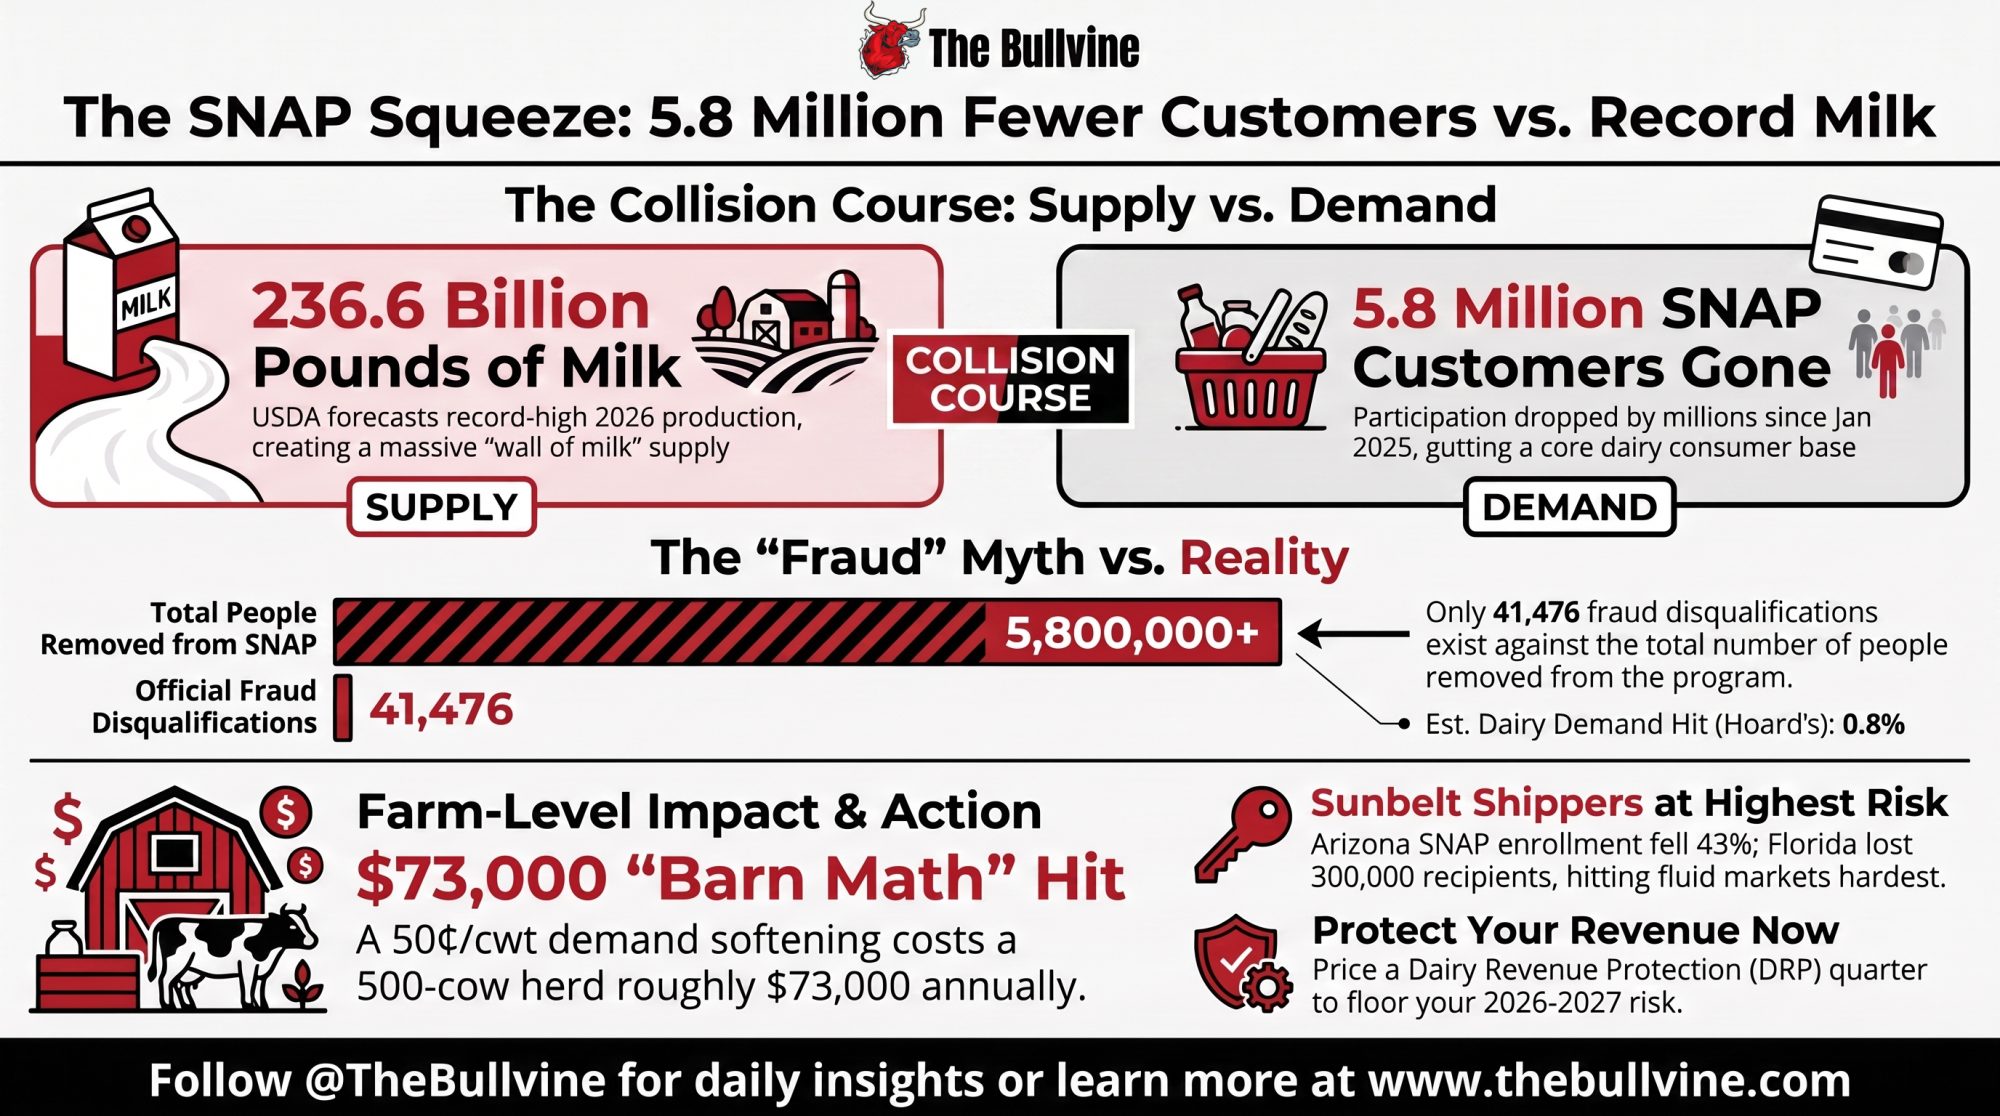
Key Takeaways
- If you ship into Arizona or Florida retail corridors, ask your buyer this month what share of your volume moves through SNAP-heavy stores — those markets are shrinking fastest.
- If you want a floor before year-end, price a DRP quarter now — it’s the one margin tool still open in July, since DMC’s 2026 window closed in February.
- If you’re budgeting 2027–2028 on stable domestic demand, stress-test it against a 0.5–1.0% softening in fluid and staple sales and see where your breakeven lands. For the reset, see Dairy Farm Economics 2026: Milk Pricing, Margins & Risk Playbook.
- If someone tells you SNAP’s falling because of fraud, keep the ratio in your back pocket: 41,476 disqualifications against more than 5.8 million people gone.
- If your co-op can’t tell you your channel-level SNAP exposure, that blind spot is itself a risk — put it on the agenda at your next board or patron meeting.
The question isn’t whether record milk and shrinking food aid are converging. The data says they already are. It’s whether your operation’s demand assumptions can survive being honest about it. So here’s the one worth sitting with tonight: if you pulled last year’s milk check and asked “how much of this leaned on customers who are no longer on SNAP,” would you even know where to start looking?
Run Your Numbers
Dairy Profit Projector — Take that 50¢/cwt demand-softening scenario and put it against your own herd. The Projector turns milk price, feed cost, and ration assumptions into IOFC, breakeven milk price, and 12-month whole-herd margin — so you find out where your floor really sits before the market tests it.
Complete references and supporting documentation are available upon request by contacting the editorial team at editor@thebullvine.com.
Learn More
- The Hidden Contract Clause That Could Cost Your Dairy $55000 in 2026 — Arms you with a 30-day tactical audit to spot new liability transfers in processor contracts before July deadlines hit. Learn how allergen indemnification clauses threaten $15,000 to $55,000 in annual net profit on 500-cow operations.
- 211000 More Dairy Cows. Bleeding Margins. The 2026 Math That Won’t Wait. — Exposes the structural trap where $1,300 beef-on-dairy calf premiums keep low-margin cows in stalls, starving replacement pipelines to a 20-year low. Master the genetics protocol needed to protect your herd’s true $19.80/cwt breakeven.
- Your Cheese Plant’s New Bacteria Can Run 56% Faster – Why This Technology Decides Which Processors (and Farms) Survive 2030 — Follows the money into gene-edited fermentation technology that speeds cheese production by 56%. Identify which processing partners will survive automation and consolidation, securing your milk check’s long-term home through the 2030 market transition.
 The Sunday Read Dairy Professionals Don’t Skip.
 The Sunday Read Dairy Professionals Don’t Skip.
Every week, thousands of producers, breeders, and industry insiders open Bullvine Weekly for genetics insights, market shifts, and profit strategies they won’t find anywhere else. One email. Five minutes. Smarter decisions all week.




