Net Merit told you to push fat. Canada’s LPI just told producers to pivot to protein. Your 2021 sire picks freshened this spring — and they won’t leave the herd until 2029.
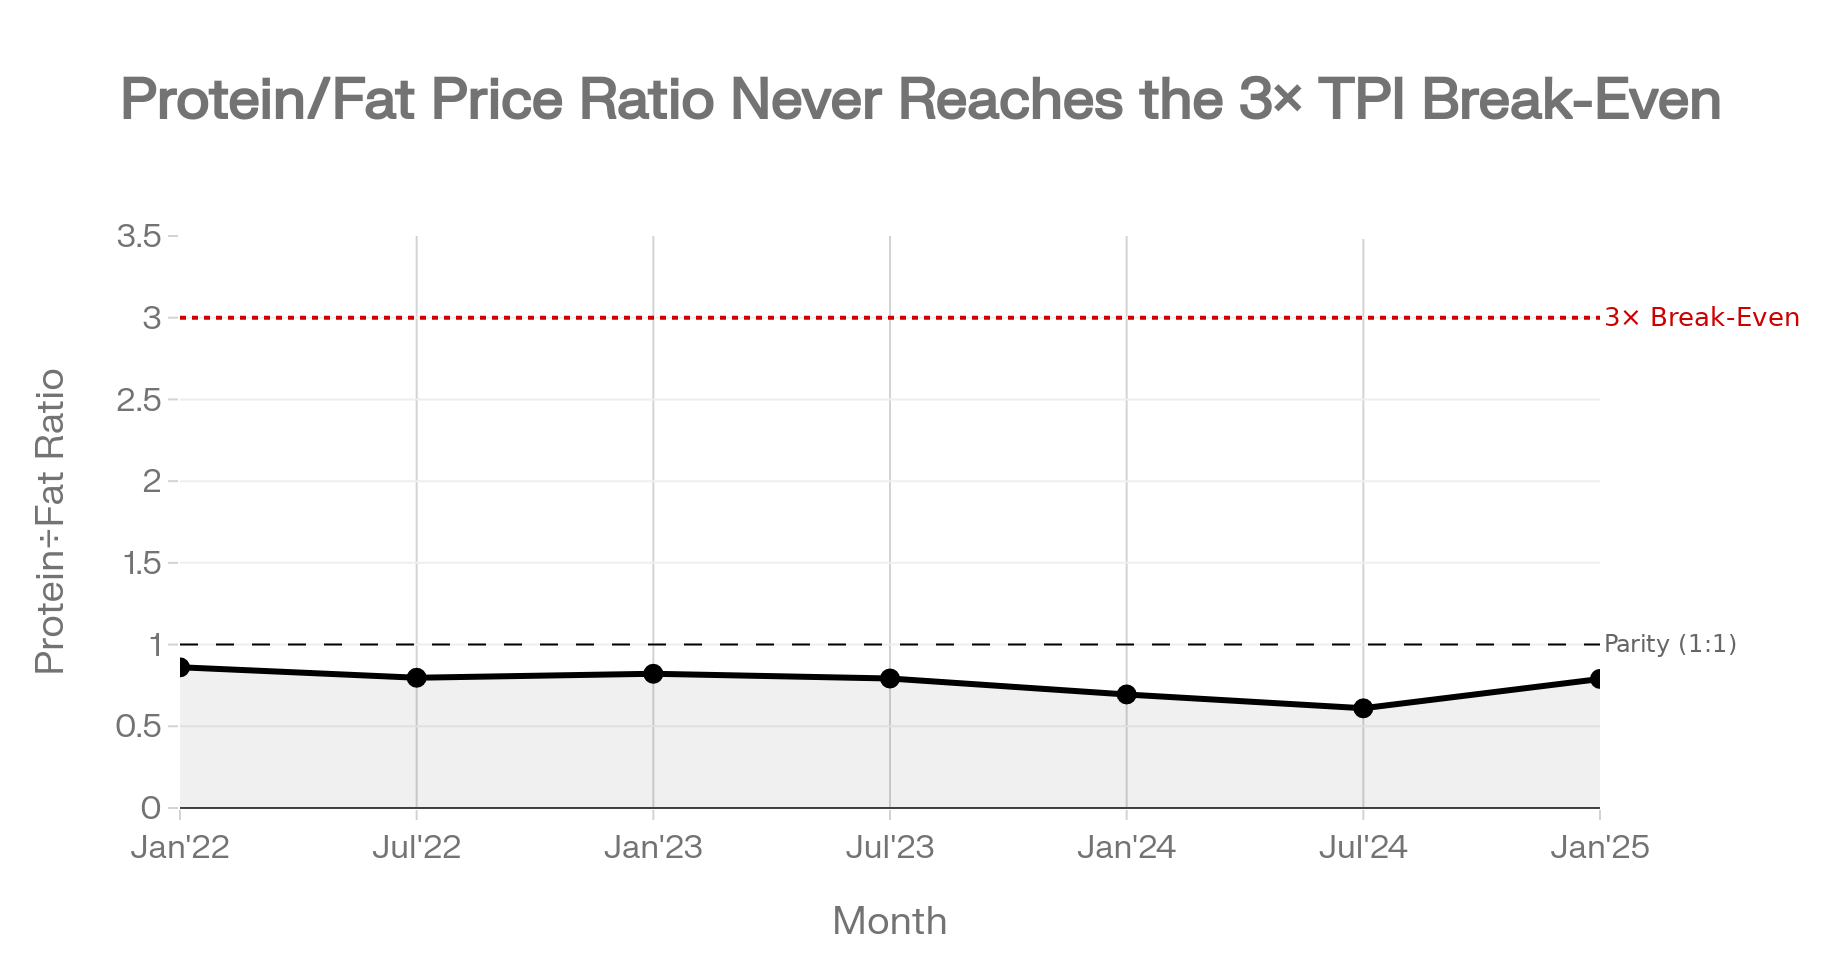
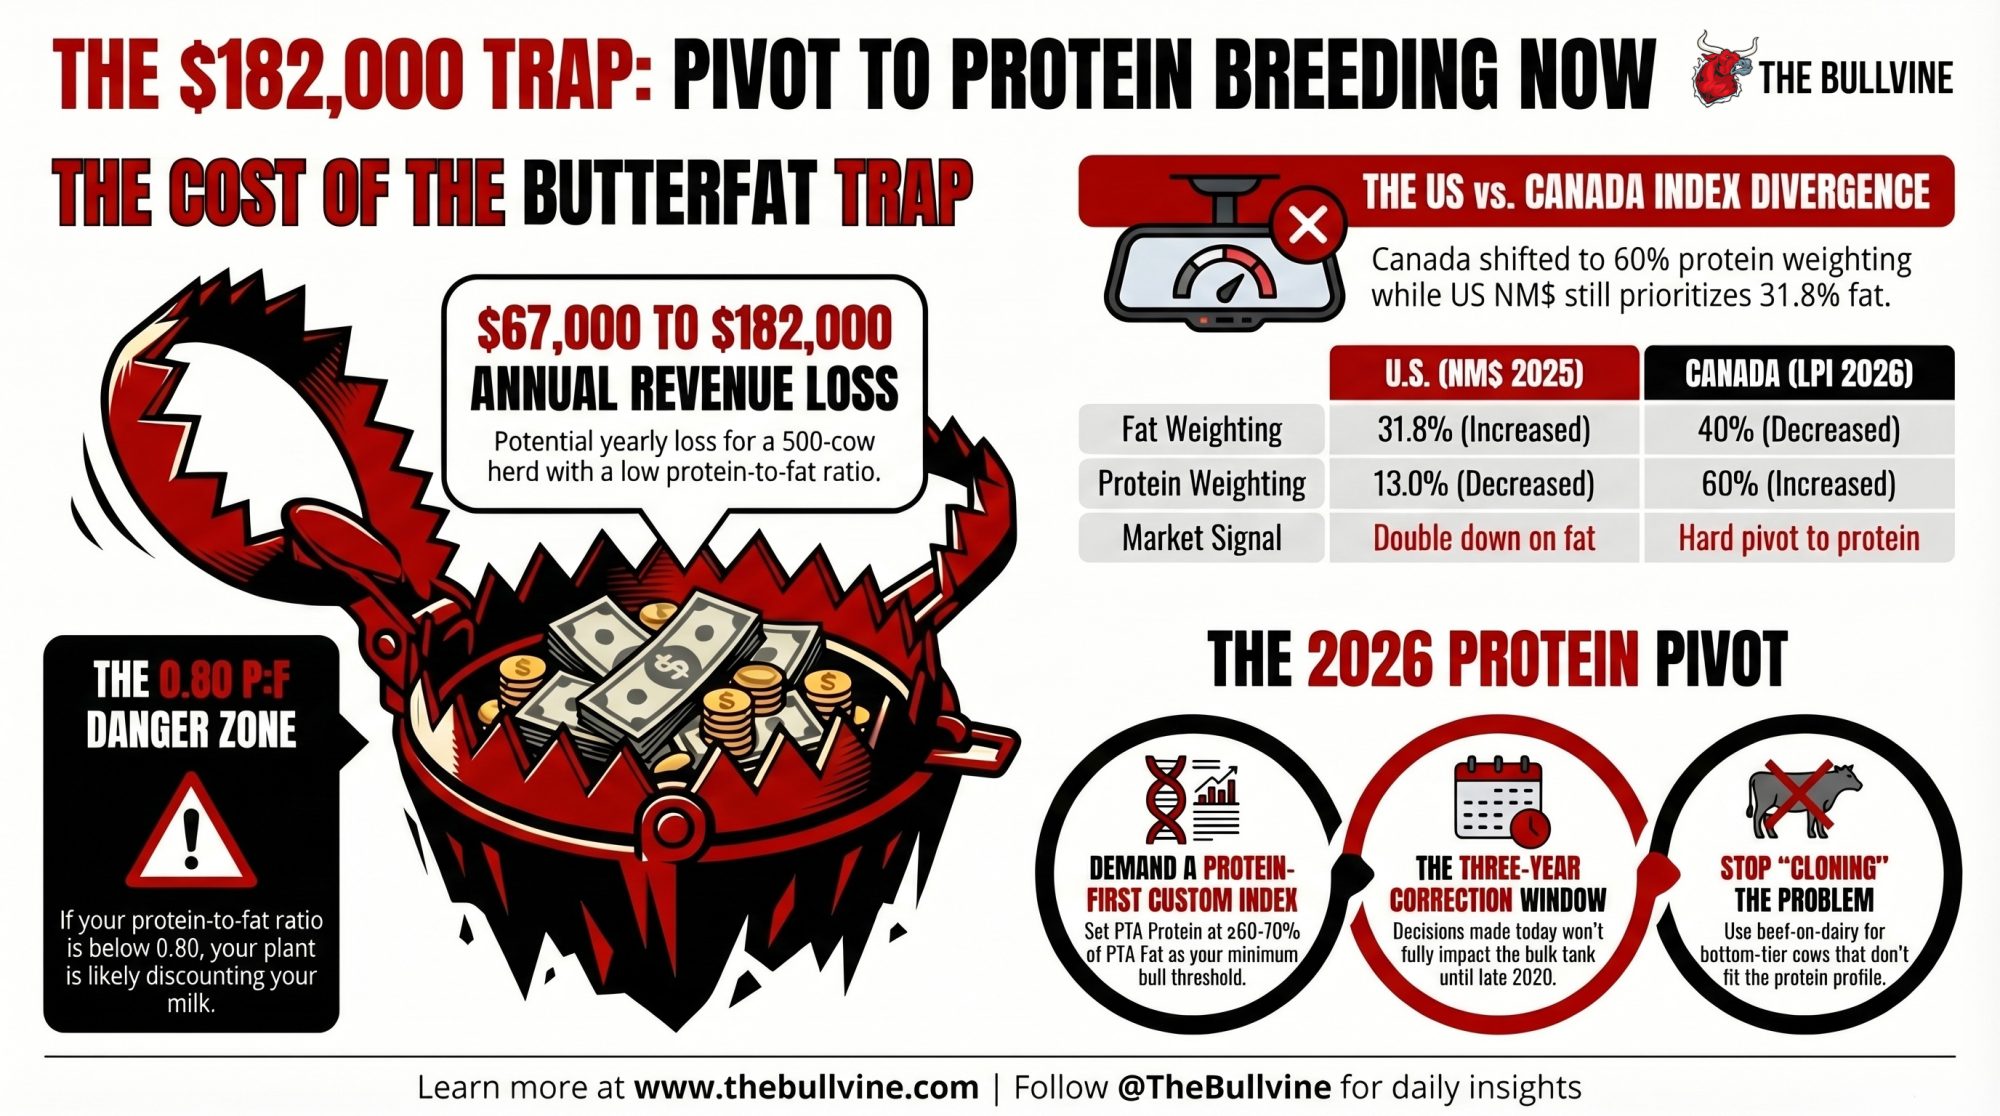
Executive Summary: A 500-cow Western cheese herd whose protein-to-fat ratio has drifted from 0.82 to 0.77 is giving up $67,000 to $182,000 per year in component revenue — and the sire picks that created the mismatch won’t cycle out of the milking string until 2029. CoBank’s April 2026 analysis declared the U.S. “structurally short on protein and long on butterfat,” a shift driven by a decade of FMMO signals and NM$ weightings that rewarded maximum fat production. The NM$ 2025 revision deepened it: CDCB bumped fat’s index share to 31.8% and cut protein to 13.0%, right as CME spot butter crashed from $2.44 to $1.50/lb in fifteen weeks. Canada read the same global data and went the opposite direction — Lactanet’s April 2026 LPI revision shifted production weighting to 60% protein. The margin squeeze hits hardest at cheese-market herds where plants discount excess fat and pay up for protein, pushing well-managed operations toward or below Penn State’s $7.41/cow/day IOFC breakeven. Breeding changes made this spring won’t produce fresh heifers until late 2028, so your immediate move is pulling DHIA records, graphing your P: F trend, and demanding a protein-first custom index from your AI rep — not another NM$ top-10 list.
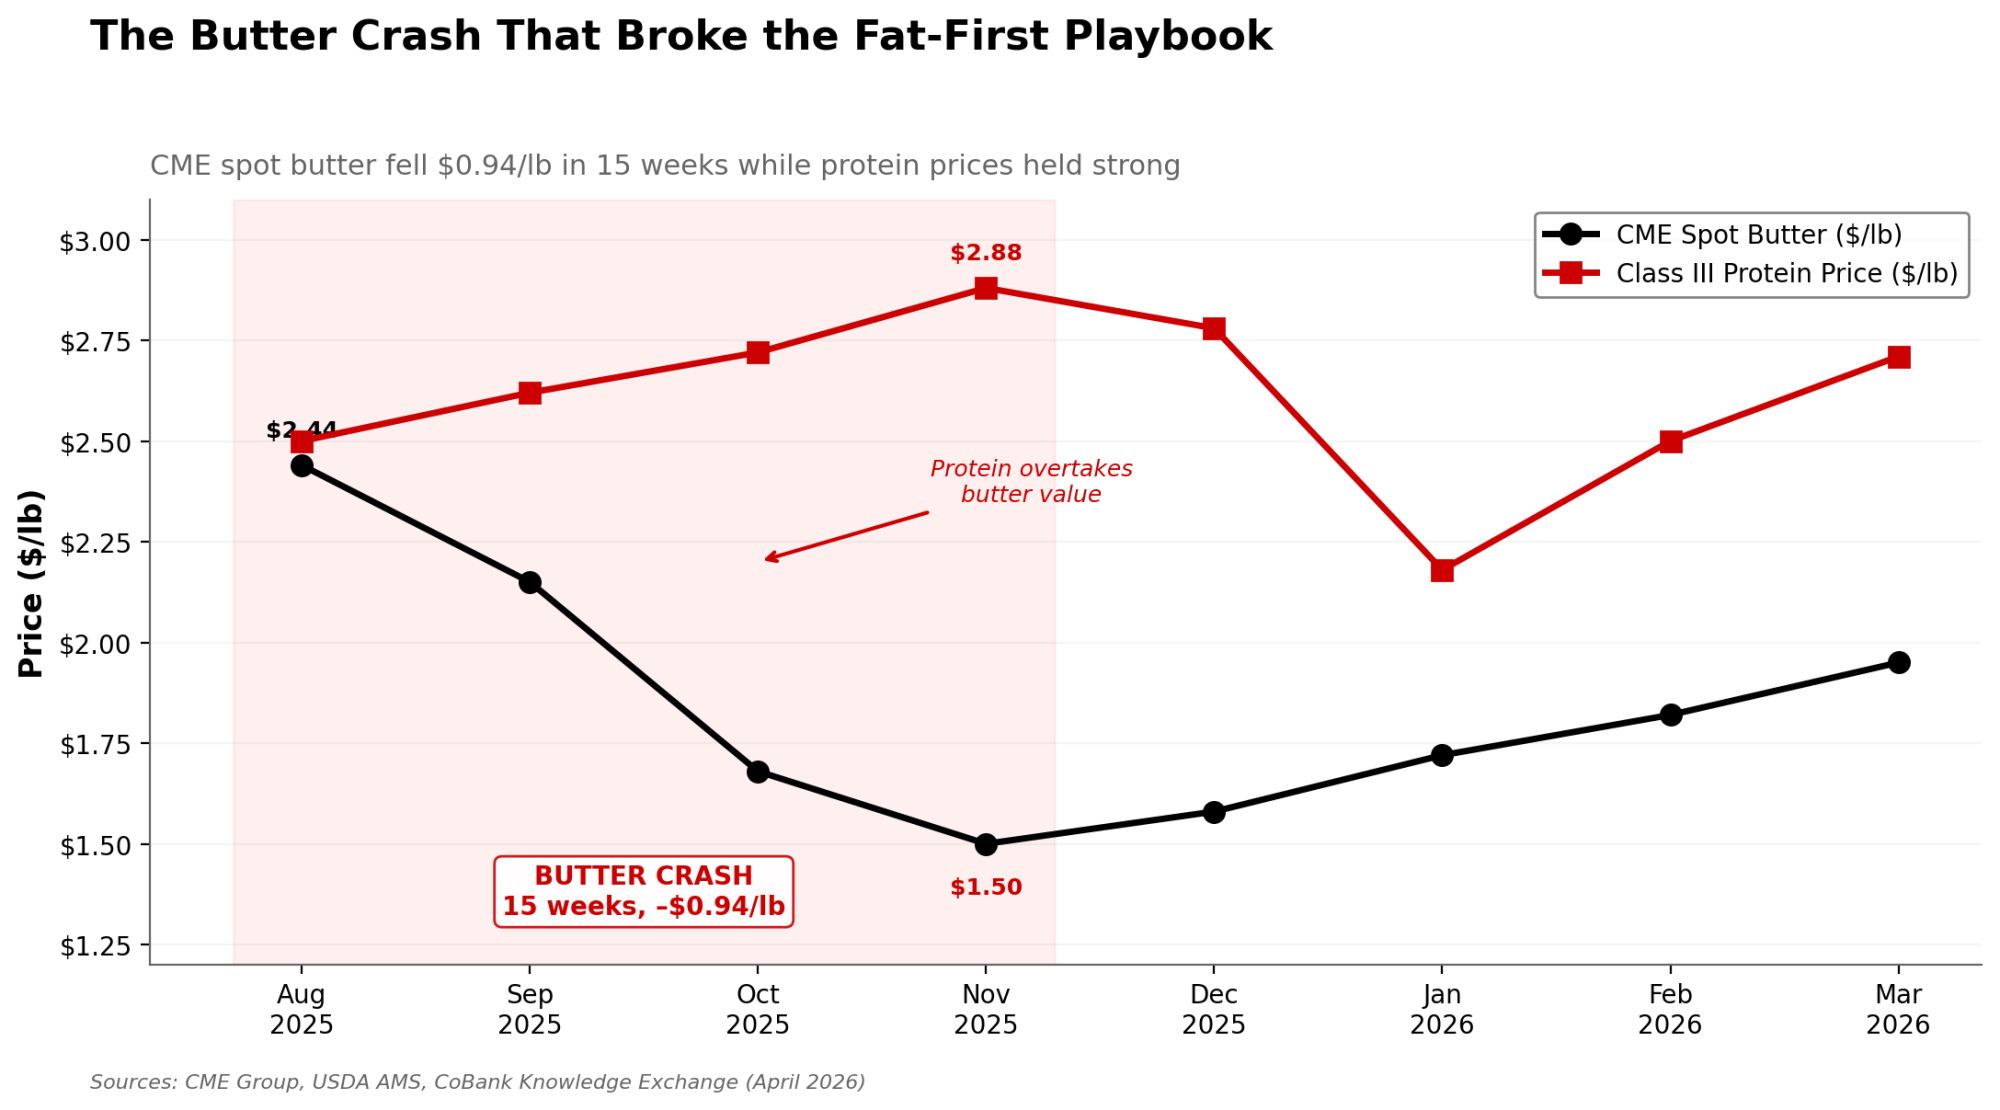
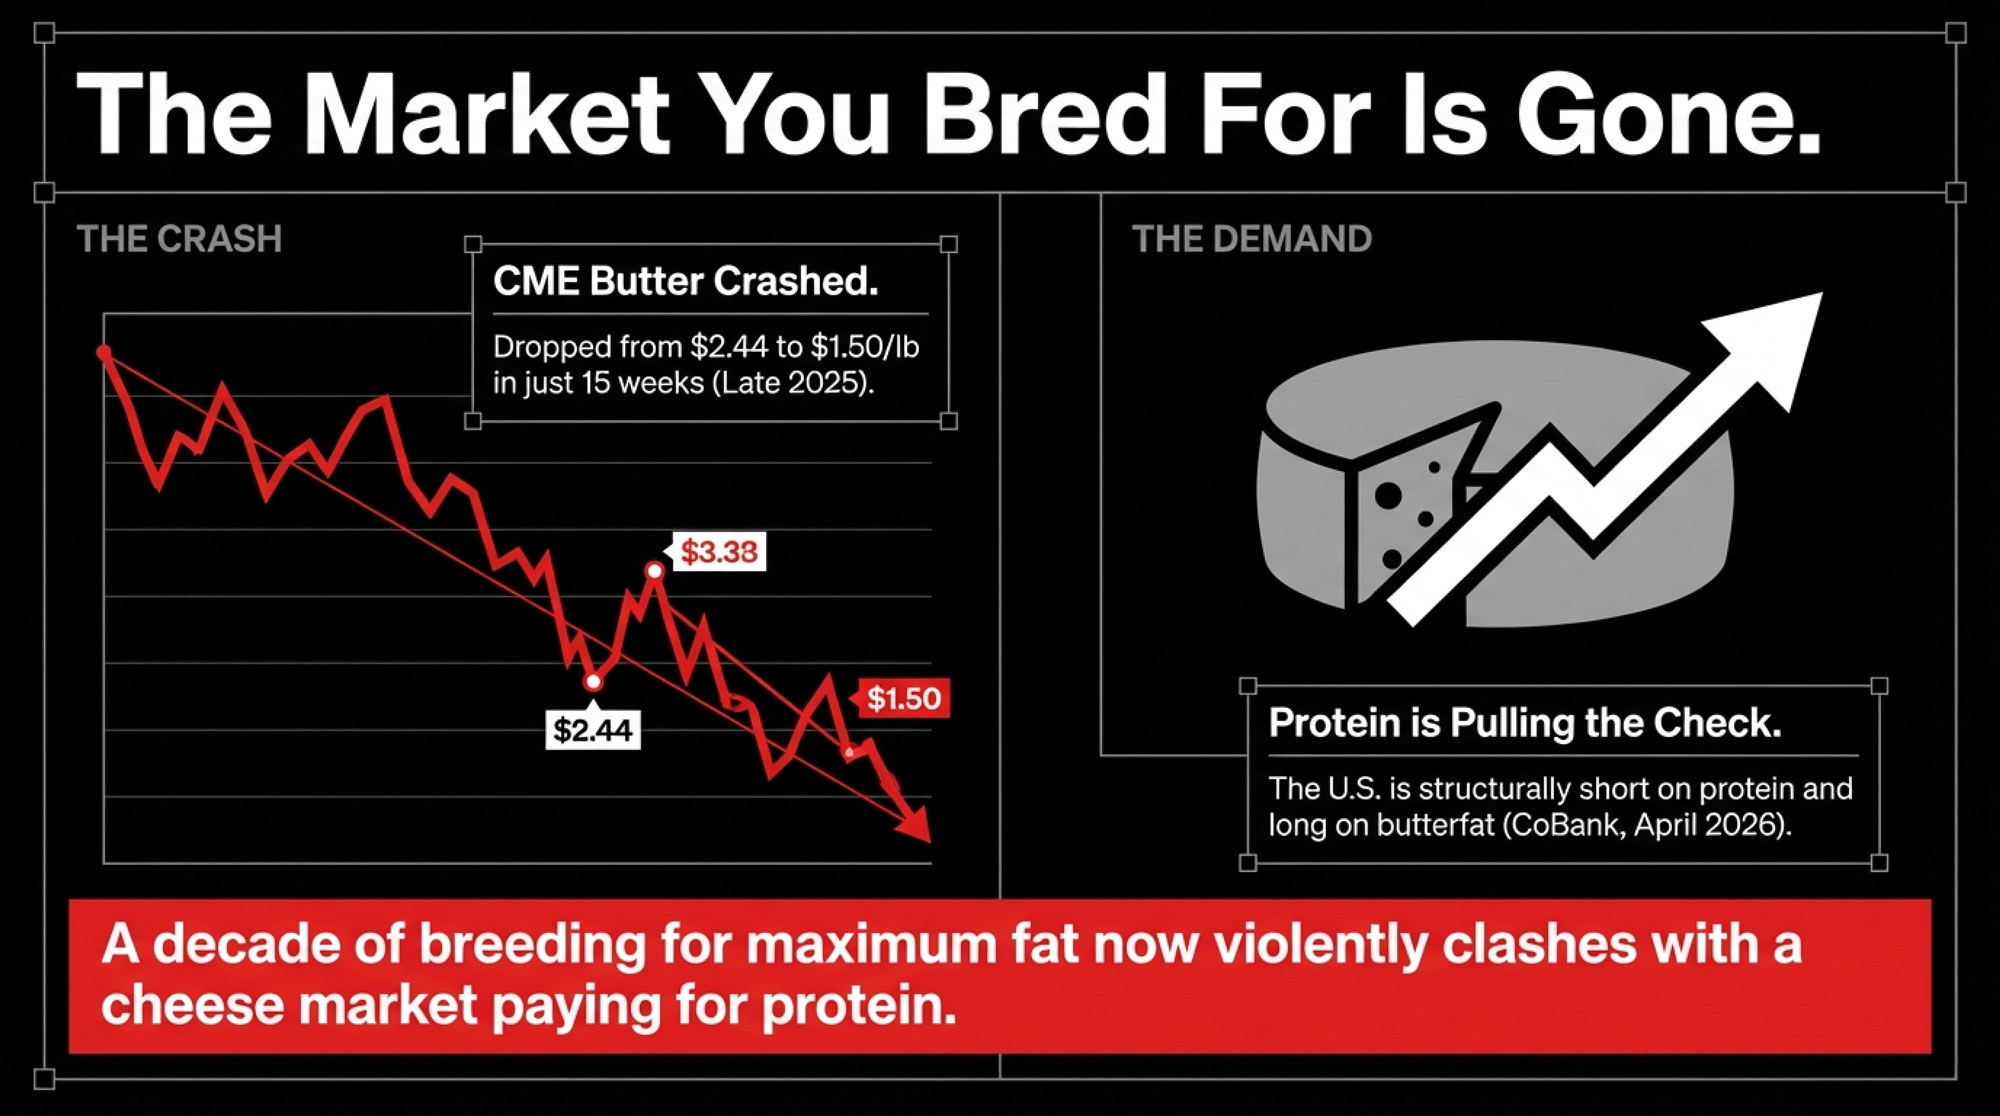
Butter fell from $2.44/lb to $1.50/lb in about fifteen weeks during late 2025, according to CME spot trading data. That drop hit right when holiday demand should’ve kept prices propped up, and it exposed a brutal truth for Western cheese herds: a decade of breeding for maximum butterfat now clashes with a market that’s paying you for protein.
For a 500‑cow Western cheese herd that looks like a lot of component herds in Idaho and the Central Valley, that shift isn’t theoretical. At late‑2025 component prices, it translates to roughly $130 to $190 per cow per lactation in forgone protein revenue, depending on which month’s protein price you use. Those daughters are already fresh. No breeding decision you make this spring will meaningfully affect your bulk tank before late 2028.
The Sires You Picked in 2021 Just Freshened
Here’s how the biology works. A heifer born in early 2024 — conceived from matings made in mid‑2023, using bulls selected off 2021–2022 proof runs — is freshening right now at 23 to 24 months of age. She’s the physical output of decisions made when CME butter traded above $2.80/lb, and every AI catalog, co‑op meeting, and genetics rep pointed in the same direction: fat is money.
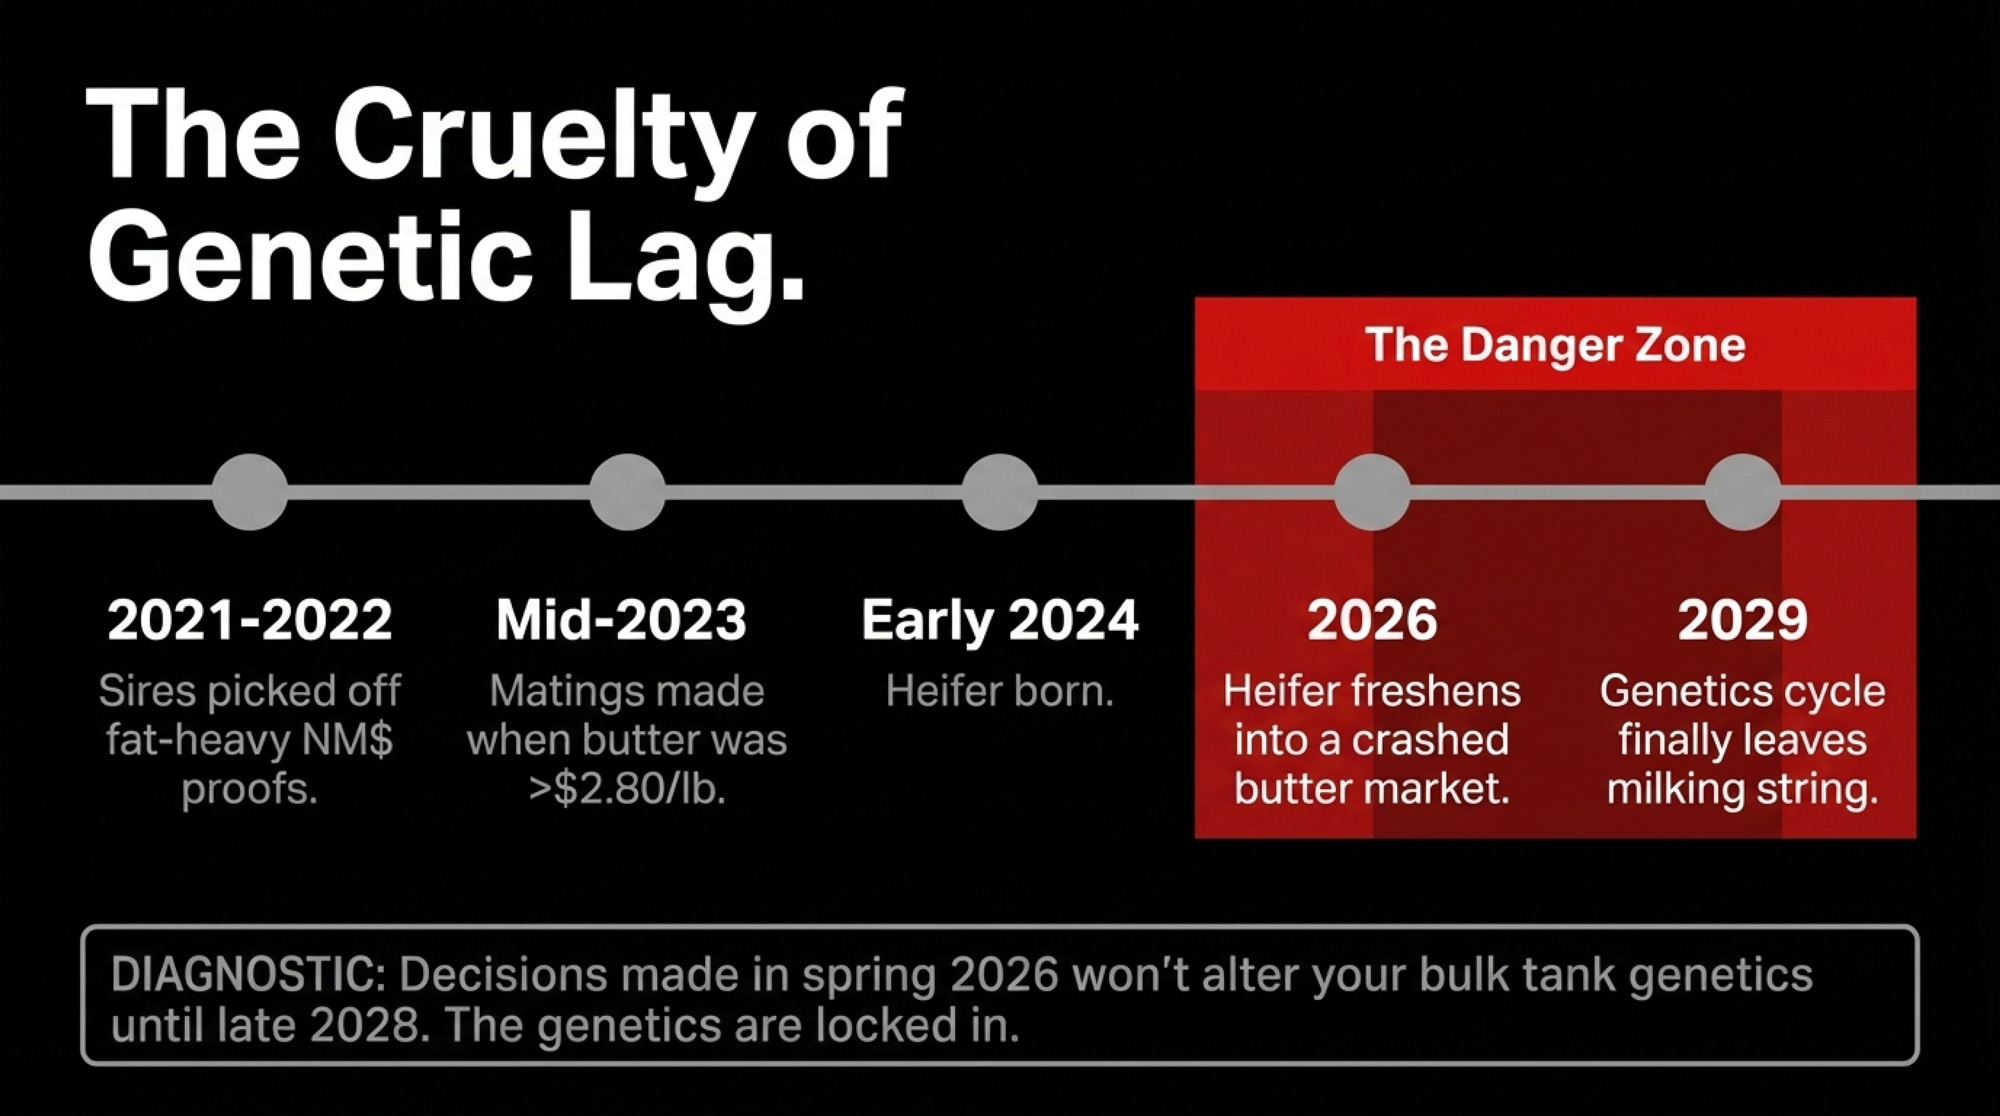
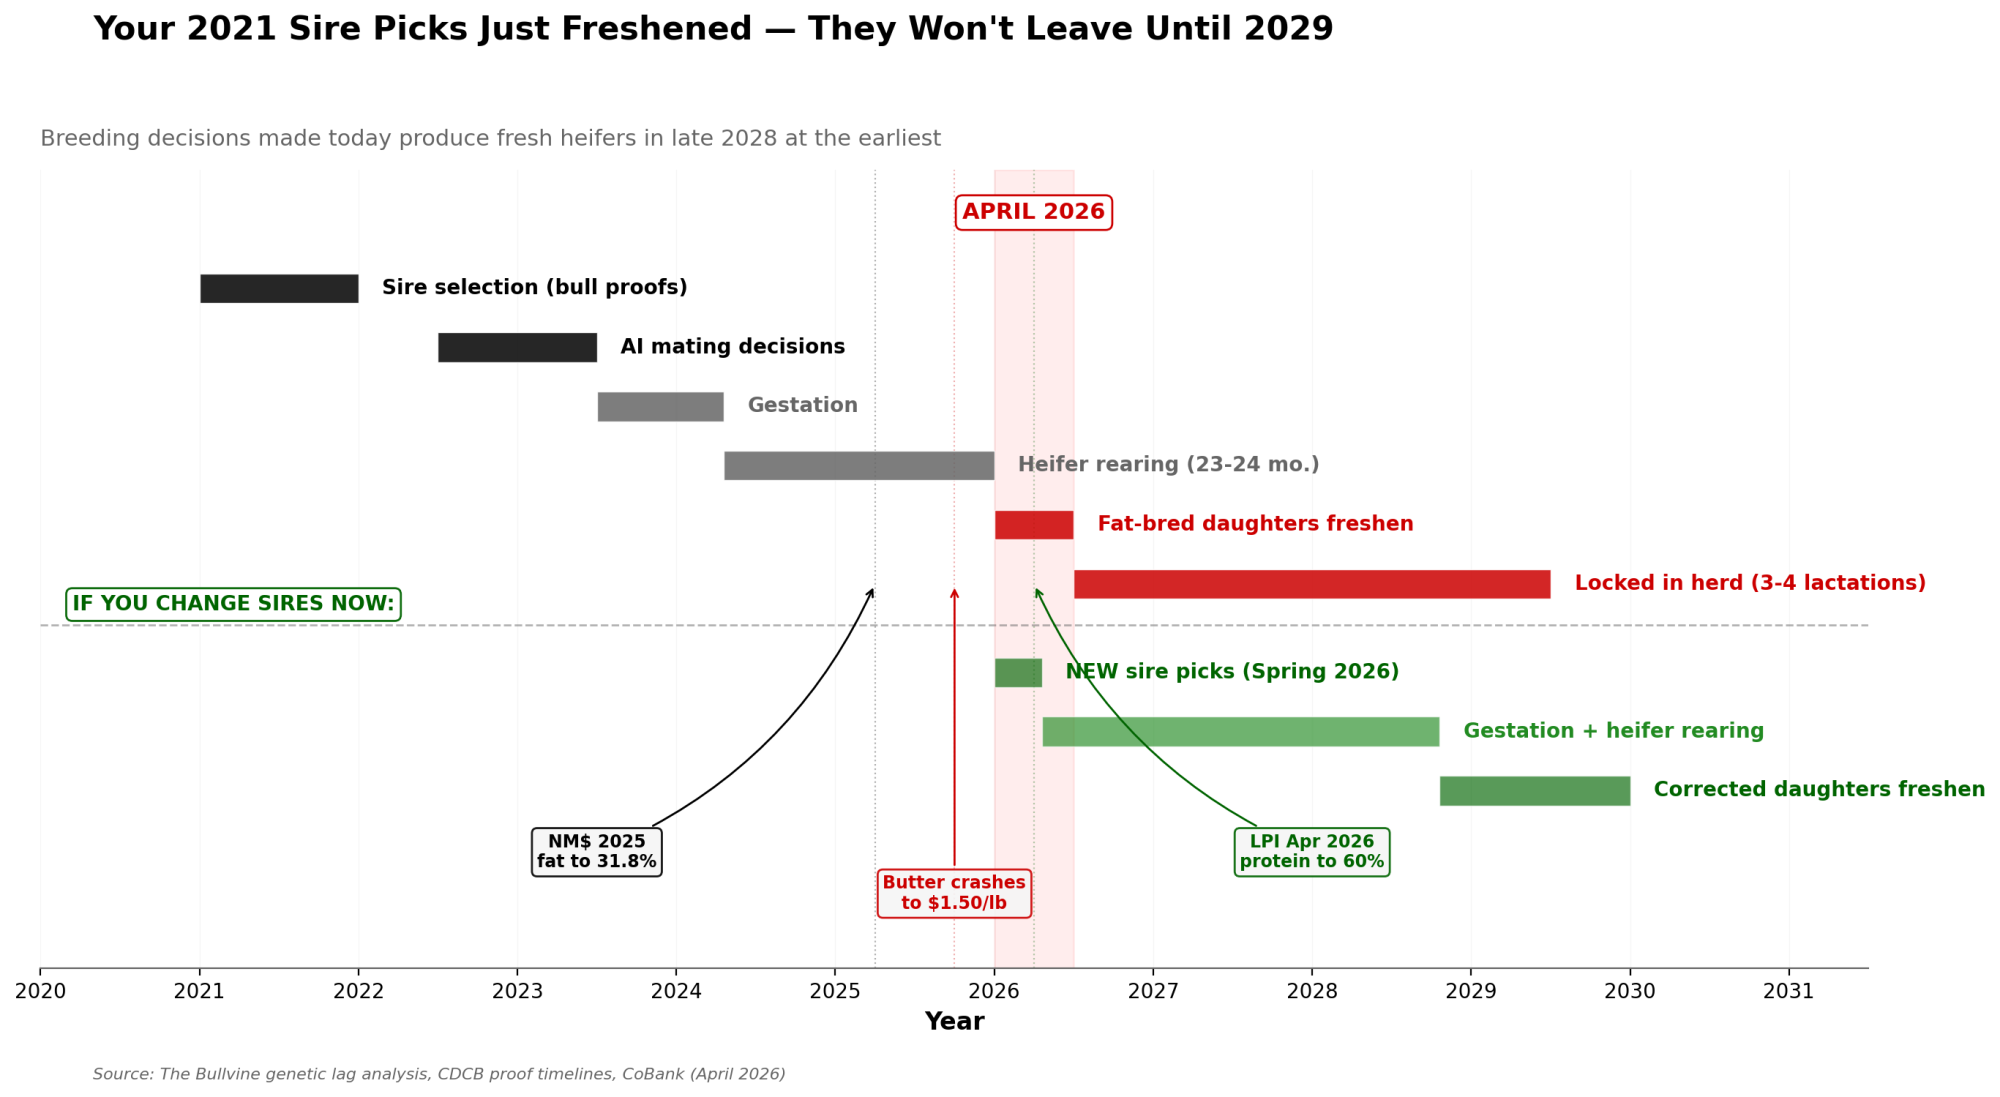
That wasn’t wrong at the time. FMMO component pricing passed those strong butter values directly into milk checks, and Net Merit reinforced the signal. But the timeline is cruel. By the time that heifer calves and starts shipping milk, the market she was bred for has already moved on. Butter’s trading $1.75 to $2.00/lb. Protein is pulling your milk check. And she’ll be in your herd for three to four more lactations before she leaves.
Cara Murphy at HighGround Dairy was among the first analysts to publicly flag the divergence. By late August 2025, HighGround was tracking a CME spot butter market that fell roughly $0.45/lb over the month — about an 18% decline from early‑month levels. CoBank’s September 25, 2025, report, co‑authored by Corey Geiger and Abbi Prins, carried a title that read like a warning label: “While U.S. Leads Milk Component Growth, Butterfat May Be Growing Too Fast”. Geiger put it plainly: “For 10 years, the market couldn’t supply enough of it, and now there’s an oversupply — it’s almost too much of a good thing”.
By then, the genetics were settled.
The Index That Told Everyone to Double Down
The comforting story is that the index had your back. The reality: it pushed you further into the problem.
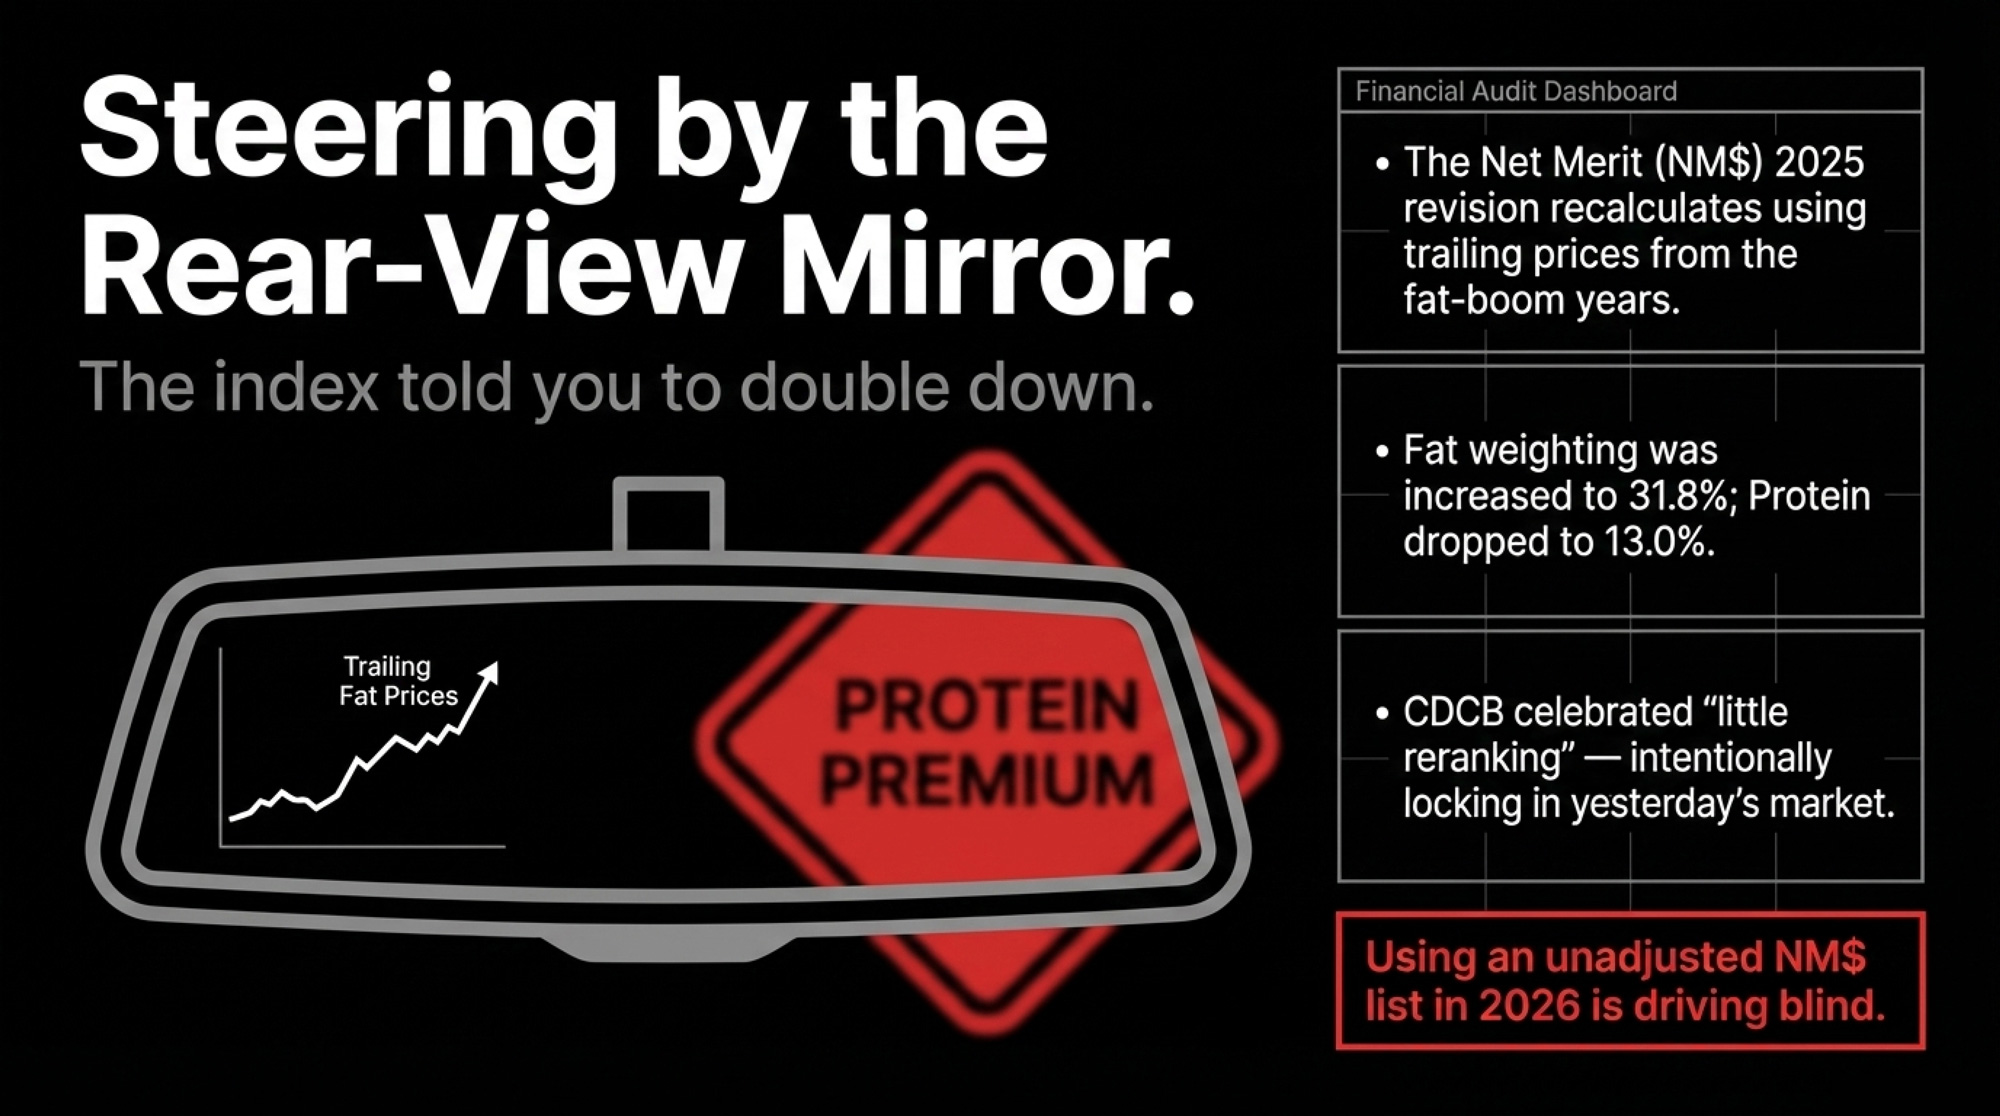
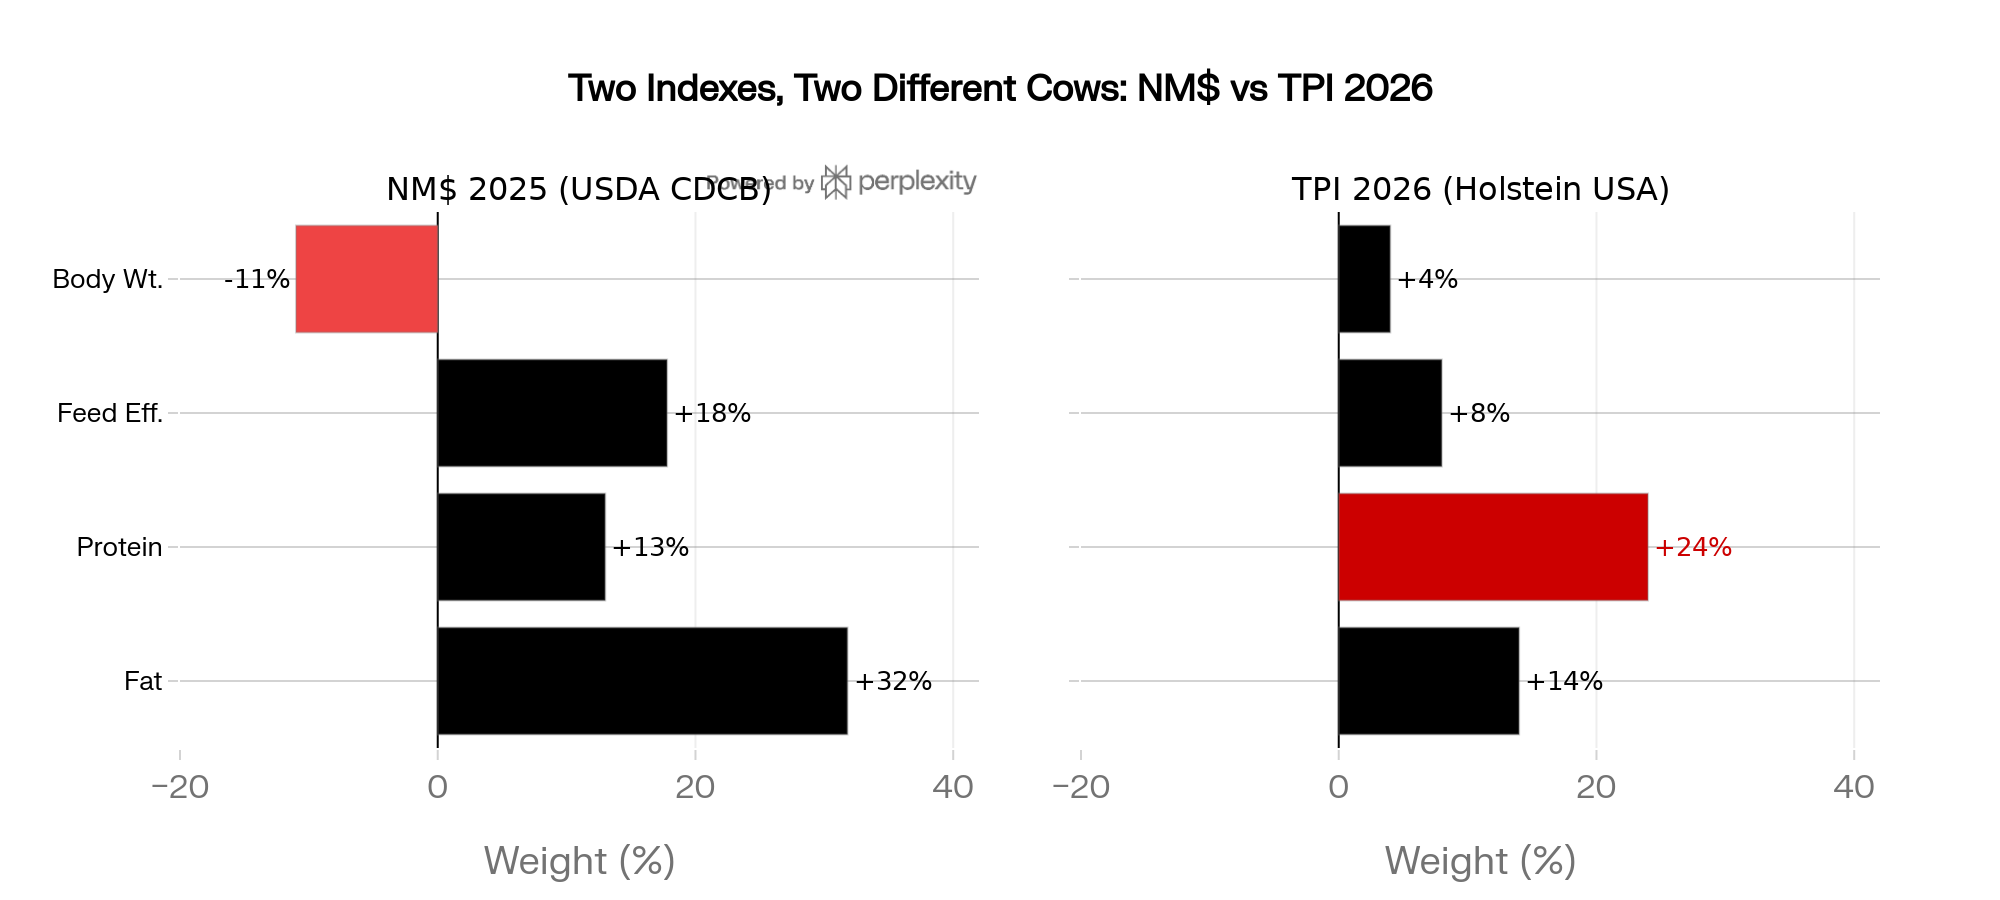
The Net Merit 2025 revision — designed by Dr. Paul VanRaden at USDA’s Animal Genomics and Improvement Laboratory and implemented through CDCB on April 1, 2025 — recalculated economic trait weights using trailing prices from the fat‑boom years. The result: NM$ 2025 increased butterfat’s share of the index from 28.6% to 31.8%and cut protein’s share from 19.6% to 13.0%. CDCB highlighted the 0.992 correlation with the previous version as a success, promising “little reranking”.
That’s the inertia of the index. By the time a lifetime‑profit index gets revised on several years of trailing prices, it’s basically a rear‑view mirror tool being used to drive a high‑speed vehicle. It smooths out noise — and locks in yesterday’s market. That’s not a design flaw if you treat NM$ as one input among many. It becomes a problem when it’s the only filter you use in a market that just repriced butterfat by roughly 40% in a single quarter.
Canada went the other way.
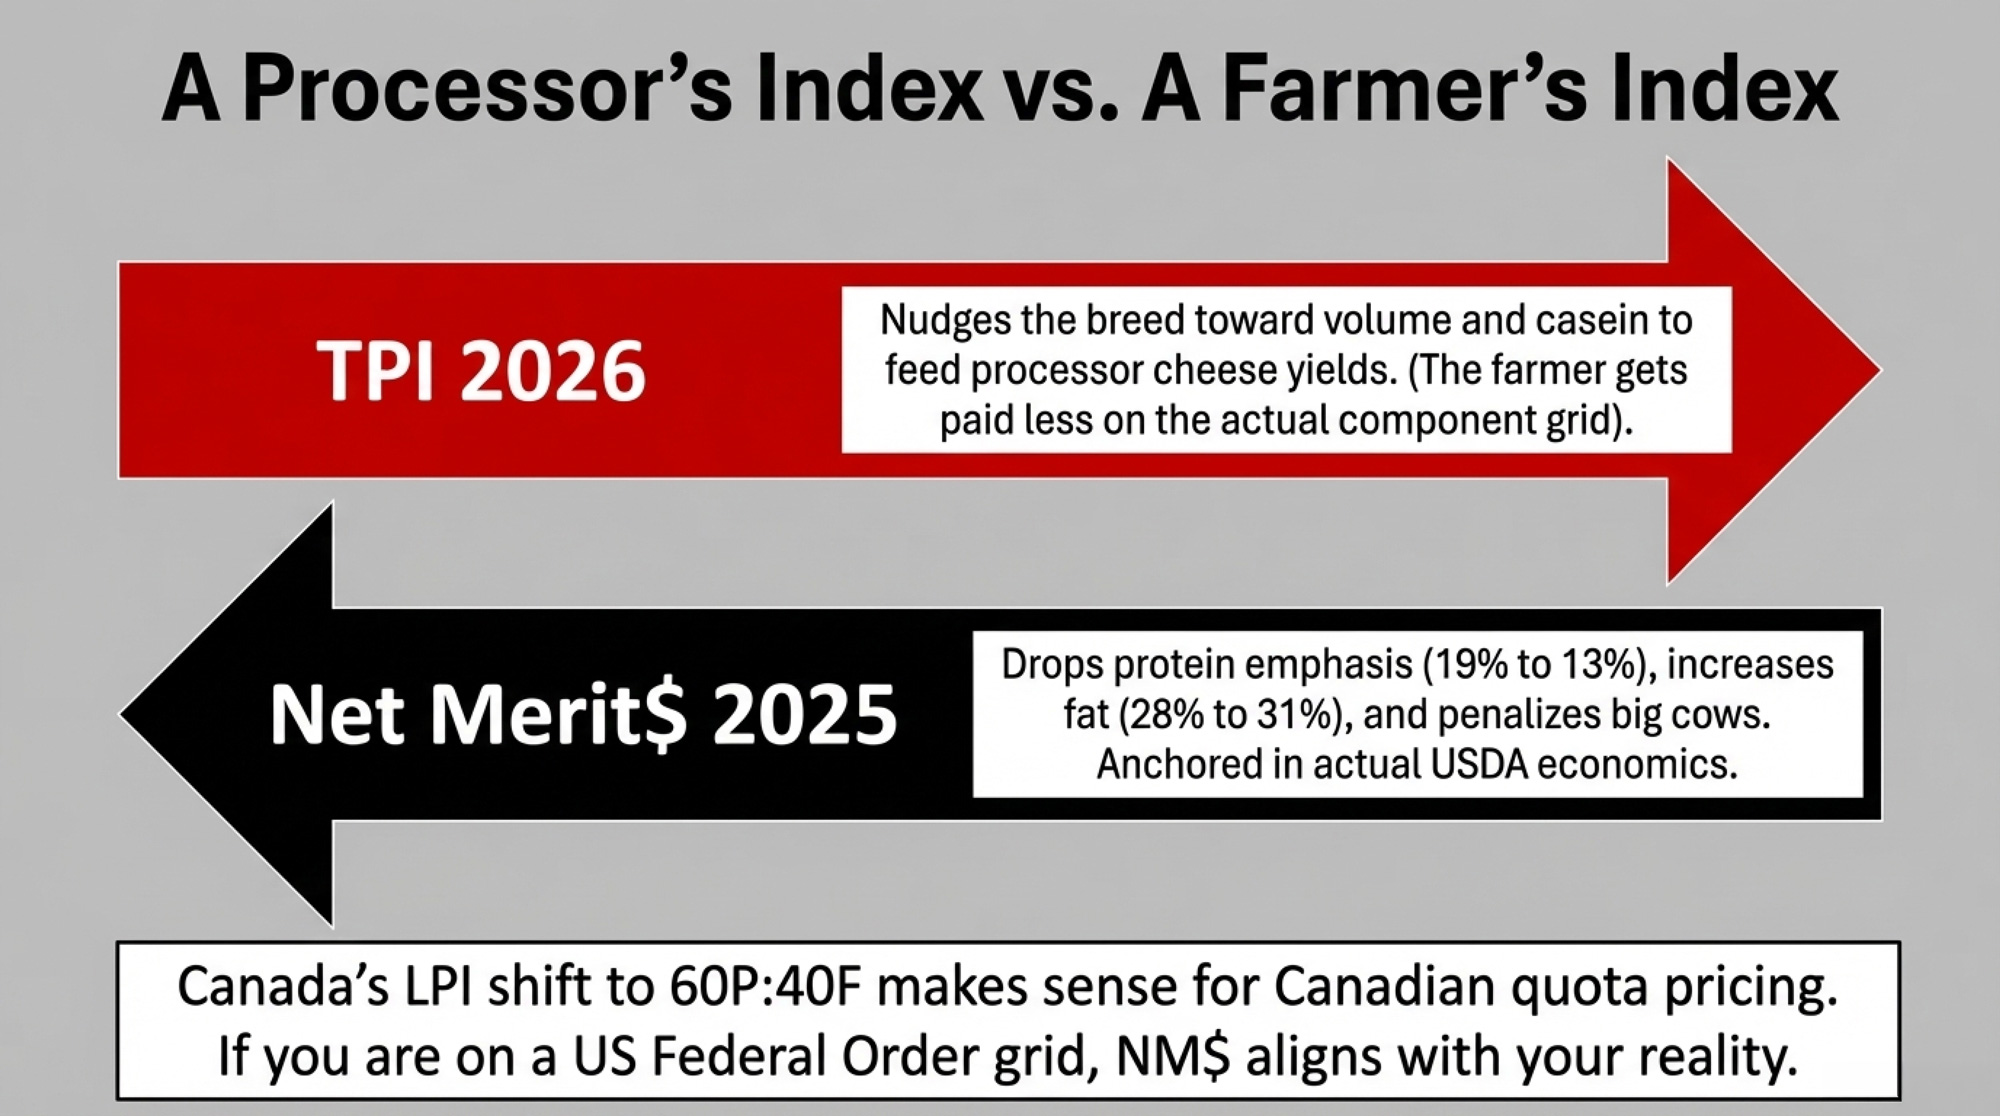
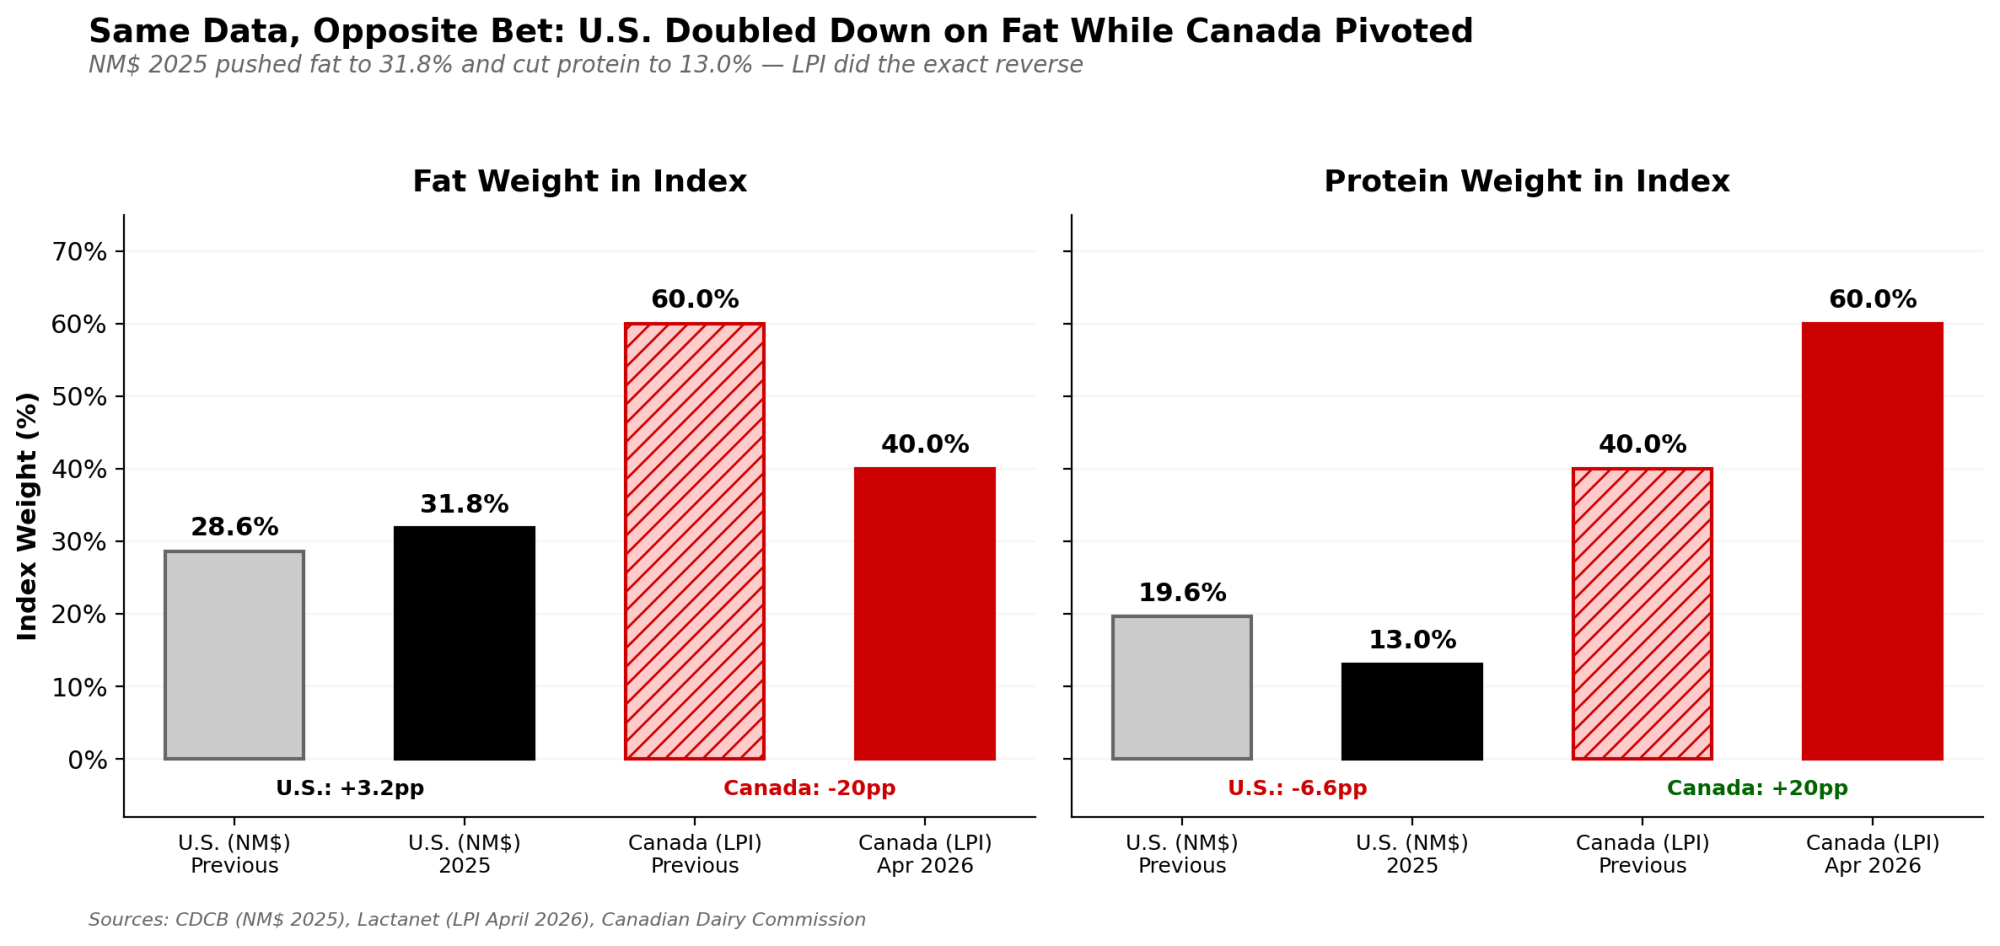
U.S. vs. Canada: Same Data, Opposite Signal
| Feature | U.S. (NM$ 2025) | Canada (LPI April 2026, Holstein) |
| Fat Weighting | Increased to 31.8% | Decreased to 40% (from 60%) |
| Protein Weighting | Decreased to 13.0% | Increased to 60% (from 40%) |
| Market Signal | “Stay the course on fat.” | “Hard pivot to protein.” |
Lactanet’s April 2026 changes to LPI production weights were a direct response to new component pricing in Canada’s supply‑managed system. The Canadian Dairy Commission told producers at a February 25, 2026, session to stop pushing butterfat relative to protein and to rebalance their solids. Western Canada shifted pool pricing from 85% fat / 10% protein to 70% fat / 25% protein, effective April 1, 2026, while the P5 eastern provinces restructured their own component pay with a heavy emphasis on achieving a solids‑non‑fat‑to‑butterfat ratio of 2.2 or higher.
Same global demand story. Two very different signals. One system told you to pivot toward protein. The other told you to double down on fat.
How Much Does the Genetic Lag Really Cost Per Cow?
| P:F Ratio | Protein % (at 4.25% Fat) | Lost Protein (lb/cow/day vs. 0.82) | Annual Loss/Cow ($2.71/lb protein) | 500-Cow Herd Annual Loss |
|---|---|---|---|---|
| 0.82 | 3.49% | 0.00 | $0 | $0 (baseline) |
| 0.80 | 3.40% | 0.08 | $66 | $33,000 |
| 0.78 | 3.32% | 0.16 | $132 | $66,000 |
| 0.77 | 3.27% | 0.20 | $165 | $82,500 |
| 0.76 | 3.23% | 0.23 | $190 | $95,000 |
| 0.74 | 3.15% | 0.31 | $257 | $128,500 |
For most of the last decade, high butterfat tests lined up with a strong milk check. When protein prices sit $0.70 to $1.00/lb above butterfat, the math flips.
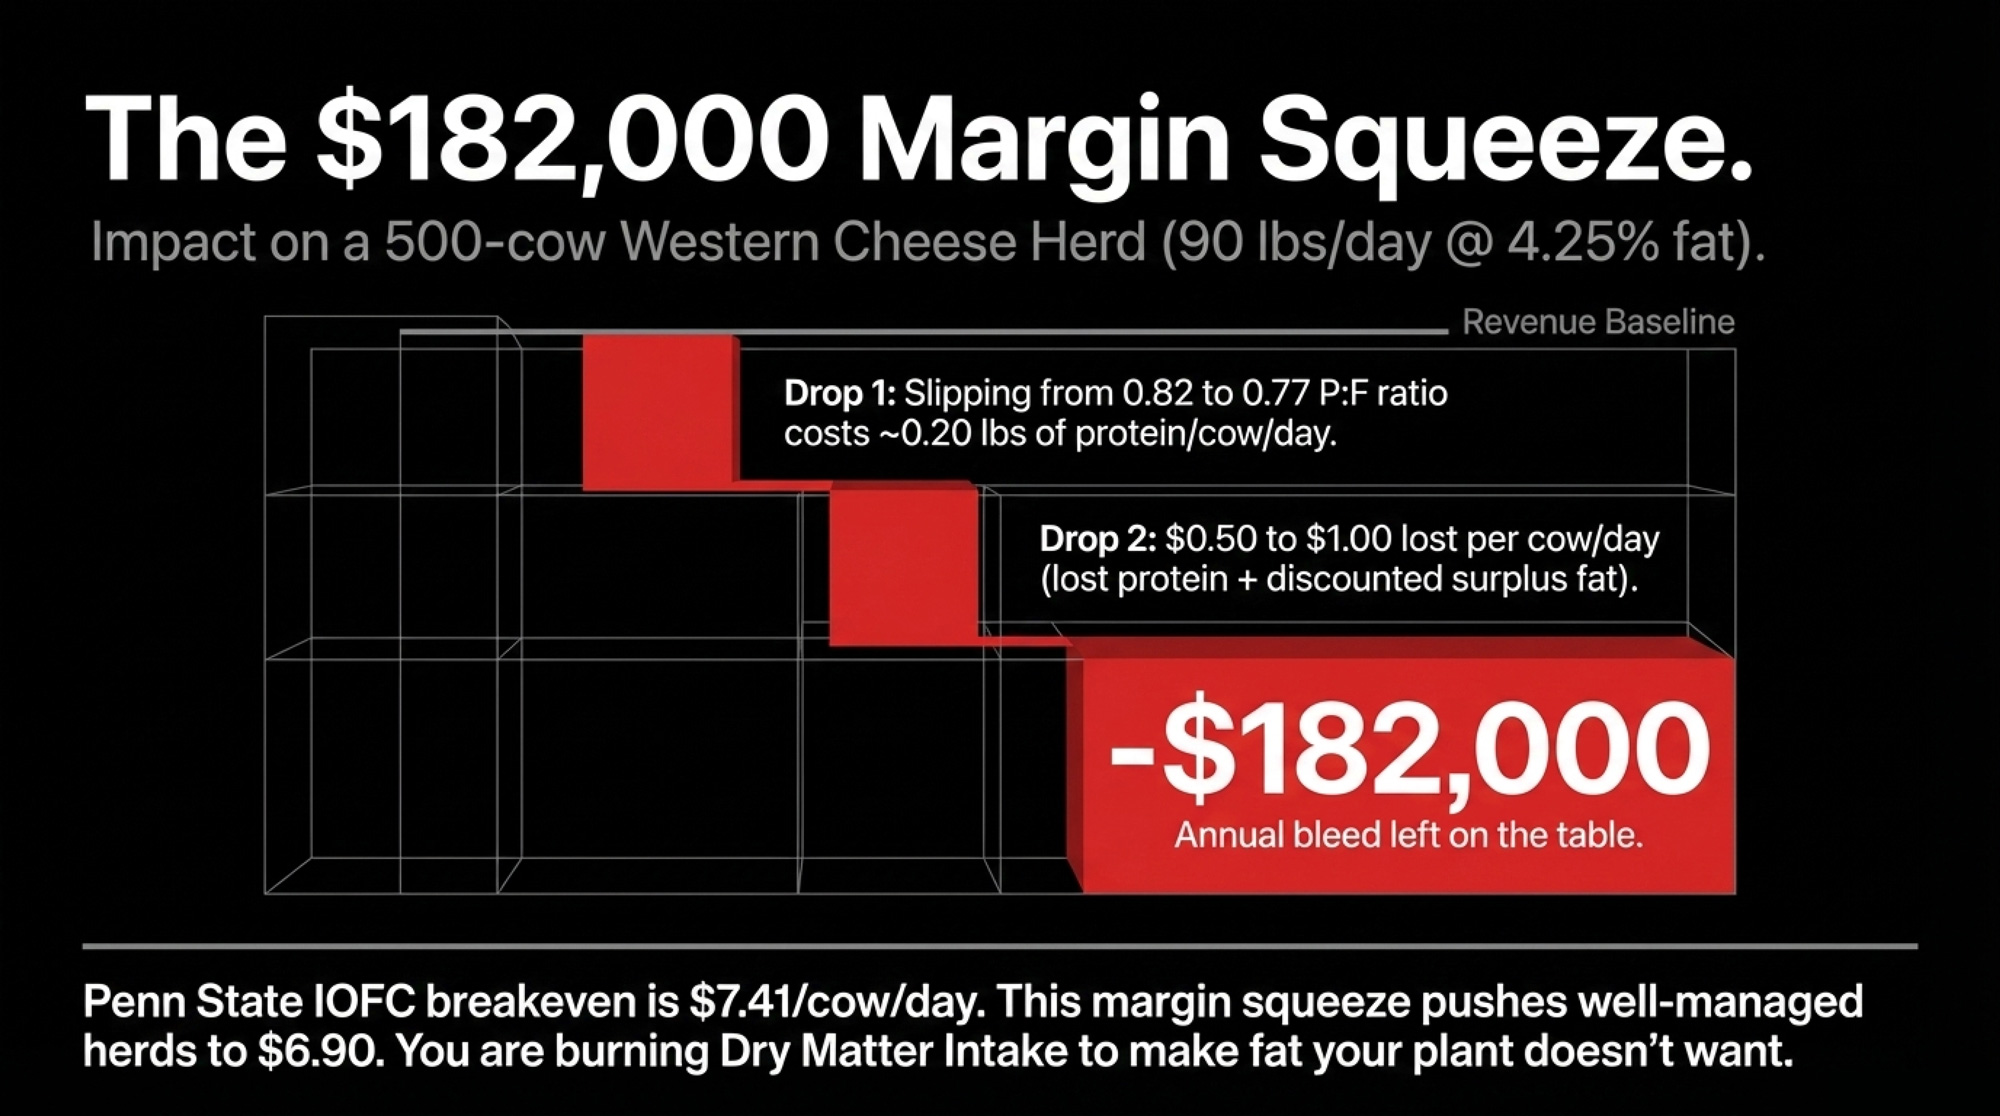
Walk through it with barn numbers. Take a 500‑cow Western cheese herd averaging 90 lb/day and testing at 4.25% fat. At a protein‑to‑fat ratio of 0.82, that herd produces about 3.49% protein. At 0.77, it’s closer to 3.27%. You’re talking roughly 0.19 to 0.22 lb less protein per cow per day, depending on your exact test.
Running the Numbers — 500‑Cow Herd, 2025–26 Prices.
- Lost protein per cow per day: ~0.19–0.22 lb (P: F 0.82 vs 0.77 on 4.25% fat at 90 lb/day).
- Protein value (Class III component price, October 2025 per USDA AMS): $2.8761/lb.
- Daily revenue gap per cow: 0.20 × $2.88 ≈ $0.58.
- Per 305‑day lactation: ~$176 per cow.
- Annual herd‑level impact (500 cows): ~$88,000.
At January 2026’s lower protein price (~$2.18/lb), that same 0.20 lb gap is roughly $0.44/cow/day — about $134/cow per lactation, or ~$67,000 for 500 cows.
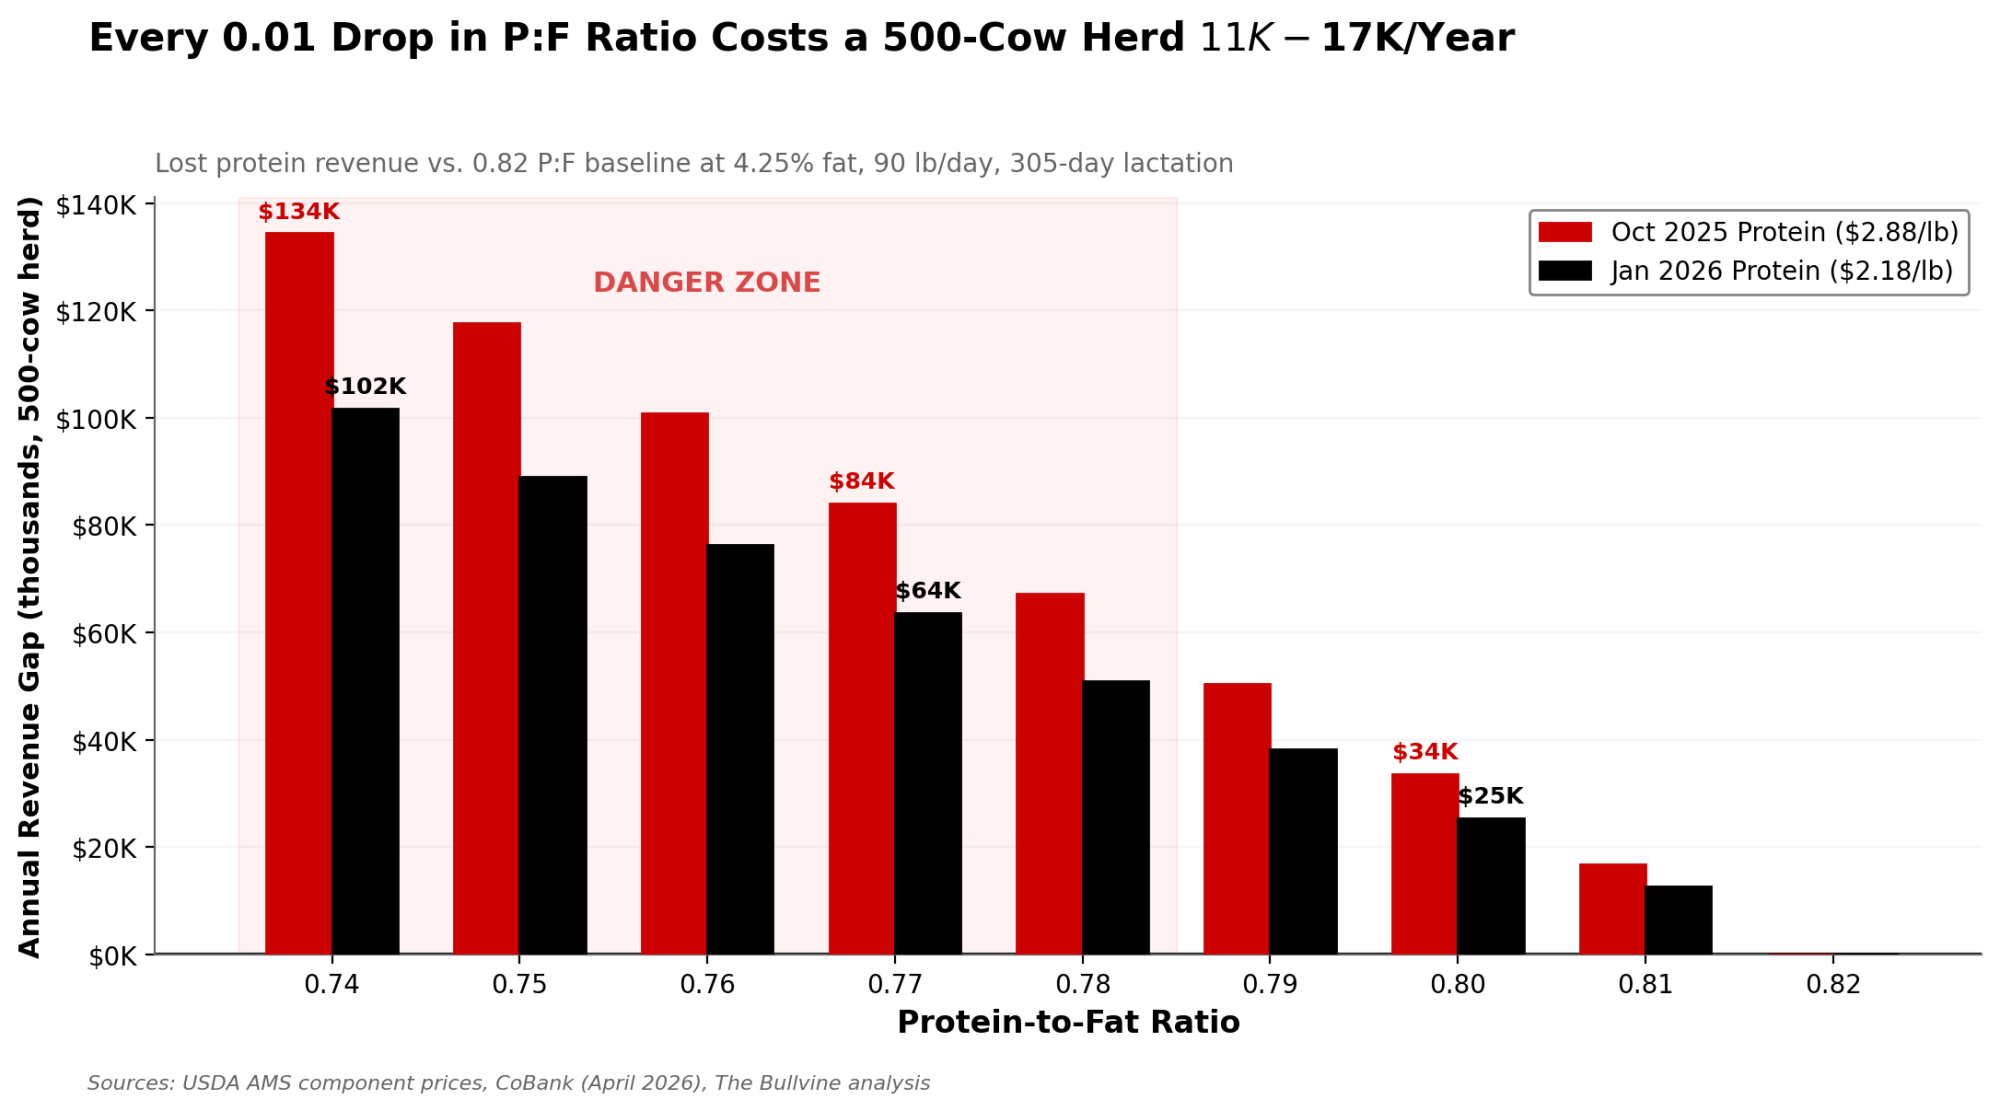
If your plant is also discounting excess fat above standardization targets, the gap can push toward $1.00/cow/day, or roughly $182,000/year, once you account for both lost protein revenue and fat that isn’t being fully valued.
There’s a feed‑efficiency angle here too. High‑fat milk generally comes with a higher metabolic demand. When butterfat is cheap, and protein is where the money is, you’re not just leaving revenue on the table — you’re burning Dry Matter Intake to make pounds of fat your plant doesn’t really pay for.
Through 2025, co‑op field staff told The Bullvine their plants were handling the fat glut with weaker fat differentials, caps on premiums, and discounted rates on surplus above standardization targets. In several cases, producers shipping at around 4.3% fat and 3.0% protein found that neighbors shipping at 3.9% fat and 3.2% protein were getting better net checks. The plant’s economics reward protein and balanced solids, not maximum fat. Public contract language confirming this is scarce, but the field reports from multiple Western cheese plants were consistent.
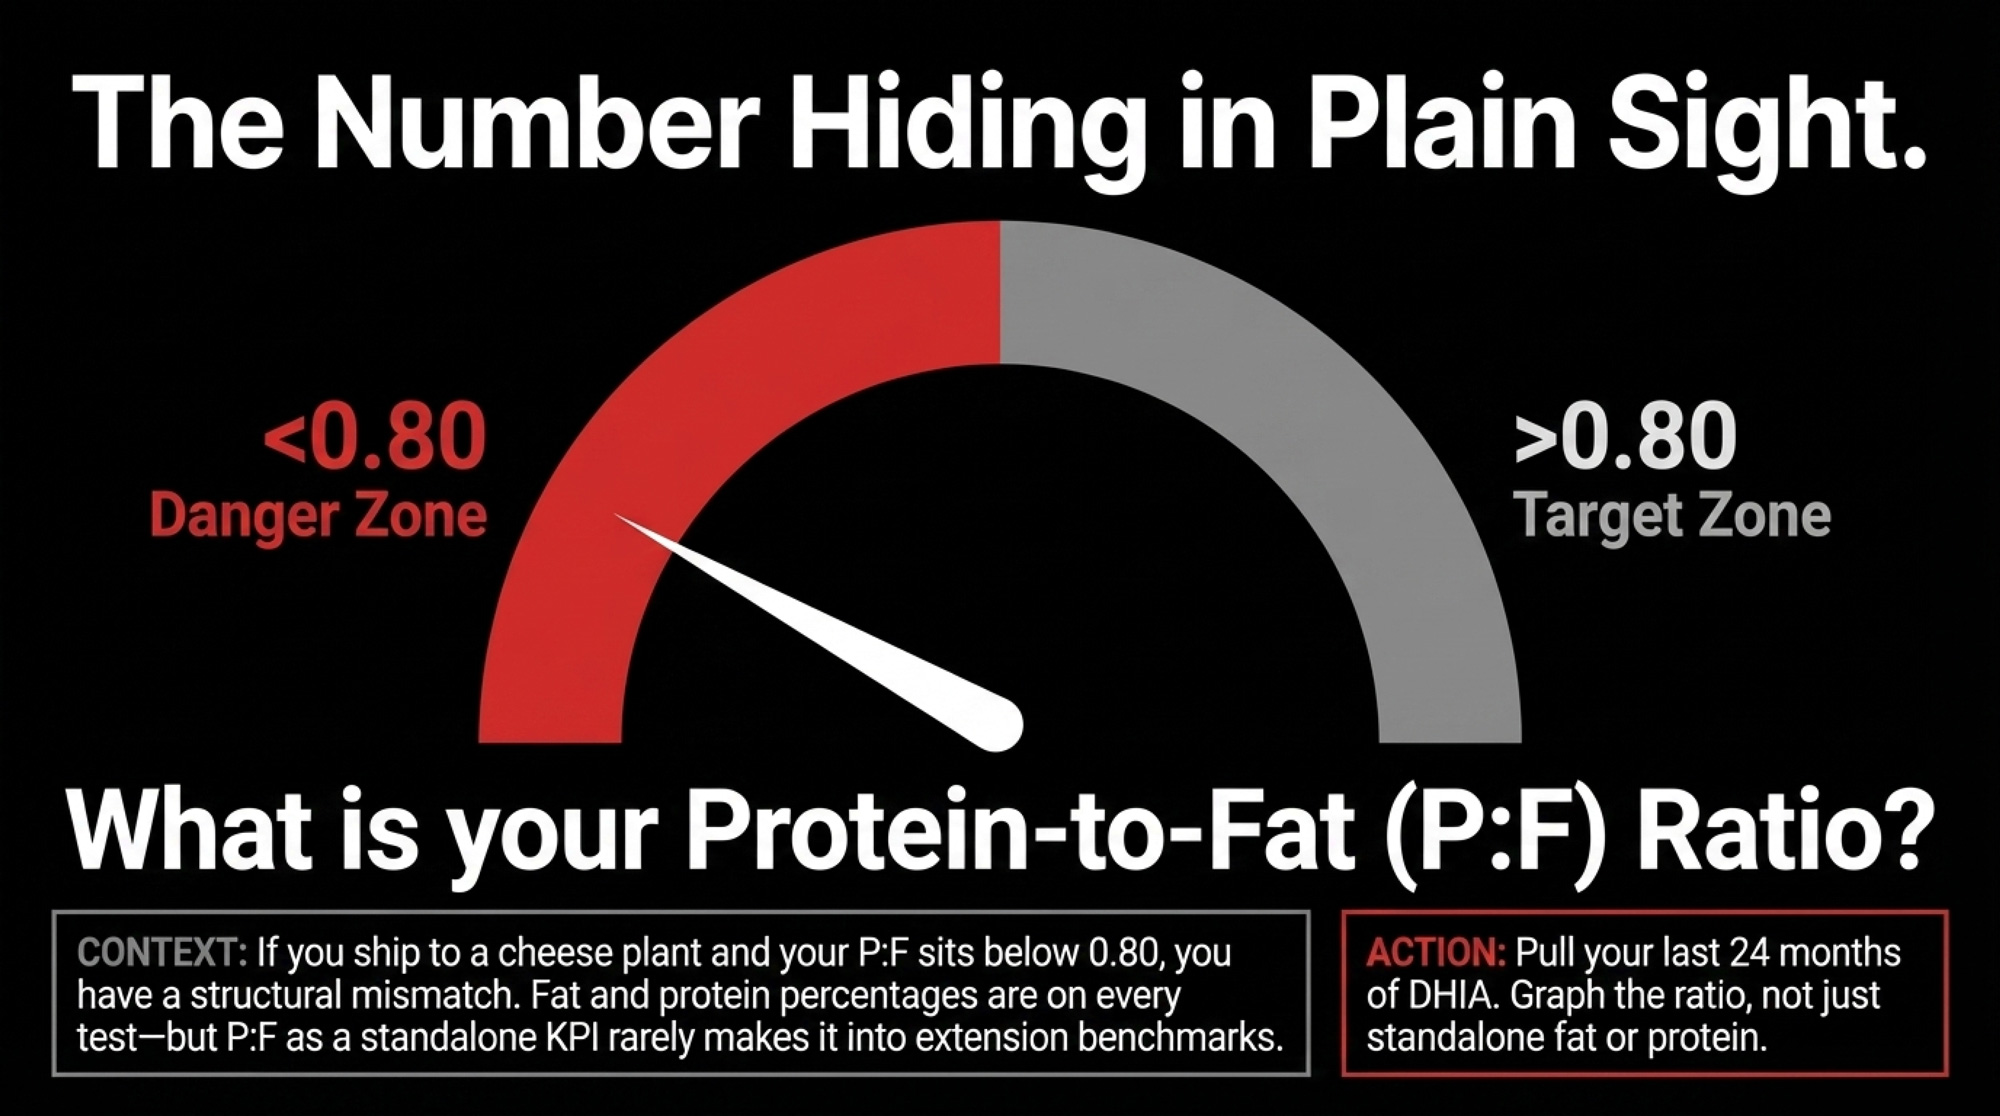
The number that rarely shows up on a DHIA summary — and probably should — is the protein‑to‑fat ratio itself. Fat and protein percentages are on every test and every milk check. P: F as a standalone KPI rarely makes it into extension benchmarks or co‑op field reports. It hides in plain sight.
What Protein‑to‑Fat Ratio Should Western Cheese Herds Target?
Geiger told a USDA Outlook audience in February 2025 that over 80% of U.S. farmgate milk now goes into manufactured products by volume— cheese, butter, powders, yogurt. Those products depend on milk solids, especially protein. Fluid volume is secondary.
CoBank’s April 8, 2026, report called the U.S. “structurally short on protein” and argued that butterfat would have to find new markets, with exports doing a lot of the work. The August 2025–March 2026 whiplash in Class IV futures — more than $5/cwt swings in five months — was the market trying to digest that imbalance. That wasn’t a one‑off.
There’s early evidence that herds are responding on the nutrition side — but don’t mistake a ration tweak for a genetic fix. Geiger noted in an April 3, 2026, analysis that U.S. protein pounds grew 3.8% to 6.0% from December 2025 through February 2026, while butterfat growth ran 3.6% to 5.4% over the same window — meaning protein outpaced fat for three consecutive months. That’s encouraging, but it’s almost certainly a feed and management response: amino acid balancing, starch adjustments, forage quality improvements. The genetic composition of the milking herd hasn’t changed yet. It can’t — the biology won’t allow it for another two to three years.
For a 500‑cow Western herd on the wrong side of the component curve, the correction timeline is pinned by biology:
- Sire changes you make in spring 2026 create heifers born early 2027, freshening late 2028 or early 2029.
- Meaningful herd‑level P: F shift shows up in 2029–2030, as those corrected daughters replace 2019–2022 genetics through culling and normal turnover.
That’s a three‑to‑five‑year window where you’re structurally behind the neighbor who already fits their plant.. At $0.50 to $1.00/cow/day — the range implied by the math above — a 500‑cow operation faces roughly $91,000 to $182,000 per year in margin gap.
How much room do you actually have? The Bullvine’s analysis in “Ishler vs. Ferreira: The Feed‑Cost Trap Hiding $547,500 in Your IOFC” showed Virginia Ishler’s Penn State Extension IOFC benchmark puts breakeven at $7.41/cow/day. In March 2026, Class III prices of $16.16/cwt per USDA AMS, when applied to Ishler’s IOFC framework, put a typical well‑managed herd at roughly $6.90/cow/day in IOFC. Losing $0.50 to $1.00 off that base is a 7% to 15% margin haircut — sustained over years, not months. It pushes a lot of herds below that $7.41 breakeven.
Is Your AI Rep an Advisor or Just Moving Product?
AI companies saw the same CoBank charts, the same HighGround Dairy price curves, and the same USDA component production trends you’re seeing now. They were in a better position than any one farm to notice that NM$ was still fat‑heavy while the market started paying for protein.
From what we saw in catalogs and on‑farm conversations, many breeding programs were still leaning on fat‑heavy lists even after butter had slipped under $2.00.
That’s why the question can’t just be “when did they update my lineup?” It has to be, “Is my program built around my plant’s economics, or around whatever semen the catalog happens to be pushing?”
The CDCB board that approves NM$ revisions includes AI companies, breed associations, co‑ops, and producers. A 0.992 correlation between old and new NM$ reflects an intentional choice to prioritize stability and avoid major reranking. In practice, that stability also means existing semen inventories and marketing narratives face less disruption when economics change. When “little reranking” is celebrated as a success, it signals that the system is prioritizing index stability — sometimes at the expense of how quickly you can pivot with the market.
VanRaden’s description of NM$ as a lifetime profit index under “average U.S. conditions” is technically right. Smoothing noise is part of the design. But in a genomics era where you can change a herd’s direction every 2.5 years, an index recalculated every few years off trailing prices becomes a rear‑view mirror. If you use it unthinkingly, you’re steering by where the market was, not where your milk check is today.
How Should Western Herds Recalibrate Sire Selection in 2026?
You can’t fix the cows that have already freshened. You can stop digging the hole deeper and line up your breeding, feeding, and risk tools with where your plant is actually making money.
| Timeline | Action | Target Metric | Red Flag If… |
|---|---|---|---|
| Next 30 days | Pull 24 months of DHIA, calculate P:F ratio trend | P:F ratio graphed monthly | P:F below 0.80 and trending down |
| Next 30 days | Get plant’s ideal composition in writing | Plant-specific P:F target | Rep can’t provide a number |
| Next 30 days | Audit sire lineup: flag bulls where PTA Protein < 60% of PTA Fat | % of lineup meeting threshold | More than 40% of bulls fail |
| Next 90 days | Switch from NM$ to CM$ or custom plant-weighted index | Primary selection index changed | AI rep won’t build a custom index |
| Next 90 days | Implement P:F-aware ration with nutritionist | Monthly IOFC tracking P:F, target +0.1–0.2 pt protein test | No monthly IOFC report; IOFC below $7.41/cow/day |
| Next 90 days | Run DRP component option analysis | Premium vs. indemnity modeling at your fat/protein tests | Using Class III coverage only when component option fits better |
| 12-month | Genomic test heifer pipeline; sexed semen on top 50%, beef-on-dairy on bottom | % of replacements from protein-indexed matings | Still making replacements from P:F < 0.80 dams |
| 12-month | Stress-test 3-year cashflow with $0.50–$1.00/cow/day drag | Cashflow model at current cow count | Model breaks at $0.50/cow/day drag |
| 12-month | Evaluate breed mix / crossbreeding at current protein prices | Protein revenue per lb DMI comparison | Relying on 2021 crossbreeding math |
In the next 30 days:
- Pull your last 24 months of DHIA and calculate your protein‑to‑fat ratio. Not just fat. Not just protein. P: F. Graph it. If you’re below 0.80 and shipping to a cheese plant, you’ve got a problem you can put a number on.
- Call your co‑op or plant field rep: “What’s your ideal milk composition for what you’re manufacturing, and where does my herd sit relative to that?” Get it in writing.
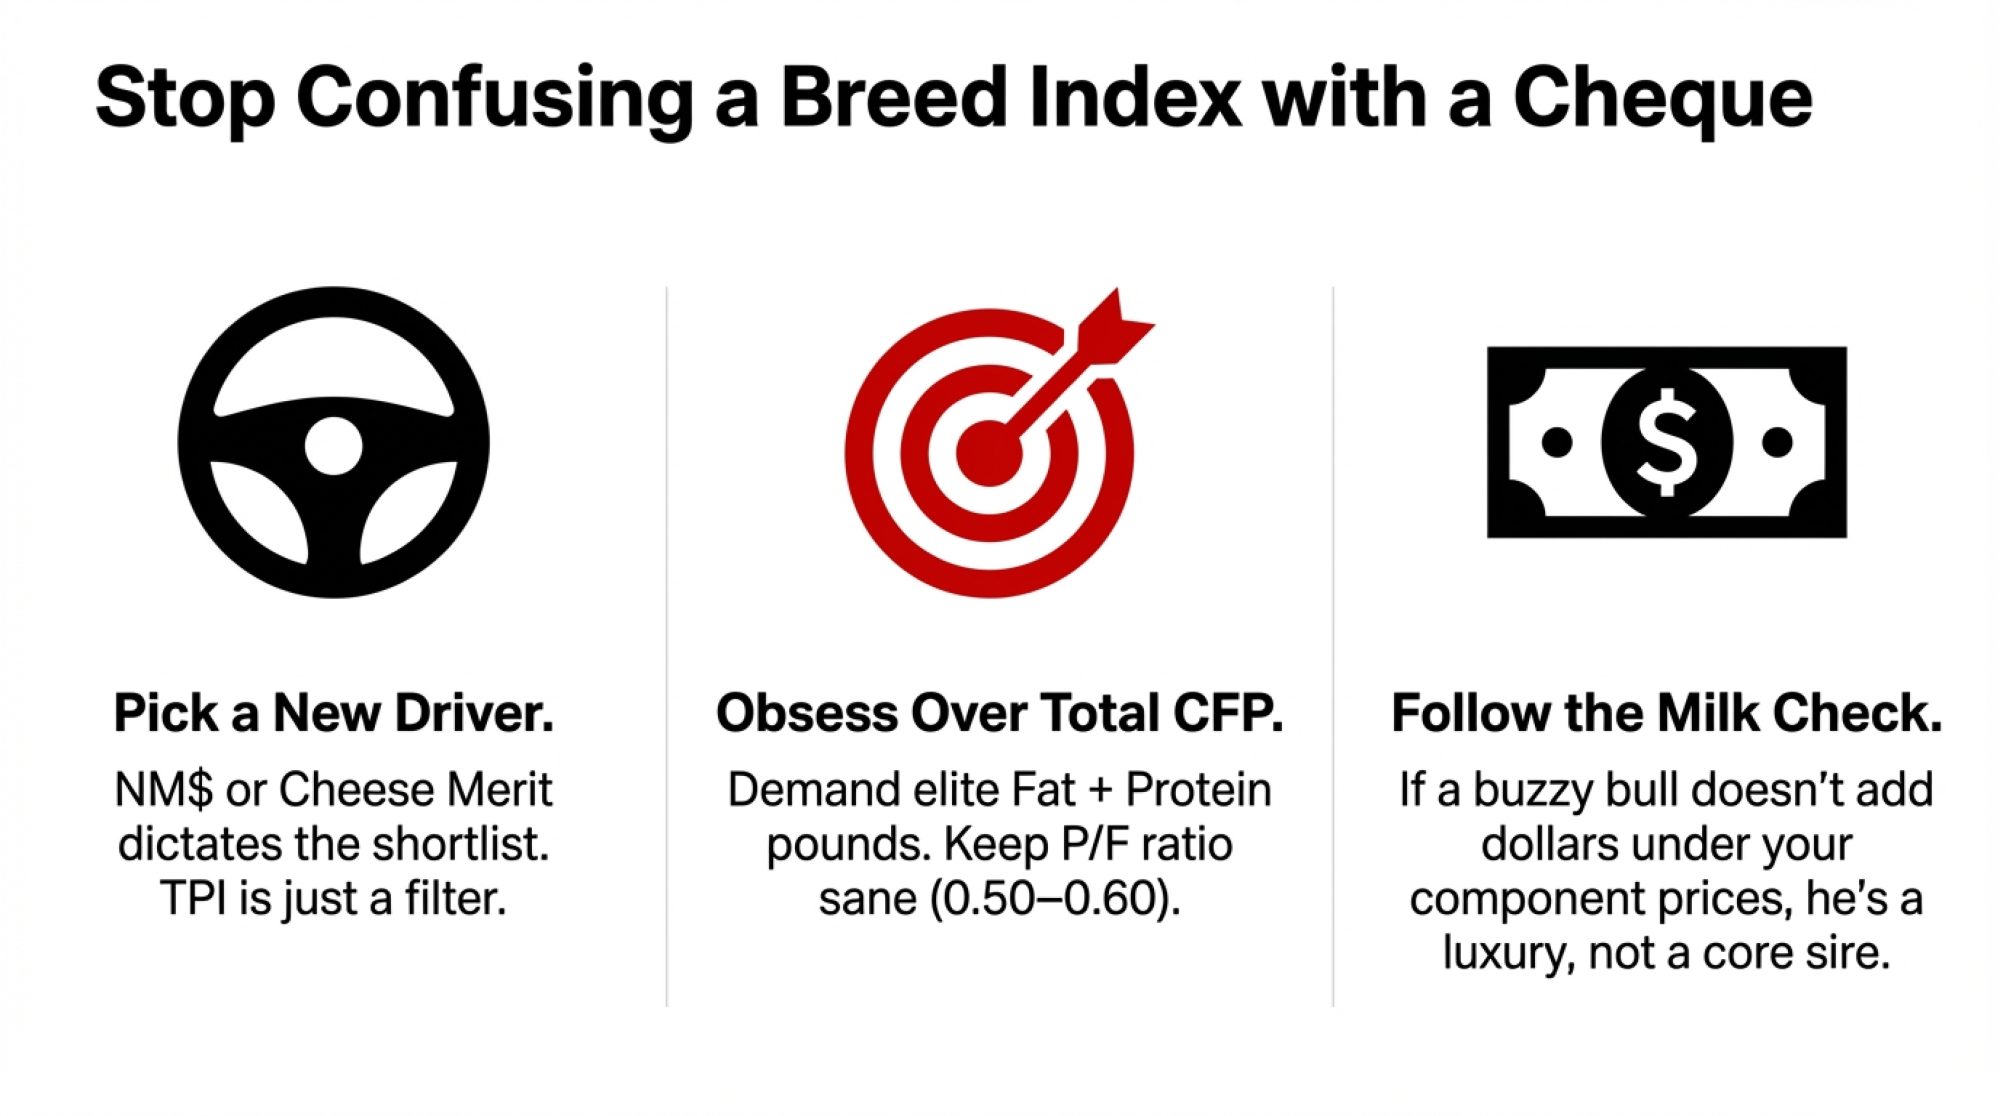
- Sit your AI rep down and flip the agenda. “Show me my current sire lineup’s PTA protein relative to PTA fat. Flag every bull where protein is less than 60% of fat. Those are off the list.” Then ask for a protein‑first custom index ranked specifically for your plant’s economics, not a generic NM$ list.
Red flag: If your rep can’t build a CM$ or custom index that fits your plant’s economics — or won’t show you the list — you’re not getting true advisory support. You’re just being sold semen. Custom indexes are no longer just for the top 1% of herds; in a volatile 2026 market, they are a survival tool for the mid-sized 500-cow operation as well.
In the next 90 days:
- Shift from NM$ as your primary filter to CM$ or a custom plant‑weighted index that pays for protein yield. Make PTA Protein ≥60–70% of PTA Fat your minimum bar on every bull.
- Work with your nutritionist on a P: F‑aware ration. Amino acid balancing, starch management, and forage quality can raise protein tests 0.1–0.2 points without blowing fat up further — but insist on monthly IOFC reports that track P: F, not just crude component percentages. You’ll spend some feed dollars; the goal is to move the revenue side faster while genetics play catch‑up.
- Run a Dairy Revenue Protection (DRP) analysis with your risk advisor. DRP’s component option lets you insure butterfat, protein, and other solids separately. In an Ohio State Extension walkthrough, a 250‑cow herd covering 5,000 cwt on the component option at 4.55% fat and 3.55% protein paid about $0.81/cwt in premium and collected an $8,775 net indemnity when component prices dropped — while the same herd on Class III coverage lost money on the premium. Federal subsidies cover roughly 44–55% of the premium at common coverage levels.
Opportunity signal: When Class III or IV futures spike on short‑term tightness, that’s your window. The August–March 2025–26 swings showed how fast that window opens and closes.
The 12‑Month Reset
Over the next year, you’re not trying to win the race. You’re trying to stop losing ground.
- Genomic test and tighten your female pipeline. Use sexed semen on the top half of heifers ranked on your new protein‑aware index. The bottom half doesn’t need to make replacements. She should be making a black calf. If a cow doesn’t fit the P: F profile your plant needs, her best contribution to your business is a terminal pregnancy, not another daughter just like her.
- Stress‑test a three‑year cashflow with a $0.50–$1.00/cow/day drag. Multiply that by your cow count and plug it into your IOFC and lender conversations. If the model holds at that haircut, you’ve got room to ride out the genetic lag. If it doesn’t, you need a different plan — more scale, a different market, or a different timeline.
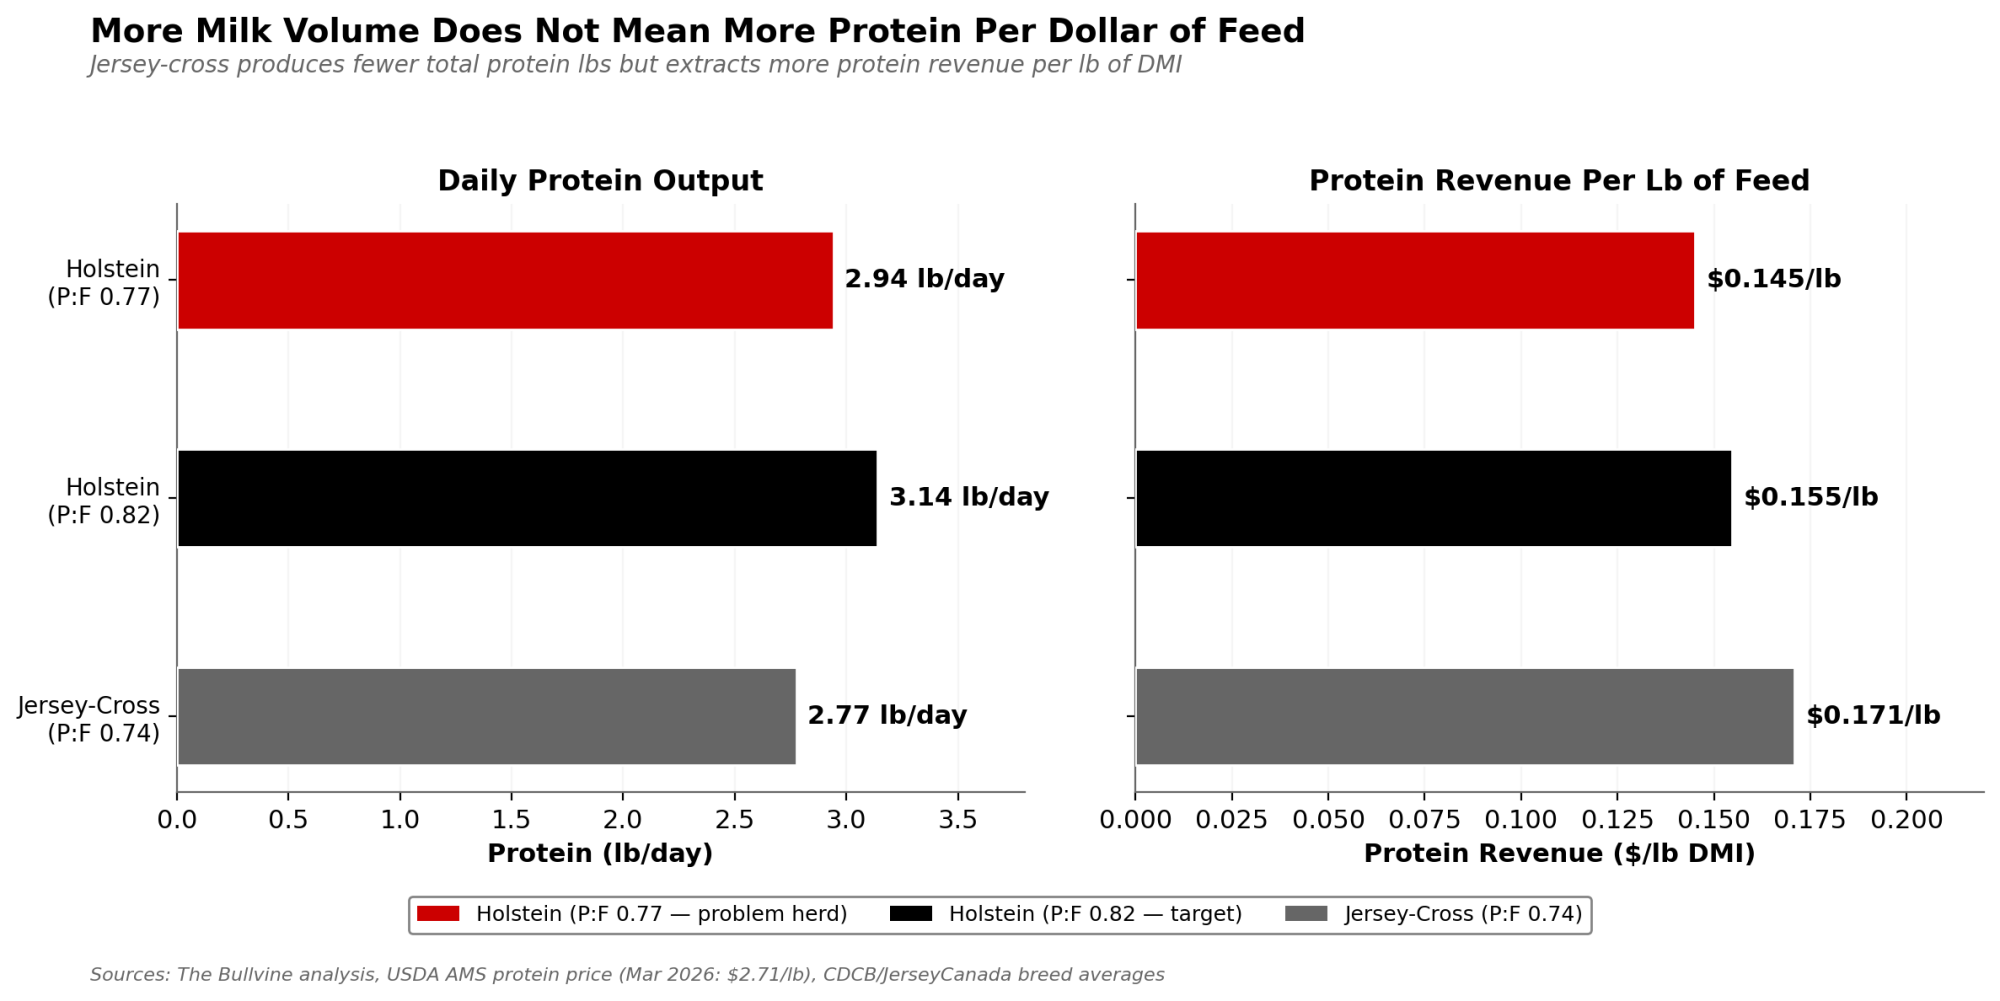
- Revisit breed mix and crossbreeding math at current component prices. Jersey and Jersey‑cross cattle naturally run 3.6%–3.9% protein with strong protein pounds per pound of DMI. At 75 lb/day and 3.7% protein, a Jersey‑cross gives you about 2.78 lb of protein. A Holstein at 90 lb/day and 3.27% protein gives you about 2.94 lb. More total protein, yes — but at a higher feed cost per pound of protein shipped. With protein at $2.00+/lb and fat under pressure, that trade‑off deserves a fresh pencil, not a 2021 one.
What This Means for Your Operation
- Your P: F trend is now a strategic metric. If your protein‑to‑fat ratio has drifted down toward 0.77 while your plant wants protein, that’s a structural mismatch, not just a funny test. Graph it over the last two years and treat it like a KPI.
- Your index choice is a business decision, not a religion. If you’re still picking bulls off NM$ in a high‑protein cheese market, you’re using a rear‑view mirror to steer. Talk to your AI company about CM$ and custom indexes — or find one that will.
- Your cows have to earn their genetics. Any cow that doesn’t fit the plant’s P: F target probably shouldn’t be producing your next replacement. Beef‑on‑dairy isn’t just a fad; for many herds, it’s become the cleanest way to stop cloning a problem, as long as the calf market and packer access pencil out.
- Your insurance should match your actual risk. High‑fat herds in a butterfat‑glut world shouldn’t be hedging like textbook “average” herds. DRP’s component option and well‑timed futures/options can be the difference between riding out volatility and letting it eat your equity.
- Your advisors need to show their work. If your nutritionist can’t quantify how ration tweaks change P: F and IOFC — or your AI rep can’t show you a protein‑first sire list — that’s a performance issue, not just a style difference.
Key Takeaways
- If your protein‑to‑fat ratio sits below 0.80 and you’re shipping to a cheese plant, you’re in the danger band this article describes. Run the per‑cow math with your own component prices and see what that gap costs.
- If your sire lineup is still built off NM$ in 2026, you’re genetically positioned for a butterfat boom that’s already over. Rebuild your list using CM$ or a custom, protein‑weighted index and set hard PTA Protein vs Fat thresholds.
- If your 2027–2029 heifer crop looks just like your 2019–2022 cows on paper, you’ve locked in three more years of margin drag. Use genomics, sexed semen, and beef‑on‑dairy to change that trajectory now.
Nobody’s getting beat up over 2021. Back then, you followed the incentives you were given. The point is to make sure you don’t repeat the same mistake in 2026 — letting a rear‑view‑mirror index and a fat‑first mindset cannibalize your milk check for another three to five years. The market’s told you what it values. The question now is whether your genetics, your feed, and your advisors are listening.
Complete references and supporting documentation are available upon request by contacting the editorial team at editor@thebullvine.com.
Learn More
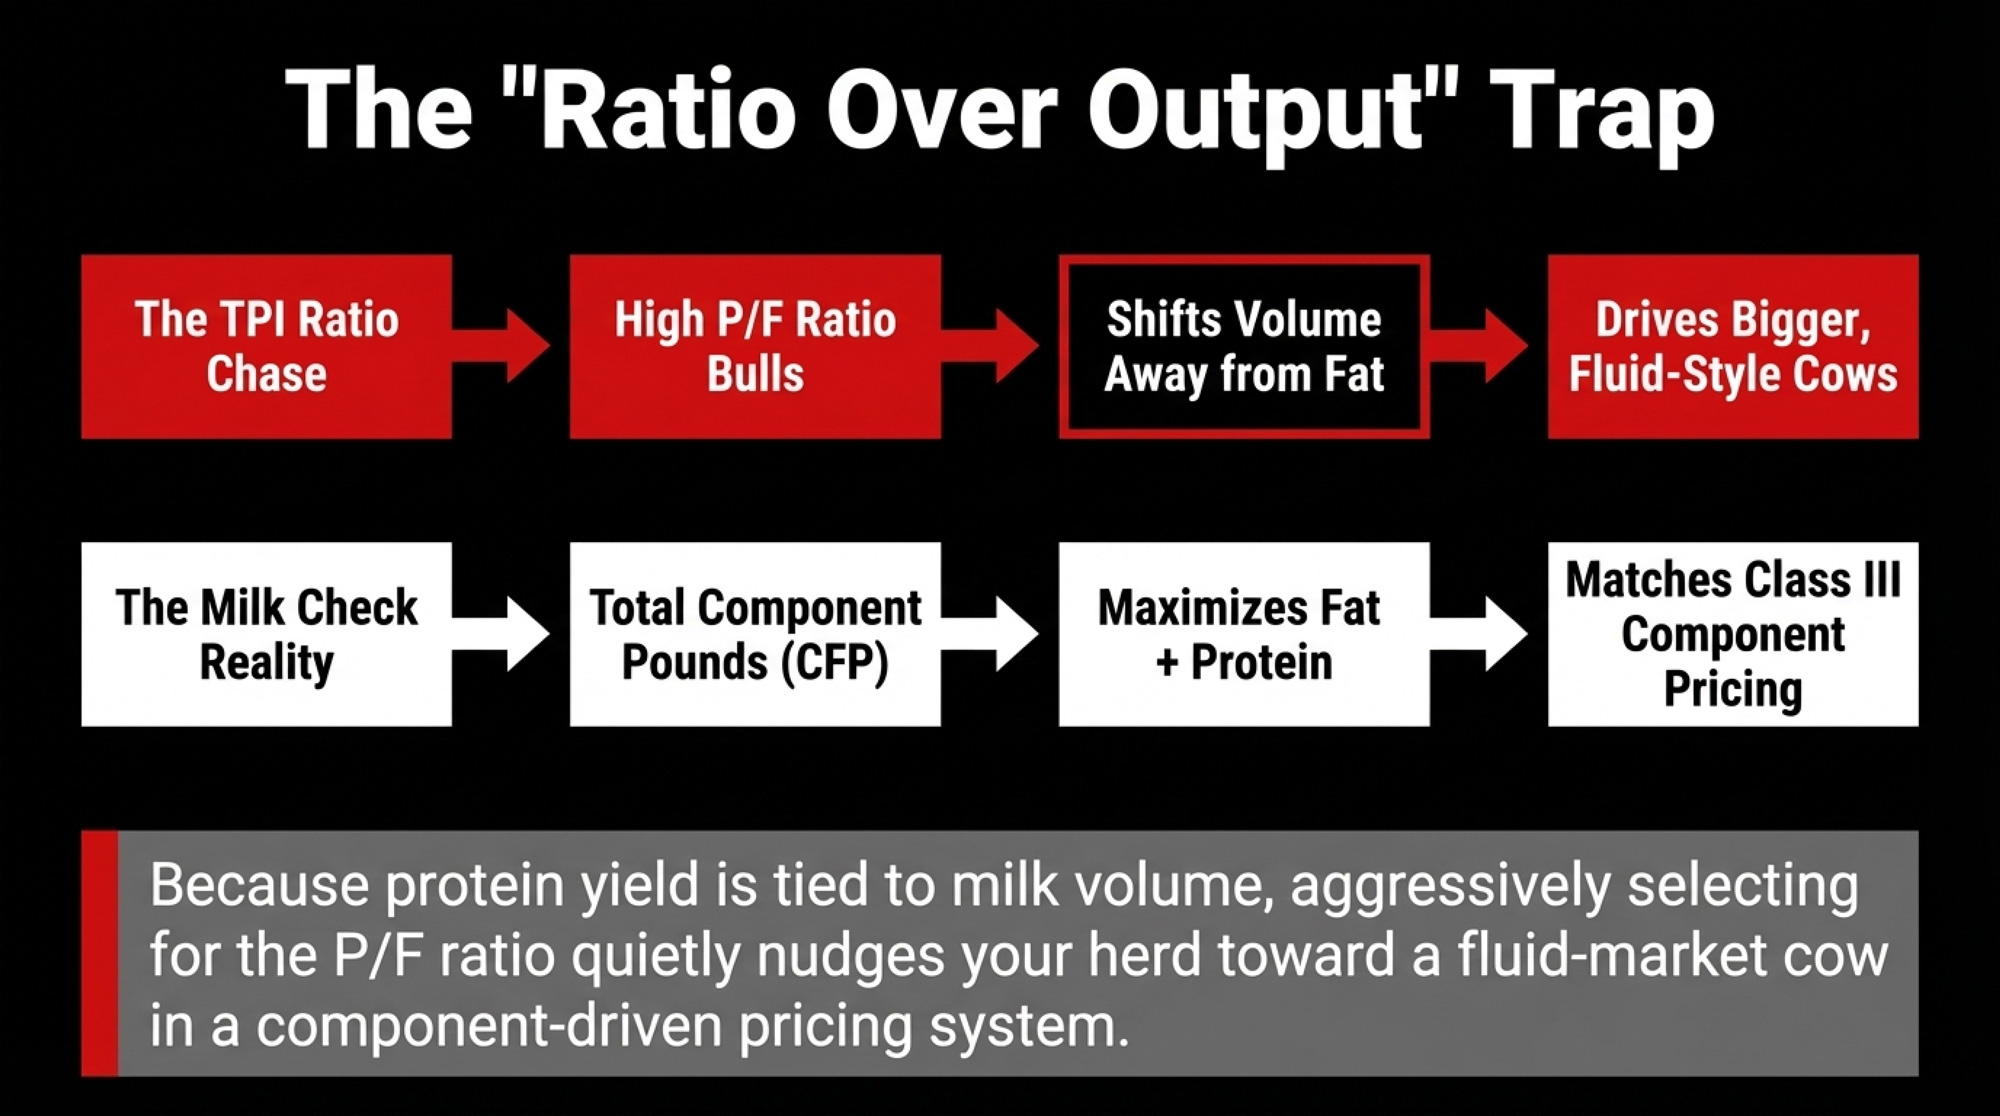
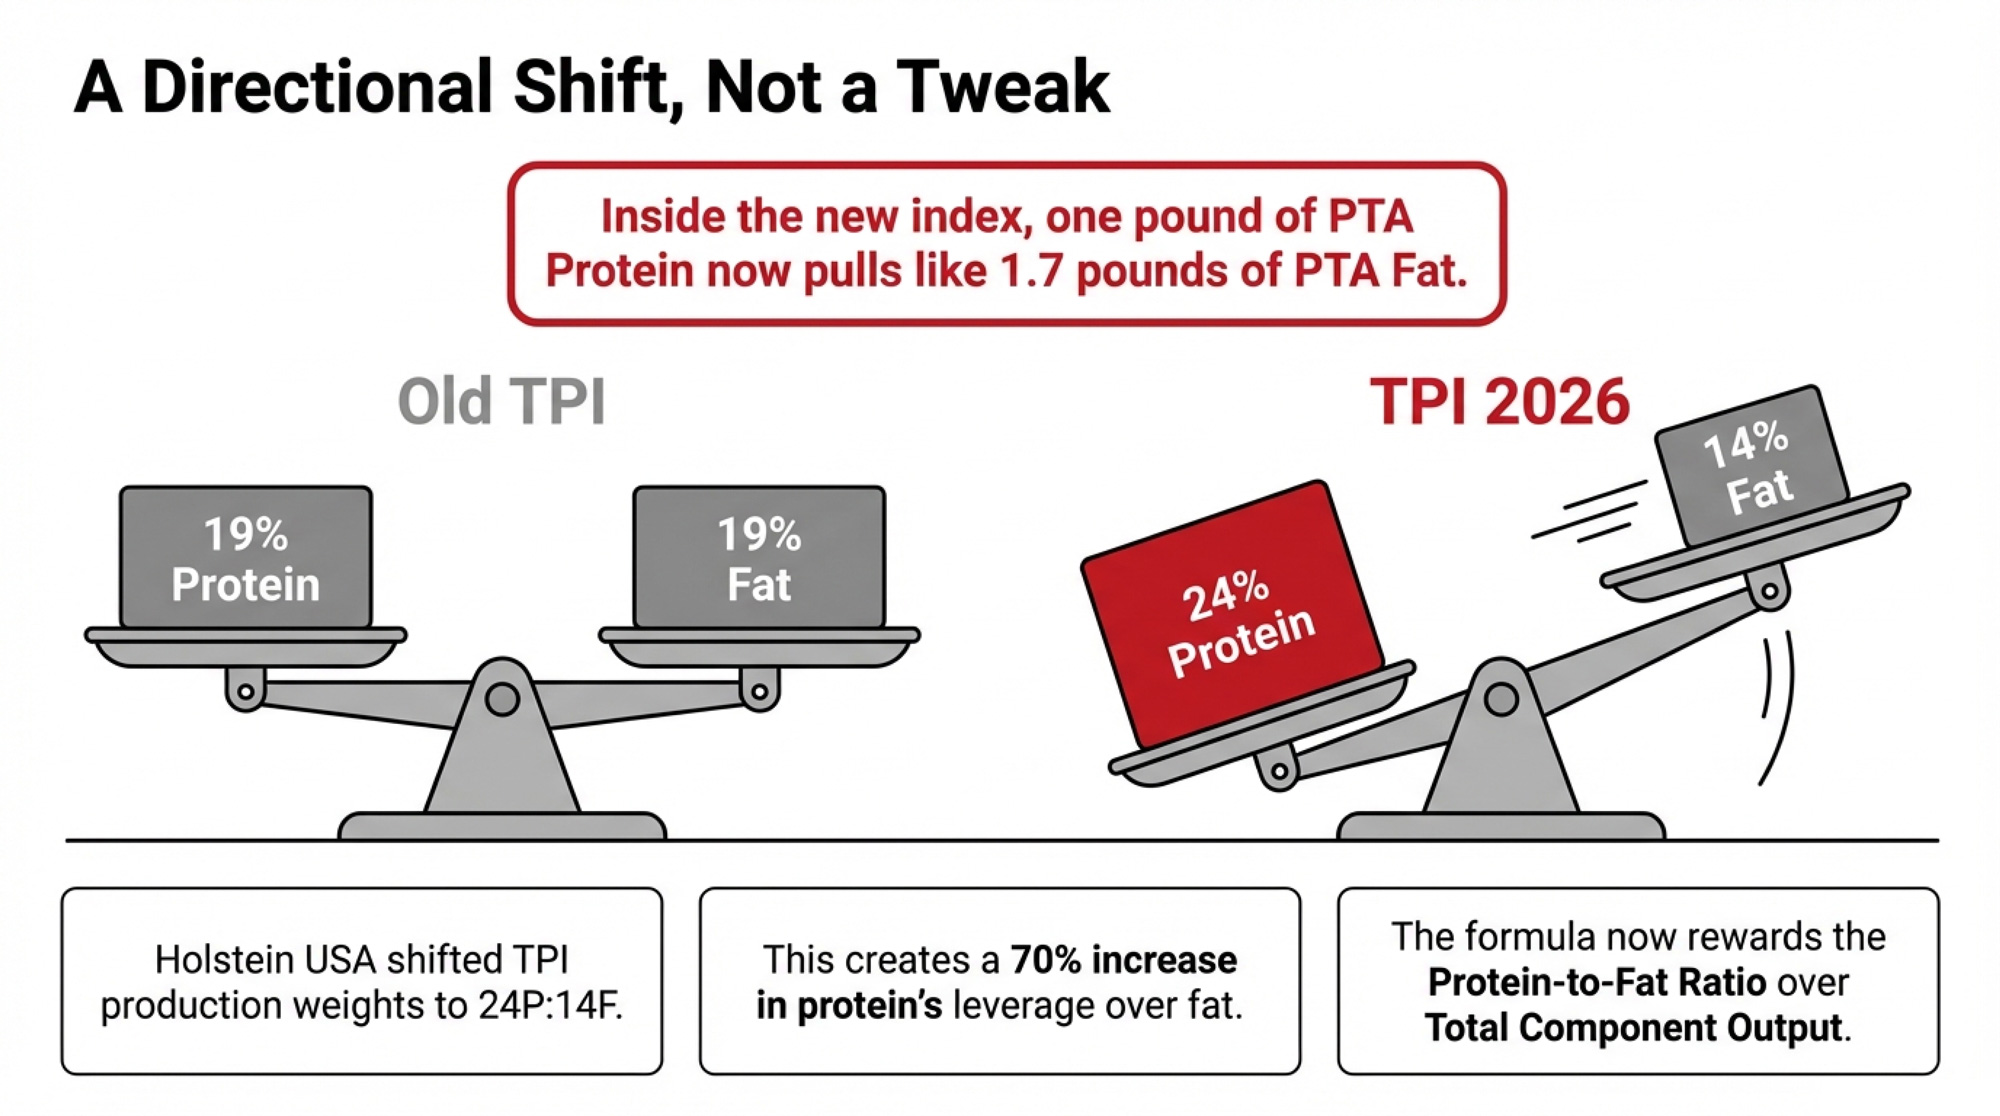
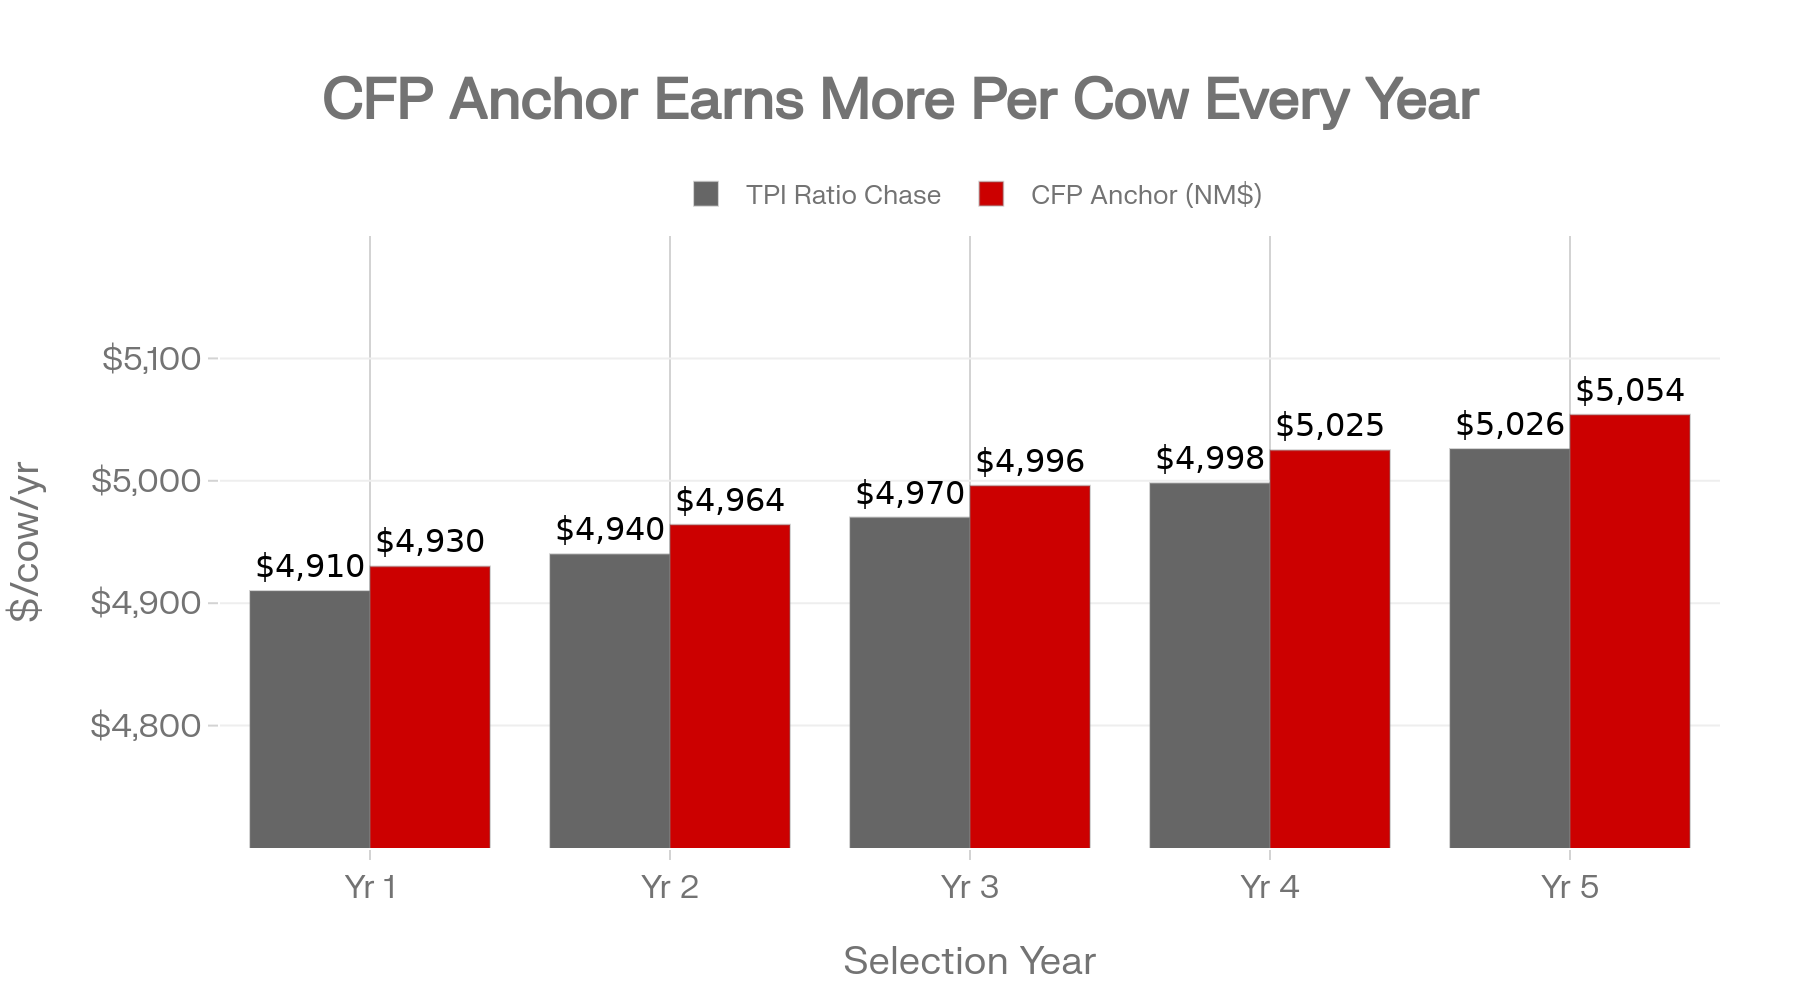
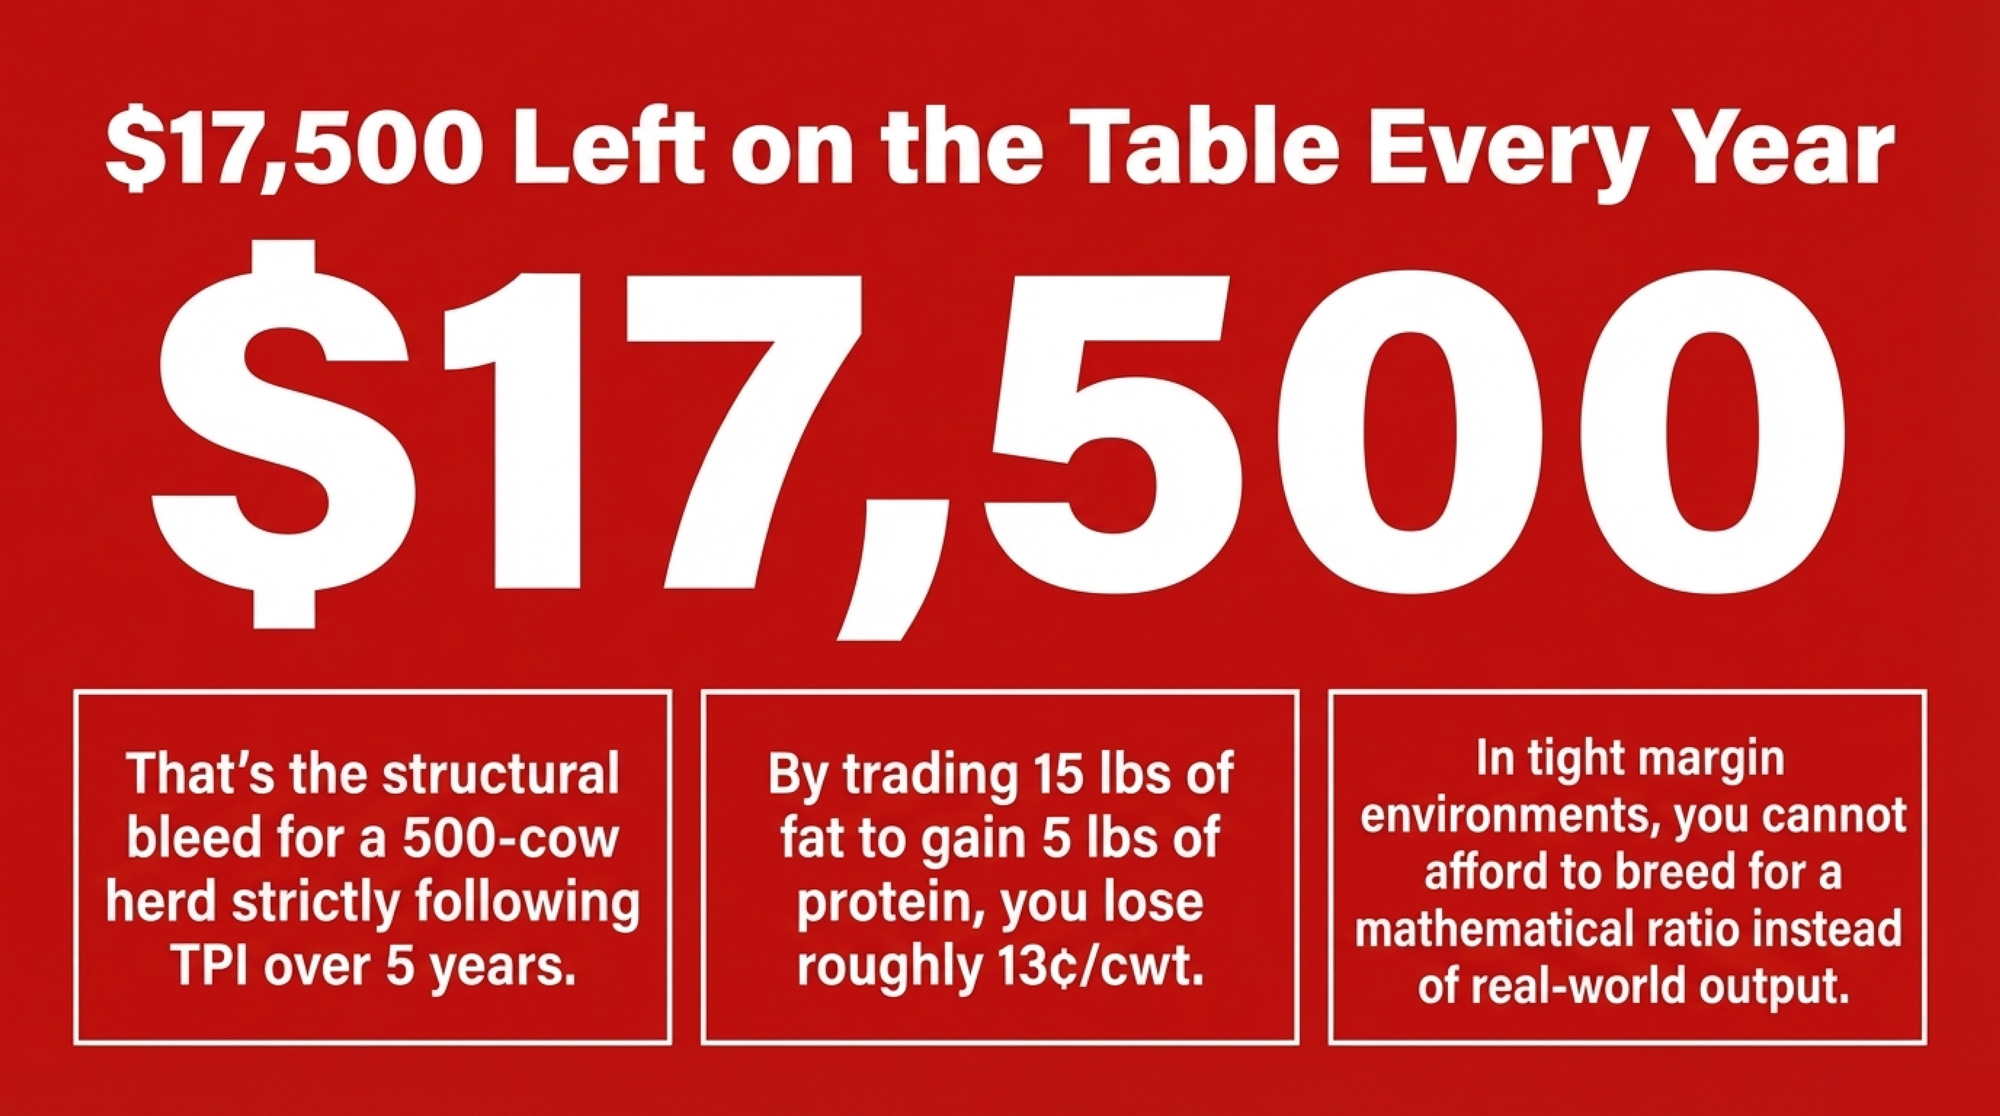
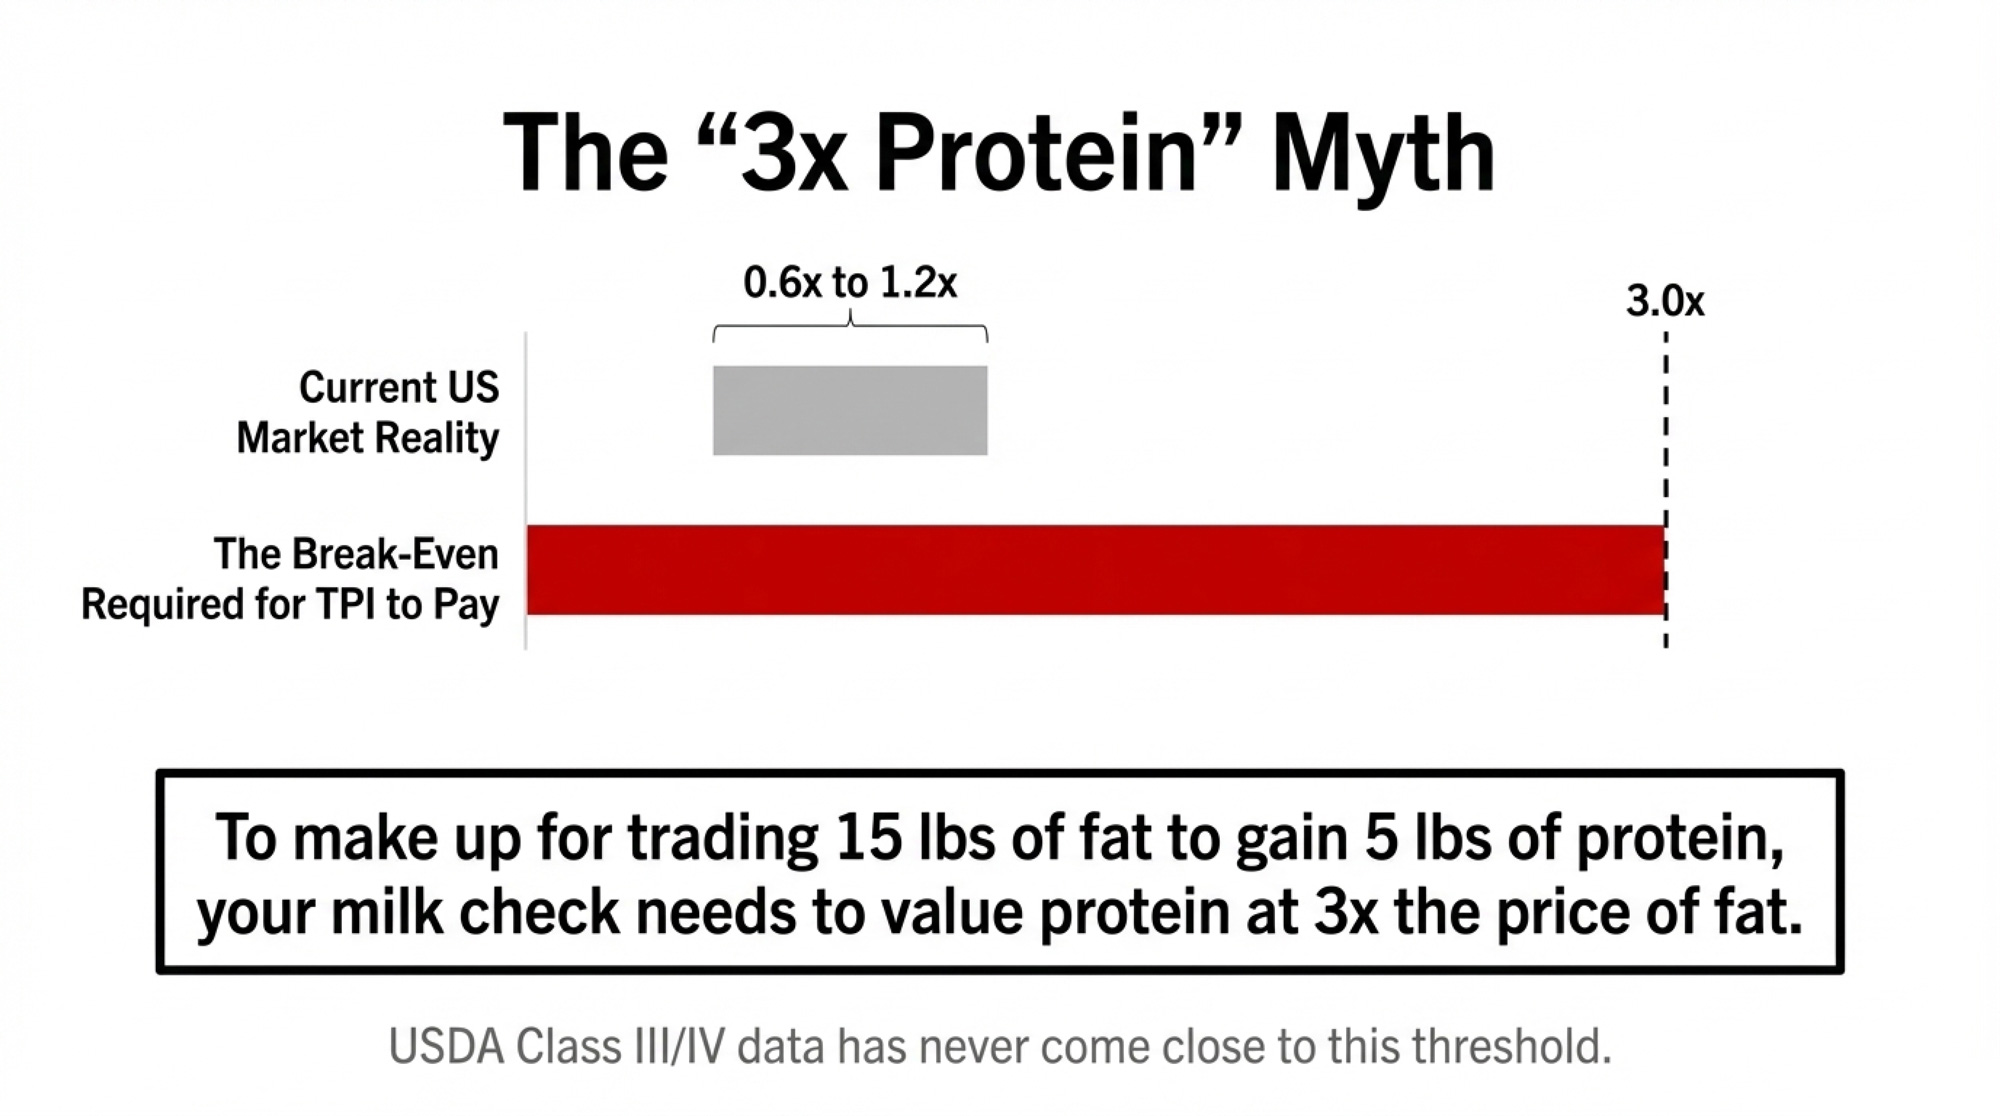
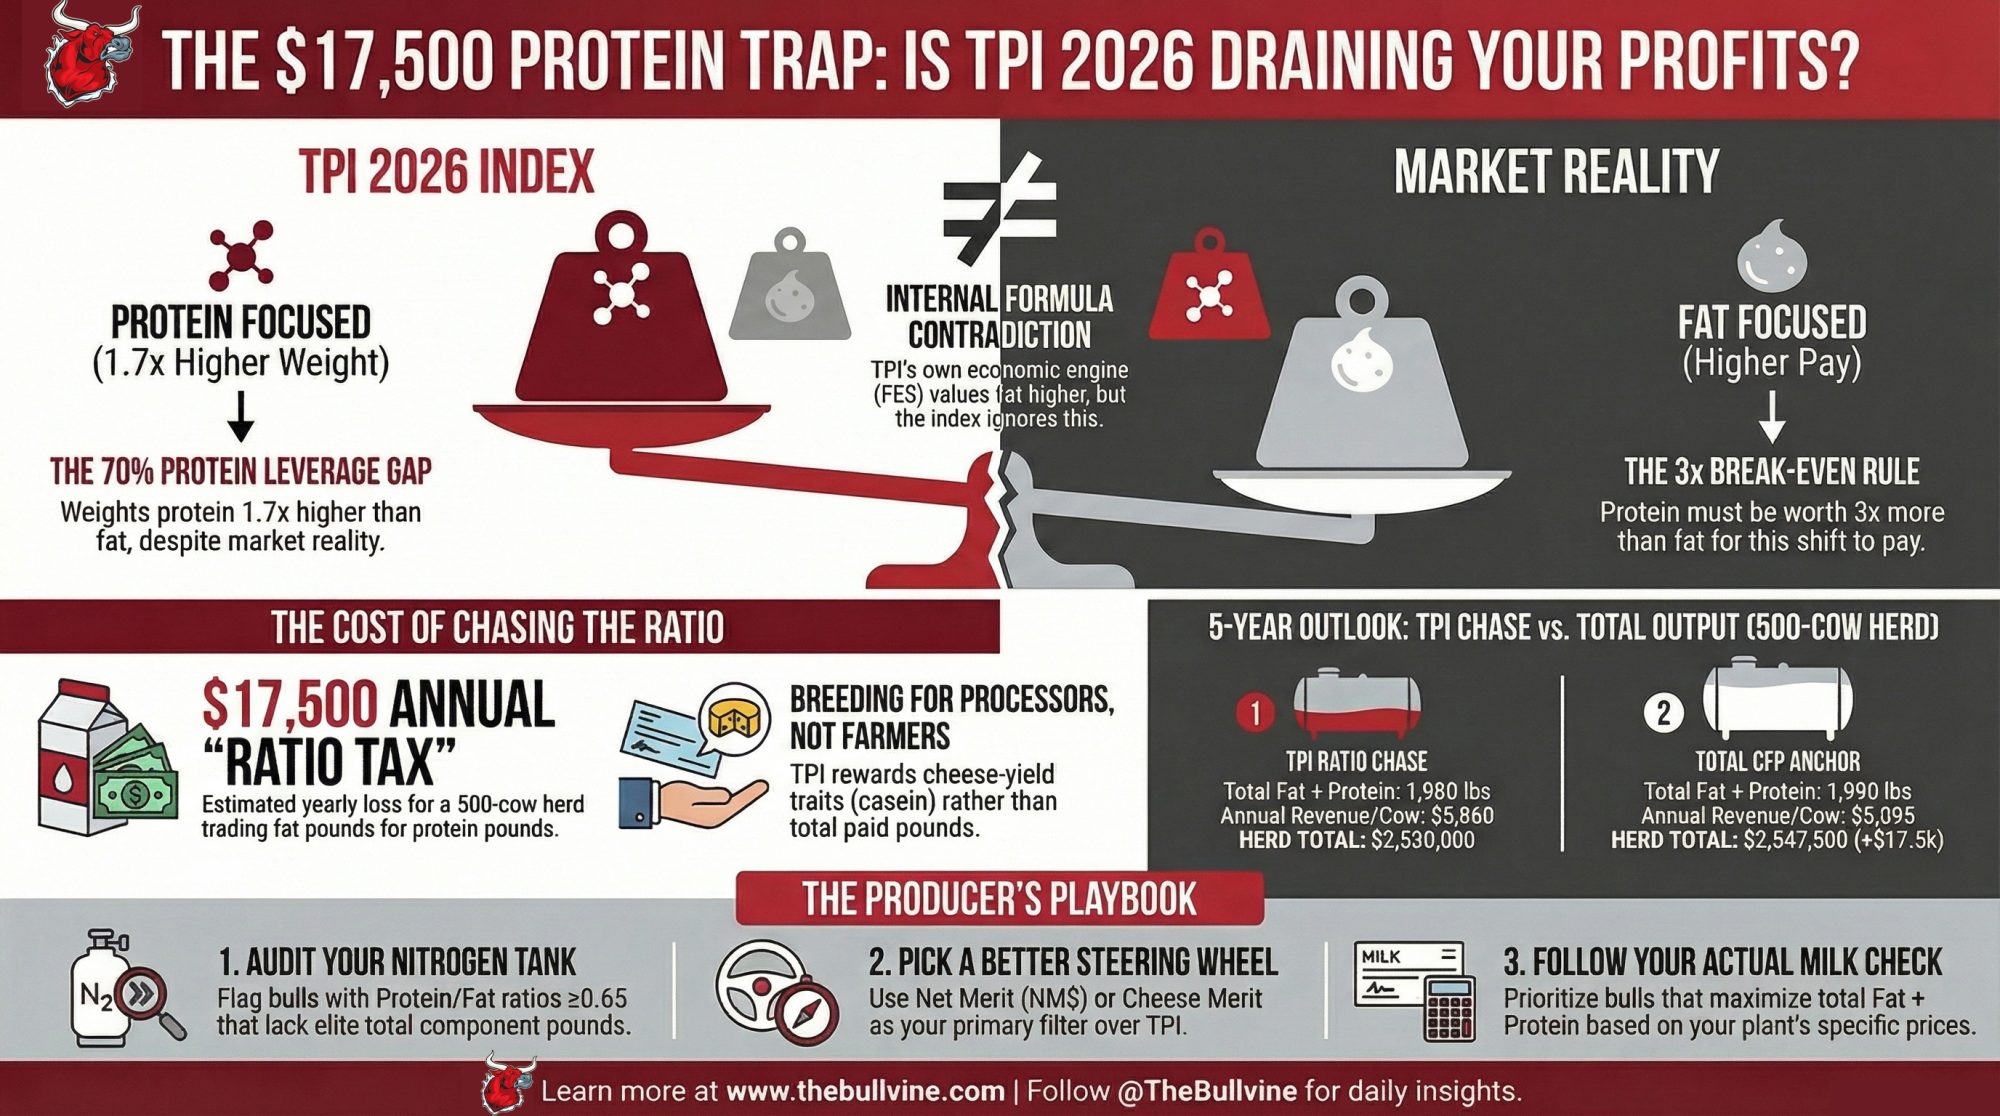
- TPI 2026’s $17,500 Protein Trap: Breeding Holsteins for a Protein Market That Doesn’t Exist – Exposes the dangerous gap between theoretical index weights and your real-world milk check. This deep dive delivers a 10-step operational audit to stop you from overpaying for protein genetics that your current market may actually be discounting.
- Same Milk, Different Payday: How Your Processor’s Product Mix Shapes Your Future – Arms you with the strategic framework to align your herd’s biological output with your processor’s specific product mix. It reveals why following national benchmarks in a specialized region leads to thousands in lost component premiums.
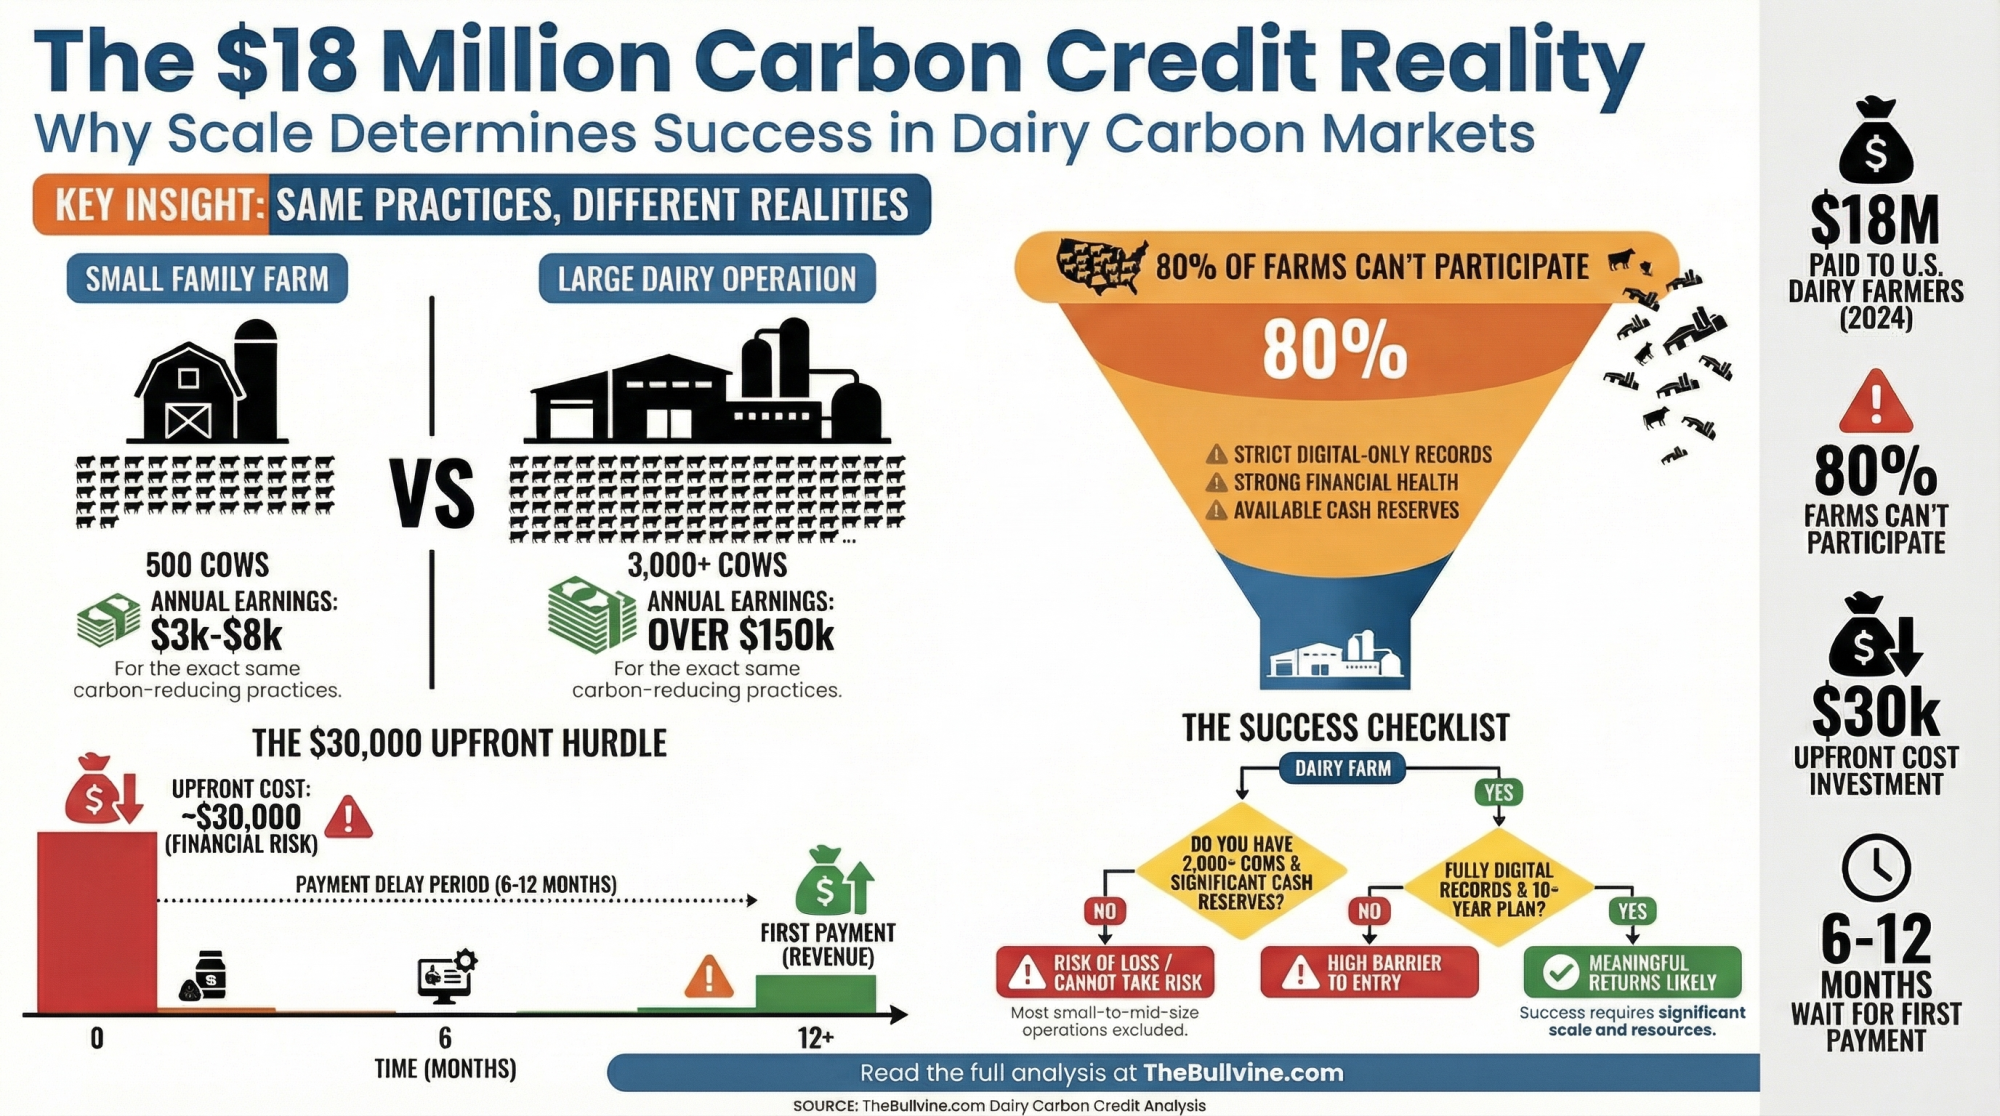
- $3,010 Per Heifer. 800,000 Short. Your Beef-on-Dairy Bill Is Due. – Breaks down the structural reset of the U.S. heifer pipeline and the $4,000 replacement reality. It reveals how to leverage genomic testing and beef-on-dairy to secure immediate cash flow without sabotaging your herd’s 2028 survival.
 The Sunday Read Dairy Professionals Don’t Skip.
 The Sunday Read Dairy Professionals Don’t Skip.
Every week, thousands of producers, breeders, and industry insiders open Bullvine Weekly for genetics insights, market shifts, and profit strategies they won’t find anywhere else. One email. Five minutes. Smarter decisions all week.