


If your inbreeding is over 9.99% and FSAV isn’t on your proof sheet, Net Merit 2025 is using you — not the other way around.
Executive Summary: Net Merit 2025 added a $57‑per‑point “weight tax” on big Holsteins by cutting Body Weight Composite to ‑11% and lifting Feed Saved to 17.8% of NM$, pushing the breed toward smaller, feed‑efficient cows. Fat now carries 31.8% of the index, protein just 13%, and cow/heifer Livability has more pull, so the model rewards components and survival over sheer size. New calf‑health evaluations — CDCB’s DIAR/RESP and Lactanet’s Calf Health RBVs — reveal that daughters of top 5% sires stay healthy 15–18 percentage points more often than daughters of the worst bulls, and a single respiratory event costs about 121 kg in first‑lactation milk. Meanwhile, average inbreeding for Canadian Holstein heifers hit 9.99% in 2024, and JDS work shows recent inbreeding hurts longevity more than older, diluted inbreeding, raising real questions about how we’re using genomics. Rosy Lane Holsteins leans hard into NM$, FSAV, and calf‑wellness indexes, but still filters out extreme‑stature bulls and ignores classification that doesn’t help profit, showing how to use the system without letting it run the herd. The practical playbook: pair NM$ with reliability, make FSAV and calf health non‑negotiable filters, keep your top three bulls below ~40% of expected future inbreeding, and, in the next 30 days, sit down with your proofs to see if Net Merit’s priorities actually match how your farm makes money.
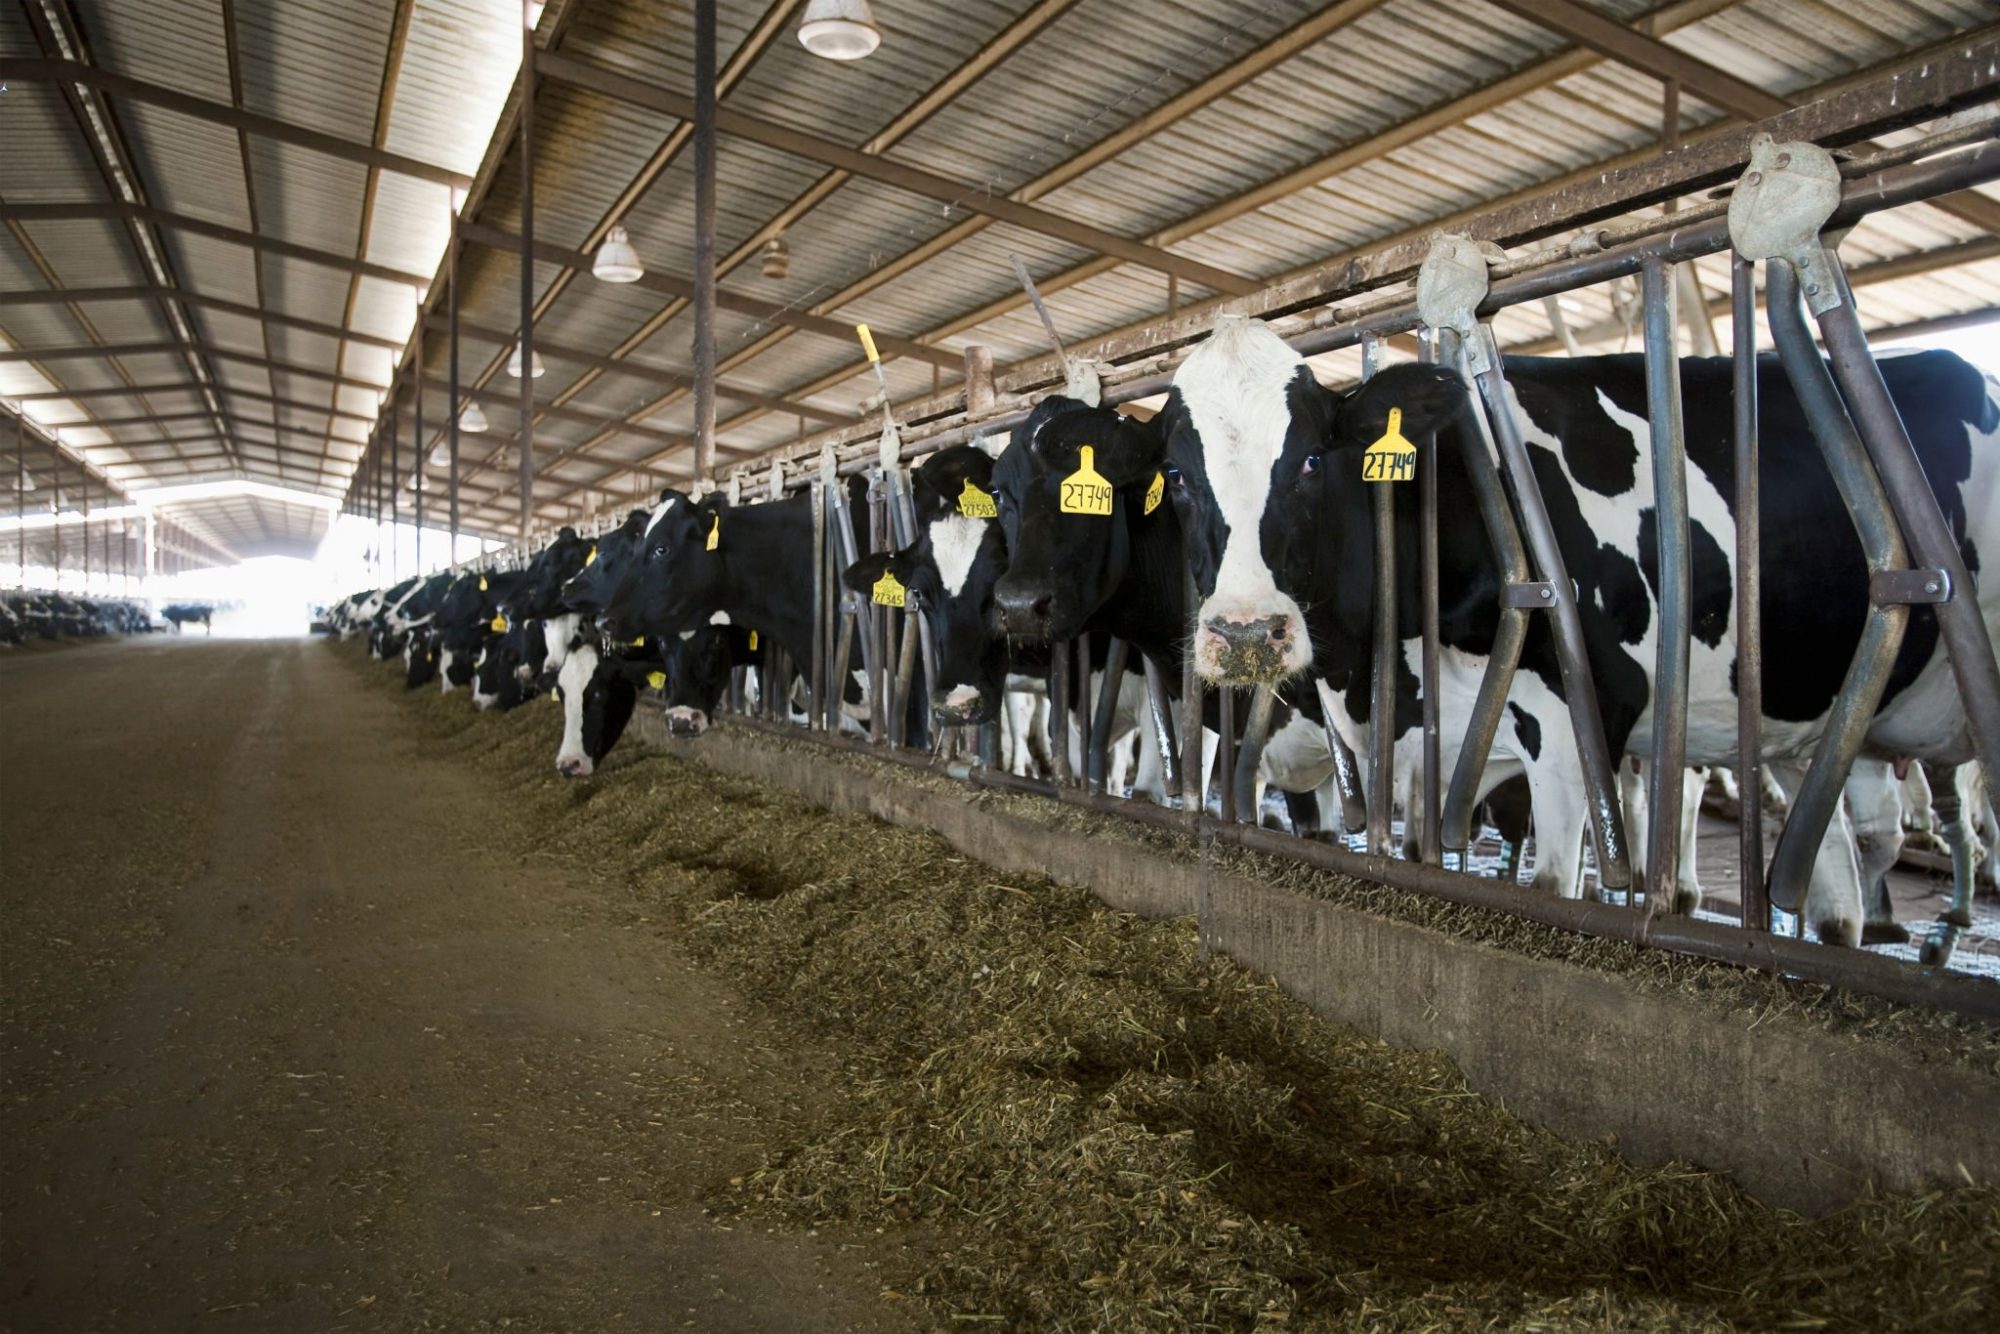
While you’re scraping stalls or checking heaters, three people you’ve never met just changed the value of every cow in your barn. In a quiet Maryland office park, the USDA recalculated the “ideal” Holstein — and if your cows are “too big” on Body Weight Composite, they just picked up a $57‑per‑point penalty for lifetime Net Merit.
The math lives in Beltsville. The consequences land in your parlour. The April 2025 Net Merit revision didn’t just shuffle a few bulls; it hard‑wired a new answer to a simple question: what kind of Holstein is worth breeding in 2026?

This is the story of the scientists who set that answer — and Rosy Lane Holsteins in Wisconsin, where Lloyd Holterman refuses to let those formulas be the whole story.
Quick Facts: What Changed in Net Merit 2025

- Body Weight Composite (BWC): -11% emphasis in NM$.
- Feed Saved (FSAV): 17.8% combined emphasis (BWC + Residual Feed Intake).
- Fat vs Protein: Fat 31.8%, Protein 13% of NM$ emphasis.
- Feed costs in the model: 58% of milk income (39% marginal, 19% maintenance).
- “Weight tax”: +1.0 BWC = -$57 lifetime NM$ per daughter.
- Genetic gain: Genomics roughly doubled NM$ gain per bull from $40 → $85/year.

Those aren’t trivia numbers. They’re the new rules your proof sheet is playing by.
From Coin, Iowa, to Every Proof Sheet in North America
The modern proof system didn’t start with DNA chips. It started with a kid from Page County, Iowa, who didn’t begin his animal breeding career until he was nearly 40.
Charles Roy Henderson grew up on a general livestock farm, served as an Army Nutrition Research Officer during World War II, and earned his PhD in genetics and animal breeding from Iowa State in 1948 at age 37. At Cornell, he developed best linear unbiased prediction — BLUP — the math that finally separated herd effect from genetic effect. It let evaluators ask: Is this cow actually superior, or just in a better barn?
USDA adopted Henderson’s herdmate comparison method in 1962, replacing the old daughter–dam comparisons. By 1989, BLUP‑based Animal Model evaluations were running in the U.S., with other countries following through the 1990s.
There was still a massive bottleneck. A young bull went into AI around two, his daughters calved, finished a lactation, and the proof didn’t publish until the bull was seven or eight. Only about 1 in 8–10 bulls “graduated” from progeny testing, and each active bull represented a $350,000–$400,000 investment in semen collection, daughter sampling, and promotion.
Genomics blew that up. Illumina’s 50K SNP BeadChip hit the market in 2007, the bovine reference sequence landed in Science in April 2009, and USDA’s Animal Genomics and Improvement Laboratory launched official genomic evaluations for Holsteins and Jerseys in January 2009. Generation interval collapsed — suddenly, you could get a genomic PTA on a bull before he was old enough to breed.
Two Beltsville scientists — Paul VanRaden and George Wiggans — built most of the computational engine that still drives those evaluations today. (Read more: The Invisible Architects: How George Wiggans and Paul VanRaden Helped Double Your Herds’ Genetic Gain)
VanRaden and the $57 “Weight Tax.”
Paul VanRaden joined the USDA’s Animal Improvement Programs Laboratory after his Iowa State PhD in 1986. His name is on a long list of methods you see every time you open a proof sheet — but Net Merit is the one that hits your pocketbook most directly.
Henderson’s BLUP told you which cow was genetically better. VanRaden’s Net Merit dollar index (NM$) tells you which cow should make you more money over her lifetime. It rolls multiple production, fertility, health, and conformation traits into a single lifetime profit estimate — and every revision is another set of judgment calls about what matters, and how much.
Where the 2025 Change Hits Your Herd
The April 2025 NM$ revision increased the emphasis on butterfat and reduced the emphasis on protein, reflecting actual component price trends in recent years. It also shifted weight from Productive Life toward cow and heifer Livability, based on stronger cull cow and heifer calf markets.
The bigger jolt is in body weight and feed efficiency. New feed‑intake data from more than 8,500 Holstein and Jersey lactations showed that maintenance feed costs were higher than previous models assumed. In plain language: big cows cost more to keep milking than the old Net Merit math gave them “credit” for.
So BWC now sits at ‑11% emphasis in NM$. For every extra point of BWC, the model knocks about $57 off that cow’s lifetime Net Merit — mostly for maintenance feed, but also for housing and replacements.
| Bull BWC Over Breed Average | Lifetime NM$ Impact Per Daughter | 100 Daughters: Total Herd Impact | What You’re Paying For |
| -0.5 | +$29 | +$2,900 | Feed saved, smaller replacements, lower maintenance |
| 0.0 (Neutral) | $0 | $0 | Breed average—no penalty, no bonus |
| +0.5 | -$29 | -$2,900 | Slightly larger cows, modest feed drag |
| +1.0 | -$57 | -$5,700 | Extra maintenance, housing, replacement costs |
| +2.0 | -$114 | -$11,400 | Big cows = big feed bills the model sees no profit |
Here’s the barn‑math version:
- Your bull team averages +1.0 BWC over breed average.
- NM$ says that’s about ‑$57 lifetime NM$ per daughter.
- Across 100 daughters, that’s roughly $5,700 in lifetime NM$ drag for that sire choice compared to a BWC‑neutral bull.
You can argue with the model. But you can’t pretend it’s not there.
Why Did Fat Leapfrog Protein?
VanRaden’s team also re‑estimated the true genetic cost of components. Genomic and sire regressions suggested that, genetically, fat takes as much or more feed to produce than protein. That’s the opposite of what older phenotypic regressions implied when they just watched cows and feed trucks.
In the 2025 NM$:
- Fat carries a relative emphasis of 31.8%.
- Protein carries 13%.
Butterfat isn’t just prettier on the milk cheque right now — the model says you’re burning a lot of feed to get it, so the index rewards fat hard.
The feed‑side math behind this revision assumes feed costs equal 58% of milk income — 39% for marginal production and 19% for maintenance. Combine that with the new Feed Saved trait (FSAV), and you see where the wind is blowing:
- FSAV is 17.8% of NM$ when you add its BWC and Residual Feed Intake components together.
If you’re not looking at FSAV on your proofs, you’re ignoring almost a fifth of the index you think you’re using.
The subtext is pretty clear: do more milk from less feed, land, and carbon, or get left behind.
Wiggans: The Infrastructure Nobody Sees
If VanRaden designed the engine, George Wiggans made sure it was street‑legal and still running when you opened your proofs this morning.
Theory doesn’t help anybody if it can’t be computed, delivered, and trusted. Wiggans spent his career sorting out genotype management, data quality control, and the nuts and bolts of turning millions of milk, type, and health records into evaluations that AI organizations can actually ship. He was central to the push that got Canadian AI studs to contribute DNA to a shared U.S.–Canada reference population before genomic proofs went live, which still underpins most North American Holstein genomic evaluations.
Every chip you send in has to survive that QC pipeline. The genotype is checked against reported parents, then against the entire database to catch swapped samples or mis‑ID’d animals. If it doesn’t add up, it doesn’t make it into the evaluations.
In a 2022 Frontiers in Genetics paper, Wiggans and Carrillo showed that the U.S. genomic‑selection era roughly doubled the rate of NM$ gain: from about $40 per bull per year (2005–2009) to roughly $85 per bull per year from 2010 onward. The genetic trend lines are real. Whether those gains match your own herd’s priorities is a different question.
What Kills Your Calves Before They Ever Milk?
John Cole is part of the generation pushing genomic evaluations into the ugly stuff that never makes it to the parlor: dead or wrecked calves.
Across multiple datasets, about 75% of preweaned calf mortality comes from just two buckets: diarrhea and respiratory disease. To put numbers on the genetics behind that, CDCB and partners pulled together 207,602 diarrhea records and 681,741 respiratory disease records from calves born between 2013 and 2024. Those data streams feed the new U.S. genomic evaluations for calf diarrhea (DIAR) and respiratory disease (RESP), officially launched in April 2026. Lactanet rolled out its own Calf Health RBVs for Holsteins in August 2025.
The heritability looks low at first glance: about 0.026 for diarrhea resistance and 0.022 for respiratory resistance. Translate that: only 2–3% of the variation in those health outcomes is explained by genetics in the current models. Zoetis’s earlier proprietary Calf Wellness index (CW$) reported slightly higher figures due to differences in traits, models, and data sources.
Cole’s message in presentations and industry pieces has been consistent: don’t let the low heritability numbers fool you. Once you’re doing the basics right on colostrum, hygiene, and housing, adding genetic resistance can still move many calves out of the treatment pen and into the parlor.
The Genetic Spread, in Real Daughters

Lactanet clearly summarized the genetic spread in an August 2025 calf health article and a companion presentation. Among officially proven Holstein sires:
- For respiratory disease, daughters of the top 5% sires by calf health RBV stayed healthy (no recorded RESP case) about 71% of the time; daughters of the bottom 5% sires were healthy only about 54% of the time.
- For diarrhea, daughters in the top 5% were healthy about 69% of the time, compared with roughly 53% for those in the bottom 5%.
That’s not “nice‑to‑have.” That’s a lot of treatments, mortalities, and delayed heifers tied directly to the bulls you pick.
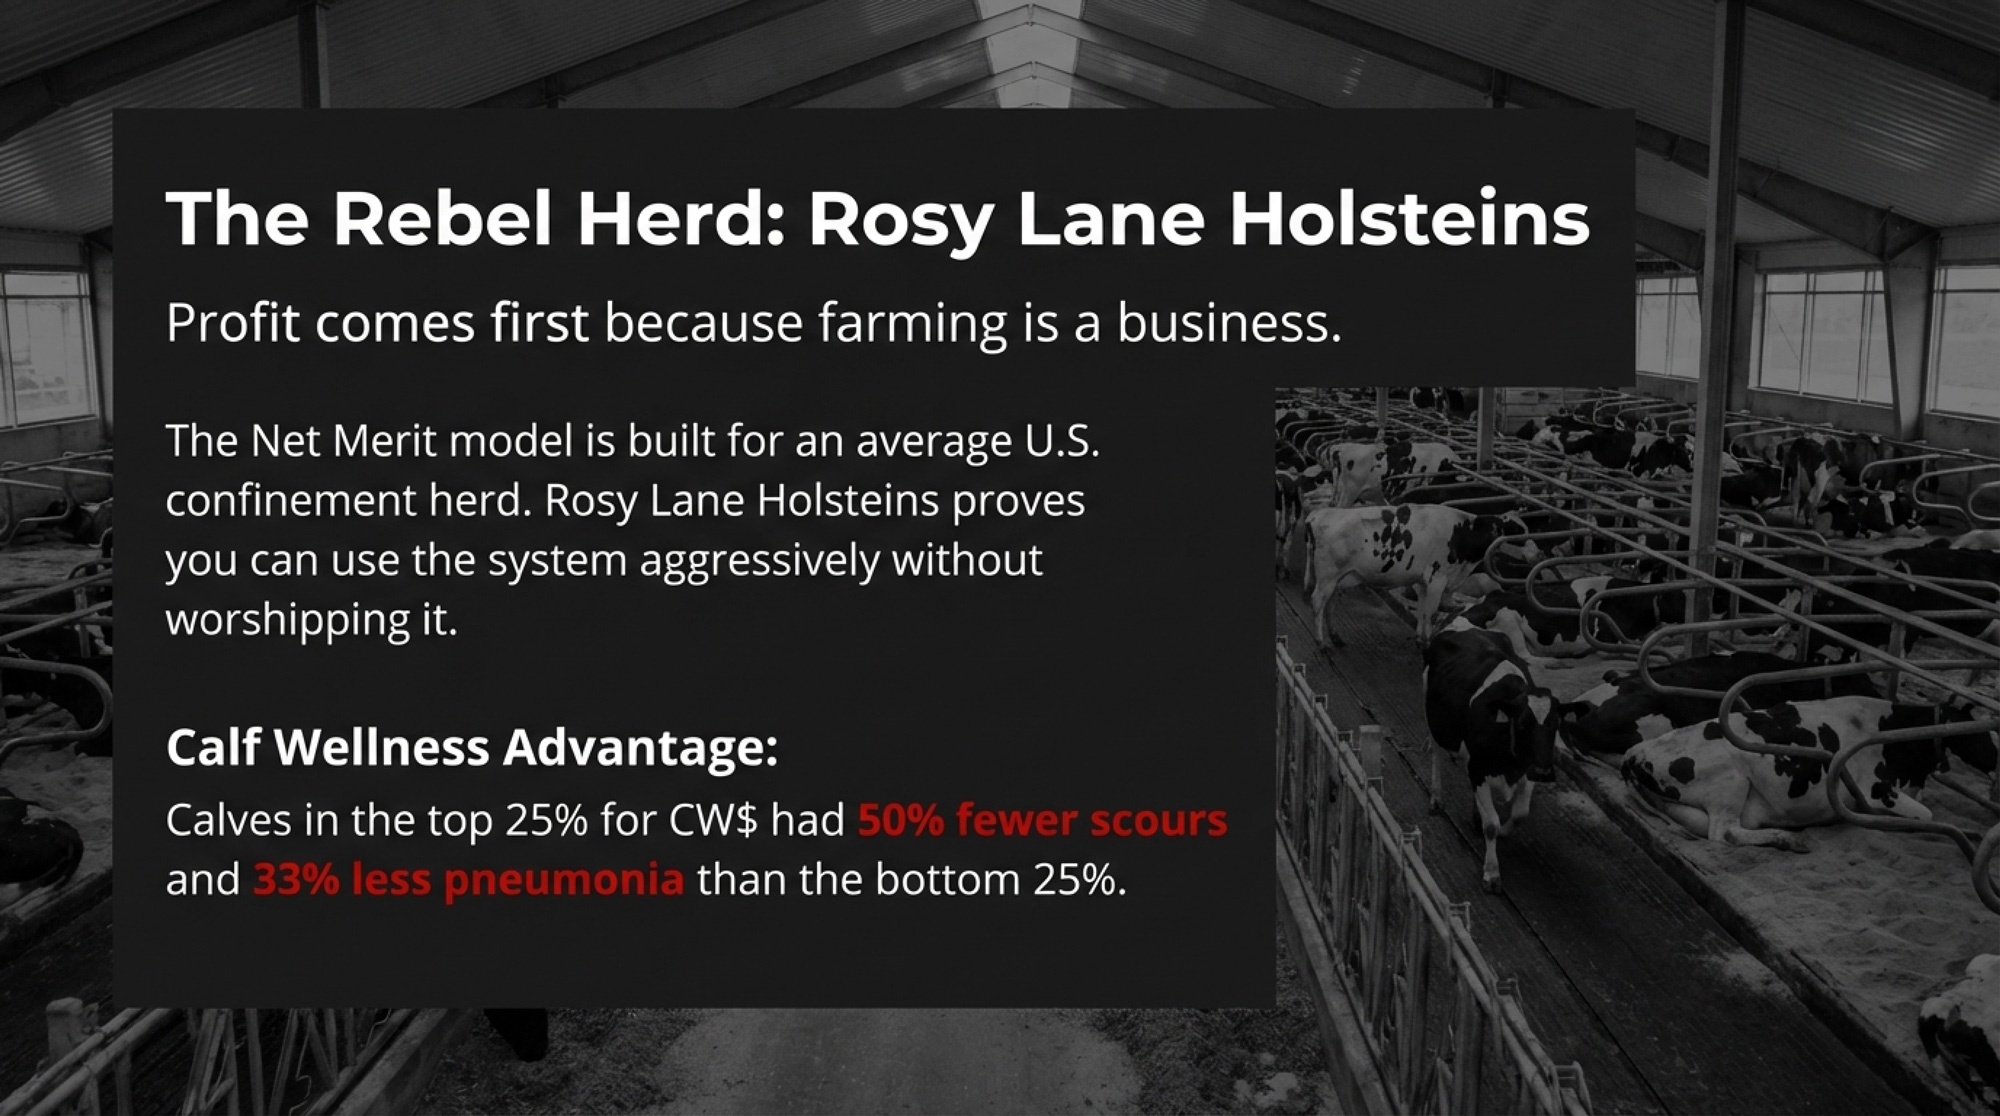
Rosy Lane Holsteins saw similar real‑world spreads years earlier when it leaned heavily into Zoetis’s Calf Wellness index. A WW Sires case study reported that calves in the top 25% for CW$ at Rosy Lane logged about 50% fewer scours cases and roughly 32% fewer pneumonia cases than calves in the bottom 25% over a 12‑month window — tracked with ultrasound to catch subclinical pneumonia that never showed as a full‑blown “trainwreck.”
An often‑cited study summarized in Farmtario’s 2025 calf‑health coverage showed that heifers with a recorded respiratory disease event produced 121 kg less milk in first lactation. Stack that across a whole age group, and you feel it in the tank.
Genetics won’t fix sloppy colostrum or filthy hutches. But if you’re already holding preweaned mortality in the 3–4% range, calf health genetics is one of the few levers left to push toward that 1–2% elite zone.
What Data Actually Feeds Your Genomic Proof?
| Data Source | What It Captures | Who Provides It | Key Blind Spot |
| DHI/DHIA test | Monthly production, components, SCC | Techs or automated meters | Only ~40% of U.S. herds on some form of official test |
| Classification | Linear type traits and composites | Breed‑association classifiers | In Canada, only first‑lactation scores feed official type proofs |
| Genomic labs | SNP genotypes (e.g., 50K → ~54,001 usable markers) | DNA from hair, blood, ear notch | Minor breeds have thin reference populations |
| Producer health records | Mastitis, metabolic disease, calf health events | Producers via herd software | Only a minority of farms consistently log calf health events |
Those gaps matter. The DIAR and RESP national datasets are over 97% Holstein and Jersey — roughly 80% Holstein, 17% Jersey — which makes the models strong for those breeds and less robust for everyone else. If you’re milking registered Holsteins on test and logging health, the system sees you. If you’re off test, crossbred, or light on health records, you’re asking the index to guess.
Does the System See Your Herd — or Just the Average?
Genomic selection was intended to mitigate inbreeding. The sales pitch: if you can see exactly which genes each calf got, you can manage inbreeding smarter. In reality, progress has been messier.
Lozada‑Soto and co‑authors (2024, Journal of Dairy Science) showed that in Nordic Holstein and Jersey populations, yearly inbreeding rates increased after genomic selection took off, and the effective population size for Nordic Holsteins dropped from 54.3 to 42.8. Doekes et al. (2019, Journal of Dairy Science) found that recent inbreeding — long runs of homozygosity in the genome — hurts longevity more than older, “diluted” inbreeding.
You see that on‑farm, as good‑looking heifers that fall apart too soon for reasons you can’t fully blame on your nutritionist or hoof trimmer.

So you’re stuck with a double‑edged sword:
- Genomics doubles genetic gain in traits the index rewards.
- It also accelerates the narrowing of the gene pool if everyone chases the same handful of sires.
Key traits like heat tolerance, methane emissions, and temperament still don’t have official U.S. evaluations. The index can’t weigh what it doesn’t measure. If those matter on your farm, you’re into custom selection, not blind NM$ chasing.
On the Canadian side, Lactanet’s August 2025 inbreeding update pegged average inbreeding for Holstein heifers born in 2024 at 9.99% — a full percentage point higher than 2014. That’s your benchmark when you run your own mating reports.
Rosy Lane Holsteins: Using the System, Not Worshipping It
The Net Merit model is built for an “average” U.S. confinement herd. Rosy Lane Holsteins, just outside Watertown, Wisconsin, is one of the operations proving you can use that system aggressively without letting it run the show.

Lloyd Holterman and the Rosy Lane team have been clear for years: profit comes first because farming is a business.In a 2014 Bullvine profile and later Zoetis/WW Sires features, Holterman laid out a strategy that still makes some breeders twitch:
- Sort bulls by NM$ first, not TPI or show‑ring appeal.
- Avoid bulls that crank up Stature; favor moderate‑sized, wide, durable cows.
- Stop classifying if the scores aren’t helping profit decisions.
When Rosy Lane compared its cows, Holterman told The Bullvine they found that shorter, wider, better‑conditioned cows “far outlived their higher‑scoring herd‑mates while having fewer foot problems and better fertility.” We later quoted his joking shorthand for what can happen when people chase pure type without thinking about fertility: cows that are “tall, pretty and infertile.” (Read more: ROSY-LANE HOLSTEINS – “Don’t Follow the Herd!”)
That line isn’t a scientific verdict on TPI. It’s one breeder’s sharp reminder that an index built for show cows and an index built for profit aren’t the same tool.
Rosy Lane also leaned early into Calf Wellness genetics. The Zoetis/WW Sires case study from their herd showed calves in the top quartile for CW$ had around half the scours and one third fewer pneumonia cases than bottom‑quartile calves — not because management changed, but because the sire list did. That’s exactly the kind of “make the data pay” story the Beltsville team hopes other herds can copy.
Holterman’s bottom line hasn’t changed: use the tools, but never forget your own milk cheque.
The Bullvine Verdict: Who Gets to Decide What a “Good” Holstein Looks Like?

Here’s the uncomfortable truth: if you don’t know how NM$, FSAV, and calf health evaluations work, someone else is making your breeding strategy — even if you’re the one signing the semen bill.
Beltsville’s job is to define an average profitable Holstein in 2025: moderate size, high components, better feed efficiency, fewer dead calves, and fewer young cows leaving early. That’s not a bad target.
But your farm isn’t average. Your milk contract might reward protein harder than fat. Your freestalls and robot boxes might punish tall, wide cows. Your land base might mean feed is your bottleneck, not cow numbers. Or you might be okay trading some NM$ for show‑ring presence or niche milk premiums.
Net Merit is a strong starting point. It’s just blunt. Rosy Lane is a live example of how a herd can lean hard into Net Merit, calf wellness, and FSAV — and still make their own calls about size, type, and classification.
The real question isn’t “Is Net Merit right?” It’s “Does Net Merit, as currently weighted, line up with the way money actually moves through your operation?”
What This Means for Your Operation

- Always read NM$ with reliability beside it. An NM$ +1,000 bull at 75% reliability is a strong estimate; at 95% reliability, it’s a proven moneymaker relative to the base. They’re not interchangeable, and low‑reliability bulls can move 150+ NM$ in a run.
- Match your index to your contract. If your cheque pays on components, CM$ or Pro$ might match better than NM$ if you’re fluid and volume-heavy. NM$ is still the best fit. The index choice isn’t a religion — it’s a business decision that should be revisited at least annually as prices shift.
- Find FSAV on your sire summary — or ask why it’s missing. With 17.8% combined weight in NM$, FSAV is now a core trait, not a side note. A bull that looks good on milk and components but is weak on FSAV may not pencil once you factor in feed and maintenance.
- Use genomics to diversify, not concentrate. Spreading risk across at least 5 genomic sires is cheap insurance. One young bull can re‑rank hard; a group of five rarely does. If your top 3 sires account for more than ~40% of your herd’s expected future inbreeding, that’s a practical red flag to add diversity.
- Treat Net Merit as your first filter, not your only one. Rosy Lane uses NM$ as the gate, then rejects bulls that push Stature too high. You might do the same for calving ease, A2A2, polled, robot suitability, or grazing traits, depending on your system.
- Put calf health on the table if you’re already nailing management. Once your basic colostrum, housing, and hygiene are solid, DIAR/RESP and tools like CW$ can start doing noticeable work in the background.

Key Takeaways
- If your expected inbreeding is higher than 9.99%, it’s time to adjust your mating plan. That 9.99% is Lactanet’s average for Canadian Holstein heifers born in 2024. Run your own mating reports. If your next calf crop is well above that, add two or three outcross or lower‑inbreeding bulls before the next breeding cycle.
- If a bull drops more than ~150 NM$ between proof runs, he should lose some tank share. That kind of swing is normal for low‑reliability genomic sires, but it’s your cue to slow his usage and bring in a replacement rather than riding him for another year, hoping he comes back.
- If your top 3 bulls contribute more than ~40% of your herd’s expected future inbreeding, you’ve got a concentration problem. That number isn’t a magic line — it’s a simple threshold that tells you when you’ve leaned too hard on a couple of “hot” sires.
- If FSAV isn’t in your sire selection process yet, you’re ignoring 17.8% of the index you think you’re using.That’s a lot of money and feed to leave on the table when you’re already fighting ration costs.
The Bottom Line
In the next month, carve out half an hour with your genetic advisor or semen rep. Pull up your proofs, look at BWC, FSAV, reliability, and expected inbreeding side by side — and ask one question: “Does the way I’m using these tools actually match how my farm makes money?”
Complete references and supporting documentation are available upon request by contacting the editorial team at editor@thebullvine.com.
Learn More
- The $212,000 Bulk Tank Lie Hitting Upper Midwest Dairies – Exposes the high-test trap that’s quietly draining your bank account. You’ll gain a concrete 4-point playbook to stop chasing percentages and start shipping the component pounds that actually drive your 2026 milk check.
- 211,000 More Dairy Cows. Bleeding Margins. The 2026 Math That Won’t Wait. – Reveals the structural reset shifting the ground beneath your feet. It arms you with a strategic plan to navigate record-low heifer supplies and beef-on-dairy math before the 2027 supply crunch hits home.
- The $8,100 Gamble on Missy, 198 Dragged Genes, and the 20-Year Breeding Blind Spot Hiding in Your Herd – Delivers a provocative look at the “collateral damage” of selection. You’ll gain a competitive edge by identifying the 198 invisible genes that are sabotaging your herd’s fertility and immune performance right now.
 The Sunday Read Dairy Professionals Don’t Skip.
 The Sunday Read Dairy Professionals Don’t Skip.
Every week, thousands of producers, breeders, and industry insiders open Bullvine Weekly for genetics insights, market shifts, and profit strategies they won’t find anywhere else. One email. Five minutes. Smarter decisions all week.
