


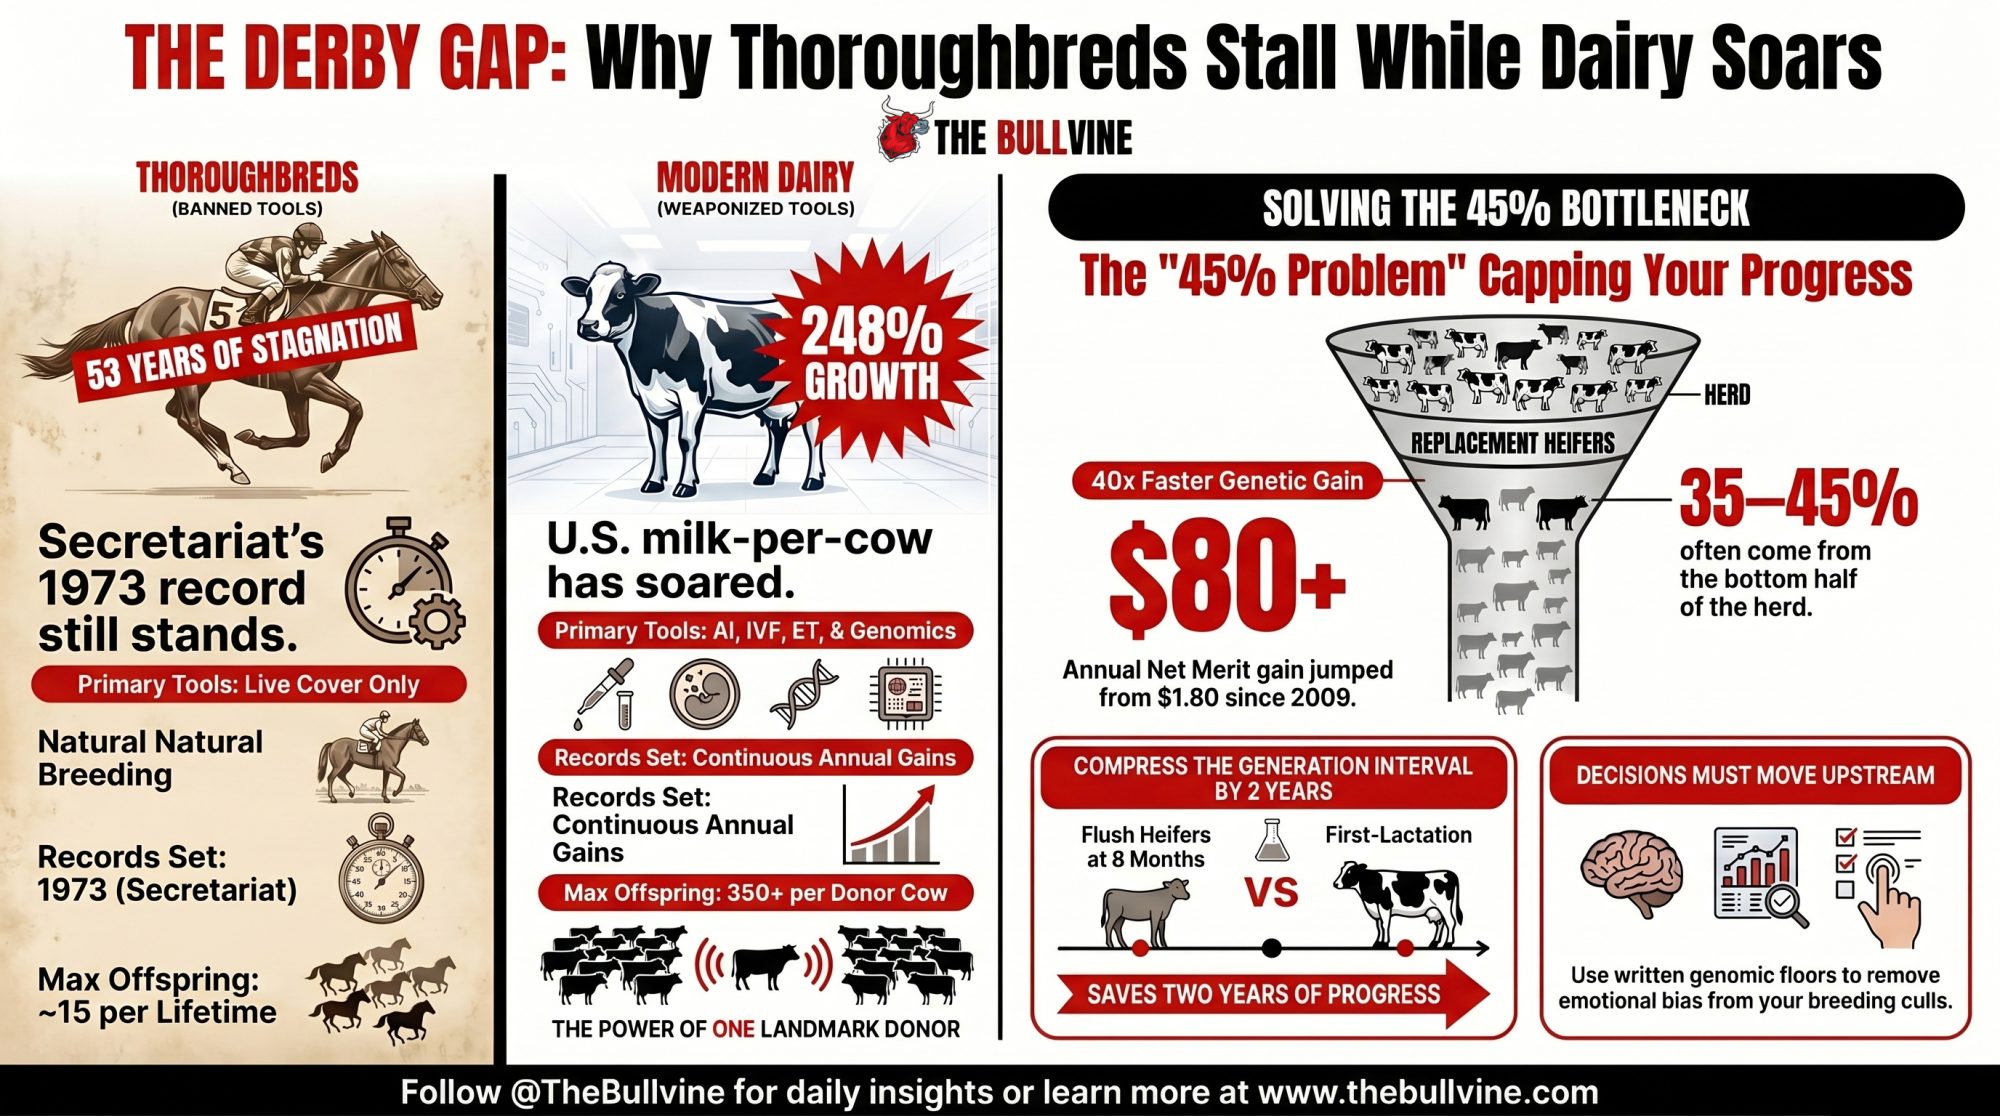
Secretariat’s Derby record is 53 years old. U.S. milk-per-cow is up 248% since he was born. One industry weaponized artificial insemination and genomics. The other banned the tools. Where’s your calf crop in that gap?
Executive Summary: Secretariat’s Kentucky Derby record is 53 years old and U.S. milk-per-cow is up 248% since he was born — not because of biology, but because the Jockey Club still bans AI, IVF, and ET while dairy weaponized all three plus genomic selection since 2009. The annual rate of Holstein genetic gain jumped more than 40-fold inside one decade, from roughly $1.80/year in Net Merit pre-genomics to $79.20–$85.00/year by the CDCB 2016–2020 window. KHW Regiment Apple-Red-ET, bred by Kamps-Hollow Holsteins, now carries more than 350 direct progeny — more than an entire stable of thoroughbred mares will produce across their combined lifetimes. But the uncomfortable number for your operation is this: genetics advisors consistently see 35–45% of replacement heifers in genomic-testing herds coming from the bottom half of the dam distribution, meaning your sire lineup is compounding while your dam decisions sit flat. On a 300-cow Holstein illustration, a 200-point NM$ spread between top and bottom quartiles equals 2.5 years of industry-average progress sitting inside the same barn — and an 8-month OPU flush versus a first-lactation flush compresses or extends 2 years of generation interval per calf. Run the one-hour quartile diagnostic this month before the next proof run: pull your last two calf crops, match each heifer to her dam’s genomic rank at conception, and count the bottom half. If 35% or more of your heifers are coming from there, your decision architecture — not your tool access — is what’s capping your herd’s runway.
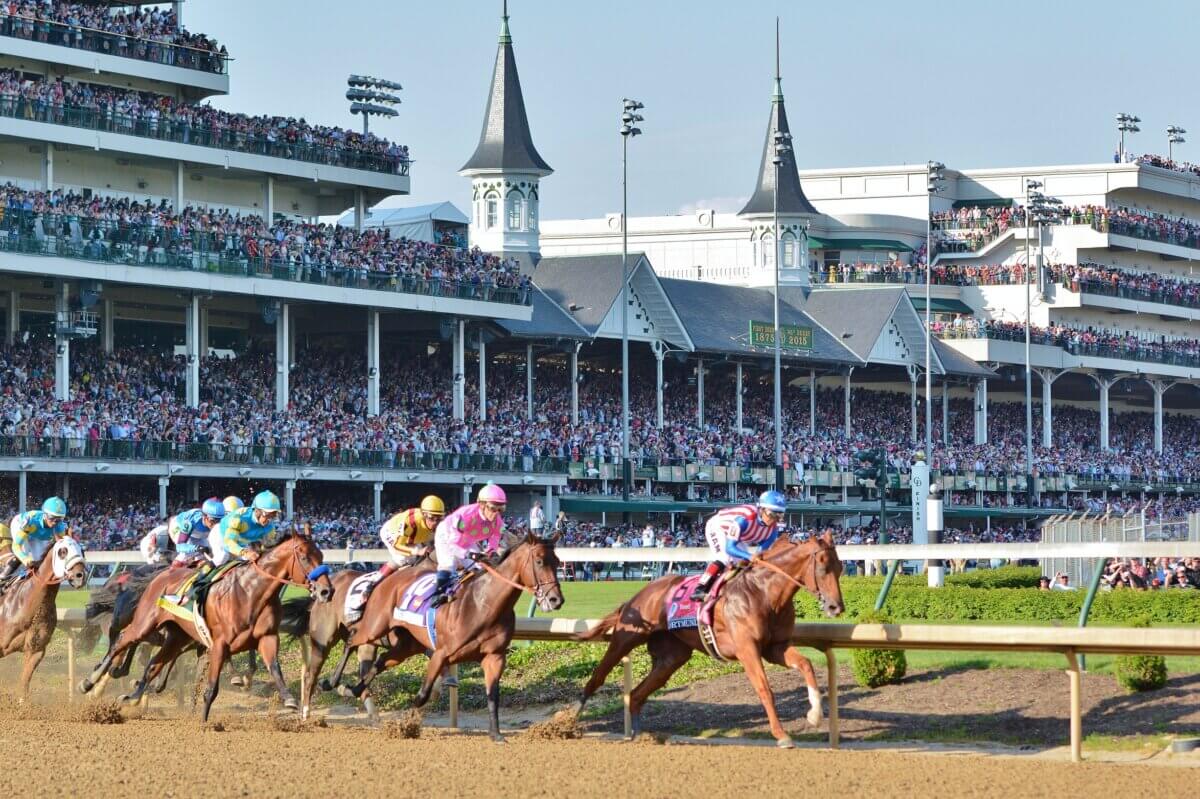
Somewhere in Louisville this afternoon, a three-year-old thoroughbred worth more than most dairy operations will leave the gate at Churchill Downs and run for roses. Odds are, the winner’s time won’t touch Secretariat’s 1:59.40 from May 1973 — a Derby record that’s now stood for 53 years across an industry awash in discretionary capital.
Meanwhile, the U.S. dairy cow has gotten 248% better at her job in roughly the same window — a gain built on artificial insemination, IVF, embryo transfer, and, since 2009, dairy genomic selection. That gap — flat racing clock, exponential milk curve — is the most useful lens available on Derby Day 2026 for a question most progressive Holstein breeders have never run the diagnostic on:
How much of dairy’s tool advantage is actually reaching your specific herd?
The Scoreboard on Derby Day 2026
Average U.S. milk production per cow climbed from roughly 7,029 pounds in 1960 to 24,117–24,390 pounds by 2023–2025 — the 248% increase that defines modern dairy genetic gain. Annual Net Merit $ gain for U.S. Holsteins went from about $1.80 per year pre-genomics to $79.20–$85.00 by the CDCB 2016–2020 evaluation window. The annual rate of genetic gain increased more than 40-fold inside one decade.
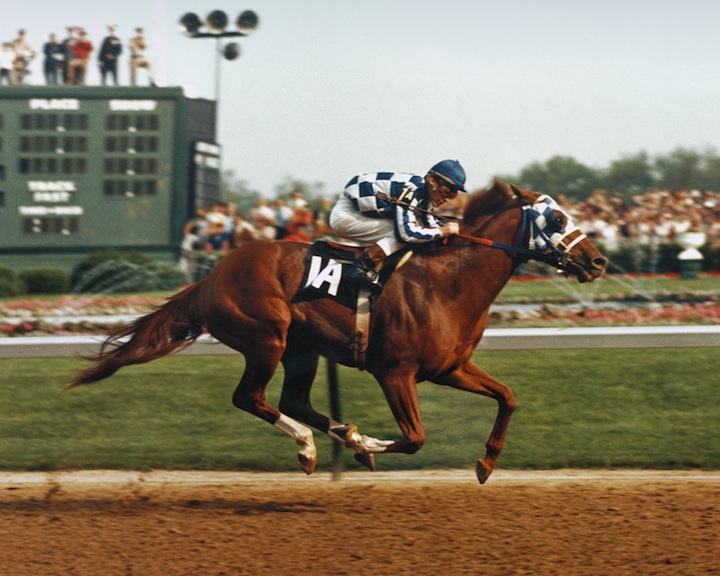
Now the Derby contrast. Secretariat’s record has held for 53 years — a winning time that has barely moved across a century of racing. Thoroughbred racing commands billions in discretionary capital, elite veterinary care, and the best training money can buy. The clock has barely moved with it.
The reason isn’t biology. It’s the Jockey Club rulebook. Live cover only. No AI. No IVF. No embryo transfer. A thoroughbred mare is biologically capped at roughly 10–15 offspring across her productive lifetime because she can only produce one foal per year.
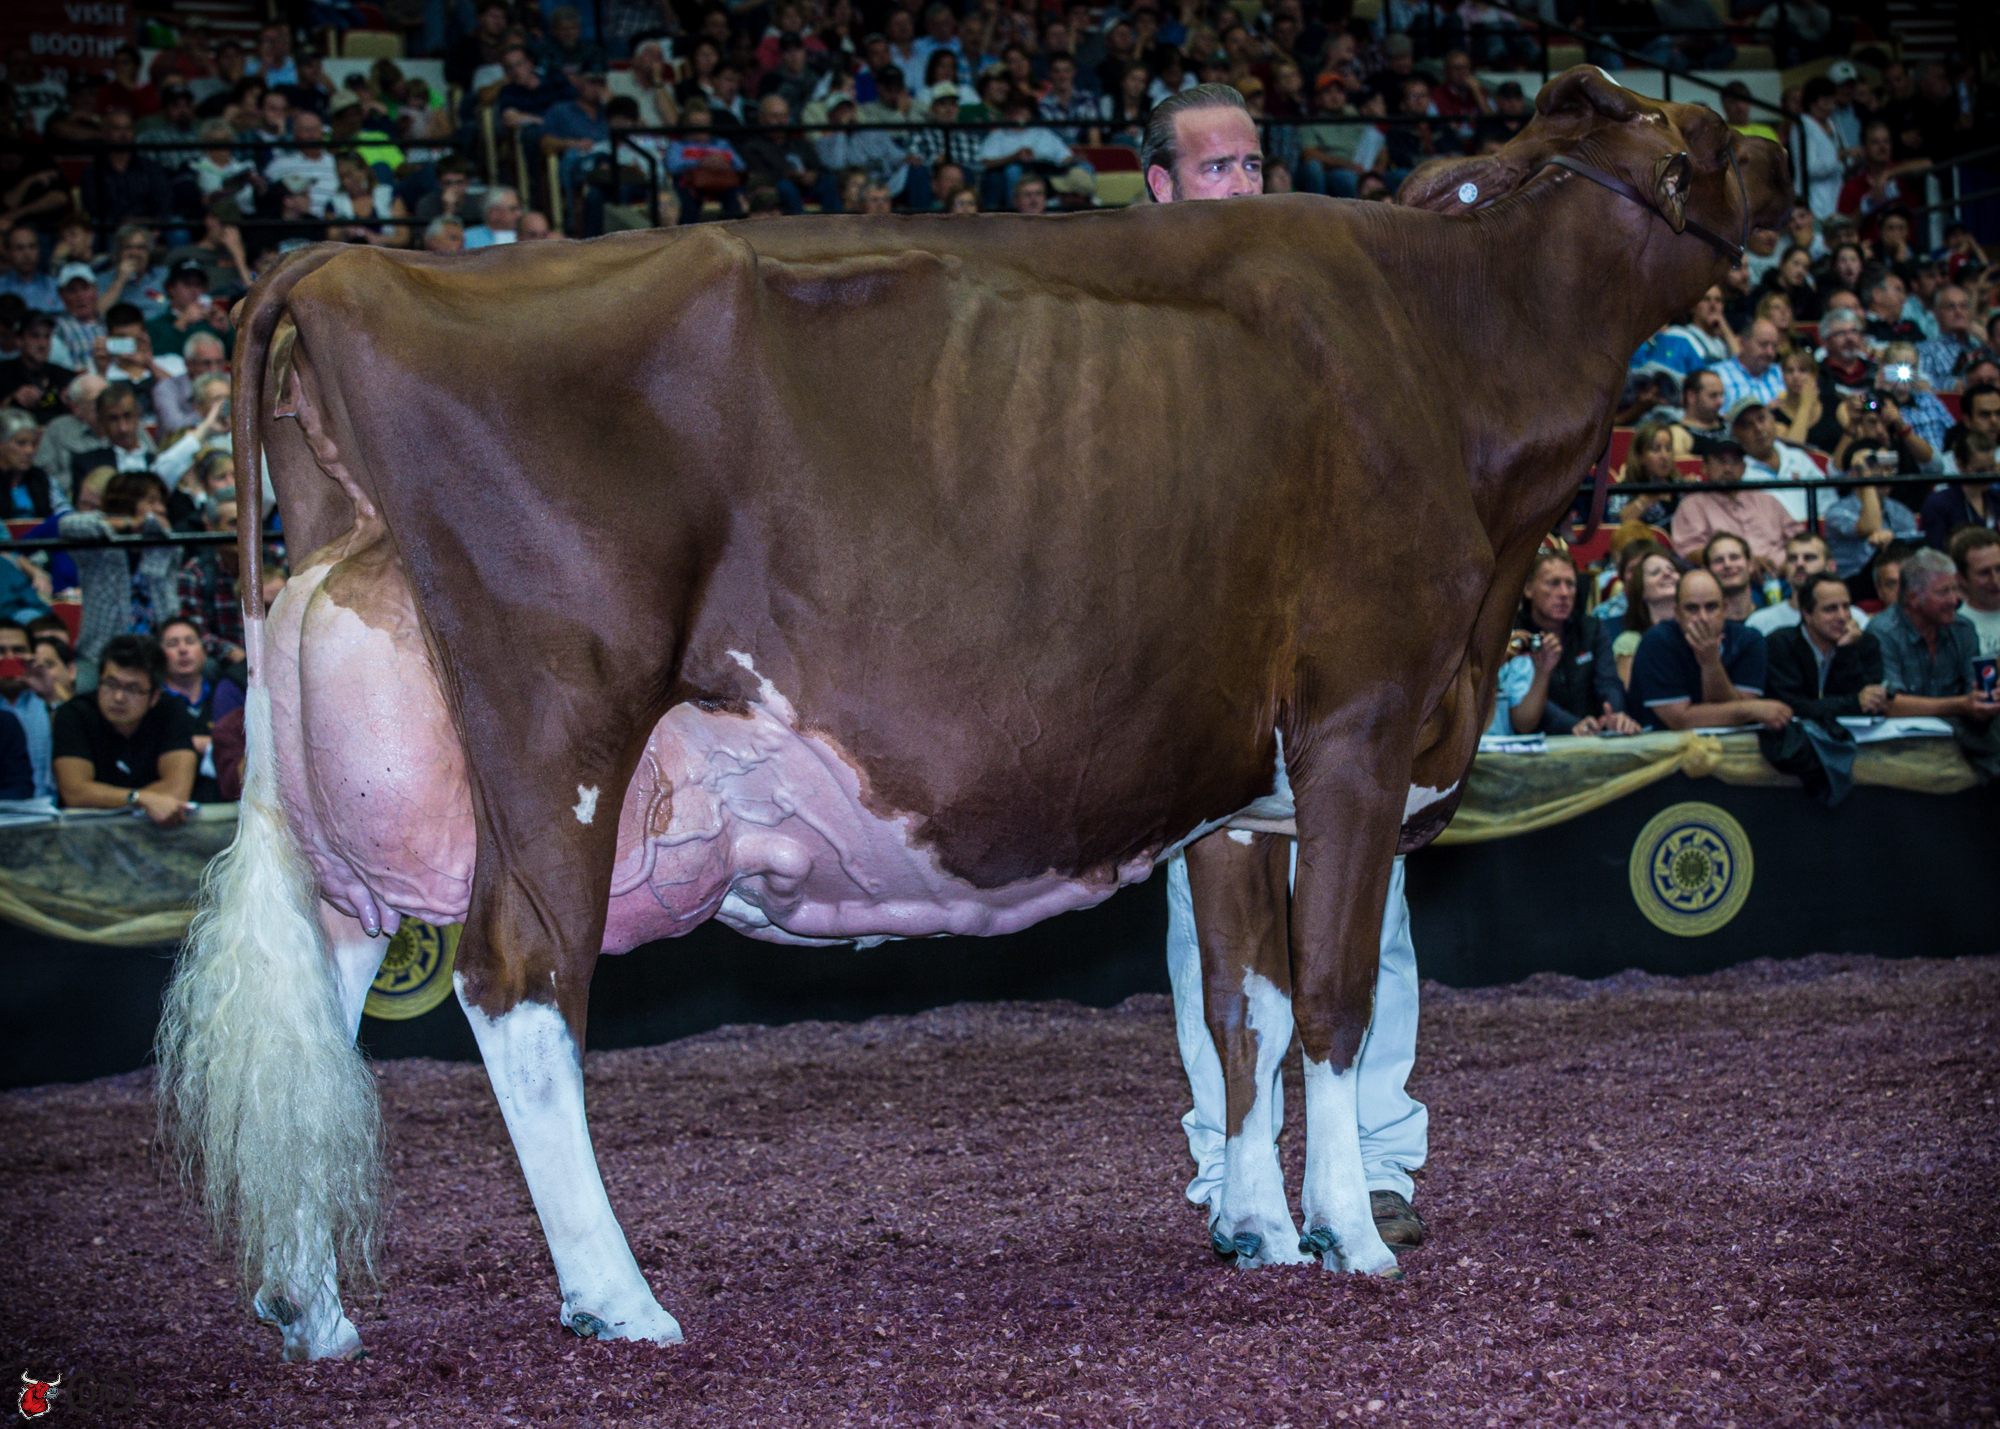
Did You Know? KHW Regiment Apple-Red-ET — bred by Kamps-Hollow Holsteins — is widely recognized as a landmark donor cow of the Holstein breed. Estimates credit her with more than 350 direct progeny and more than 280 Excellent-scored daughters and descendants worldwide, with a single oocyte collection session reportedly yielding 50 viable oocytes. One cow. More registered offspring than an entire stable of thoroughbred mares will produce across their combined lifetimes.
The Jockey Club’s rules aren’t accidental. They’re designed to protect a specific definition of sporting integrity, and there are thoroughbred people who would rather see Secretariat’s record stand forever than see it beaten by a genetically optimized horse. That’s a legitimate choice. It’s just a choice with a visible genetic cost.
So when the gates open at Churchill Downs this afternoon, you’re watching the cleanest control group in animal agriculture. Same century. Same species of smart, well-capitalized breeders. Tools available on one side, banned on the other. The results are on the clock.
The 45% Problem in Your Barn
The Derby clock raises an uncomfortable question for every progressive Holstein herd:
You have every tool thoroughbreds don’t — so are you actually using them?
Here’s the diagnostic that answers it, and it takes about an hour.
Pull your last two calf crops, match each heifer back to her dam’s genomic ranking at conception, split the herd into quartiles, and count. Among U.S. Holstein operations that have been genomic testing at birth for three-plus years, the number genetics advisors most often describe seeing lands somewhere between 35% and 45%.
That’s the share of your future breeding herd coming from the half of the cows you’d cull first if you were being systematic. It isn’t a knowledge gap. It’s a gap in decision architecture. And it’s the quiet reason herds with the same tools, the same semen access, and the same genomic infrastructure end up with very different rates of genetic gain five years from now.
How Does a Healthy, Productive Cow End Up Dragging Your Genetic Mean Down?
Here’s the composite scenario most genetics advisors describe. She’s milking 85 pounds. She settled on the first service. She’s healthy, she’s cycling, she hasn’t had a vet call in eight months. Every visible signal your eye has been trained to read says keep her. The genomic report, which arrived six months ago and sits in a binder somewhere, says she’s in the bottom quartile.
Those two signals aren’t in conflict biologically. Moderate producers with good health traits exist throughout the genetic distribution. But they feel like a conflict — because one is abstract and the other is standing in front of you eating hay.
So she doesn’t get culled. She gets bred back, probably to a mid-tier sire, because the elite semen is being saved for the top end of the herd. She calves. The calf is a heifer. The heifer enters the breeding pool. Two years later, when you run the diagnostic on your most recent calf crop, that heifer is part of the 45%.
Nobody decided this would happen. The repro program was built to maximize pregnancy rate and minimize days open. It does that well. But it wasn’t built to connect repro priority to genomic rank, so it didn’t. The outcome isn’t a failure of the system — it’s exactly what the system was designed to produce, and the team running it deserves credit for the competence, not blame for the gap.
What Does the Breeder’s Equation Actually Cost When You Don’t Enforce It?
Every textbook on genetic improvement comes back to the breeder’s equation: ΔG = (i × r × σ_g) / L. Selection intensity, accuracy, genetic variation, generation interval. Dairy has optimized every variable at the industry level. AI lets breeders draw from a narrow band of the highest-ranked proven sires worldwide — something that was operationally impossible before frozen semen and international shipping. Genomic testing at birth delivers materially higher reliability on young-animal production indexes than pedigree alone — on the order of 70% versus 20–30%, depending on trait category. Genomic evaluation has compressed generation interval from the traditional 5–7 years under progeny testing to under 2 years.
Every one of those gains was unlocked at the industry level. Whether they’re unlocked inside your fence line depends on decisions made downstream of the data.
Here’s what the math looks like in a real barn. Take a 300-cow Holstein herd. For the sake of illustration — and this is illustrative, not a sourced herd-level distribution — say your top genomic quartile averages $800 NM$ and your bottom quartile averages $600 NM$, a 200-point spread. At the 2016–2020 CDCB annual Net Merit gain rate of roughly .20, that spread translates to about 2.5 years of industry-average genetic progress sitting inside the same barn. Every heifer calf born from the bottom quartile represents roughly 2.5 years of deferred progress compared to a calf born from the top quartile.
The second piece of math most breeders never run: flush an elite heifer at 8 months through OPU, and her daughter is born roughly 17–20 months later, once the embryo has been transferred to a recipient and carried to term. Wait until that same female completes her first lactation before flushing her, and the calf arrives roughly 44 months later. That’s 2 years of generation interval you’re either compressing or extending — and at roughly $79/year in NM$ gain, it’s a measurable number per calf, not a theoretical one.
How the Top Decile Actually Runs the Program
The operations that appear to compound consistently year over year tend to share four structural patterns, according to genetics advisors and herd-level genetic trend data published by CDCB. They don’t solve the 45% problem by working harder. They solve it by moving the genetic decisions upstream — out of the emotionally loaded moment of standing in front of a specific animal, and into a policy or schedule written when the stakes felt abstract.
- A written genomic floor. A specific NM$ or LPI number — below it, no female is bred to a high-investment sire. The threshold is written down, the exception process requires documentation and a named approver, and the number is reviewed every proof run against the herd’s current distribution.
- A standing heifer flush schedule. Candidates selected at birth based on genomic testing, OPU appointments booked as part of the herd health calendar at 7–8 months, not case-by-case. The question flips from “should we flush this heifer?” to “is there a reason to take her off the schedule?”
- Two repro tracks, not one. A conception program for the working herd, optimized for pregnancy rate and days open. A multiplication program for the top tier, optimized for genomic advancement. Top-tier females get scheduled reproductive attention regardless of cycling convenience.
- Breeding objectives written as decision rules. “We breed for components and fertility” is a preference. “No female below our written NM$ floor is eligible for the breeding herd” is a rule. One requires a decision every time. The other only requires one when you want an exception.
Every one of those moves has the same underlying effect: it changes what has to happen for the default to hold. In most herds, the default requires no decision and aggressive selection requires one. In top-decile herds, the reverse is true.
Options and Trade-Offs for Your Operation
There’s no single path out of the 45% pattern. The right one depends on herd size, cash position, and how much operational change the team can absorb in a single breeding cycle.
- This month — run the quartile diagnostic. One hour, no commitment. Pull your last two calf crops, match each heifer to her dam’s genomic rank at conception, count the bottom half. The number is the intervention. Works for every herd size. Costs nothing. Backfires only if you look at the result and do nothing with it.
- Set one genomic threshold for elite sire allocation. Pick your primary index, draw a line, and below it no female gets bred to a high-investment sire. Not a full culling policy yet. One constraint, applied consistently for one breeding cycle. Backfires if the threshold is set so low it doesn’t cut anyone you currently like — in which case it isn’t doing selection work
- Schedule 8-month heifer OPU as standing protocol. Requires a relationship with an ET technician, recipient inventory or contracted recipients, and a lab that can handle variable volume. Fits operations with the scale and cash to maintain the infrastructure. Backfires when young stock nutrition or body condition isn’t supporting the protocol — fix the management environment first.
- Separate repro priority from cycling priority. Most operations run one repro program for the whole herd. Top operations run two. Demands more management bandwidth but doesn’t require more labor — it reallocates the labor already there.
The trade-offs are real on all four. Culling productive cows hits next month’s milk cheque. Flushing heifers ties up cash before any daughter has been on the ground. Running two repro programs stretches whoever is managing them. Enforcing a written threshold means sometimes moving a cow you respect. None of that disappears because the math is sound. The math is just clearer than the discomfort.
What This Means for Your Operation
What percentage of your last two heifer calf crops came from the bottom half of your herd genomically?
If you don’t know, that’s the first number to pull this month. It reframes every other genetic decision you’ll make before the next proof run.
- Is your repro program optimizing for pregnancy rate, or for the genomic rank of the calves it produces? Those are different objectives. When they’re not connected explicitly, the easier one wins every cycle.
- Where is your genomic floor for the breeding herd, and when did you last enforce it on an animal you respected? A threshold that hasn’t cut anyone uncomfortable isn’t doing selection work.
- How old is your average dam at first flush? If she’s a cow rather than a heifer, you’ve added years to your effective generation interval on the female side — the side the tools now let you compress.
- Which cows are you keeping for reasons that have nothing to do with their genetics? Every operation has a few. Naming them explicitly is how you prevent the next generation of comfortable exceptions from quietly forming around the next set of animals.
- When did you last cull a productive, healthy cow because her genomic rank disqualified her from the breeding pool? If never, your selection intensity on the dam side is near zero regardless of what your sire lineup looks like.
- Is your breeding objective written as a trait preference list, or as decision rules with specific thresholds and a named person responsible for exceptions? Aspirational standards evaporate under production pressure. Enforceable ones survive because overrides require justification.
Key Takeaways
- If 35% or more of your replacement heifers are coming from your bottom-half genomic distribution, your sire lineup is doing half the work of the breeder’s equation while your dam decisions are doing none of it. That asymmetry is the single biggest driver of the gap between top-decile and median-herd rates of genetic gain.
- If your breeding objective lives in your head rather than on paper with specific thresholds, it’s a preference, not a program. Write the floor down. Name the person who can approve an exception. Require documentation when one gets made.
- If you’ve been genomic testing for three-plus years and your herd’s genomic floor hasn’t risen meaningfully, the tool is doing its job. The decision architecture around it may be the piece still waiting to catch up.
- If you can flush an elite heifer at 8 months instead of waiting for first lactation, you’re compressing roughly 2 years of generation interval per animal — and at roughly $79/year in NM$ gain, that’s a measurable outcome per calf, not a theoretical one.
- If the first cow your new threshold disqualifies is one you respect, the threshold is set at the right level. If it doesn’t cut anyone uncomfortable, the line is in the wrong place.
Watching the Race, Reading Your Barn
When the 2026 Derby field hits the wire at Churchill Downs this evening, most of the barn talk afterward will be about the trip, the track, the trainer, the jockey. Nobody on the broadcast will say the quiet part: the winning time will be what it is today because the Jockey Club decided decades ago which tools their breeders can and can’t use. You have every tool they don’t — AI, IVF, genomic selection at birth, global semen access, compressed generation intervals, and the data infrastructure to act on all of it. The only thing making those tools unavailable inside your fence line is whether you decided how to use them before you walked into the barn this morning.
So here’s the Derby Day question for your operation:
Which one of the four structural moves is the one you’ve been putting off — and what would have to be true in the next proof run for you to stop?
Complete references and supporting documentation are available upon request by contacting the editorial team at editor@thebullvine.com.
Learn More
- Overton’s 85-Herd Beef-on-Dairy Study: Why a 79% Heifer Completion Rate Limits Beef to About One-Third of Your Pregnancies — Calculate your exact safe limit for beef semen before starving the milking string. This breakdown of real-world mortality data from 85 herds exposes why common breeding plans silently pre-load a massive, six-figure replacement deficit.
- 9.57 Million Cows, 3.9 Million Replacements: Genetics Built This Dairy Herd Paradox – and 2027 Ends It — Position your balance sheet for the fast-approaching 2027 market reset by understanding the structural trap behind record U.S. cow numbers. Traces the current 48-year low in available replacements directly back to the extended longevity created by modern genomic selection.
- The Next Frontier: What’s Really Coming for Dairy Cattle Breeding (2025-2030) — Capture a $3,000 to $5,000 per cow premium by aligning your genetic strategy with emerging designer casein milk markets. Maps the impending collision between traditional production volume goals and the rapid rollout of CRISPR gene-editing technologies.
 The Sunday Read Dairy Professionals Don’t Skip.
 The Sunday Read Dairy Professionals Don’t Skip.
Every week, thousands of producers, breeders, and industry insiders open Bullvine Weekly for genetics insights, market shifts, and profit strategies they won’t find anywhere else. One email. Five minutes. Smarter decisions all week.
