



Archive for heifer completion rate

Net Merit Ranks the Females. Your Replacement Target Sets the Sexed-Semen Cutoff

It’s breeding-list day: 700 eligible females, 130 first-calvers needed. A fixed 60% sexed list projects 193. Rank on Net Merit, then stop the list at the target.

sexed semen cutoff

Put sexed semen on a fixed 60% of your eligible females without checking it against your replacement needs, and you can pay for heifers you never planned on. In a 500-cow Bullvine model, that rule costs $5,235 more in breeding expenditure (semen and labor) than a list built to the herd’s replacement target. It also projects about 63 expected first-calvers above the 130-head base requirement.

Genomics tells you which females to breed dairy. Your replacement target tells you how many.

To see how a fixed percentage drifts away from the replacement target, here’s the math on an illustrative 500-cow herd. It has 200 heifers reaching breeding age this year. After counting the pregnancies and youngstock already in its pipeline, it still needs 130 first-calvers from this year’s breedings. That 130 is an illustrative remaining requirement with no buffer added, not a recommended replacement rate.

“Top 60%” means 420 of the 700 eligible females (500 cows plus 200 heifers) ranked on Net Merit. The 60% is an illustrative fixed share, not an industry recommendation.

Sexed semen is already standard equipment. NAAB members sold 10.6 million units of gender-selected dairy semen in the U.S. in 2025, 64% of domestic dairy-semen units. That 64% counts semen units sold, not females bred. Lauber and co-authors found herds allocating sexed and beef semen by parity and service number. Neither data set shows whether those herds set a replacement target first.

What the three plans project

The table compares three ways to breed the same 700 females. Each sexed-listed female gets up to two sexed services, then one beef service if she’s still open. Beef-listed females get up to three beef services. These are Bullvine projections, not herd results.
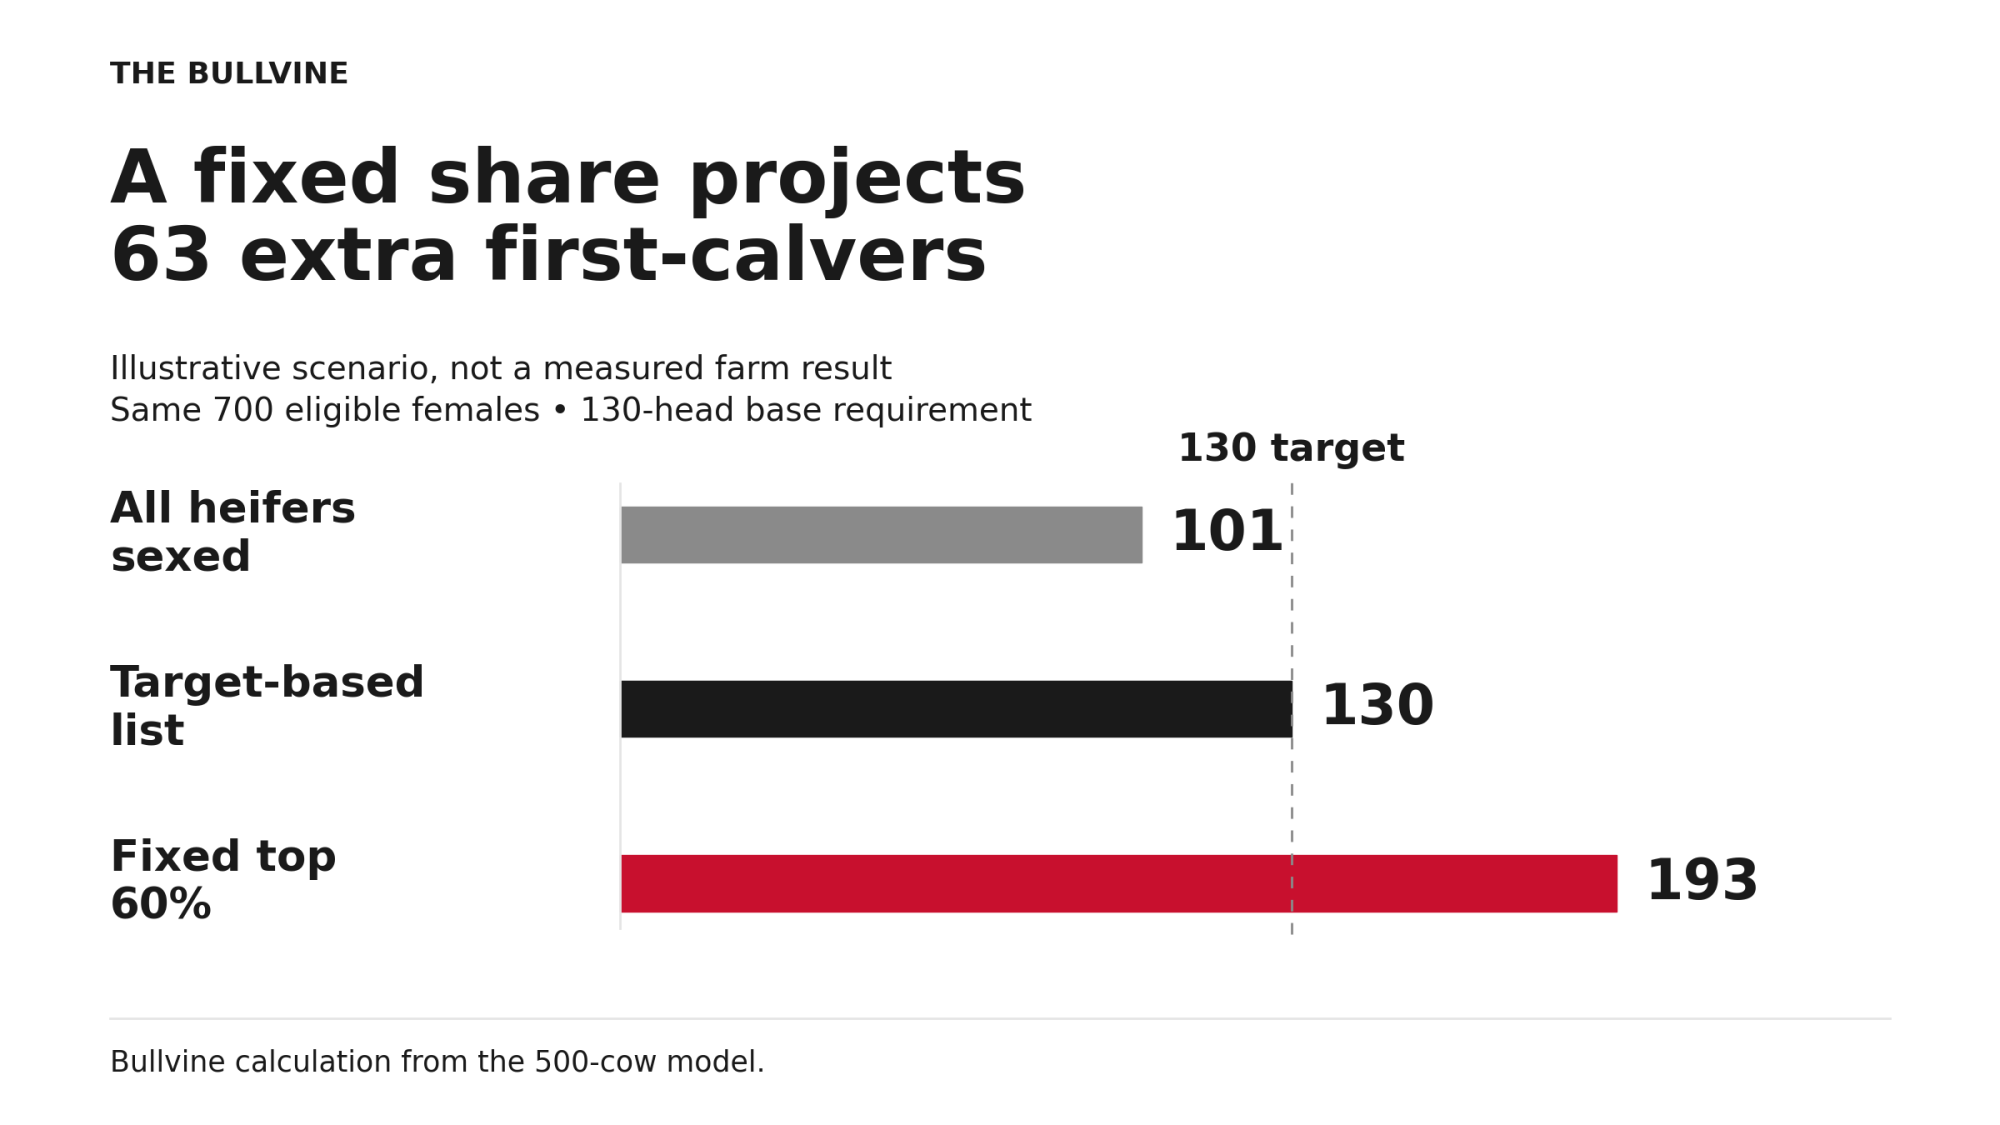
Modeled first-calvers: all heifers sexed 101, target-based 130, fixed top 60% 193; base requirement 130.
PlanSexed-listed femalesExpected first-calversDifference from targetModeled breeding cost (US$, semen + labor)
All heifers sexed200101−29$36,130
Target-based listAbout 2811300 expected$39,426
Fixed top 60%420193+63$44,661

Costs assume the service limits above and stop after the last specified service.
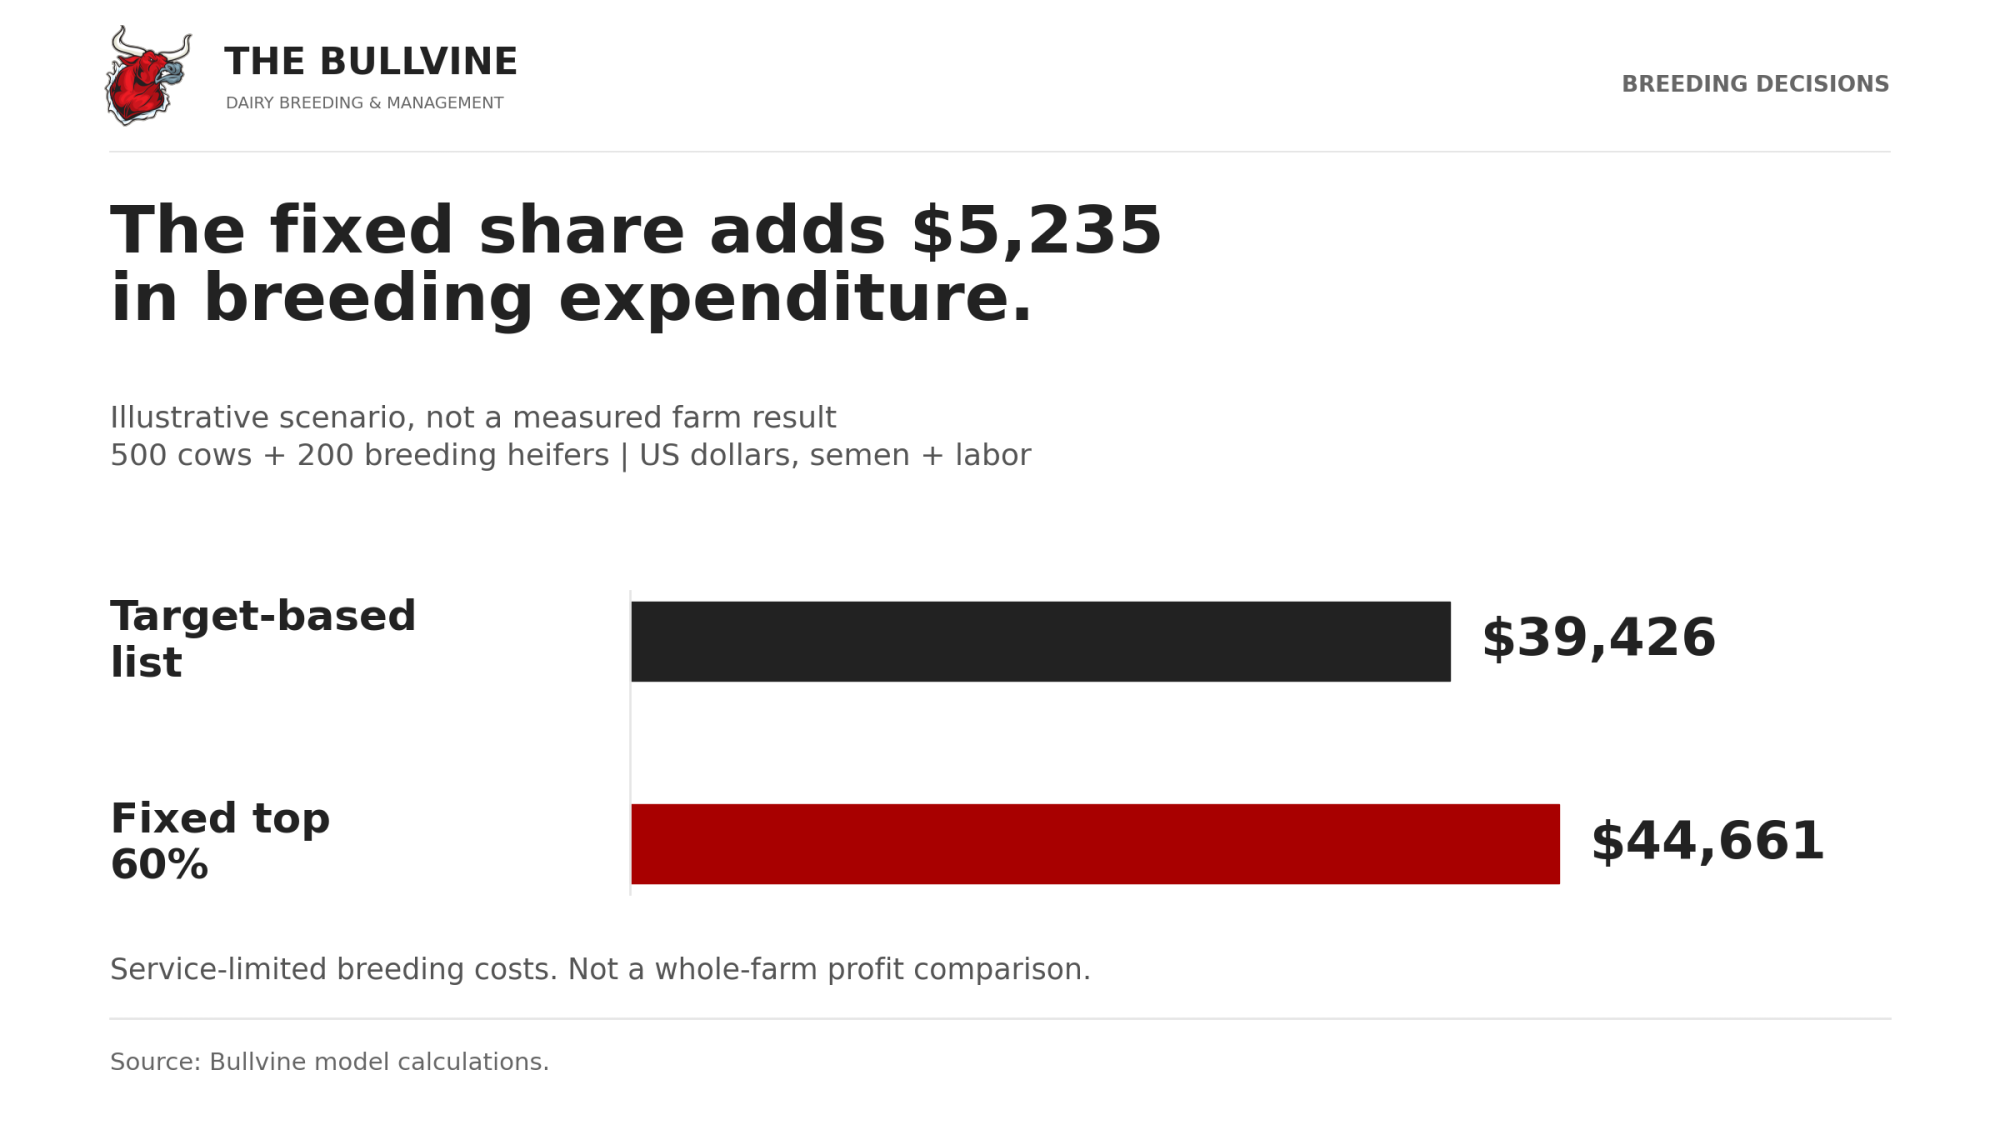
The comparison covers replacement supply and breeding cost. It isn’t a whole-farm profit ranking. It leaves out calf revenue, surplus-heifer sales, rearing costs and the choice of which daughters to keep. The fixed share’s list also reaches further down the rankings, so on average its replacements come from lower-ranked dams.

For what happens to the replacement count when beef takes more of the services, see the companion piece, USDA’s 3.905 Million-Heifer Paradox.

Count backward from calving

This is a one-cohort illustration, not a steady-state herd. The 200 heifers enter breeding over the next 12 months, and the 500 cows are bred in the same window. Their daughters won’t reach the milking string for more than two years.
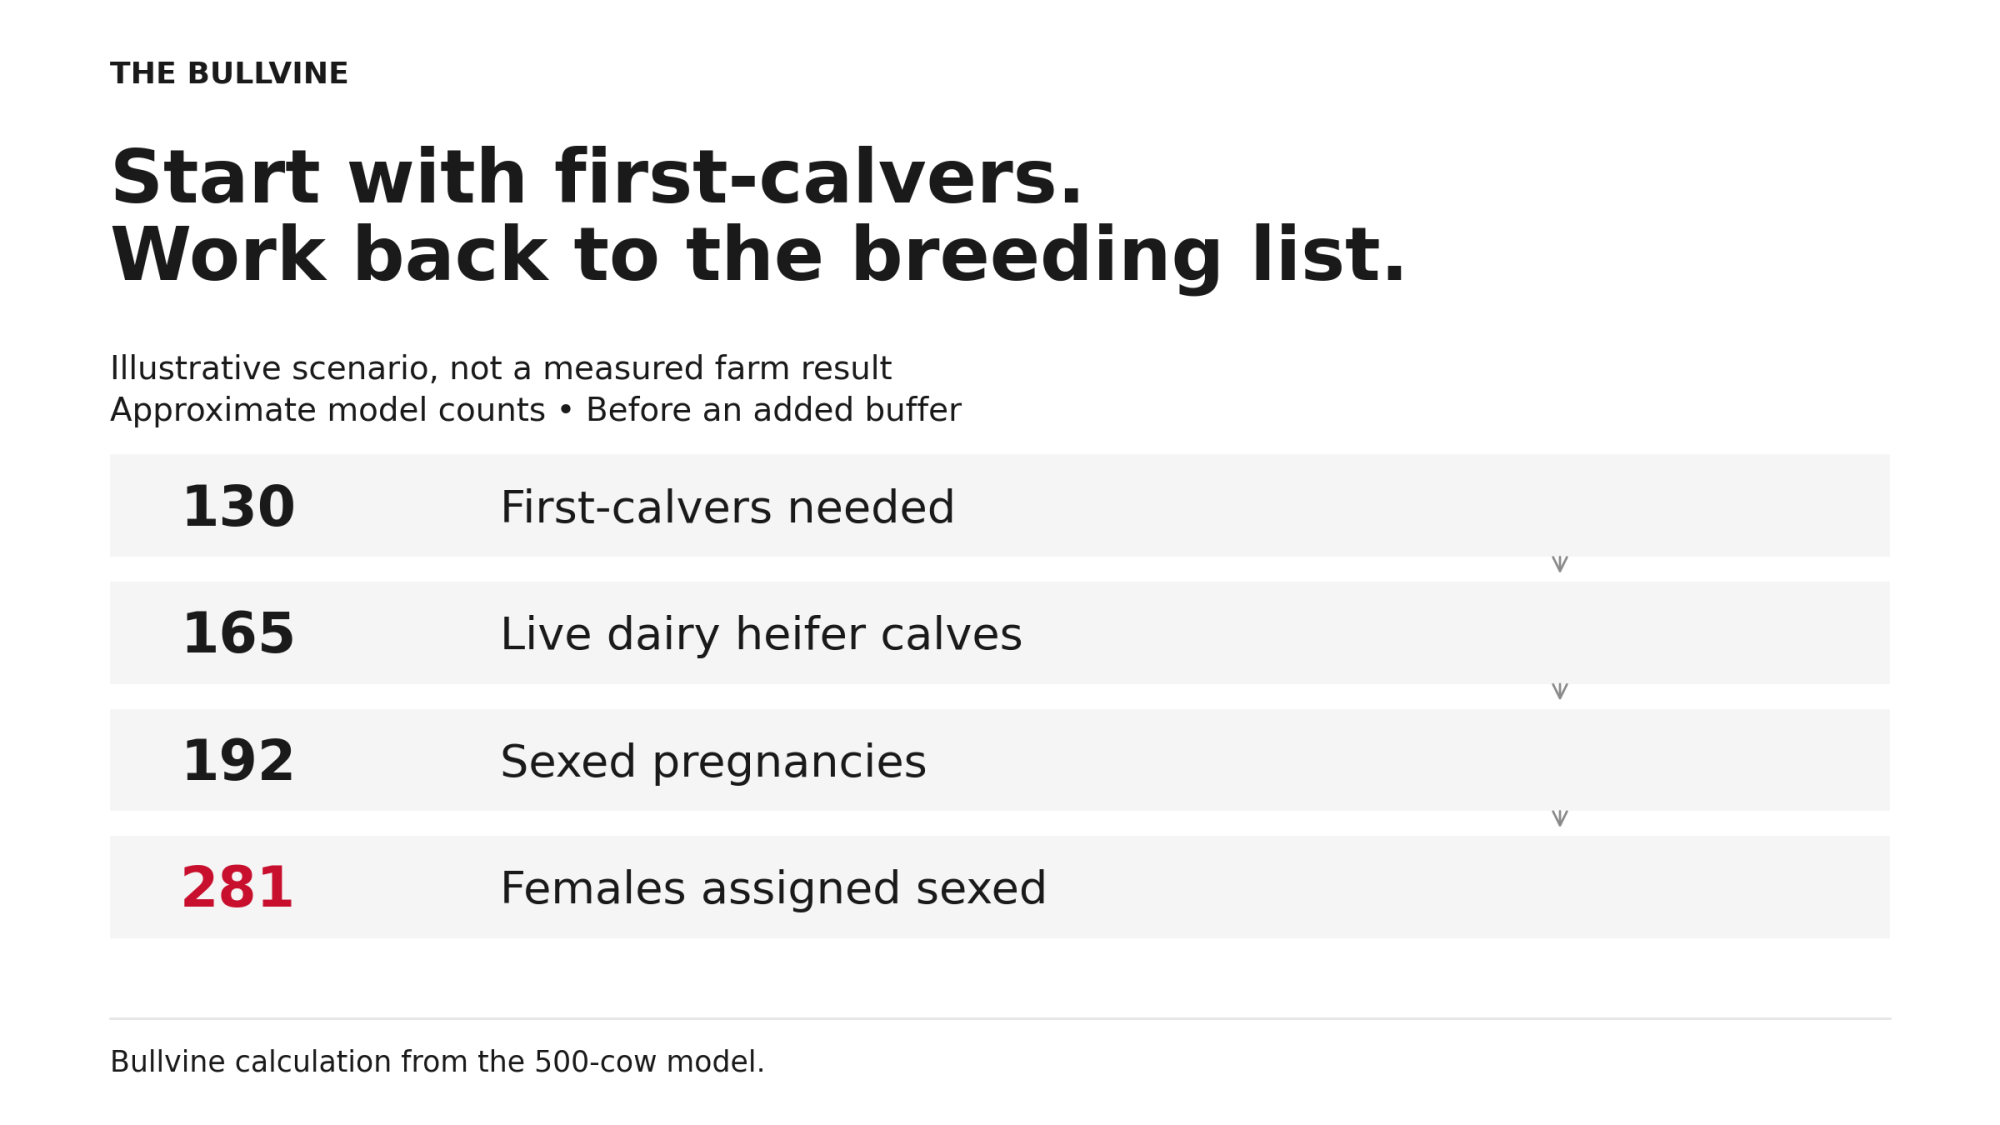
Backward calculation: 130 first-calvers, about 165 live heifer calves, 192 sexed pregnancies and 281 listed females.

The funnel, from target back to pregnancies:

  • Target: 130 first-calvers entering the milking string.
  • Live heifer calves needed: about 165, assuming 79% complete the trip from birth to first calving.
  • Sexed pregnancies needed: about 192, assuming 90% of calves are female and 5% of diagnosed pregnancies don’t end in a live calf. The 5% is a model assumption; Overton’s herd data show lower survival for cow pregnancies, which the fourth scenario below tests.
  • Sexed list: about 281 eligible females. Each listed heifer yields 0.51 expected first-calvers and each listed cow 0.43. Because the list includes top-ranked cows, some lower-ranked heifers fall outside it and get beef.

The 79% is the median Michael Overton, a Zoetis veterinarian, reported across 85 U.S. herds in March 2026, with an interquartile range of 74% to 84%. He labeled these “NOT benchmarks or goals.”

His completion stages count deaths, sales, heifers that never conceive and conceived heifers that fail to calve. Before reusing your own historical rate, check why heifers left. A herd that used to sell surplus dairy heifers has a completion rate shaped by that policy.

Target, buffer or surplus

A workable replacement target separates three numbers:

  • Expected requirement: the first-calvers the herd needs.
  • Planned buffer: a deliberate margin for contingencies or extra selection.
  • Unplanned surplus: anything beyond both.

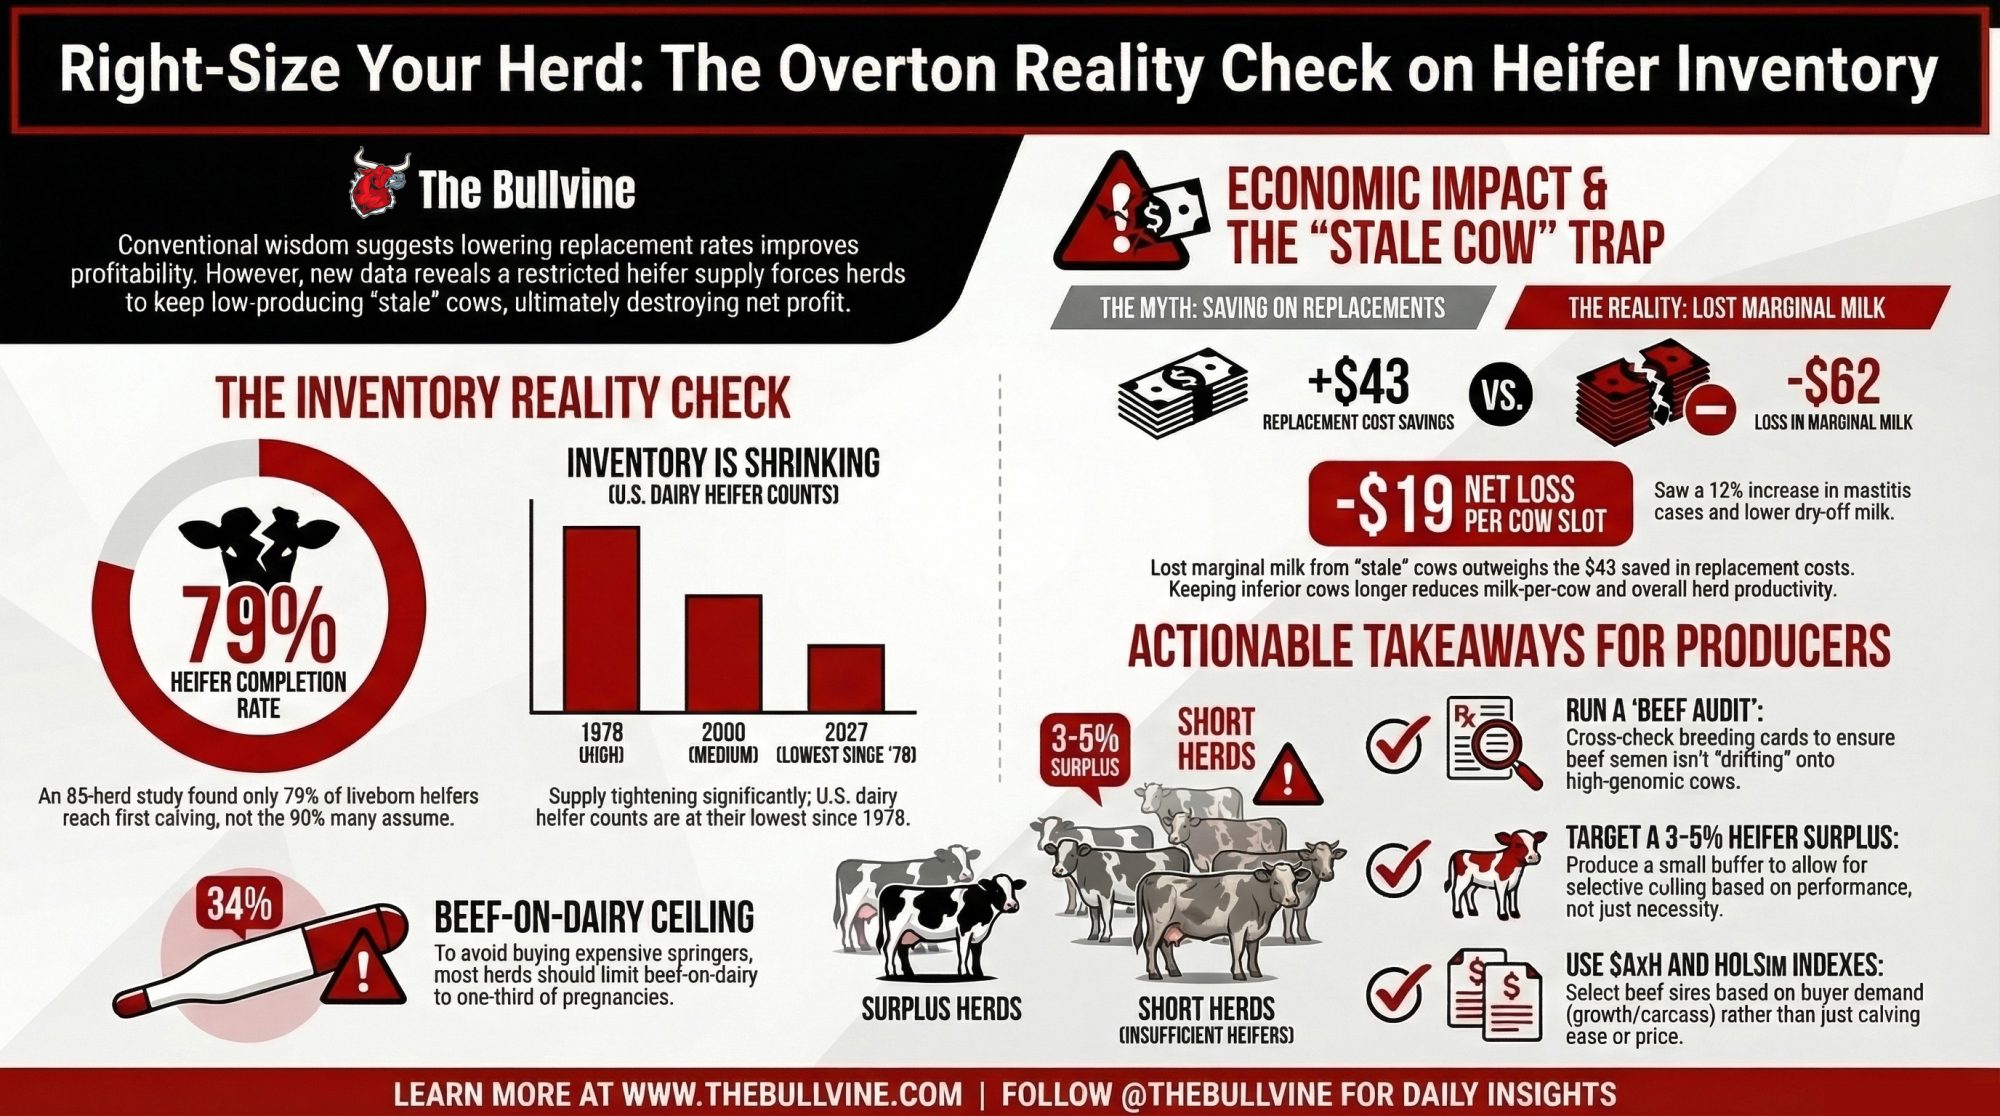
Overton advised using enough sexed semen to produce “a bit of a surplus of heifers,” with “3-5% as a start.” For this herd, 3–5% of the 500-cow inventory is 15 to 25 extra first-calvers. That’s roughly 12% to 19% above the 130-head base, so the buffer scenario raises the remaining requirement to 145–155. Overton’s own worked example also allows for historical year-to-year variation, so this is a simplified version of his method.

At 145 to 155, the target-based list grows to about 314–336 females. The fixed share’s projected 193 still sits 38 to 48 head above it.

Planned extra heifers have uses: more selective replacement, selling springers, culling weaker heifers on genomic results. The case here is against surplus nobody planned for.
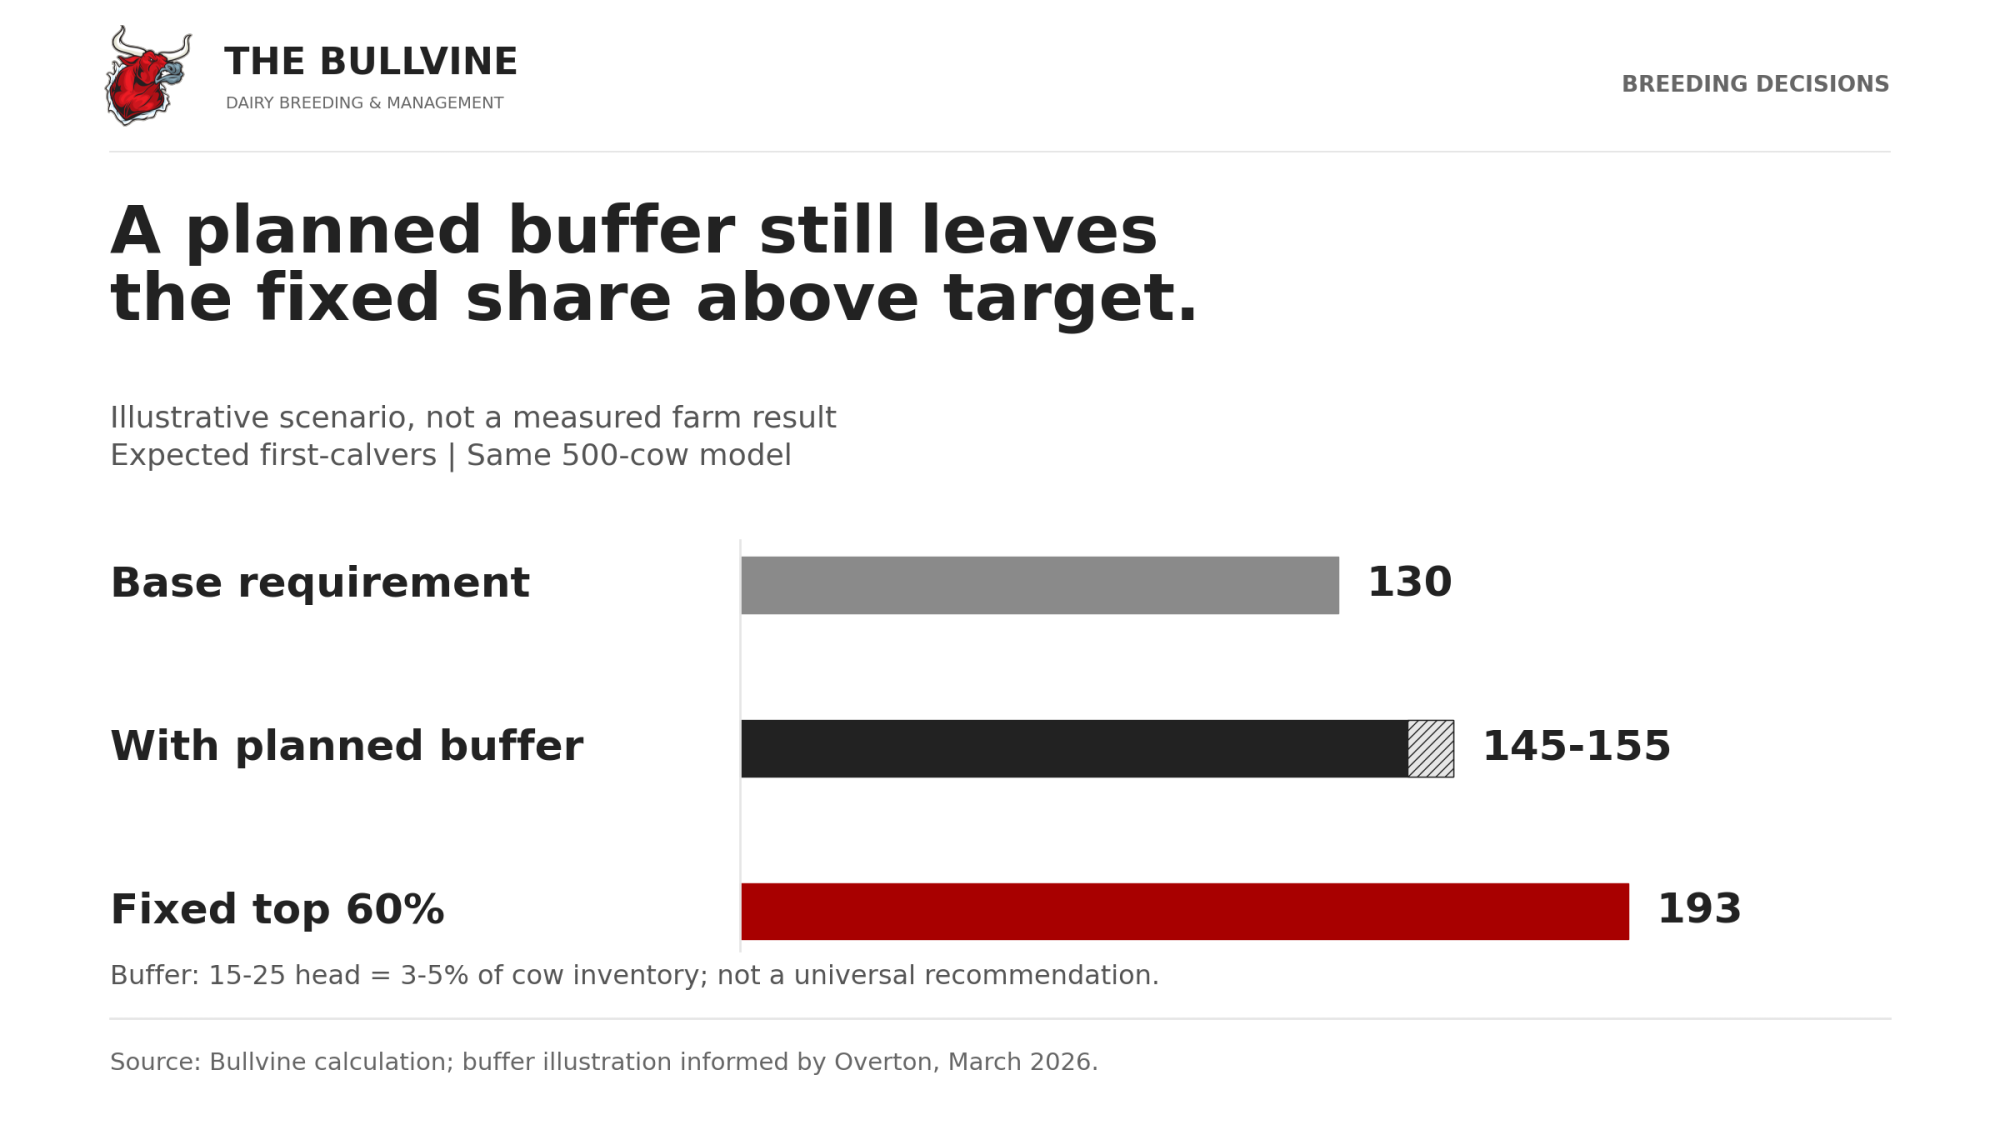
Even with the illustrative buffer, the 193 projected first-calvers exceed the 145–155 requirement. Source: Bullvine calculation informed by Overton.

Fertility sets the length of the list

In the two trials cited here, sexed-semen P/AI (pregnancies per insemination) at first service ranged from about 43% to 59%. The trials differed in protocol, herds (one used Irish seasonal pasture herds) and the day pregnancy was checked, so that roughly 16-point gap has more than one cause. Either way, it’s why you can’t borrow a neighbor’s percentage. Your list length has to follow your own farm’s fertility records.
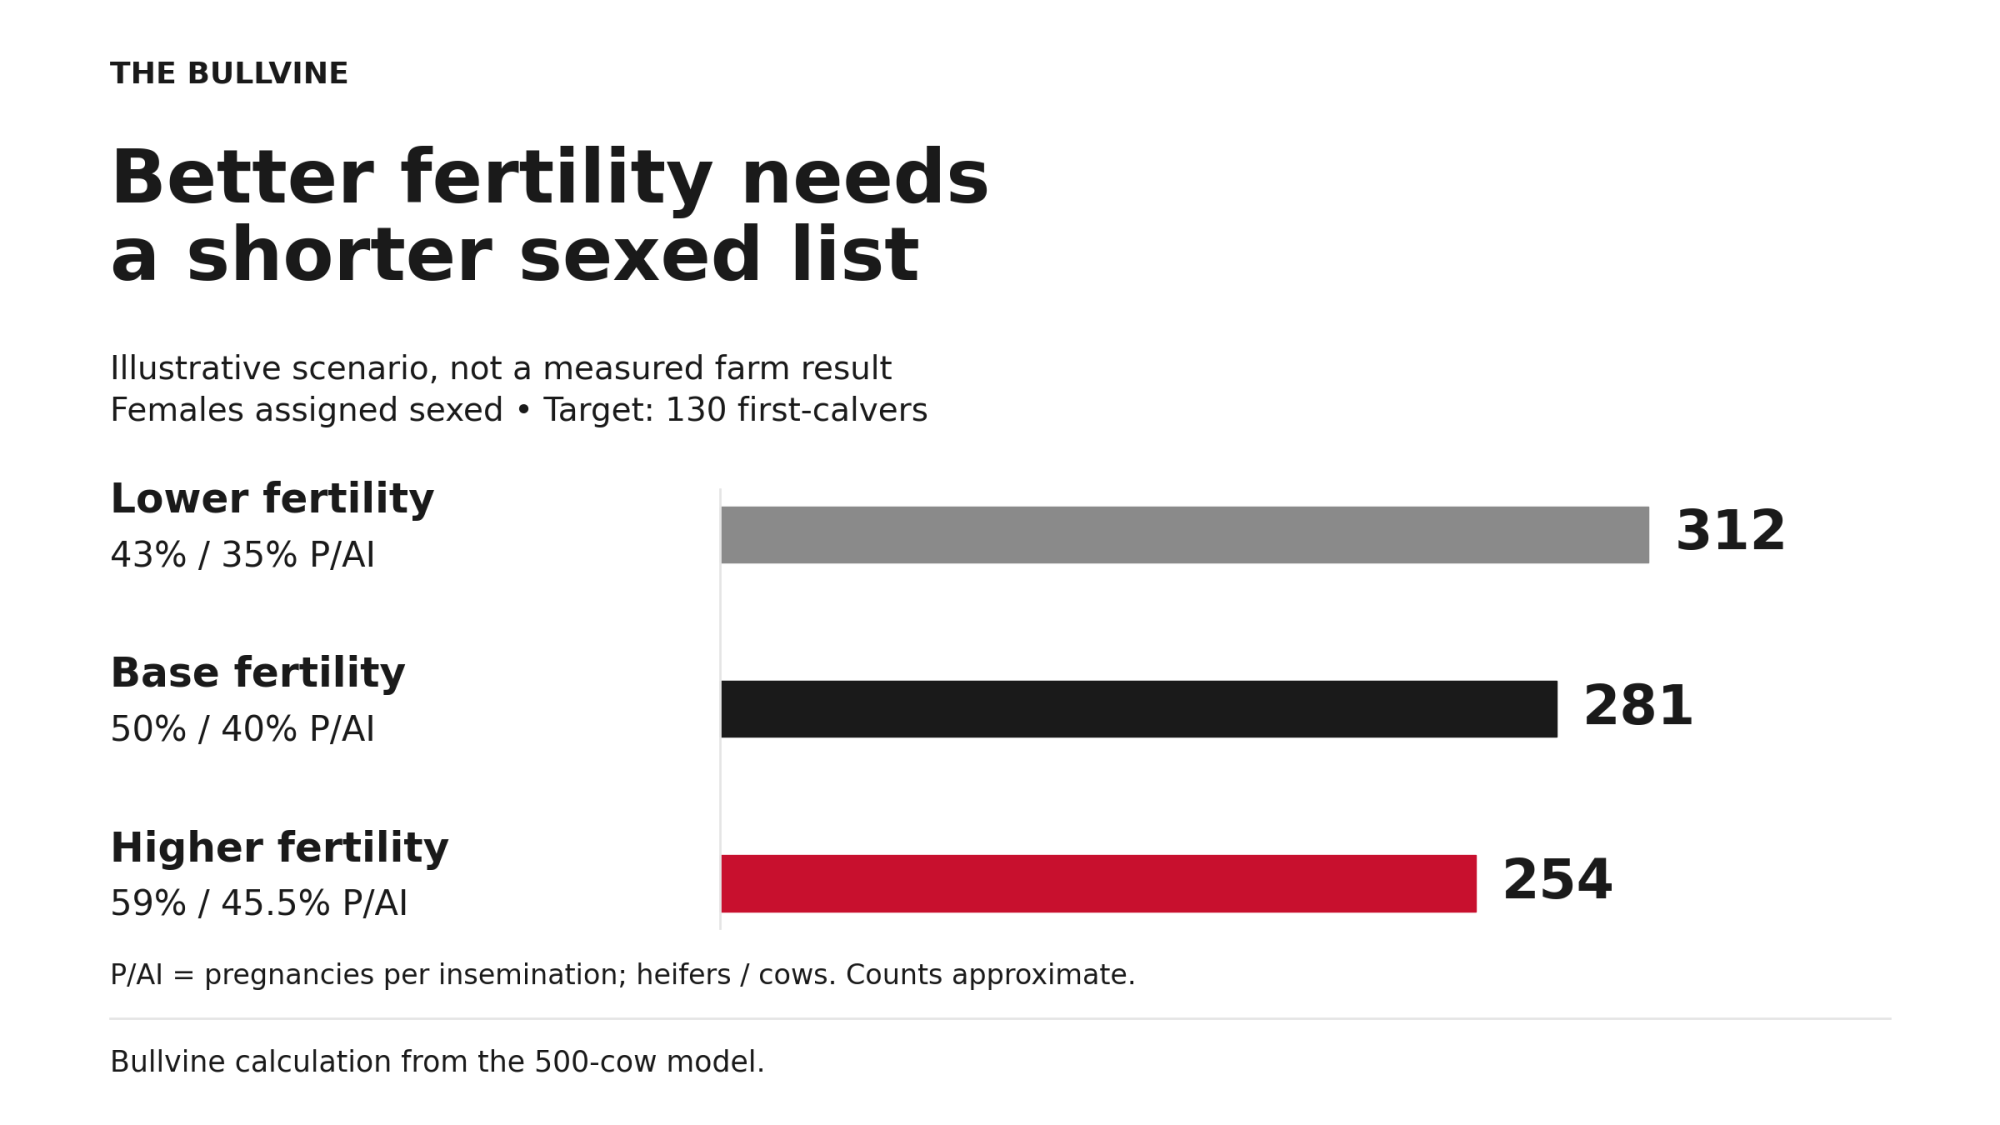
Lower, base and higher fertility need about 312, 281 and 254 sexed-listed females to target 130 first-calvers.
Scenario (sexed P/AI, heifers / cows)All heifers sexed: expected first-calversTarget-based list: females assigned sexedFixed top 60%: expected first-calvers
Lower (43% / 35%)91 (−39)About 312174 (+44)
Base (50% / 40%)101 (−29)About 281193 (+63)
Higher (59% / 45.5%)112 (−18)About 254213 (+83)
Base conception, alternative survival assumptions99 (−31)About 299181 (+51)

The fourth row uses different pregnancy-to-live-calf assumptions for heifers and cows. With survival based on Overton’s data, the fixed share’s projected surplus is about 51. The 44-to-83 range spans three tested fertility scenarios. It isn’t an uncertainty interval.

A percentage isn’t wrong in itself. In the base case, the target-based list puts sexed semen on about 40% of eligible females (281 of 700). Across the other scenarios, that runs from about 36% to 45%.

What goes wrong is treating an inherited percentage as the goal. The percentage should come out of the replacement calculation, and it should move whenever fertility, eligible numbers or the requirement changes.

Choose the index before setting the cutoff

The model ranks on Net Merit, but the cutoff logic doesn’t depend on which index you use. CDCB publishes four lifetime merit indexes: Net Merit, Cheese Merit, Fluid Merit and Grazing Merit. Breed associations add their own, such as Holstein TPI, and Lactanet publishes LPI and Pro$.

  • Pick the index that fits your breeding objective.
  • Rank every eligible female on that same index and evaluation system.
  • Look hard at the animals near the cutoff.

A 2018 article by Brian Van Doormaal reported that genotyping more than doubled average Holstein heifer reliability for LPI and Pro$, from about 33% to 70%. Use the reliability on each female’s current report. A small predicted gap near the cutoff is real information, but it shouldn’t settle the decision on its own.

When sexed on every heifer is enough

Under these assumptions, sexed semen on every heifer supplies about 91 to 112 expected first-calvers from this cohort, depending on fertility. If your remaining requirement is at or below that, the blanket heifer plan fills it without ranking the cows.

Newton and co-authors’ Australian pasture-based model found the net benefit of genotyping heifers depended on reproductive performance, replacement rate, whether parent-average information was available, and returns from surplus heifers.

Running it month to month

Keep two numbers apart:

  • Total requirement: first-calvers needed in a chosen future window, with your buffer included once.
  • Remaining breeding requirement: what’s still unfilled after the pipeline is credited. In the base model that’s 130 with no buffer; in the buffer scenario it’s 145–155. Don’t add the buffer twice.

Each month:

  1. Pick the future arrival window and set its total requirement, buffer included.
  2. Credit only prospective replacements expected to arrive inside that window, applying only the risks still ahead of each one.
    1. Existing replacement heifers count by their own expected first-calving date. A confirmed pregnant heifer has already passed most of the stages inside the 79% figure; in Overton’s data, a median 3% of heifers that conceive fail to calve.
    1. Dairy pregnancies meant to produce replacement daughters count by those daughters’ later expected first-calving dates.
  3. Count each prospective replacement once. A pregnant heifer and her female fetus are two prospective replacements for different windows.
  4. Subtract expected arrivals from the total requirement. That gives the remaining breeding requirement.
  5. Assign dairy breedings to that gap.

Keep three checks separate:

  • Genetics sets the rank.
  • Health and reproductive status set eligibility.
  • The replacement target sets the cutoff.
DecisionInstruction (the modeled target-based rule)
Eligible and selected to meet the dairy targetUp to two sexed services
Still open after two sexed servicesOne beef service
Eligible but outside the dairy listUp to three beef services
Not suitable for further breedingIndividual management review

Adding conventional dairy semen is a separate strategy, and it needs its own calculation.
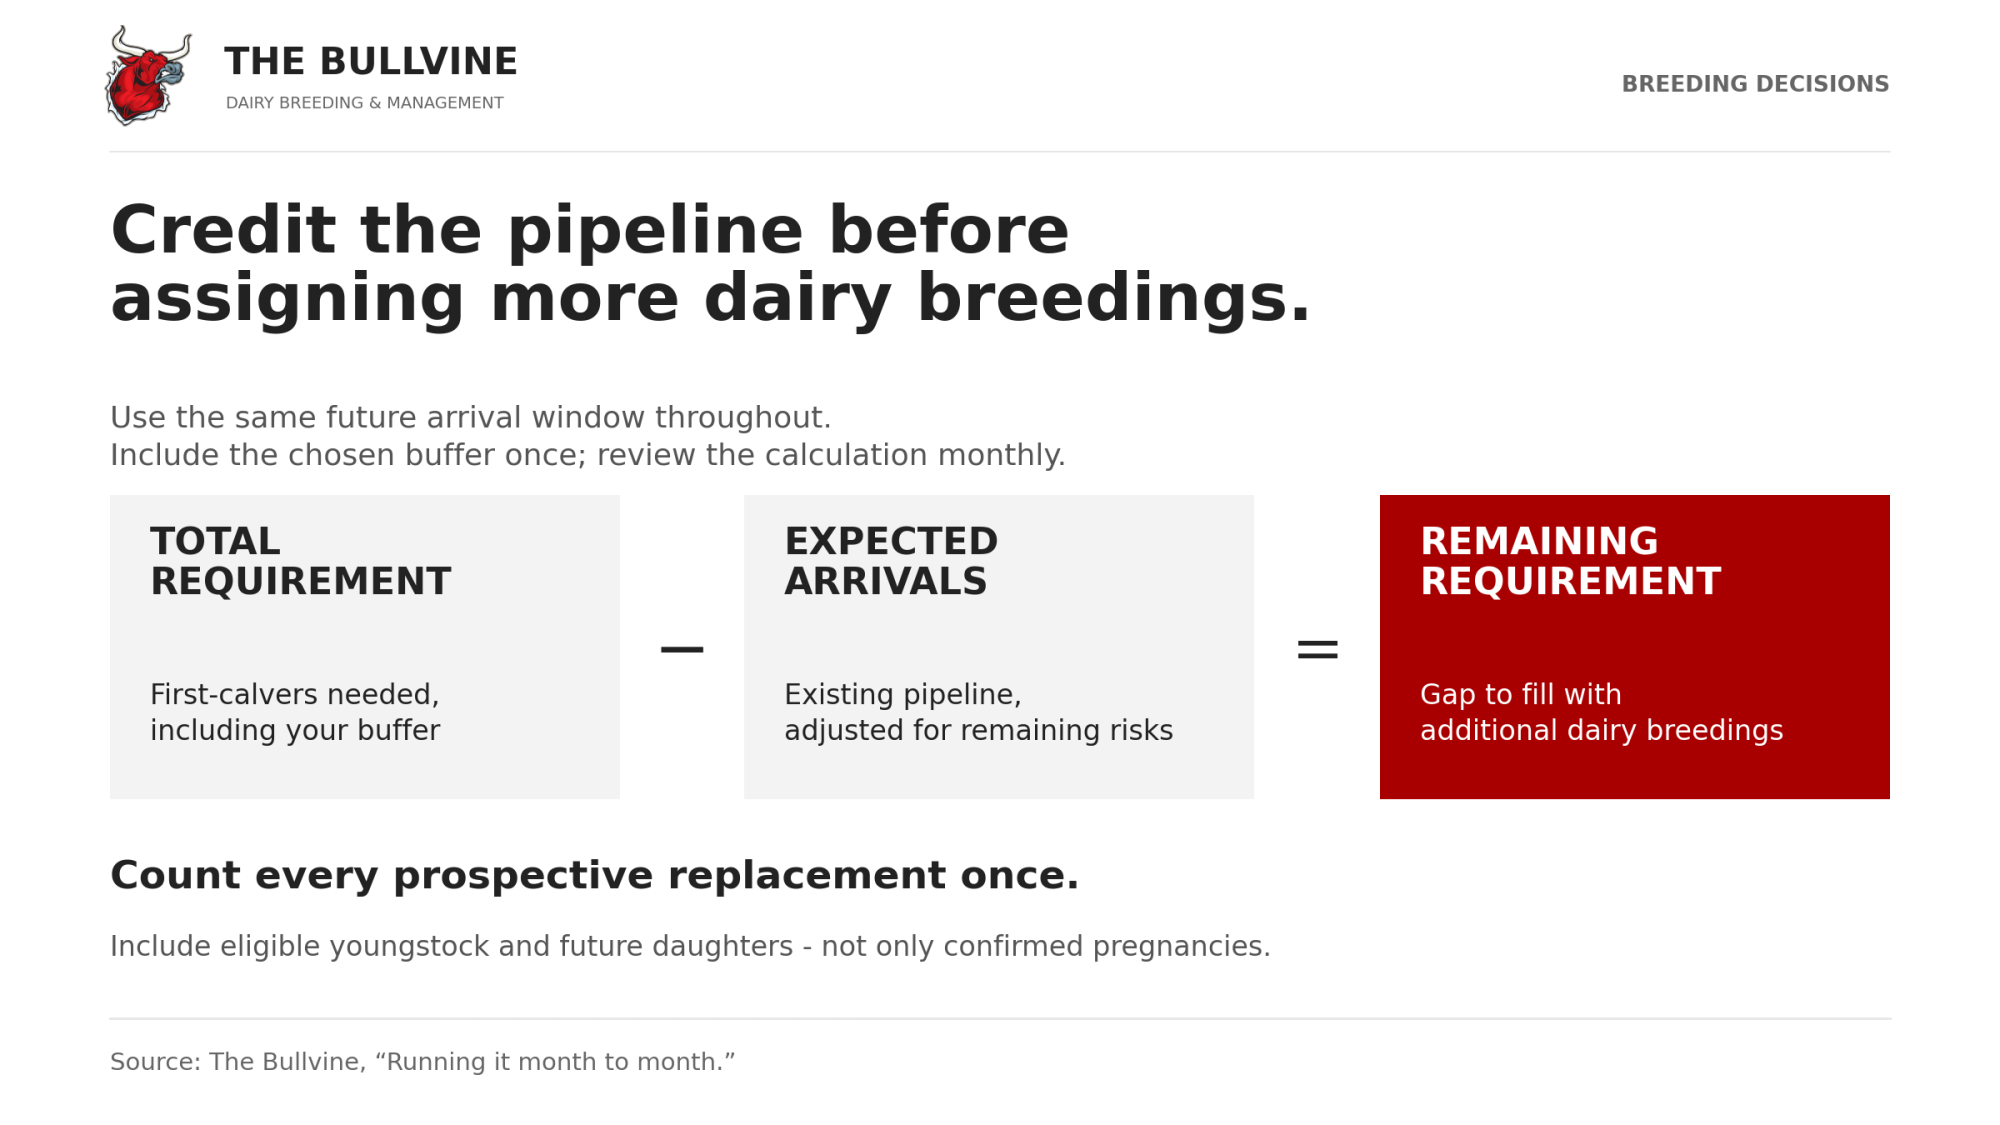
Credit expected arrivals before assigning additional dairy breedings, counting each prospective replacement once. Source: The Bullvine.

Your next breeding meeting checklist

Before you order semen for the next quarter, bring these three numbers to the table:

  1. Expected first-calvers needed in the chosen window, including the chosen buffer.
  2. Expected arrivals already committed to that window.
  3. Expected first-calvers from the proposed dairy breeding list.
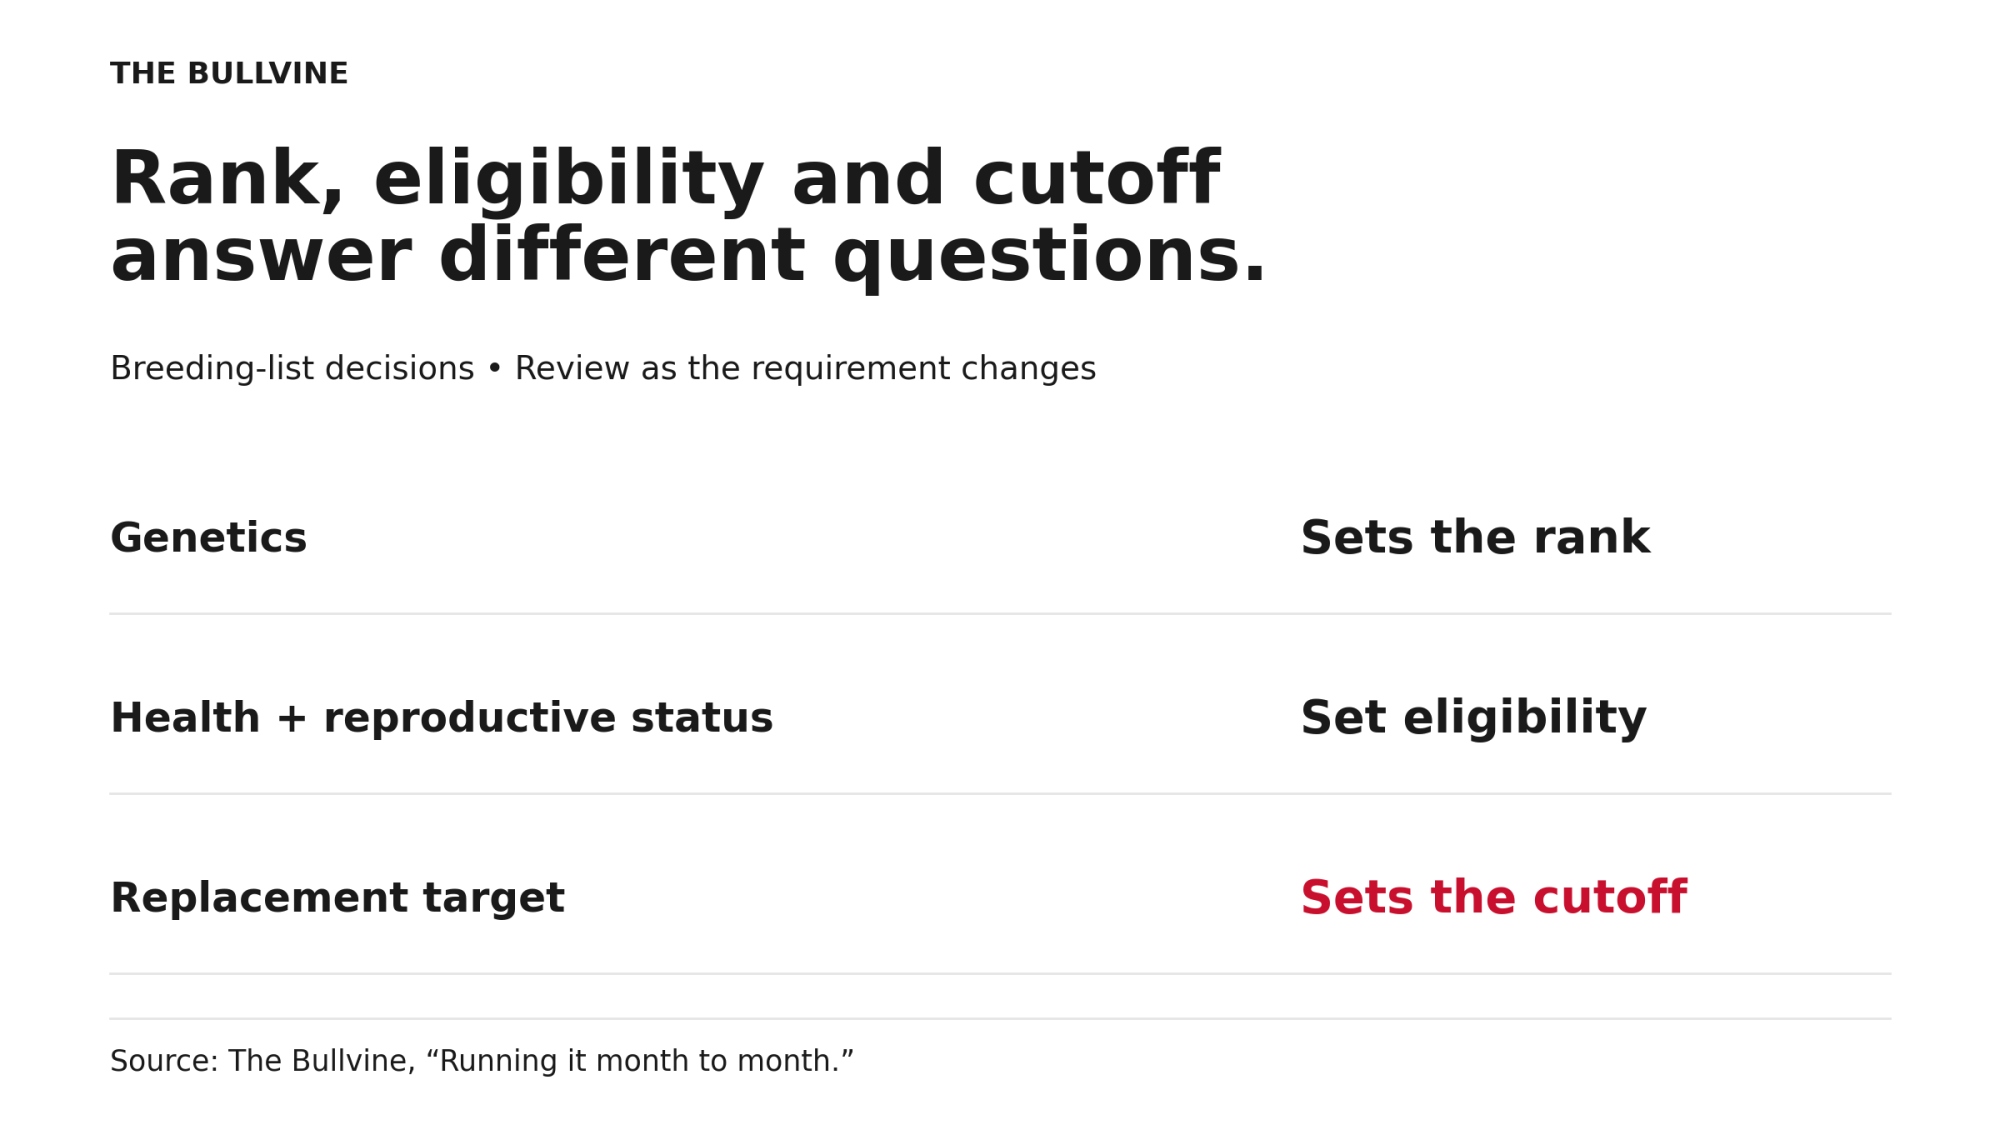
Genetics sets rank; health and reproductive status set eligibility; the replacement target sets the cutoff.

If the second and third don’t add up to the first, start by checking the requirement, buffer and pipeline estimates. If they still hold, change the breeding list to close the gap. Don’t move a justified target just to make the current semen allocation look adequate.
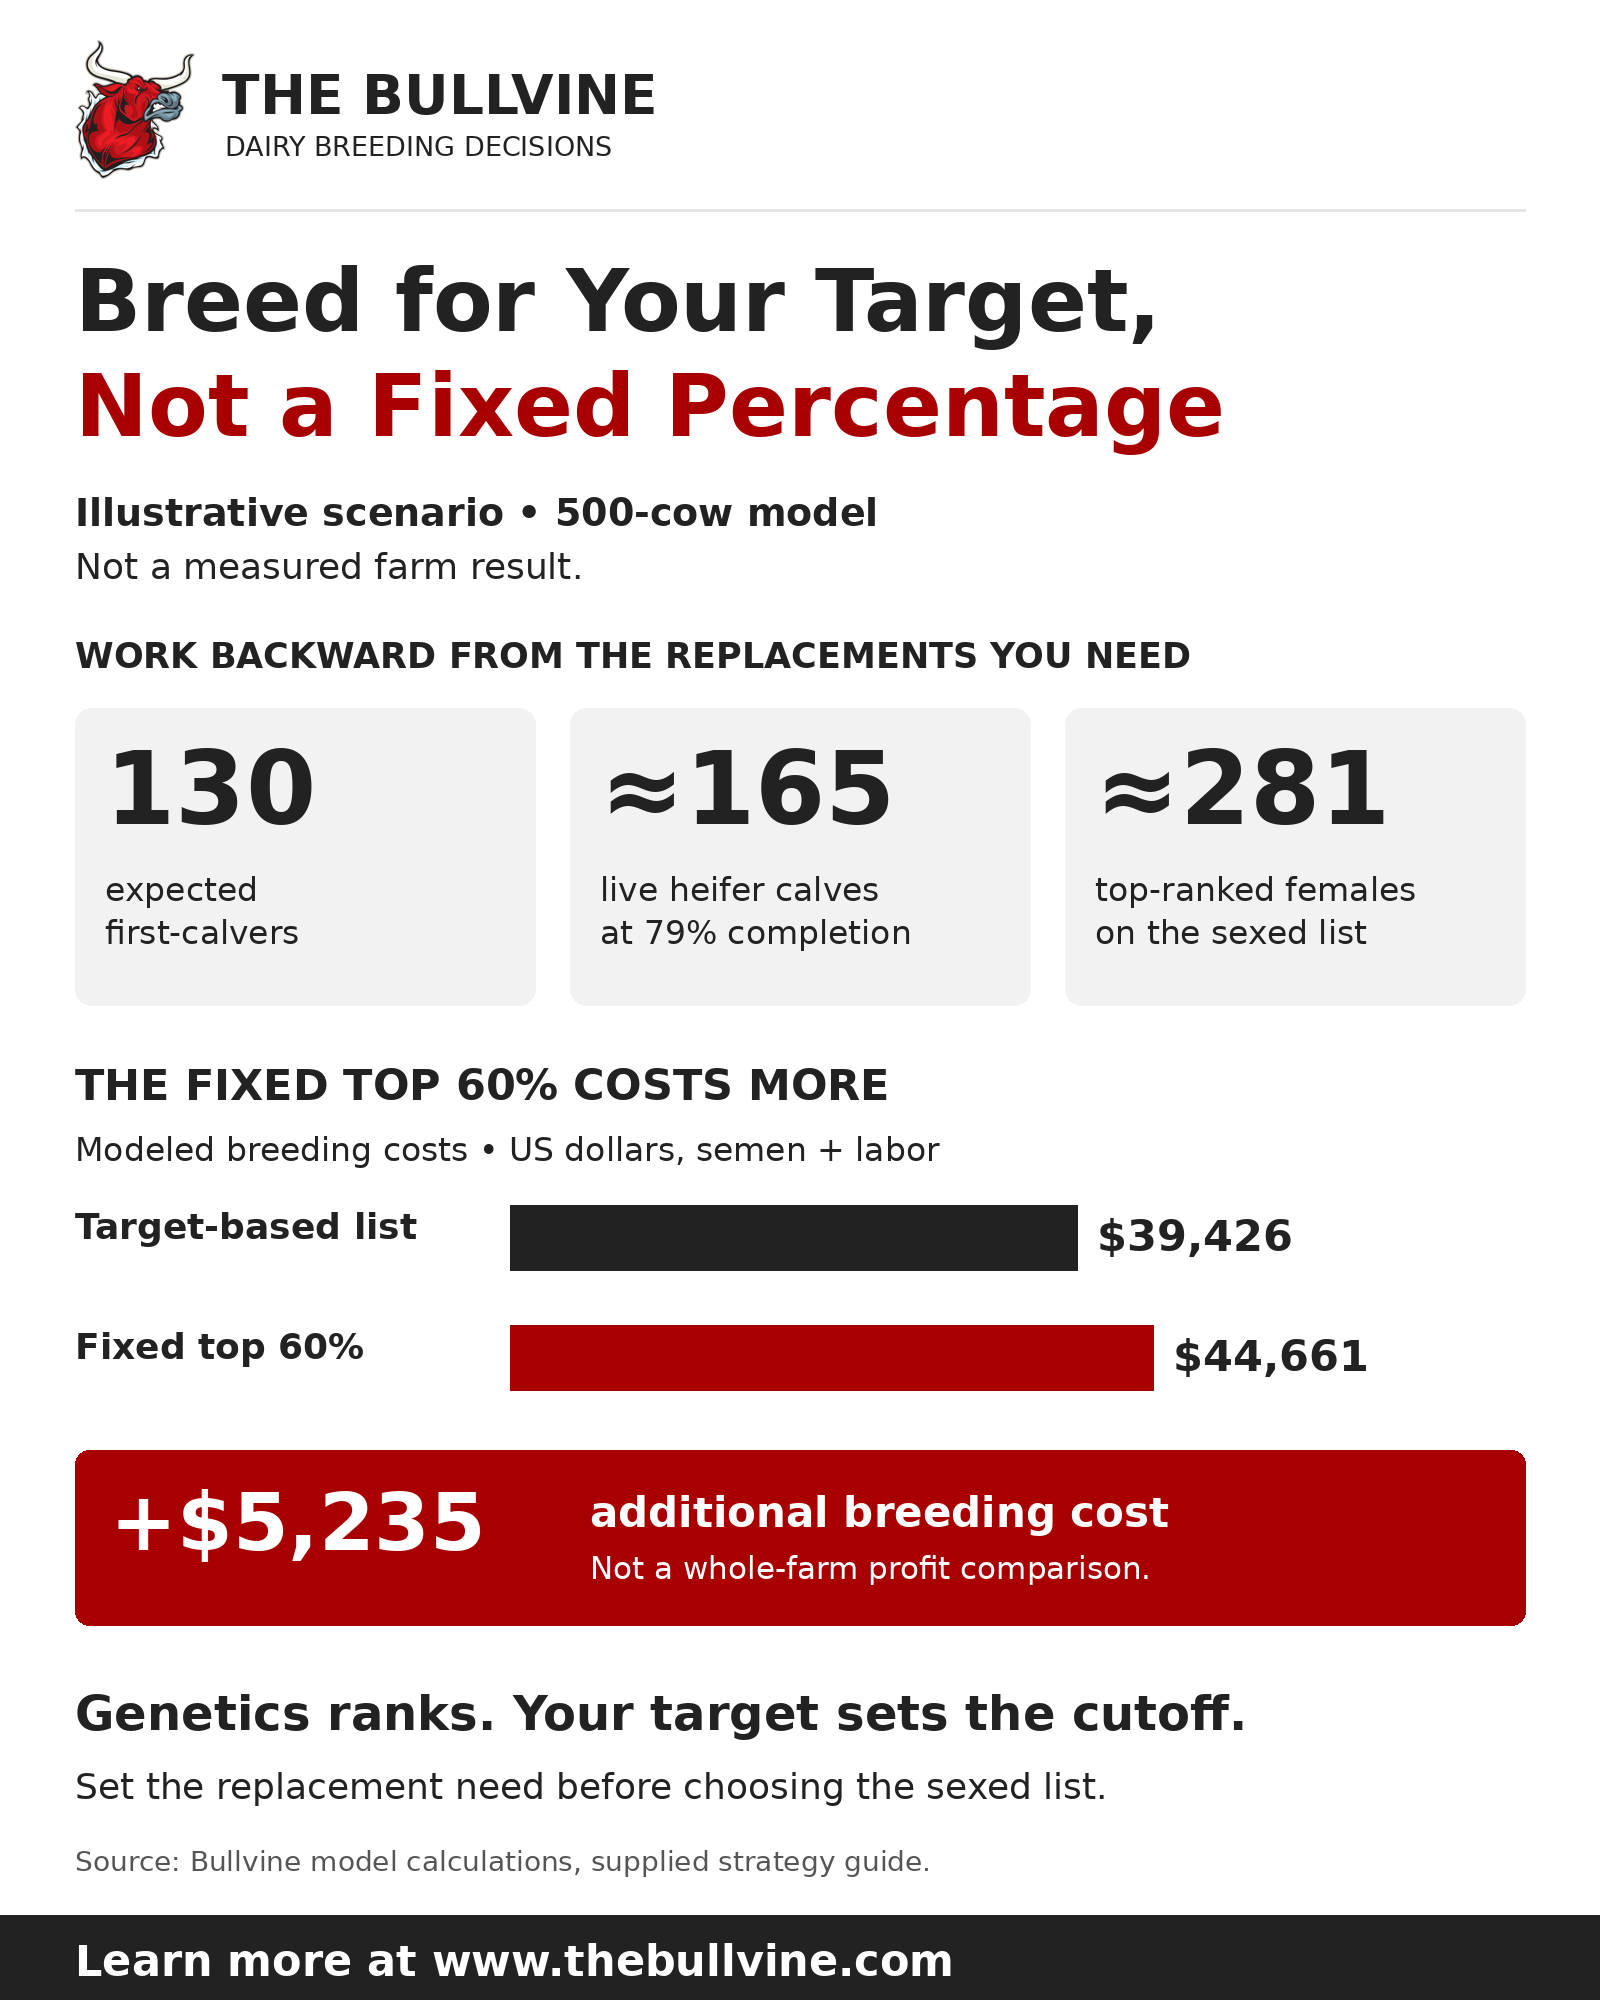
Rerun it whenever fertility, eligible numbers or the requirement changes. To score your whole replacement pipeline, run the Bullvine Pipeline Index Calculator.

Methodology: how the model works

This is the accordion, closed by default. The content is unchanged except for the two restored paragraphs below, and “labour” is now “labor” in the inputs table.

CDCB describes its indexes as the lifetime-profit difference an animal is expected to transmit to its progeny. So the $50 dam-group gap is an expected daughter lifetime-profit gap under the index’s assumptions, not realized profit. With equivalent sires, the daughters’ own NM$ values would differ by about half the dam-group difference, roughly $25.

Index revisions vs. switching indexes. USDA reports a 0.992 correlation between the 2021 and 2025 Net Merit formulas for young Holstein bulls. Lactanet expected “minor reranking” among top bulls after moving its Holstein production subindex from 60:40 to 40:60 fat to protein. Both describe revisions within one index, and neither guarantees a farm’s own cutoff animals stay put.

Learn More

The Sunday Read Dairy Professionals Don’t Skip.

Every week, thousands of producers, breeders, and industry insiders open Bullvine Weekly for genetics insights, market shifts, and profit strategies they won’t find anywhere else. One email. Five minutes. Smarter decisions all week.
NewsSubscribe
First
Last
Consent

USDA’s 3.905 Million-Heifer Paradox: A 500-Cow Dairy Can Sell 291 Beef Calves and Still Come Up 28 Replacements Short

Your 291 Beef Calves Can Still Leave You 28 Replacements Short

beef-on-dairy replacement gap

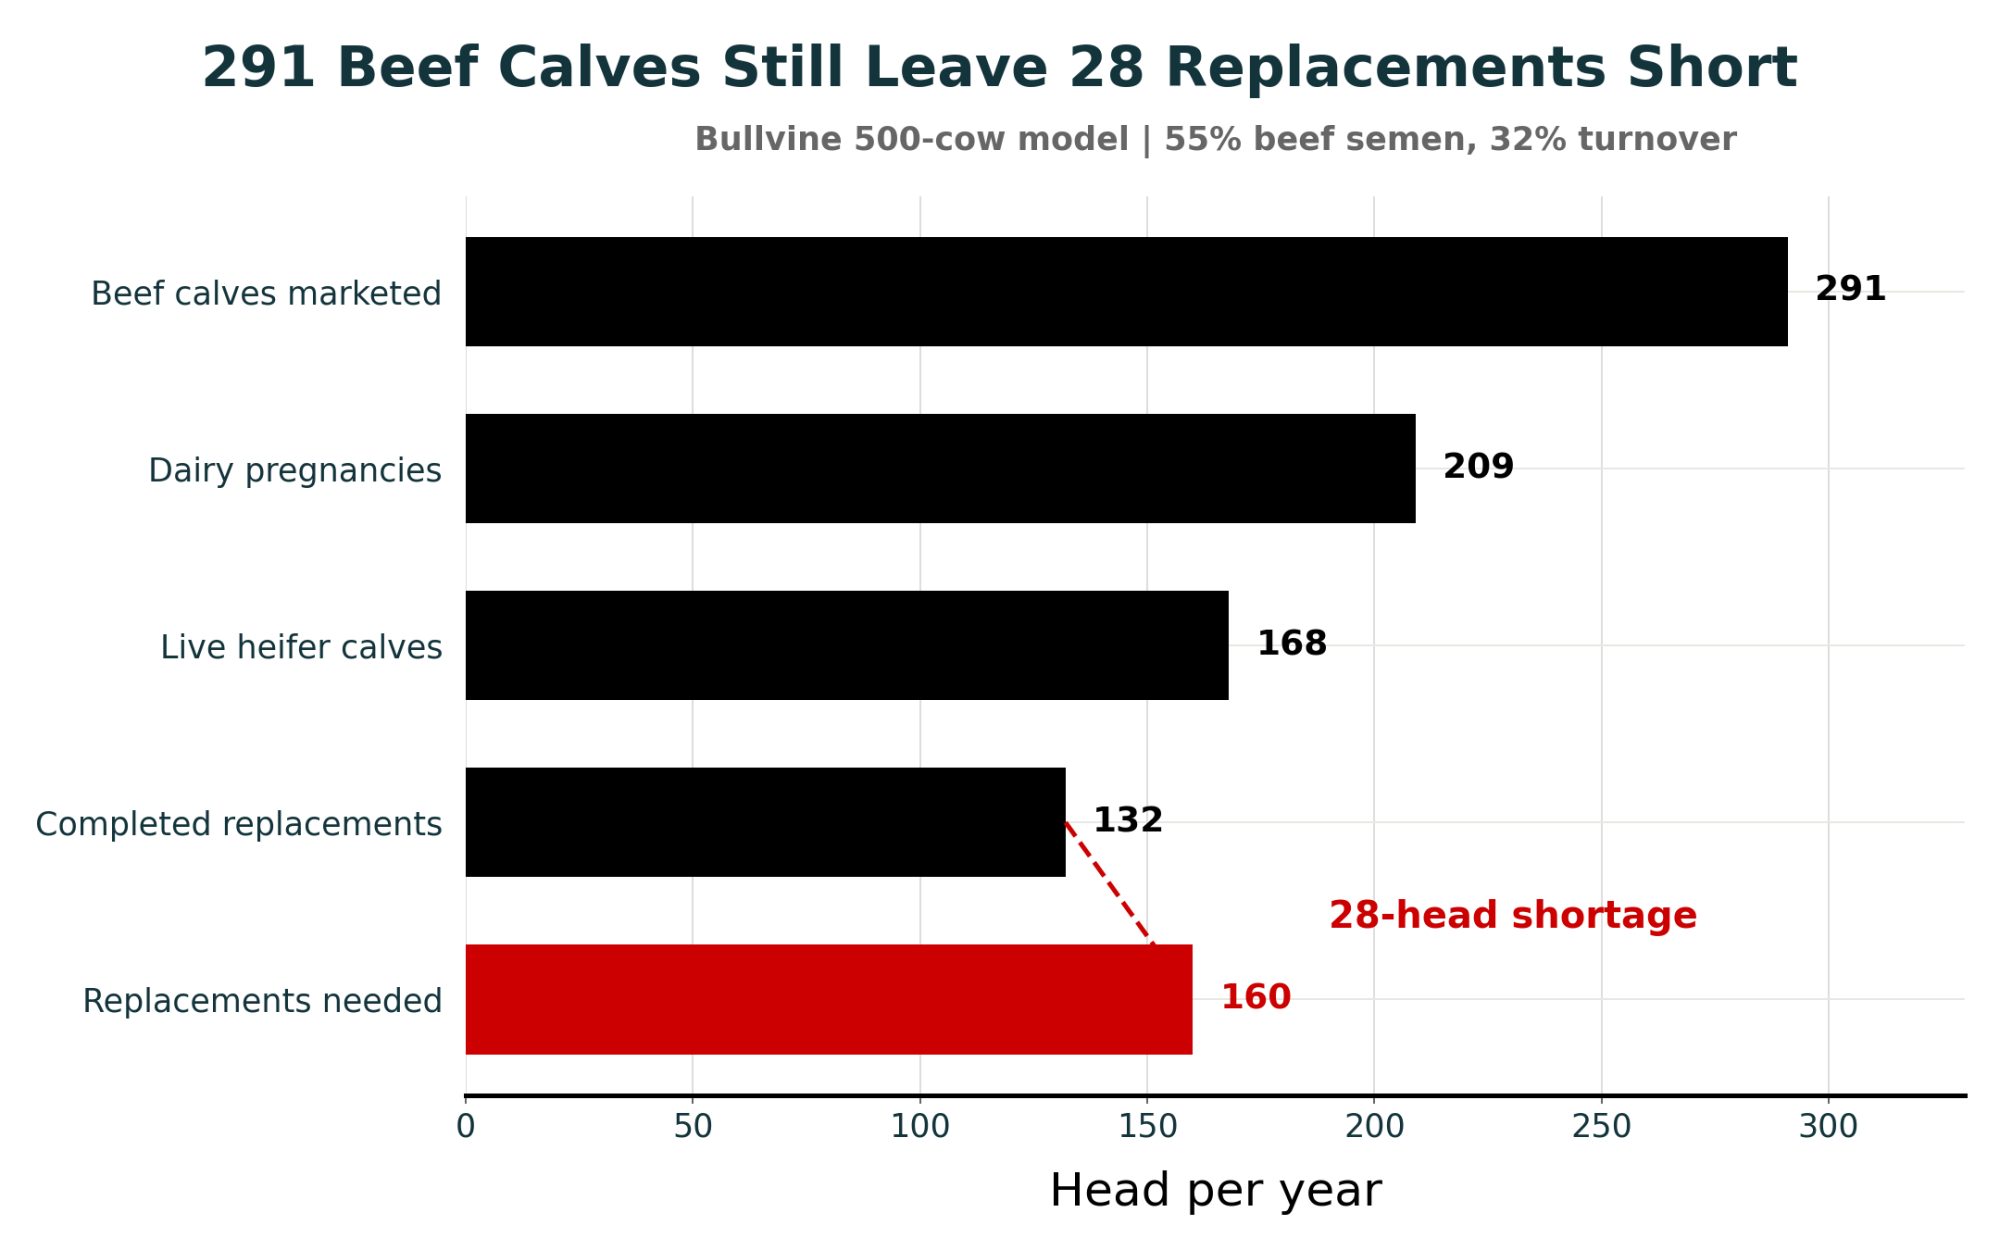
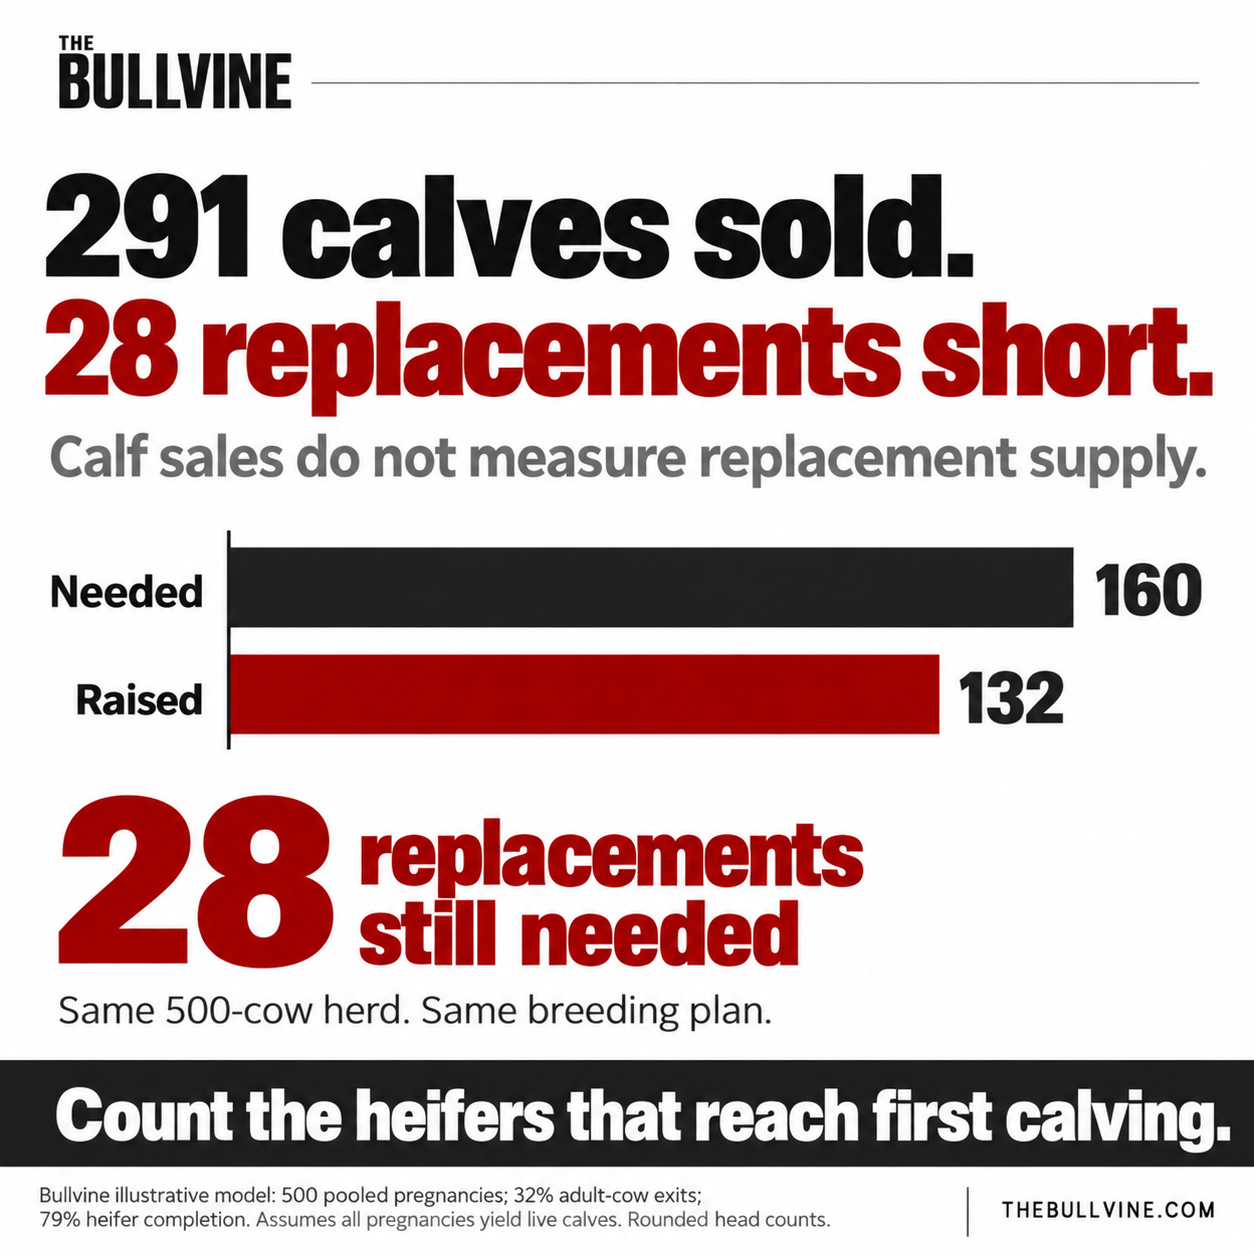
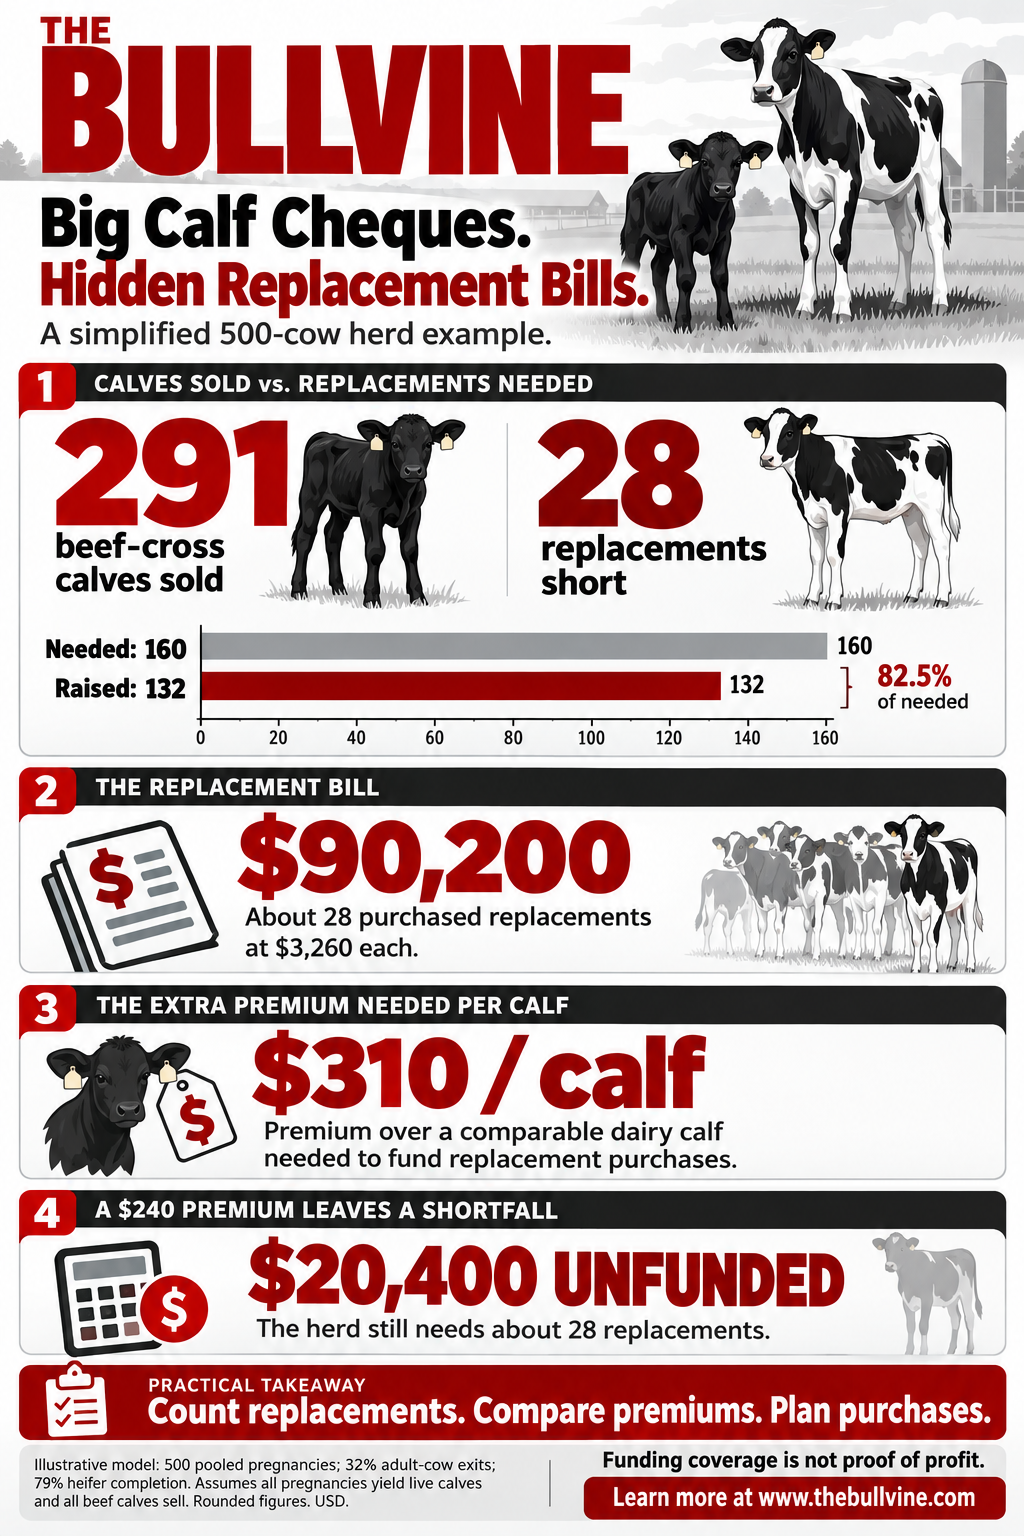
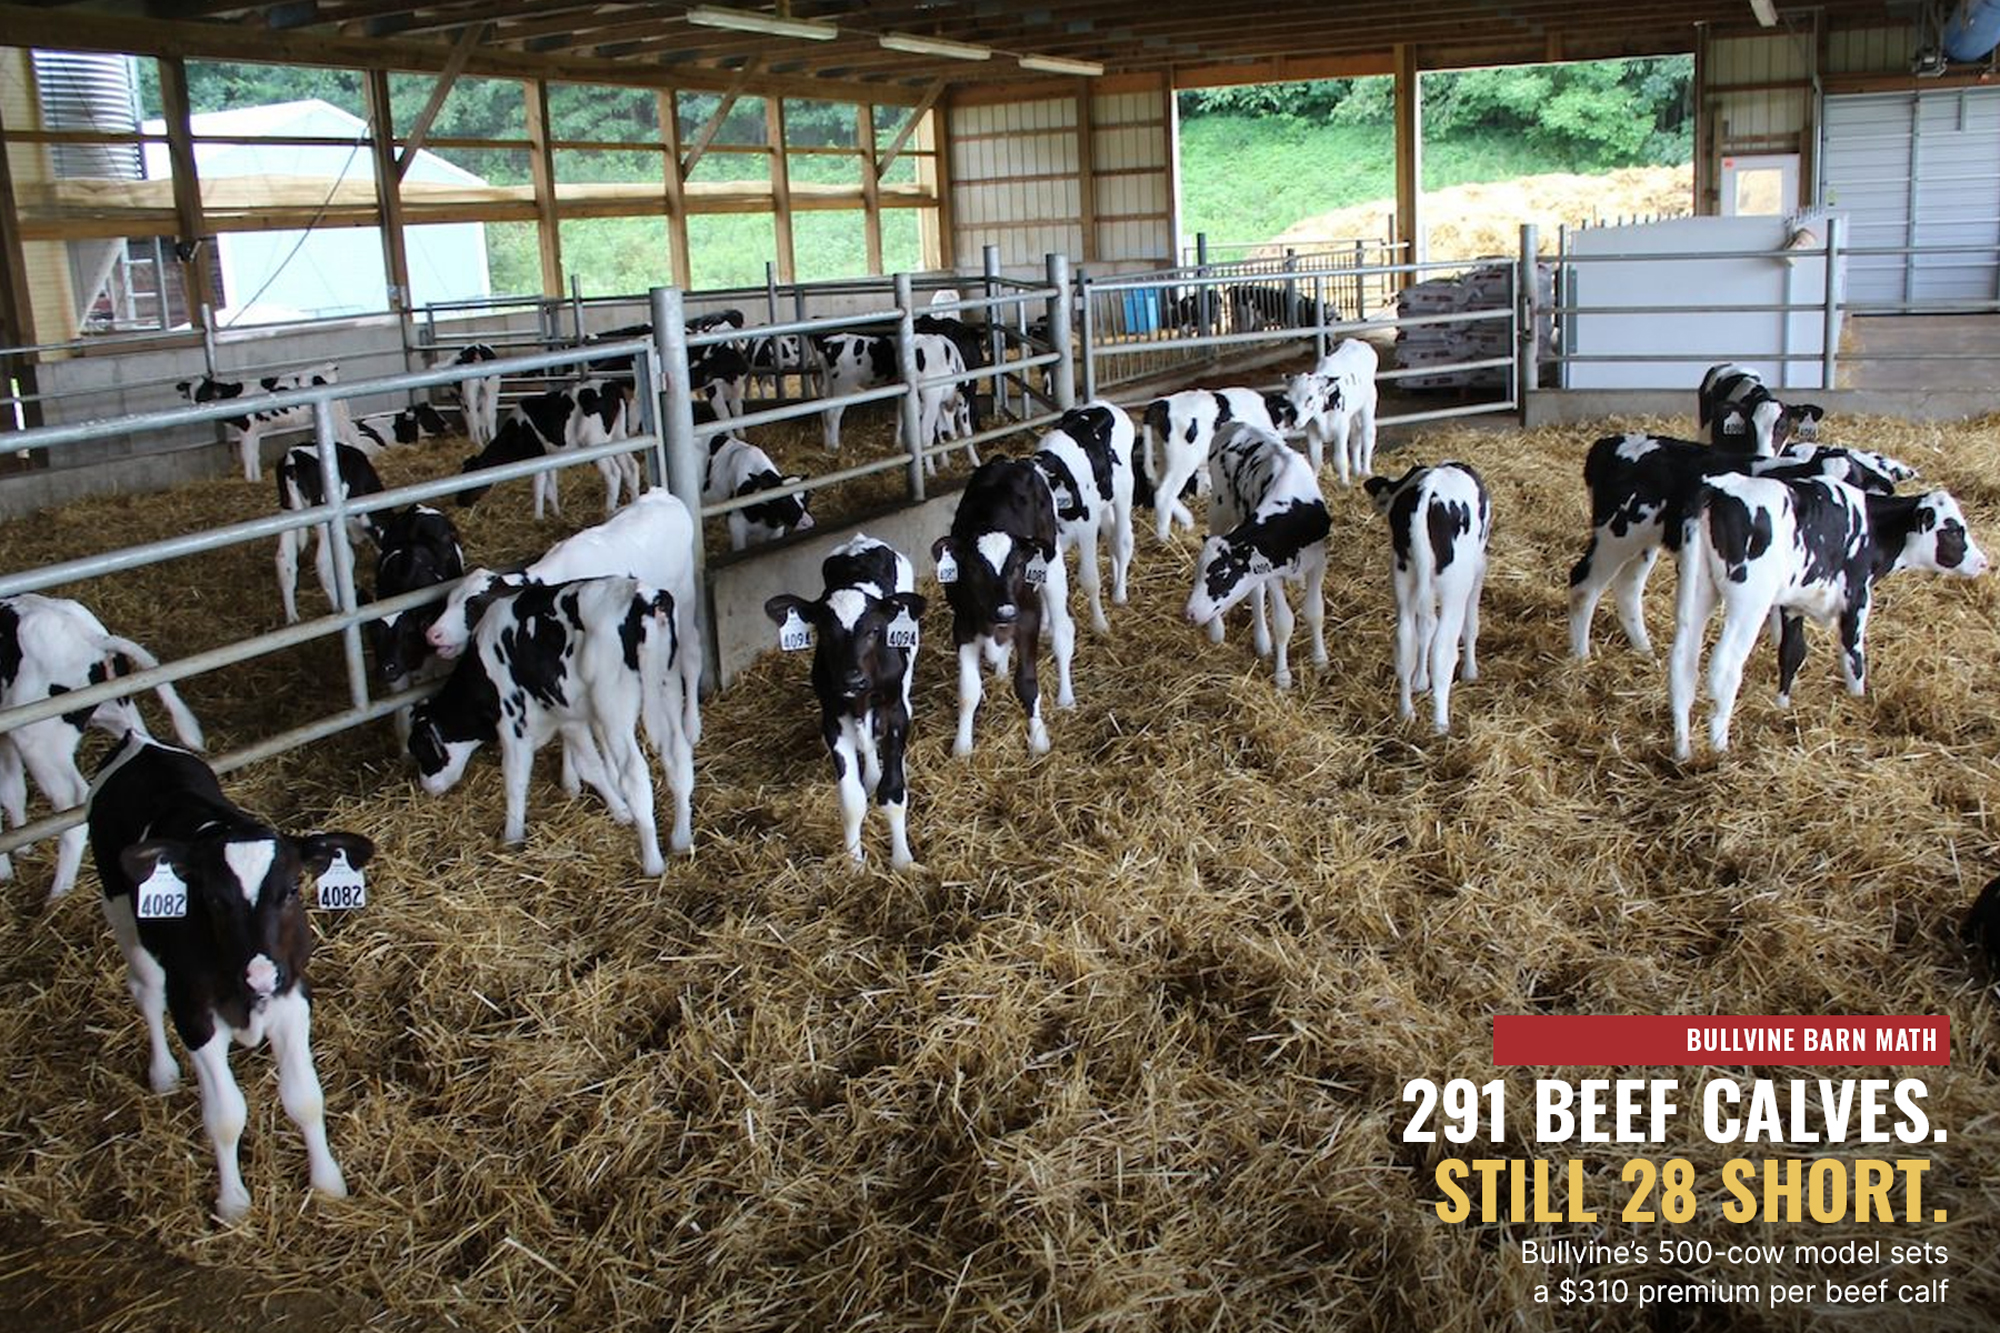
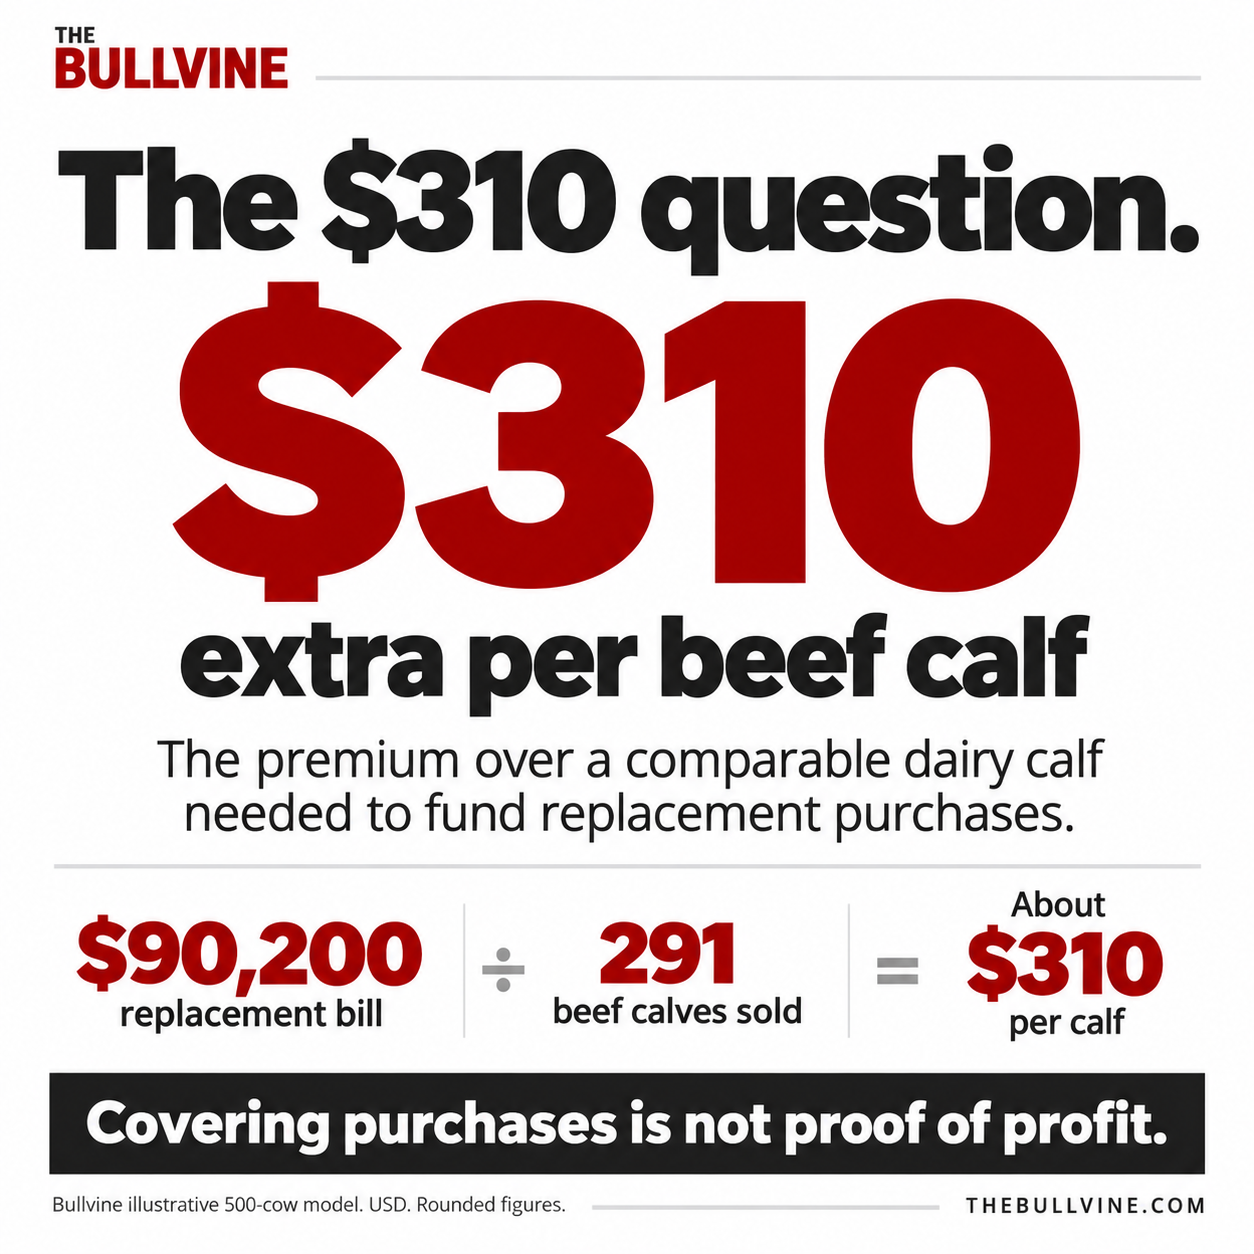
Put 55% of services into beef semen on a 500-cow dairy and Bullvine’s model produces roughly 291 beef-cross calves to sell. It also leaves the herd about 28 replacements short. At USDA’s July 2026 replacement price of $3,260, buying those animals costs about $90,200. To cover that bill, each calf sold has to bring about $310 more than a comparable dairy calf. 

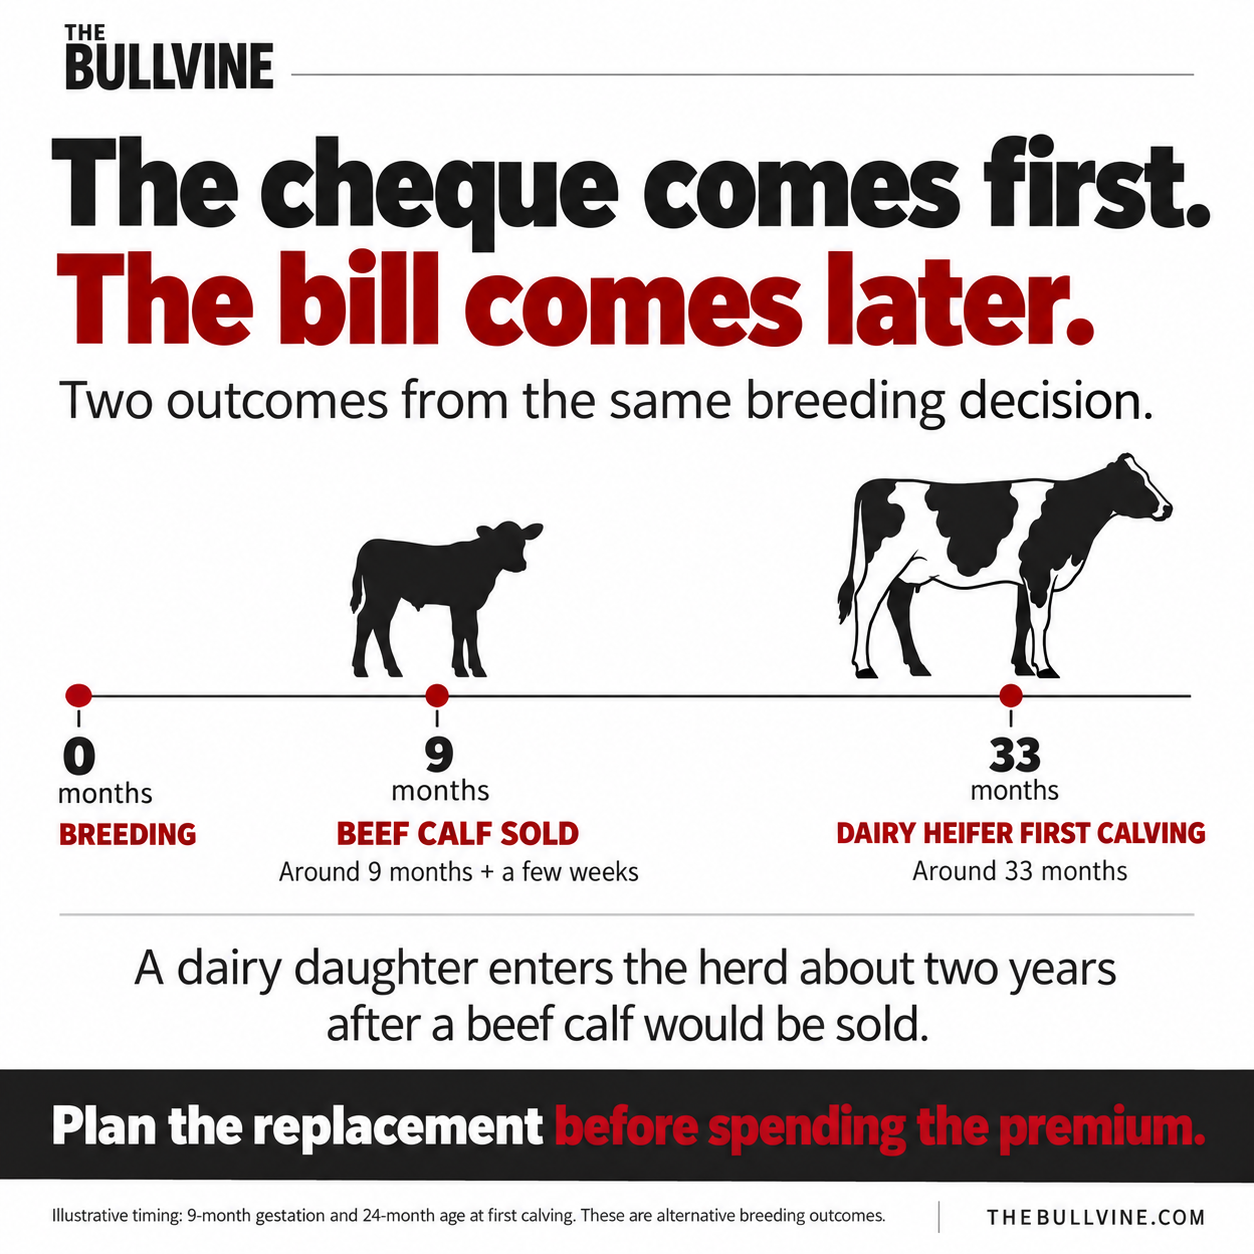
The calf cheque arrives first

The useful question isn’t whether beef calves bring in money. They do, and fast. The question is what that money has to cover, because the calf cheque and the replacement bill from the same breeding rarely land in the same year’s books.

A beef-cross calf goes to market weeks after a birth that came about nine months after breeding. The dairy heifer that breeding could have produced wouldn’t reach the milking string for roughly another two years, at a 24-month age at first calving. The semen mix creates the gap. Time hides it.

The national cushion is thin

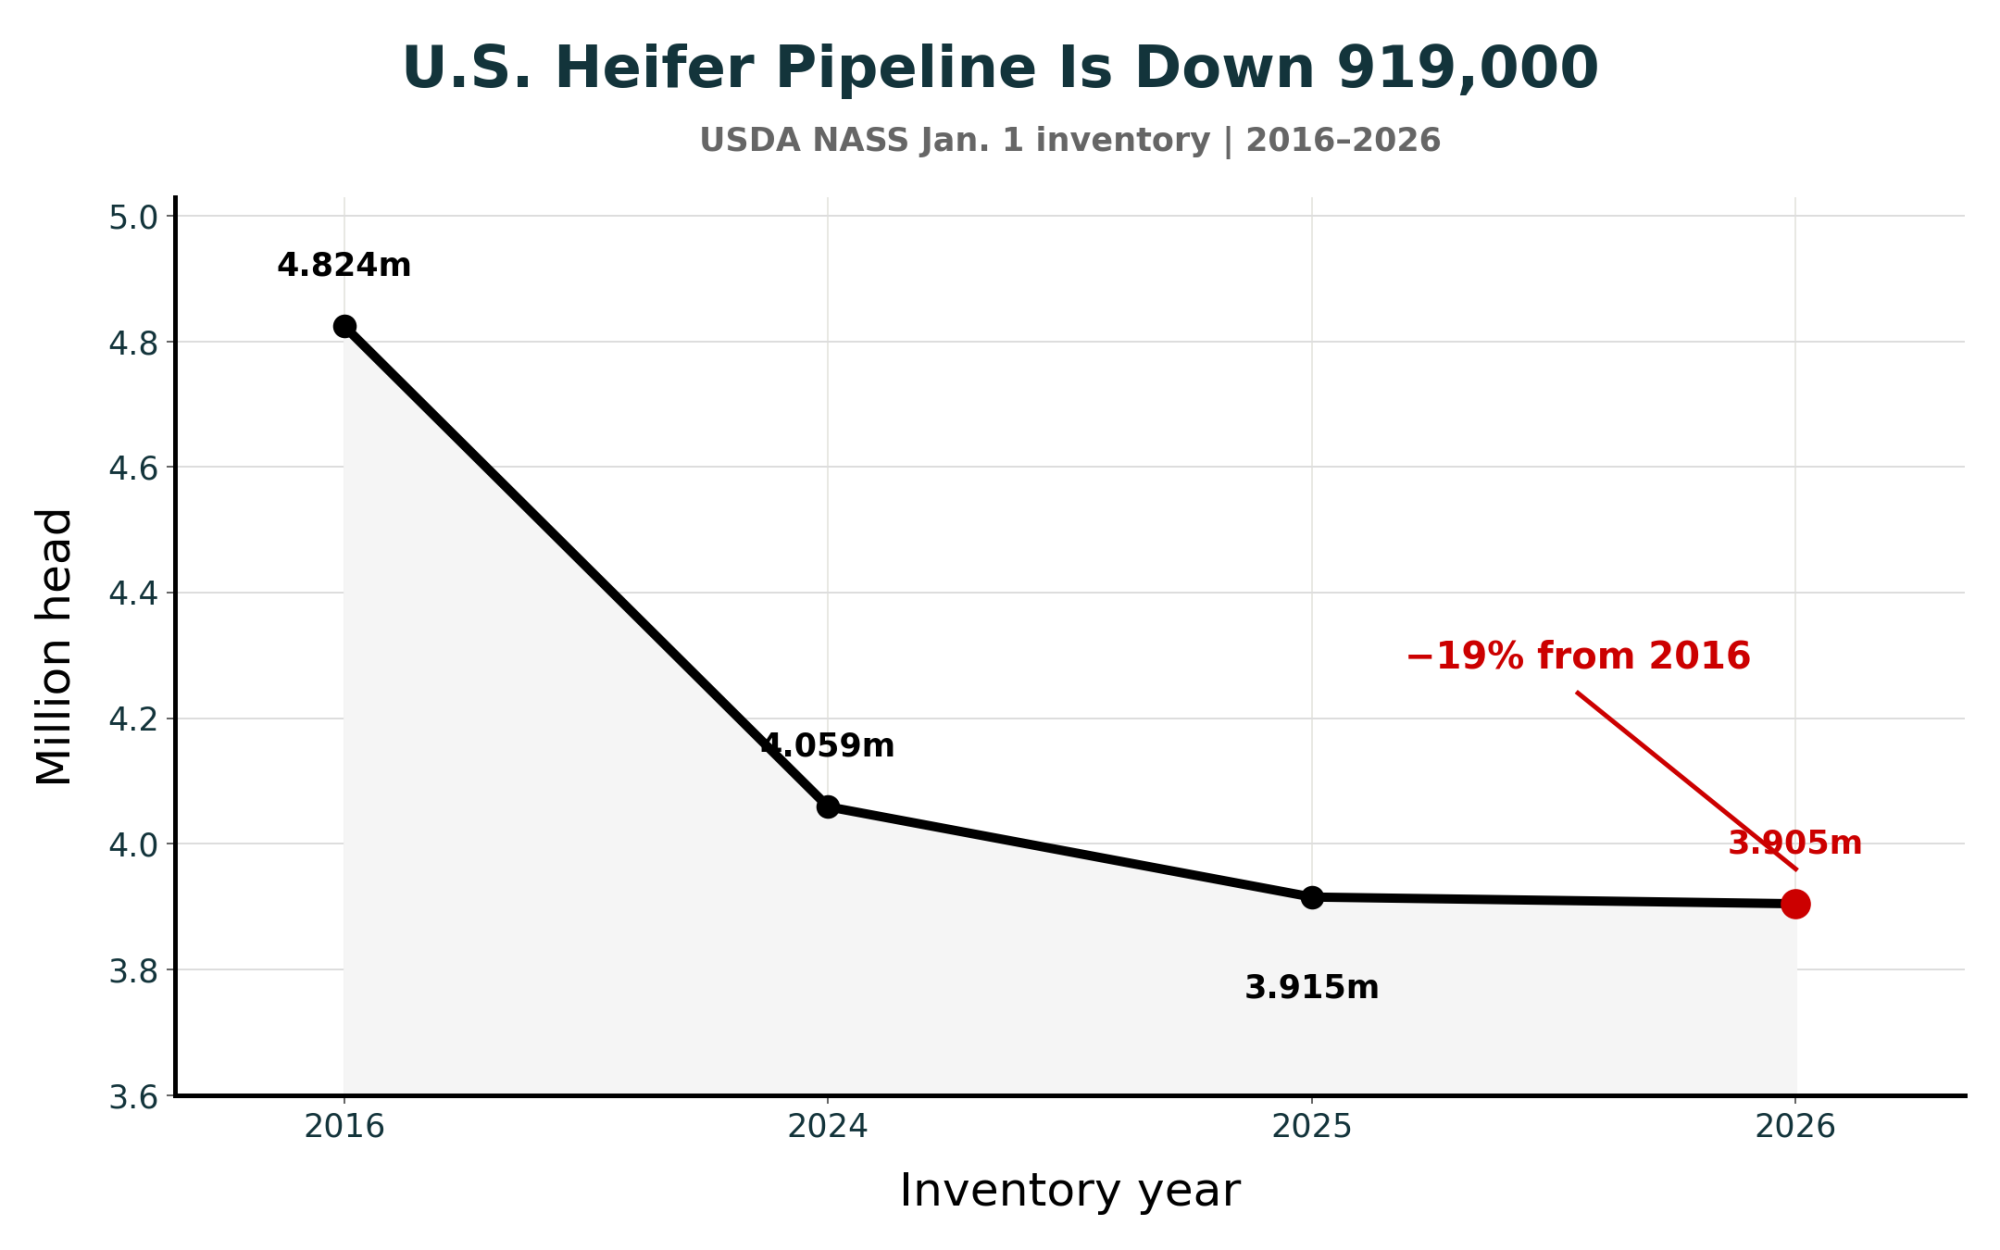
USDA NASS counted 3.9046 million heifers of 500 pounds and over kept for milk-cow replacement on January 1, 2026. A year earlier, the revised count was 3.9153 million. That’s about 919,000 fewer than the 4.824 million counted in January 2016. USDA’s July 2026 estimate rose to 3.6 million from 3.5 million. That’s a better midyear number, but it doesn’t refill the pipeline. 

CoBank projected 357,490 fewer completed replacements in 2025 and another 438,844 fewer in 2026. It then projected a 285,387-head improvement in 2027, driven by 425,454 more heifers from sexed semen and partly offset by 140,067 fewer from conventional dairy semen. NAAB reported 10.6 million sexed dairy units, 8.1 million beef-on-dairy units and 6.0 million conventional dairy units sold domestically in 2025. For any one herd, the national picture comes down to two things: what replacements cost and whether they’re available when it has to buy. 

The example’s boundaries

This is a simplified 500-cow herd in steady state. The 500 cows are adult animals, milking and dry. The herd needs 500 pregnancies a year, pooled across cows and maiden heifers under one assumed split of services. The math compares illustrative annual flows. It doesn’t track the herd’s age structure or the heifers already in the pipeline.

BULLVINE MATH: inputs

InputCentral assumption
Annual cull and death rate32%
Share of services: sexed dairy35%
Share of services: conventional dairy10%
Share of services: beef55%
Conception: sexed / conventional / beef36% / 40% / 42%
Female rate: sexed / conventional90% / 49%
Live dairy heifer to first calving79%
Replacement price$3,260 (USDA NASS, July 2026) 

The 79% completion rate comes from Mike Overton of Zoetis. It’s the median across 85 commercial U.S. herds, drawn from Zoetis internal data. Most herds landed between 74% and 84%, and herds raising heifers for other operations were left out. Overton presented the figures as descriptive data, not targets. CoBank used 79% in its forecast too. The conception rates and the conventional female rate are Bullvine assumptions. 

What the model produces

The model treats every pregnancy as a live calf and every beef-cross calf as sold. That’s optimistic at both stages, so the counts below lean high. Overton’s data puts stillbirths at about 2–4% depending on lactation, which this model ignores. 

BULLVINE MATH: 500 cowsExpected number
Services needed (weighted conception 39.7%)1,259
Sexed dairy pregnancies159
Conventional dairy pregnancies50
Beef-cross calves marketed291
Live dairy heifer calves168
Completed replacements132
Replacements needed (32% of 500)160
Physical shortage28

The same assumptions scale in a straight line: 17 short with 175 beef calves at 300 cows, and 55 short with 582 calves at 1,000 cows.

What the calf has to earn

The Funding Threshold

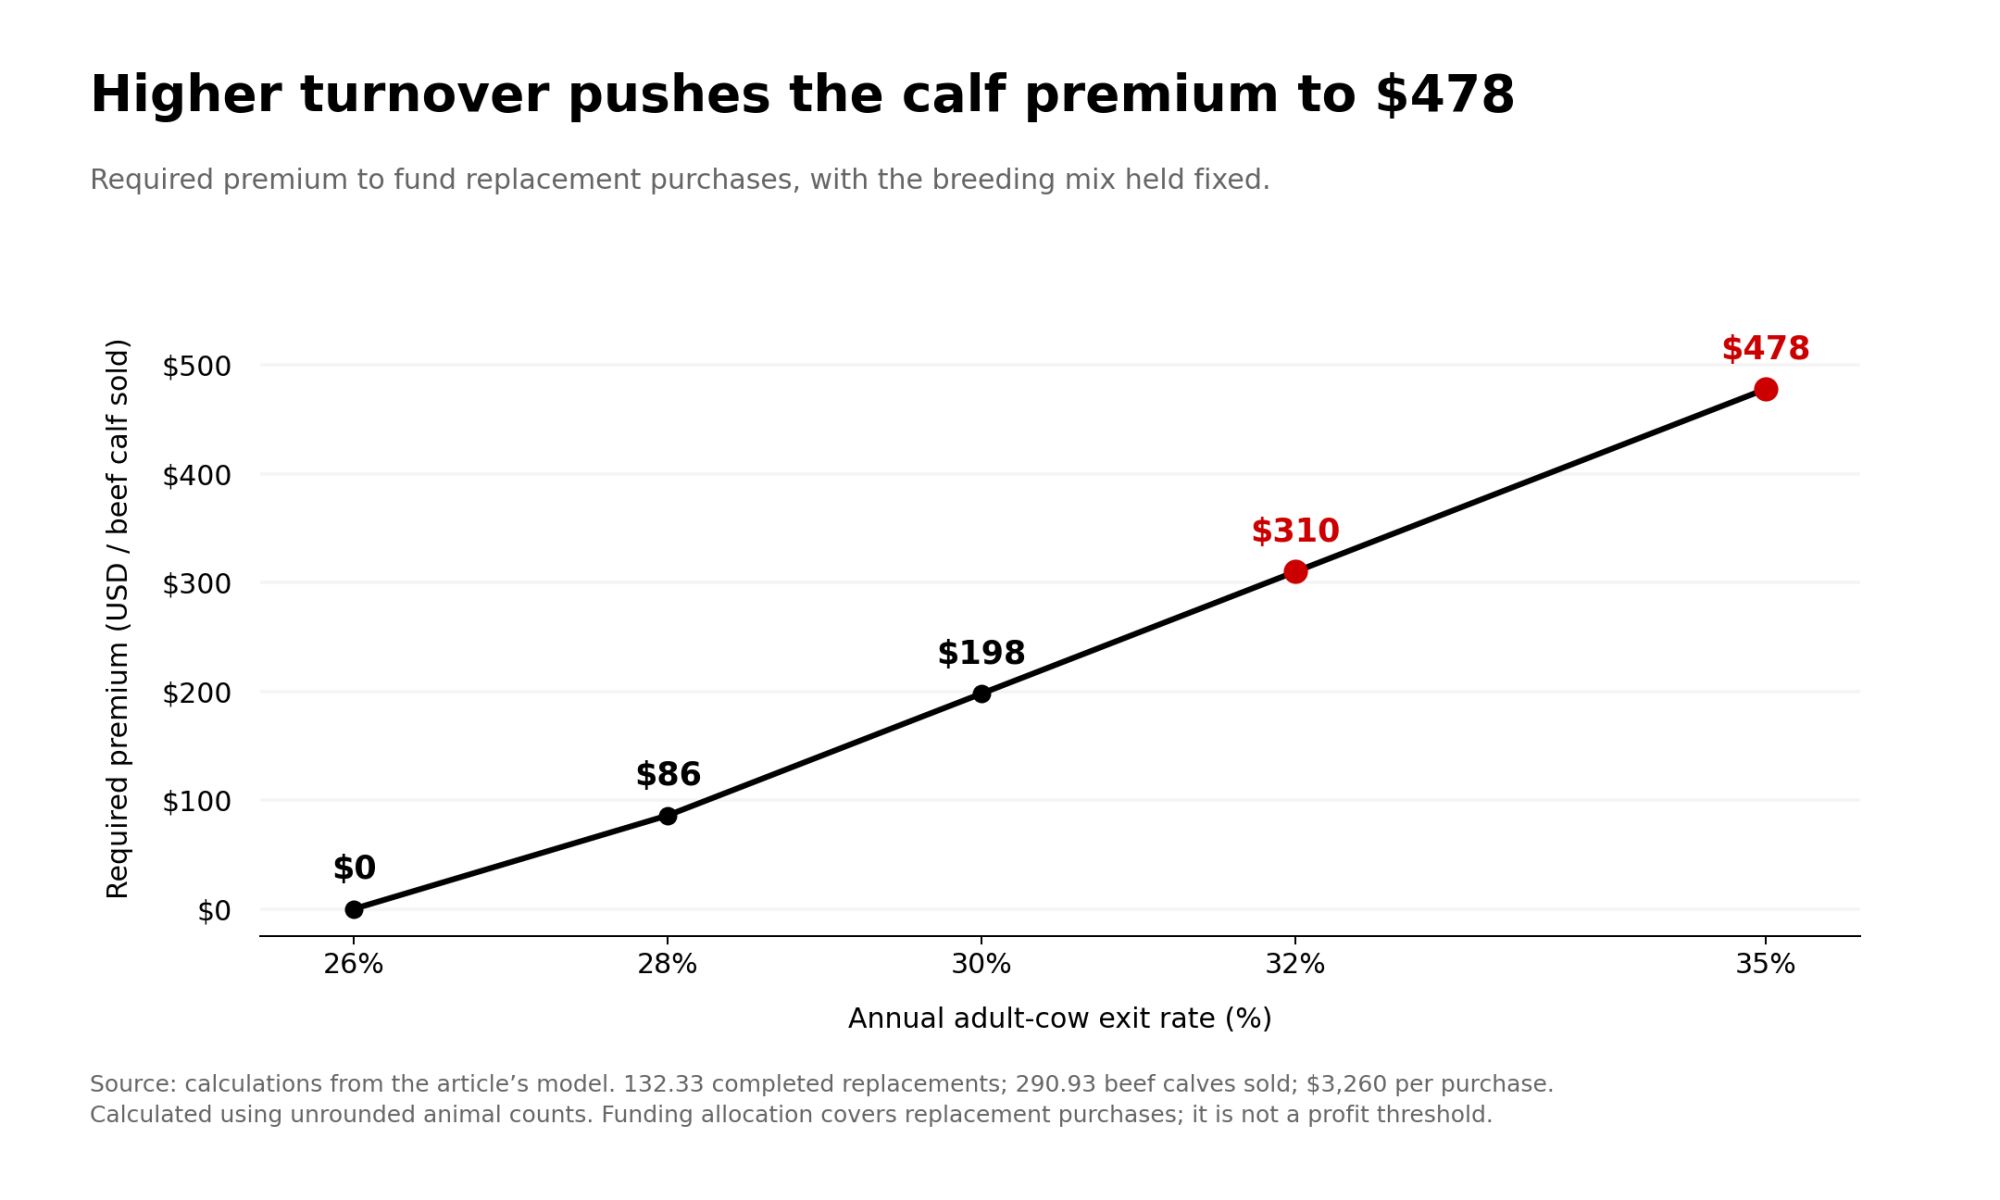
At USDA’s July 2026 price of $3,260 a head, buying the 27.7-head replacement gap (about 28 animals) costs about $90,200. Spread across 291 marketed beef calves, each calf has to bring about $310 more than a comparable dairy calf just to cover those replacement purchases.

Allocation per calf = replacement purchase requirement ÷ beef-cross calves marketed

($90,200 ÷ 291 calves ≈ $310 per calf)

Bullvine Math. Clearing $310 means calf revenue covers the replacements bought. It doesn’t prove the beef program earns more than raising those heifers would.

The $310 is a premium over a comparable dairy calf, not a gross sale price. A herd that tracks only the beef-cross cheque can’t tell whether it cleared the bar.

Turnover can erase the replacement cushion

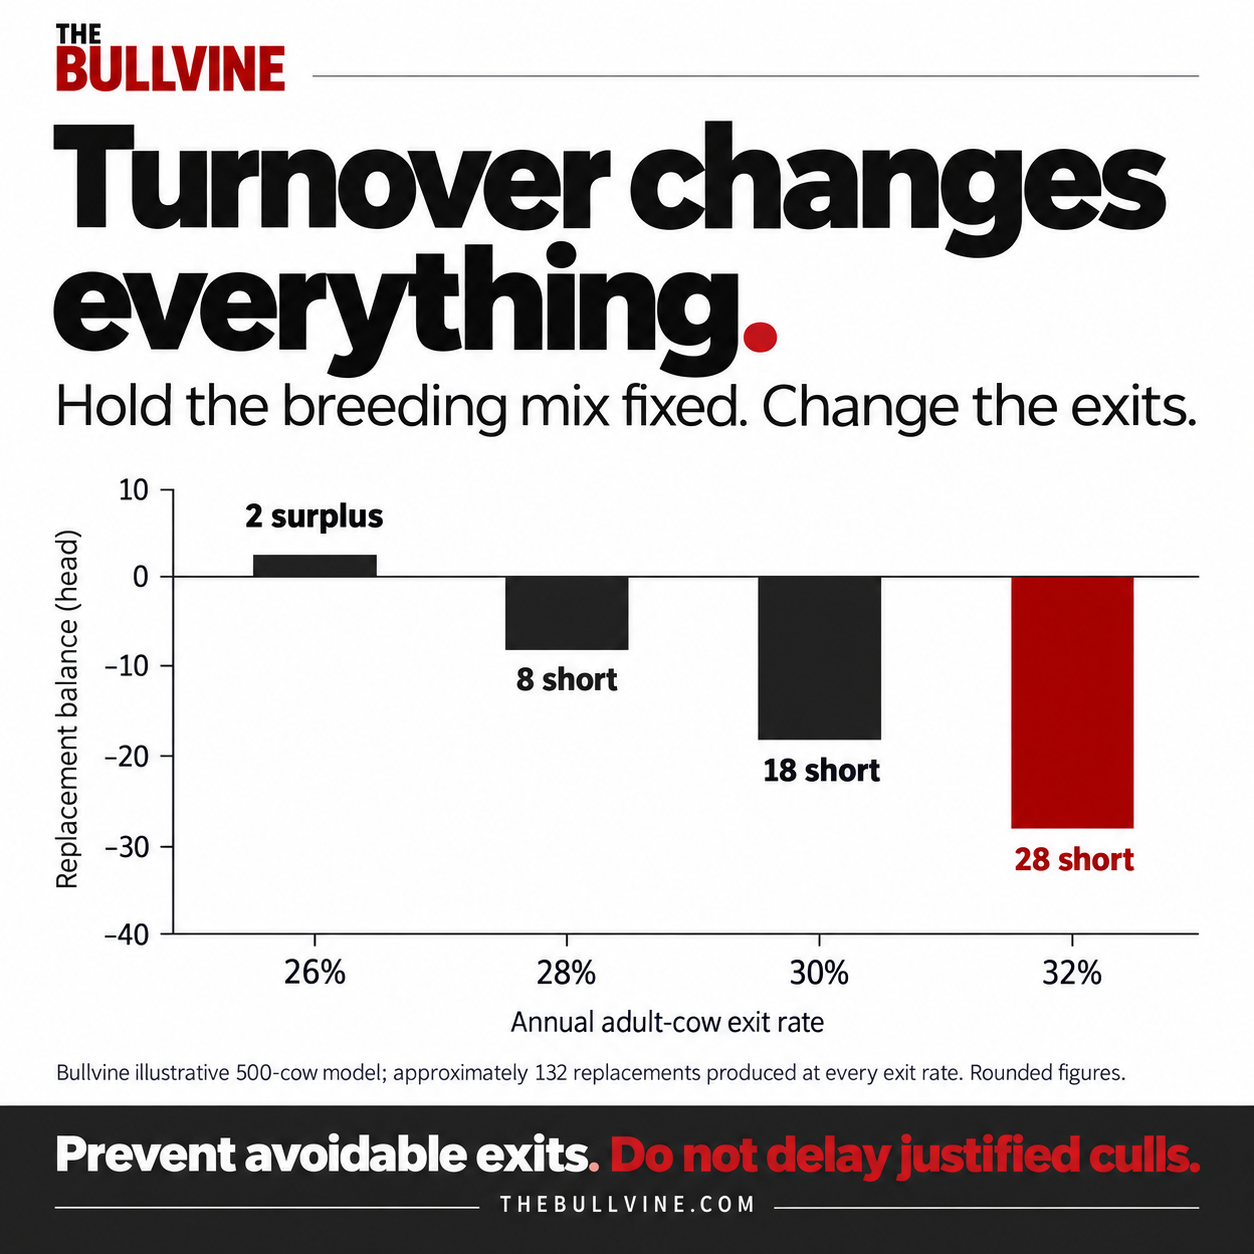
Hold the service mix fixed and change only turnover. On a 500-cow dairy, every percentage point means five more replacements.

Cull and death rateNeededProducedGapAllocation per calf at $3,260
26%1301322 surplusNone
28%1401328About $86
30%15013218About $198
32%16013228About $310
35%17513243About $479

A breeding plan that works at 26% turnover fails at 32% without changing a single straw. Here’s each lever tested on its own, with everything else held at the central case:

BULLVINE MATH: separate scenariosLowCentralHigh
Cull and death rate (26% / 32% / 35%)2 surplus28 short43 short
Completion (90% / 79% / 70%)9 short28 short43 short
Beef share, replacing conventional (45% / 55% / 65%)7 short28 short48 short

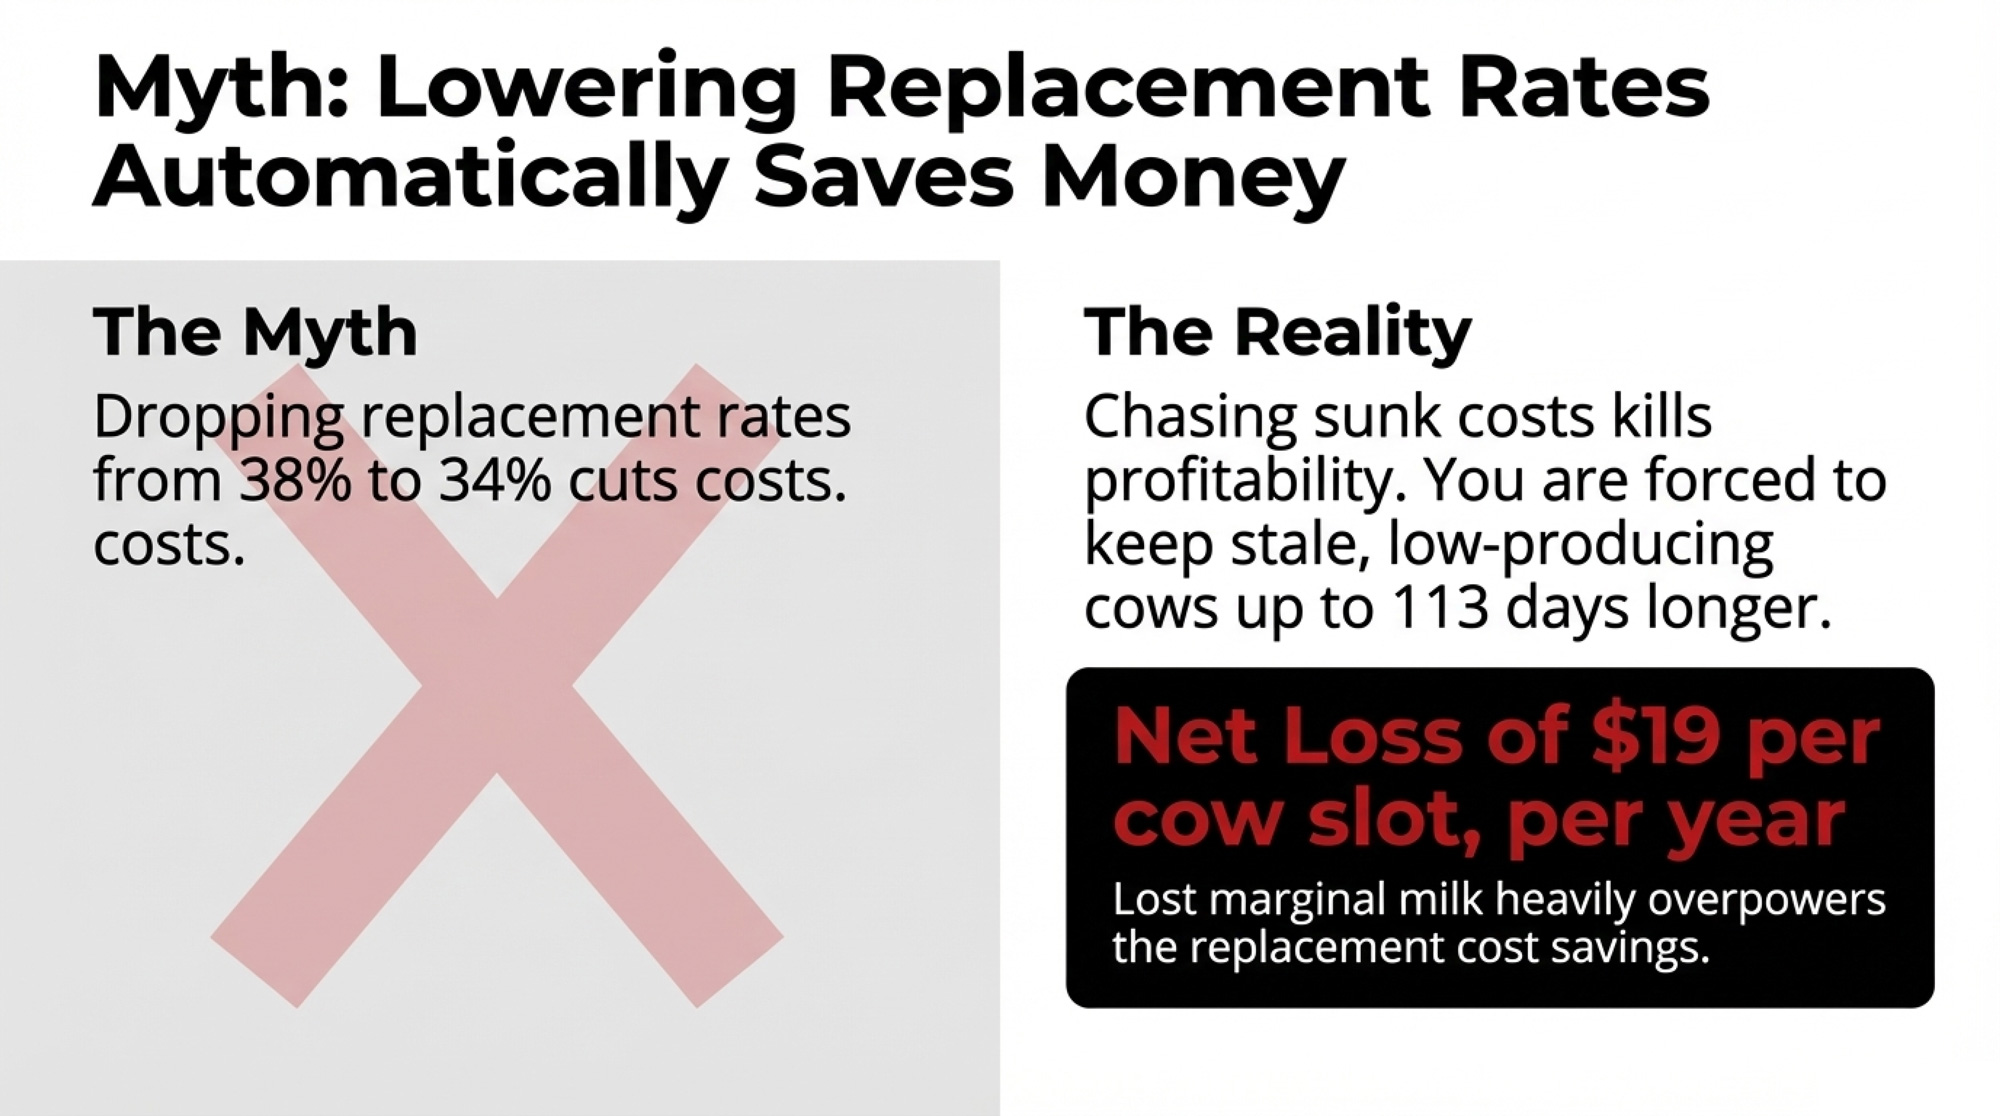
Preventing an exit isn’t the same as delaying a justified cull. Overton modelled a herd that cut its replacement rate from 38% to 34% by running short of heifers, with no management improvements. Its worst cows stayed about 113 days longer. The lost milk cost about $62 per cow slot a year against $43 saved on replacements, a net loss of about $19 per slot. 

CoBank counted 611,600 fewer dairy cows sent to slaughter from Labor Day 2023 through July 2025 than in comparable earlier periods. It also warned that an older herd brings more fresh-cow disease, metabolic trouble and fertility costs. Cut avoidable exits like deaths, early-lactation losses and preventable disease. Don’t stop culling. 

Four ways to close the $20,400 funding gap

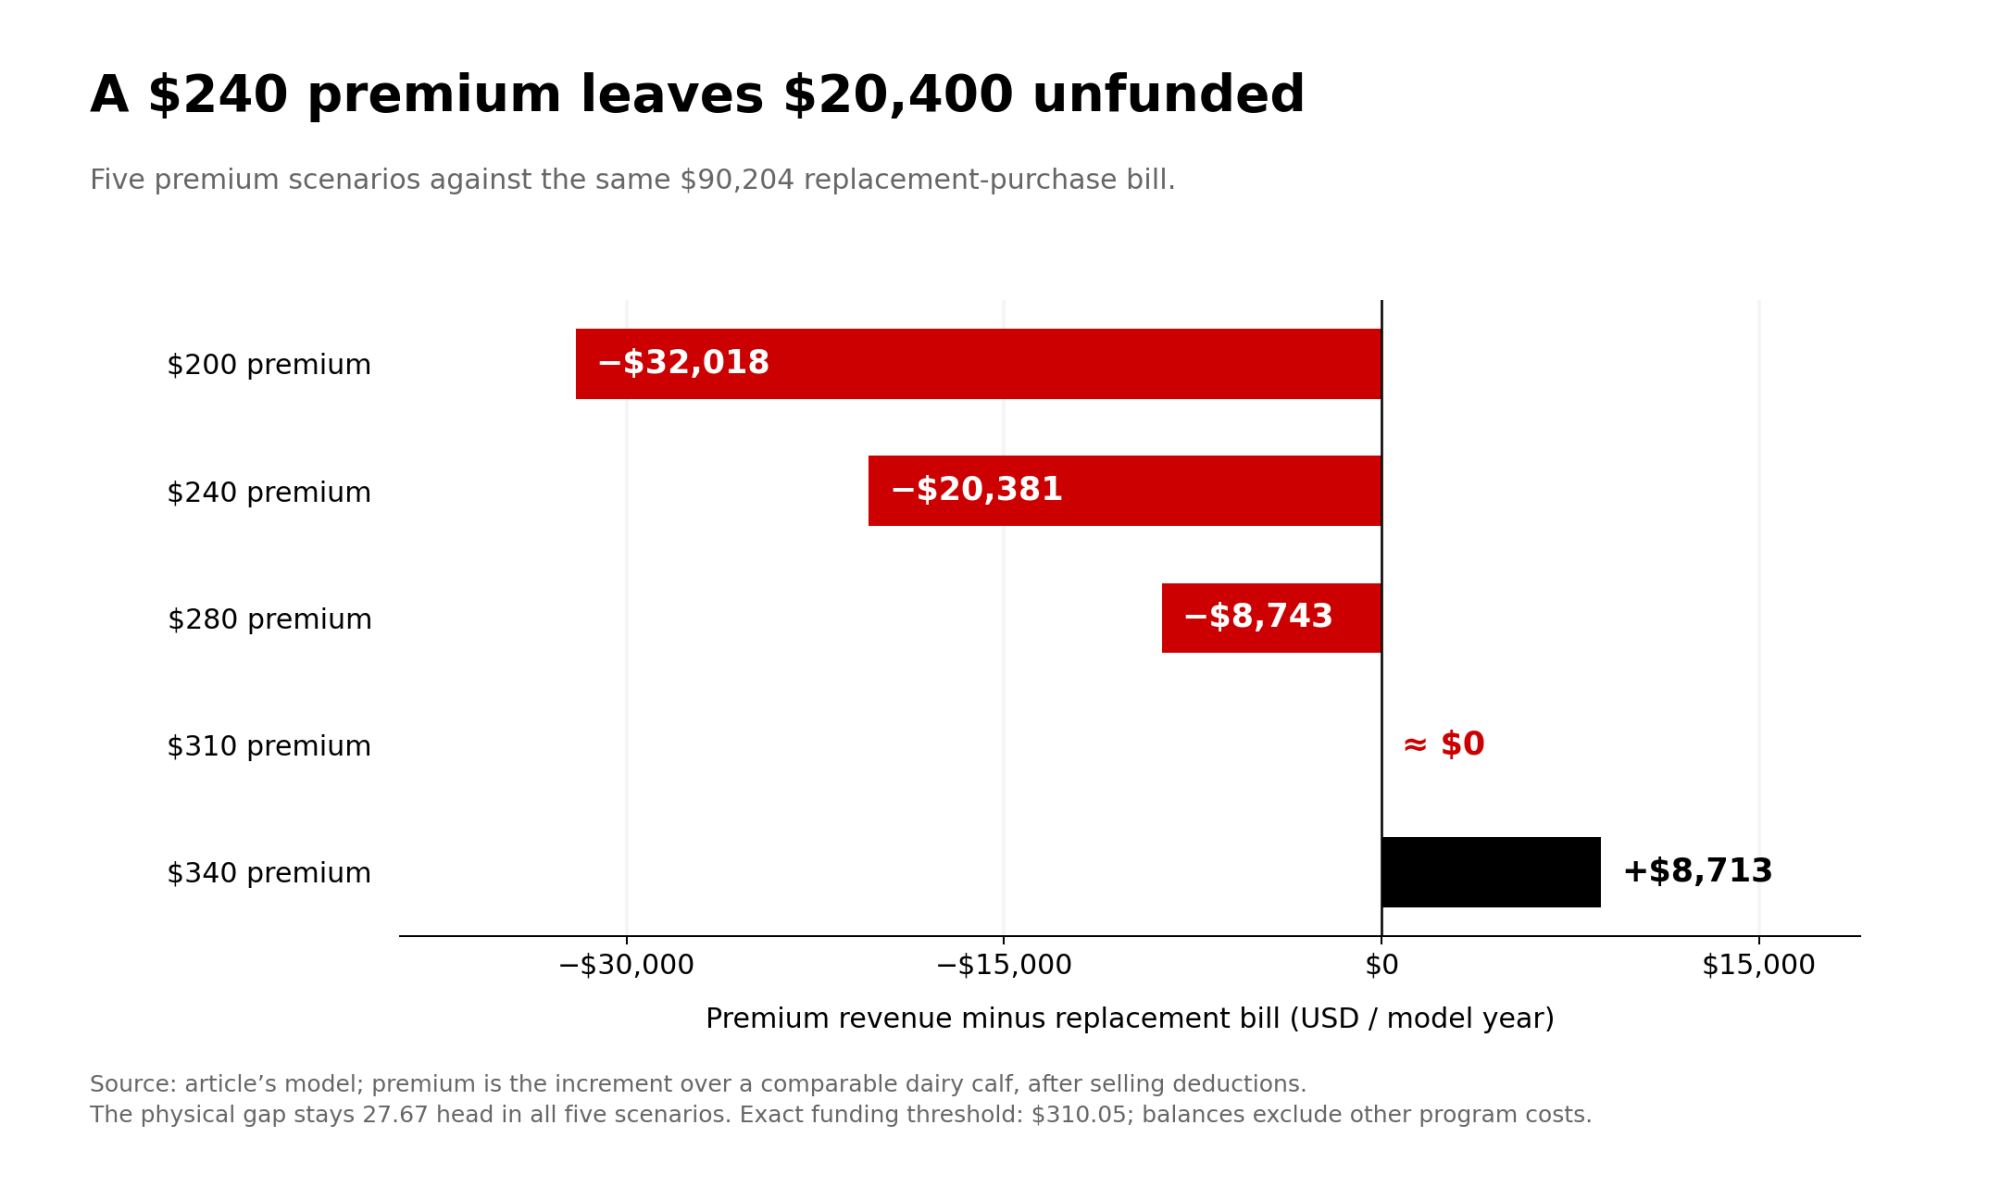
Suppose the herd’s realized premium comes in at $240. Across 291 calves, that brings in about $69,800 against the $90,200 bill.

That leaves about $20,400 uncovered. At USDA’s July 2026 price of $3,260, that’s the funding equivalent of about 6.3 replacements. The physical shortage hasn’t shrunk. The herd still has to find about 28 animals it didn’t raise. The $240 premium pays for roughly 21 of them, and the cash for the other six or so has to come from somewhere else. 

  • Negotiate the Premium: Raise the average premium over a comparable dairy calf by about $70, from $240 to $310.
  • Plug the Leaks (Exits): Cut about six to seven exits, or roughly 1.25 percentage points of turnover. Six fewer exits save $19,560, which leaves about $800 uncovered.
  • Optimize Completion: Raise live-heifer-to-first-calving completion from 79% to roughly 83%. That’s about six or seven more completed heifers from the same cohort. Count only gains from fewer deaths and failed pregnancies. Overton warns that a higher completion rate can just mean a herd is keeping poor-quality heifers. 
  • Adjust the Semen Mix: Moving ten beef pregnancies to sexed dairy takes roughly four extra services and adds about seven completed replacements. It also costs ten beef calves.

All four are Bullvine Math, based on the 500-cow central model.

The levers run on different clocks. A semen change can’t put a springer in the pen next spring. That shortage gets handled with cows already in the barn, heifers already on the ground and planned purchases.

Plan backward from first calvings, with a cushion

Start with the exits you forecast, then add a cushion. Overton’s method starts with the herd’s average replacement need, then adds one standard deviation of its 10-year replacement rate and a cushion for needs nobody saw coming. In his 1,000-cow example, that turned 370 heifers into a target of 420 that calve. 

BULLVINE MATH, using Overton’s method: For the 500-cow herd, start with 160. Add 10 for year-to-year swings, which uses his example’s 2% standard deviation as an assumption. Add a 3% cushion of 15. The target becomes 185 heifers that calve. Against 132 produced, the planning gap is about 53, not 28. The headline keeps 28 because it’s the conservative figure. The 53 is the planning number.

Next, divide by your own completion rate. At 79%, 185 heifers that calve takes about 234 live dairy heifer calves. Work each cow or heifer group and semen type separately. For each group, multiply services by conception rate, live-birth rate, female rate and completion rate. Then add the groups’ expected replacements and check the total against the target. Don’t divide the whole requirement by each semen type’s female rate, because that counts the same heifers twice. Overton’s own advice is to use enough sexed semen to make a 3–5% heifer surplus. 

The records that answer it

You can’t calculate this from the semen invoice. You need the cull report, the heifer report, the replacement invoices and the calf settlements on the same desk. The herd software knows the biology, and the bookkeeper knows the money. The test works when those two files meet.

RecordMinimum neededWhat breaks the test
Cow inventoryMonthly counts for 12 monthsOnly a year-end count in a changing herd
ExitsDate and destination for every cow: dairy sale, slaughter, death Deaths or dairy sales left out
Breeding cohortService date and semen typeBeef and dairy services can’t be separated
Heifer pipelineLive birth ID linked to first-calving dateBirths can’t be tied to first calvings
Beef-calf settlementsHead count and net proceedsPregnancies counted in place of calves sold
Dairy-calf comparatorSame-week net value, farm or market reportGross beef price treated as the premium
Replacement invoicesHead, price, freight and dateNo invoice and no written quote
ExpansionOpening and closing cow inventoryGrowth animals counted as turnover

Turnover should be exits divided by average cow inventory or cow-years at risk. Heifer records split across paper, spreadsheets and software are a common weak point. Overton suggests using a two- or three-year window to set historical heifer needs, not a single year. You can work around a missing calf weight. You can’t work around a missing denominator. 

Covering the bill isn’t the same as winning

Clearing $310 shows the calf money pays for the replacements bought. It doesn’t show the beef program earns more than raising those heifers would. A full comparison counts the future rearing costs avoided by not raising a heifer, plus semen cost, freight, financing and the health risk of bought animals. Money already spent on heifers on the ground isn’t a saving.

Overton ran that fuller comparison for the last 100 pregnancies in a 2,500-cow herd that had room to raise extra heifers. His assumptions were a $1,300 beef-cross calf, a $3,200 springer and a $1,700 marginal raising cost. On calf value at birth, beef looked about $50,000 better. Once he counted the springers that would have to be bought later, sexed semen came out ahead. Those are his model inputs, not market prices. They do show the calf cheque alone can point the wrong way. 

What this means for your operation

  • Pull four records for one closed cohort before the next semen order: exits, live heifers to first calving, net calf settlements and replacement invoices.
  • Figure your own allocation per calf. Divide what you’ll spend buying replacements by the beef-cross calves you sold, then compare it with your net premium over a comparable dairy calf.
  • Test turnover at 28%, 32% and 35%. In this model, the allocation runs from about $86 to $310 to $479 per calf.
  • Plan to a target with a cushion, not to last year’s exits. In this model, adding a cushion moves the 500-cow target from 160 to 185.
  • Turn any premium miss into head, not percentages. A $70 miss on a 500-cow herd is about 6.3 replacements’ worth of funding inside a 28-animal shortage.
  • Recheck replacement prices on October 30 and November 30, 2026, when NASS’s next Agricultural Pricesreports are due. 

If home-raised heifers won’t cover the need, start by deciding how many replacements you’ll buy on purpose, at a price and from a supplier you trust. Set the home-raised target from what’s left, work out the dairy pregnancies that target needs, and give beef the rest.

Run Your Numbers

Bullvine Pipeline Index Calculator: Plug in your herd size, heifers on hand, cull rate, sexed and beef breeding shares, and today’s replacement price. The calculator scores your replacement pipeline 0–100 and flags whether your beef program is drawing it down faster than it refills.

Complete references and supporting documentation are available upon request by contacting the editorial team at editor@thebullvine.com.

Learn More

  • New Holland’s Beef-Cross Calves Topped UW–Madison’s $1,125 Test—at a $260 Premium — Tracks real-world sale barn data validating recent economic benchmarks. Breaks down why specific beef sire lines pull strong margins over Holstein controls while others flatline. Target the genetic traits that feedlots actually reward.
  • 5-Year Historical Tracking Analysis of Elite Genomic Holstein Bulls — Benchmarks bovine genetic investments directly against alternative asset classes and U.S. dairy returns. Quantifies the long-term equity sacrificed when prioritizing immediate crossbred cash flow over building elite, highly efficient herd genetics for the future.
  • The Consistency Advantage — Dismantles the assumption that peak milk alone dictates herd profitability. Follows the money on uniform lactation curves and reduced metabolic culling, proving how steadily producing cows systematically lower your replacement demand and slash overhead.

The Sunday Read Dairy Professionals Don’t Skip.

Every week, thousands of producers, breeders, and industry insiders open Bullvine Weekly for genetics insights, market shifts, and profit strategies they won’t find anywhere else. One email. Five minutes. Smarter decisions all week.
NewsSubscribe
First
Last
Consent

Overton’s 85-Herd Beef-on-Dairy Study: Why a 79% Heifer Completion Rate Limits Beef to About One-Third of Your Pregnancies

Overton’s 85-herd study found a 79% heifer completion rate. That math says most herds can only afford about one-third of pregnancies as beef-on-dairy.

Executive Summary: Beef-on-dairy has been a bright spot on many milk cheques, but new numbers show plenty of herds are quietly overbreeding to beef and starving their future heifer supply. In an 85-herd dataset presented at the 2026 High Plains Dairy Conference, Mike Overton found an average 79% heifer completion rate from liveborn heifer calf to first calving, not the 90% many breeding plans assume. Layer that on top of CoBank’s forecast that U.S. dairy heifer inventories will shrink by roughly 800,000 head before rebounding in 2027, and the room for error on replacement planning almost disappears. For a typical 500-cow herd using sexed and conventional semen, realistic math often limits beef-on-dairy to about one-third of pregnancies if the goal is to avoid buying springers back at record prices instead of producing them at home. This article walks you through that “Overton reality check” step by step, then shows how to audit breeding cards for parlor drift, tighten tier-based breeding rules, and reverse-engineer your beef sire lineup from your buyer’s cheque using tools like $AxH and HOLSim. It finishes with a 30-day beef-audit checklist and annual replacement-pipeline review so you can keep beef-on-dairy as a profit center without blowing a hole in your 2028 milking string.

Heifer Completion Rate

The breeding cards were supposed to confirm the plan.

A herd manager spread a week’s worth of cards across the office table, grabbed a red marker, and circled every beef mating. It didn’t take long before everyone in the room could see it: beef semen on cows that weren’t truly bottom‑third genetics, chronic mastitis cows bred again instead of marked DNB, and a lot more red circles than the “about 25% beef” the farm thought it was running.

That gap between the breeding plan in your head and the breeding cards in your hand is exactly where this story sits. In 2025–26, with heifer numbers tight and beef‑on‑dairy still hot, getting that gap wrong isn’t a rounding error — it’s a replacement pipeline problem waiting to surface right when you least want to be buying springers.

The 21% Leak: Why Your Heifer Pipeline Is Thirstier Than You Think

Veterinarian and dairy economist Mike Overton went looking for hard numbers on replacement risk when he analyzed data from 85 commercial U.S. herds and presented it at the High Plains Dairy Conference in Amarillo, Texas, on March 3–4, 2026.

Across those herds, the average heifer completion rate from liveborn heifer calf to first calving was about 79%, with most herds landing between 74 and 84%. Just over one in five heifer calves never make it into the milking string. Some are lost at, or shortly after birth, some in the calf and grow‑out phases, some to disease or injury, and some are culled before they ever freshen.

Overton’s point to the HPDC crowd was blunt: a lot of operations are still planning their replacement needs as if nearly every heifer calf eventually freshens. His datasets say those assumptions are quietly loading risk into every decision about sexed semen usage, beef‑on‑dairy percentage, and whether a herd will be forced to compete in a record‑high springer market a couple of years down the road.

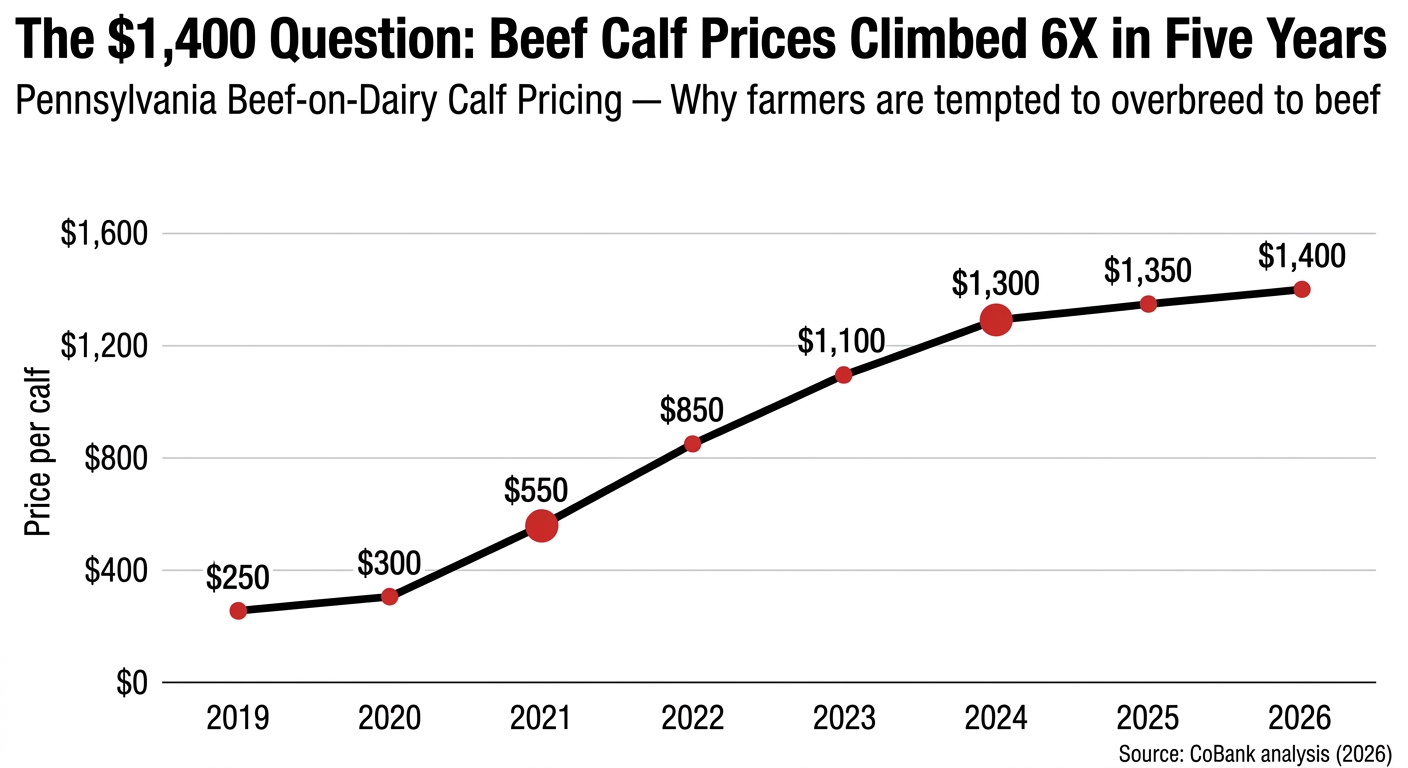
The national backdrop doesn’t leave much margin for error. USDA’s January 1, 2025, cattle estimates put dairy heifers 500 pounds and over at 3.914 million head, the lowest count in that category since 1978. CoBank’s August 2025 Knowledge Exchange report projected dairy heifer inventories would shrink by roughly 800,000 head over the following two years before beginning to rebound in 2027, with heifer prices already at record highs and potentially moving well beyond ,000 per head in some markets as supply tightens. When $3,000‑plus springers are the new normal, pretending your herd runs at 90% heifer completion when the real number is closer to 79% is an expensive fantasy.

Parlor Drift: Is Your 4:00 a.m. Tech Killing Your Genetic Progress?

On paper, the breeding strategy in a lot of progressive herds already sounds sharp.

The binder in the office usually says something like: the top genomic tier and key cow families get sexed dairy semen; the middle third get conventional dairy; the true bottom third get beef from carefully chosen Angus or SimAngus sires; and obvious problem cows are DNB. That’s the clean terminal‑program diagram you walk through with your vet, nutritionist, and semen rep.

The decision about which straw goes in which cow doesn’t happen on that whiteboard, though. It happens at 4 a.m. in the parlor.

If today’s list says “breed these 14 cows” without telling the tech who gets sexed, who gets conventional, who gets beef, and who shouldn’t be bred at all, the plan starts to leak:

  • A high‑genomic heifer that missed first service on sexed gets conventional “just this once” so she’s not open again.
  • A third‑lactation cow, the crew is sick of treating, gets beef because she was open again, not because she’s truly bottom‑tier genetically.
  • A lame, stale cow that should be hard DNB gets a straw anyway because she’s already in the headlocks and the tank is right there.
  • A cow flagged for beef on the list gets conventional dairy because the tech grabbed the wrong tank canister, and nobody caught it until reconciliation — if reconciliation happens at all.

None of those calls look crazy in isolation. Stack them up over 52 weeks, and it’s easy for a beef target in the mid‑20s to creep into the low‑ or mid‑30s without anyone ever sitting down and saying, “Let’s change the plan.” Until someone reconciles pregnancies by semen type against the replacement math, that drift stays invisible.

If you haven’t done it recently, a simple 20‑minute “beef audit” on your breeding cards is eye‑opening. Grab a recent week, highlight every beef mating, and cross‑check those cows against your genomic or index‑based tier list and DNB list. When more than a handful of beef straws are landing on cows that aren’t truly bottom‑tier, the day‑to‑day realities in the parlor are quietly pulling the program off the plan.

The 500-Cow “Overton Reality Check.”

Overton’s 79% completion figure isn’t just an interesting stat to quote at meetings. It’s the anchor for a simple backward pipeline calculation you can run on your own herd to find your real beef‑on‑dairy ceiling.

Here’s how a hypothetical 500‑cow herd looks when you put the math side by side with typical planning assumptions:

MetricYour Value (Est.)The “Overton” Reality Check
Herd Size500500
Replacement Rate35% (what you’d like)37% (what many herds actually run)
Heifers Needed175185 (+15 buffer = 200)
Completion Rate90% (goal in your head)79% (85‑herd actual)
Heifer Calves Needed194253
Beef Ceiling~50% of pregnancies (on paper)~34% of pregnancies (with sexed + conventional mix)

Walking through the right‑hand column in barn‑math terms:

  • At a 37% annual cull/turnover rate, you need 185 replacements to stand still (0.37 × 500 = 185). 
  • Add a modest 3% buffer for flexibility — about 15 extra heifers — and you’re targeting 200 heifers calving in per year.
  • At a 79% heifer completion rate, those 200 heifers require roughly 253 heifer calves born alive (200 ÷ 0.79 ≈ 253).
  • If 60% of your dairy pregnancies use sexed semen (≈90% heifers) and 40% use conventional (≈50% heifers), the weighted average female fraction per dairy pregnancy is about 0.74. 
  • To get 253 heifer calves at 0.74 heifers per pregnancy, you need about 342 dairy‑sired pregnancies per year(253 ÷ 0.74 ≈ 342).

Total pregnancies per year in a 500‑cow herd vary with the reproduction program, but for illustration, say you generate around 520 pregnancies annually. In that scenario:

  • 520 total pregnancies − 342 dairy‑sired pregnancies needed = 178 pregnancies available for beef.
  • 178 ÷ 520 ≈ 34% of pregnancies.

That 34% isn’t a magic industry standard. It’s the ceiling in this particular example with these assumptions. If your actual completion rate is lower than 79%, your safe beef ceiling drops. Dial back sexed semen usage — or see weaker conception on sexed — and it drops again. Want more than a 3% heifer surplus to sell into a strong replacement market? It drops further still.

Overton showed how the math scales on a larger herd in that same HPDC talk. In one 2,500‑cow scenario from his presentation, he modeled using sexed dairy semen versus beef semen on the final 100 pregnancies. Once he included three‑year replacement costs, his model showed the sexed semen strategy generating about $216,000 more net value than the beef‑semen strategy on those same 100 pregnancies. Most of that difference came from not having to buy high‑priced springers into a market where $3,000‑plus per head isn’t rare.

The calf cheque from beef is visible right away. The springer cheque is delayed and much less fun to write. The arithmetic doesn’t care which one feels better.

DecisionBeef-on-Dairy PregnancySexed Dairy PregnancyDifference
Immediate Calf Value+$1,200 (beef calf)+$750 (dairy heifer calf)+$450 to beef
Heifer Raised01 @ $1,700 raising cost-$1,700 to beef
Springer Purchased Later-$3,200$0-$3,200 to beef
Net Present Value-$2,000+$850-$2,850 net loss for beef

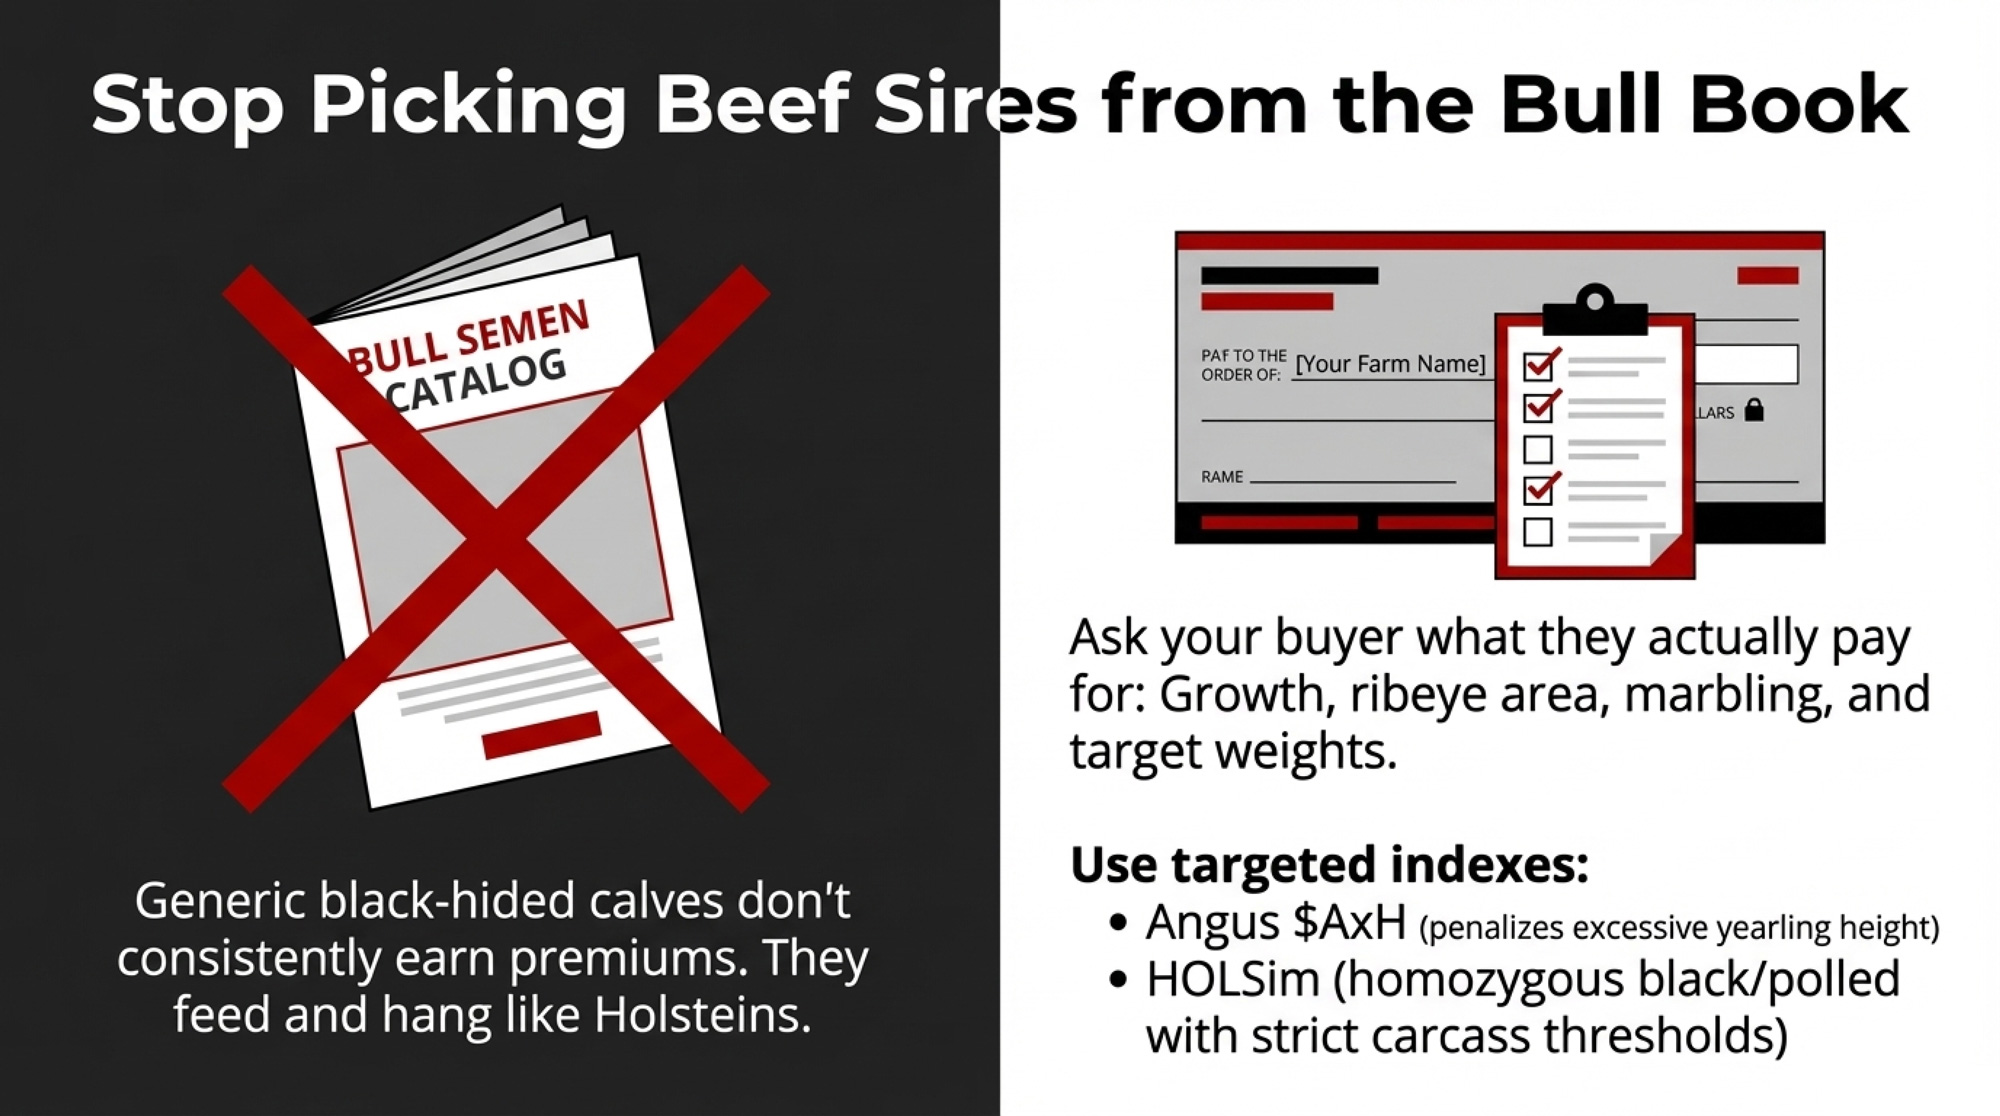
Are You Breeding for the Bull Book or the Buyer’s Cheque?

Once you’ve got a handle on how many pregnancies you can safely point at beef‑on‑dairy, the next question is uncomfortable and simple: are you picking beef bulls for your buyer, or for your semen catalog?

Plenty of herds still select beef semen on a mostly dairy‑centric checklist — calving ease, conception rate, semen price, and maybe coat color — instead of starting with the traits their calf buyer actually pays for. Meanwhile, calf buyers and feedlots are looking at a different checklist: calves that grow, hang a decent carcass, and are consistent enough they don’t need a spreadsheet to figure out what they’re feeding.

Extension and university work — including Kansas State’s analysis of Holstein and beef‑dairy cross calves in video auctions — shows that well‑bred beef‑on‑dairy calves often sell above straight Holstein steers on a per‑hundredweight basis, narrowing the gap to native‑beef calves in many sales. Generic black‑hided calves that still feed and hang like Holsteins don’t earn those premiums consistently.

Instead of guessing, start that conversation at the other end of the chain. Ask your buyer:

  • What breed or breed type do you actually want on these calves — straight Angus, or are SimAngus/HOLSim crosses on the table if they’re black and muscled?
  • Do you need predominantly black‑hided calves for your program?
  • Are you insisting on polled calves?
  • At what weight do you buy — day‑old, 250 pounds, 500 pounds, or heavier?
  • Are you paying primarily on live weight, or is there carcass/grid feedback that matters?

Those answers translate directly into trait priorities on the sire side: growth and feed efficiency to hit target weights, muscling and ribeye area to avoid “dairy‑type” carcasses, marbling to hit Choice or better, moderate frame consistently, and the calving ease you need on Holstein or Jersey dams. Color and horn status become hard filters, not catalog fluff.

On the genetics side, two indexes do a lot of heavy lifting:

  • The Angus $AxH index was developed specifically for Angus sires used on Holstein dams. It blends calving ease, growth, muscling, and marbling while penalizing excessive yearling height — directly addressing the carcass‑length and cut‑size issues common in straight Holstein steers. In one Angus Genetics Inc. summary from 2022, just 15 of 9,690 sires ranked over 150 on $AxH, which tells you how small the truly elite slice was at that point. 
  • The HOLSim program, a joint effort between Holstein Association USA and the American Simmental Association, launched in 2019 and designates SimAngus bulls that are homozygous black and homozygous polled and exceed a Holstein‑specific terminal index threshold, balancing calving ease and carcass traits. Eligible bulls must be SimAngus with a breed composition of 3/8 to 3/4 Simmental, with the balance Angus. 

Beef semen used in dairy herds has often been cheaper on average than top‑end terminal options, as Dairy Herd and Progressive Dairy have both noted. The real question isn’t whether you can save a few dollars per straw. It’s whether the sires you’re using actually work for the person writing the cheque.

For many 200‑ to 1,000‑cow herds, the practical move isn’t a 20‑bull lineup. It’s a small, consistent group — often three to five sires — that rank well on $AxH or HOLSim and match your buyer’s spec sheet. And then the discipline to stick with them. No off‑list bulls go in the tank “just this once.” No “cleaning out the tank” by throwing calves into the pipeline, your buyer didn’t ask for.

  • Don’t just take the cheque; demand the data. Ask for carcass or grid information back from your buyer, where possible. If your high‑index beef‑crosses aren’t consistently grading Choice or Prime, you’re giving away leverage on next year’s price discussion — and you won’t know it until you ask. 

📖 Recommended Reading:
Overton’s heifer inventory deep‑dive — “A new perspective on right-sizing your heifer inventory.”

Can You Get the Beef-on-Dairy Benefit Without Fancy Tech?

A lot of the breeding‑strategy case studies making the rounds right now feature fully integrated setups: automated sort gates, activity monitors feeding into DairyComp or BoviSync, cow‑level breeding reports, semen assignment protocols. If you’re there already, great.

Plenty of 200‑ to 800‑cow herds aren’t there yet. And they’re not going to install a six‑figure tech stack to straighten out beef usage.

You don’t need another app to remove most of the slop from your program. You do need a clear, written plan, a slightly smarter breeding sheet, and a ruthless 20 minutes once a week.

The minimum viable system looks something like this:

  • Write a one‑page breeding policy and hang it where cows actually get bred. Define top, middle, and bottom tiers using your genomic or index ranking. In one line per tier, spell out which semen types are allowed on which services. Then list your DNB criteria in plain language — chronic mastitis, chronic lameness, multiple failed services, stale lactation, whatever fits your herd.
  • Print a color‑coded cow list out of your genomic file or herd software. Sort by your chosen index (NM, or a custom ranking), then tag green for top, yellow for middle, red for bottom. Put a dot or symbol next to the cows you already know should be DNB. Keep that list beside the breeding cards, not in the office drawer.
  • Add one column to your breeding card or work list: “Tier + Allowed Semen.” When the tech goes to breed cow 4123, they don’t just see an ID. They see “green — sexed only” or “red — beef only.” If “Angus” gets written next to a green cow, that mismatch is easy to spot on Friday.
  • Block 20 minutes once a week for a three‑count audit:
    • Count how many beef straws went to green or yellow cows instead of red.
    • Count how many services were sexed, conventional, and beef — and compare that mix to the replacement plan you just ran with your own numbers.
    • Count how many cows marked as DNB on your list still got bred.

You won’t get a slick dashboard out of this. You will get a clear yes‑or‑no answer to a hard question: is your beef‑on‑dairy program being driven by your genetic and replacement plan, or by whoever happened to be standing in the parlor with an AI gun at 4 a.m.?

What This Means for Your Operation

Think of this as a set of reality checks, not a recap:

  • Within 30 days, run the breeding‑card beef audit. Pick a recent week, highlight every beef mating, and cross‑check each cow against your genomic tier list and DNB list. If more than a third of your beef straws are landing on cows that aren’t truly bottom‑tier, it’s a sign the day‑to‑day realities in the parlor are quietly pulling the program off the plan.
  • Calculate your own heifer completion rate instead of guessing. Take a recent calf crop, divide the number of heifers that actually calved in by the number of live heifer calves born in that group. If you’re near Overton’s ~79% average — or below — your safe beef‑on‑dairy percentage is tighter than it looks in your winter planning meeting. 
  • Run the backward pipeline math once a year. Start with herd size and actual replacement rate, add a small buffer, then work back through your real completion rate and sexed/conventional mix to find how many dairy pregnancies you need. Whatever’s left is your genuine beef ceiling. If your current beef percentage is higher than that, you’re pre‑loading a replacement deficit.
  • Sit down with your calf buyer or integrator before your next semen order and get their specs in writing: breed, color, horn status, target weight, and how they pay. Build your beef sire list backward from that conversation using $AxH or HOLSim bulls that fit, instead of forward from whichever bull picture looks best in the catalog. 
  • Make the breeding sheet match your plan. If you’re asking staff to remember which cows get what semen type in their heads, you’re almost guaranteeing drift. The moment you write “green — sexed only” and “red — beef only” on the card, you’ve given people a fair chance to hit the target.
  • Watch the opportunity cost, not just the calf cheque. In a market where replacement heifers can sell well above $3,000 per head, that extra $150–$200 on a beef‑cross calf can disappear fast if you later have to buy a heifer to replace the one you didn’t create. The gap is on the order of a couple of thousand dollars, not a rounding error. 

Key Takeaways

  • If you don’t know your own heifer completion rate, you’re guessing about how much beef‑on‑dairy your herd can afford — and Overton’s 85‑herd dataset suggests those guesses are often 10 points too optimistic. 
  • If your breeding cards and your genomic tier list don’t line up on where beef semen is actually going, you’ve got more of a beef‑on‑dairy storyline than a fully enforced strategy.
  • If your beef sire lineup came from the bull book forward instead of from the buyer’s cheque backward, you’re likely leaving premiums on the table — especially if you aren’t tracking whether those calves are actually grading Choice or Prime once they reach the packer. 
  • If you can’t explain — in one hallway conversation — how many dairy pregnancies you need each year to protect your replacement pipeline, it’s a sign you don’t yet have full control over how beef‑on‑dairy fits into your herd.

The Bottom Line

The heifer shortage isn’t going to disappear this year or next. Beef‑on‑dairy isn’t going away either. On Monday morning, before you do anything else with the next semen delivery, grab last week’s breeding cards, a highlighter, and your genomic list — and find out whether your beef‑on‑dairy program is protecting your 2028 milking string or just making it more expensive to buy back later.

Complete references and supporting documentation are available upon request by contacting the editorial team at editor@thebullvine.com.

Learn More

The Sunday Read Dairy Professionals Don’t Skip.

Every week, thousands of producers, breeders, and industry insiders open Bullvine Weekly for genetics insights, market shifts, and profit strategies they won’t find anywhere else. One email. Five minutes. Smarter decisions all week.
NewsSubscribe
First
Last
Consent
Send this to a friend