






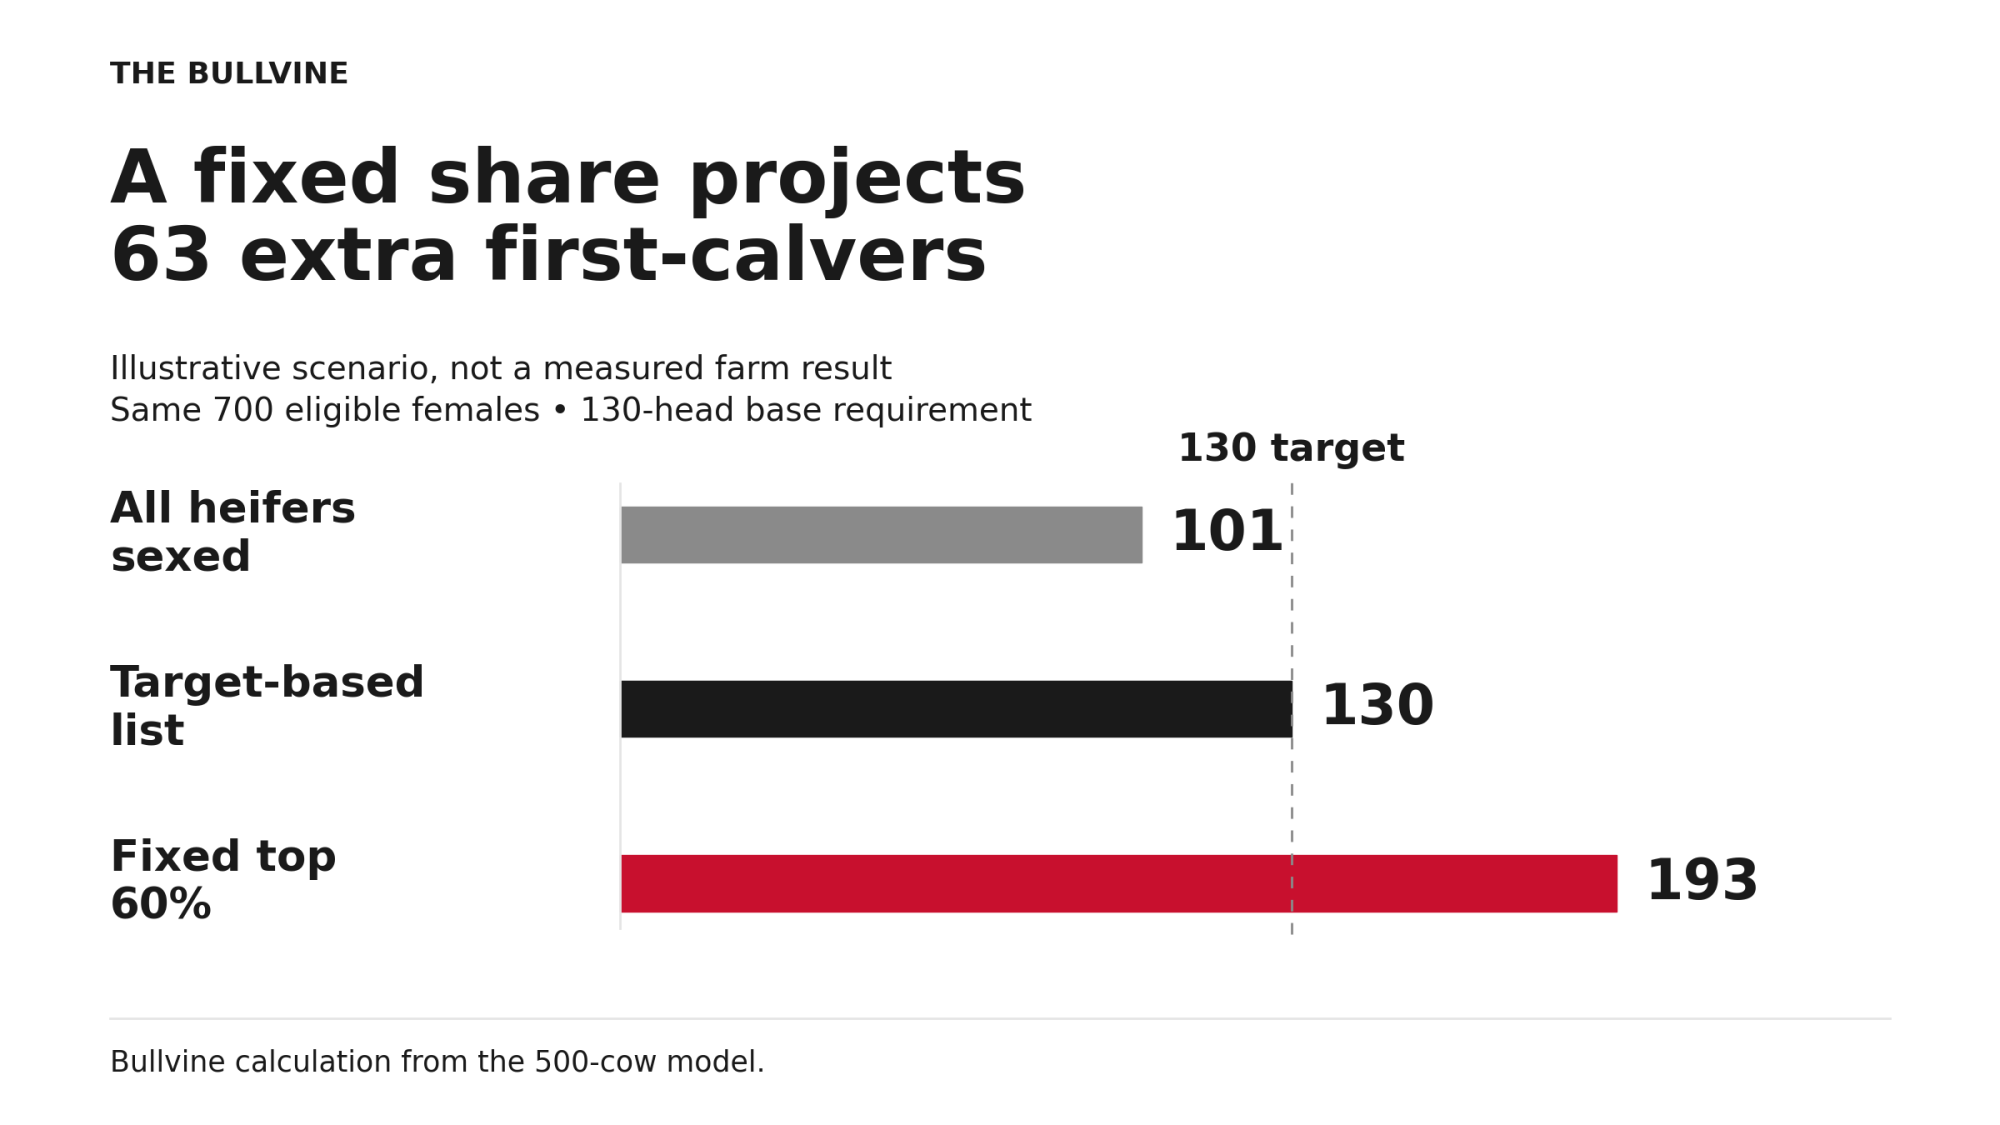
It’s breeding-list day: 700 eligible females, 130 first-calvers needed. A fixed 60% sexed list projects 193. Rank on Net Merit, then stop the list at the target.

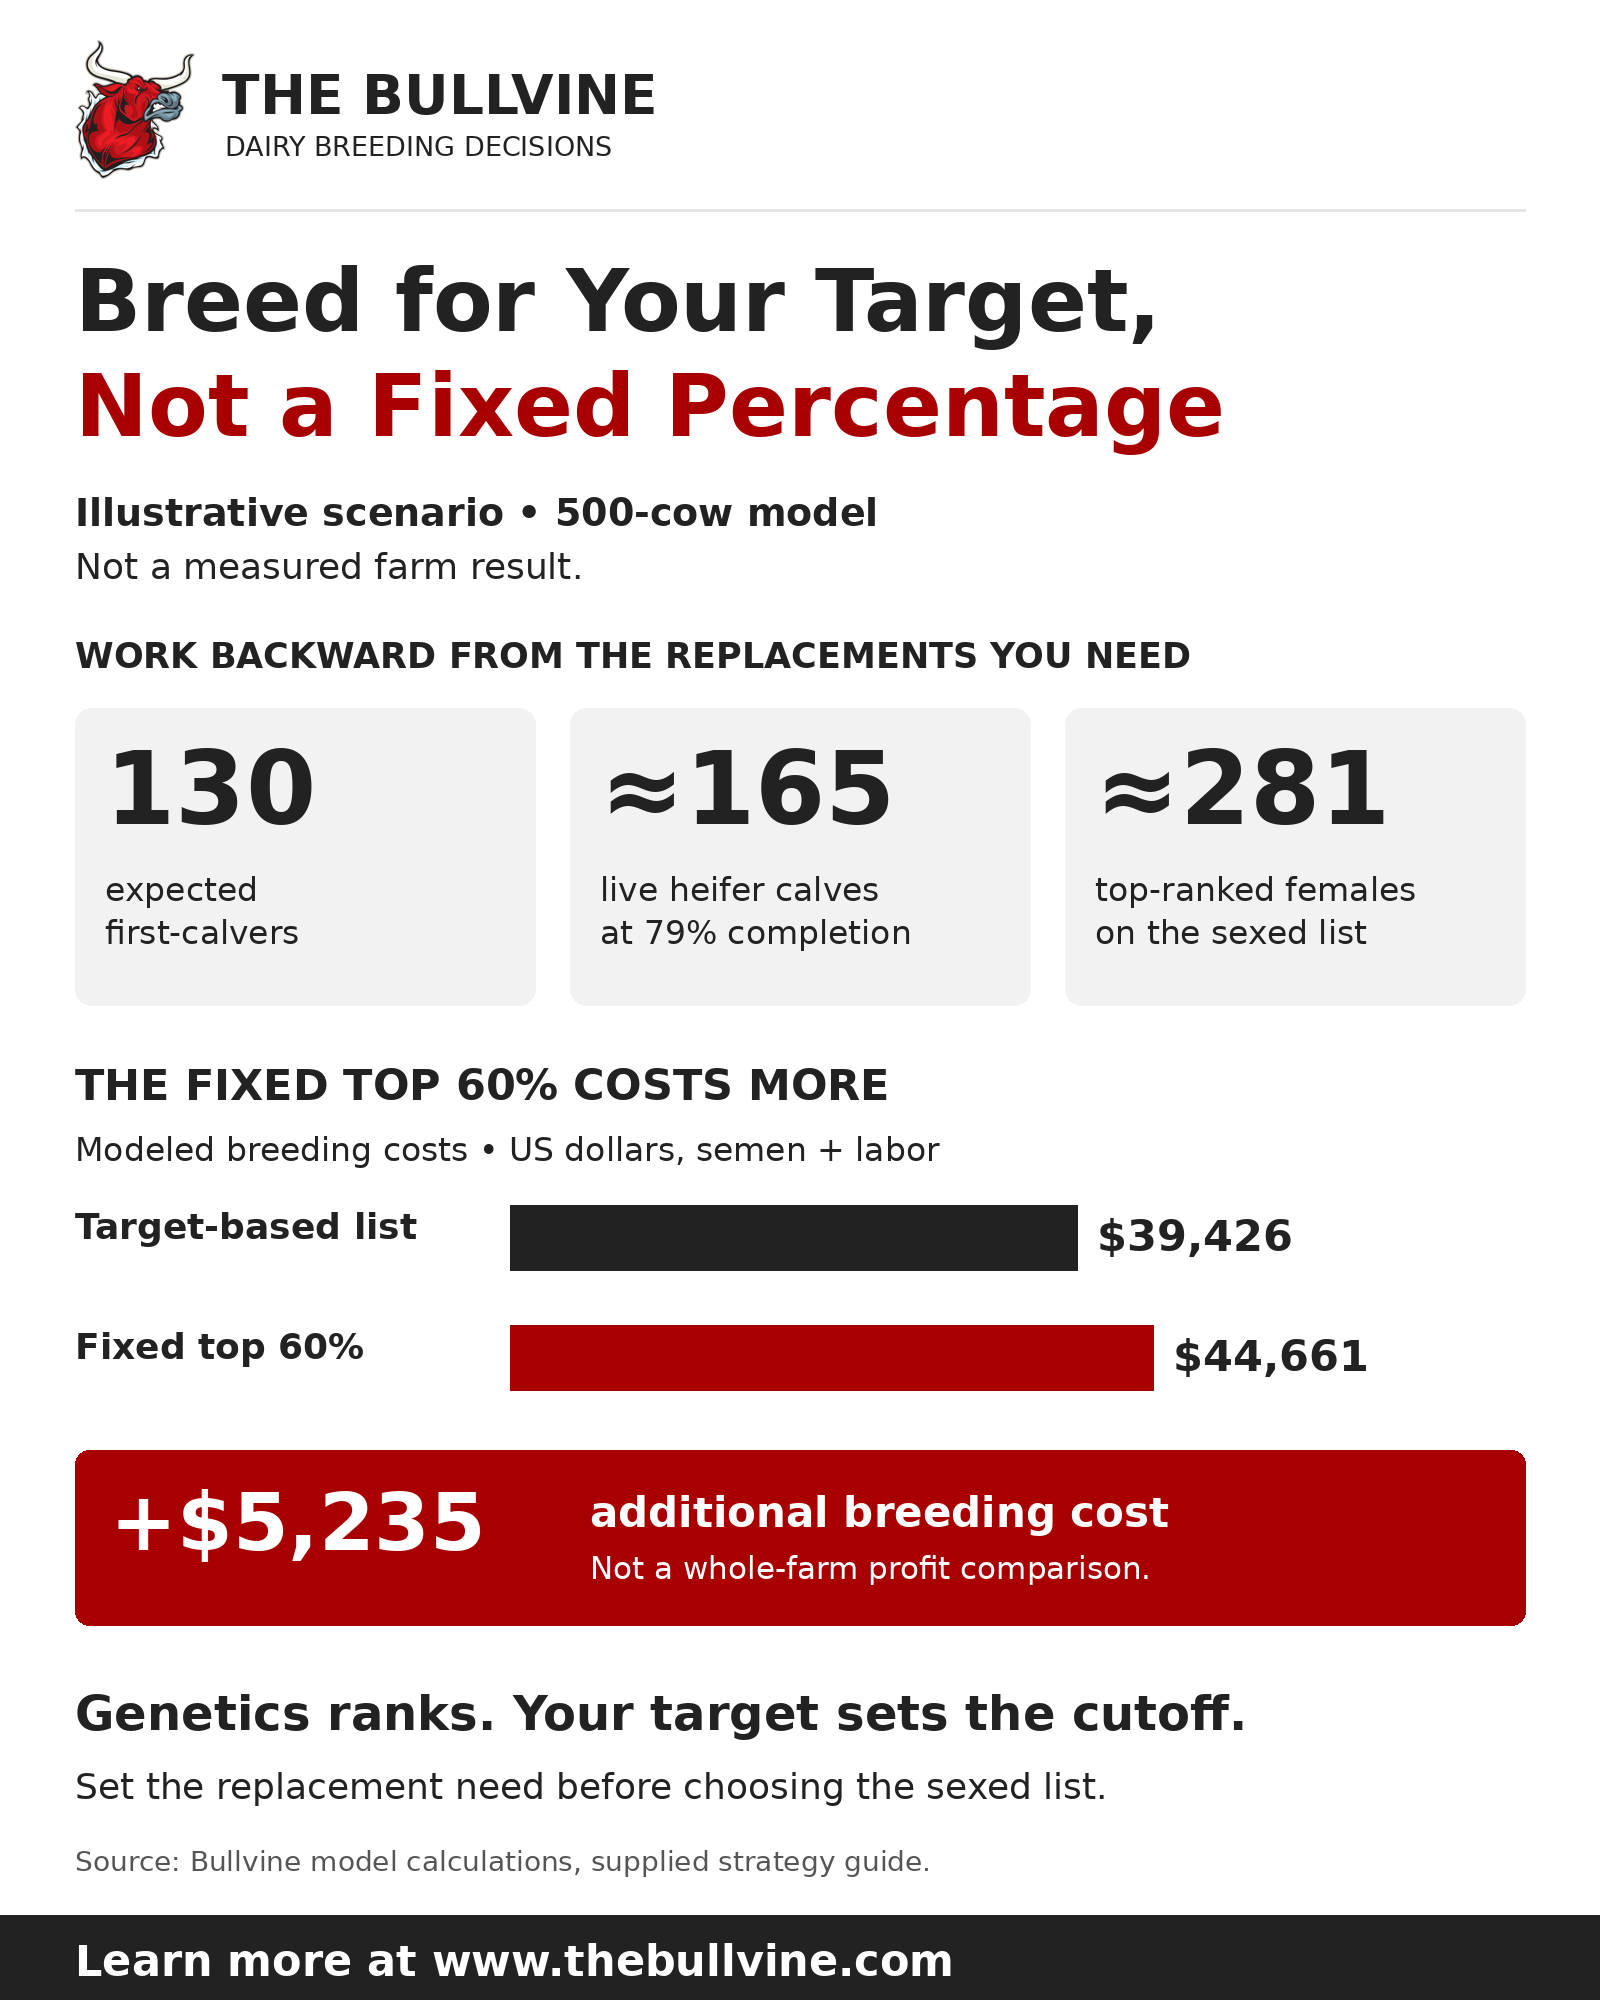
Put sexed semen on a fixed 60% of your eligible females without checking it against your replacement needs, and you can pay for heifers you never planned on. In a 500-cow Bullvine model, that rule costs $5,235 more in breeding expenditure (semen and labor) than a list built to the herd’s replacement target. It also projects about 63 expected first-calvers above the 130-head base requirement.
Genomics tells you which females to breed dairy. Your replacement target tells you how many.
To see how a fixed percentage drifts away from the replacement target, here’s the math on an illustrative 500-cow herd. It has 200 heifers reaching breeding age this year. After counting the pregnancies and youngstock already in its pipeline, it still needs 130 first-calvers from this year’s breedings. That 130 is an illustrative remaining requirement with no buffer added, not a recommended replacement rate.
“Top 60%” means 420 of the 700 eligible females (500 cows plus 200 heifers) ranked on Net Merit. The 60% is an illustrative fixed share, not an industry recommendation.
Sexed semen is already standard equipment. NAAB members sold 10.6 million units of gender-selected dairy semen in the U.S. in 2025, 64% of domestic dairy-semen units. That 64% counts semen units sold, not females bred. Lauber and co-authors found herds allocating sexed and beef semen by parity and service number. Neither data set shows whether those herds set a replacement target first.
What the three plans project
The table compares three ways to breed the same 700 females. Each sexed-listed female gets up to two sexed services, then one beef service if she’s still open. Beef-listed females get up to three beef services. These are Bullvine projections, not herd results.
| Plan | Sexed-listed females | Expected first-calvers | Difference from target | Modeled breeding cost (US$, semen + labor) |
| All heifers sexed | 200 | 101 | −29 | $36,130 |
| Target-based list | About 281 | 130 | 0 expected | $39,426 |
| Fixed top 60% | 420 | 193 | +63 | $44,661 |
Costs assume the service limits above and stop after the last specified service.
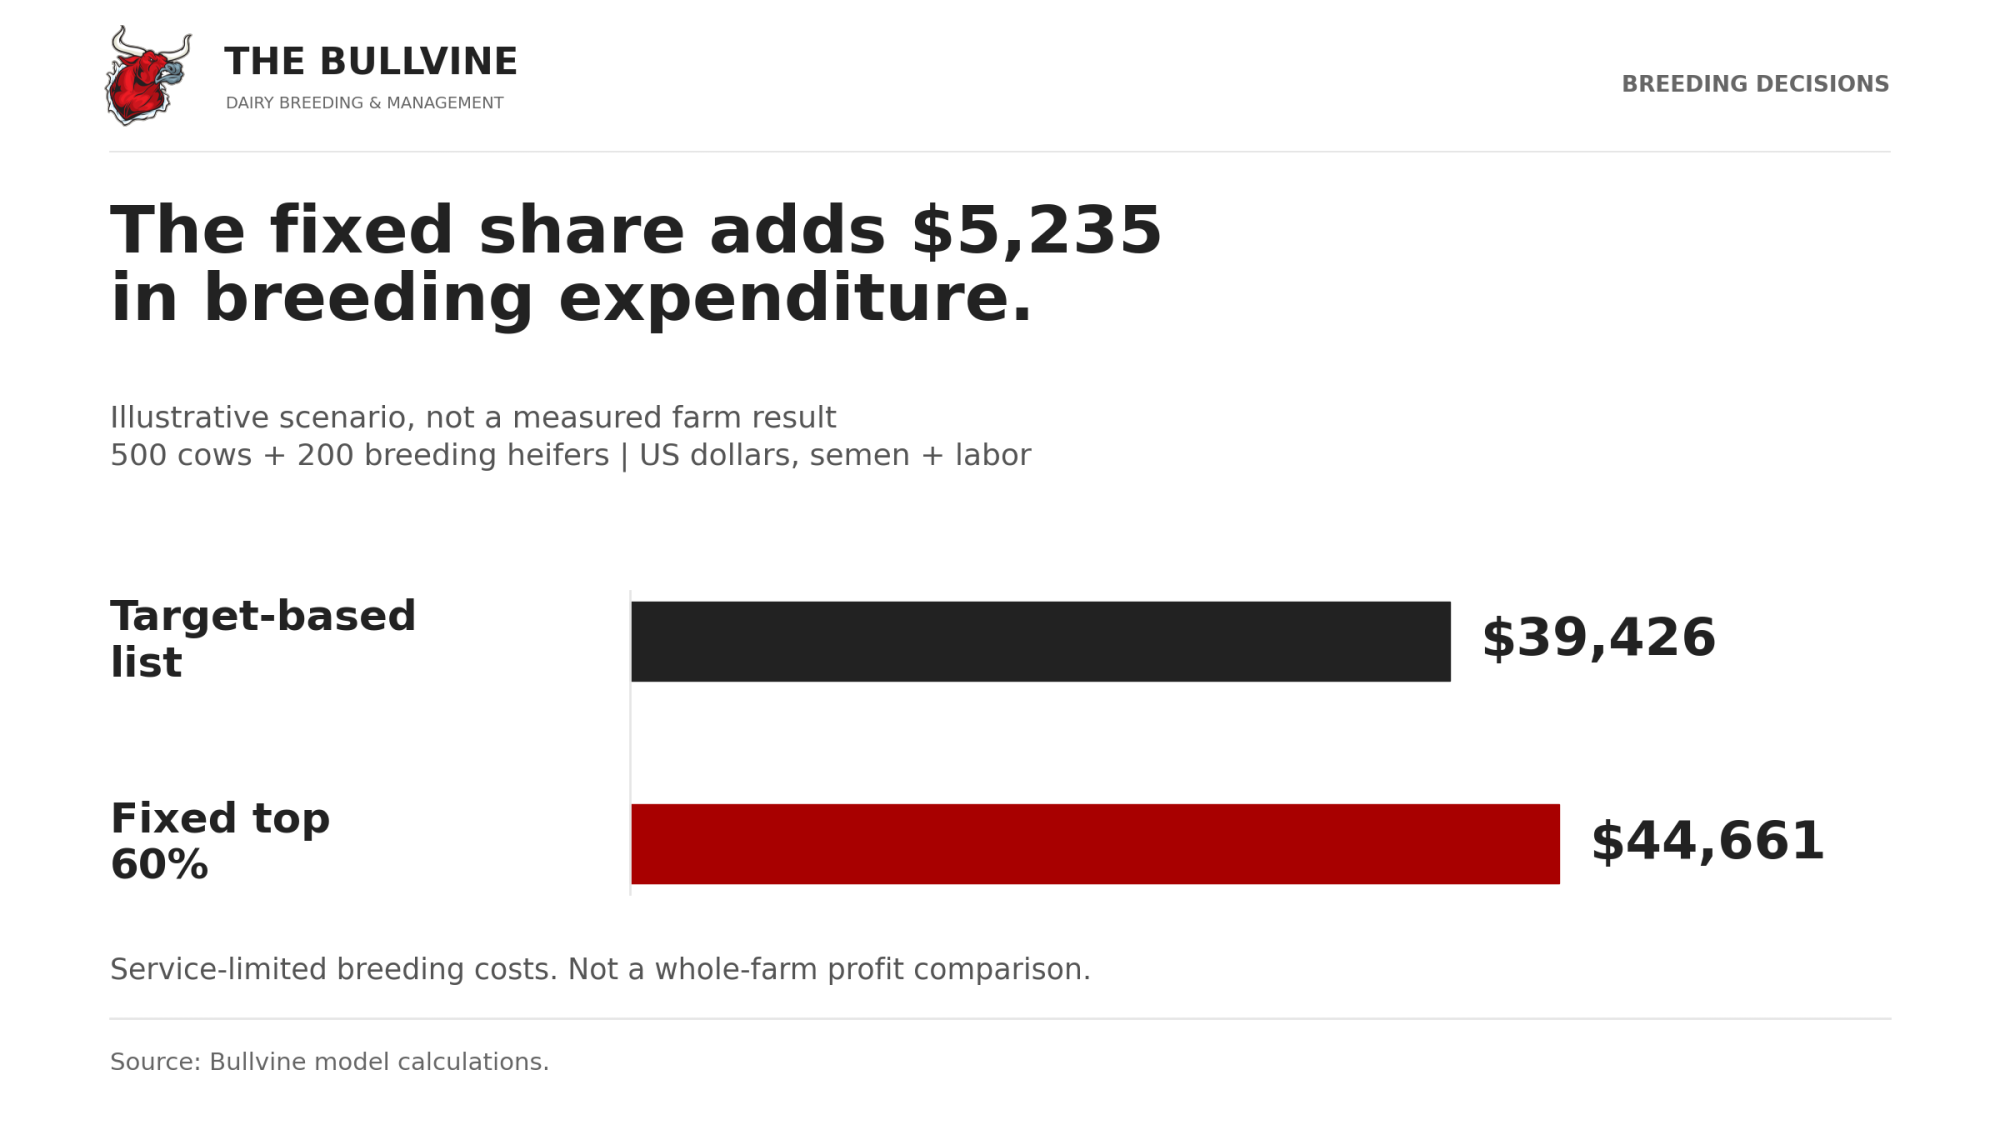
The comparison covers replacement supply and breeding cost. It isn’t a whole-farm profit ranking. It leaves out calf revenue, surplus-heifer sales, rearing costs and the choice of which daughters to keep. The fixed share’s list also reaches further down the rankings, so on average its replacements come from lower-ranked dams.
For what happens to the replacement count when beef takes more of the services, see the companion piece, USDA’s 3.905 Million-Heifer Paradox.
Count backward from calving
This is a one-cohort illustration, not a steady-state herd. The 200 heifers enter breeding over the next 12 months, and the 500 cows are bred in the same window. Their daughters won’t reach the milking string for more than two years.
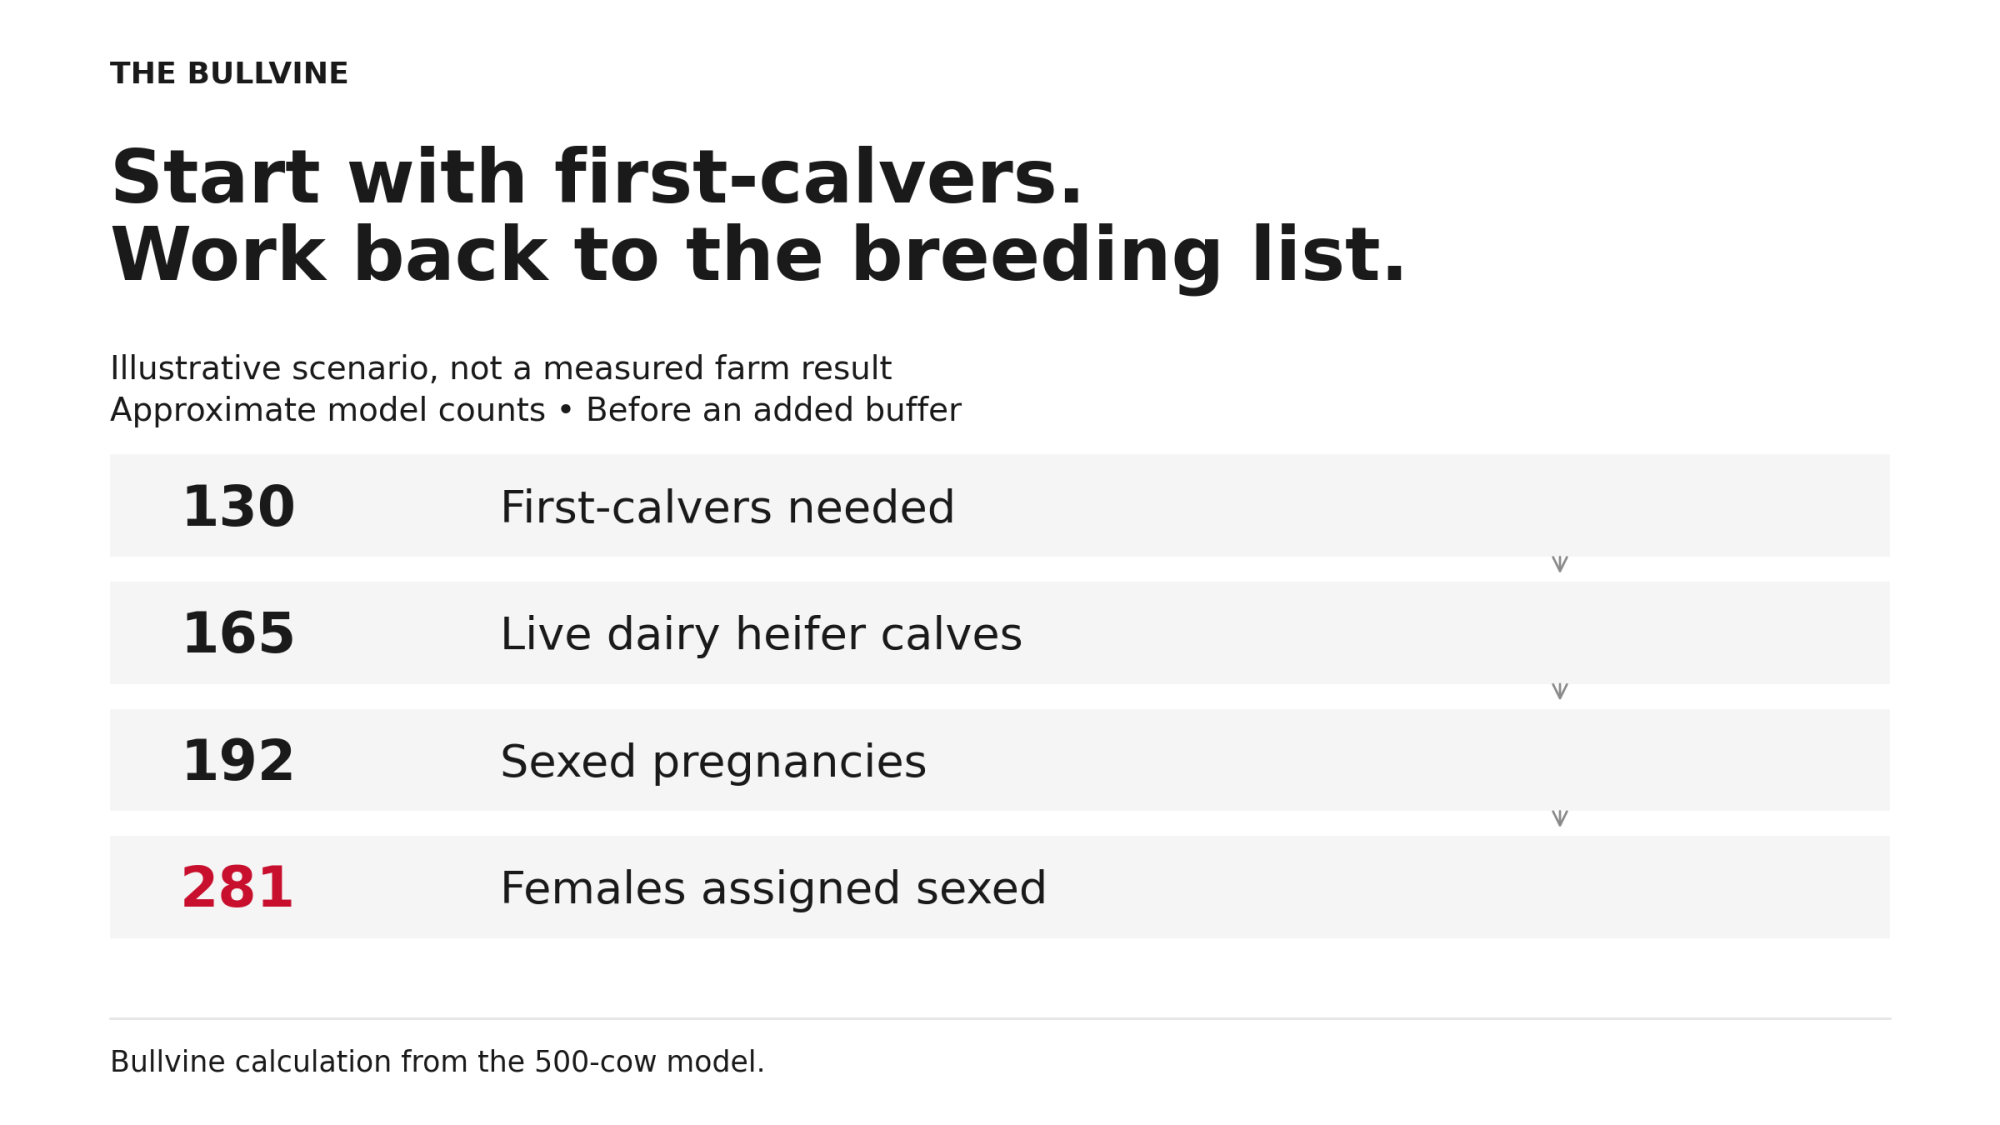
The funnel, from target back to pregnancies:
- Target: 130 first-calvers entering the milking string.
- Live heifer calves needed: about 165, assuming 79% complete the trip from birth to first calving.
- Sexed pregnancies needed: about 192, assuming 90% of calves are female and 5% of diagnosed pregnancies don’t end in a live calf. The 5% is a model assumption; Overton’s herd data show lower survival for cow pregnancies, which the fourth scenario below tests.
- Sexed list: about 281 eligible females. Each listed heifer yields 0.51 expected first-calvers and each listed cow 0.43. Because the list includes top-ranked cows, some lower-ranked heifers fall outside it and get beef.
The 79% is the median Michael Overton, a Zoetis veterinarian, reported across 85 U.S. herds in March 2026, with an interquartile range of 74% to 84%. He labeled these “NOT benchmarks or goals.”
His completion stages count deaths, sales, heifers that never conceive and conceived heifers that fail to calve. Before reusing your own historical rate, check why heifers left. A herd that used to sell surplus dairy heifers has a completion rate shaped by that policy.
Target, buffer or surplus
A workable replacement target separates three numbers:
- Expected requirement: the first-calvers the herd needs.
- Planned buffer: a deliberate margin for contingencies or extra selection.
- Unplanned surplus: anything beyond both.
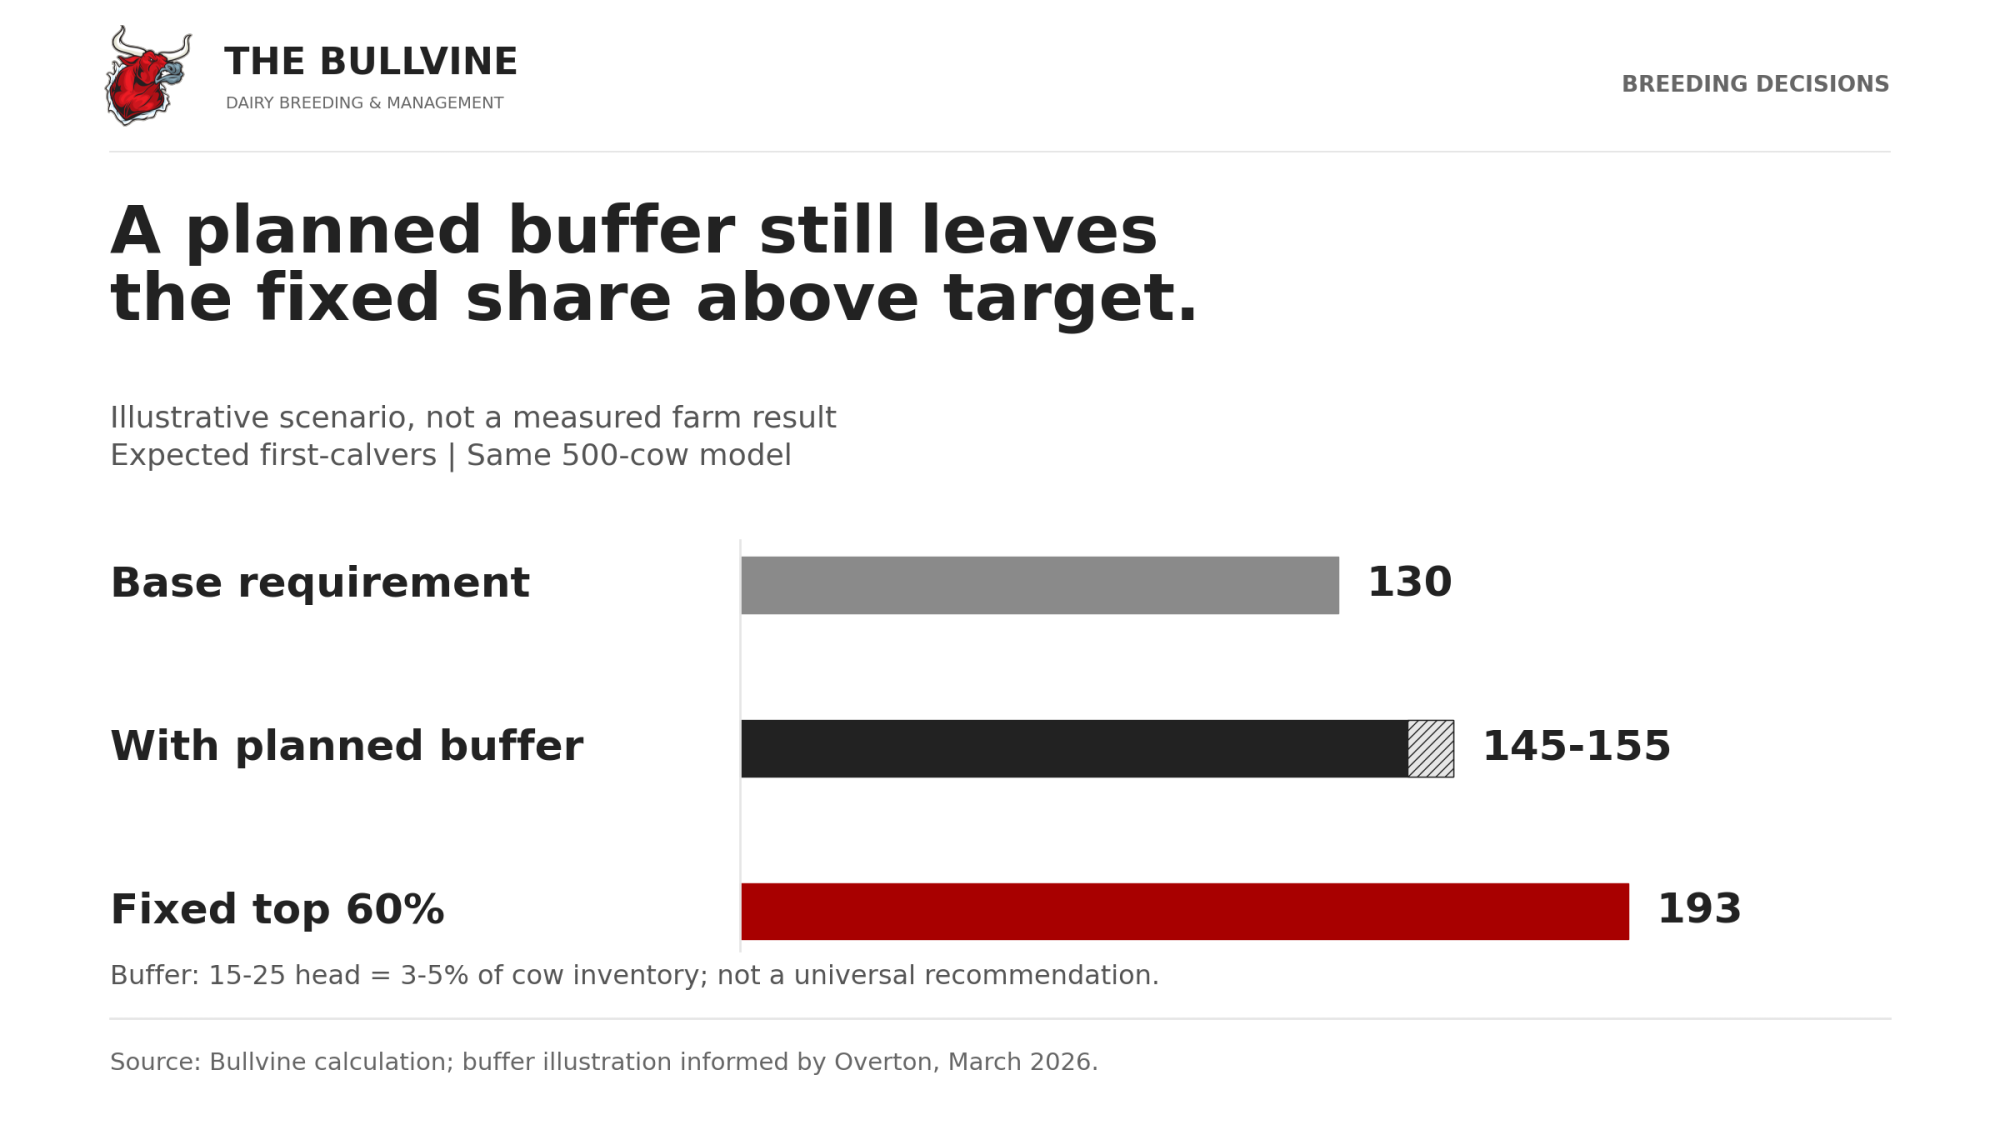
Overton advised using enough sexed semen to produce “a bit of a surplus of heifers,” with “3-5% as a start.” For this herd, 3–5% of the 500-cow inventory is 15 to 25 extra first-calvers. That’s roughly 12% to 19% above the 130-head base, so the buffer scenario raises the remaining requirement to 145–155. Overton’s own worked example also allows for historical year-to-year variation, so this is a simplified version of his method.
At 145 to 155, the target-based list grows to about 314–336 females. The fixed share’s projected 193 still sits 38 to 48 head above it.
Planned extra heifers have uses: more selective replacement, selling springers, culling weaker heifers on genomic results. The case here is against surplus nobody planned for.
Fertility sets the length of the list
In the two trials cited here, sexed-semen P/AI (pregnancies per insemination) at first service ranged from about 43% to 59%. The trials differed in protocol, herds (one used Irish seasonal pasture herds) and the day pregnancy was checked, so that roughly 16-point gap has more than one cause. Either way, it’s why you can’t borrow a neighbor’s percentage. Your list length has to follow your own farm’s fertility records.
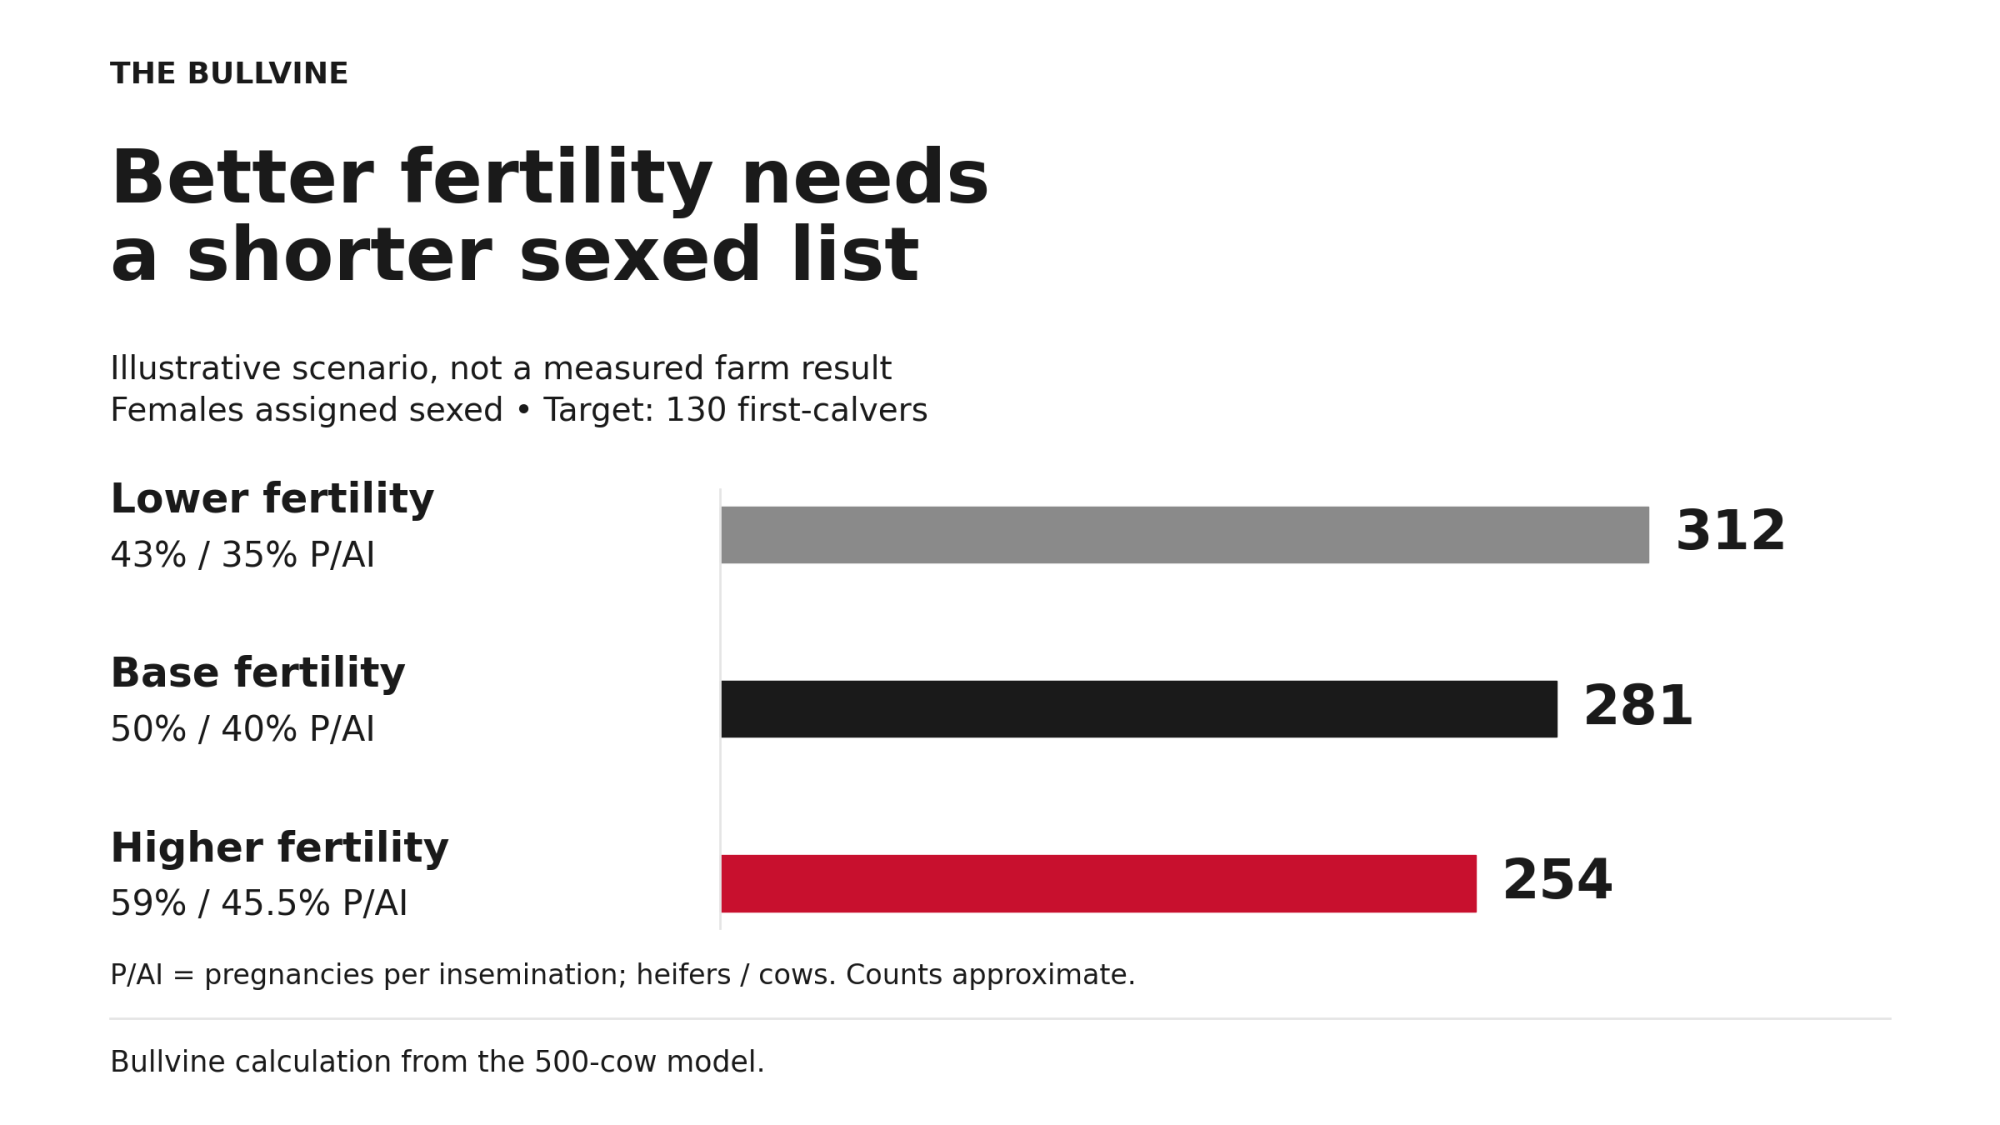
| Scenario (sexed P/AI, heifers / cows) | All heifers sexed: expected first-calvers | Target-based list: females assigned sexed | Fixed top 60%: expected first-calvers |
| Lower (43% / 35%) | 91 (−39) | About 312 | 174 (+44) |
| Base (50% / 40%) | 101 (−29) | About 281 | 193 (+63) |
| Higher (59% / 45.5%) | 112 (−18) | About 254 | 213 (+83) |
| Base conception, alternative survival assumptions | 99 (−31) | About 299 | 181 (+51) |
The fourth row uses different pregnancy-to-live-calf assumptions for heifers and cows. With survival based on Overton’s data, the fixed share’s projected surplus is about 51. The 44-to-83 range spans three tested fertility scenarios. It isn’t an uncertainty interval.
A percentage isn’t wrong in itself. In the base case, the target-based list puts sexed semen on about 40% of eligible females (281 of 700). Across the other scenarios, that runs from about 36% to 45%.
What goes wrong is treating an inherited percentage as the goal. The percentage should come out of the replacement calculation, and it should move whenever fertility, eligible numbers or the requirement changes.
Choose the index before setting the cutoff
The model ranks on Net Merit, but the cutoff logic doesn’t depend on which index you use. CDCB publishes four lifetime merit indexes: Net Merit, Cheese Merit, Fluid Merit and Grazing Merit. Breed associations add their own, such as Holstein TPI, and Lactanet publishes LPI and Pro$.
- Pick the index that fits your breeding objective.
- Rank every eligible female on that same index and evaluation system.
- Look hard at the animals near the cutoff.
A 2018 article by Brian Van Doormaal reported that genotyping more than doubled average Holstein heifer reliability for LPI and Pro$, from about 33% to 70%. Use the reliability on each female’s current report. A small predicted gap near the cutoff is real information, but it shouldn’t settle the decision on its own.
When sexed on every heifer is enough
Under these assumptions, sexed semen on every heifer supplies about 91 to 112 expected first-calvers from this cohort, depending on fertility. If your remaining requirement is at or below that, the blanket heifer plan fills it without ranking the cows.
Newton and co-authors’ Australian pasture-based model found the net benefit of genotyping heifers depended on reproductive performance, replacement rate, whether parent-average information was available, and returns from surplus heifers.
Running it month to month
Keep two numbers apart:
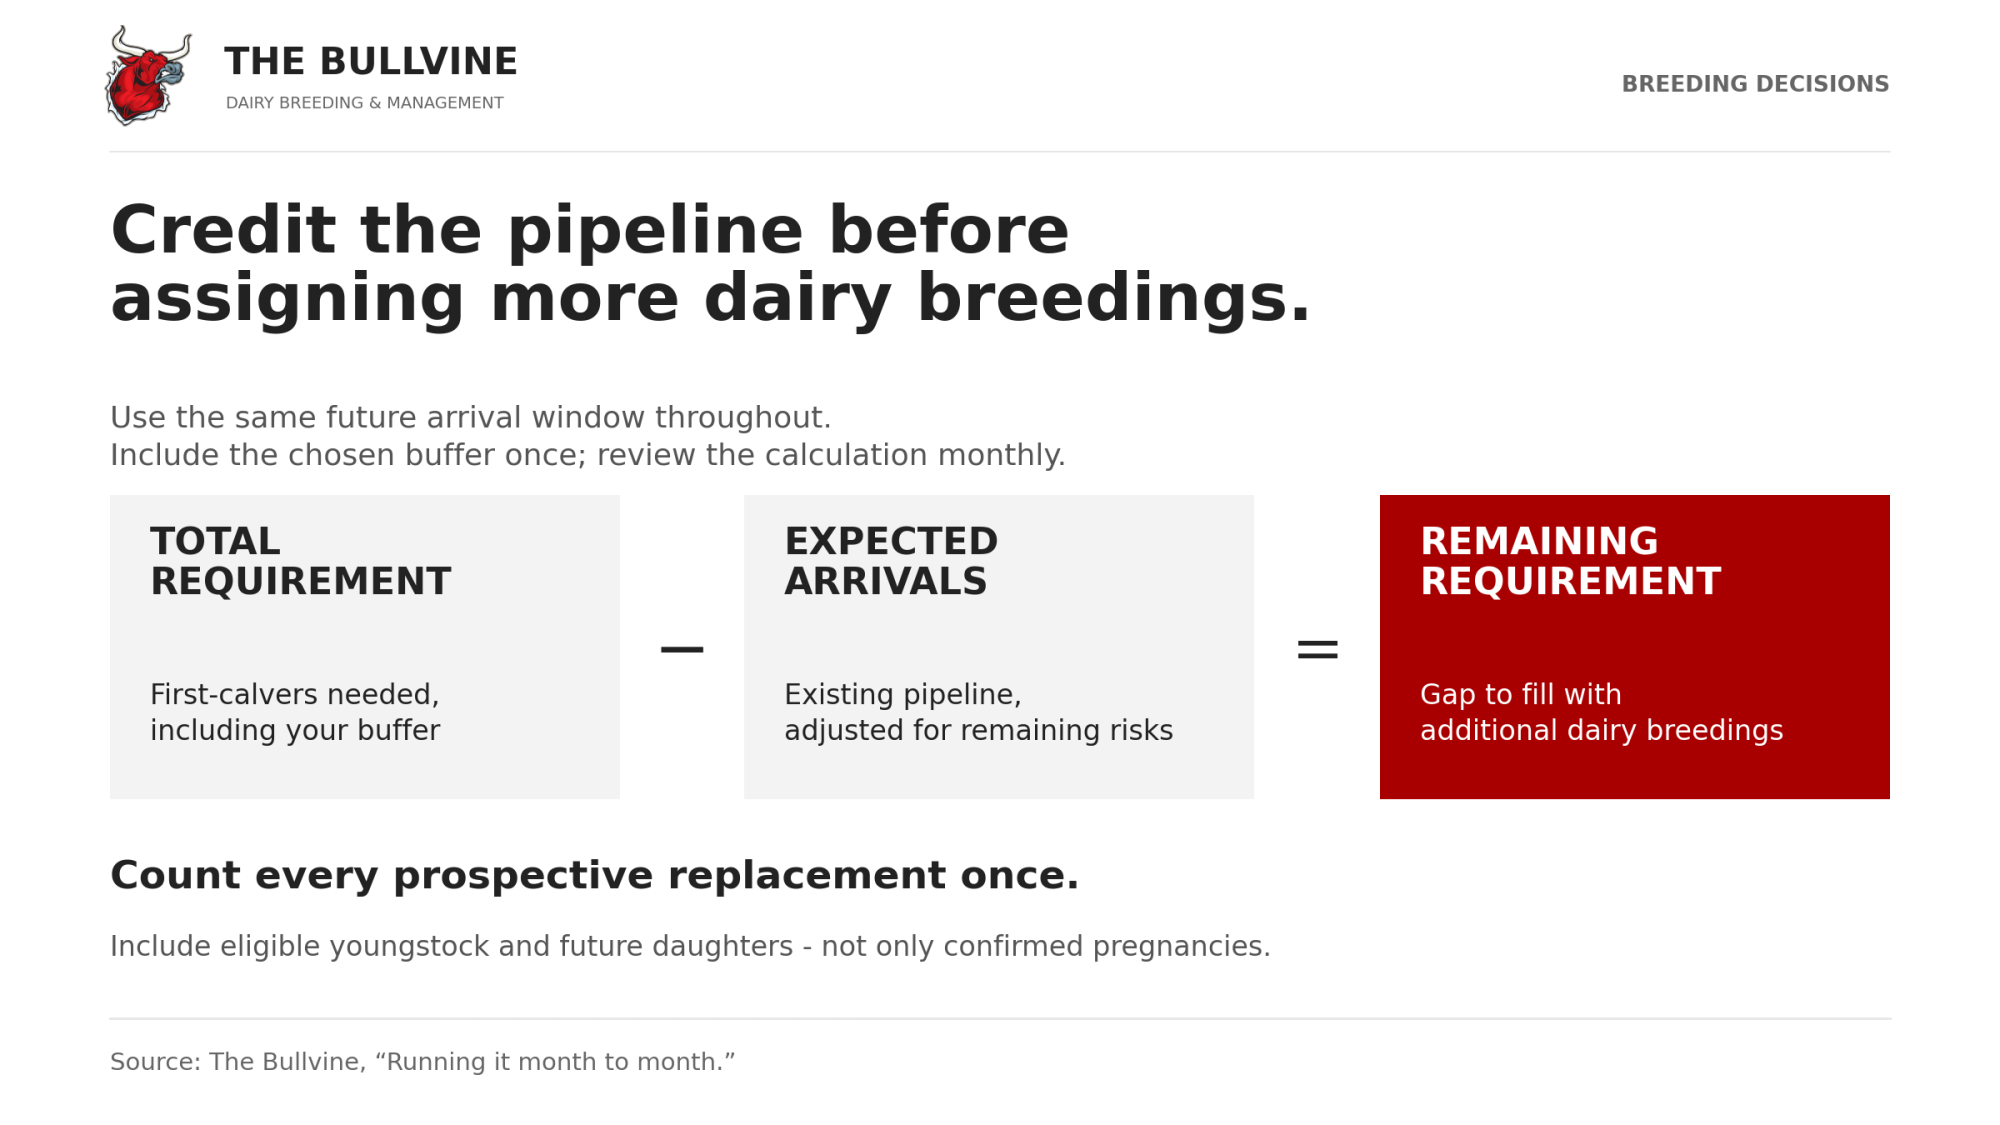
- Total requirement: first-calvers needed in a chosen future window, with your buffer included once.
- Remaining breeding requirement: what’s still unfilled after the pipeline is credited. In the base model that’s 130 with no buffer; in the buffer scenario it’s 145–155. Don’t add the buffer twice.
Each month:
- Pick the future arrival window and set its total requirement, buffer included.
- Credit only prospective replacements expected to arrive inside that window, applying only the risks still ahead of each one.
- Existing replacement heifers count by their own expected first-calving date. A confirmed pregnant heifer has already passed most of the stages inside the 79% figure; in Overton’s data, a median 3% of heifers that conceive fail to calve.
- Dairy pregnancies meant to produce replacement daughters count by those daughters’ later expected first-calving dates.
- Count each prospective replacement once. A pregnant heifer and her female fetus are two prospective replacements for different windows.
- Subtract expected arrivals from the total requirement. That gives the remaining breeding requirement.
- Assign dairy breedings to that gap.
Keep three checks separate:
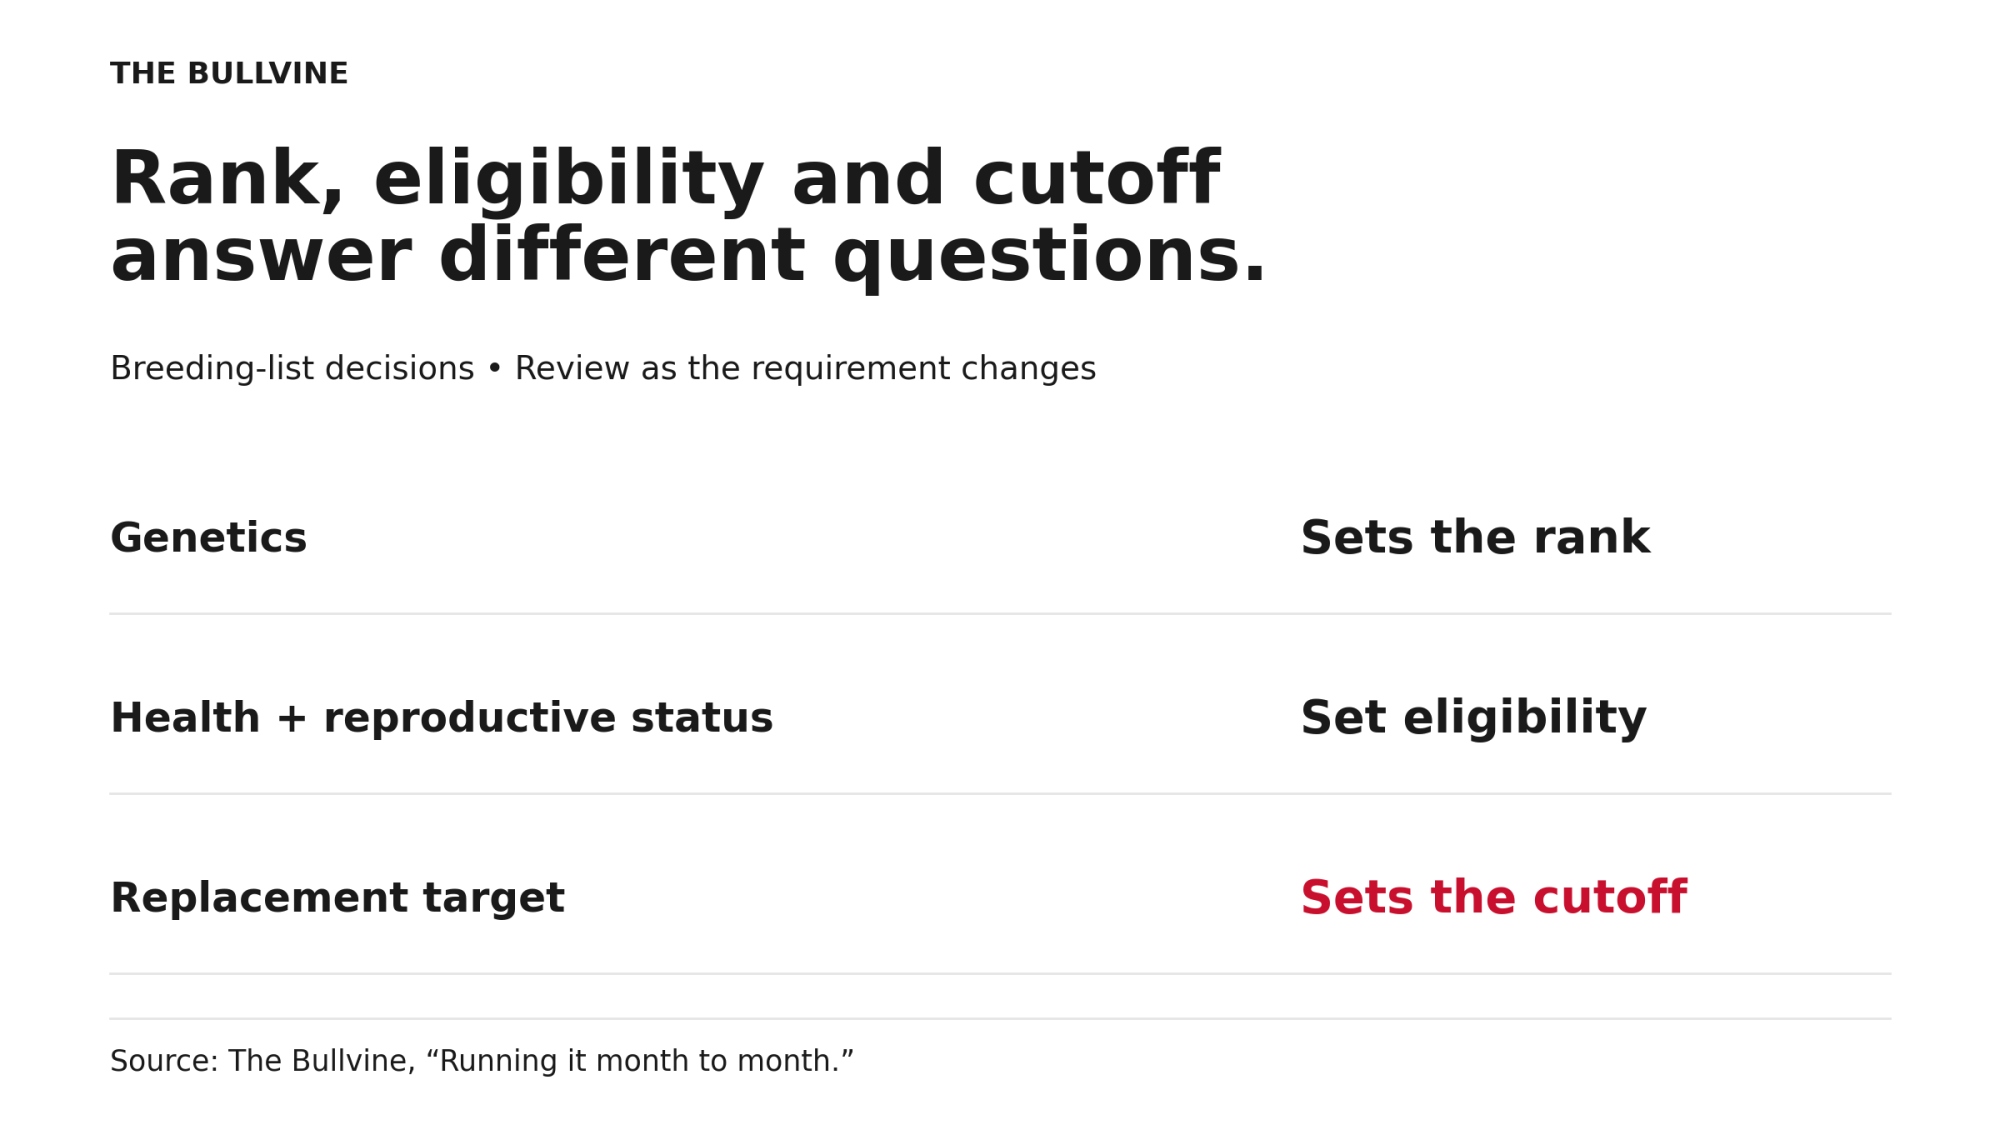
- Genetics sets the rank.
- Health and reproductive status set eligibility.
- The replacement target sets the cutoff.
| Decision | Instruction (the modeled target-based rule) |
| Eligible and selected to meet the dairy target | Up to two sexed services |
| Still open after two sexed services | One beef service |
| Eligible but outside the dairy list | Up to three beef services |
| Not suitable for further breeding | Individual management review |
Adding conventional dairy semen is a separate strategy, and it needs its own calculation.
Your next breeding meeting checklist
Before you order semen for the next quarter, bring these three numbers to the table:
- Expected first-calvers needed in the chosen window, including the chosen buffer.
- Expected arrivals already committed to that window.
- Expected first-calvers from the proposed dairy breeding list.
If the second and third don’t add up to the first, start by checking the requirement, buffer and pipeline estimates. If they still hold, change the breeding list to close the gap. Don’t move a justified target just to make the current semen allocation look adequate.
Rerun it whenever fertility, eligible numbers or the requirement changes. To score your whole replacement pipeline, run the Bullvine Pipeline Index Calculator.
Methodology: how the model works
This is the accordion, closed by default. The content is unchanged except for the two restored paragraphs below, and “labour” is now “labor” in the inputs table.
CDCB describes its indexes as the lifetime-profit difference an animal is expected to transmit to its progeny. So the $50 dam-group gap is an expected daughter lifetime-profit gap under the index’s assumptions, not realized profit. With equivalent sires, the daughters’ own NM$ values would differ by about half the dam-group difference, roughly $25.
Index revisions vs. switching indexes. USDA reports a 0.992 correlation between the 2021 and 2025 Net Merit formulas for young Holstein bulls. Lactanet expected “minor reranking” among top bulls after moving its Holstein production subindex from 60:40 to 40:60 fat to protein. Both describe revisions within one index, and neither guarantees a farm’s own cutoff animals stay put.
Learn More
- Beef-on-Dairy’s $6215 Secret: Why 72% of Herds Are Playing It Wrong — Arms you with the exact pregnancy rate benchmarks required to aggressively deploy beef semen without draining your replacement pipeline. Breaks down the protocols separating elite operations from the 72% currently leaking up to $6,215 a month.
- The Heifer Crisis Hiding in Plain Sight: Why Your Next 90 Days Determine Your 2028 Herd — Exposes the structural deficit behind the USDA’s three-million-head inventory, showing how biological losses shrink effective replacements to just 2.5 million. Delivers a rigid 90-day blueprint to position your herd for the inevitable margin squeeze.
- Stop Breeding by Color: Genomics, Heat Stress and Beef‑on‑Dairy Math That Can Add Over $4/cwt to Holstein Margins — Dismantles the financial drain of selecting replacements visually, proving how a $40 genomic test safeguards your $2,000 rearing investment. Connects strategic trait selection directly to heat stress mitigation and an extra $4/cwt in dairy margins.
The Sunday Read Dairy Professionals Don’t Skip.

Every week, thousands of producers, breeders, and industry insiders open Bullvine Weekly for genetics insights, market shifts, and profit strategies they won’t find anywhere else. One email. Five minutes. Smarter decisions all week.