






Your 291 Beef Calves Can Still Leave You 28 Replacements Short
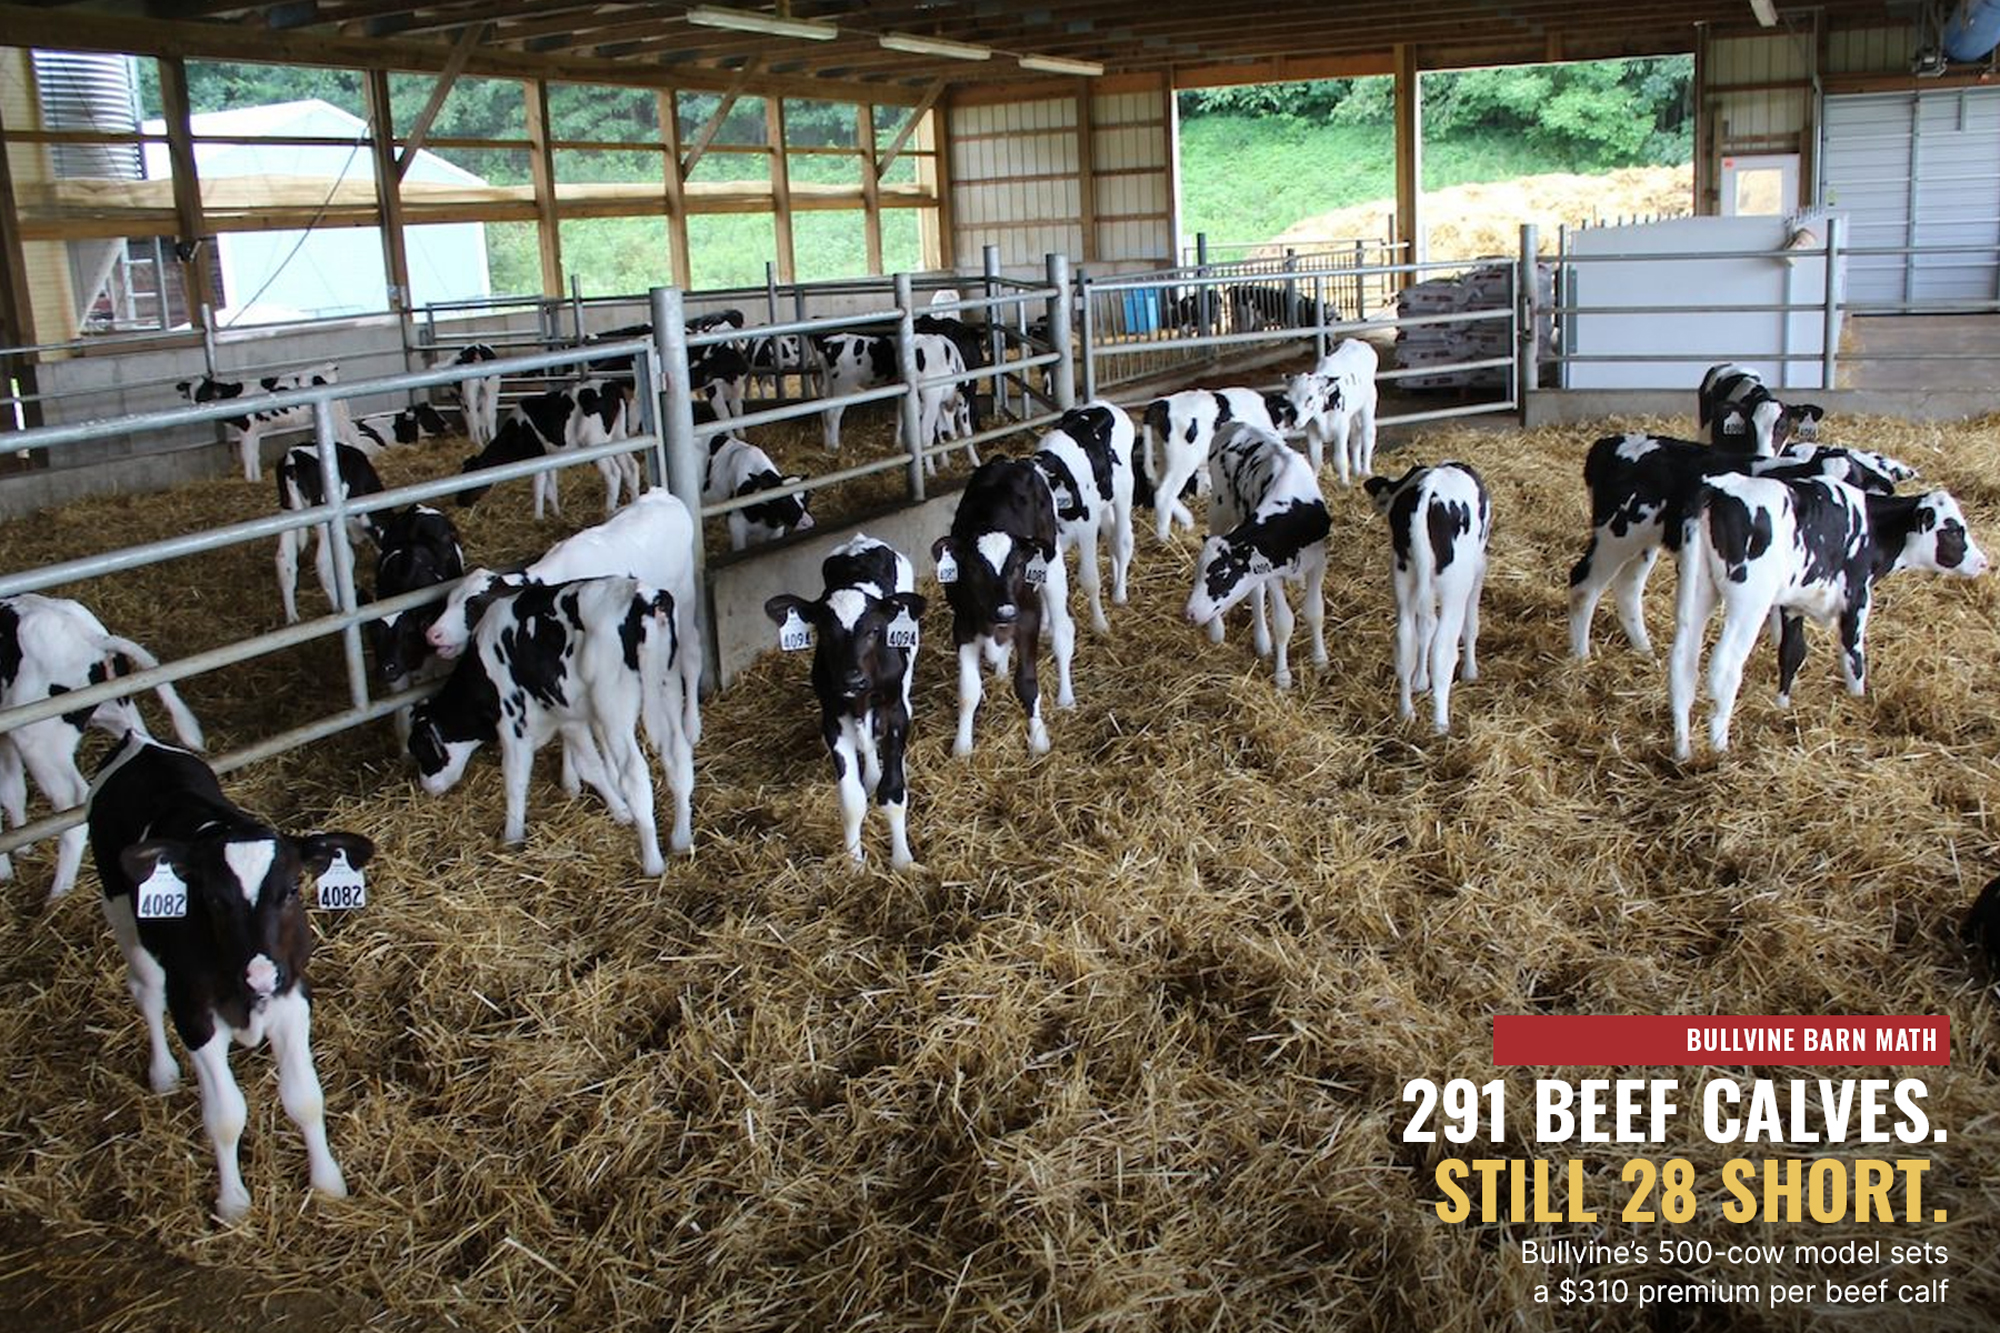
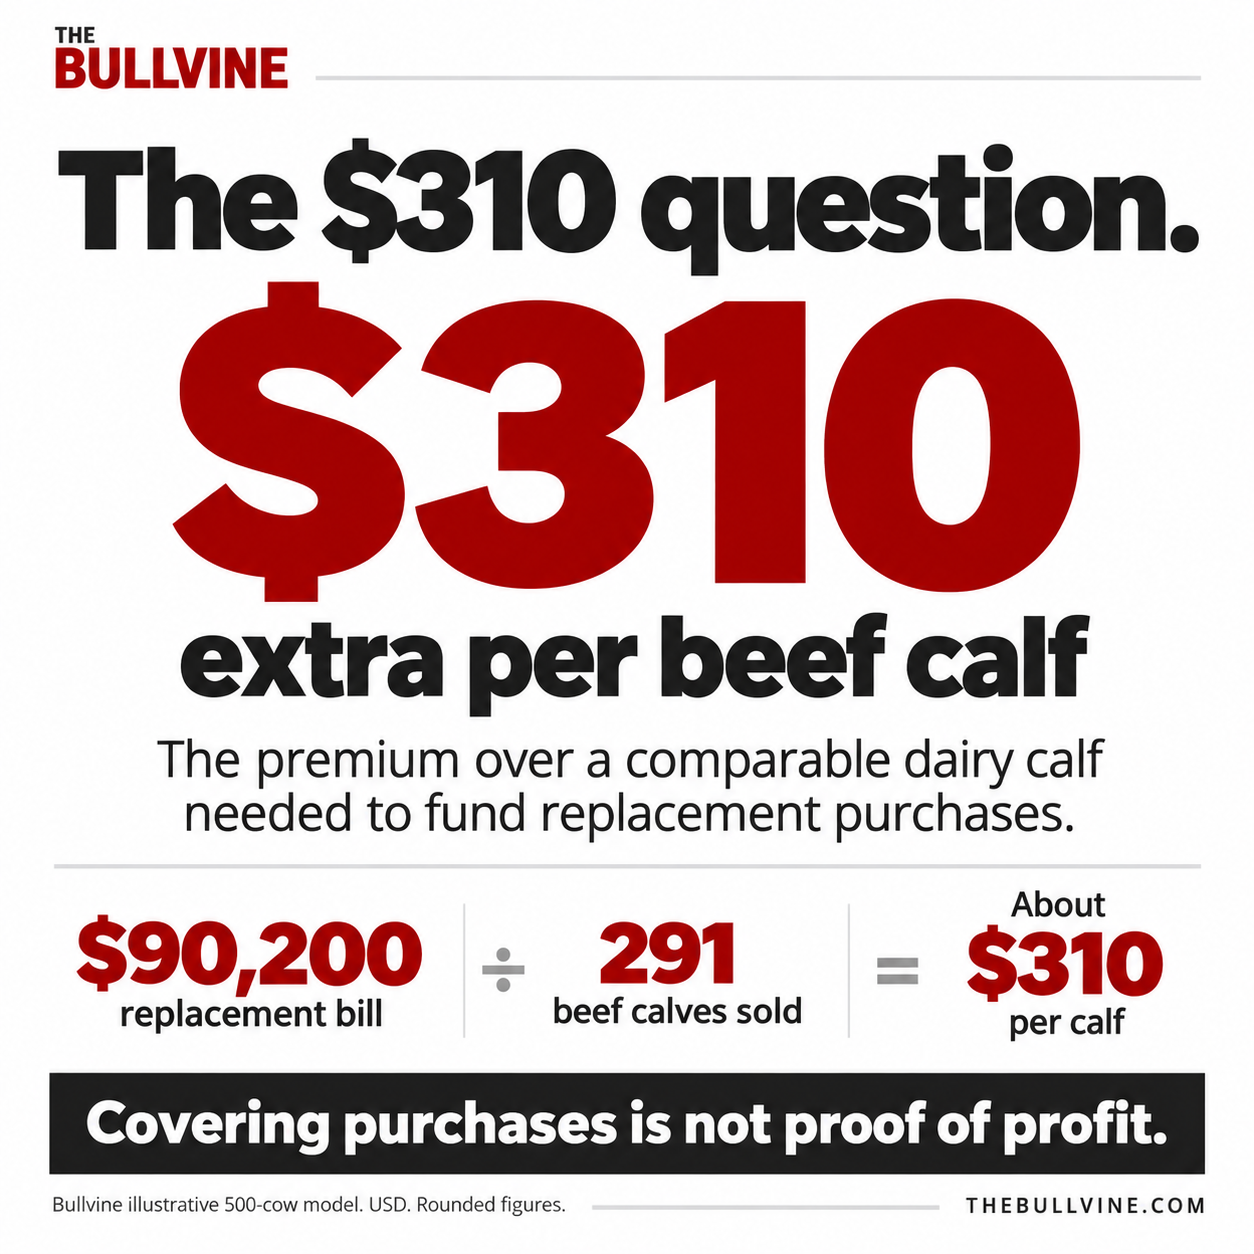
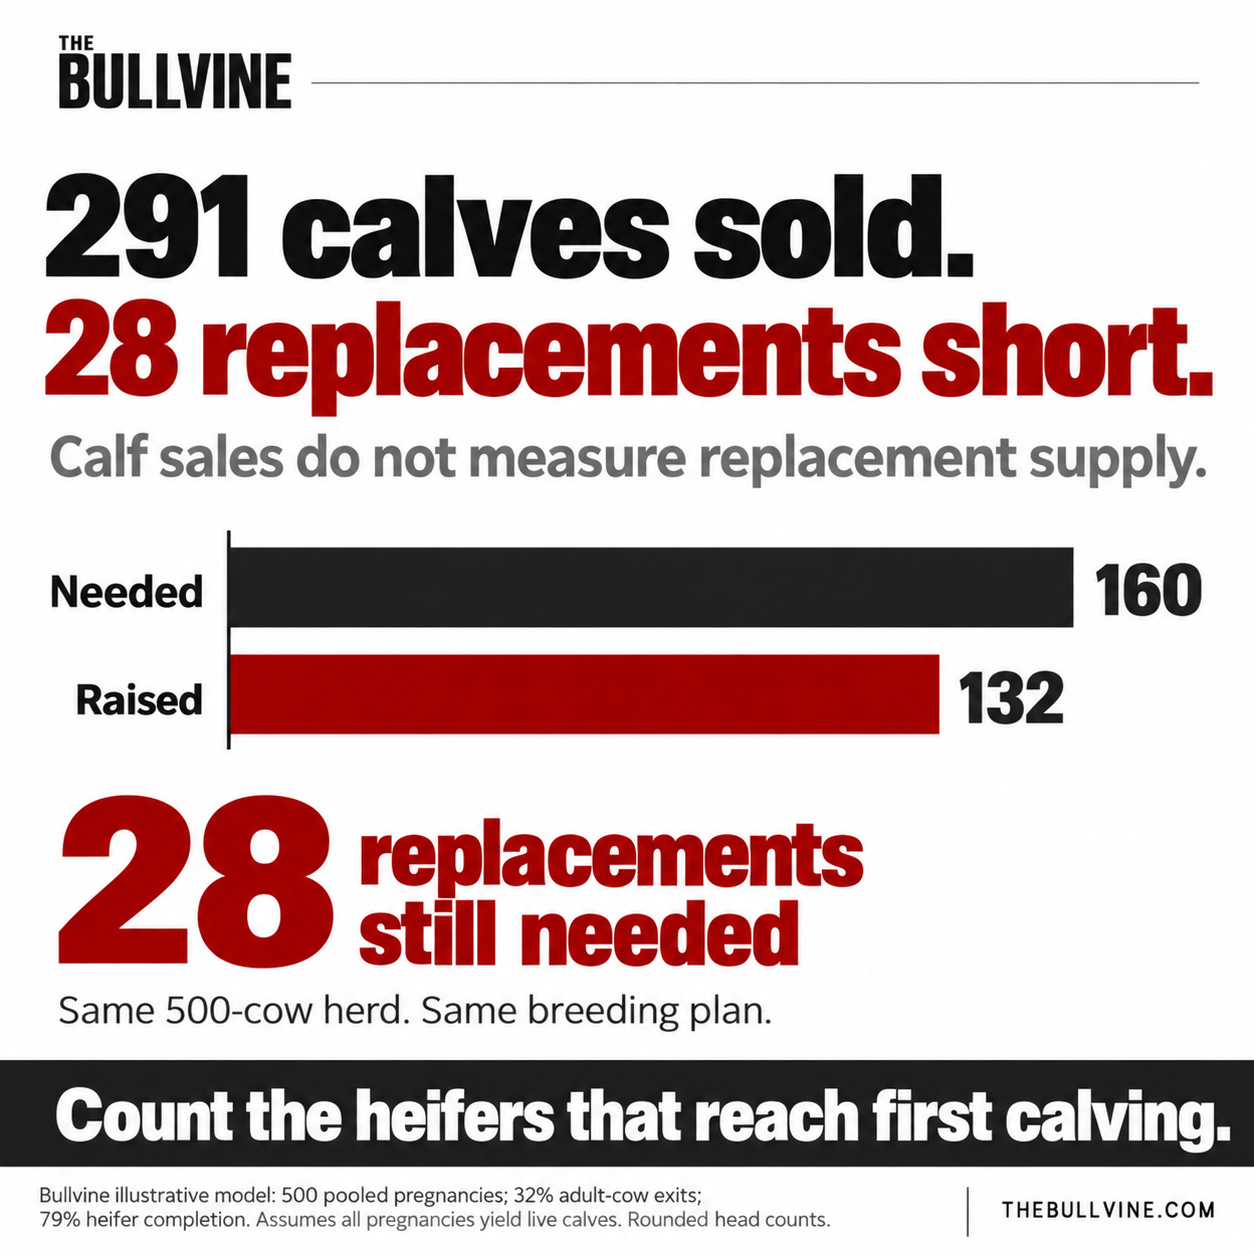
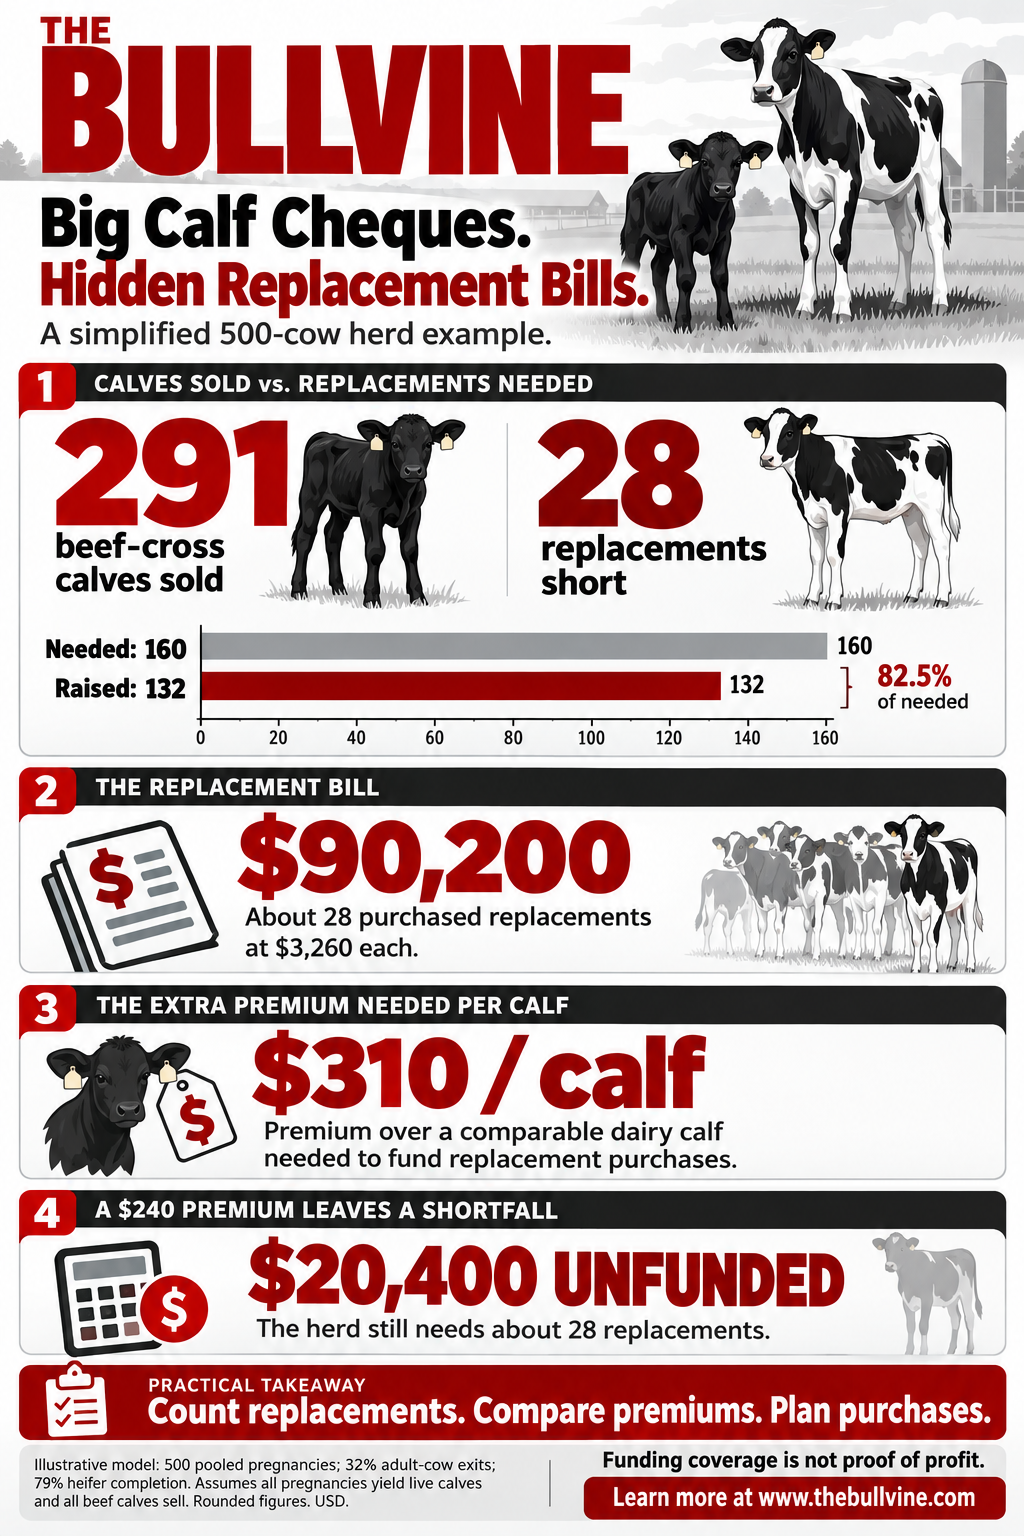
Put 55% of services into beef semen on a 500-cow dairy and Bullvine’s model produces roughly 291 beef-cross calves to sell. It also leaves the herd about 28 replacements short. At USDA’s July 2026 replacement price of $3,260, buying those animals costs about $90,200. To cover that bill, each calf sold has to bring about $310 more than a comparable dairy calf.
The calf cheque arrives first
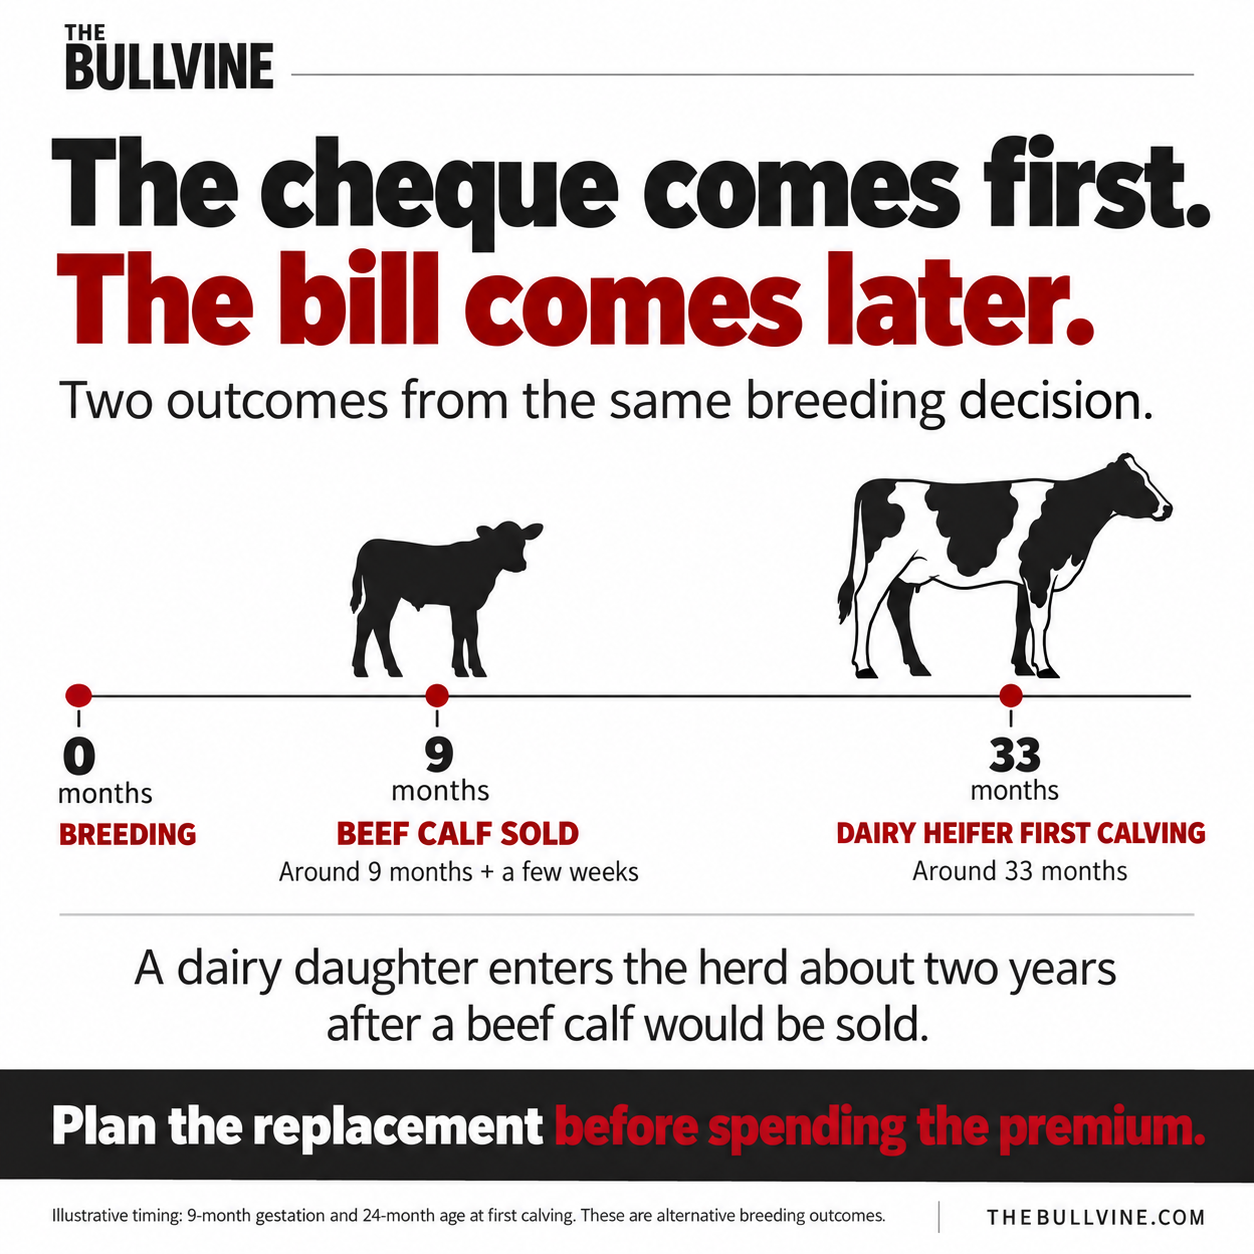
The useful question isn’t whether beef calves bring in money. They do, and fast. The question is what that money has to cover, because the calf cheque and the replacement bill from the same breeding rarely land in the same year’s books.
A beef-cross calf goes to market weeks after a birth that came about nine months after breeding. The dairy heifer that breeding could have produced wouldn’t reach the milking string for roughly another two years, at a 24-month age at first calving. The semen mix creates the gap. Time hides it.
The national cushion is thin
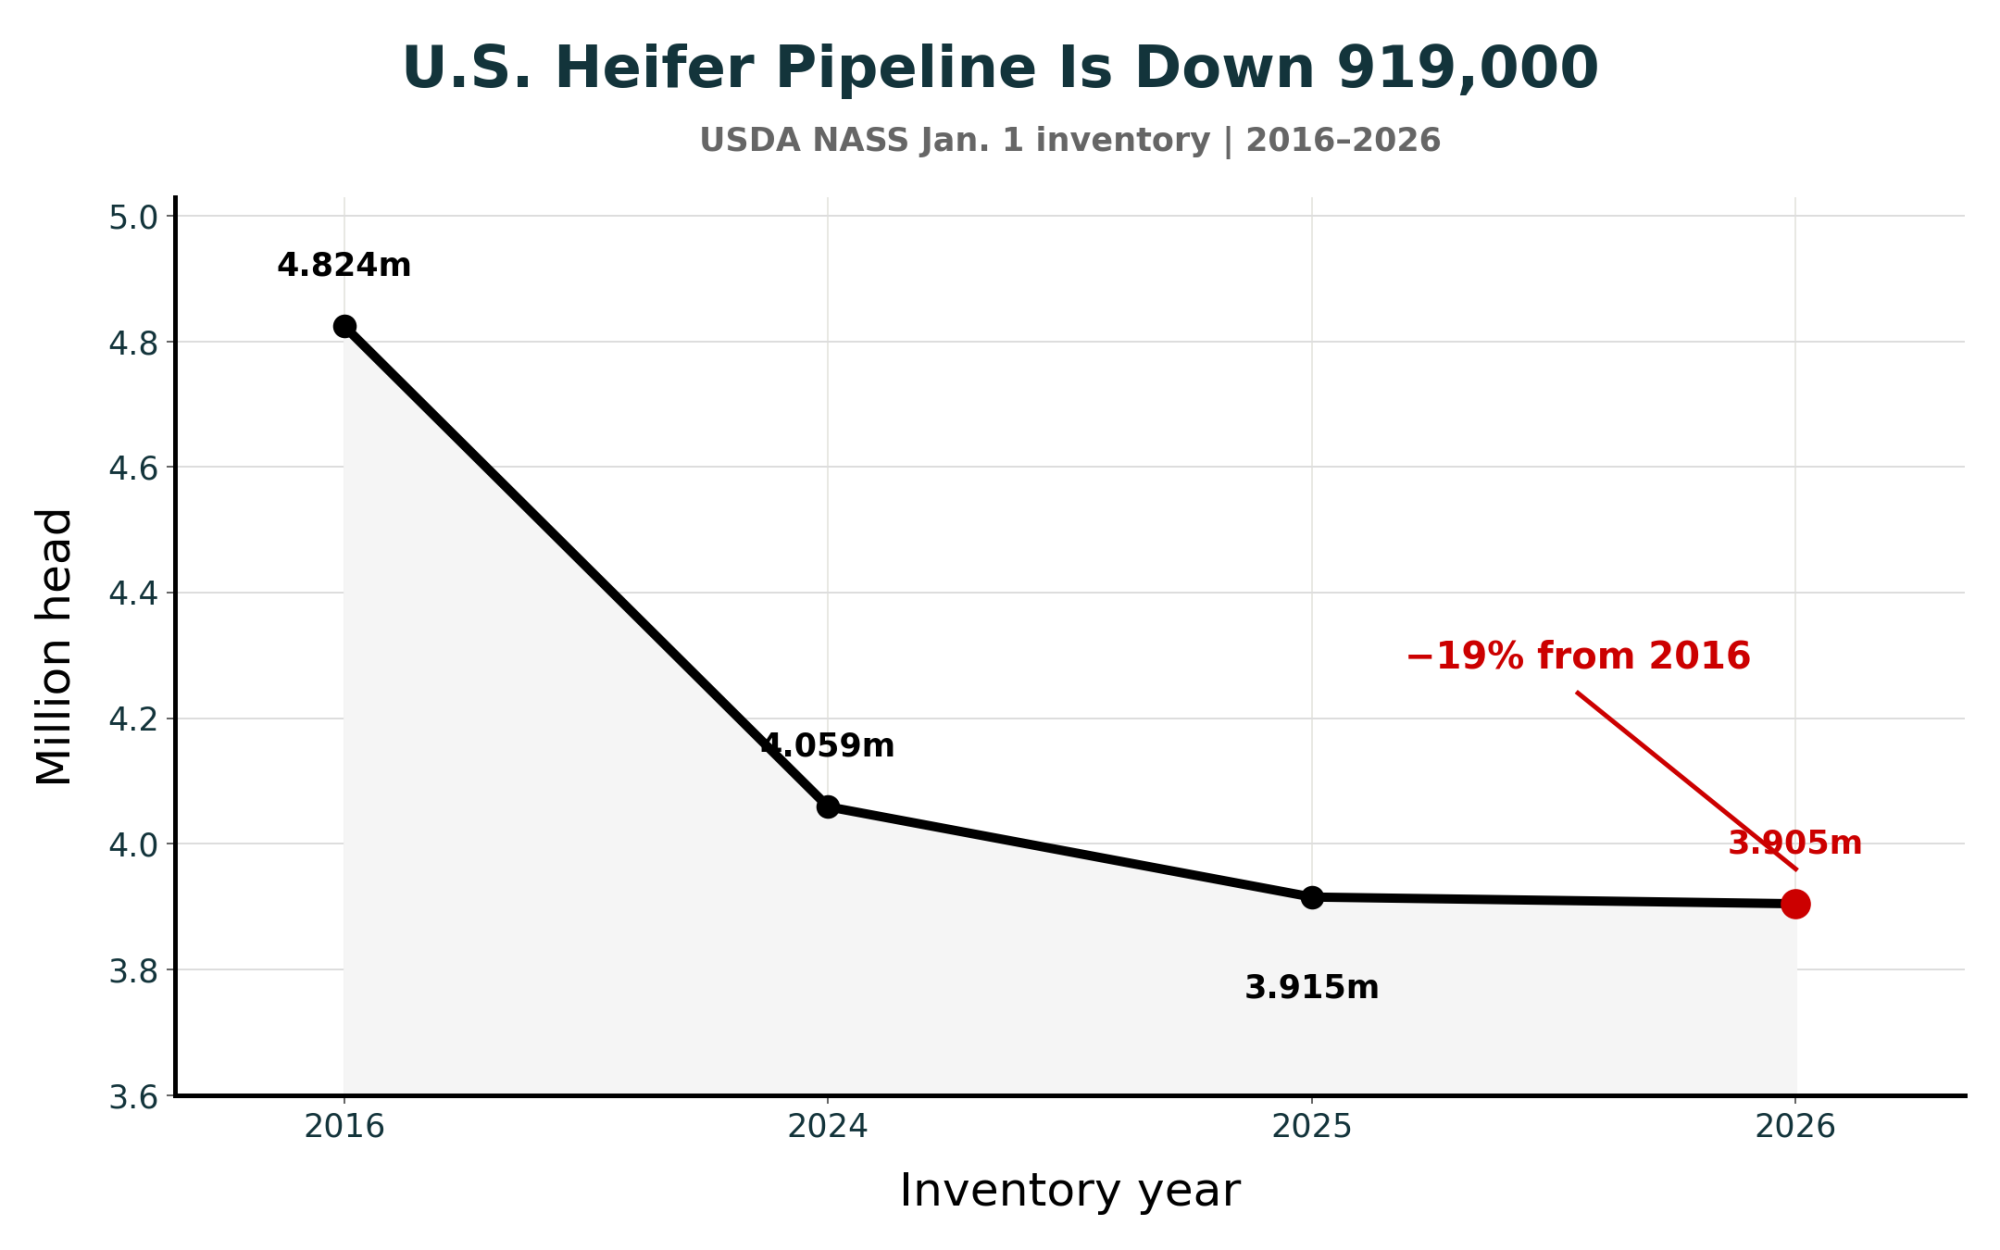
USDA NASS counted 3.9046 million heifers of 500 pounds and over kept for milk-cow replacement on January 1, 2026. A year earlier, the revised count was 3.9153 million. That’s about 919,000 fewer than the 4.824 million counted in January 2016. USDA’s July 2026 estimate rose to 3.6 million from 3.5 million. That’s a better midyear number, but it doesn’t refill the pipeline.
CoBank projected 357,490 fewer completed replacements in 2025 and another 438,844 fewer in 2026. It then projected a 285,387-head improvement in 2027, driven by 425,454 more heifers from sexed semen and partly offset by 140,067 fewer from conventional dairy semen. NAAB reported 10.6 million sexed dairy units, 8.1 million beef-on-dairy units and 6.0 million conventional dairy units sold domestically in 2025. For any one herd, the national picture comes down to two things: what replacements cost and whether they’re available when it has to buy.
The example’s boundaries
This is a simplified 500-cow herd in steady state. The 500 cows are adult animals, milking and dry. The herd needs 500 pregnancies a year, pooled across cows and maiden heifers under one assumed split of services. The math compares illustrative annual flows. It doesn’t track the herd’s age structure or the heifers already in the pipeline.
BULLVINE MATH: inputs
| Input | Central assumption |
| Annual cull and death rate | 32% |
| Share of services: sexed dairy | 35% |
| Share of services: conventional dairy | 10% |
| Share of services: beef | 55% |
| Conception: sexed / conventional / beef | 36% / 40% / 42% |
| Female rate: sexed / conventional | 90% / 49% |
| Live dairy heifer to first calving | 79% |
| Replacement price | $3,260 (USDA NASS, July 2026) |
The 79% completion rate comes from Mike Overton of Zoetis. It’s the median across 85 commercial U.S. herds, drawn from Zoetis internal data. Most herds landed between 74% and 84%, and herds raising heifers for other operations were left out. Overton presented the figures as descriptive data, not targets. CoBank used 79% in its forecast too. The conception rates and the conventional female rate are Bullvine assumptions.
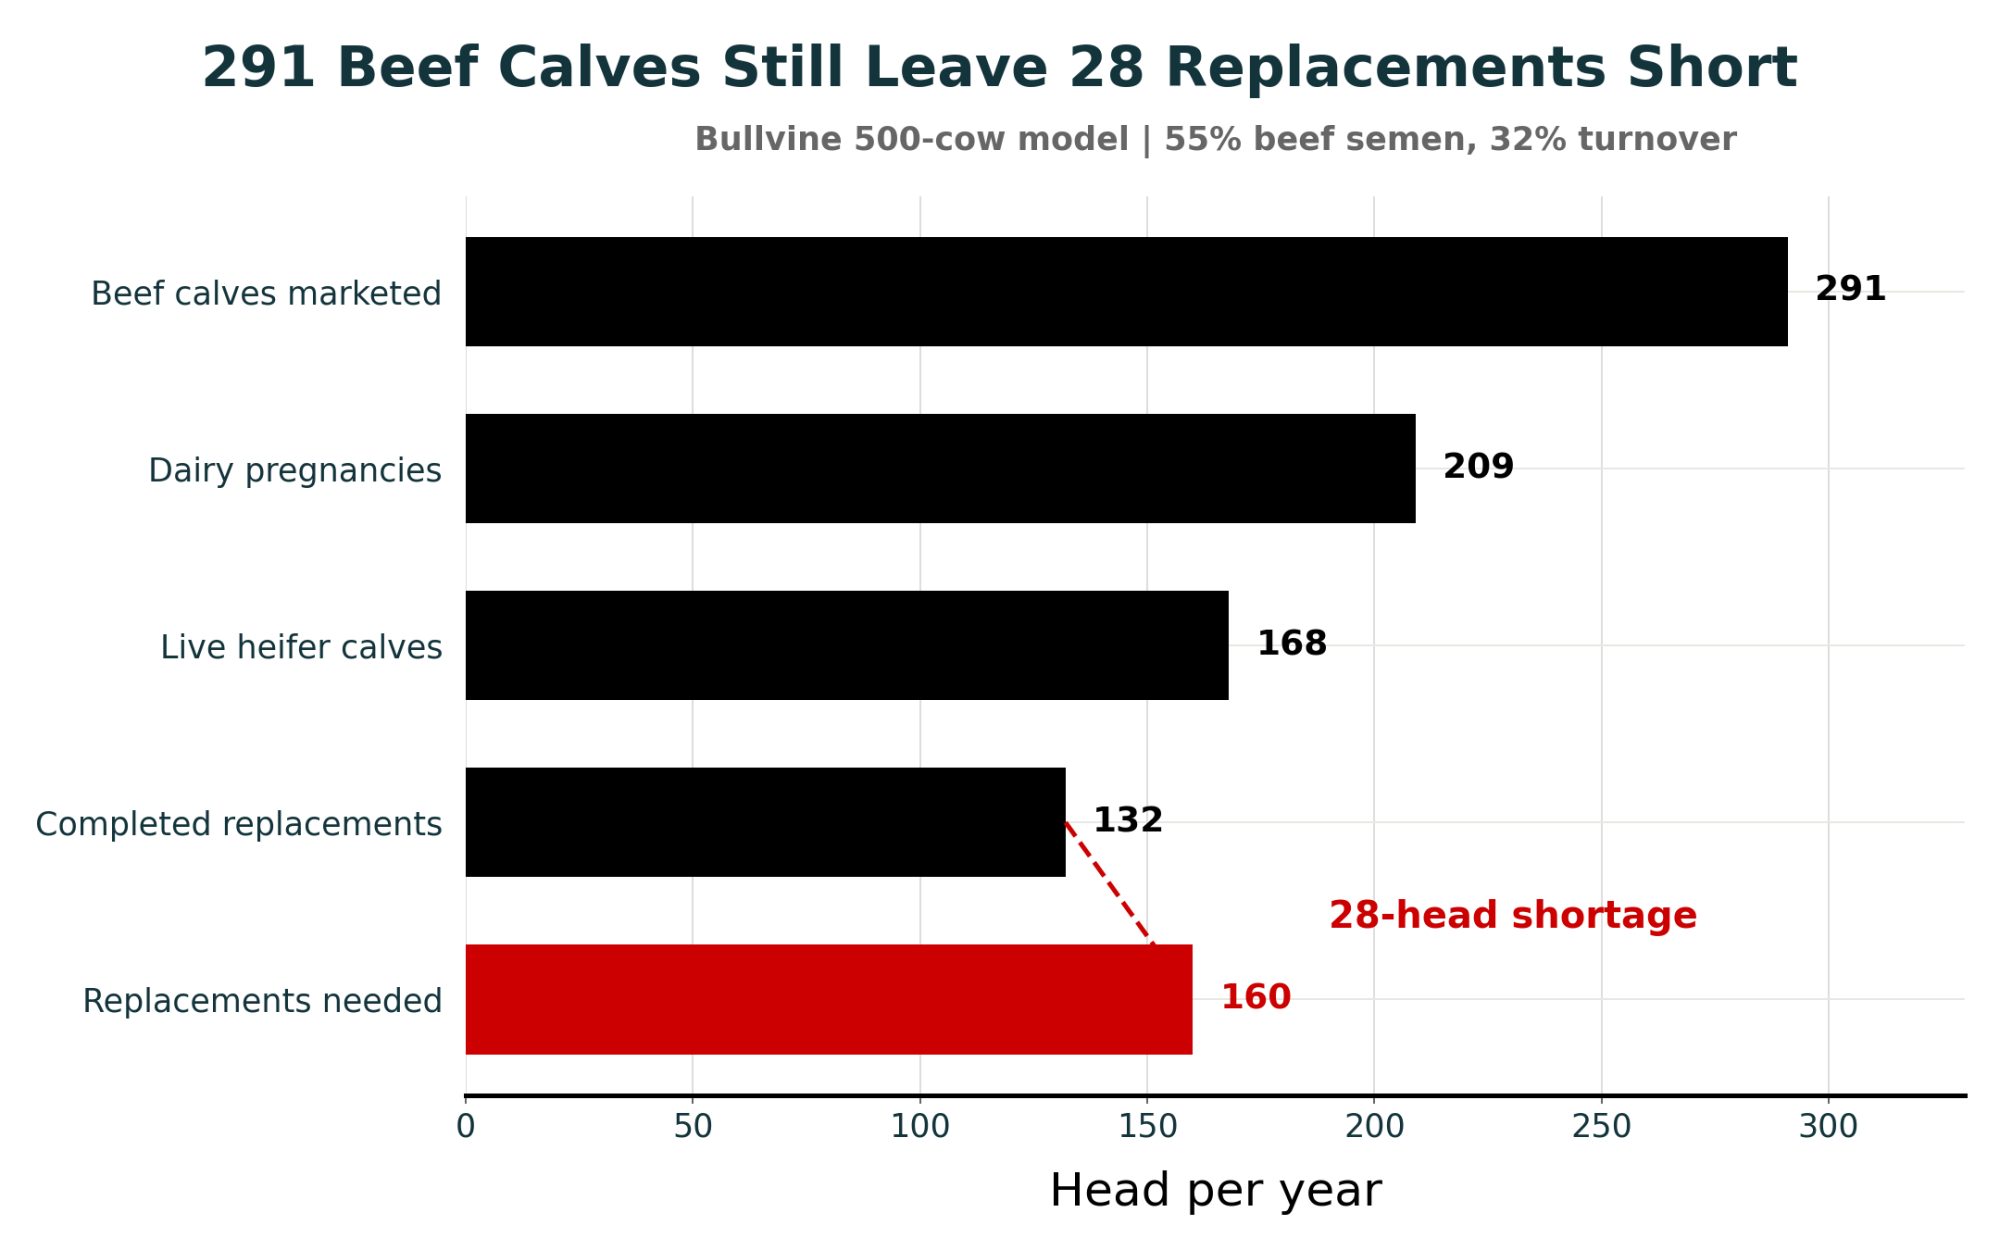
What the model produces
The model treats every pregnancy as a live calf and every beef-cross calf as sold. That’s optimistic at both stages, so the counts below lean high. Overton’s data puts stillbirths at about 2–4% depending on lactation, which this model ignores.
| BULLVINE MATH: 500 cows | Expected number |
| Services needed (weighted conception 39.7%) | 1,259 |
| Sexed dairy pregnancies | 159 |
| Conventional dairy pregnancies | 50 |
| Beef-cross calves marketed | 291 |
| Live dairy heifer calves | 168 |
| Completed replacements | 132 |
| Replacements needed (32% of 500) | 160 |
| Physical shortage | 28 |
The same assumptions scale in a straight line: 17 short with 175 beef calves at 300 cows, and 55 short with 582 calves at 1,000 cows.
What the calf has to earn
The Funding Threshold
At USDA’s July 2026 price of $3,260 a head, buying the 27.7-head replacement gap (about 28 animals) costs about $90,200. Spread across 291 marketed beef calves, each calf has to bring about $310 more than a comparable dairy calf just to cover those replacement purchases.
Allocation per calf = replacement purchase requirement ÷ beef-cross calves marketed
($90,200 ÷ 291 calves ≈ $310 per calf)
Bullvine Math. Clearing $310 means calf revenue covers the replacements bought. It doesn’t prove the beef program earns more than raising those heifers would.
The $310 is a premium over a comparable dairy calf, not a gross sale price. A herd that tracks only the beef-cross cheque can’t tell whether it cleared the bar.
Turnover can erase the replacement cushion
Hold the service mix fixed and change only turnover. On a 500-cow dairy, every percentage point means five more replacements.
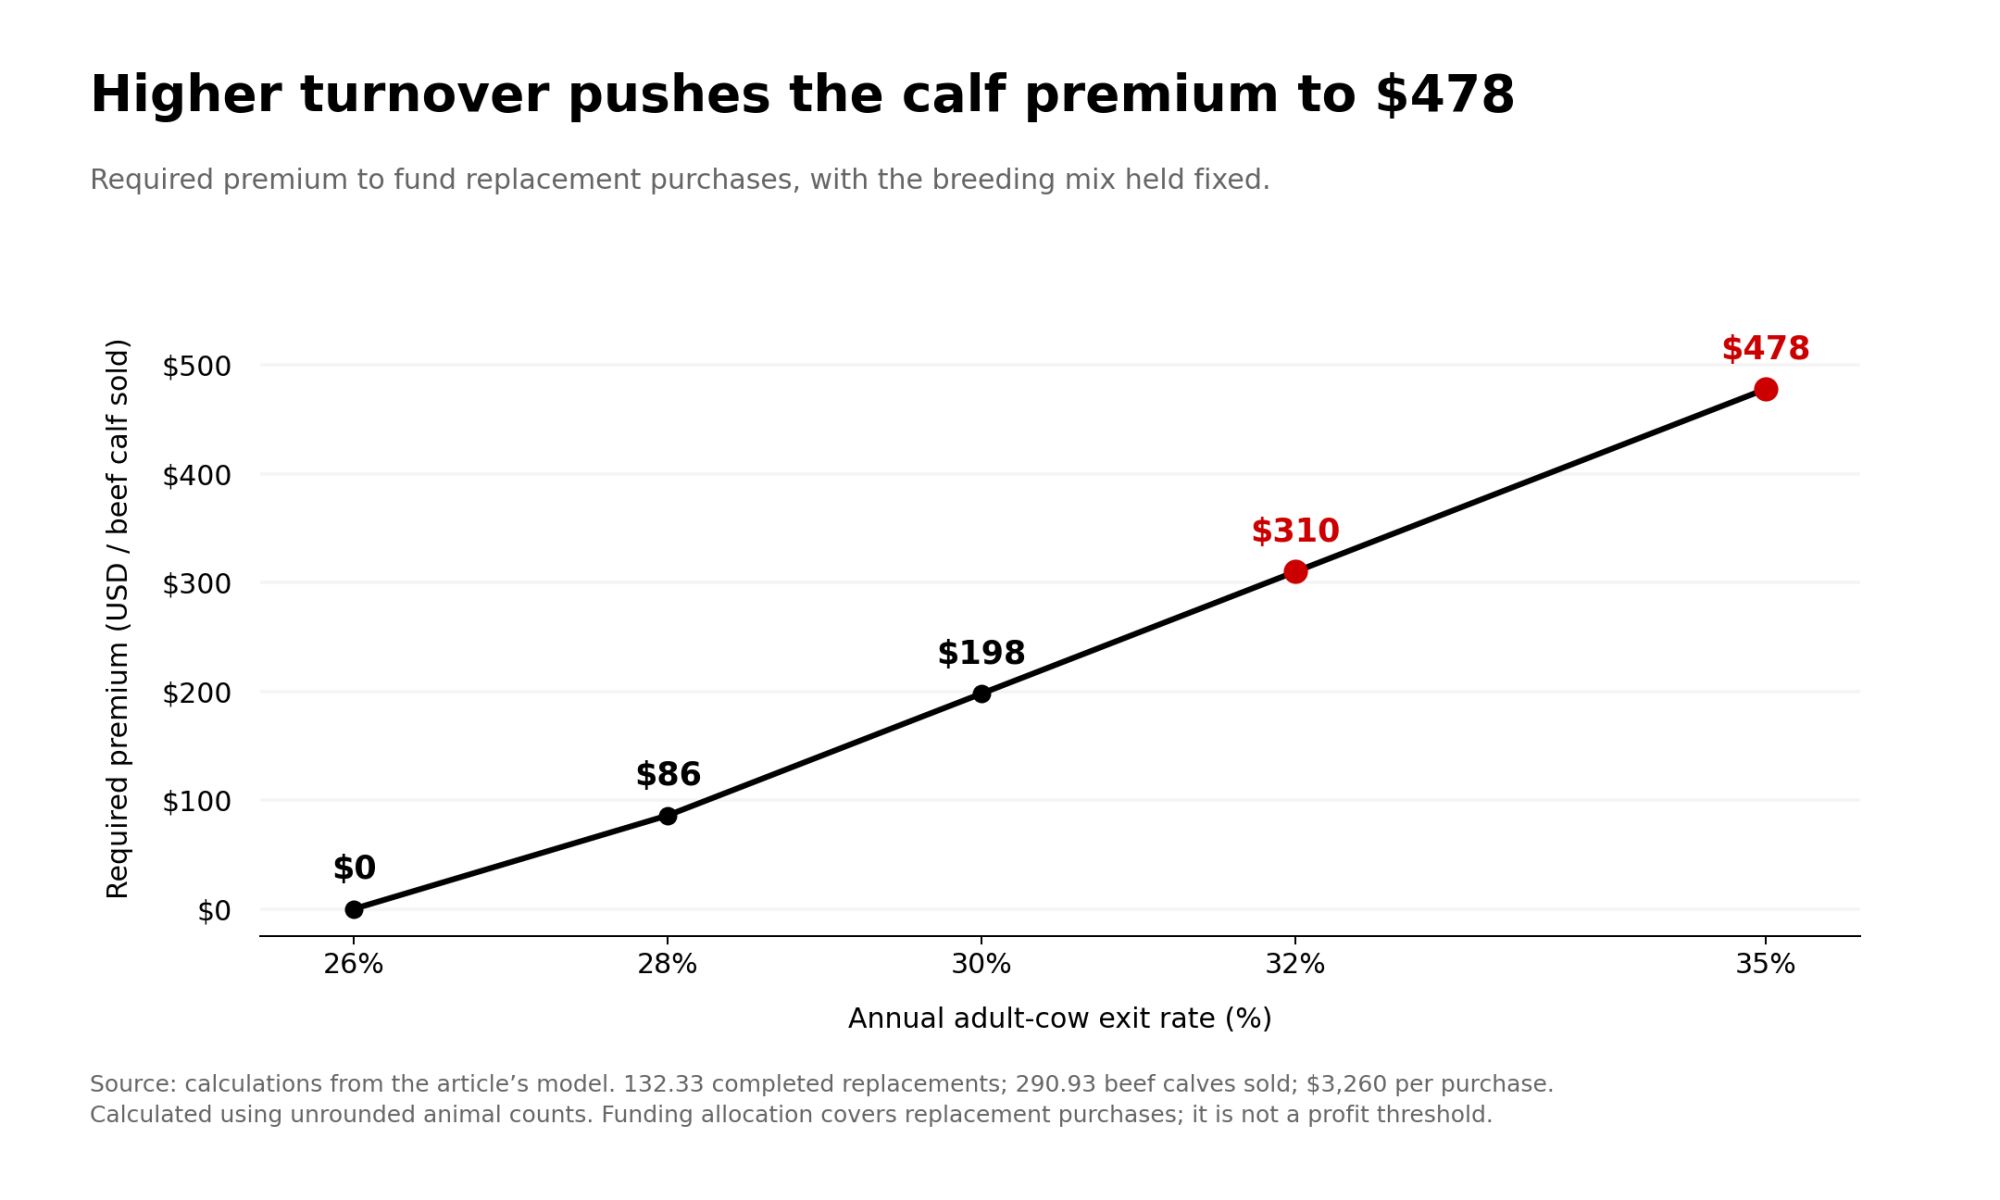
| Cull and death rate | Needed | Produced | Gap | Allocation per calf at $3,260 |
| 26% | 130 | 132 | 2 surplus | None |
| 28% | 140 | 132 | 8 | About $86 |
| 30% | 150 | 132 | 18 | About $198 |
| 32% | 160 | 132 | 28 | About $310 |
| 35% | 175 | 132 | 43 | About $479 |
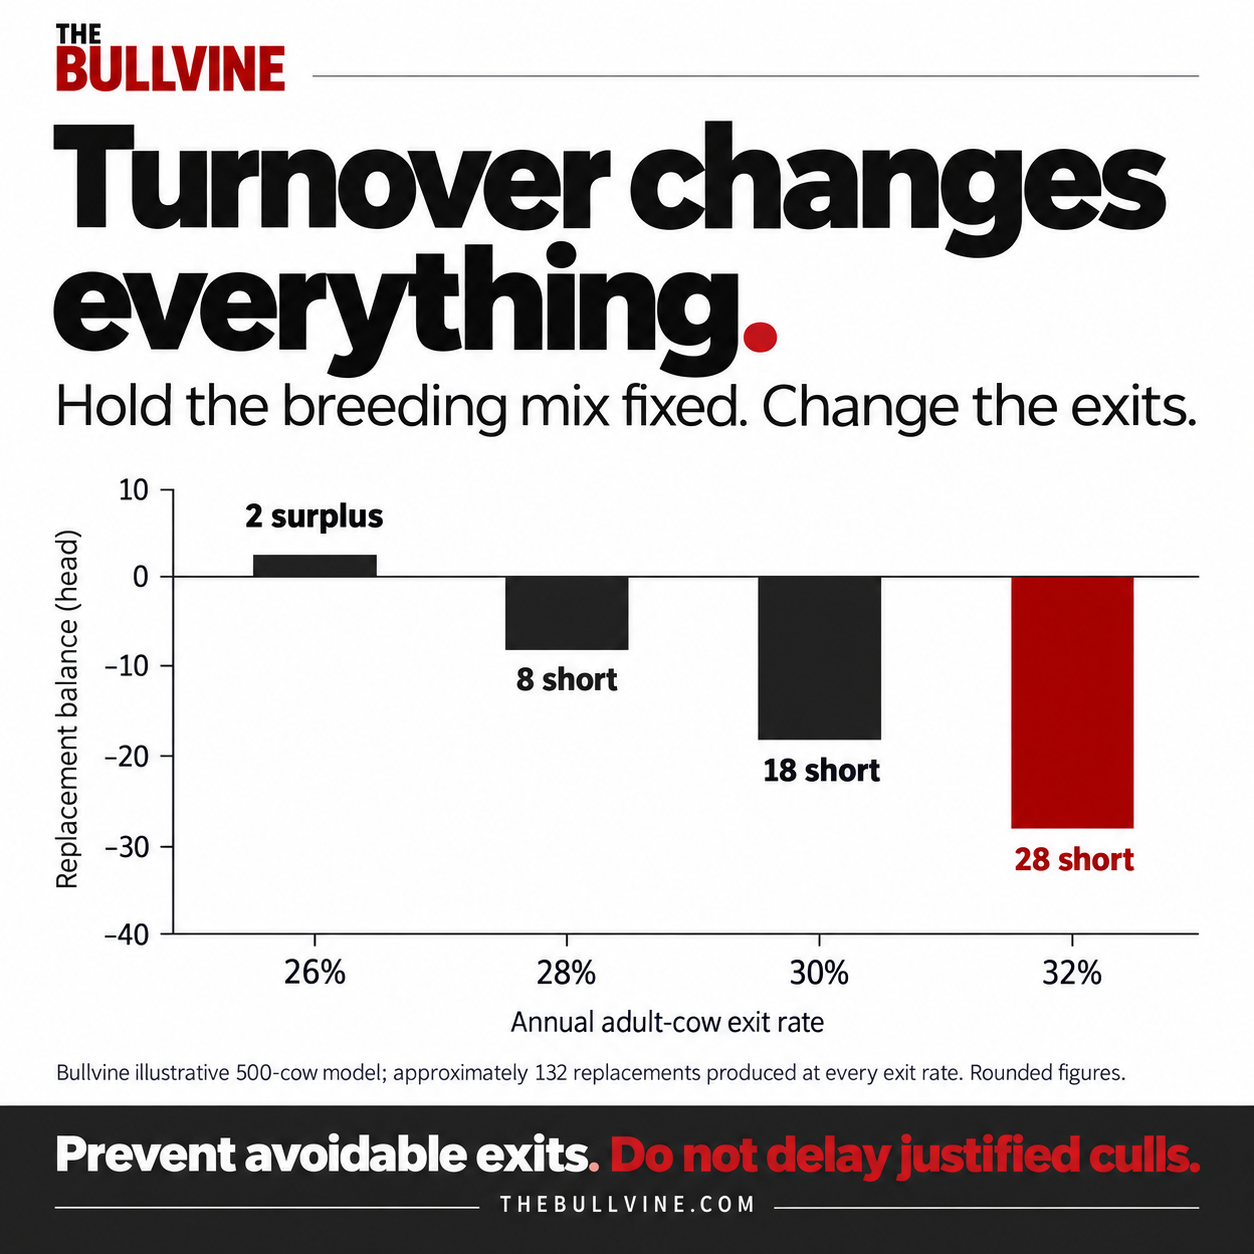
A breeding plan that works at 26% turnover fails at 32% without changing a single straw. Here’s each lever tested on its own, with everything else held at the central case:
| BULLVINE MATH: separate scenarios | Low | Central | High |
| Cull and death rate (26% / 32% / 35%) | 2 surplus | 28 short | 43 short |
| Completion (90% / 79% / 70%) | 9 short | 28 short | 43 short |
| Beef share, replacing conventional (45% / 55% / 65%) | 7 short | 28 short | 48 short |
Preventing an exit isn’t the same as delaying a justified cull. Overton modelled a herd that cut its replacement rate from 38% to 34% by running short of heifers, with no management improvements. Its worst cows stayed about 113 days longer. The lost milk cost about $62 per cow slot a year against $43 saved on replacements, a net loss of about $19 per slot.
CoBank counted 611,600 fewer dairy cows sent to slaughter from Labor Day 2023 through July 2025 than in comparable earlier periods. It also warned that an older herd brings more fresh-cow disease, metabolic trouble and fertility costs. Cut avoidable exits like deaths, early-lactation losses and preventable disease. Don’t stop culling.
Four ways to close the $20,400 funding gap
Suppose the herd’s realized premium comes in at $240. Across 291 calves, that brings in about $69,800 against the $90,200 bill.
That leaves about $20,400 uncovered. At USDA’s July 2026 price of $3,260, that’s the funding equivalent of about 6.3 replacements. The physical shortage hasn’t shrunk. The herd still has to find about 28 animals it didn’t raise. The $240 premium pays for roughly 21 of them, and the cash for the other six or so has to come from somewhere else.
- Negotiate the Premium: Raise the average premium over a comparable dairy calf by about $70, from $240 to $310.
- Plug the Leaks (Exits): Cut about six to seven exits, or roughly 1.25 percentage points of turnover. Six fewer exits save $19,560, which leaves about $800 uncovered.
- Optimize Completion: Raise live-heifer-to-first-calving completion from 79% to roughly 83%. That’s about six or seven more completed heifers from the same cohort. Count only gains from fewer deaths and failed pregnancies. Overton warns that a higher completion rate can just mean a herd is keeping poor-quality heifers.
- Adjust the Semen Mix: Moving ten beef pregnancies to sexed dairy takes roughly four extra services and adds about seven completed replacements. It also costs ten beef calves.
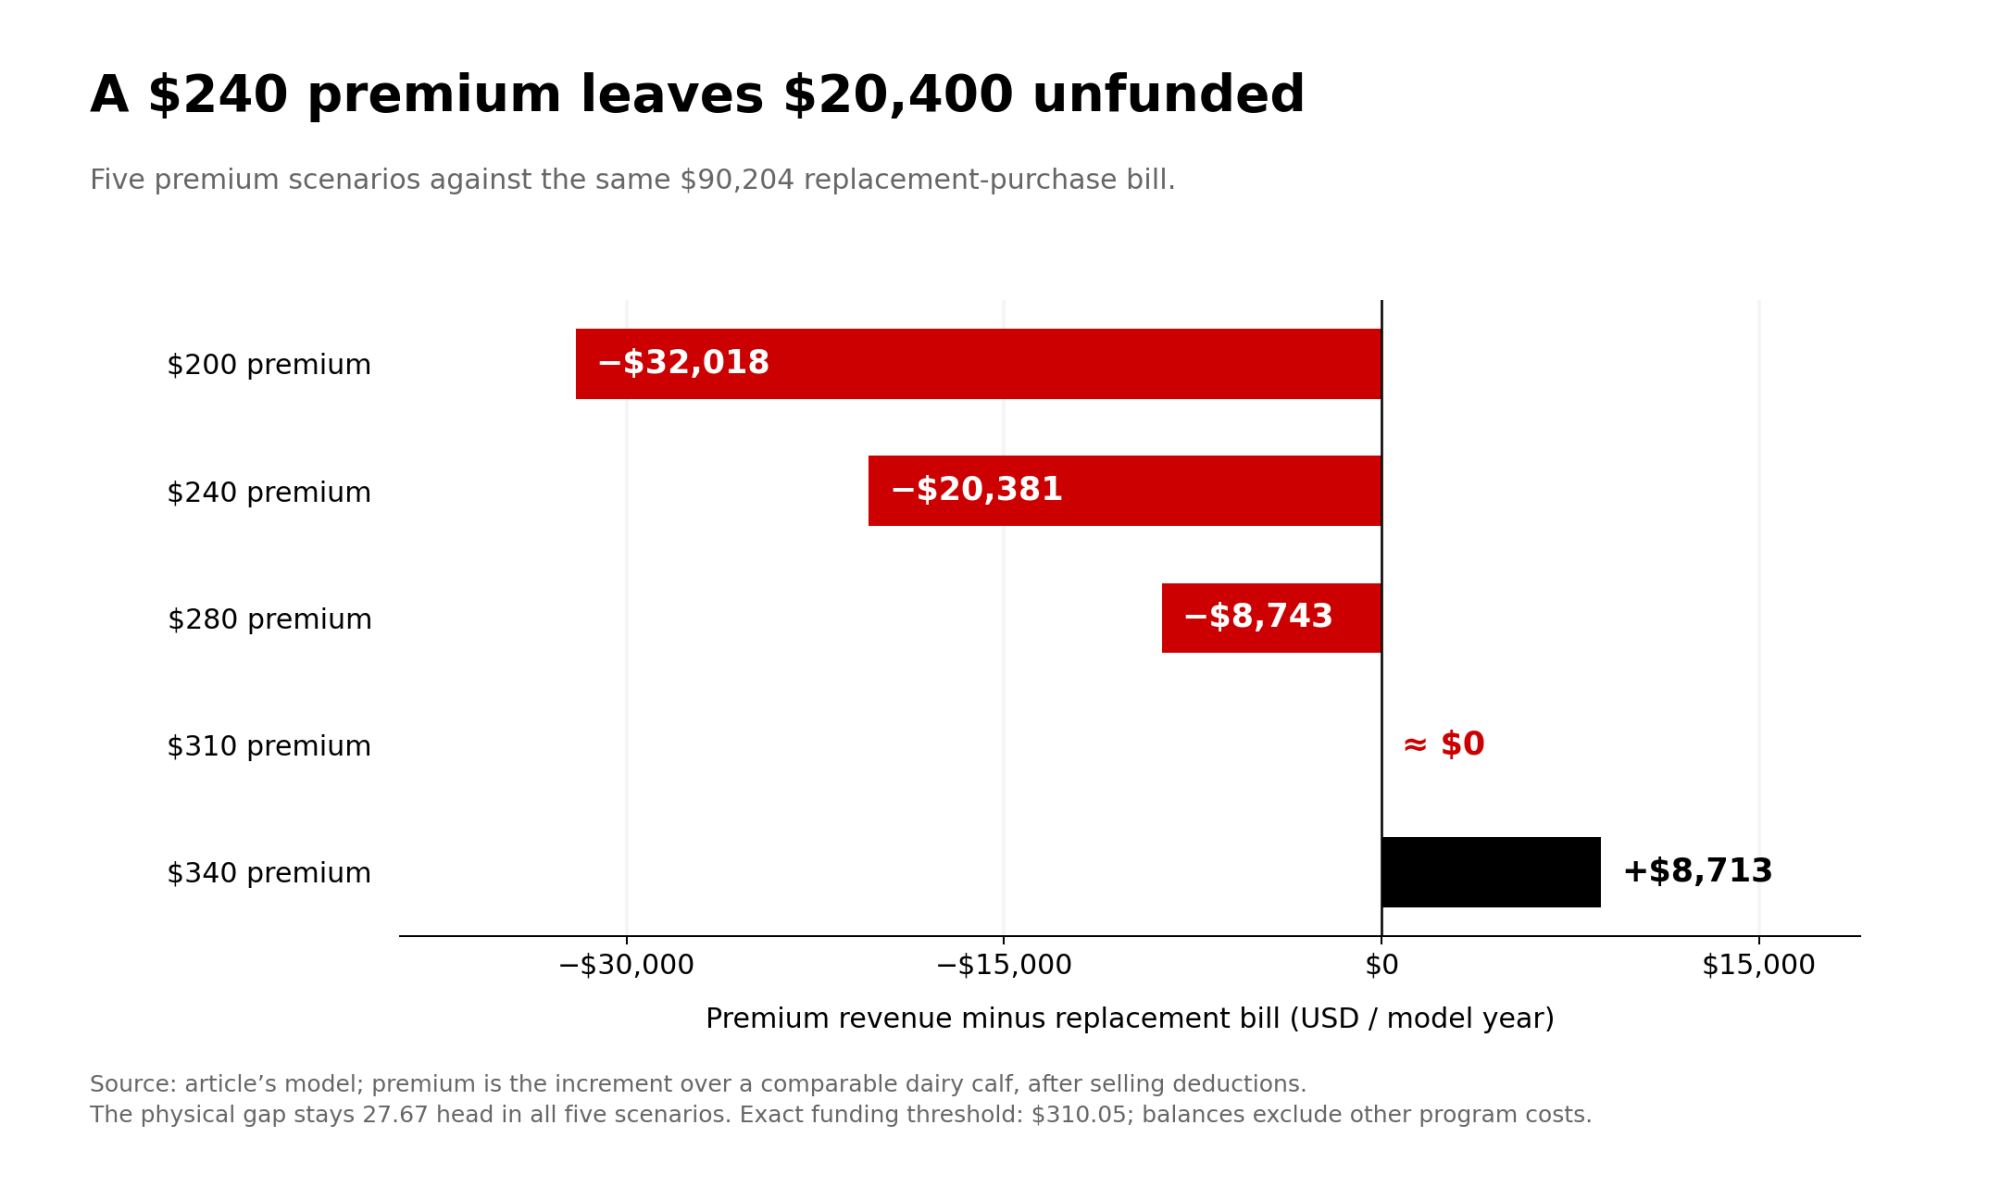
All four are Bullvine Math, based on the 500-cow central model.
The levers run on different clocks. A semen change can’t put a springer in the pen next spring. That shortage gets handled with cows already in the barn, heifers already on the ground and planned purchases.
Plan backward from first calvings, with a cushion
Start with the exits you forecast, then add a cushion. Overton’s method starts with the herd’s average replacement need, then adds one standard deviation of its 10-year replacement rate and a cushion for needs nobody saw coming. In his 1,000-cow example, that turned 370 heifers into a target of 420 that calve.
BULLVINE MATH, using Overton’s method: For the 500-cow herd, start with 160. Add 10 for year-to-year swings, which uses his example’s 2% standard deviation as an assumption. Add a 3% cushion of 15. The target becomes 185 heifers that calve. Against 132 produced, the planning gap is about 53, not 28. The headline keeps 28 because it’s the conservative figure. The 53 is the planning number.
Next, divide by your own completion rate. At 79%, 185 heifers that calve takes about 234 live dairy heifer calves. Work each cow or heifer group and semen type separately. For each group, multiply services by conception rate, live-birth rate, female rate and completion rate. Then add the groups’ expected replacements and check the total against the target. Don’t divide the whole requirement by each semen type’s female rate, because that counts the same heifers twice. Overton’s own advice is to use enough sexed semen to make a 3–5% heifer surplus.
The records that answer it
You can’t calculate this from the semen invoice. You need the cull report, the heifer report, the replacement invoices and the calf settlements on the same desk. The herd software knows the biology, and the bookkeeper knows the money. The test works when those two files meet.
| Record | Minimum needed | What breaks the test |
| Cow inventory | Monthly counts for 12 months | Only a year-end count in a changing herd |
| Exits | Date and destination for every cow: dairy sale, slaughter, death | Deaths or dairy sales left out |
| Breeding cohort | Service date and semen type | Beef and dairy services can’t be separated |
| Heifer pipeline | Live birth ID linked to first-calving date | Births can’t be tied to first calvings |
| Beef-calf settlements | Head count and net proceeds | Pregnancies counted in place of calves sold |
| Dairy-calf comparator | Same-week net value, farm or market report | Gross beef price treated as the premium |
| Replacement invoices | Head, price, freight and date | No invoice and no written quote |
| Expansion | Opening and closing cow inventory | Growth animals counted as turnover |
Turnover should be exits divided by average cow inventory or cow-years at risk. Heifer records split across paper, spreadsheets and software are a common weak point. Overton suggests using a two- or three-year window to set historical heifer needs, not a single year. You can work around a missing calf weight. You can’t work around a missing denominator.
Covering the bill isn’t the same as winning
Clearing $310 shows the calf money pays for the replacements bought. It doesn’t show the beef program earns more than raising those heifers would. A full comparison counts the future rearing costs avoided by not raising a heifer, plus semen cost, freight, financing and the health risk of bought animals. Money already spent on heifers on the ground isn’t a saving.
Overton ran that fuller comparison for the last 100 pregnancies in a 2,500-cow herd that had room to raise extra heifers. His assumptions were a $1,300 beef-cross calf, a $3,200 springer and a $1,700 marginal raising cost. On calf value at birth, beef looked about $50,000 better. Once he counted the springers that would have to be bought later, sexed semen came out ahead. Those are his model inputs, not market prices. They do show the calf cheque alone can point the wrong way.
What this means for your operation
- Pull four records for one closed cohort before the next semen order: exits, live heifers to first calving, net calf settlements and replacement invoices.
- Figure your own allocation per calf. Divide what you’ll spend buying replacements by the beef-cross calves you sold, then compare it with your net premium over a comparable dairy calf.
- Test turnover at 28%, 32% and 35%. In this model, the allocation runs from about $86 to $310 to $479 per calf.
- Plan to a target with a cushion, not to last year’s exits. In this model, adding a cushion moves the 500-cow target from 160 to 185.
- Turn any premium miss into head, not percentages. A $70 miss on a 500-cow herd is about 6.3 replacements’ worth of funding inside a 28-animal shortage.
- Recheck replacement prices on October 30 and November 30, 2026, when NASS’s next Agricultural Pricesreports are due.
If home-raised heifers won’t cover the need, start by deciding how many replacements you’ll buy on purpose, at a price and from a supplier you trust. Set the home-raised target from what’s left, work out the dairy pregnancies that target needs, and give beef the rest.
Run Your Numbers
Bullvine Pipeline Index Calculator: Plug in your herd size, heifers on hand, cull rate, sexed and beef breeding shares, and today’s replacement price. The calculator scores your replacement pipeline 0–100 and flags whether your beef program is drawing it down faster than it refills.
Complete references and supporting documentation are available upon request by contacting the editorial team at editor@thebullvine.com.
Learn More
- New Holland’s Beef-Cross Calves Topped UW–Madison’s $1,125 Test—at a $260 Premium — Tracks real-world sale barn data validating recent economic benchmarks. Breaks down why specific beef sire lines pull strong margins over Holstein controls while others flatline. Target the genetic traits that feedlots actually reward.
- 5-Year Historical Tracking Analysis of Elite Genomic Holstein Bulls — Benchmarks bovine genetic investments directly against alternative asset classes and U.S. dairy returns. Quantifies the long-term equity sacrificed when prioritizing immediate crossbred cash flow over building elite, highly efficient herd genetics for the future.
- The Consistency Advantage — Dismantles the assumption that peak milk alone dictates herd profitability. Follows the money on uniform lactation curves and reduced metabolic culling, proving how steadily producing cows systematically lower your replacement demand and slash overhead.
The Sunday Read Dairy Professionals Don’t Skip.

Every week, thousands of producers, breeders, and industry insiders open Bullvine Weekly for genetics insights, market shifts, and profit strategies they won’t find anywhere else. One email. Five minutes. Smarter decisions all week.