






February’s Class III benchmark ran 41.6¢/cwt higher at the same component prices, just from USDA’s new factors. Before you credit the sire or the ration, split production from pricing.
Key takeaways
- USDA’s new solids factors raise the Class III benchmark 41.6¢–58.5¢/cwt at the same component prices (Bullvine calculation, Jan–Oct 2026).
- On actual-component pay, that difference isn’t in your component dollars.
- Value both periods at common prices before crediting a sire or ration.
If you’re comparing Class III milk prices across December 2025, your comparison has a formula change built into it. That’s when USDA’s new skim-milk composition factors took effect, and those factors remain in use in USDA’s October 2026 class and component price announcement, released Nov. 4. At AMS’s monthly component prices, Bullvine calculates that the factor change alone added between 41.6¢/cwt (February) and 58.5¢/cwt (August) to the Class III benchmark in every month from January through October 2026. The calculation holds component prices constant and changes only the formula. It says nothing about how your herd performed.
What did USDA actually change?
What changed in December 2025
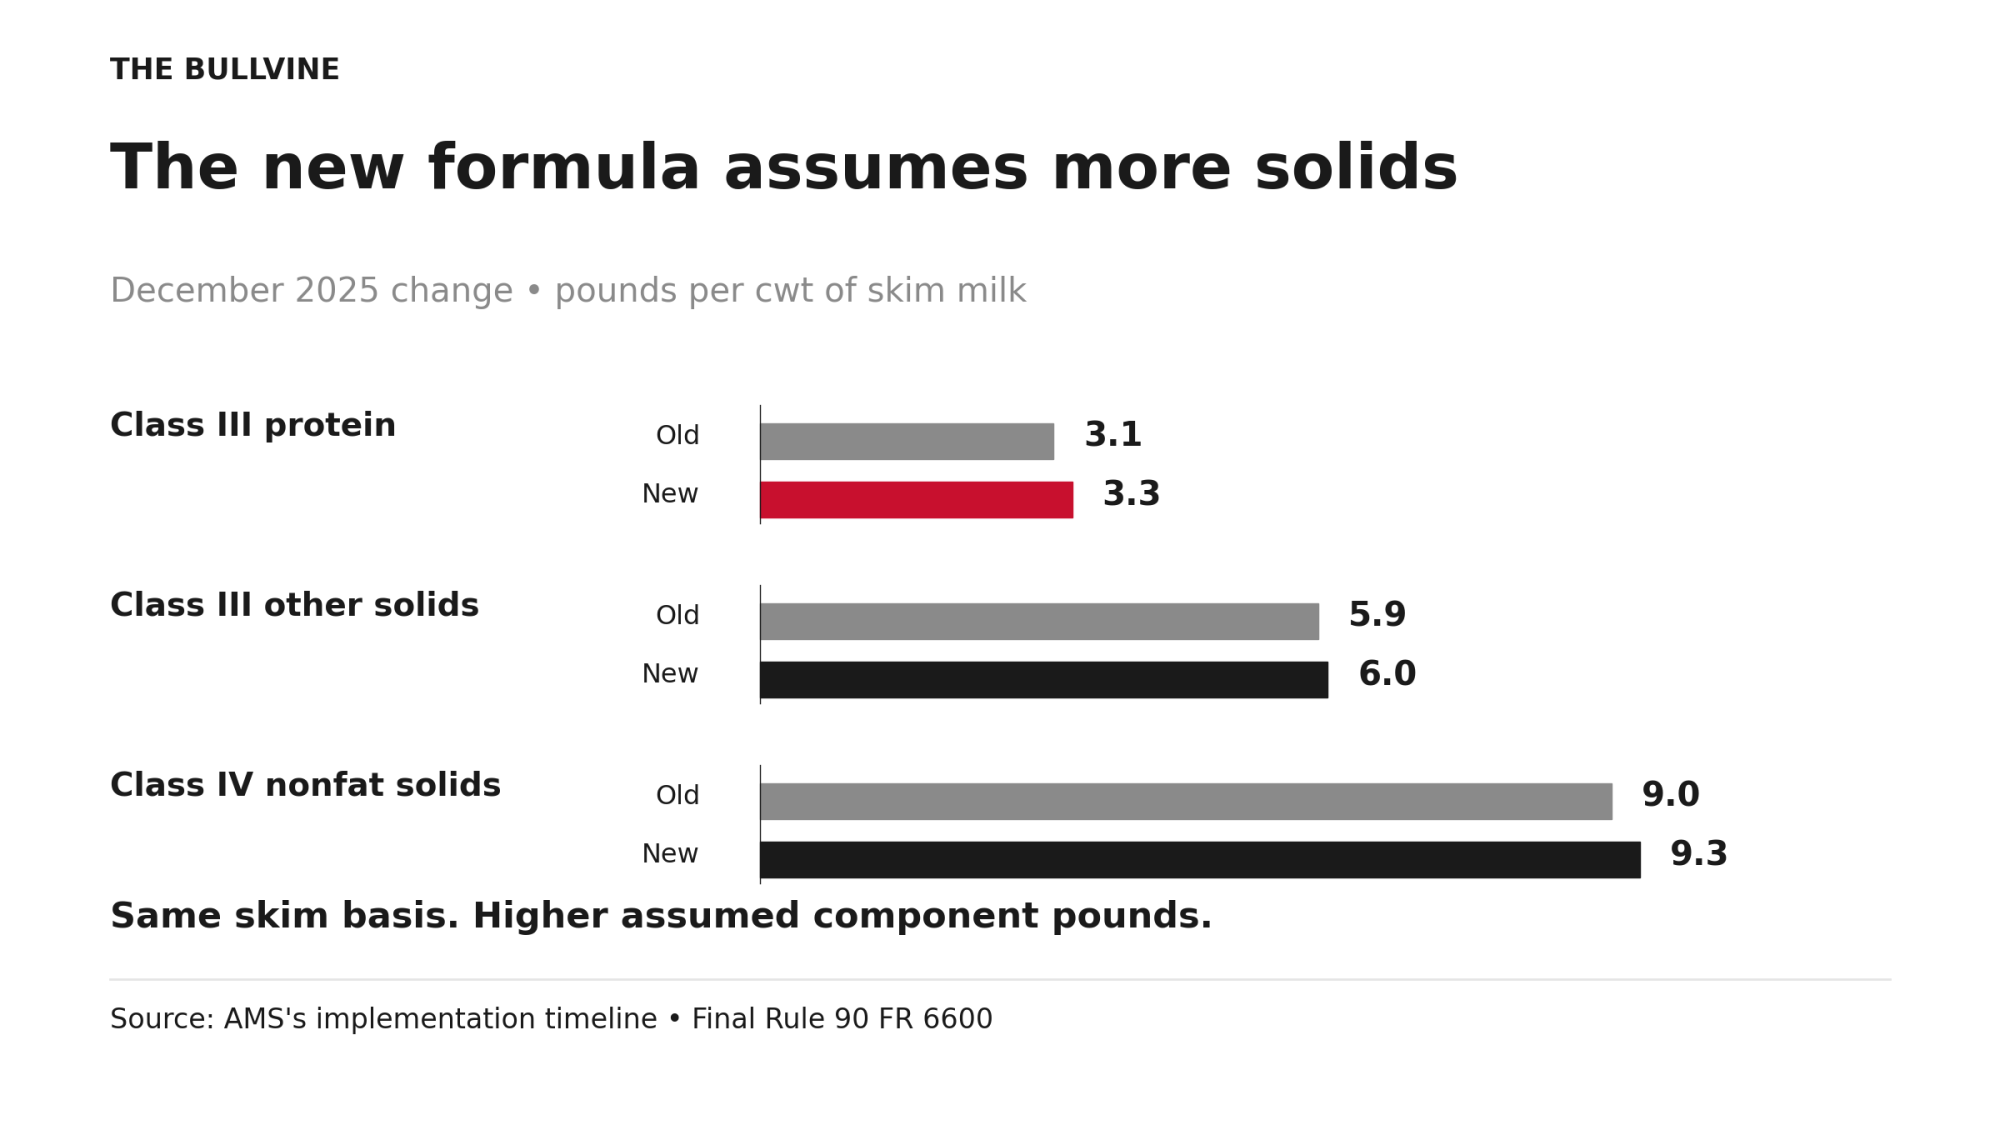
| Component | Old formula | New formula |
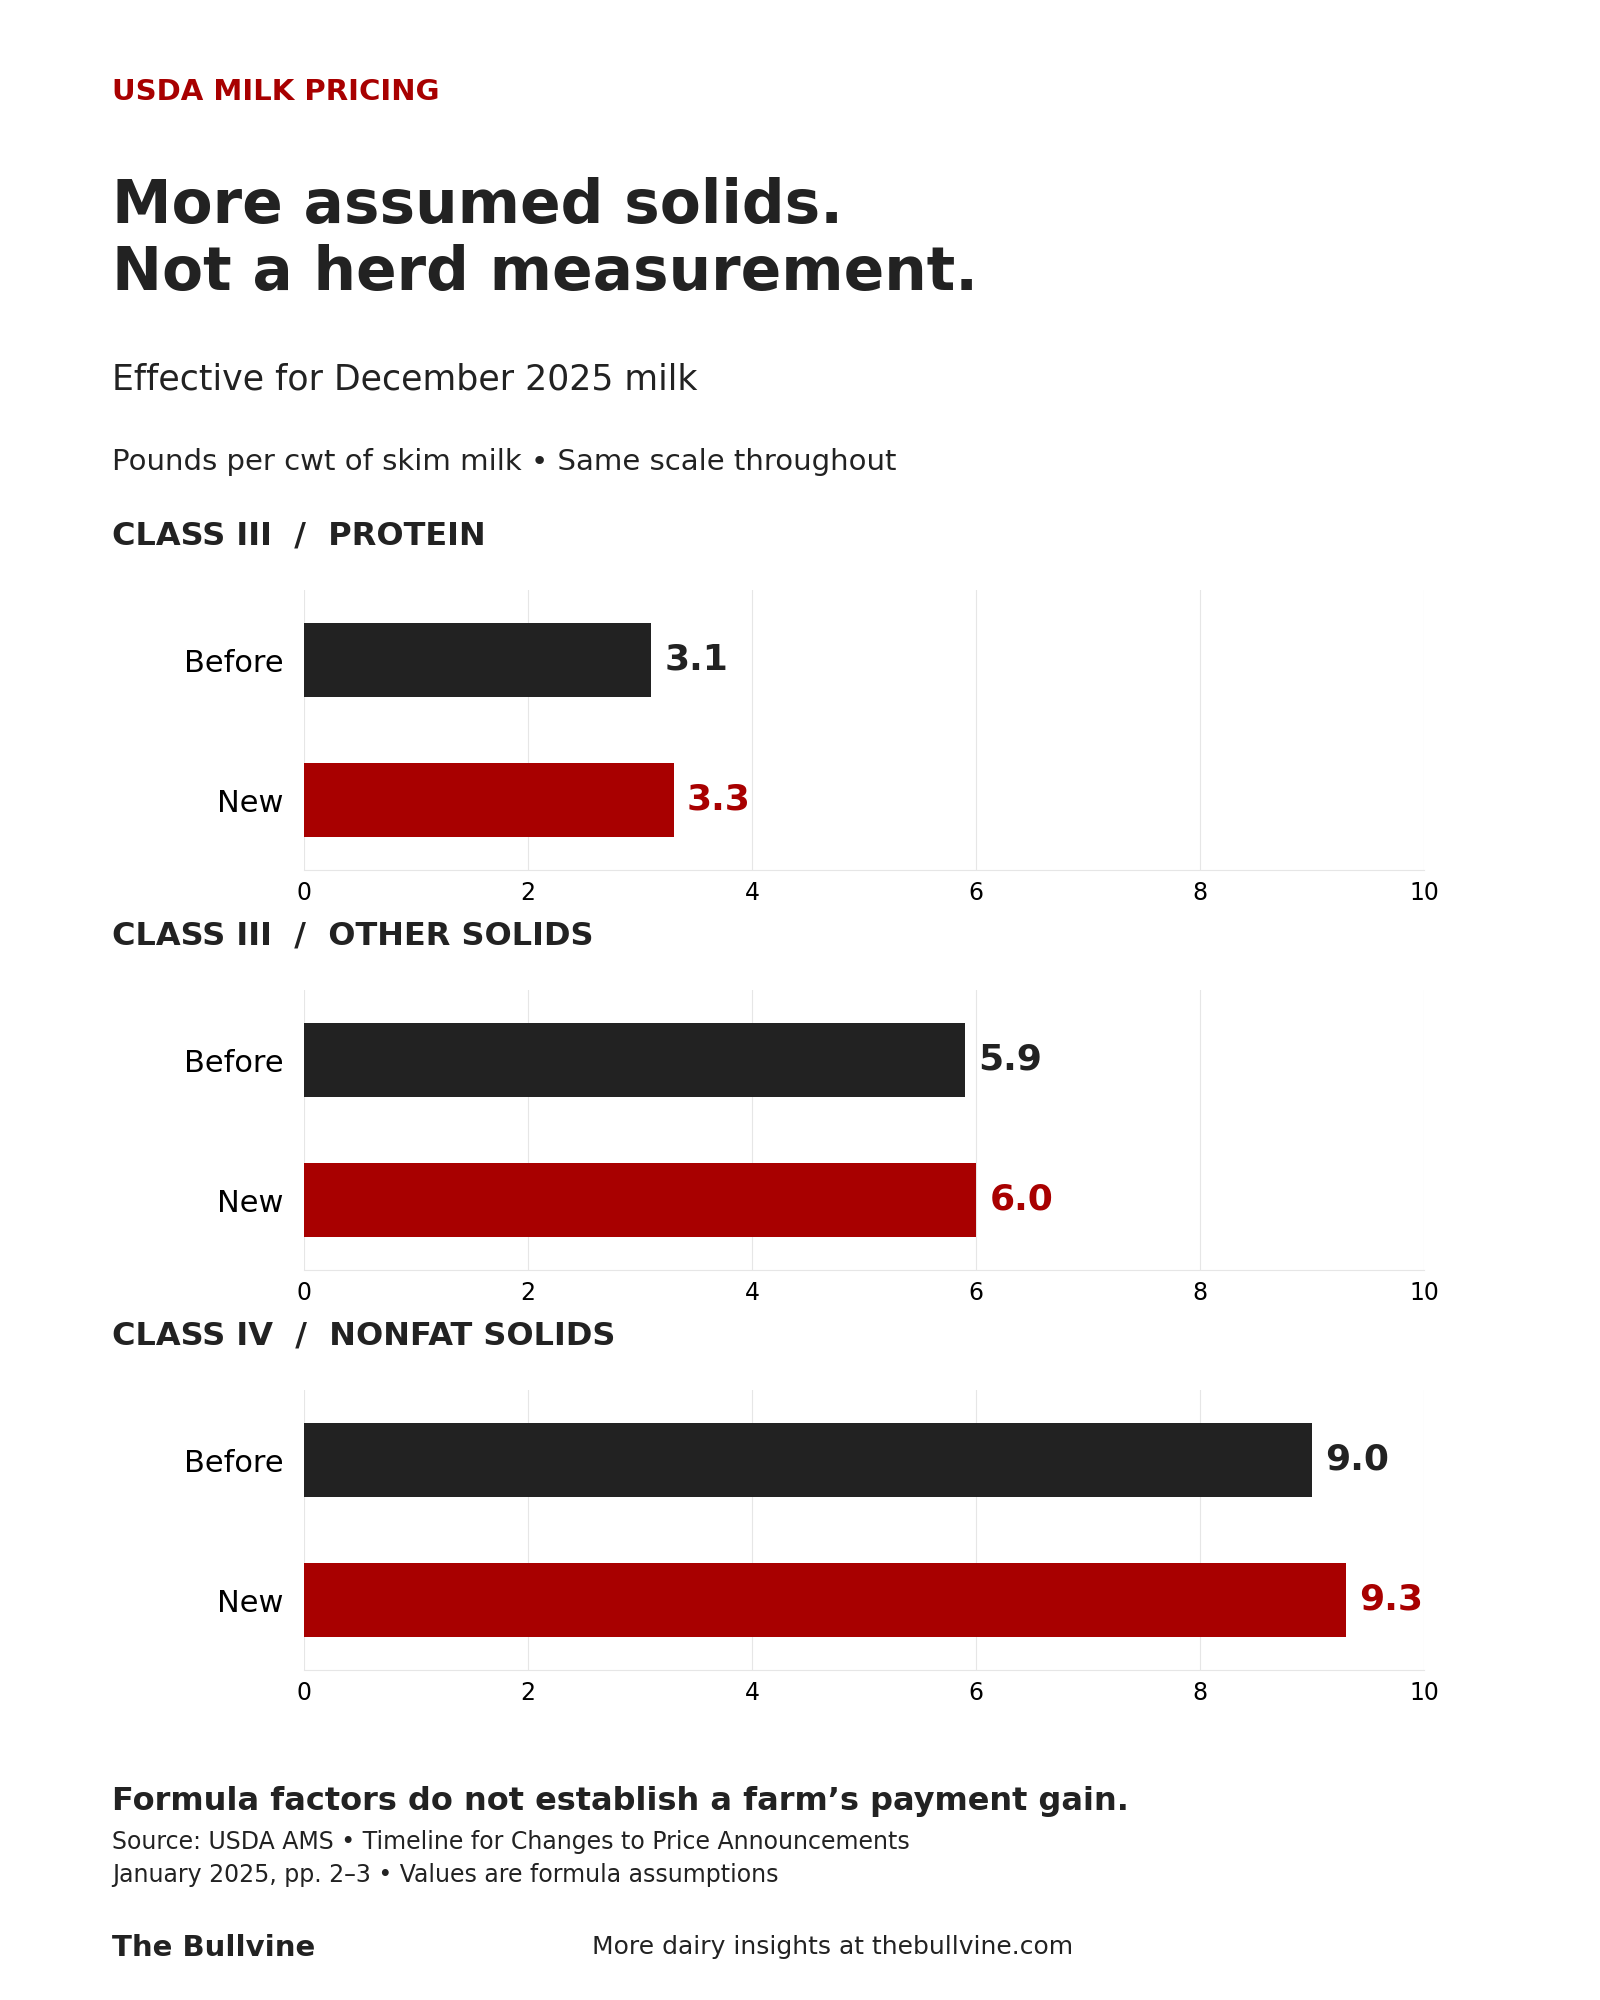
| Class III protein | 3.1 lb/cwt skim | 3.3 lb/cwt skim |
| Class III other solids | 5.9 lb/cwt skim | 6.0 lb/cwt skim |
| Class IV nonfat solids | 9.0 lb/cwt skim | 9.3 lb/cwt skim |
Source: USDA AMS implementation timeline for Final Rule 90 FR 6600. AMS lists these as percentages; 3.3% equals 3.3 lb per cwt of skim. The updated composition factors apply to milk marketed in December 2025.
Under Final Rule 90 FR 6600, as summarized in AMS’s implementation timeline. AMS lists these as percentages; 3.3% equals 3.3 lb per cwt of skim.
The announced Class III and IV prices are calculated for milk standardized at 3.5% butterfat. USDA multiplies its per-pound component prices by assumed pounds of solids per hundredweight. In August 2026, AMS priced protein at $2.8281/lb, other solids at $0.4052/lb and nonfat solids at $1.3456/lb. The factor change raised those assumed pounds.
Same component prices, more assumed solids: a higher calculated benchmark. This isolates the December composition change, not the net effect of the wider 2025 pricing reforms.
The formula comparison establishes the benchmark difference. What reached your check depends on your payment terms and the applicable pool calculation.
Why doesn’t the 41.6¢ show up dollar-for-dollar on your check?
On a multiple-component order, you’re paid for the pounds you actually ship in the tank. USDA’s new 3.3-lb protein assumption doesn’t set your shipped protein pounds; your shipped volume multiplied by your actual protein test does. That’s the rule in the Central order (Federal Order 32), set out in its producer-payment section. If your order or plant pays on a different basis, check its producer-payment section first. That cuts both ways: don’t give the cows credit for the formula’s contribution to the benchmark, but don’t subtract 41.6¢ from component dollars that never contained that money.
The factor change can still reach your check indirectly, through the producer price differential (PPD), the Class I price your order’s pool collects, and pooled returns. Analysis by Nicholson, Wolf and Stephenson (Choices, 2025) shows announced class-price effects and actual farm-price effects diverge. For your herd, that indirect piece is undetermined until someone reconstructs your settlement.
Running the Numbers
Formula-only benchmark differences, January–October 2026
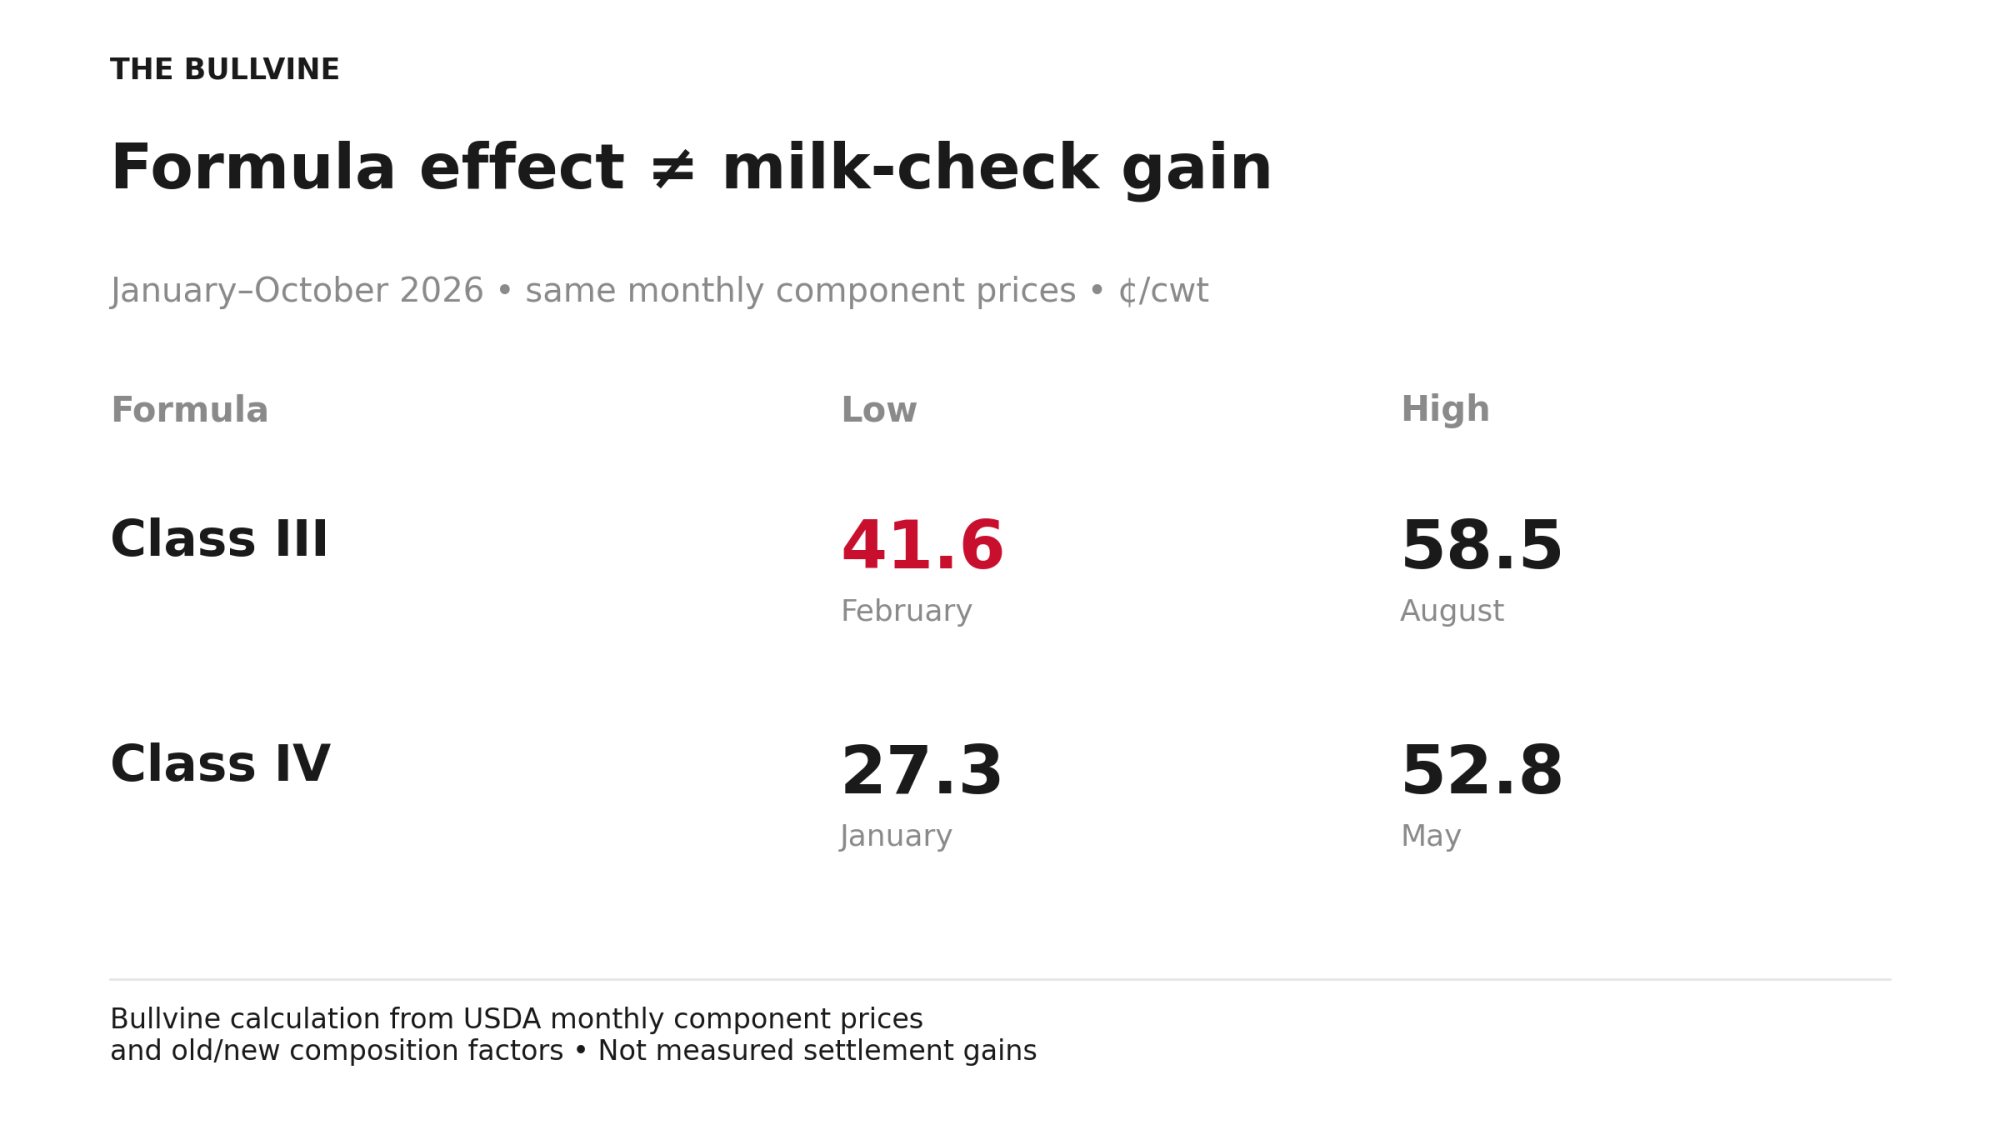
| Benchmark | Lowest difference | Highest difference |
|---|---|---|
| Class III | 41.6¢/cwt — February | 58.5¢/cwt — August |
| Class IV | 27.3¢/cwt — January | 52.8¢/cwt — May |
Table note: Bullvine calculations as supplied in the draft. Each difference compares the old and new composition factors using the same month’s component prices. These are benchmark differences—not month-to-month price increases or estimates of additional farm income. Values are in USD.
December 2025, the first month, was 51.6¢ (Class III) and 26.2¢ (Class IV). These are Bullvine’s figures, not USDA’s. They show the difference between the two formulas at the same month’s component prices, not a month-to-month price increase or money you received.
At farm scale: 400 milking cows shipping 80 lb/cow/day produce 320 cwt/day. Holding the 41.6¢/cwt difference constant for an illustrative year gives $48,589 (Bullvine calculation). This is a benchmark equivalent, not an estimate of your check’s gain; any payment effect requires the applicable pool calculation and your buyer’s payment terms.
Did Your Cows Really Pay For That Milk Check?
Isolate your herd’s true component value from USDA’s recent Class III math changes in under 60 seconds.
ΔR = b* × ΔF + p* × ΔP + o* × ΔO
Gross Margin Change = ΔR – ΔFeed
We multiply your milk lbs by your component percentages to get shipped pounds for each period. Then we multiply both periods by the exact same component prices (holding the market constant). Finally, we subtract the difference to isolate pure herd performance.
A Bullvine tool · Last updated November 2026
Separate production changes from payment changes
You need two tests, and they shouldn’t share a line.
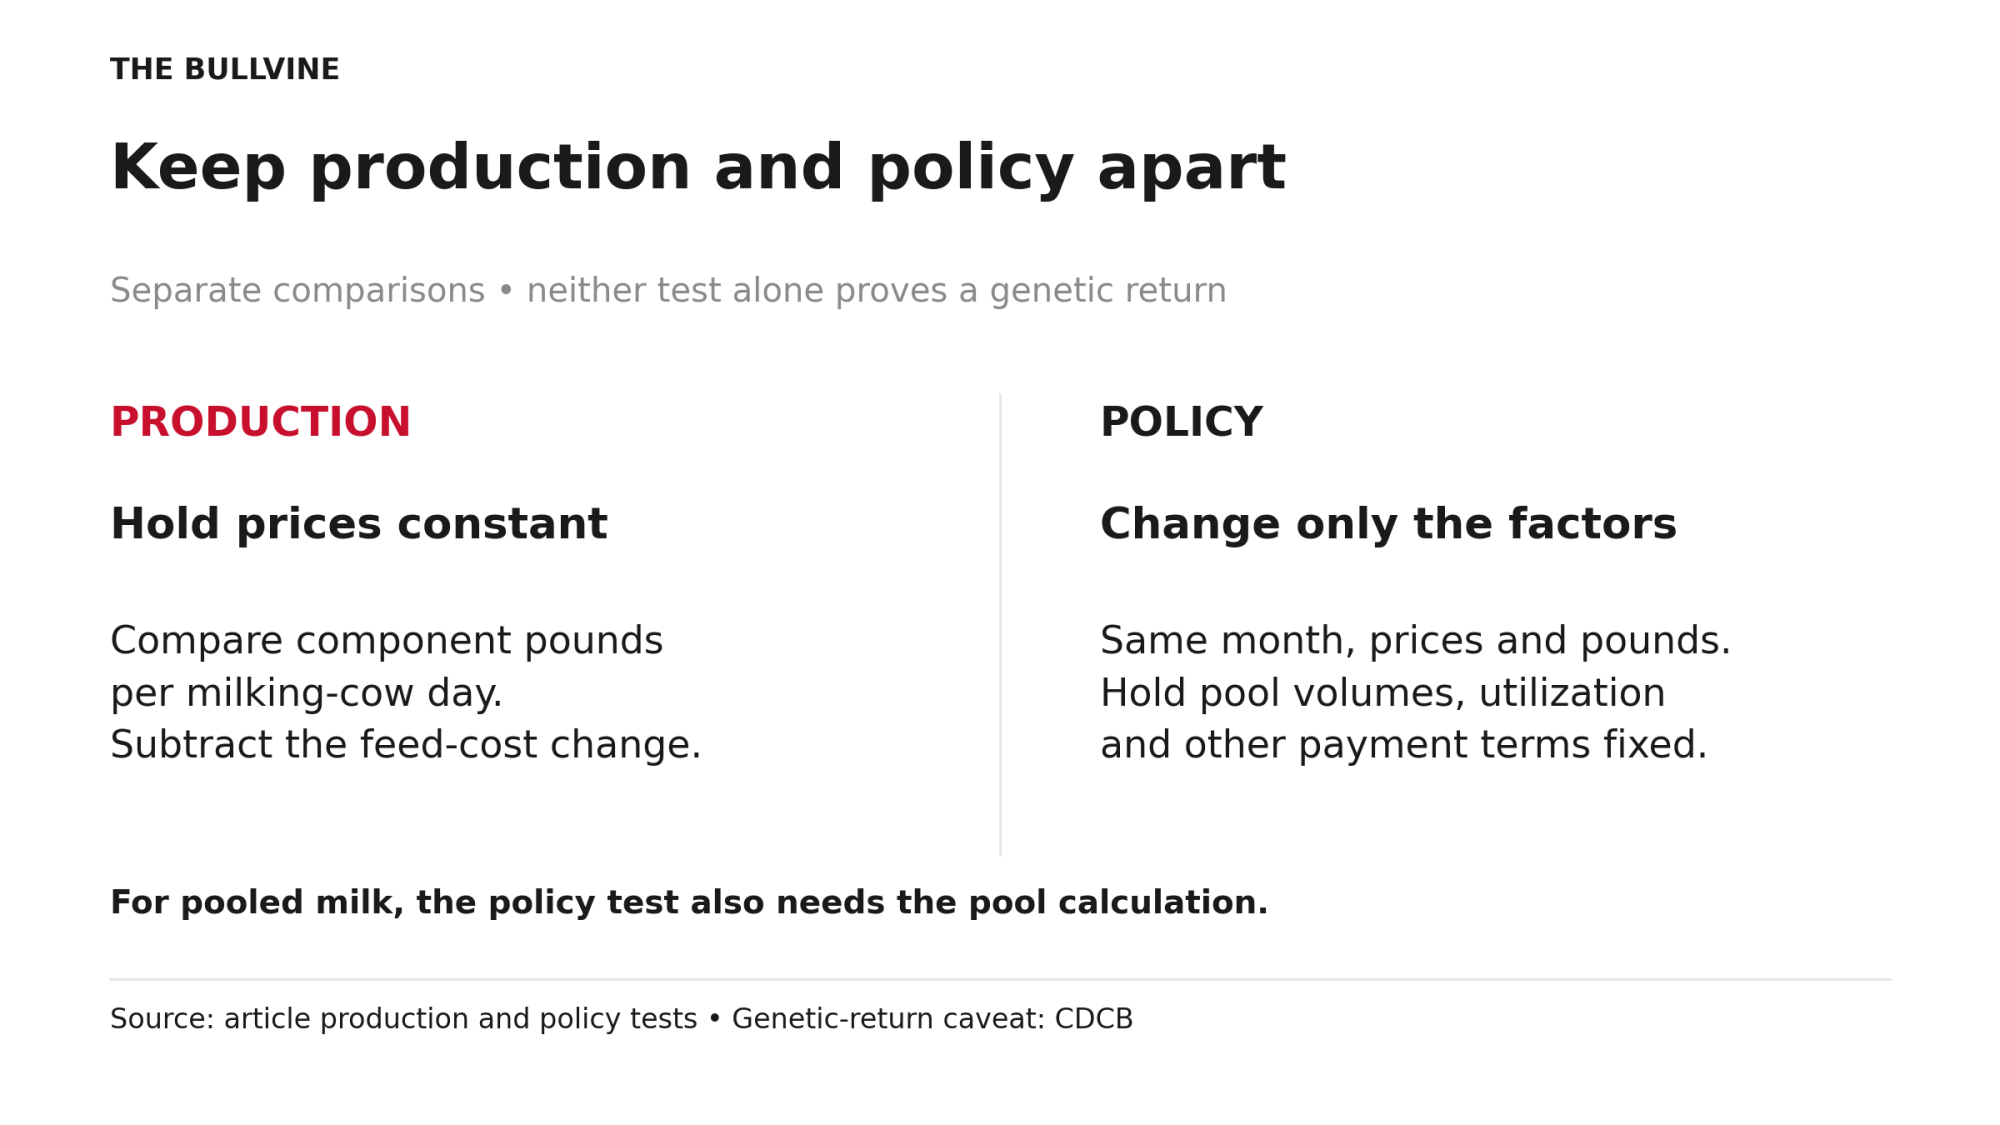
Production test. To find your actual production gain, isolate your pounds:
- Take your shipped fat, protein and other-solids pounds per milking-cow day for both periods.
- Multiply both periods by the exact same component prices.
- Compare the two revenue figures, then subtract the change in feed cost per milking-cow day.
If component revenue per milking-cow day rises at common prices, the herd shipped more component value per milking-cow day. A flat result does not rule out higher total component revenue from more milking-cow days. This test removes changes in component payment rates from the comparison; ration, management and season still affect the result.
Penn State Extension (updated Sept. 2023) defines income over feed cost as a gross margin, not net profit. Using actual feed bills leaves feed-price changes in the result. To compare production and feed use at common prices, value feed quantities in both periods at the same feed prices.
Policy test. Ask your co-op or pricing adviser for a same-month comparison under the old and new composition factors. Hold these constant: component prices, your milk and component pounds, pool volumes and utilization, and every other payment term. For pooled milk, that also takes the pool calculation and advanced-pricing inputs, not just your settlement. The difference estimates the composition change’s effect under those fixed assumptions.
Keep the production and policy results separate, and state what each holds constant.
Even a clean production test doesn’t make it a genetic return. CDCB notes that measured performance reflects nutrition, housing, management and health as well as genetics. Animal records linked to genetic evaluations are a starting point; the comparison must also account for environmental and management differences before you attribute the gain to genetics.
Playbook
At your next settlement review
- Do: Pull your November and December 2025 settlements and your most recent settlement. Mark the milk-production month covered and identify actual-component dollars, PPD, premiums and deductions.
- Requires: Your plant’s payment schedule as of each settlement date.
- Urgent if: Your co-op report or board talks about a milk-price “gain” across December 2025 without a factor footnote.
- Backfires if: You subtract 41.6¢ from component dollars. That money was never in them.
Before renewing a feeding or breeding program
- Do: Calculate component revenue per milking-cow day in each period using the same payment rates. Subtract the earlier period from the later period, then subtract the change in feed cost per milking-cow day.
- Requires: Shipped pounds, tests, milking-cow days, and feed quantities and prices for both periods.
- Urgent if: You’re about to renew a semen contract or a component-focused ration program because of a better-looking check.
- Backfires if: The two periods differ in season, pen mix or fresh-cow share. Match them, or say they’re not matched.
Contract check: Ask your field rep: “Which lines on my settlement use my actual component pounds, and which depend on a class price or pool return?” Request a worked comparison using the same month’s milk and prices with only the composition factors changed.
Breeder Strategy: Does your index value components the way your plant pays for them?
Holstein Association USA moved TPI’s direct weights to 24 protein and 14 fat in April 2026. Its technical note says the credit applies per standardized unit. That’s not a per-pound price ratio. Don’t compare 24:14 to your plant’s protein-to-fat price spread.
The number to check is your farm’s net marginal value of a pound of protein against a pound of fat, after feed cost, over the daughters’ working lives. (For the protein side of that math, see what a tenth of protein is worth.) Put that value on the full trait list of two bulls you’d actually buy, and check whether the preferred bull changes under your low, central and high assumptions. A different choice in all three cases is a stronger reason to review your index than a reversal in one. Cole’s 2025 Journal of Dairy Science review found that “the response in individual traits changes, but the overall index response (total economic merit) does not.”
Before your next sire purchase
- Do: Put your farm’s net protein-to-fat value on your next two sire shortlists across low/central/high cases.
- Requires: Current official proof run, reliabilities, genomic vs daughter-proven status, and full trait PTAs.
- Urgent if: The higher-TPI bull loses under all three of your cases.
- Backfires if: You value only components and drop fertility, livability and feed efficiency.
Methodology note. Bullvine’s formula differences: Class III = 0.965 × [(0.2 × protein price) + (0.1 × other-solids price)]; Class IV = 0.965 × (0.3 × nonfat-solids price), with component prices in dollars per pound from USDA’s monthly announcements. For each month from December 2025 through October 2026, the calculation holds that month’s published component prices constant and applies the pre- and post-change factors. Differences are calculated before rounding either class price and displayed to 0.1¢/cwt. Monthly differences do not accumulate. The farm-scale figure is $0.416 × 320 cwt/day × 365, held constant for an illustrative year. It is not a farm-income estimate and does not reconstruct any pool. All figures are in USD.
Learn More
- Pellet-Free Robotic Milking: The $36,740 Decision Your Operation Needs to Make Now — Slash your annual feed bill by $36,740 per 200 cows and drive higher butterfat by eliminating expensive robot pellets. The following blueprint breaks down the exact guided-flow adjustments and TMR protocols required to protect milk yield during transition.
- Dairy Farm Economics 2026: Milk Pricing, Margins & Risk Playbook — Mastering the financial reset triggered by FMMO modernization insulates your balance sheet from margin compression. By delivering a multi-year strategy, the playbook helps navigate structural market gaps, quota shifts, and rising labor costs without cannibalizing farm equity.
- TPI 2026’s $17,500 Protein Trap: Breeding Holsteins for a Protein Market That Doesn’t Exist — Because theoretical index weights rarely match actual plant payouts, chasing high-protein sires can silently drain your component revenue. We follow the money on recent genetic evaluations, arming you with the data needed to avoid this costly breeding trap.
The Sunday Read Dairy Professionals Don’t Skip.

Every week, thousands of producers, breeders, and industry insiders open Bullvine Weekly for genetics insights, market shifts, and profit strategies they won’t find anywhere else. One email. Five minutes. Smarter decisions all week.