In 2024, Bullvine headlined a $33,000 high-oleic soybean opportunity. Two university trials now put the observed fat response between zero and 0.20 lb per cow per day. The number that actually decides the purchase is one most rations never calculate.
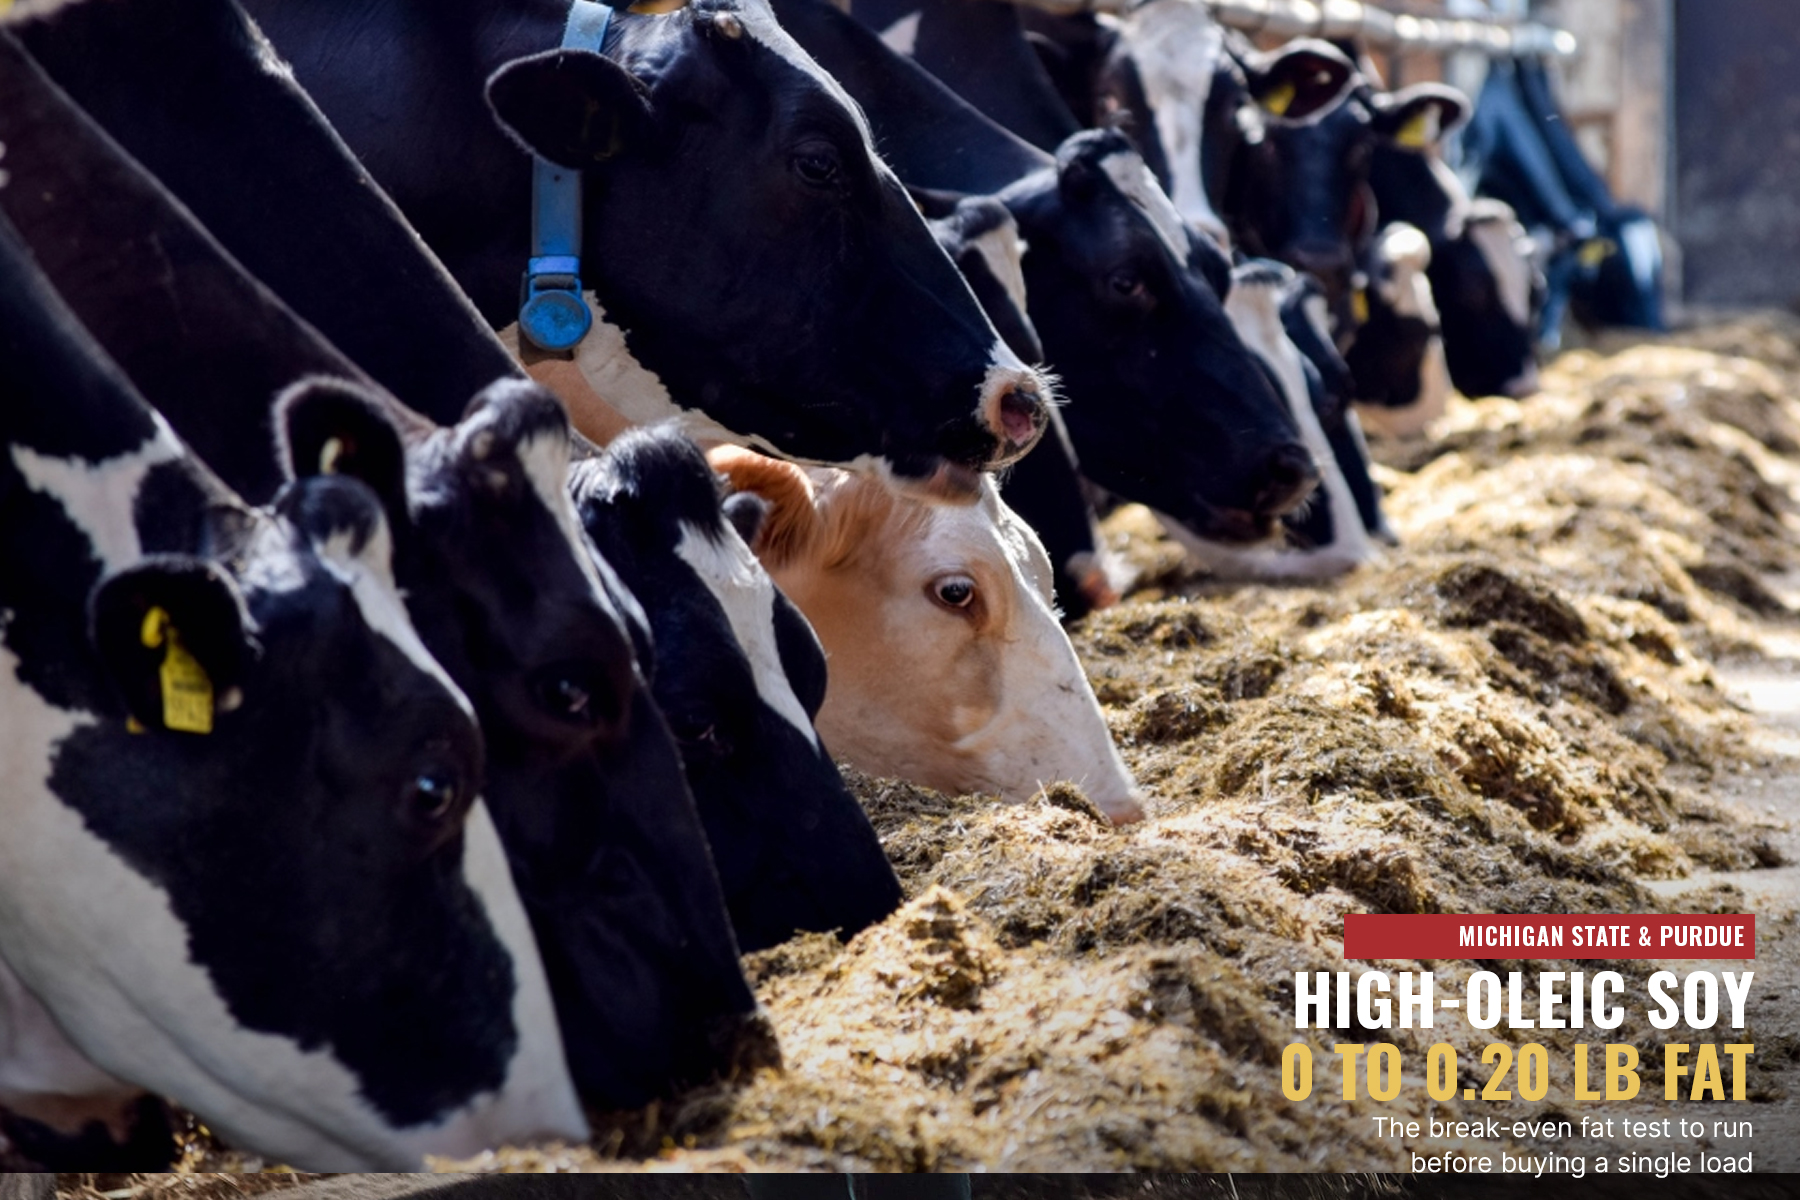
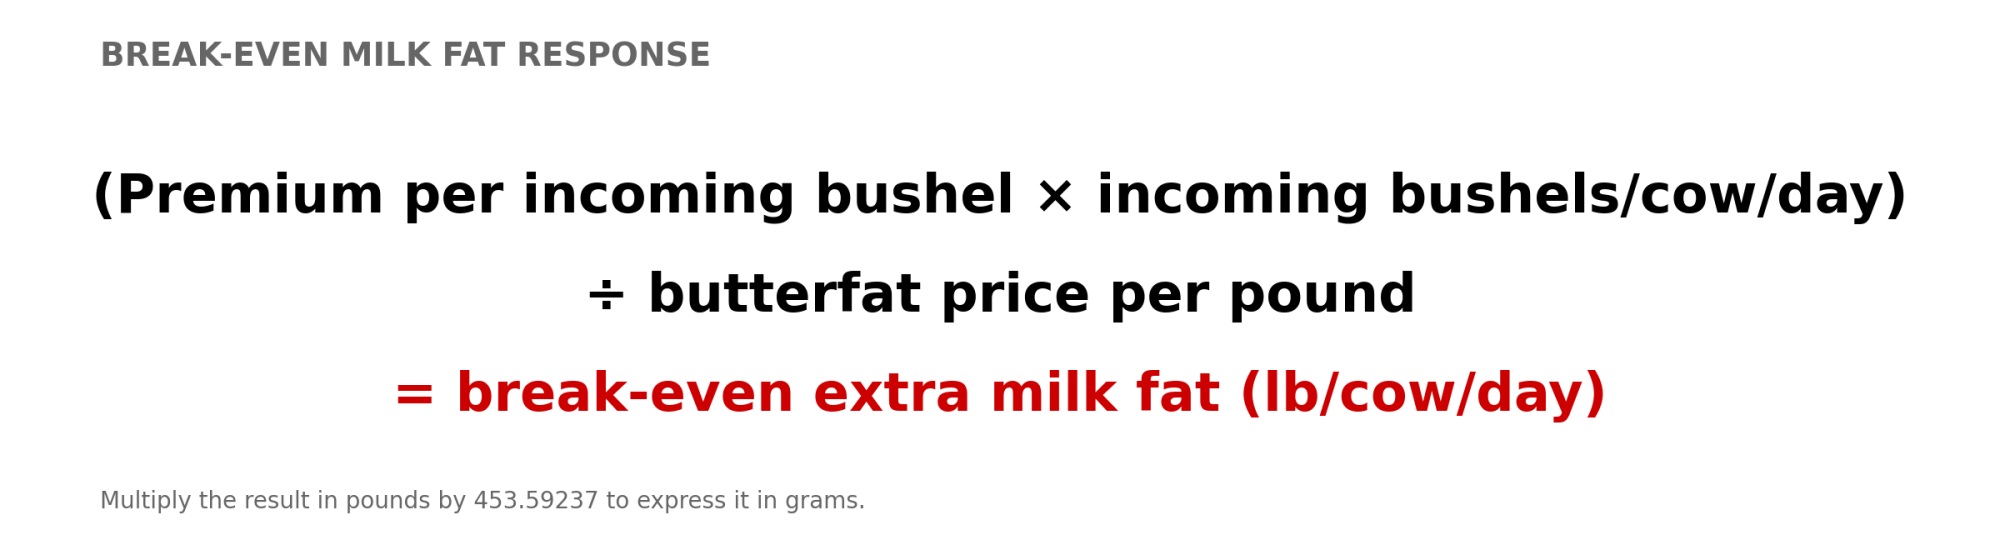
When high-oleic soybeans hit the research barn, they produced anywhere from no significant fat-yield gain to 0.20 lb more fat per cow per day. Purdue University fed high-oleic soybean oil and saw no significant change in fat yield. Michigan State University’s 8% roasted high-oleic soybean diet produced 0.20 lb more fat than its control. Neither result shows the beans cut feed cost. That depends on one farm-specific number: the break-even milk-fat response, in pounds per cow per day.
What did the $33,000 actually measure?
Bullvine’s May 27, 2024 article put a $33,000 annual gain for a 500-cow herd in the headline, and cited milk income less feed cost of up to $0.27 per cow per day in the text. Those figures came from two different points in the same Cornell-led model. Nicholson et al. reported a mean of $0.1787 and a maximum of $0.2730 per cow per day, using U.S. prices from January 2014 through September 2020. The research was supported by the United Soybean Board.
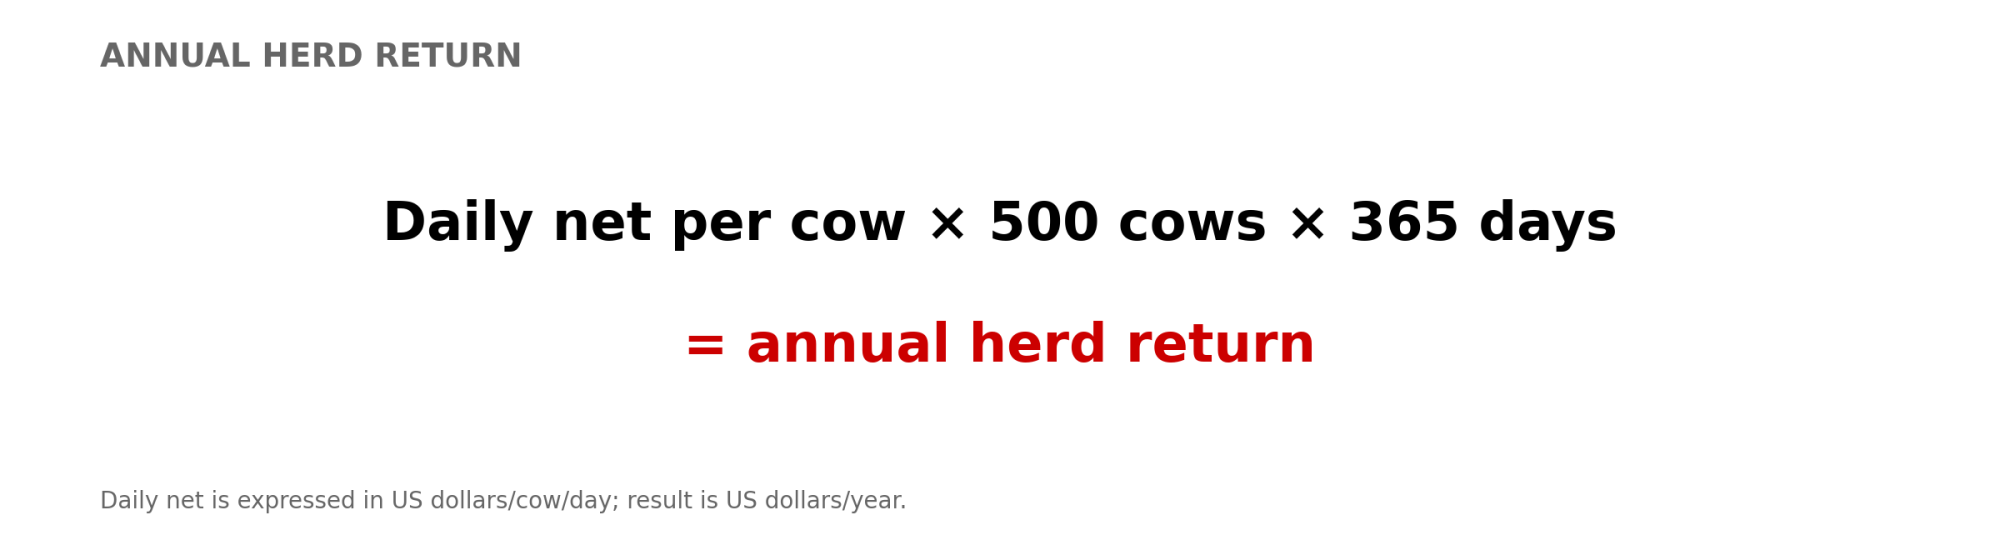
Bullvine math: 500 cows × 365 days × $0.1787 = $32,613, which is the $33,000. The maximum works out to $49,823. So the $33,000 wasn’t a multiplication error. The article printed the maximum per-cow figure next to the mean whole-herd figure without saying they were different numbers. Neither was measured on a working dairy.
Which assumptions dropped out of the headline?
Nicholson’s base case had raw high-oleic beans replace raw conventional beans at 5% of ration DM, about 1.4 kg per cow per day. It assumed 50 g of extra milk fat, roughly 0.11 lb. It also used a $0.50/bu premium, no extra freight or logistics, no processing difference, and no change in milk, protein, reproduction or longevity. The authors called it a “first approximation.” The headline kept the dollar figure and dropped those conditions.
That substitution answers a narrower question than the one a feed buyer has to answer. Swapping raw high-oleic beans for raw conventional beans at equal fat isn’t the choice most nutritionists are pricing. The real choice is among three complete protein-and-fat packages: conventional roasted beans plus commercial fat; roasted high-oleic beans replacing that combination; or soybean meal plus commercial fat. All three need to be held equal on NEL and MP, with digestible amino acids, total FA, RUFAL, NDF, starch and DMI reported, so the “cheap” ration isn’t just moving a shortfall somewhere else.
What did Michigan State establish?
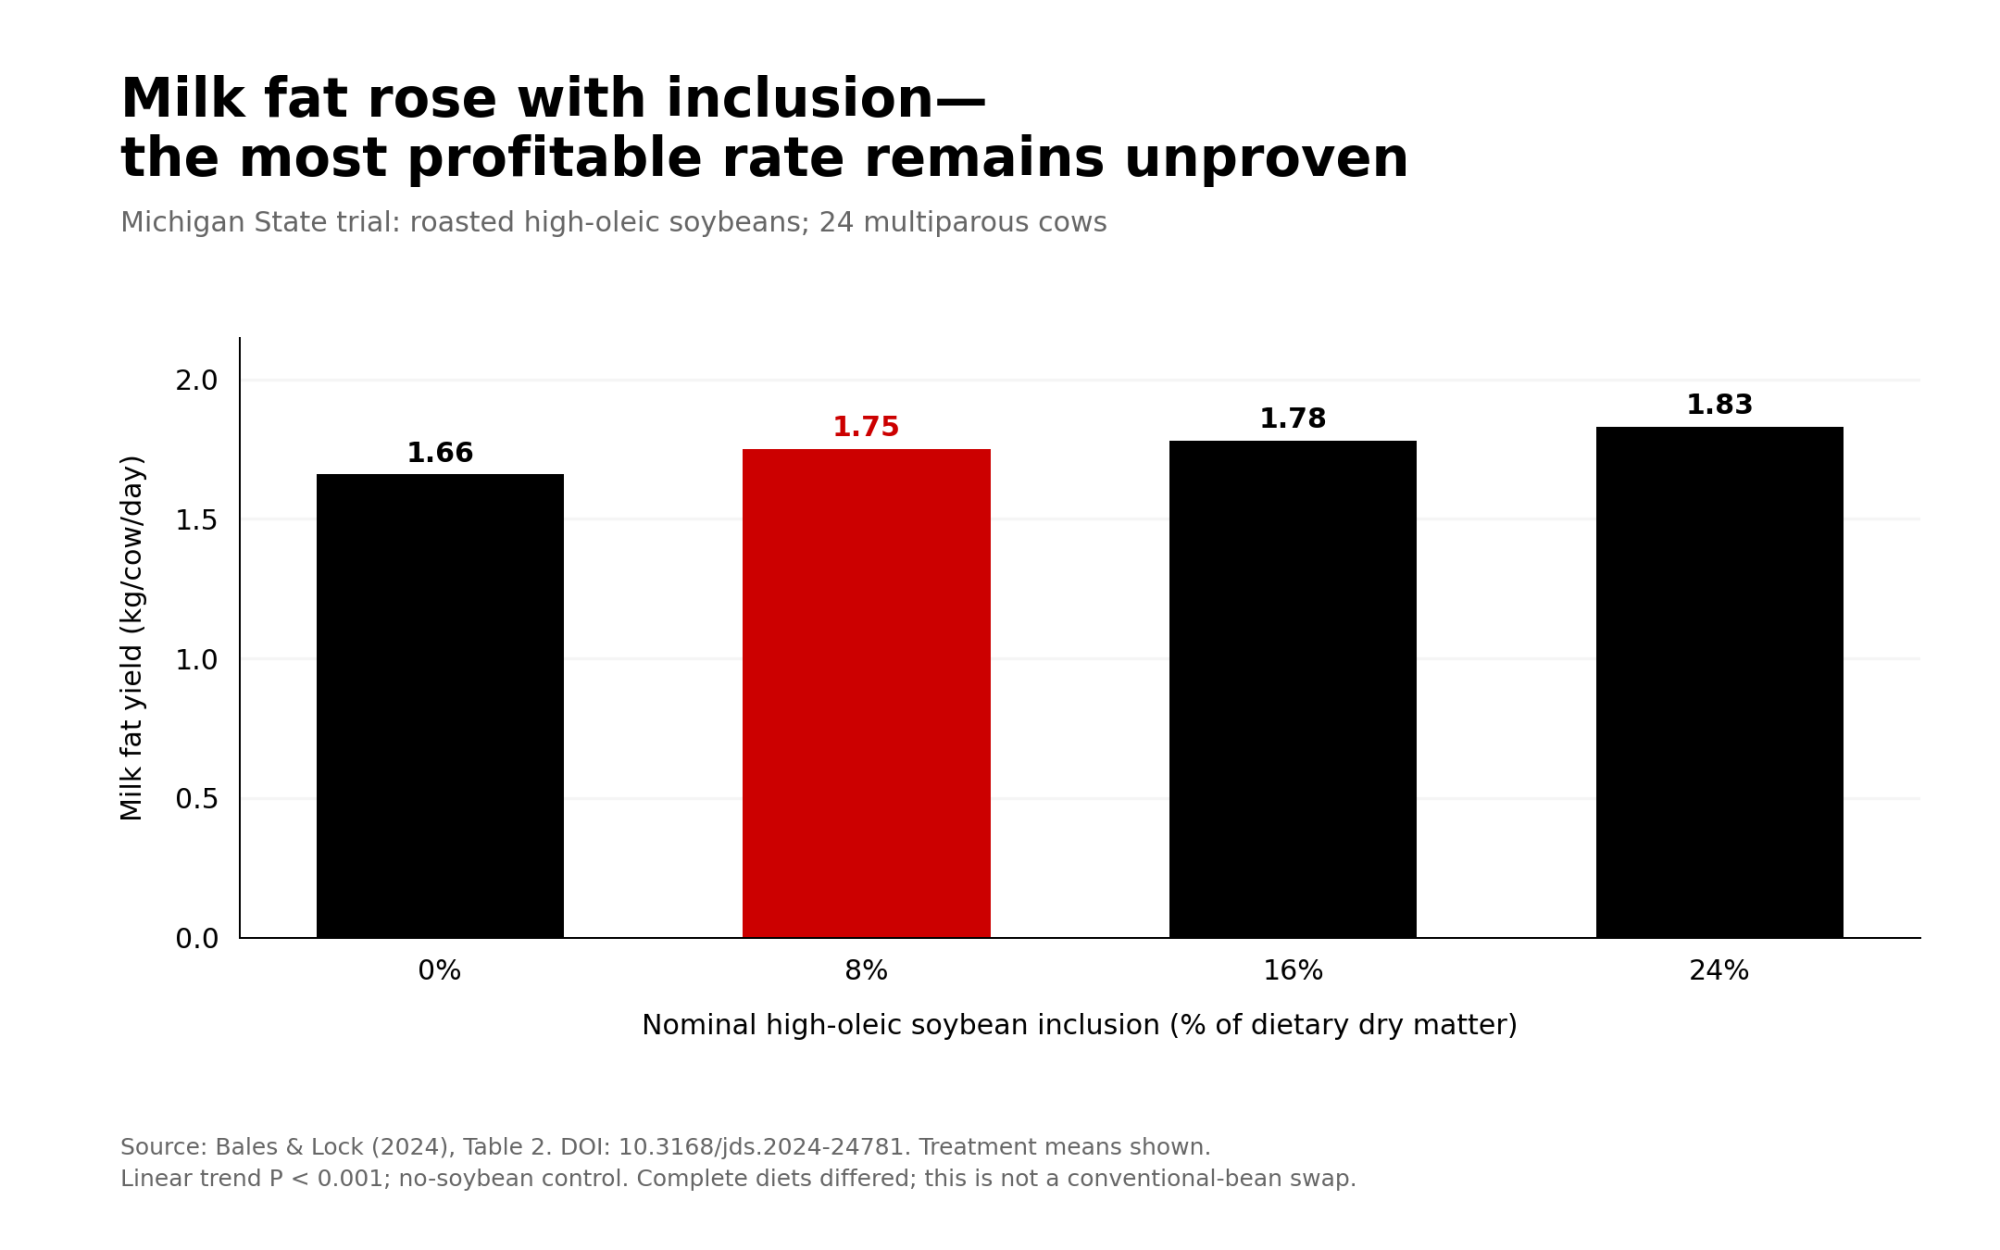
Michigan State ran 24 multiparous Holsteins through a replicated 4 × 4 Latin square on diets with 0%, 8%, 16% or 24% roasted high-oleic soybeans. The beans were roasted at 157°C for two hours and ground through a 10-mm screen. Before treatment, the cows were at 122 ± 57 DIM and averaged 50.7 kg (about 112 lb) of milk. Funding came from the Michigan Alliance for Animal Agriculture and the United Soybean Board, and Caledonia Farmers Elevator supported a graduate fellowship.
At 8% inclusion, cows ate 2.58 kg of beans a day. Compared with control, milk went from 48.2 to 51.4 kg, ECM from 49.4 to 51.3 kg, fat from 1.66 to 1.75 kg, and protein from 1.56 to 1.63 kg. The 0.09-kg fat difference is 0.198 lb. The treatment diets weren’t matched on energy, RUP or amino-acid supply, so the whole response can’t be credited to oleic acid.
Bullvine’s incremental-response math, using the bean intakes the paper reports (2.58, 4.97 and 7.43 kg/day):
Inclusion step
Added beans
Added ECM
Added fat
Added protein
Fat per kg of beans added
0% → 8%
2.58 kg
1.90 kg
0.09 kg
0.07 kg
~35 g
8% → 16%
2.39 kg
0.50 kg
0.03 kg
0.00 kg
~13 g
16% → 24%
2.46 kg
0.60 kg
0.05 kg
−0.02 kg
~20 g
These are differences between treatment means, not causal marginal returns, and they don’t show 8% to be an economic optimum. They do show that fat kept rising as inclusion went up, but each extra kilogram of beans after the first 8% bought far less ECM and no more protein.
Why didn’t better digestibility pay at Purdue?
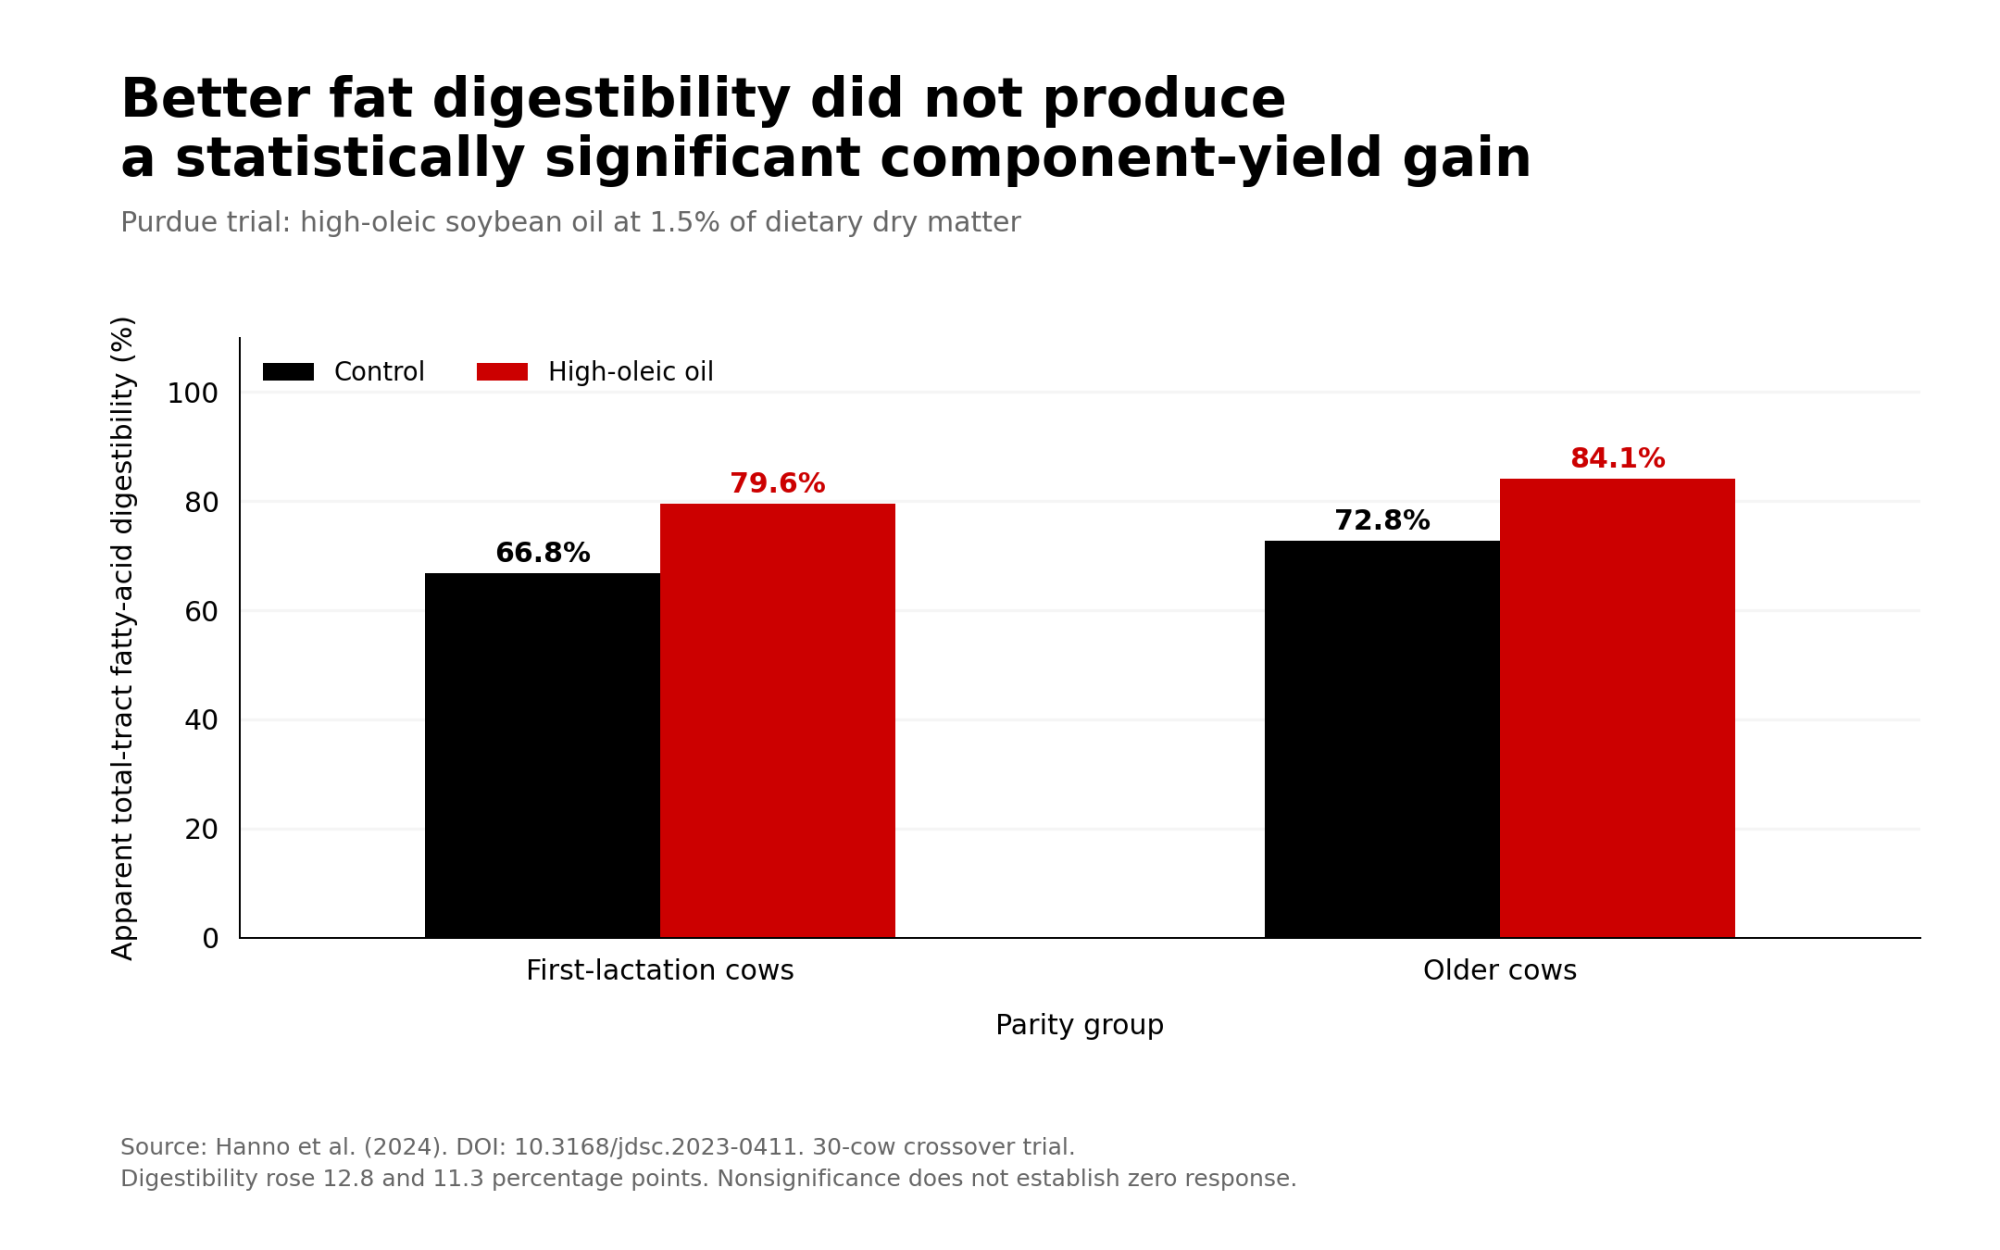
Purdue’s 30-cow crossover (16 first-lactation, 14 older cows, 87 ± 26 DIM) replaced 1.5% wheat middlings with 1.5% high-oleic soybean oil. Apparent FA digestibility rose from 66.8% to 79.6% in first-lactation cows and from 72.8% to 84.1% in older cows. The Indiana Soybean Alliance funded the work, and Benson Hill supplied the oil.
The oil diet also had more energy than the control: 1.70 vs. 1.65 Mcal/kg NEL. Even so, DMI, milk, ECM and component yields didn’t change. Fat yield rose 0.03–0.04 kg, which wasn’t significant (P = 0.20). Fat test tended upward by 0.16 points, and backfat depth rose 0.44 mm. The authors tied the missing ECM response partly to energy going into body fat. Both diets also contained HMTBa, which may have reduced milk fat depression risk.
This doesn’t contradict Michigan State. Purdue fed oil. Michigan State fed roasted whole beans, which also changed protein supply, rumen escape and how fast the fat was released. What Purdue shows is the floor: more digestible fat and more NEL on paper don’t guarantee more fat in the tank, because a cow can put that energy on her back instead. You’re paid on pounds of components.
Where does the invoice mislead?
A high-oleic quote may or may not include the commodity bean, the grower’s identity-preserved premium, handling, testing, roasting, shrink and freight. Before comparing quotes, confirm whether each price is per raw ton at the elevator or per finished ton delivered to your mixer. In August 2024, the U.S. Soybean Export Council put grower premiums at $1.00–$1.75/bu. That’s not a current dairy-buyer price, but it’s two to three and a half times the $0.50 Nicholson assumed.
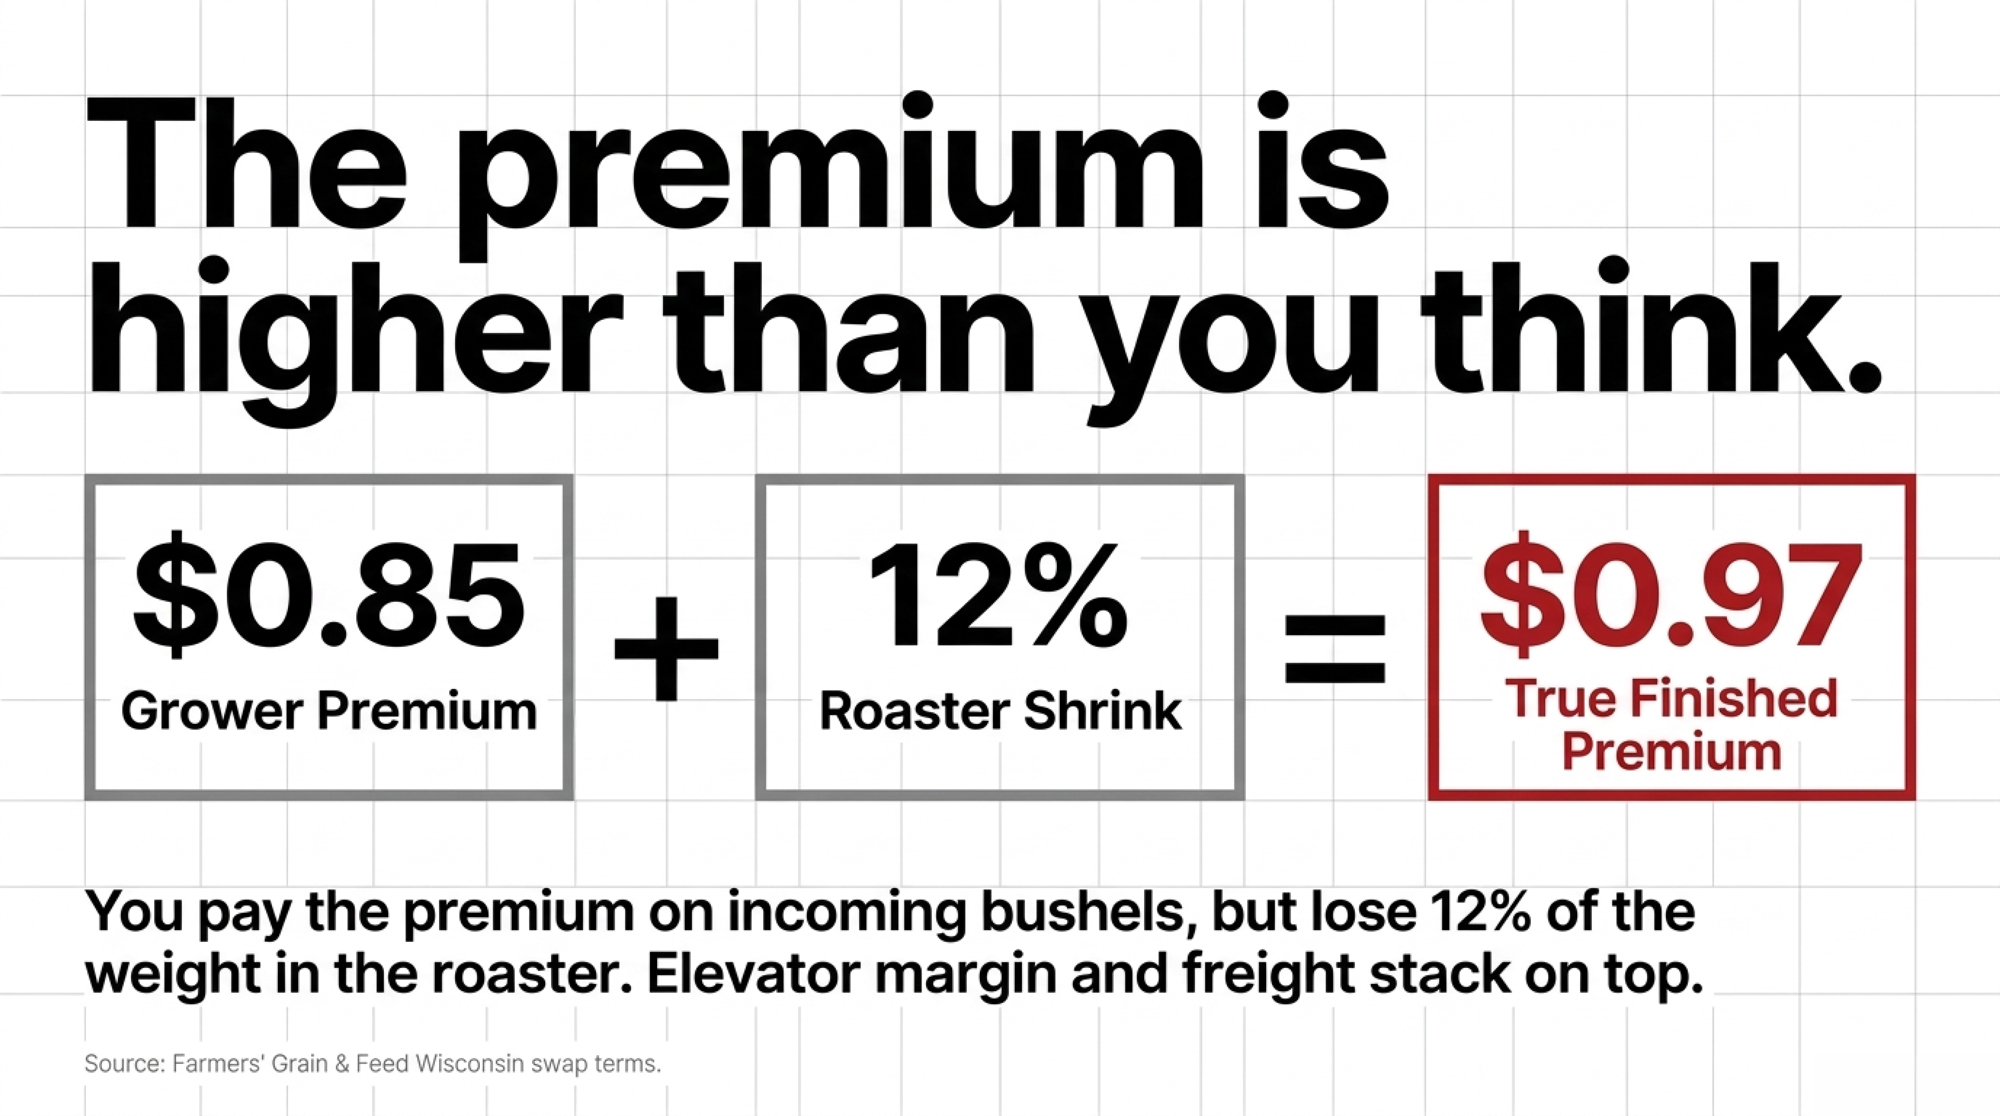
One processor’s 2026 schedule shows the costs that come after the beans. Farmers’ Grain & Feed LLC in Wisconsin, effective September 19, 2026, charges $35/ton to roast beans at 13% moisture, plus $3 per full moisture point, up to $47. It lists 12% shrink on swapped beans, rolling at $13 per finished ton, and trucking to its elevator at $0.25/wet bu within 30 miles or $0.30 beyond, with a $150 minimum. Moisture shrink, storage and quality discounts are charged separately, and the schedule is marked subject to change without notice. These are one mill’s terms, not a national average.
At 12% shrink, it takes 1.136 incoming tons to make one finished ton. That doesn’t mean 12% of the nutrients disappeared, because some of the lost weight is water. The model has to compare tons on a dry-matter basis, using an analysis of the finished feed.
Running the Numbers
Published evidence: Michigan State fed 2.58 kg of roasted high-oleic beans per cow per day at 8% and saw +0.198 lb of fat vs. control. Purdue saw no significant change in fat yield. Nicholson assumed +0.110 lb. Farmers’ Grain & Feed lists 12% swap shrink.
Stated assumptions: 500 lactating cows. Inclusion of 2.58 kg of finished beans per cow per day, used only to show tonnage. 12% shrink. No dollar values, because current prices and milk-pay values are missing.
Bullvine calculation: 2.58 kg × 500 cows = 1,290 kg/day, or 1.422 short tons of finished beans. Divided by 0.88, that’s 1.616 incoming tons a day. Over a year, that’s about 519 finished tons from 590 incoming tons, a 71-ton difference in weight.
Response used
Fat/cow/day
Fat/500 cows/day
Source
Floor
0 lb (no significant change)
0 lb
Purdue, high-oleic oil
Model assumption
0.110 lb
55 lb
Nicholson, raw-bean swap
Trial treatment difference
0.198 lb
99 lb
Michigan State, 8% roasted
These come from different ingredients and designs. They’re stress tests, not a forecast range, and shouldn’t be averaged.
What does your cow have to produce?
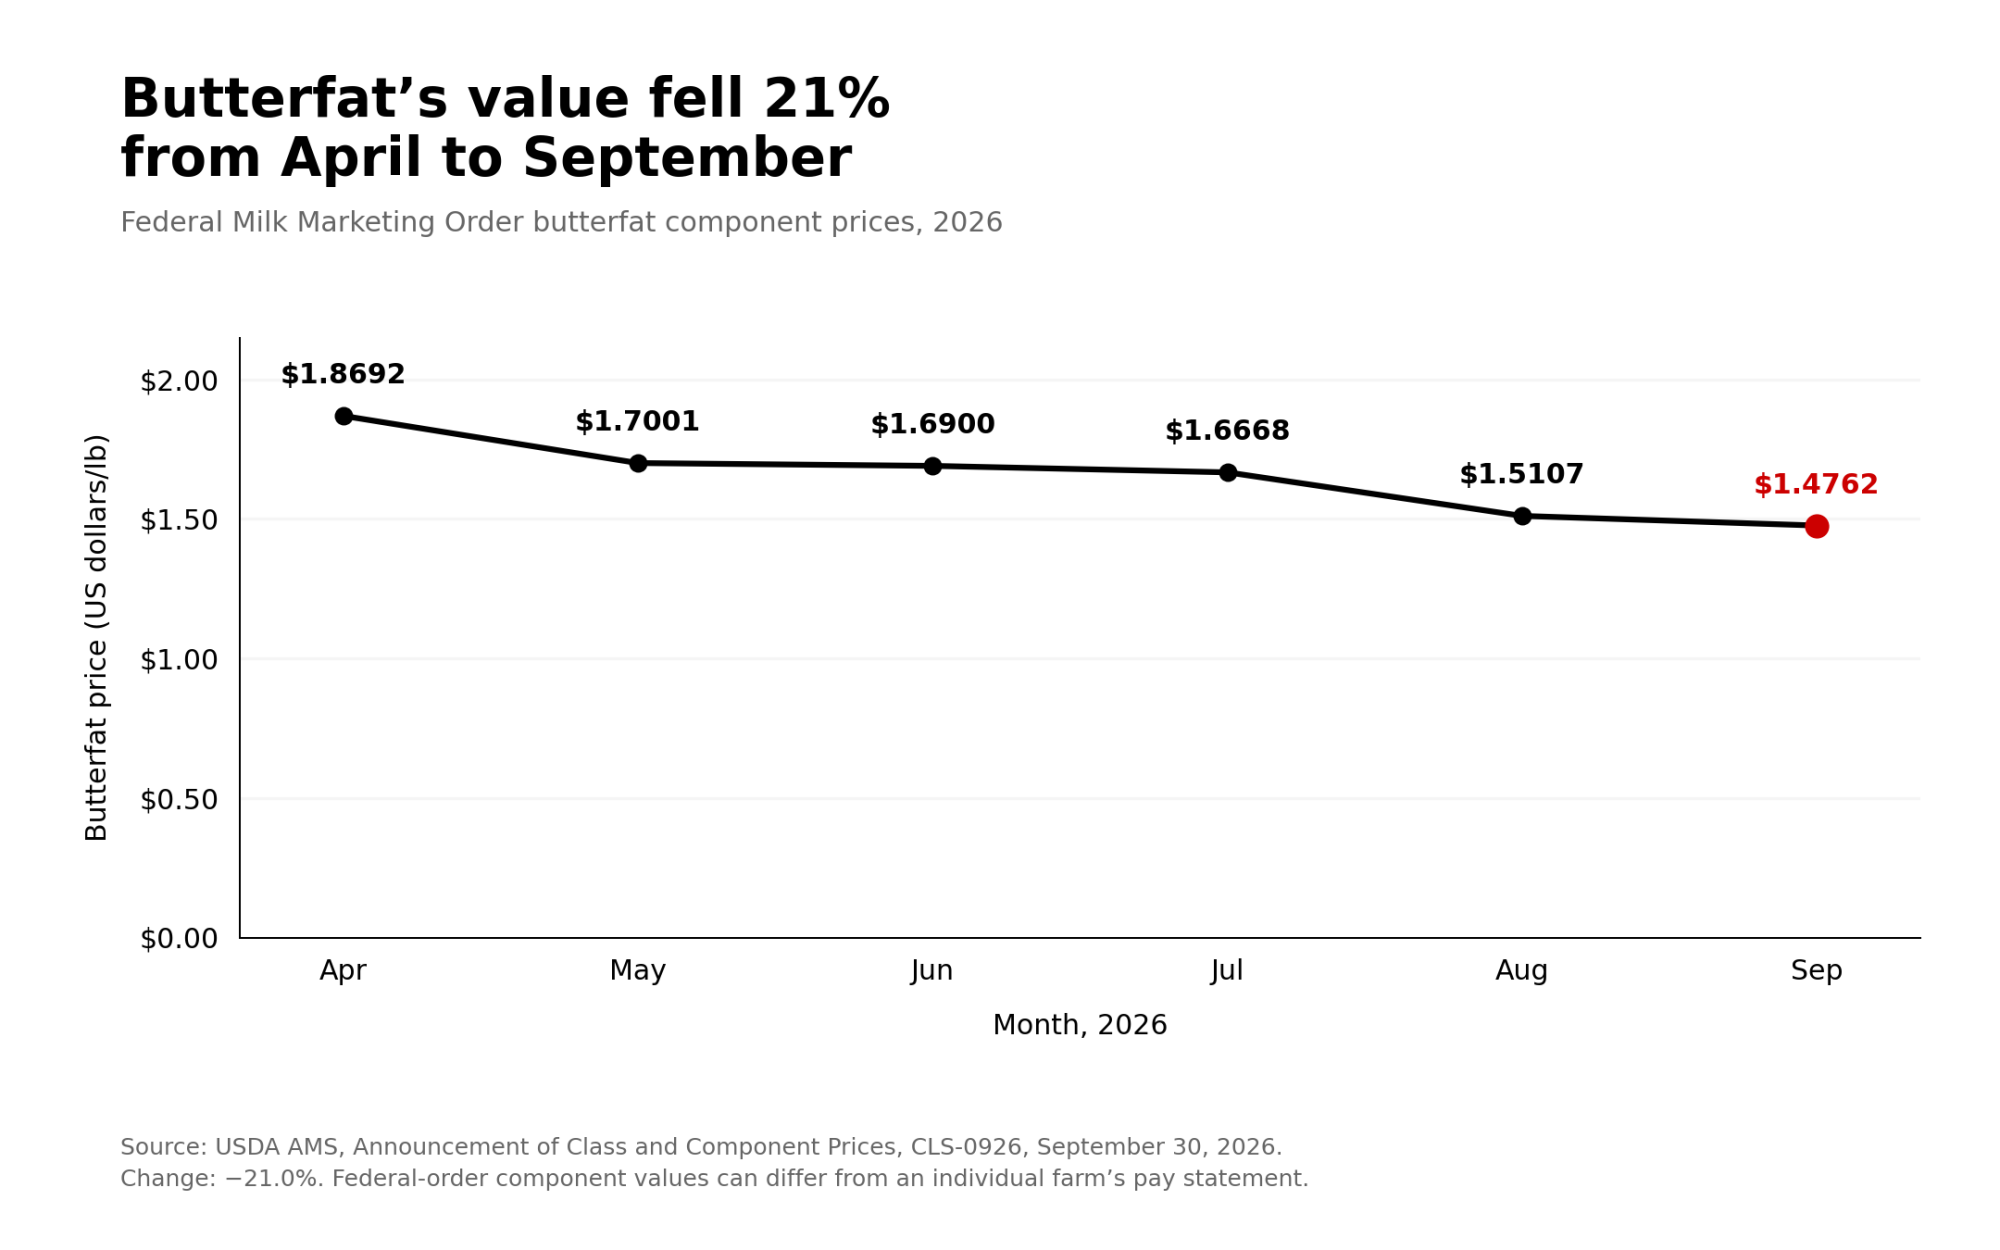
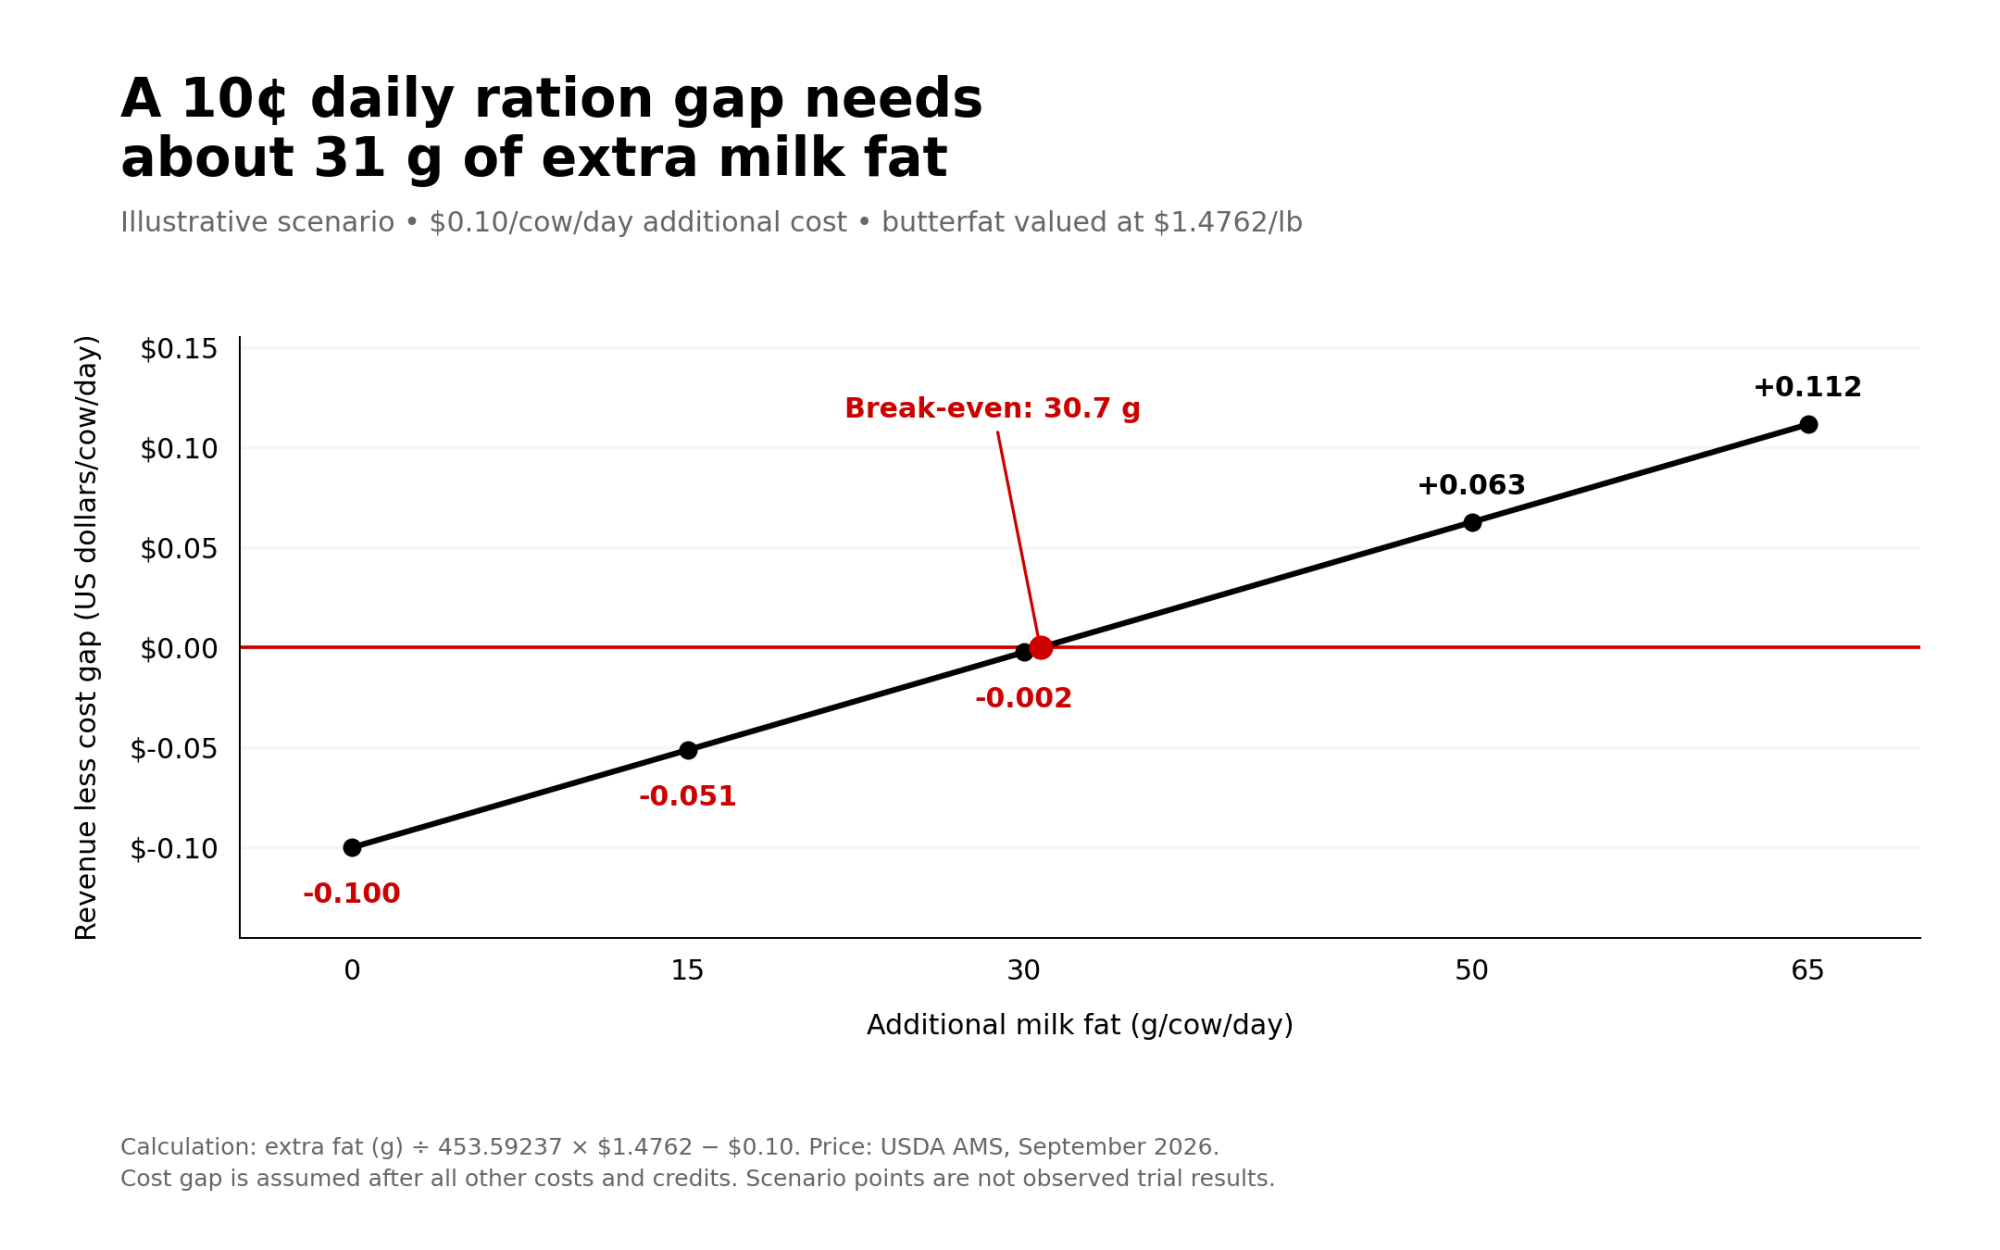
The high-oleic ration cost has to include beans, premium, roasting, true DM loss, rolling, freight, storage, testing and any MP fix. The alternative is the least-cost ration at equal NEL, MP and digestible amino acids, not conventional beans pound for pound. Use your own milk check’s fat value. Bullvine’s September 2026 Order 30 analysis put August protein at 1.87 times butterfat, and a weaker fat price raises the break-even.
The decision rule is simple. If your break-even is above Michigan State’s 0.198 lb, the best available bean trial doesn’t support the purchase. If the high-oleic ration is cheaper at equal nutrients with no fat response at all, it wins on cost alone. The beans pay at the bulk tank, not at the invoice.
What should you do next?
Timing
What to do
What it requires
Act now if
Where it backfires
30 days
Price three rations at equal NEL and MP
Delivered quotes, processing terms, freight, lab values, your nutritionist’s formulations
A quote doesn’t say whether it’s per raw or finished ton, or at what moisture
Comparing raw tons to finished tons, or counting roasting twice
90 days
Run a farm trial only once the break-even fat number is written down
Stable forage, recorded DMI, component pounds, your milk-pay formula
Your break-even is near or above 0.198 lb
Counting a higher fat test while milk drops and fat pounds stay flat
Paid response averages below break-even over the season
Locking in a premium off your best month or one unusually good load
The 30-day step is the one that matters. Get the break-even fat number in pounds per cow per day from your nutritionist before you sign the first purchase order.
High-Oleic Soybean Break-Even Calculator
Calculate the daily milk fat response required to cover your local premium.
Your Break-Even Targets
Required Extra Fat/Cow/Day:— g
Annual Premium Cost (Herd):$–
Effective Premium per Finished Bu:$–
Methodology Note
Break-Even Fat Response = (daily cost premium of the high-oleic ration − value of other supported responses) ÷ the farm’s net value per lb of fat. All three rations are balanced at equal NEL and MP, with digestible amino acids, FA, RUFAL, NDF, starch and DMI reported. Costs are compared delivered, as finished feed, on a dry-matter basis. The incremental table uses the HOSB intakes Michigan State reports. The tonnage example uses Michigan State’s 8% intake and Farmers’ Grain & Feed’s 12% swap shrink, and it describes tonnage only. The 0, 0.110 and 0.198-lb responses are stress tests, not a probability distribution.
Learn More
How to Calculate Income Over Feed Cost From Paid Components — Lock in your true margin before testing new feed additives. This operational breakdown dismantles the obsession with gross milk yield, proving exactly why isolating component revenue against ration premiums dictates survival in a high-input market.
How RUFAL Changes Your Herd’s Milk Fat Depression Risk — Unsaturated fats in the rumen determine whether your expensive high-oleic swap actually yields bulk tank butterfat. Exposes the biological bottleneck behind component drops, arming you with a targeted feeding protocol to protect daily milk cheques.
The Hidden Maintenance Overhead: Calculating Hold-to-Proof Costs — Carrying unproven genetics to their first official proof burns capital just like inefficient feed contracts. Analyzes the crushing maintenance overhead of housing sires, delivering a hard-math framework to identify which investments actually warrant the operating cost.
The Sunday Read Dairy Professionals Don’t Skip.
Every week, thousands of producers, breeders, and industry insiders open Bullvine Weekly for genetics insights, market shifts, and profit strategies they won’t find anywhere else. One email. Five minutes. Smarter decisions all week.
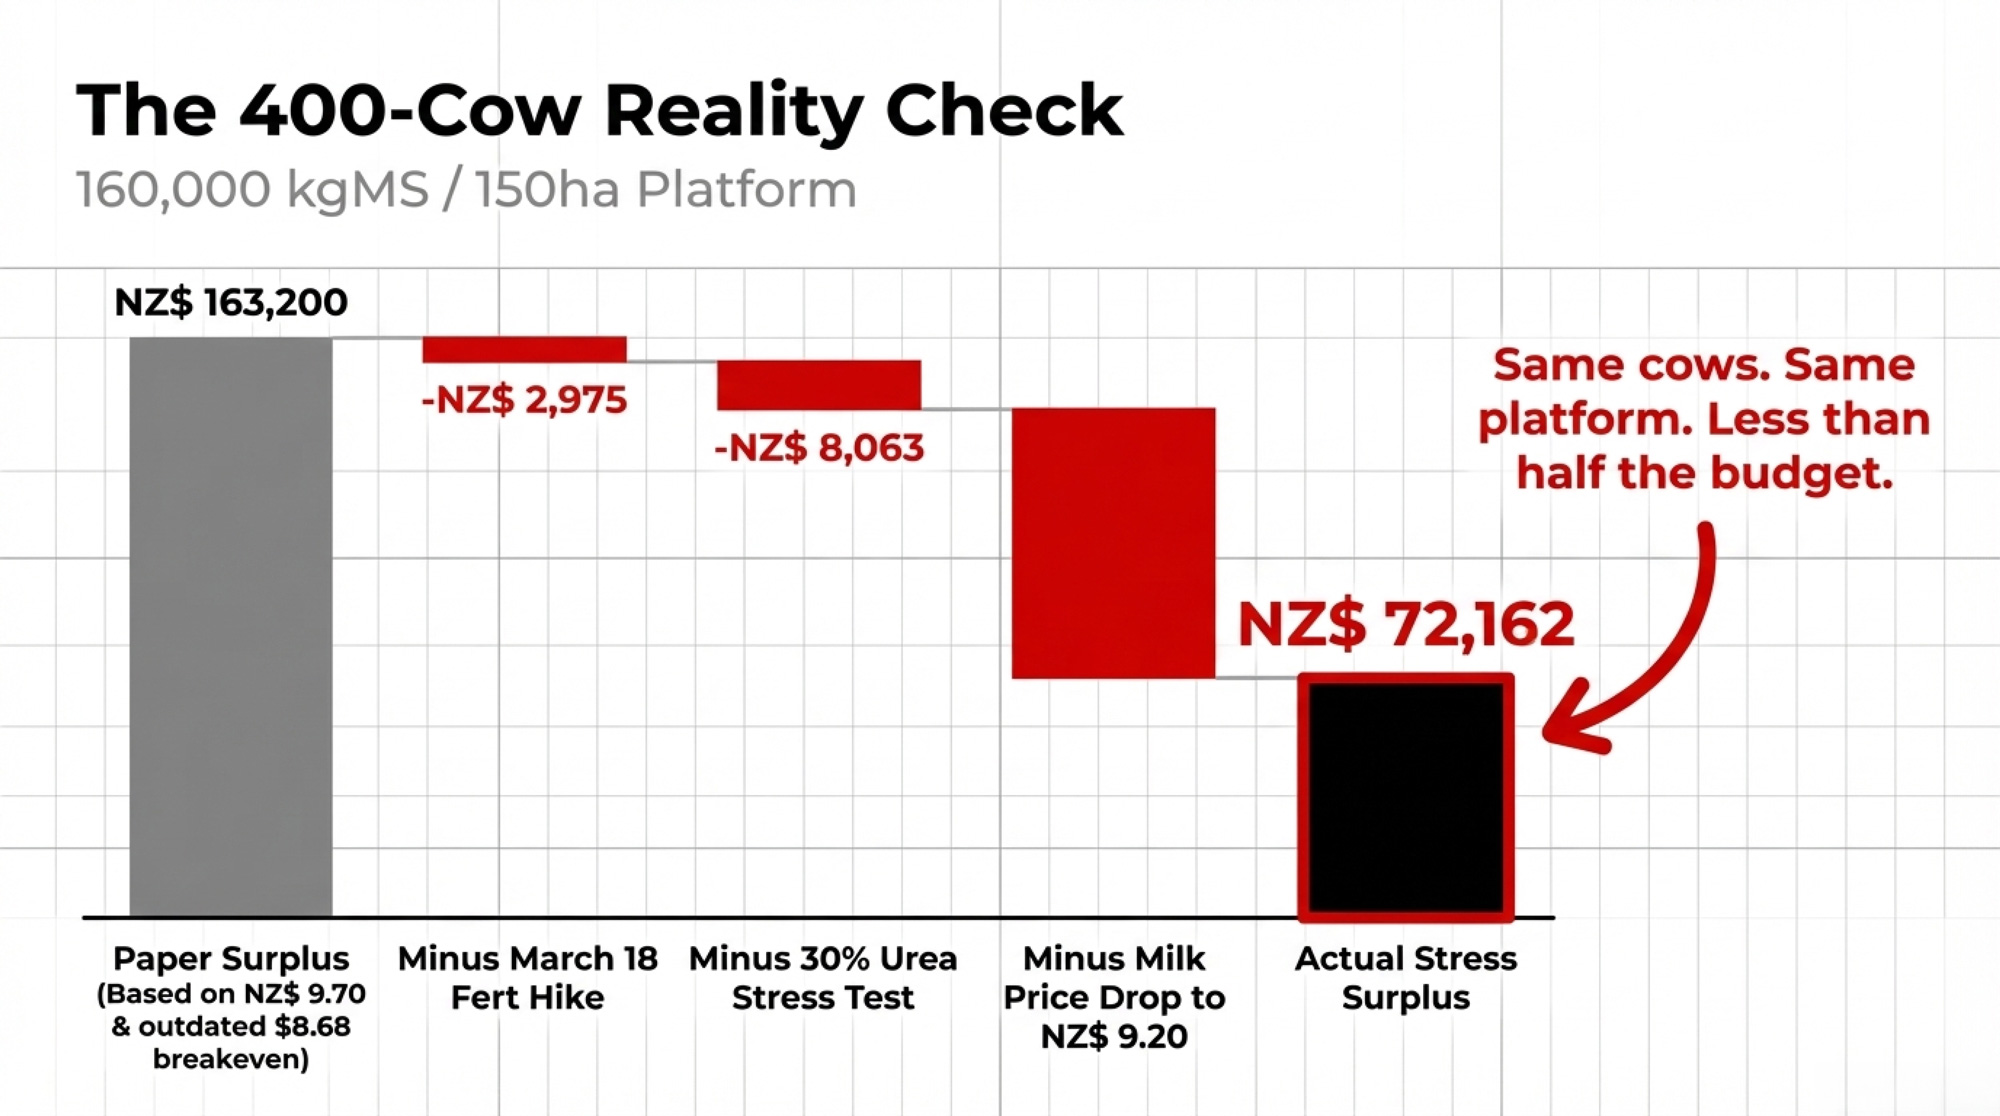
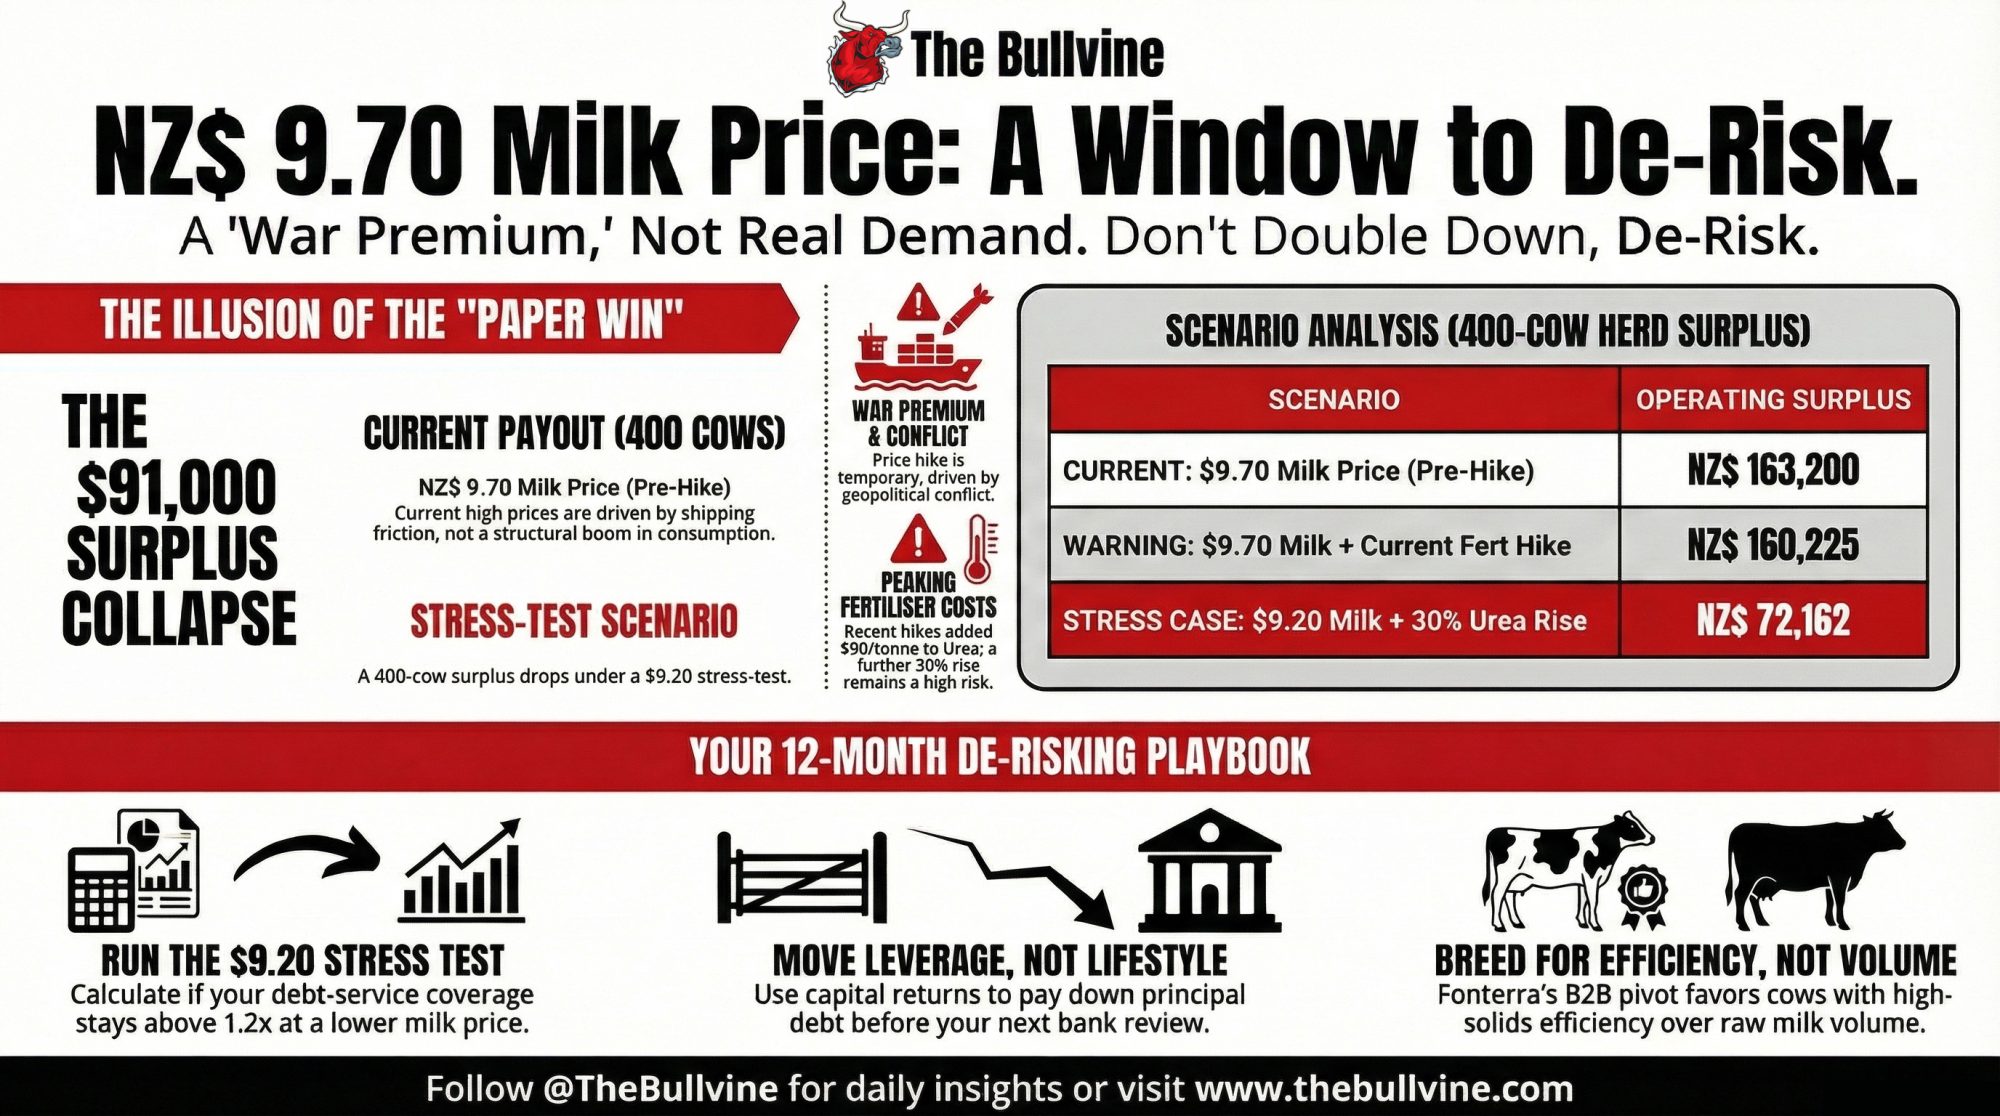
At NZ$9.70, a 400‑cow herd clears NZ$163,200. At NZ$9.20 with post‑March fert costs, it’s NZ$72,162. Same cows. Same platform. Different budget.
Executive Summary: Fonterra’s NZ$9.70/kgMS midpoint looks like a win, but ANZ already pegs 2026/27 closer to NZ$8.70, and Ballance just added NZ$90/t to urea. A 400‑cow herd that appears to clear NZ$163,200 at NZ$9.70 and DairyNZ’s NZ$8.68 breakeven can see that surplus collapse to about NZ$72,000 if milk slips to NZ$9.20 and nitrogen climbs another 30%. The co‑op has hedged itself with a 10‑year raw milk deal, a 3‑year ingredients agreement, and roughly NZ$3.9B in returns, but none of that changes your breakeven, leverage, or debt‑service coverage. This piece walks through the barn math step‑by‑step so you can plug in your own kgMS, fert tonnes, and debt schedule. It shows why herds in the 60–65% debt‑to‑asset band are in a “use this payout to de‑risk or double down” 12‑month window. And it lays out a practical playbook: how to stress‑test at NZ$9.20 plus higher fert, what to take to your next bank review, and how to decide whether to lock in nitrogen or ride the market.
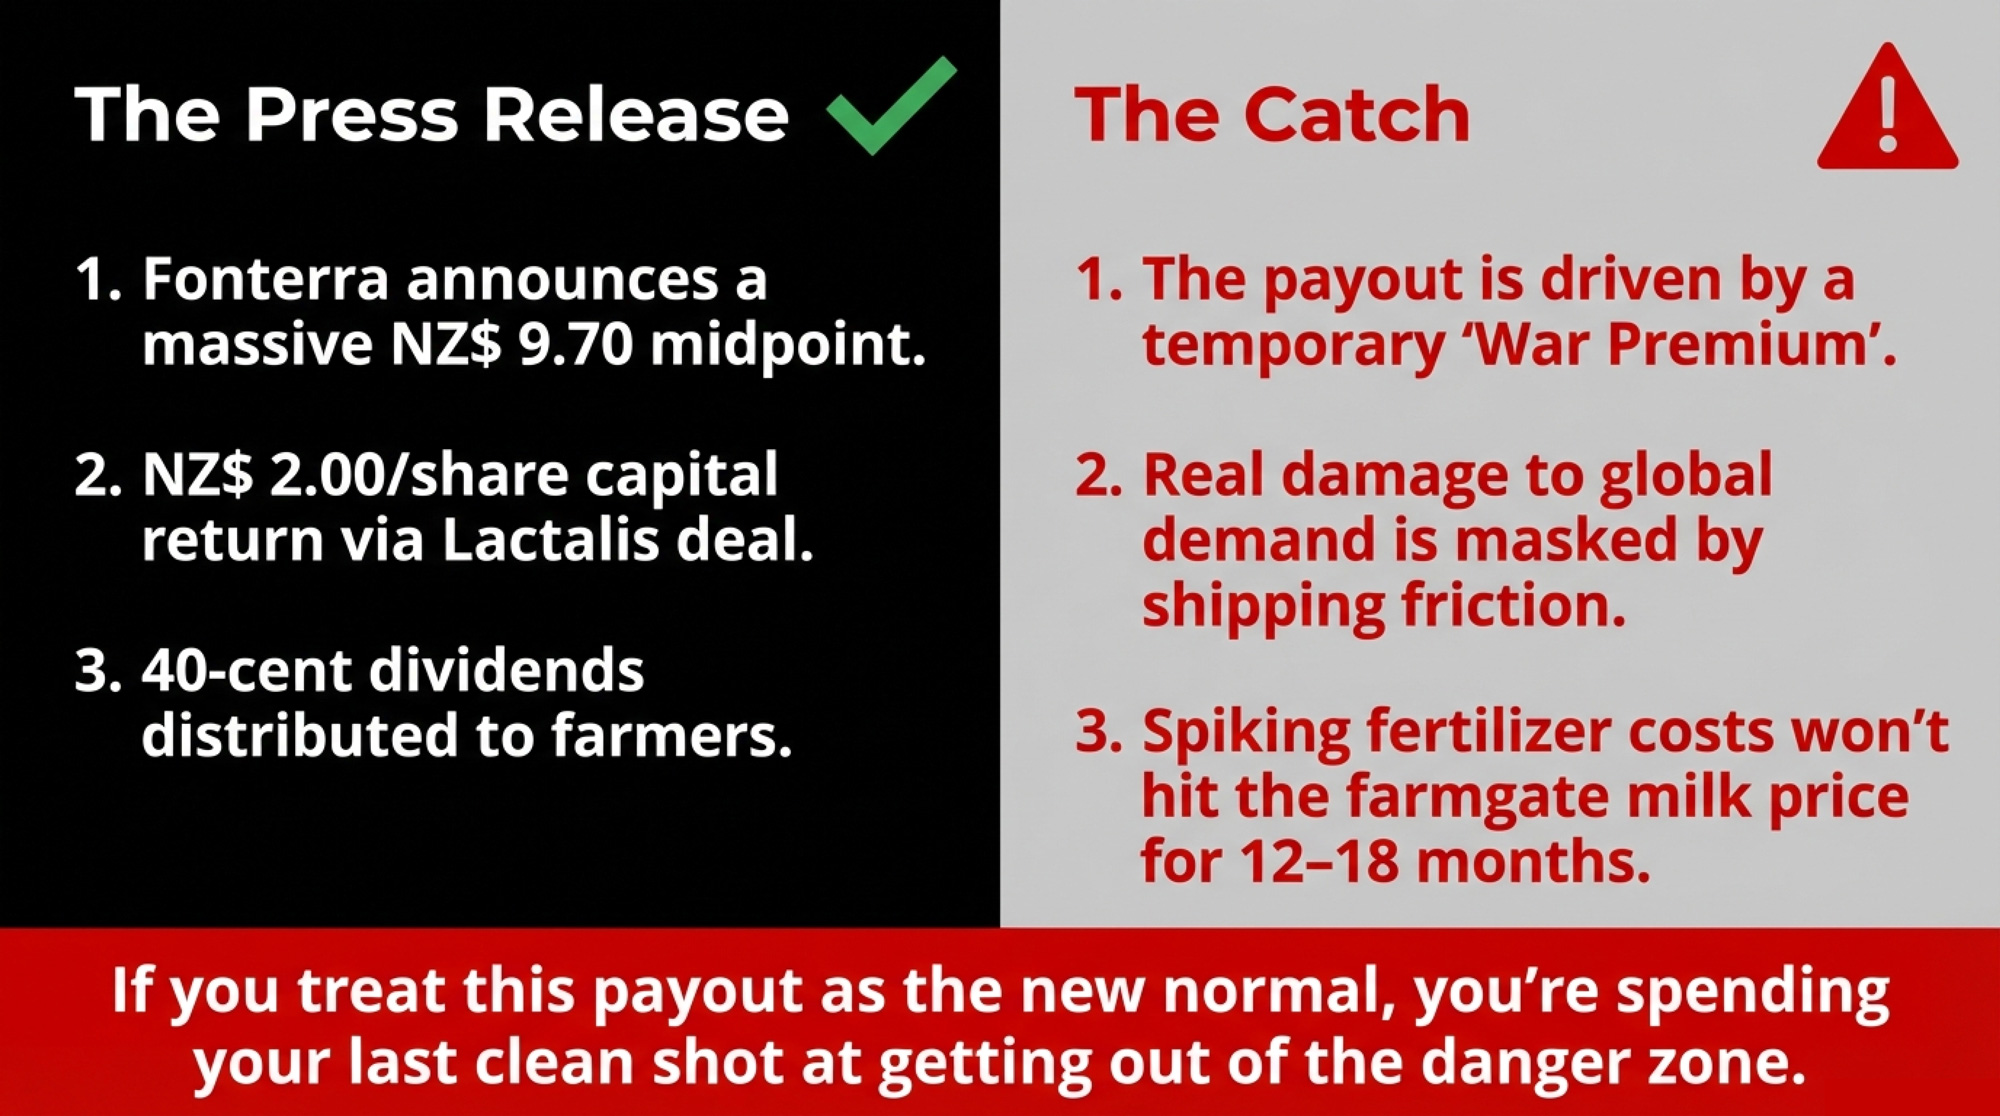
For a 400‑cow North Island dairy sitting at about 65% debt‑to‑asset, Fonterra’s NZ$9.70 per kgMS midpoint, NZ$2.00 per share capital return, and 40 cents in dividends feel like a long‑overdue rescue package. On paper, it’s the first season in two years where the milk cheque looks big enough to fix fences, upgrade gear, and finally get the bank manager off your back.
The catch is simple and uncomfortable: those record numbers are boosted by short‑term conflict and shipping friction, while the real damage to demand and fertiliser costs won’t show up in the farmgate milk price for another 12–18 months. If you treat this payout as the new normal, you may be spending what should’ve been your last clean shot at moving out of the danger band — not because the numbers are wrong, but because the conditions behind them may not last.
A 400‑Cow “Win” That’s Not as Fat as It Looks.
Let’s stay with that 400‑cow example, because that’s exactly where a lot of New Zealand herds sit. Call him Mark — 400 cows on about 150 hectares of milking platform in the North Island, running an intensive pasture system and carrying roughly 65% debt‑to‑asset after the last few tough seasons.
Scenario
400 cows (160k kgMS)
800 cows (336k kgMS)
1,500 cows (660k kgMS)
NZ$9.70 FMP, pre-hike costs
NZ$163,200
NZ$342,720
NZ$673,200
NZ$9.70 + Ballance March hike
NZ$160,225
NZ$339,672
NZ$670,105
NZ$9.70 + 30% urea stress
NZ$152,162
NZ$319,544
NZ$628,843
NZ$9.20 + 30% urea stress
🔴 NZ$72,162
🔴 NZ$152,644
🔴 NZ$301,991
On March 22, 2026, Fonterra reported half‑year FY26 numbers: NZ$13.9 billion in revenue and NZ$750 million net profit after tax for the six months to January 31, 2026. On the back of that, the co‑op lifted its forecast Farmgate Milk Price range to NZ$9.40–NZ$10.00 per kgMS, with a midpoint of NZ$9.70 — up from a previous midpoint of NZ$9.50. It also confirmed an interim dividend of 24 cents per share and a special 16‑cent Mainland dividend, and signalled a planned NZ$2.00 per share capital return tied to completion of its Lactalis transactions.
DairyNZ’s Econ Tracker, updated June 26, 2025, put the national average breakeven milk price at NZ$8.68 per kgMS for the 2025/26 season, up from NZ$8.41 the year before. Head of economics Mark Storey linked that increase to higher tax obligations and rising farm working expenses, especially feed, fertiliser, and energy.
If Mark’s breakeven matched that national average, his margin at NZ$9.70 looks like this:
9.70 − 8.68 = NZ$1.02/kgMS margin.
At 160,000 kgMS from 400 cows, that’s NZ$163,200 in operating surplus for the season.
That’s before the capital return and dividends even hit his account. It’s the kind of number that makes you think about new iron, extra land, maybe finally getting ahead of the bank.
But DairyNZ’s NZ$8.68 breakeven was calculated before March 18, 2026.
The Fertiliser Hit You Didn’t Budget For
Four days before Fonterra released those HY26 numbers, Ballance Agri‑Nutrients told farmers it was raising fertiliser prices again. In a March 18 update, Ballance said sulphur‑based and Yara‑branded products would increase immediately, with other products following on March 26, citing “rapidly changing circumstances” in global markets and conflict in the Middle East.
The new Ballance schedule landed like this for New Zealand farmers:
Urea: up NZ$90/tonne, to about NZ$1,075/t.
SustaiN: up NZ$90/t, to around NZ$1,124/t.
DAP: up NZ$75/t, to roughly NZ$1,603/t.
Superphosphate: up NZ$35/t, to about NZ$549/t.
On Mark’s 150‑hectare platform, let’s assume a fairly intensive fertility program — around 25 tonnes of urea, 5 tonnes of DAP, and 10 tonnes of super in a season. Plug your own rates in here, but watch what happens with these numbers:
Urea: 25 t × NZ$90/t = NZ$2,250.
DAP: 5 t × NZ$75/t = NZ$375.
Super: 10 t × NZ$35/t = NZ$350.
That’s an extra NZ$2,975 in fertiliser costs purely from the March increase. Spread over 160,000 kgMS, it’s about 1.9 cents/kgMS off his margin.
So Mark’s “paper” margin drops from NZ$1.02/kgMS to roughly NZ$1.00/kgMS after just one pricing email. Doesn’t sound like much. Not yet. But it’s already trimming a margin most operators are still mentally pencilling at NZ$1.02/kgMS.
The 30% Urea Stress Test: How Fast the Cushion Shrinks
Ballance’s head of procurement, Shane Crean, has been warning since early 2026 that volatility is now the norm rather than the exception: India’s tender timing, China’s DAP export settings, and instability around the Strait of Hormuz are all pushing nitrogen prices higher and making supply less predictable.
The Hormuz corridor carries an outsized share of the global fertiliser trade. Gulf producers supply a significant share of the global trade in nitrogen and phosphate, and New Zealand is directly exposed through imports of urea and other products.
There’s a recent precedent. When Russia invaded Ukraine in early 2022, putting a noticeable share of global urea exports at risk, NZ‑dollar nitrogen prices jumped sharply over a short period. Early commentary around the 2026 Hormuz disruption already highlights quick, double‑digit percentage gains in urea benchmarks as cargos are rerouted and insurers reprice risk.
So take a conservative stress case on top of what’s already happened: another 30% rise in urea from today’s NZ$1,075/t level.
In our example, 25 tonnes of urea, 30% of NZ$1,075 is about NZ$322.50/t.
Extra cost from that move: 25 t × NZ$322.50/t ≈ NZ$8,063.
Add the NZ$2,975 he’s already absorbed from the March hike.
Total incremental fertiliser cost versus pre‑March pricing: roughly NZ$11,038 for the season.
Mark’s apparent NZ$163,200 surplus becomes about NZ$152,162 before any other cost shifts. It’s still money. It’s just less room for error than the milk cheque suggests.
Here’s how that scales for three herd sizes, assuming similar kgMS per cow and the same per‑kg margin changes:
Scenario
400 cows (160k kgMS)
800 cows (336k kgMS)
1,500 cows (660k kgMS)
NZ$9.70 FMP, pre‑hike costs
NZ$163,200
NZ$342,720
NZ$673,200
NZ$9.70 + Ballance hike
NZ$160,225
NZ$339,672
NZ$670,105
NZ$9.70 + 30% urea stress
NZ$152,162
NZ$319,544
NZ$628,843
NZ$9.20 + 30% urea stress
NZ$72,162
NZ$152,644
NZ$301,991
That last row is the uncomfortable one. It combines a NZ$9.20/kgMS milk price — the lower half of Fonterra’s own NZ$9.40–NZ$10.00 forecast range for 2025/26 — with the kind of fertiliser stress we’ve just walked through.
And NZ$9.20 isn’t even the bear case. ANZ’s February 10, 2026, forecast update for the 2026/27 season opened at NZ.70/kgMS, on the assumption that the current price surge would lose momentum and global supply pressures would reassert themselves. That was before the March Hormuz escalation pushed freight costs higher and spooked more Gulf buyers.
This isn’t about proving you’re doomed. It’s about making sure your budget matches the risk, not the press release.
The Global Ripple: Why North American Producers Should Care
It’s easy to look at NZ$9.70 and think, “That’s their problem. Different market.” It isn’t.
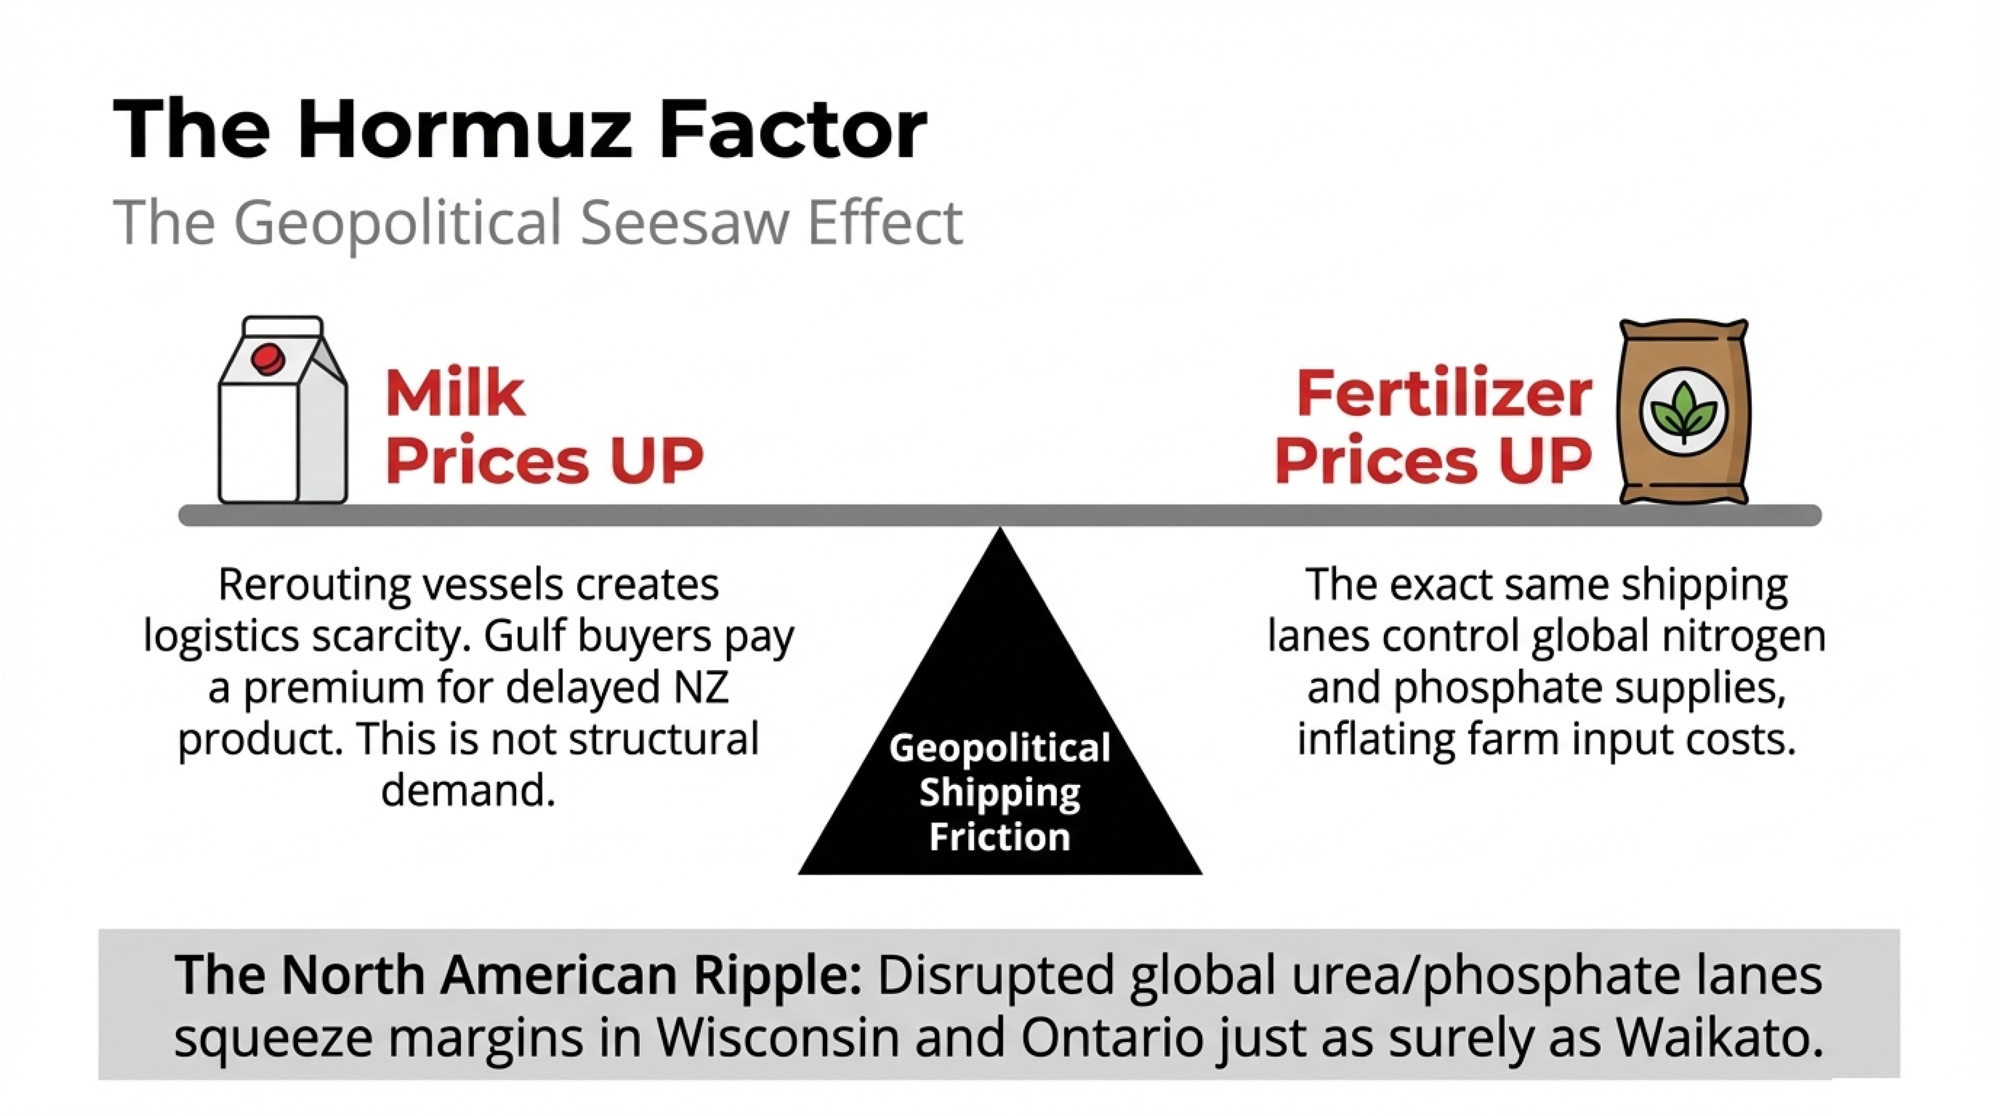
When New Zealand buyers and their customers start testing alternatives — shifting some skim and whole milk powder demand toward EU or U.S. suppliers — it doesn’t just reshuffle who wins a tender. It creates a temporary floorunder global dairy prices that’s built more on logistics friction and risk premiums than on a genuine jump in consumption.
Right now, that floor is propped up by longer shipping routes around the Cape of Good Hope, higher war‑risk insurance, and a premium for any supplier who can deliver reliably into the Middle East and North Africa. If shipping normalises or Gulf buyers complete their pivot toward alternative origins, that floor can drop fast — leaving anyone who budgeted off today’s “war premium” exposed.
The same goes for fertiliser. Analysts point out that a meaningful share of globally traded nitrogen‑rich urea and phosphates depends on Gulf producers and shipping lanes. U.S. agriculture has some buffer because it produces most of its ammonia domestically, but imported urea and phosphates still leave crop and dairy margins exposed to disruptions in the Strait of Hormuz corridor.
That’s the real “Hormuz Factor.” It’s not just an NZ shipping problem — it’s a global nitrogen and energy problem that puts pressure on Midwestern and Canadian fertiliser and feed costs in a different but still serious way. If fertiliser prices grind higher while crop prices don’t move in step — a risk several analysts are flagging under a prolonged Hormuz disruption — margins get squeezed in Wisconsin and Ontario just as surely as they do in Waikato, even if the exact numbers differ.
If you’re thinking ahead on dairy farm debt management 2026, this isn’t background noise. It’s one of the main reasons your 12‑month plan needs a stress test baked in.
Is GDT’s 2026 Rally Real Demand or Just a War Premium?
The whole NZ$9.70 story depends on what’s really driving commodity prices right now.
At the March 4, 2026 Global Dairy Trade event, the overall price index rose 5.7% — the fifth consecutive increase since January. Whole milk powder traded around US$3,863/t, skim milk powder rose by roughly 9%, and butter rose by just over 6%. Commentators called it evidence of “resilient demand,” pointing to buyers in the Middle East and Asia still bidding aggressively despite freight headaches.
That’s accurate at the surface level. Buyers are there. But a meaningful chunk of that price strength is better described as a friction premium than a demand boom.
With vessels being rerouted around the Cape of Good Hope and insurance costs rising, it’s simply harder and more expensive to move product from New Zealand to key buyers, including those in the Gulf. The buyers who still want NZ products are paying up to secure them. That’s scarcity in logistics, not a structural jump in how much dairy the world wants to consume.
ANZ’s February 2026 forecast update made a similar point. Agri economist Susan Dilly noted that while the GDT bounce was “great news for dairy farmers,” prices remained “a lot closer to the bottom than the top,” and that buyers “perhaps spooked by geopolitical tensions in the Middle East and elsewhere” were helping to drive the rebound after the late‑2025 sell‑off overshot on the downside.
At the same time, some large importers in the Middle East and North Africa are testing alternatives. EU skim milk powder has become increasingly price‑competitive in MENA markets, and commentary around a larger‑than‑expected ONIL milk powder tender in early 2024 highlighted EU suppliers covering most SMP volumes, even as New Zealand, Europe, and South America shared the WMP business. The pattern isn’t universal, but it’s a clear signal: when NZ gets more expensive or harder to ship, EU offers get a closer look.
Put those pieces together, and you get a two‑stage story:
Short‑term: GDT prices are being pulled up by higher shipping friction and supply risk. That’s what supports NZ$9.70 today.
Medium‑term: As Gulf and MENA buyers adjust their tendering and contract patterns, some volumes that historically defaulted to NZ may shift more permanently toward competing origins. That risk doesn’t show up in this season’s milk price. It shows up in next season’s starting point.
As Dilly told Rural News Group in December 2025, “nearly half of the current season’s production has already been contracted, so GDT results over the rest of the season will have a bigger impact on next year’s starting point than this year’s endpoint.”
That’s the transmission lag that matters here. Mark doesn’t feel it yet. His cheque says NZ$9.70. The tender rooms and freight lanes are determining what his 2026/27 milk price will look like — and they’re doing so long before Fonterra updates its range on the website.
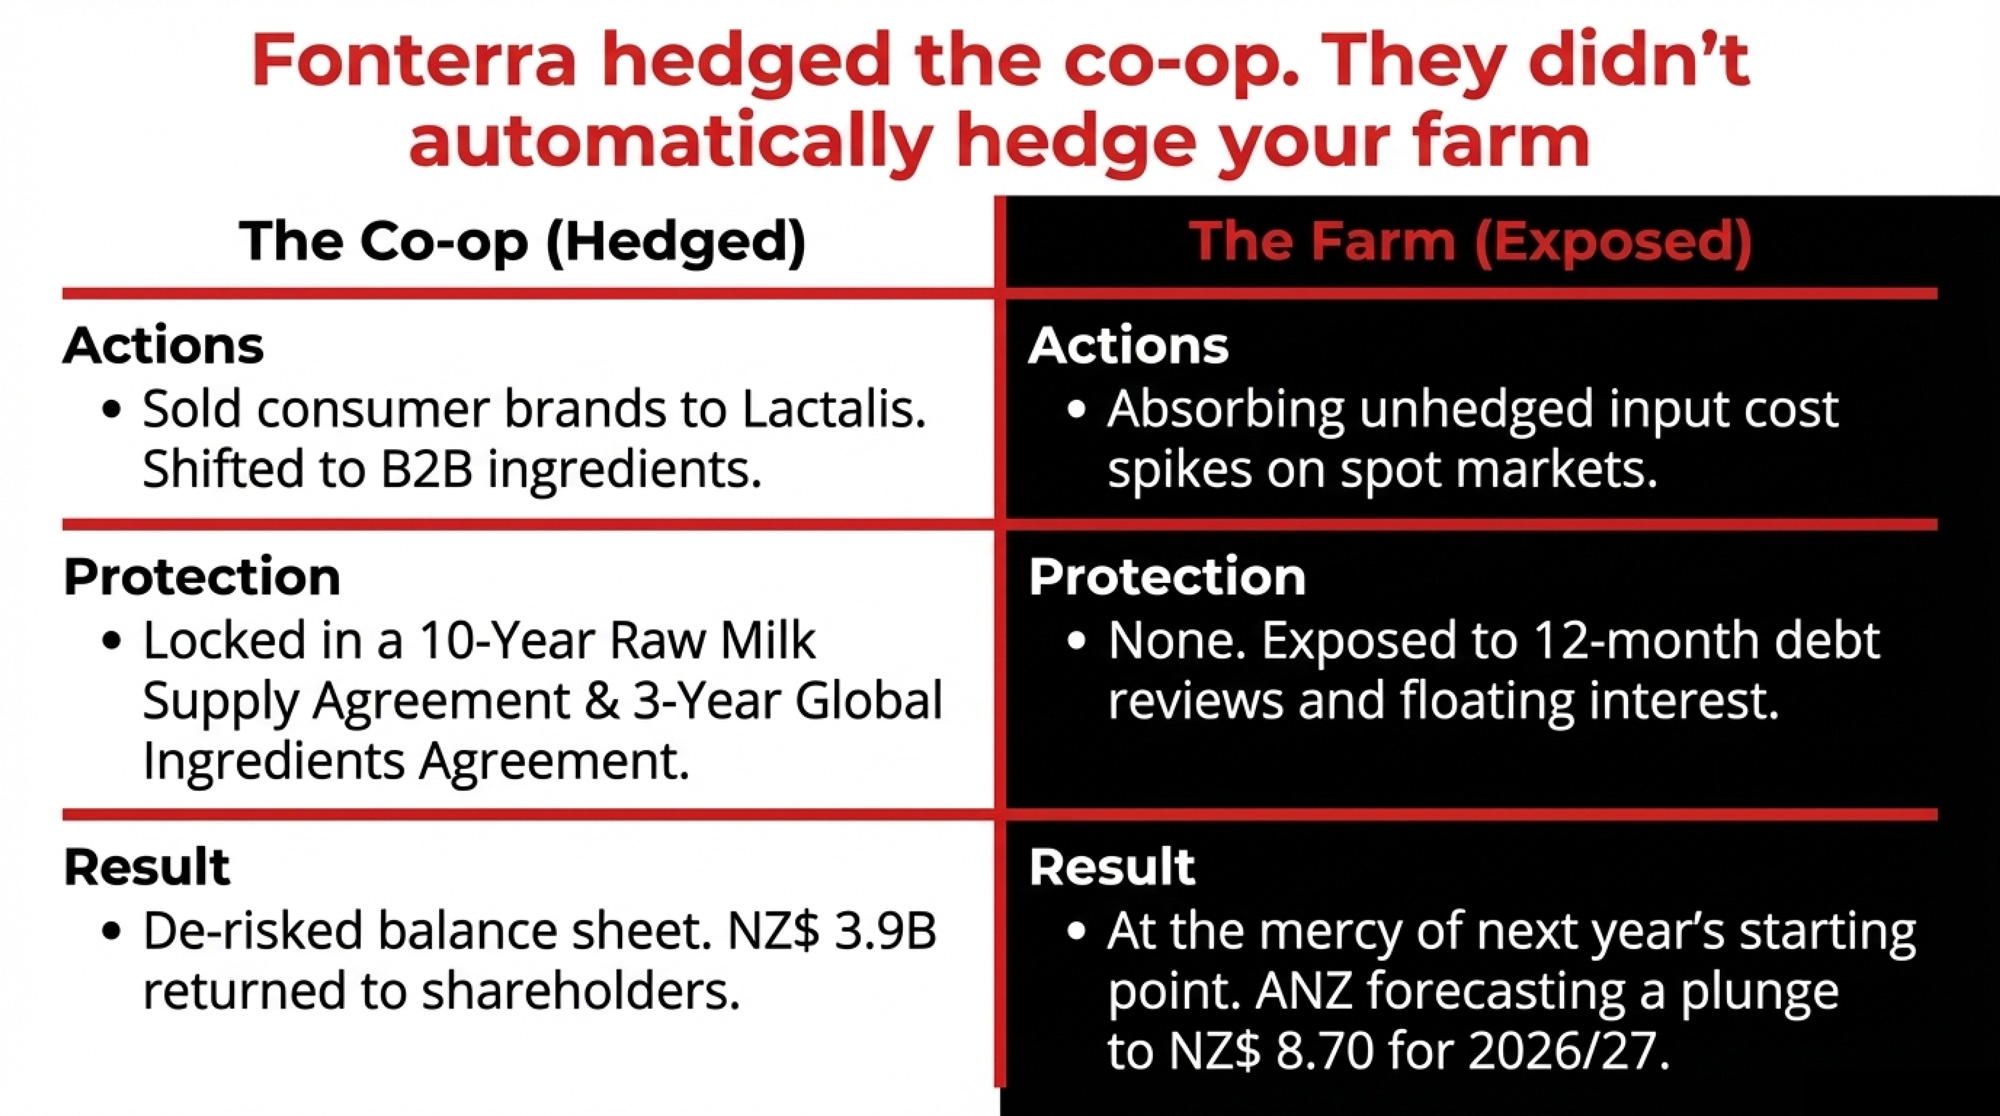
Fonterra Hedged the Co‑op. It Didn’t Automatically Hedge the Farm.
One thing is clear: Fonterra’s board and management haven’t been blind to any of this.
In its HY26 commentary, the co‑op explicitly noted that rising geopolitical risk in the Middle East, especially around the Strait of Hormuz, could disrupt shipping routes, force rerouting, increase inventory levels, and add volatility to global commodity prices. It also warned that some exports could face delivery delays or require re-routing, potentially increasing inventory and costs.
New Zealand’s official trade data underscores how important these markets are. USDA’s 2025 semi‑annual report shows Algeria taking about 10% of New Zealand’s whole milk powder exports in 2024, with the United Arab Emirates taking roughly 6.6%. For butter and AMF, key destinations included Saudi Arabia at about 7% of volume, alongside China, Australia, and the U.S. Add in other Gulf states, and you’re talking about a meaningful slice of NZ’s WMP and butter trade tied to a region now sitting behind a higher‑risk shipping corridor.
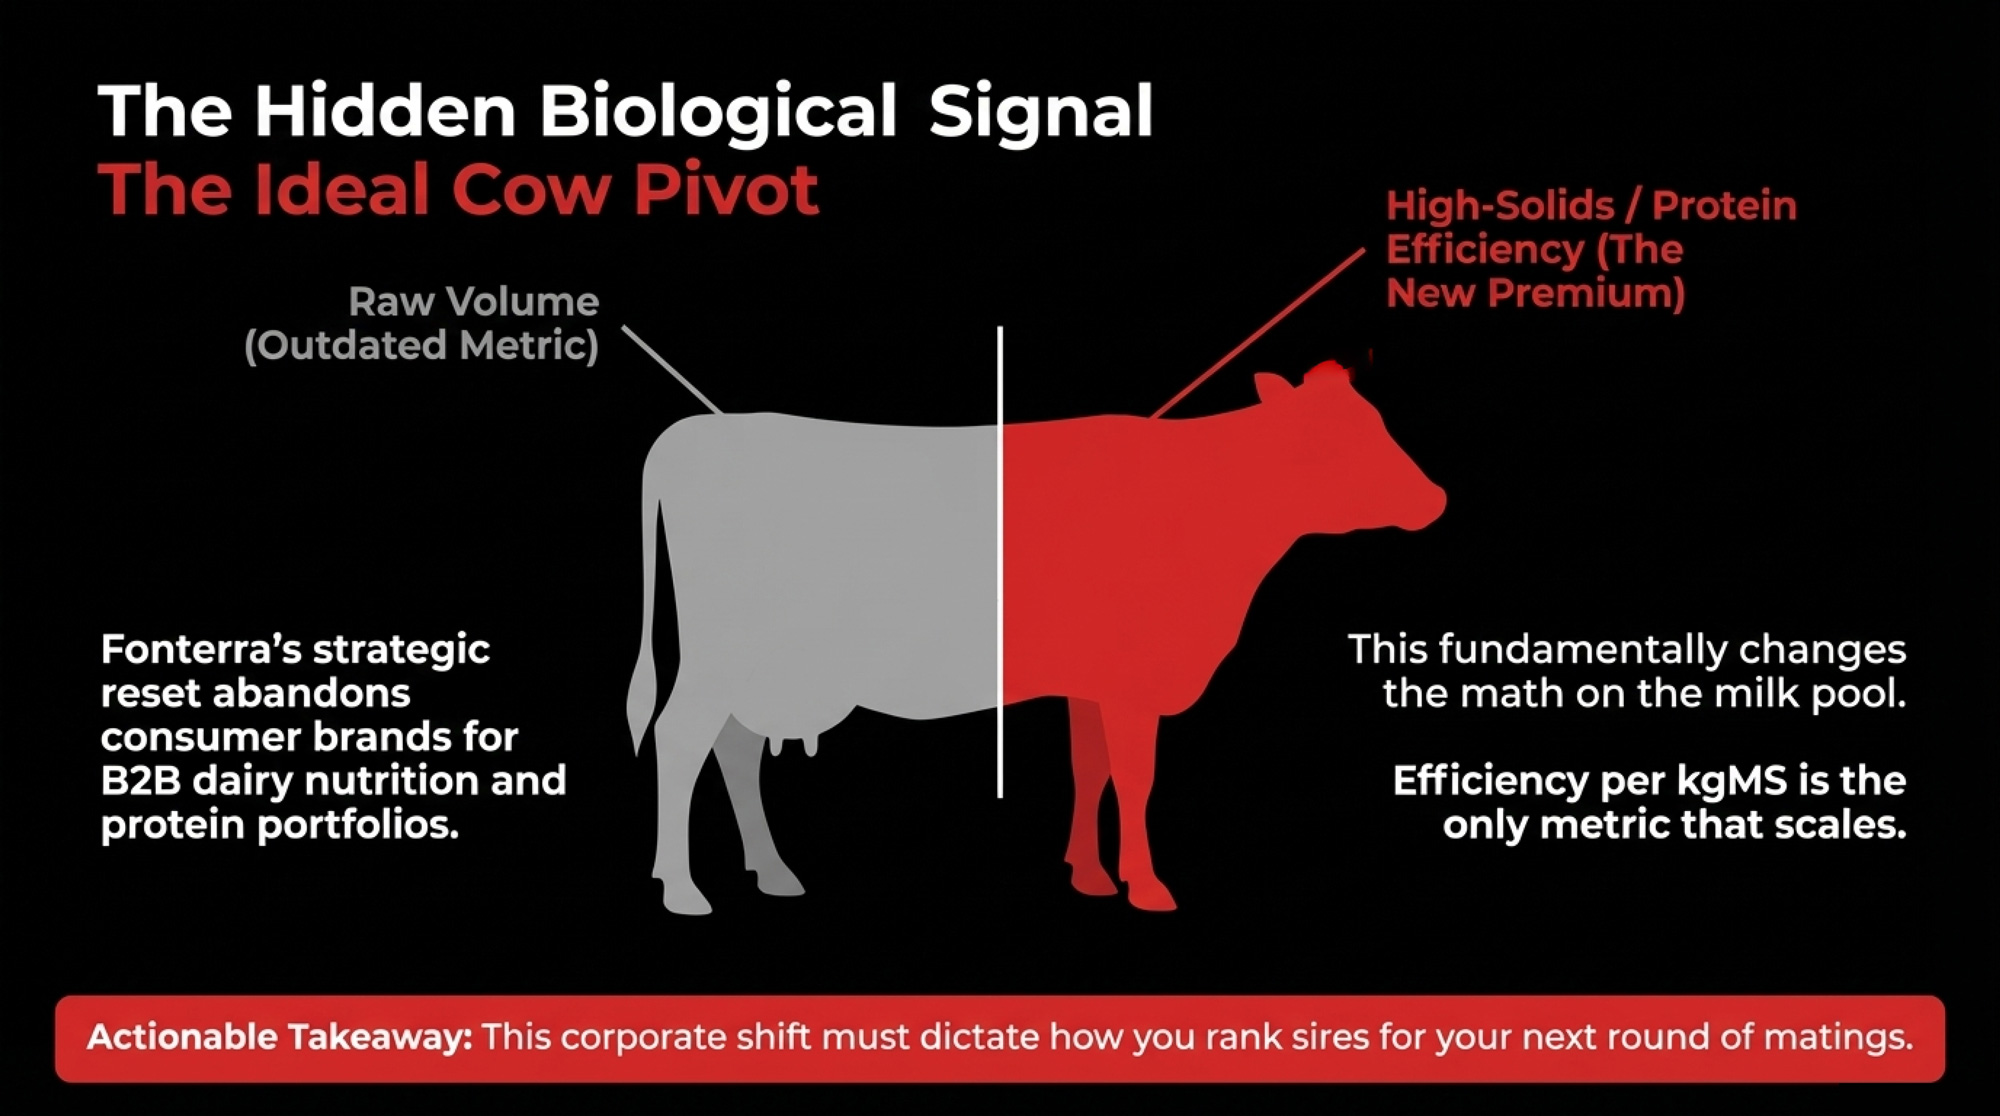
At the same time, Fonterra is in the middle of a major strategic pivot. The sale of its Mainland and other consumer brands to Lactalis is designed to turn the co‑op into a more focused B2B dairy nutrition processor, a shift Fonterra has described as “completing its strategic reset.” Regulatory approvals were progressing through early 2026, with completion expected to enable planned capital returns. The deal includes two key supply agreements that will keep the relationship between the co‑op and its former brands alive:
A Raw Milk Supply Agreement with an initial term of ten years, automatically renewing unless either party terminates with 36 months’ notice.
A Global Ingredients Supply Agreement with an initial term of three years, also auto‑renewing with 36 months’ notice to terminate.
From Fonterra’s vantage point, the logic is coherent. The co‑op:
De‑risks its own balance sheet by exiting volatile consumer brands.
Simplifies its business model to focus on B2B ingredients and dairy nutrition.
Locks in demand for its milk pool through the RMSA and GSA.
Delivers a significant cash distribution to farmer‑shareholders — external coverage pegs total cash returns around NZ$3.9 billion once dividends and capital returns are combined.
Reports a return on capital for continuing operations that sits within its 10–12% target band.
If you think in terms of genetics rather than just cheques, this pivot matters. Fonterra’s growth talk now leans heavily into “higher‑value ingredients and nutrition solutions,” with strong earnings contributions from its protein portfolio and Foodservice channels. That naturally pushes the ideal New Zealand cow further toward high solids and efficiency per kgMS, not just raw volume — which is how many genetics‑focused suppliers are reading the signal as they rank sires for the Fonterra milk pool.
From Mark’s vantage point, it looks different.
The short‑term upside — NZ$9.70, dividends, capital return — is very real. It hits his bank account this season. The medium‑term downside — structural Gulf diversification, GDT prices normalising once the war premium fades, and sticky higher fertiliser costs — will land primarily on individual farm P&Ls.
Fonterra’s strategic moves have effectively hedged the co‑op’s position. They haven’t automatically hedged individual farms. The RMSA keeps NZ plants running. The three‑year GSA keeps ingredients flowing. Neither one changes Mark’s breakeven per kgMS, his debt‑to‑asset ratio, or how his lender reads the risk.
The co‑op has used a strong earnings run and a timely asset sale to lock in its own risk position and reward shareholders. The question is whether farms like Mark’s use this same window to de‑risk themselves — or to lean harder into a milk price whose supporting conditions may not hold into 2026/27.
What to Do Before Your Next Bank Review
If you’re sitting somewhere around 60–65% debt‑to‑asset like Mark, you’re not unique. You’re also in the band, many lenders quietly file under “we’ll work with you, but we’re watching.”
The single most important move in the next 30 days isn’t a new tractor, more cows, or a tidy new shed. It’s what you do with this season’s Fonterra cash before your relationship manager walks through the door.
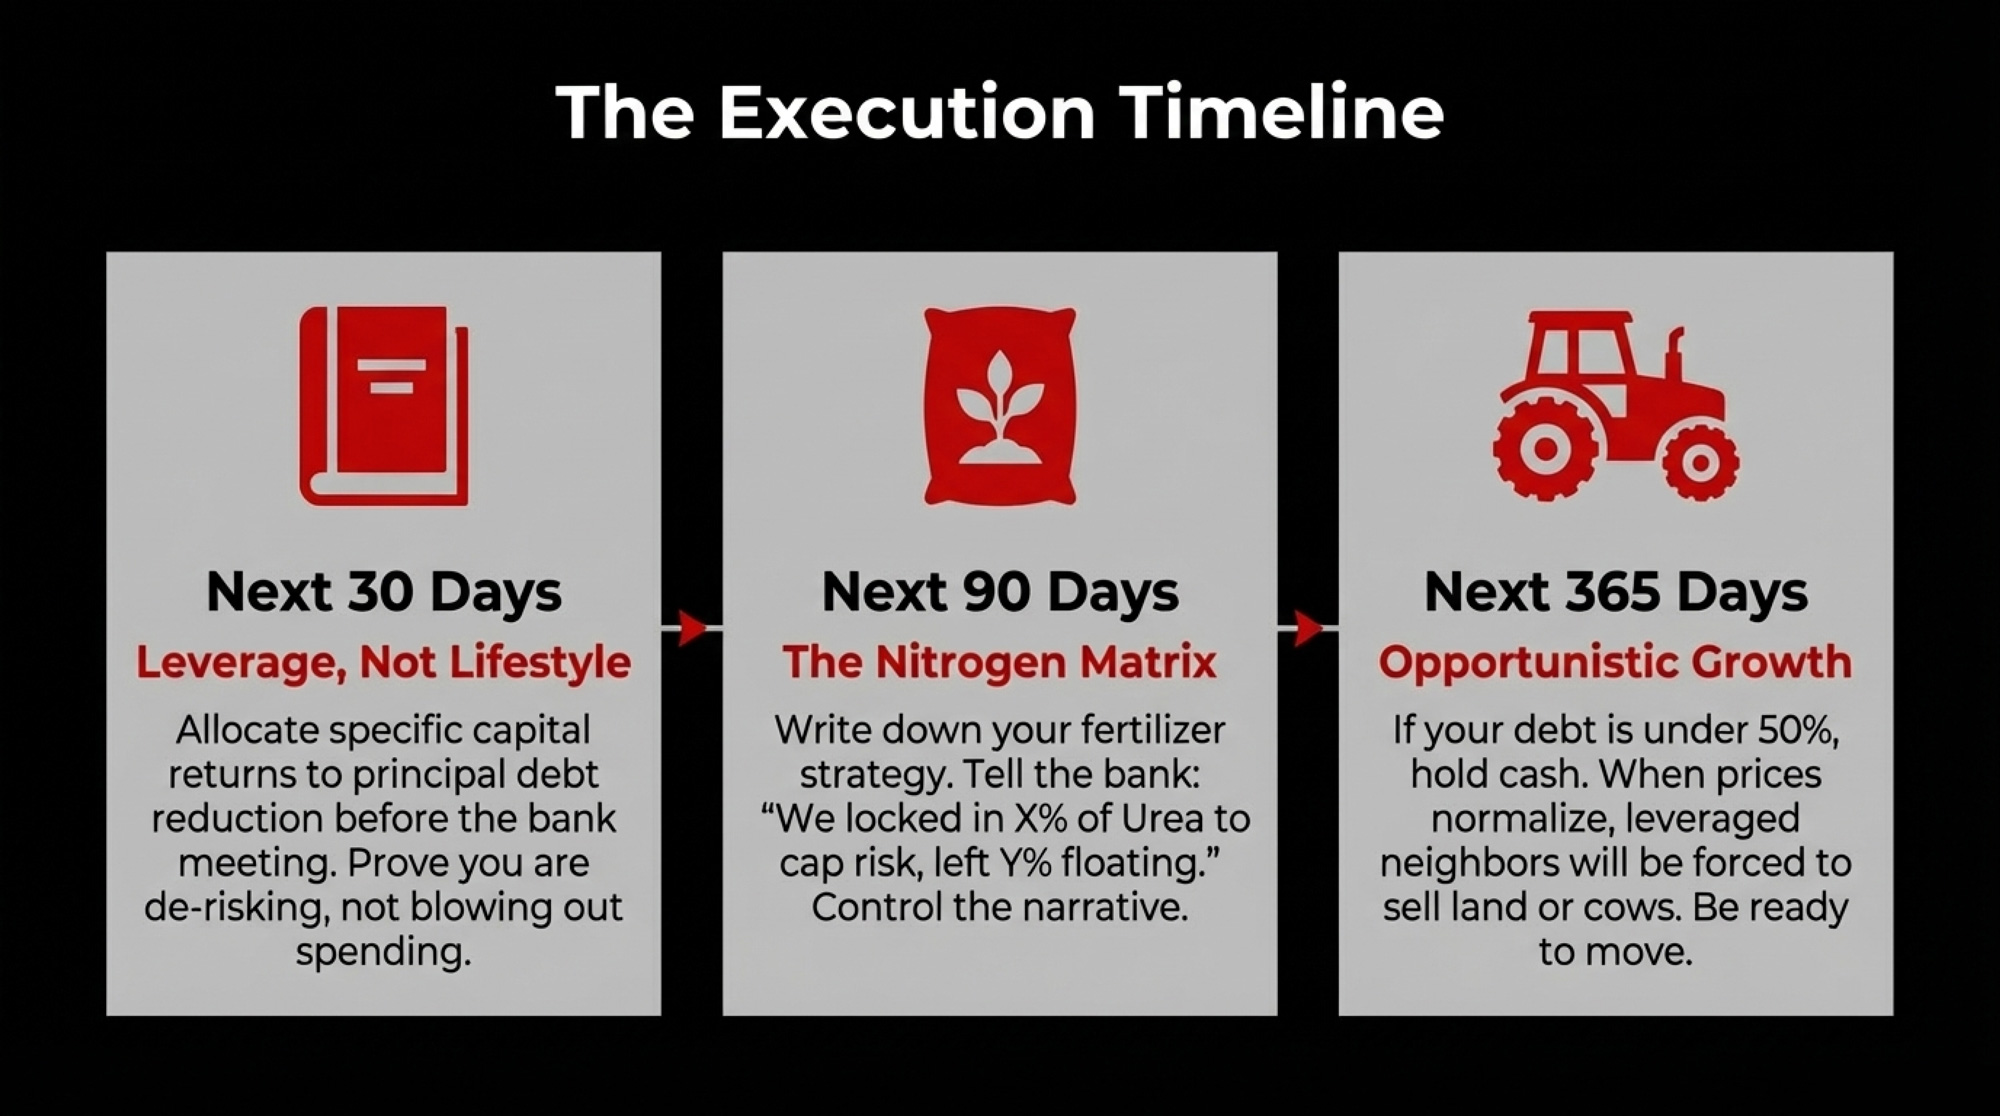
1. Use the payout to move your leverage, not your lifestyle. (Next 30 days)
Decide now what slice of the capital return, dividends, and early NZ$9.70 cash flow you’re going to use to pay down principal on term debt. Then actually do it before the bank review.
On most farms, that won’t magically transform your debt‑to‑asset ratio. But even a visible, documented principal reduction can change how your banker frames you. The story becomes: “We know this payout may be temporary. We used it to de‑risk, not to blow out spending.”
That’s a different conversation than “We’re taking the cash and hoping the good times last.”
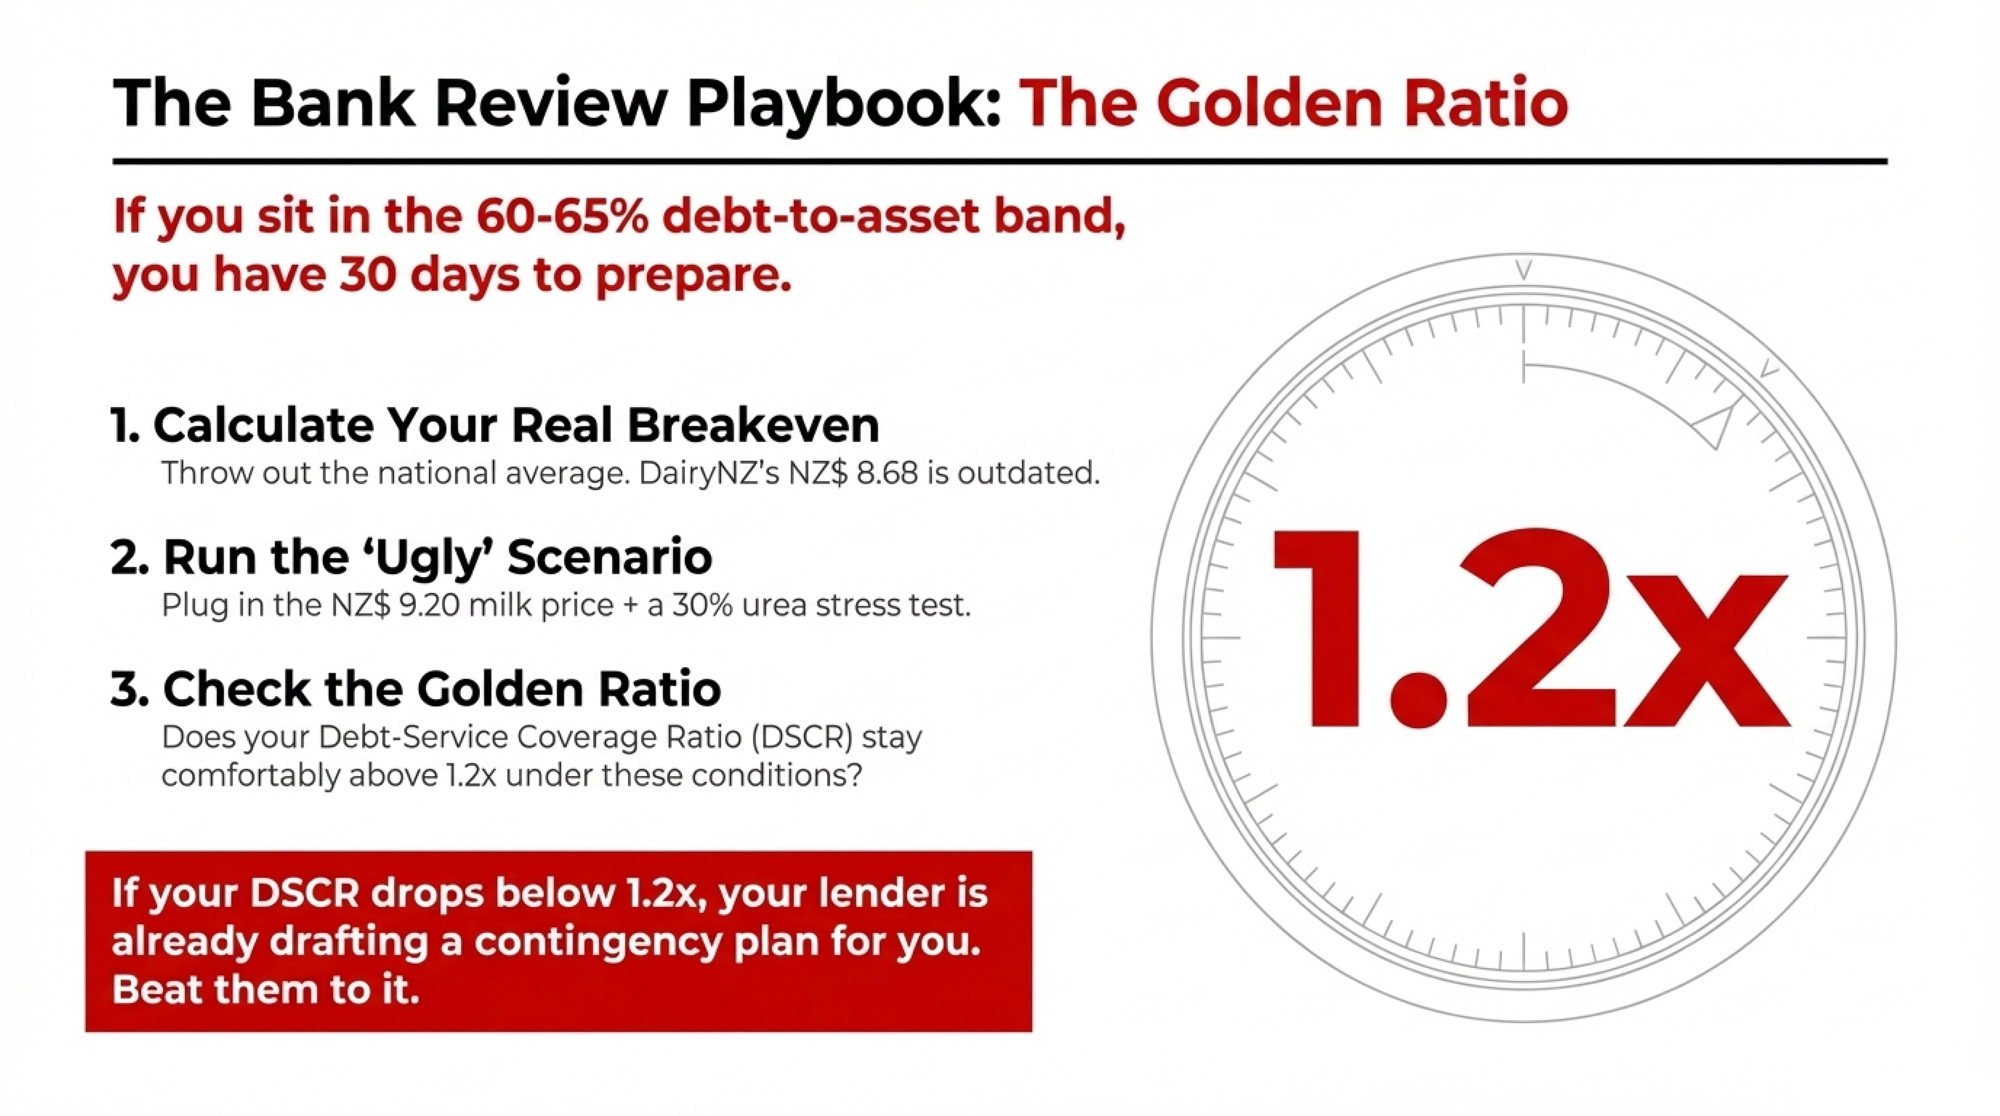
2. Stress‑test at NZ$9.20 and current‑plus‑30% urea. (Next 30 days)
Grab three numbers from your own books:
Your actual breakeven per kgMS, not the NZ$8.68 national average.
Your real fertiliser spend at today’s prices and tonnages.
Your current term debt and interest schedule.
Then run the ugly scenario:
Assume a Farmgate Milk Price of NZ$9.20/kgMS instead of NZ$9.70. That’s not doom‑and‑gloom — it’s the lower half of Fonterra’s published range, and still above ANZ’s NZ$8.70 opening forecast for 2026/27.
Add roughly 30% to your urea line on top of the March Ballance increase, using your own tonnes.
Now ask:
Does your debt‑service coverage ratio stay comfortably above about 1.2x? Many lenders start to get uneasy as you drop into that territory.
Do you still have surplus left for drawings and basic reinvestment after servicing the bank?
If the answer is no to either, it’s better to discover that from your own spreadsheet than from a bank credit memo.
3. Decide your fertiliser strategy for 2026/27 and write it down. (Next 90 days)
You can’t get last year’s nitrogen prices back. The decision now is whether to:
Lock in some of next season’s urea at today’s elevated levels to cap your worst‑case risk, or
Wait and hope that conflict risk and export restrictions ease, bringing prices back down.
There’s no universal right answer. But there’s a big difference between walking into a bank meeting saying “we’ll see what happens” and walking in with a one‑page note that says:
“We’ve locked in X% of our expected urea needs at today’s price to cap risk.”
“We’ve left Y% open in case markets soften.”
That tells the lender you’re managing risk, not being managed by it.
4. Treat this payout as a window, not a trend. (Next 365 days)
Make yourself a habit: once a year, before major spending decisions, run a “NZ$9.20 plus fertiliser stress test” on your numbers.
Use your own breakeven, not DairyNZ’s average. Plug in a milk price somewhere in the lower half of Fonterra’s realistic range. Add in the fertiliser costs you’re actually seeing, plus a stress margin if you’re on spot.
If your business only works at NZ$9.70 with last year’s costs, that’s not a stable business. It’s a good year.
Over the next 12–18 months, the farms that use this payout window to get structurally safer will look very different from those that use it to lean harder into a price supported by conflict and shipping friction.
What This Means for Your Operation
Debt-to-Asset
Risk Level
Priority Action
Stress-Test Signal to Watch
>65%
🔴 High
Pay down term principal NOW — before spending review
DSCR drops below 1.2x at NZ$9.20
60–65%
🔴 High
Allocate capital return to leverage reduction, not capex
Breakeven creep above NZ$8.68 national avg
50–60%
🟡 Moderate
Lock in portion of urea; document fert strategy for bank
Any urea +30% scenario that erodes DSCR
<50%
🟢 Low
Position opportunistically — watch for distressed land/shares
Monitor 2026/27 opening price vs ANZ $8.70
If your debt‑to‑asset ratio is north of 60–65%, use this season’s Fonterra cash to move that number, not your machinery lineup. Even a small, documented shift in leverage gives you more breathing room if the 2026/27 milk price opens closer to ANZ’s NZ$8.70 forecast than NZ$9.70.
If your breakeven per kgMS is already above DairyNZ’s NZ$8.68 benchmark, you’re operating with less cushion than the national average. Run your own numbers at NZ$9.20 with today’s fertiliser costs. That gap, not the current midpoint, tells you how fragile things really are.
If your stress‑case debt‑service coverage ratio drops much below about 1.2x, treat that as an urgent signal. That’s the zone where many lenders start tightening terms or asking for a plan, especially if they see structural risk building in your market.
If you’re under 50% debt‑to‑asset and have some fertiliser already forward‑contracted, you’re in a position to be opportunistic. This payout can be used to quietly build capacity so you can move when land, shares, or cows come loose from more leveraged neighbours over the next couple of years.
In the next 30 days, before your bank review, do one thing: put your actual breakeven per kgMS and your fertiliser‑adjusted budget next to a NZ$9.20 milk price on a single sheet of paper. That’s the forecast the bank will stress‑test you against, whether they say it aloud or not.
Key Takeaways
Fonterra’s NZ$9.70 midpoint and NZ$2.00 capital return are real wins — but they’re partly supported by a war premium and freight friction that may not be there when the 2026/27 milk price is set. ANZ’s opening forecast for next season is already NZ$8.70/kgMS.
DairyNZ’s NZ$8.68 breakeven for 2025/26 was published before Ballance’s March 18 hike. For many farms, the “NZ$1.02/kgMS margin” story is thinner than it looks once current fertiliser costs and potential further nitrogen stress are properly baked in.
The Lactalis deal gives Fonterra long‑term supply security — a 10‑year RMSA and a 3‑year GSA, both auto‑renewing with 36‑month notice. That hedges the co‑op’s risk. It does not hedge your farm’s breakeven or leverage.
For genetics‑minded herds, a B2B ingredients focus pushes the “ideal cow” even harder toward high‑solids efficiency over sheer volume. That should show up in how you rank sires and build your next round of matings in the NZ context.
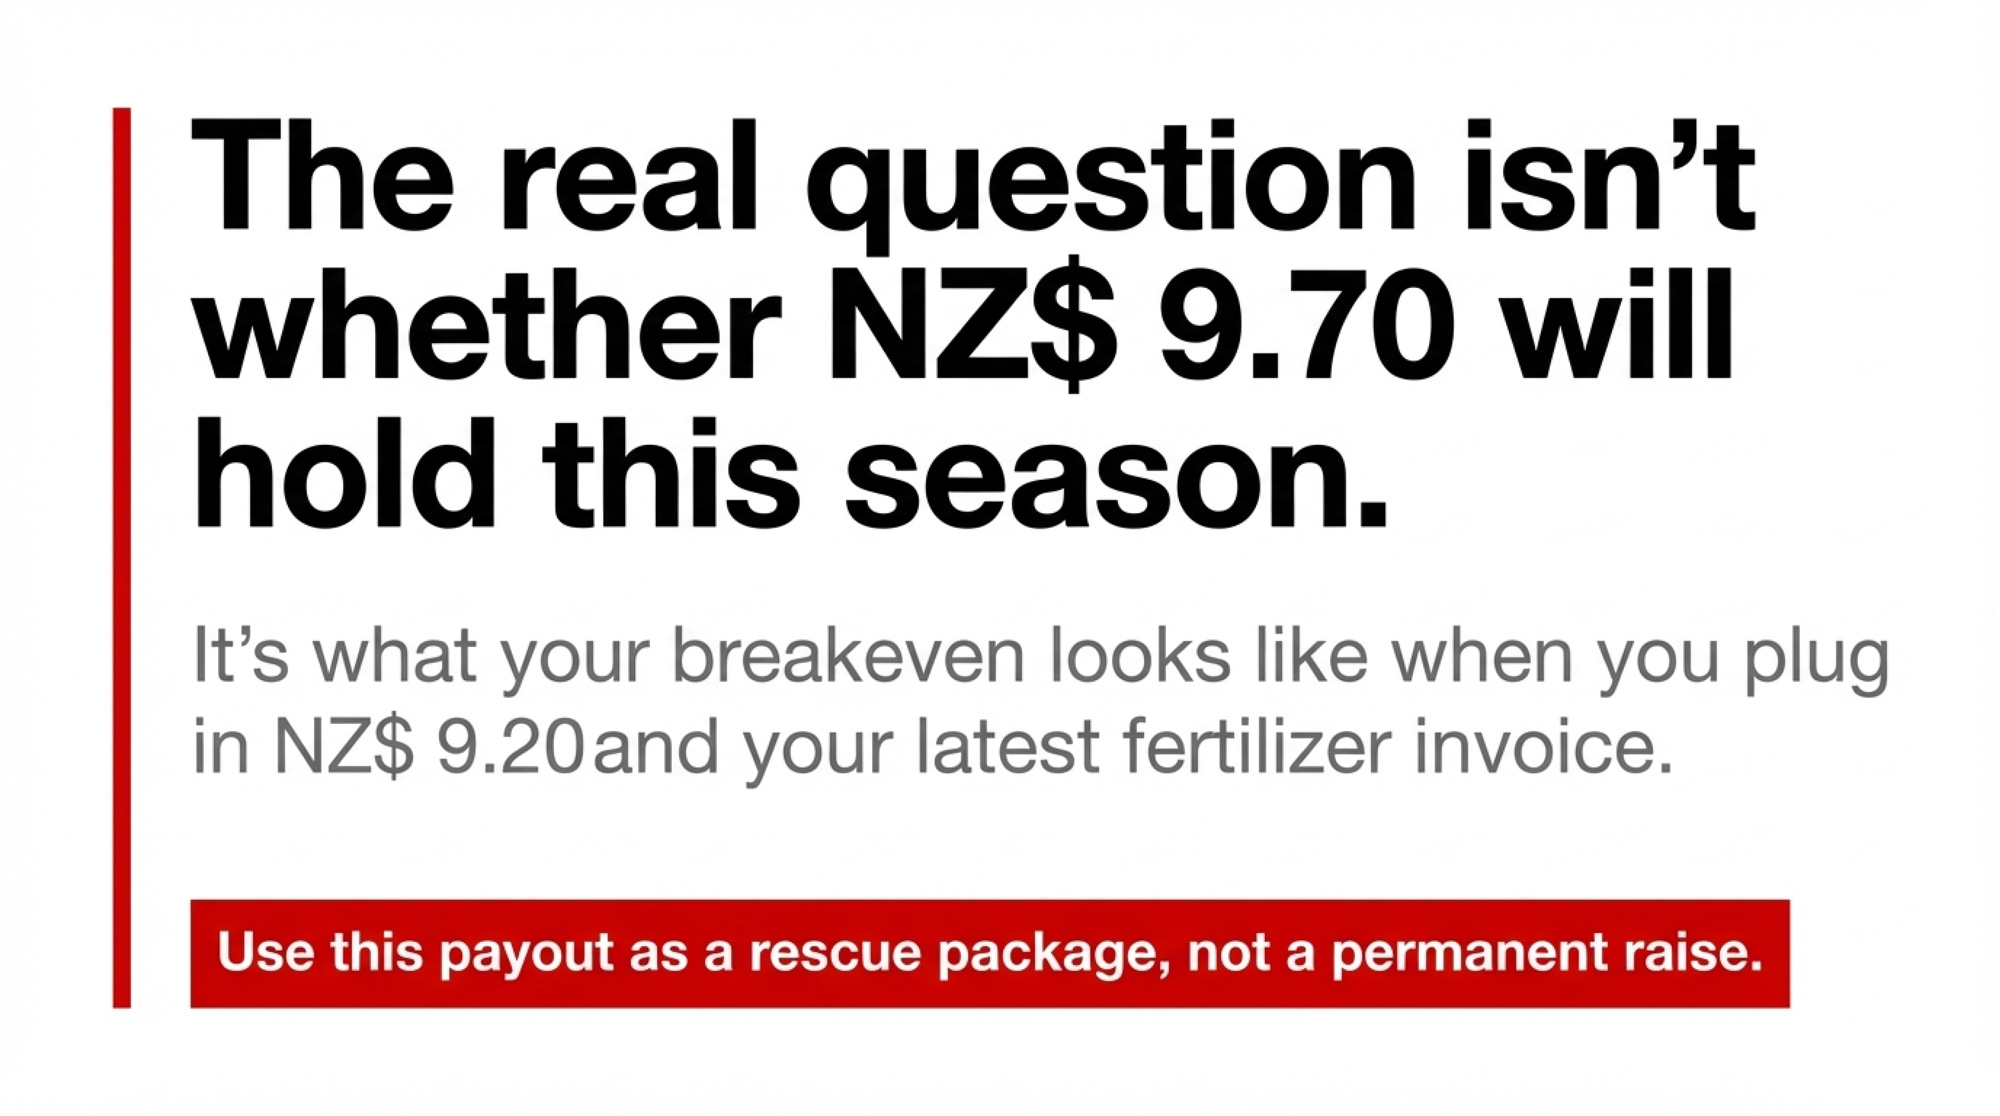
The farms most exposed to a downside scenario are those in the 60–65% debt band that treat this payout as a permanent raise rather than a one‑off window to fix the balance sheet.
The Bottom Line
The real question isn’t whether NZ$9.70 will hold this season. It’s this: what does your breakeven per kgMS look like if you plug in NZ$9.20 and your latest fertiliser invoice — and how far is that from the story your milk cheque is telling you right now?
Complete references and supporting documentation are available upon request by contacting the editorial team at editor@thebullvine.com.
Learn More
The Hidden Contract Clause That Could Cost Your Dairy $55,000 in 2026 – This 30-day action plan arms you with the negotiation leverage needed to dodge massive liability shifts in new contracts. It exposes hidden allergen compliance costs and delivers immediate methods to protect your net profit from processor-driven fee hikes.
The One-Dollar Margin: A Global Wake-Up Call from New Zealand’s Dairy Squeeze – This strategic deep dive reveals why the world’s lowest-cost producers are hitting a structural reset. It breaks down global margin gaps and positions your operation to navigate the 2026/27 price floor before the “war premium” evaporates.
Every week, thousands of producers, breeders, and industry insiders open Bullvine Weekly for genetics insights, market shifts, and profit strategies they won’t find anywhere else. One email. Five minutes. Smarter decisions all week.
To provide the best experiences, we use technologies like cookies to store and/or access device information. Consenting to these technologies will allow us to process data such as browsing behavior or unique IDs on this site. Not consenting or withdrawing consent, may adversely affect certain features and functions.
Functional
Always active
The technical storage or access is strictly necessary for the legitimate purpose of enabling the use of a specific service explicitly requested by the subscriber or user, or for the sole purpose of carrying out the transmission of a communication over an electronic communications network.
Preferences
The technical storage or access is necessary for the legitimate purpose of storing preferences that are not requested by the subscriber or user.
Statistics
The technical storage or access that is used exclusively for statistical purposes.The technical storage or access that is used exclusively for anonymous statistical purposes. Without a subpoena, voluntary compliance on the part of your Internet Service Provider, or additional records from a third party, information stored or retrieved for this purpose alone cannot usually be used to identify you.
Marketing
The technical storage or access is required to create user profiles to send advertising, or to track the user on a website or across several websites for similar marketing purposes.
To provide the best experiences, we and our partners use technologies like cookies to store and/or access device information. Consenting to these technologies will allow us and our partners to process personal data such as browsing behavior or unique IDs on this site and show (non-) personalized ads. Not consenting or withdrawing consent, may adversely affect certain features and functions.
Click below to consent to the above or make granular choices. Your choices will be applied to this site only. You can change your settings at any time, including withdrawing your consent, by using the toggles on the Cookie Policy, or by clicking on the manage consent button at the bottom of the screen.
Functional
Always active
The technical storage or access is strictly necessary for the legitimate purpose of enabling the use of a specific service explicitly requested by the subscriber or user, or for the sole purpose of carrying out the transmission of a communication over an electronic communications network.
Preferences
The technical storage or access is necessary for the legitimate purpose of storing preferences that are not requested by the subscriber or user.
Statistics
The technical storage or access that is used exclusively for statistical purposes.The technical storage or access that is used exclusively for anonymous statistical purposes. Without a subpoena, voluntary compliance on the part of your Internet Service Provider, or additional records from a third party, information stored or retrieved for this purpose alone cannot usually be used to identify you.
Marketing
The technical storage or access is required to create user profiles to send advertising, or to track the user on a website or across several websites for similar marketing purposes.