




Archive for RUFAL

Purdue and Michigan State Split on High-Oleic Soybeans: 0 to 0.20 Lb of Fat Before Costs

In 2024, Bullvine headlined a $33,000 high-oleic soybean opportunity. Two university trials now put the observed fat response between zero and 0.20 lb per cow per day. The number that actually decides the purchase is one most rations never calculate.
high-oleic soybeans

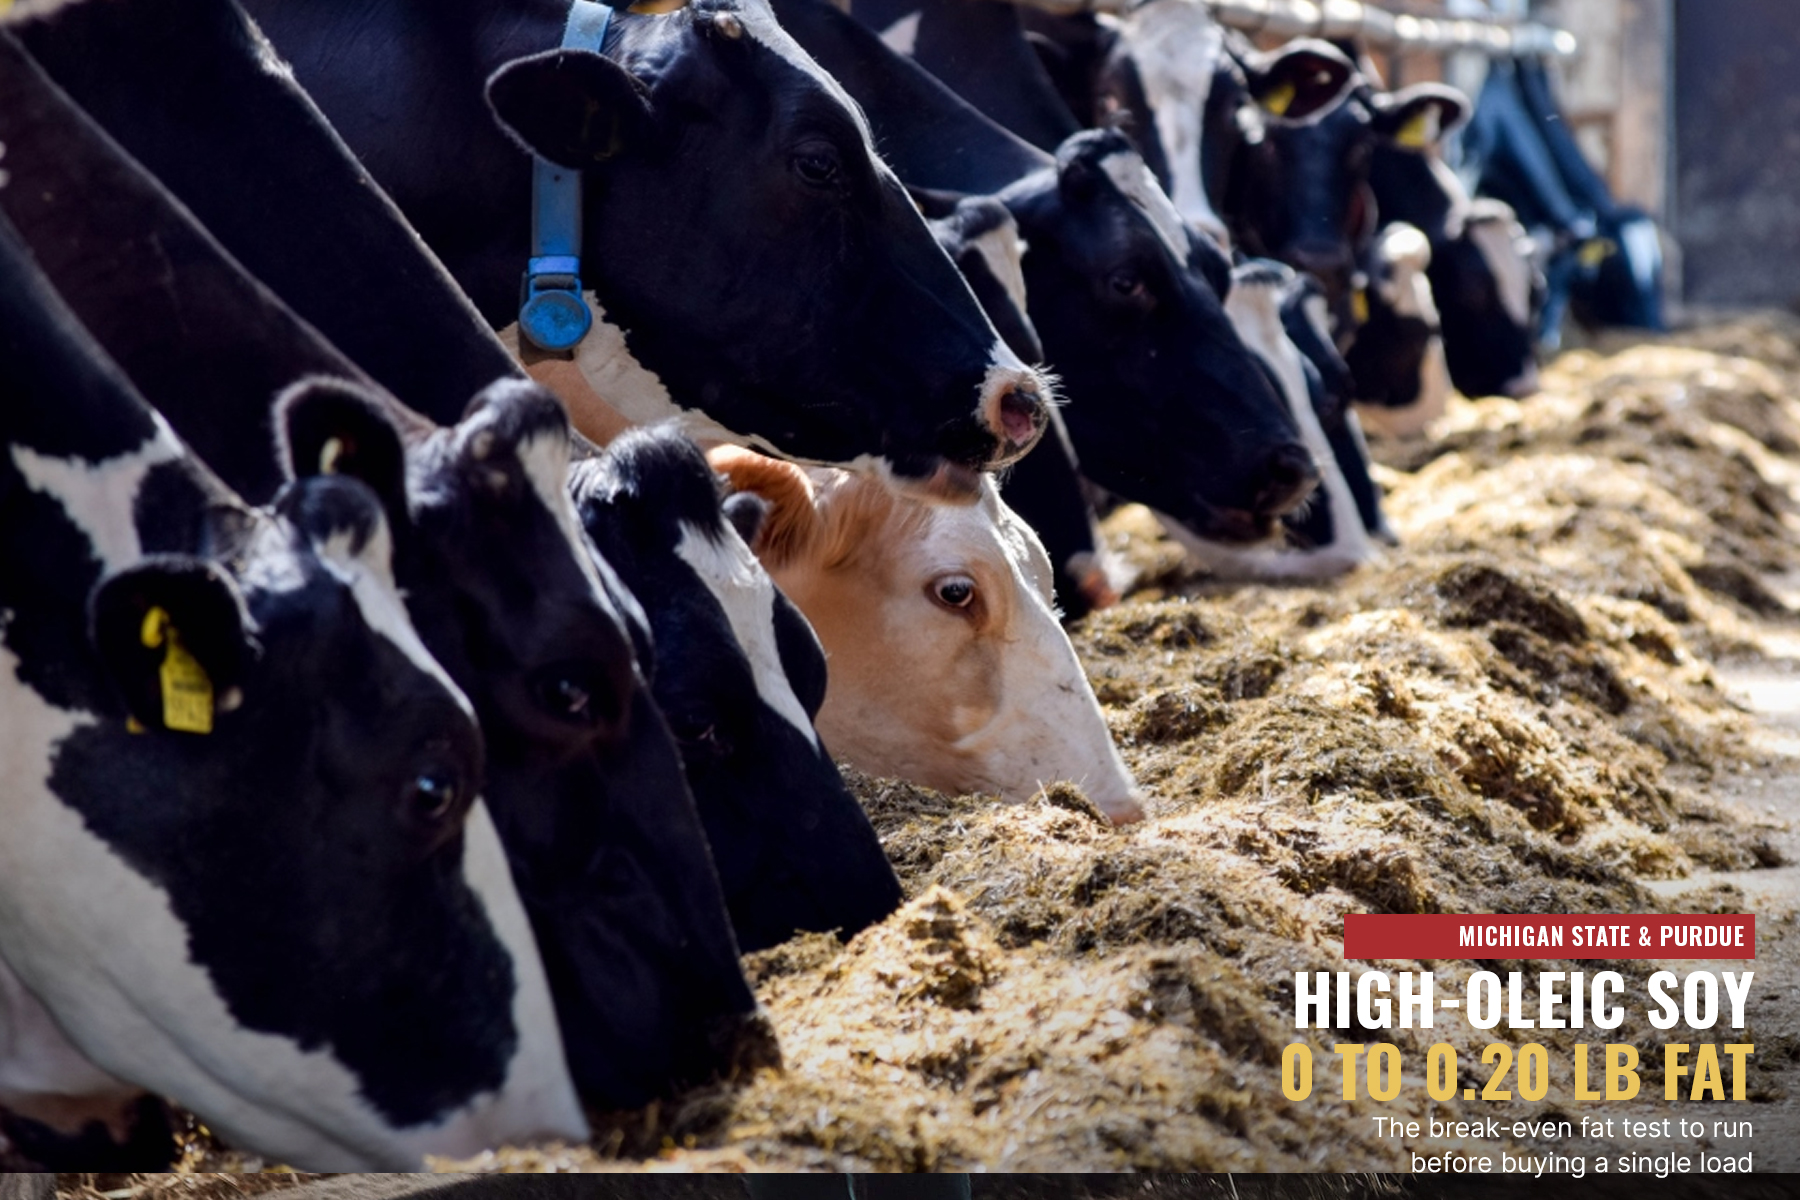
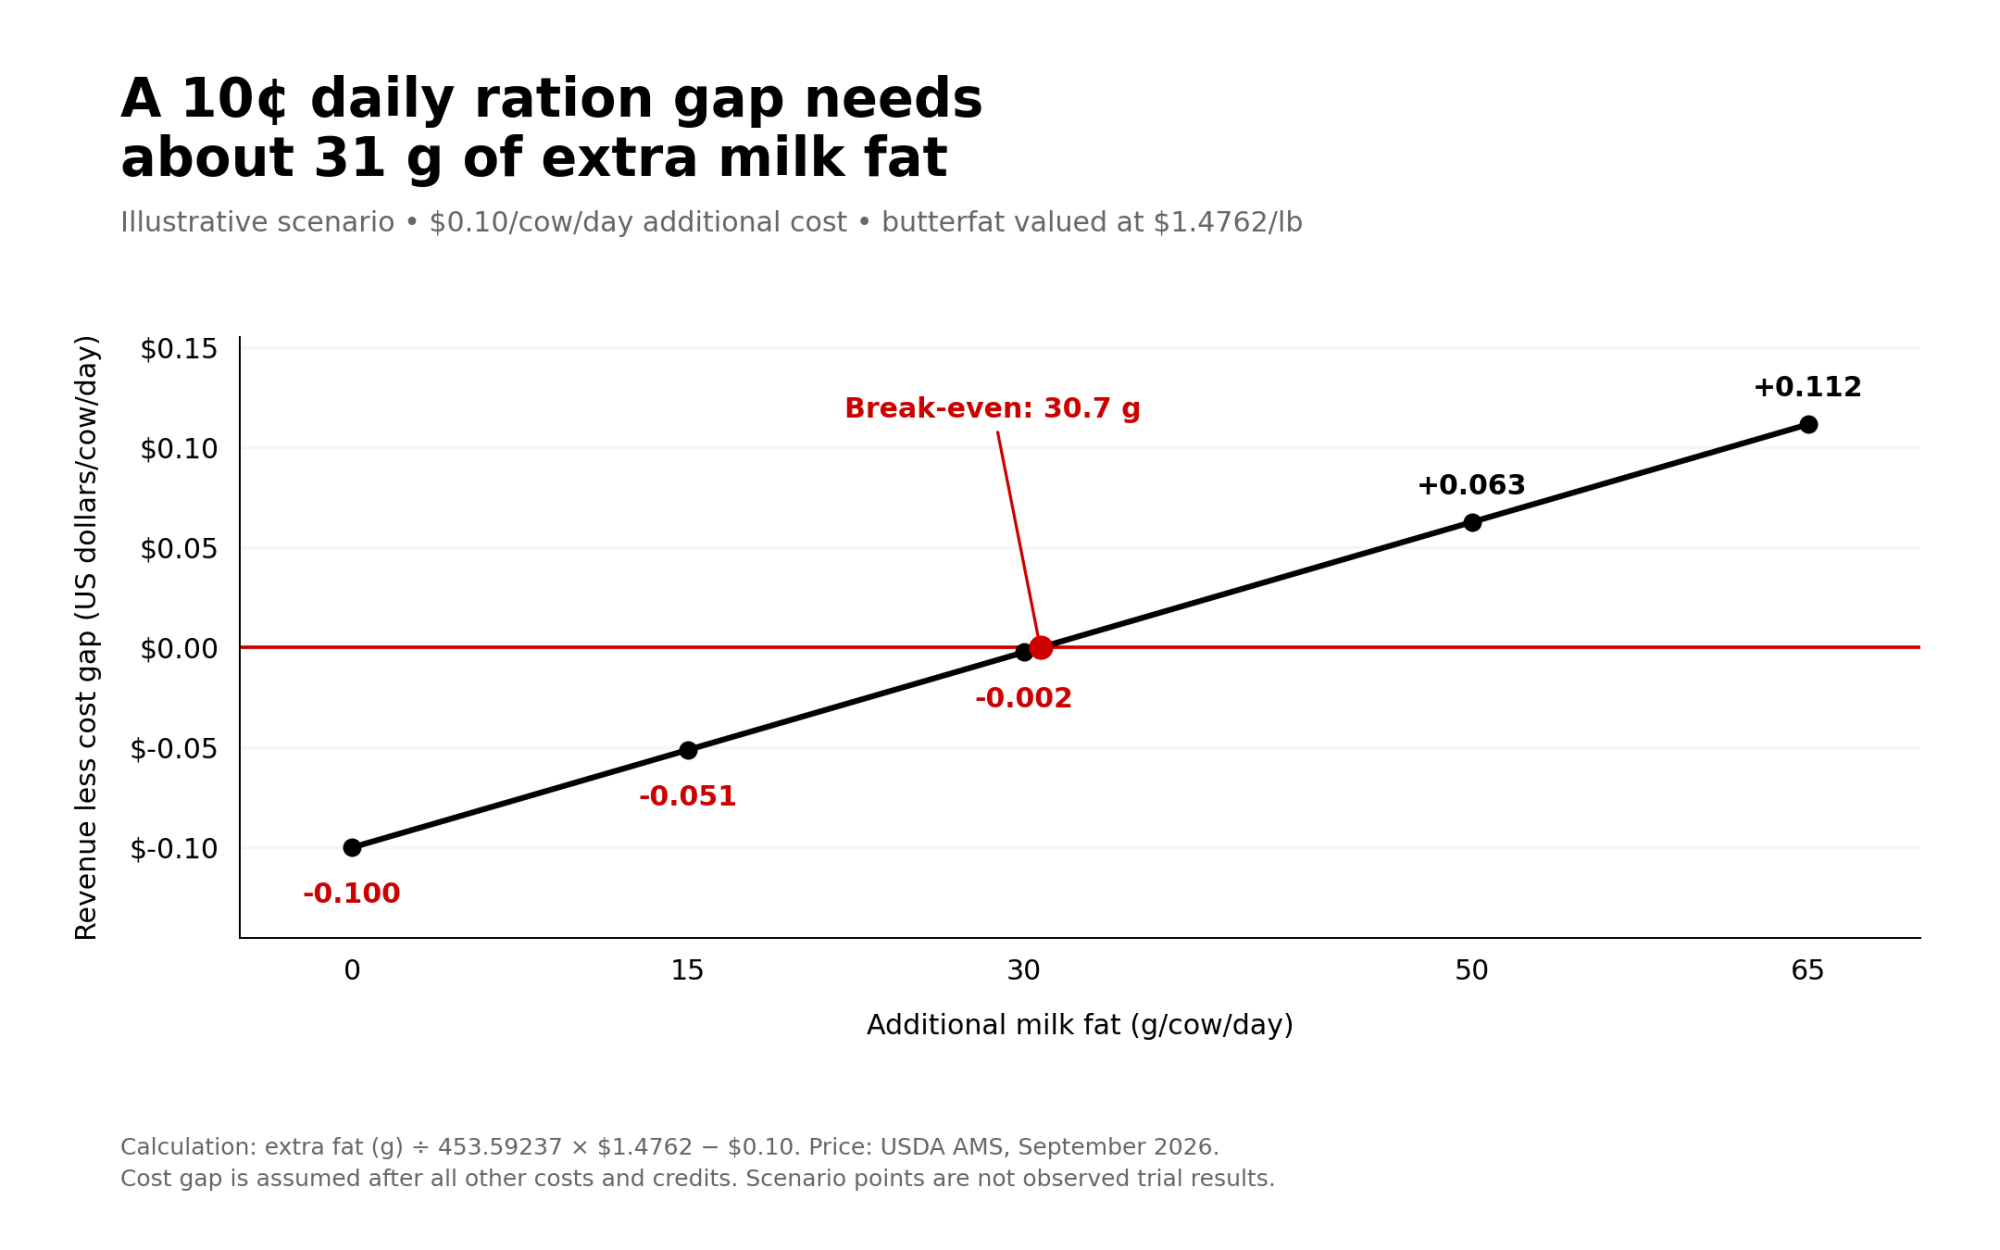
When high-oleic soybeans hit the research barn, they produced anywhere from no significant fat-yield gain to 0.20 lb more fat per cow per day. Purdue University fed high-oleic soybean oil and saw no significant change in fat yield. Michigan State University’s 8% roasted high-oleic soybean diet produced 0.20 lb more fat than its control. Neither result shows the beans cut feed cost. That depends on one farm-specific number: the break-even milk-fat response, in pounds per cow per day. 

What did the $33,000 actually measure?

Bullvine’s May 27, 2024 article put a $33,000 annual gain for a 500-cow herd in the headline, and cited milk income less feed cost of up to $0.27 per cow per day in the text. Those figures came from two different points in the same Cornell-led model. Nicholson et al. reported a mean of $0.1787 and a maximum of $0.2730 per cow per day, using U.S. prices from January 2014 through September 2020. The research was supported by the United Soybean Board. 

Bullvine math: 500 cows × 365 days × $0.1787 = $32,613, which is the $33,000. The maximum works out to $49,823. So the $33,000 wasn’t a multiplication error. The article printed the maximum per-cow figure next to the mean whole-herd figure without saying they were different numbers. Neither was measured on a working dairy.

Which assumptions dropped out of the headline?

Nicholson’s base case had raw high-oleic beans replace raw conventional beans at 5% of ration DM, about 1.4 kg per cow per day. It assumed 50 g of extra milk fat, roughly 0.11 lb. It also used a $0.50/bu premium, no extra freight or logistics, no processing difference, and no change in milk, protein, reproduction or longevity. The authors called it a “first approximation.” The headline kept the dollar figure and dropped those conditions. 

That substitution answers a narrower question than the one a feed buyer has to answer. Swapping raw high-oleic beans for raw conventional beans at equal fat isn’t the choice most nutritionists are pricing. The real choice is among three complete protein-and-fat packages: conventional roasted beans plus commercial fat; roasted high-oleic beans replacing that combination; or soybean meal plus commercial fat. All three need to be held equal on NEL and MP, with digestible amino acids, total FA, RUFAL, NDF, starch and DMI reported, so the “cheap” ration isn’t just moving a shortfall somewhere else.

What did Michigan State establish?

Michigan State ran 24 multiparous Holsteins through a replicated 4 × 4 Latin square on diets with 0%, 8%, 16% or 24% roasted high-oleic soybeans. The beans were roasted at 157°C for two hours and ground through a 10-mm screen. Before treatment, the cows were at 122 ± 57 DIM and averaged 50.7 kg (about 112 lb) of milk. Funding came from the Michigan Alliance for Animal Agriculture and the United Soybean Board, and Caledonia Farmers Elevator supported a graduate fellowship. 
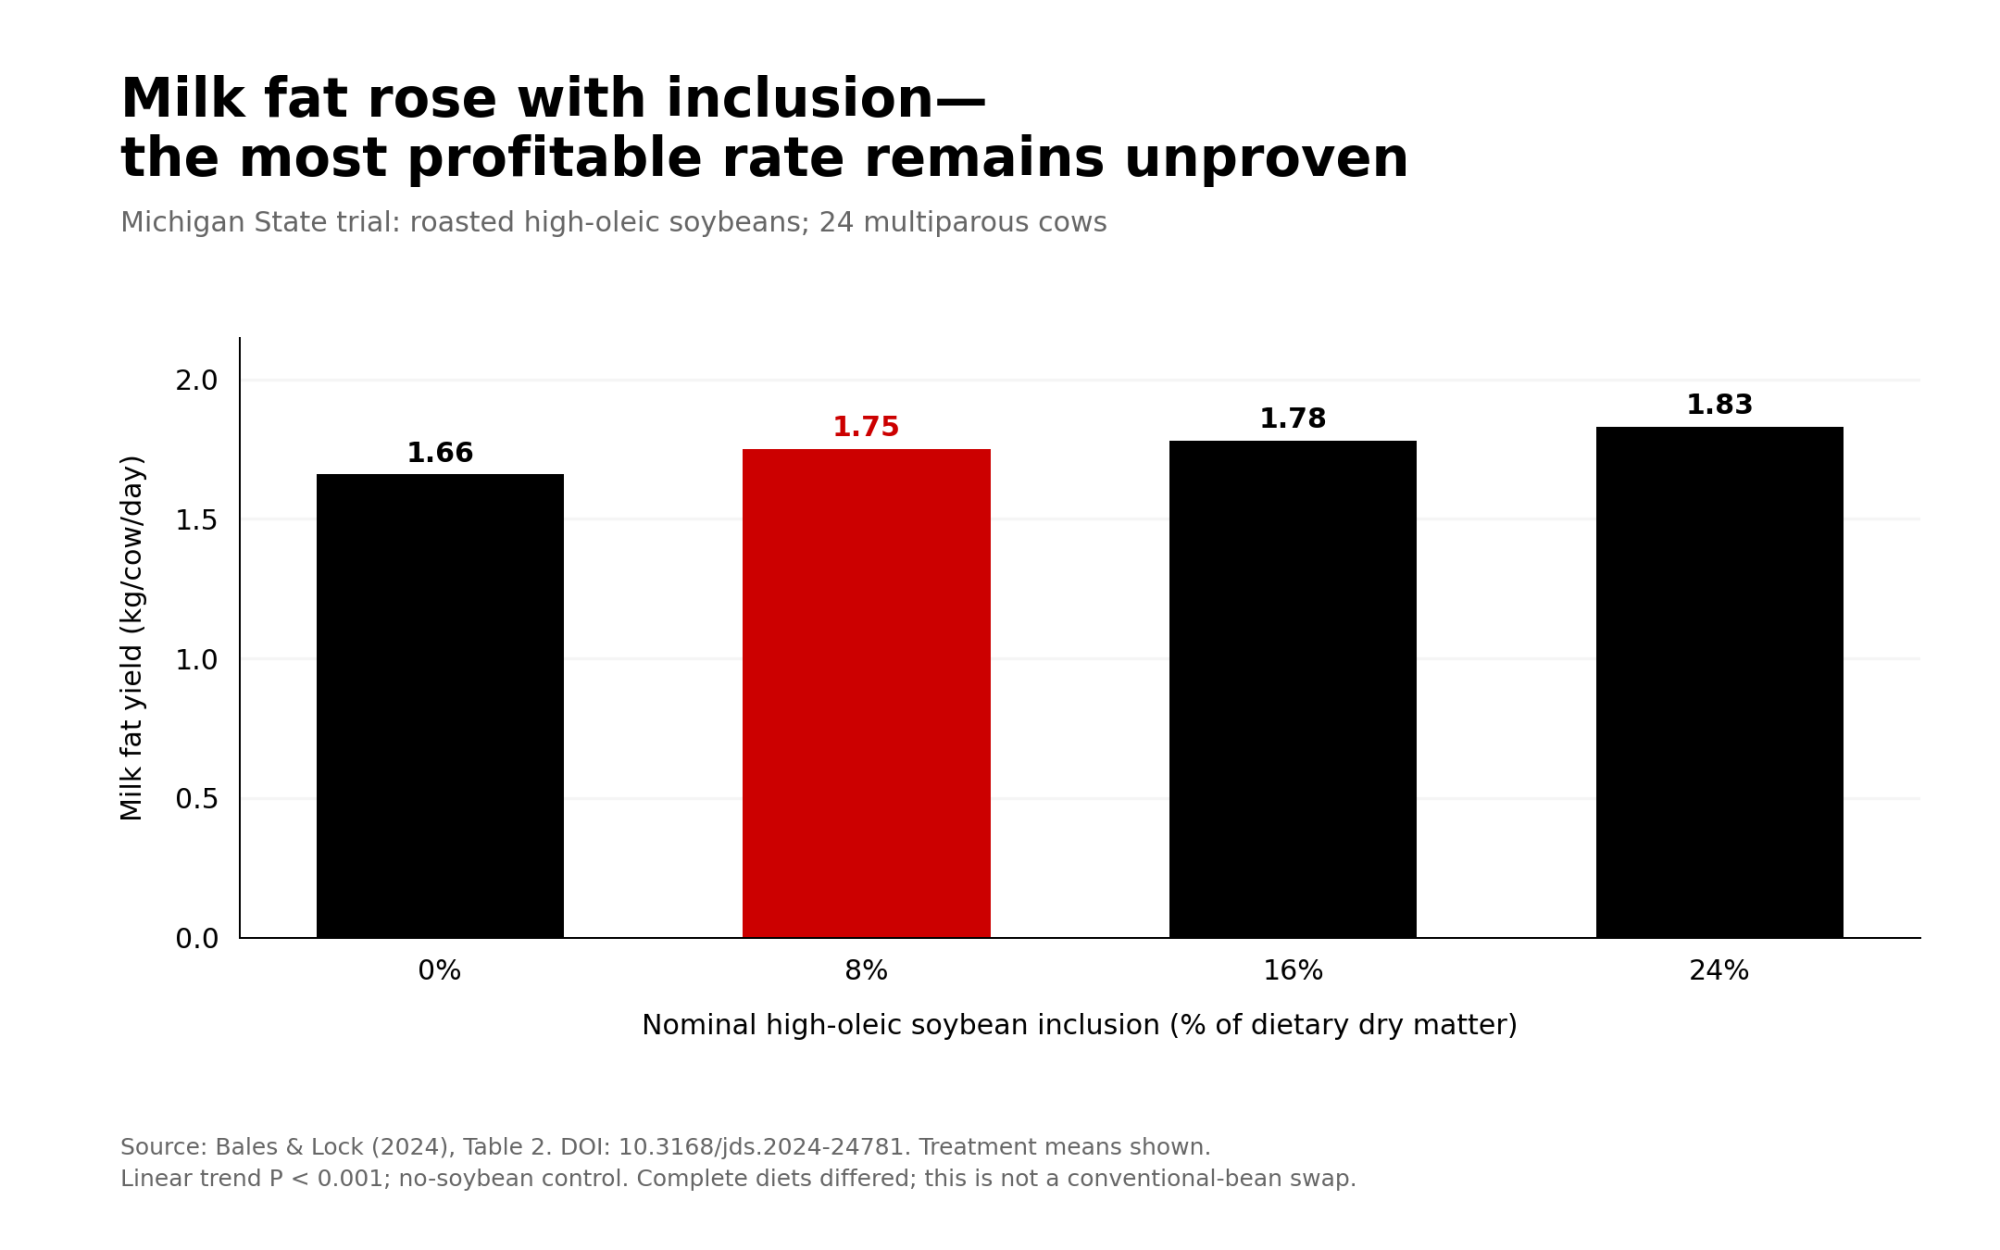
At 8% inclusion, cows ate 2.58 kg of beans a day. Compared with control, milk went from 48.2 to 51.4 kg, ECM from 49.4 to 51.3 kg, fat from 1.66 to 1.75 kg, and protein from 1.56 to 1.63 kg. The 0.09-kg fat difference is 0.198 lb. The treatment diets weren’t matched on energy, RUP or amino-acid supply, so the whole response can’t be credited to oleic acid. 

Bullvine’s incremental-response math, using the bean intakes the paper reports (2.58, 4.97 and 7.43 kg/day):

Inclusion stepAdded beansAdded ECMAdded fatAdded proteinFat per kg of beans added
0% → 8%2.58 kg1.90 kg0.09 kg0.07 kg~35 g
8% → 16%2.39 kg0.50 kg0.03 kg0.00 kg~13 g
16% → 24%2.46 kg0.60 kg0.05 kg−0.02 kg~20 g

These are differences between treatment means, not causal marginal returns, and they don’t show 8% to be an economic optimum. They do show that fat kept rising as inclusion went up, but each extra kilogram of beans after the first 8% bought far less ECM and no more protein.

Why didn’t better digestibility pay at Purdue?

Purdue’s 30-cow crossover (16 first-lactation, 14 older cows, 87 ± 26 DIM) replaced 1.5% wheat middlings with 1.5% high-oleic soybean oil. Apparent FA digestibility rose from 66.8% to 79.6% in first-lactation cows and from 72.8% to 84.1% in older cows. The Indiana Soybean Alliance funded the work, and Benson Hill supplied the oil. 
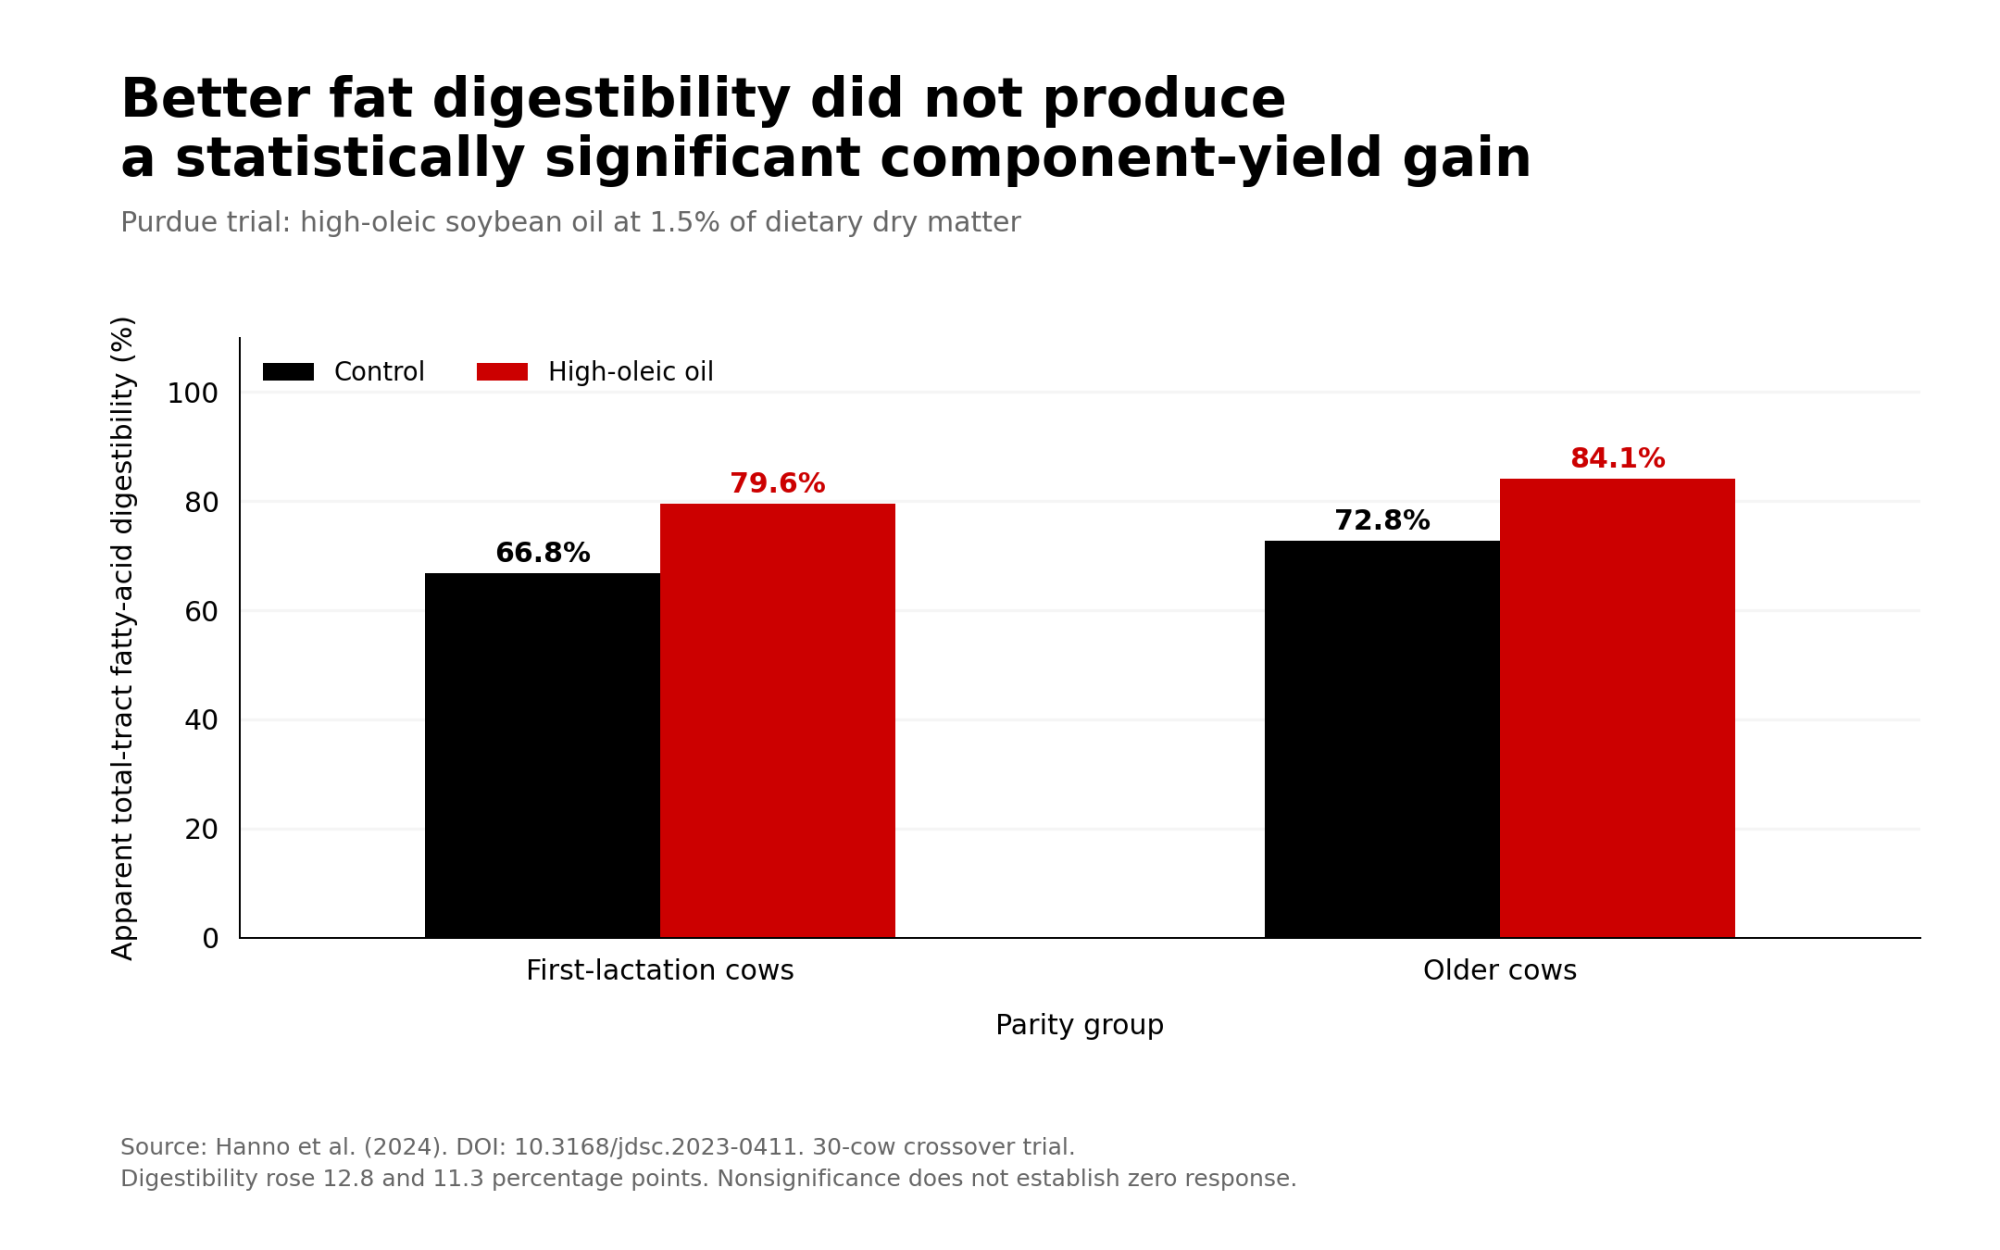
The oil diet also had more energy than the control: 1.70 vs. 1.65 Mcal/kg NEL. Even so, DMI, milk, ECM and component yields didn’t change. Fat yield rose 0.03–0.04 kg, which wasn’t significant (P = 0.20). Fat test tended upward by 0.16 points, and backfat depth rose 0.44 mm. The authors tied the missing ECM response partly to energy going into body fat. Both diets also contained HMTBa, which may have reduced milk fat depression risk. 

This doesn’t contradict Michigan State. Purdue fed oil. Michigan State fed roasted whole beans, which also changed protein supply, rumen escape and how fast the fat was released. What Purdue shows is the floor: more digestible fat and more NEL on paper don’t guarantee more fat in the tank, because a cow can put that energy on her back instead. You’re paid on pounds of components.

Where does the invoice mislead?

A high-oleic quote may or may not include the commodity bean, the grower’s identity-preserved premium, handling, testing, roasting, shrink and freight. Before comparing quotes, confirm whether each price is per raw ton at the elevator or per finished ton delivered to your mixer. In August 2024, the U.S. Soybean Export Council put grower premiums at $1.00–$1.75/bu. That’s not a current dairy-buyer price, but it’s two to three and a half times the $0.50 Nicholson assumed. 

One processor’s 2026 schedule shows the costs that come after the beans. Farmers’ Grain & Feed LLC in Wisconsin, effective September 19, 2026, charges $35/ton to roast beans at 13% moisture, plus $3 per full moisture point, up to $47. It lists 12% shrink on swapped beans, rolling at $13 per finished ton, and trucking to its elevator at $0.25/wet bu within 30 miles or $0.30 beyond, with a $150 minimum. Moisture shrink, storage and quality discounts are charged separately, and the schedule is marked subject to change without notice. These are one mill’s terms, not a national average. 
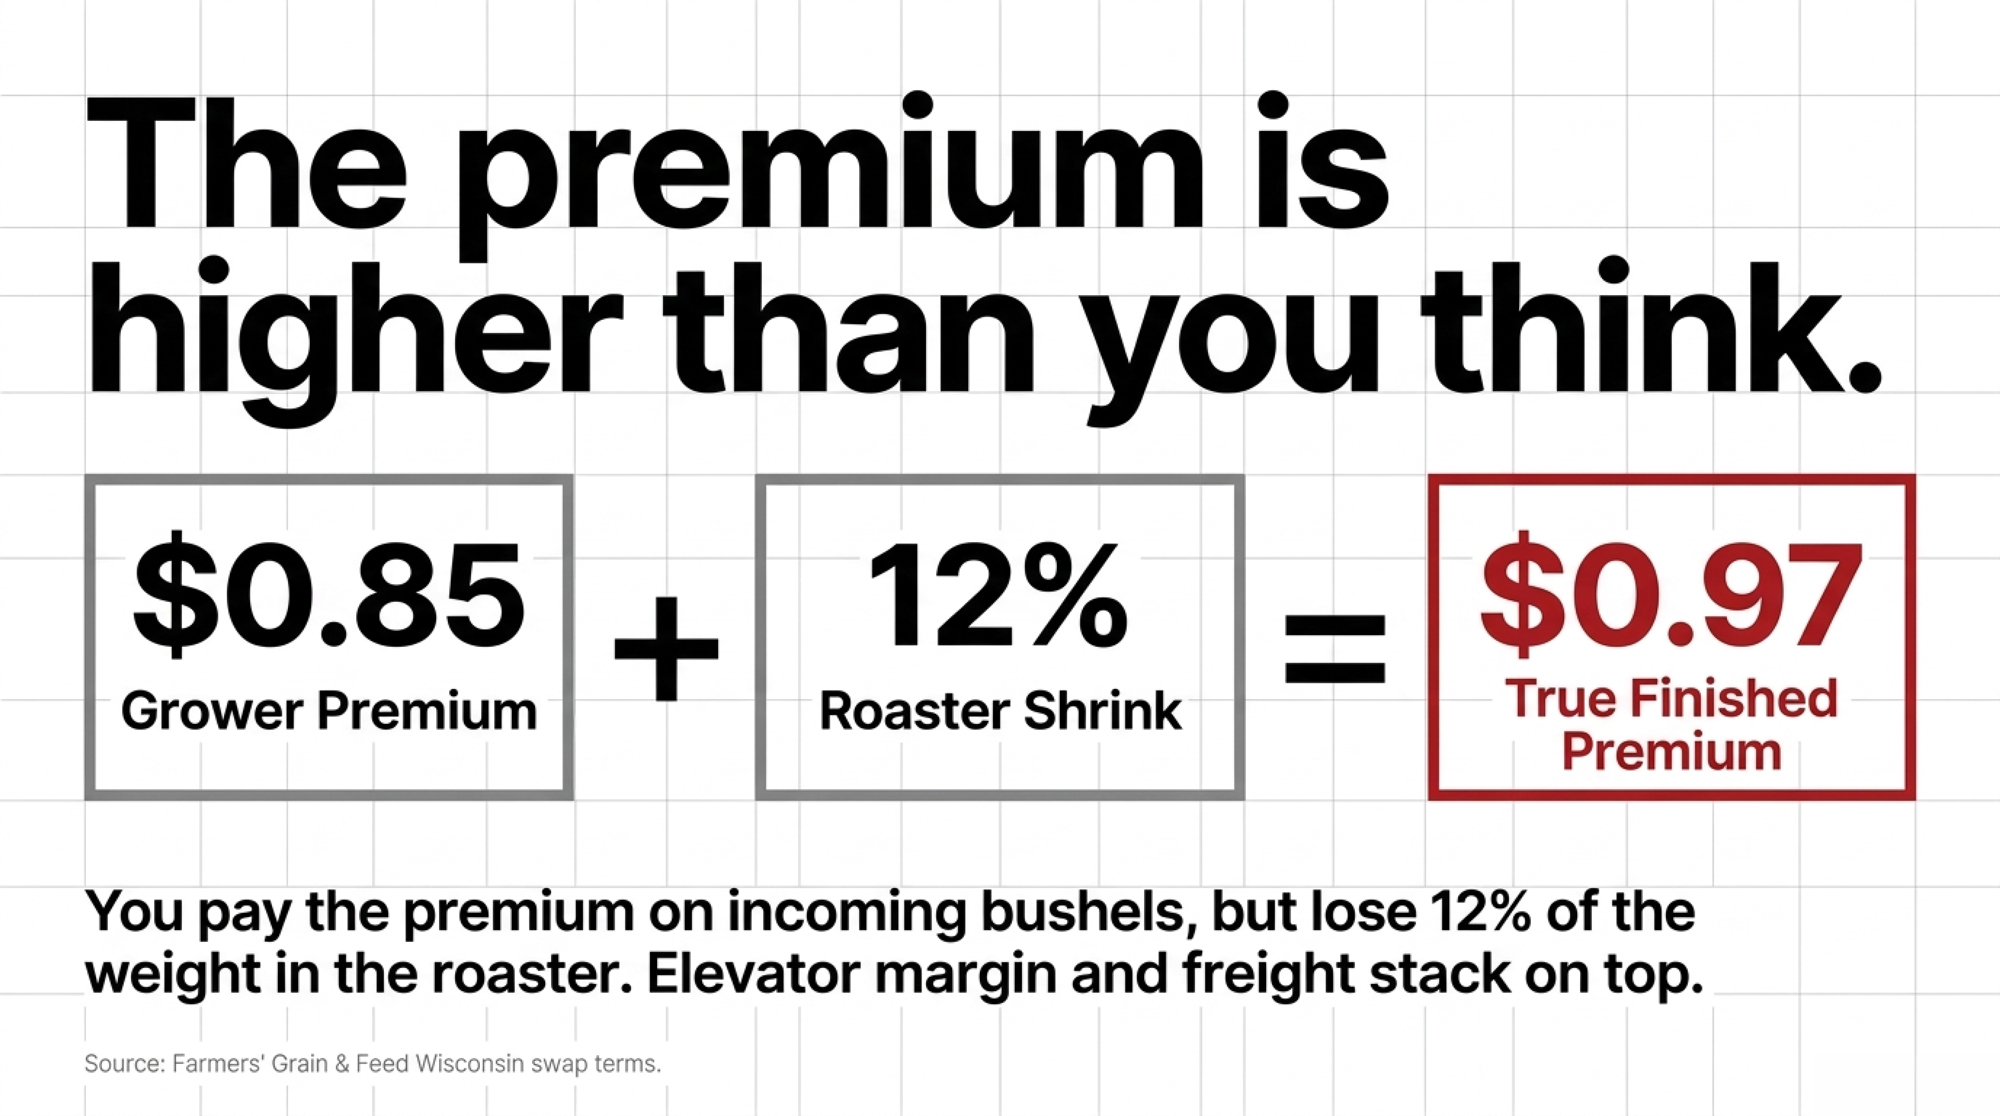
At 12% shrink, it takes 1.136 incoming tons to make one finished ton. That doesn’t mean 12% of the nutrients disappeared, because some of the lost weight is water. The model has to compare tons on a dry-matter basis, using an analysis of the finished feed.

Running the Numbers

Published evidence: Michigan State fed 2.58 kg of roasted high-oleic beans per cow per day at 8% and saw +0.198 lb of fat vs. control. Purdue saw no significant change in fat yield. Nicholson assumed +0.110 lb. Farmers’ Grain & Feed lists 12% swap shrink.

Stated assumptions: 500 lactating cows. Inclusion of 2.58 kg of finished beans per cow per day, used only to show tonnage. 12% shrink. No dollar values, because current prices and milk-pay values are missing.

Bullvine calculation: 2.58 kg × 500 cows = 1,290 kg/day, or 1.422 short tons of finished beans. Divided by 0.88, that’s 1.616 incoming tons a day. Over a year, that’s about 519 finished tons from 590 incoming tons, a 71-ton difference in weight.

Response usedFat/cow/dayFat/500 cows/daySource
Floor0 lb (no significant change)0 lbPurdue, high-oleic oil
Model assumption0.110 lb55 lbNicholson, raw-bean swap
Trial treatment difference0.198 lb99 lbMichigan State, 8% roasted

These come from different ingredients and designs. They’re stress tests, not a forecast range, and shouldn’t be averaged.

What does your cow have to produce?
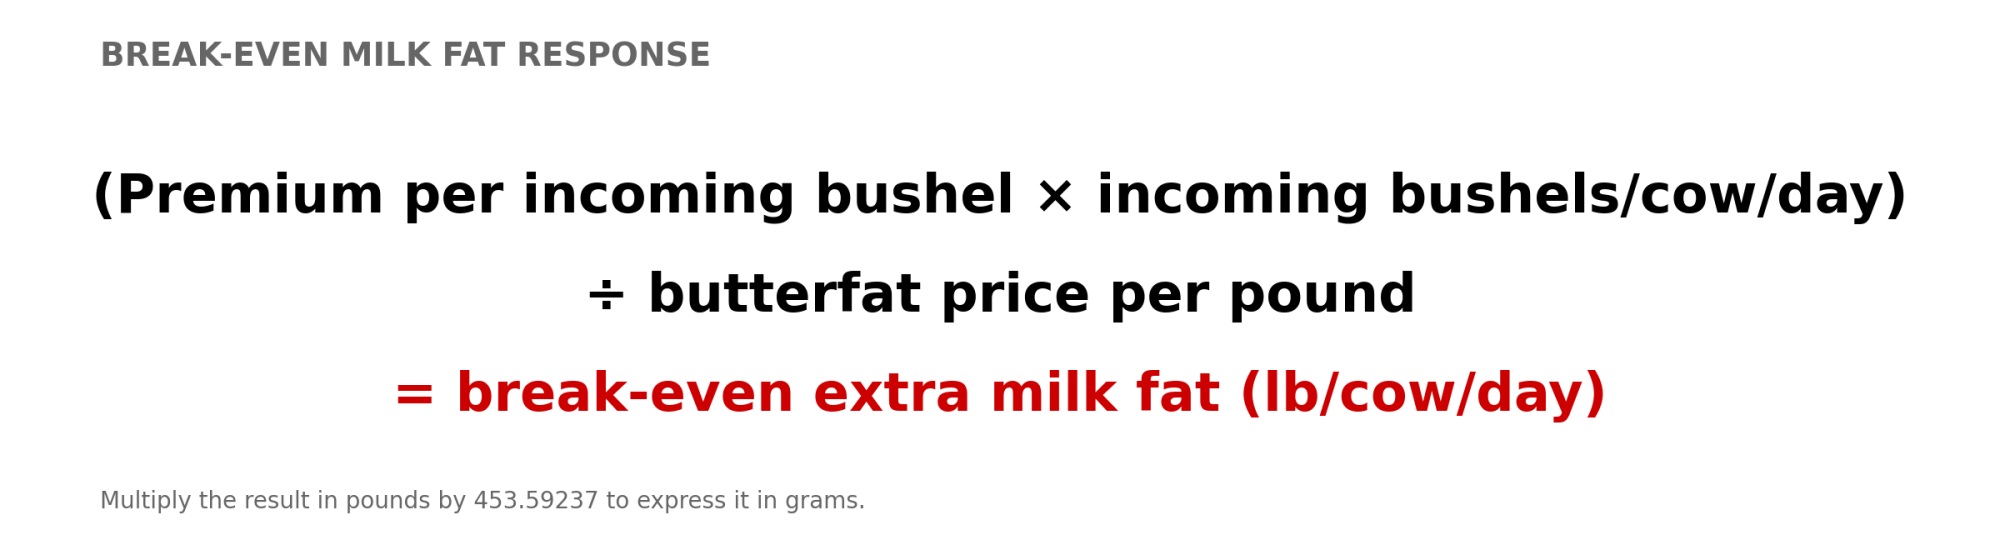
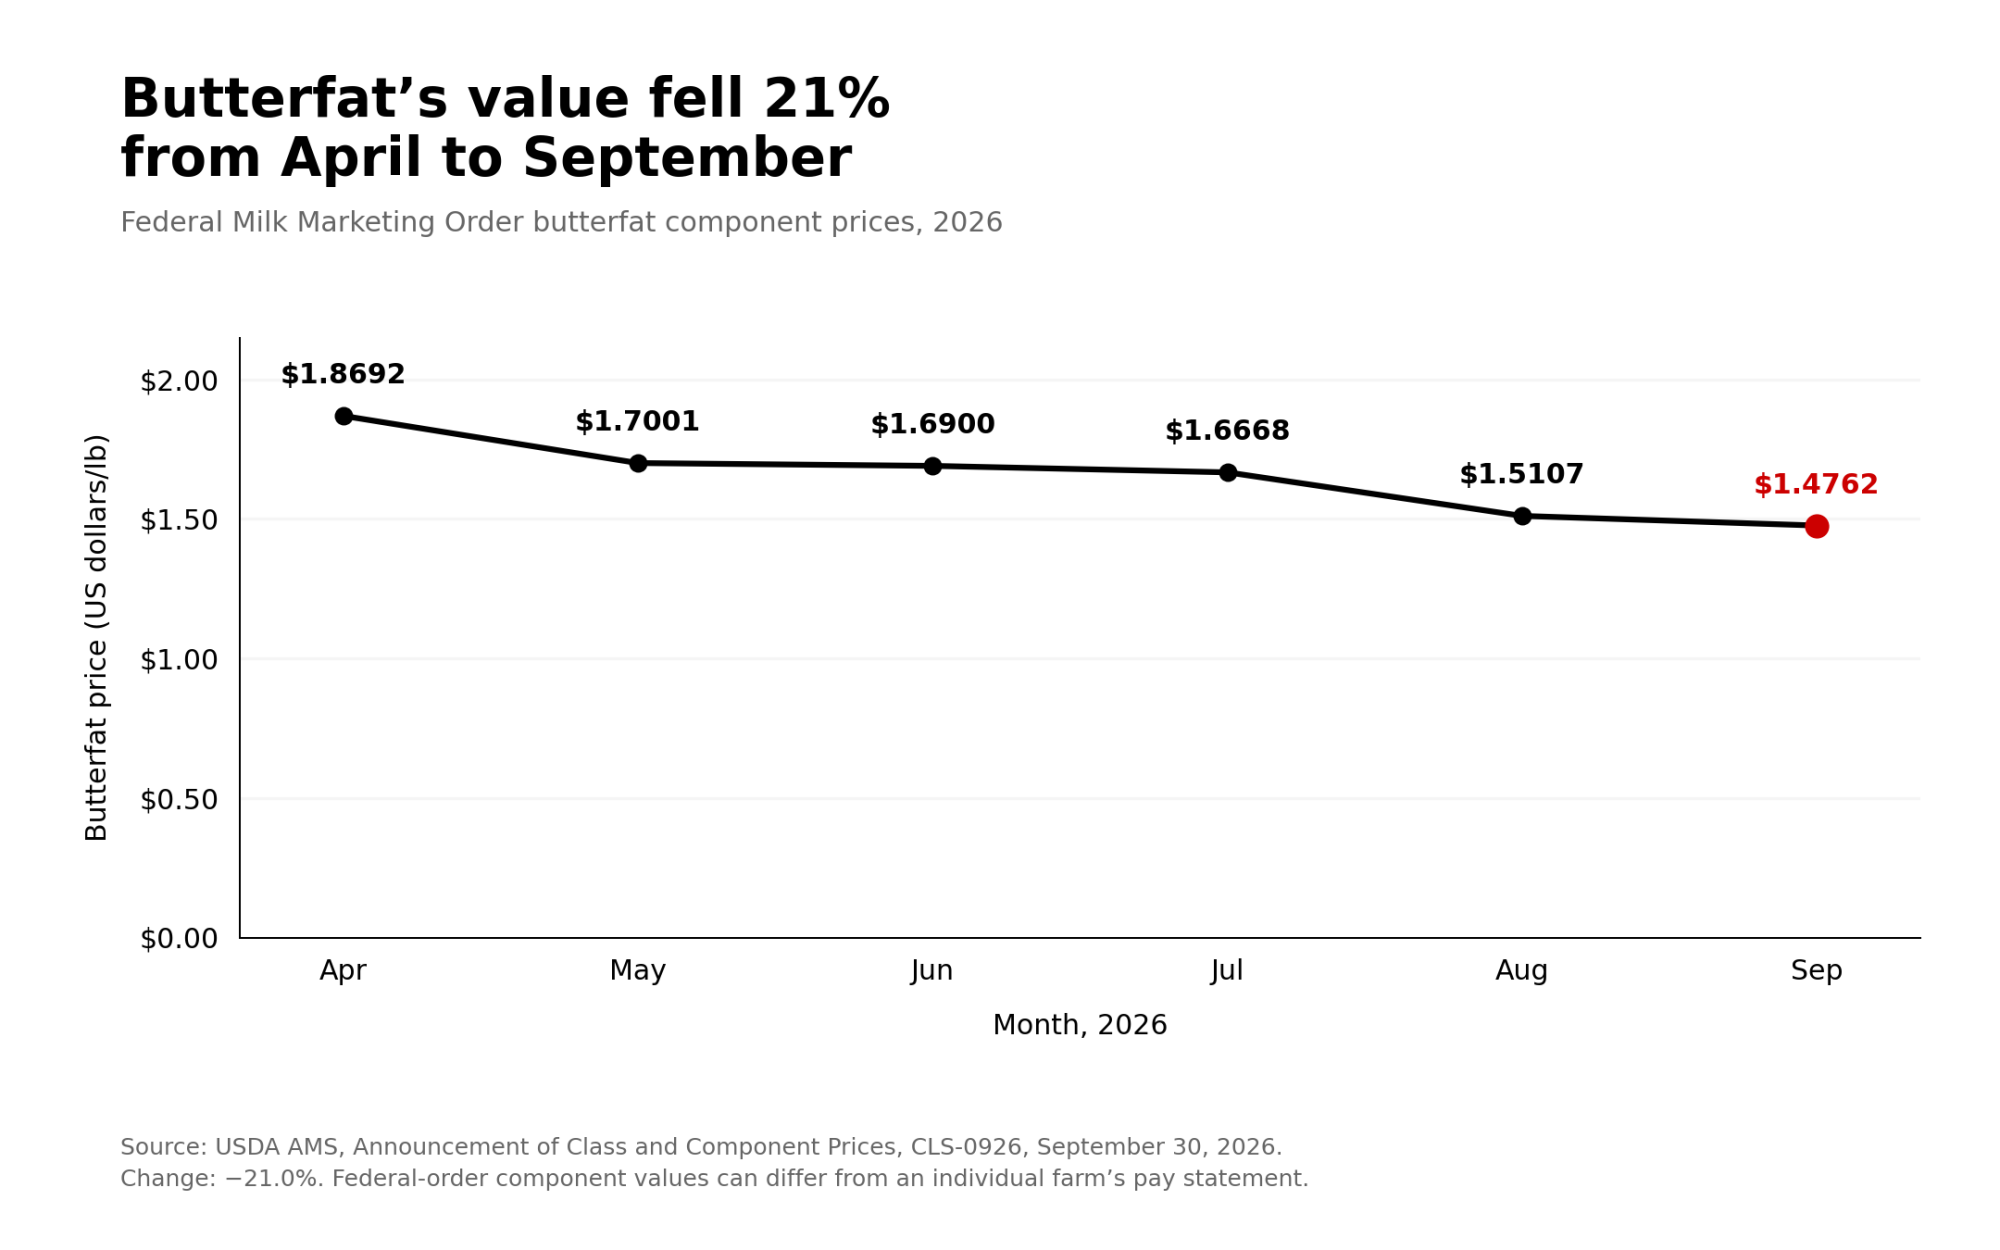
The high-oleic ration cost has to include beans, premium, roasting, true DM loss, rolling, freight, storage, testing and any MP fix. The alternative is the least-cost ration at equal NEL, MP and digestible amino acids, not conventional beans pound for pound. Use your own milk check’s fat value. Bullvine’s September 2026 Order 30 analysis put August protein at 1.87 times butterfat, and a weaker fat price raises the break-even.
The decision rule is simple. If your break-even is above Michigan State’s 0.198 lb, the best available bean trial doesn’t support the purchase. If the high-oleic ration is cheaper at equal nutrients with no fat response at all, it wins on cost alone. The beans pay at the bulk tank, not at the invoice.
What should you do next?

TimingWhat to doWhat it requiresAct now ifWhere it backfires
30 daysPrice three rations at equal NEL and MPDelivered quotes, processing terms, freight, lab values, your nutritionist’s formulationsA quote doesn’t say whether it’s per raw or finished ton, or at what moistureComparing raw tons to finished tons, or counting roasting twice
90 daysRun a farm trial only once the break-even fat number is written downStable forage, recorded DMI, component pounds, your milk-pay formulaYour break-even is near or above 0.198 lbCounting a higher fat test while milk drops and fat pounds stay flat
365 daysDecide on a supply contractSeasonal IOFC, roaster QC, consistent oleic profile, verified shrinkPaid response averages below break-even over the seasonLocking in a premium off your best month or one unusually good load

The 30-day step is the one that matters. Get the break-even fat number in pounds per cow per day from your nutritionist before you sign the first purchase order.

High-Oleic Soybean Break-Even Calculator

Calculate the daily milk fat response required to cover your local premium.

Methodology Note

Break-Even Fat Response = (daily cost premium of the high-oleic ration − value of other supported responses) ÷ the farm’s net value per lb of fat. All three rations are balanced at equal NEL and MP, with digestible amino acids, FA, RUFAL, NDF, starch and DMI reported. Costs are compared delivered, as finished feed, on a dry-matter basis. The incremental table uses the HOSB intakes Michigan State reports. The tonnage example uses Michigan State’s 8% intake and Farmers’ Grain & Feed’s 12% swap shrink, and it describes tonnage only. The 0, 0.110 and 0.198-lb responses are stress tests, not a probability distribution.

Learn More

  • How to Calculate Income Over Feed Cost From Paid Components — Lock in your true margin before testing new feed additives. This operational breakdown dismantles the obsession with gross milk yield, proving exactly why isolating component revenue against ration premiums dictates survival in a high-input market.
  • How RUFAL Changes Your Herd’s Milk Fat Depression Risk — Unsaturated fats in the rumen determine whether your expensive high-oleic swap actually yields bulk tank butterfat. Exposes the biological bottleneck behind component drops, arming you with a targeted feeding protocol to protect daily milk cheques.
  • The Hidden Maintenance Overhead: Calculating Hold-to-Proof Costs — Carrying unproven genetics to their first official proof burns capital just like inefficient feed contracts. Analyzes the crushing maintenance overhead of housing sires, delivering a hard-math framework to identify which investments actually warrant the operating cost.

The Sunday Read Dairy Professionals Don’t Skip.

Every week, thousands of producers, breeders, and industry insiders open Bullvine Weekly for genetics insights, market shifts, and profit strategies they won’t find anywhere else. One email. Five minutes. Smarter decisions all week.
NewsSubscribe
First
Last
Consent

6% or 24%? The RUFAL Audit That Turned a $40,000 Lameness Bill Into a Ration Problem.

Your herd doesn’t have to be a train wreck to bleed money. ‘Average’ lameness is a $40,000 ration problem in a lot of freestall barns.

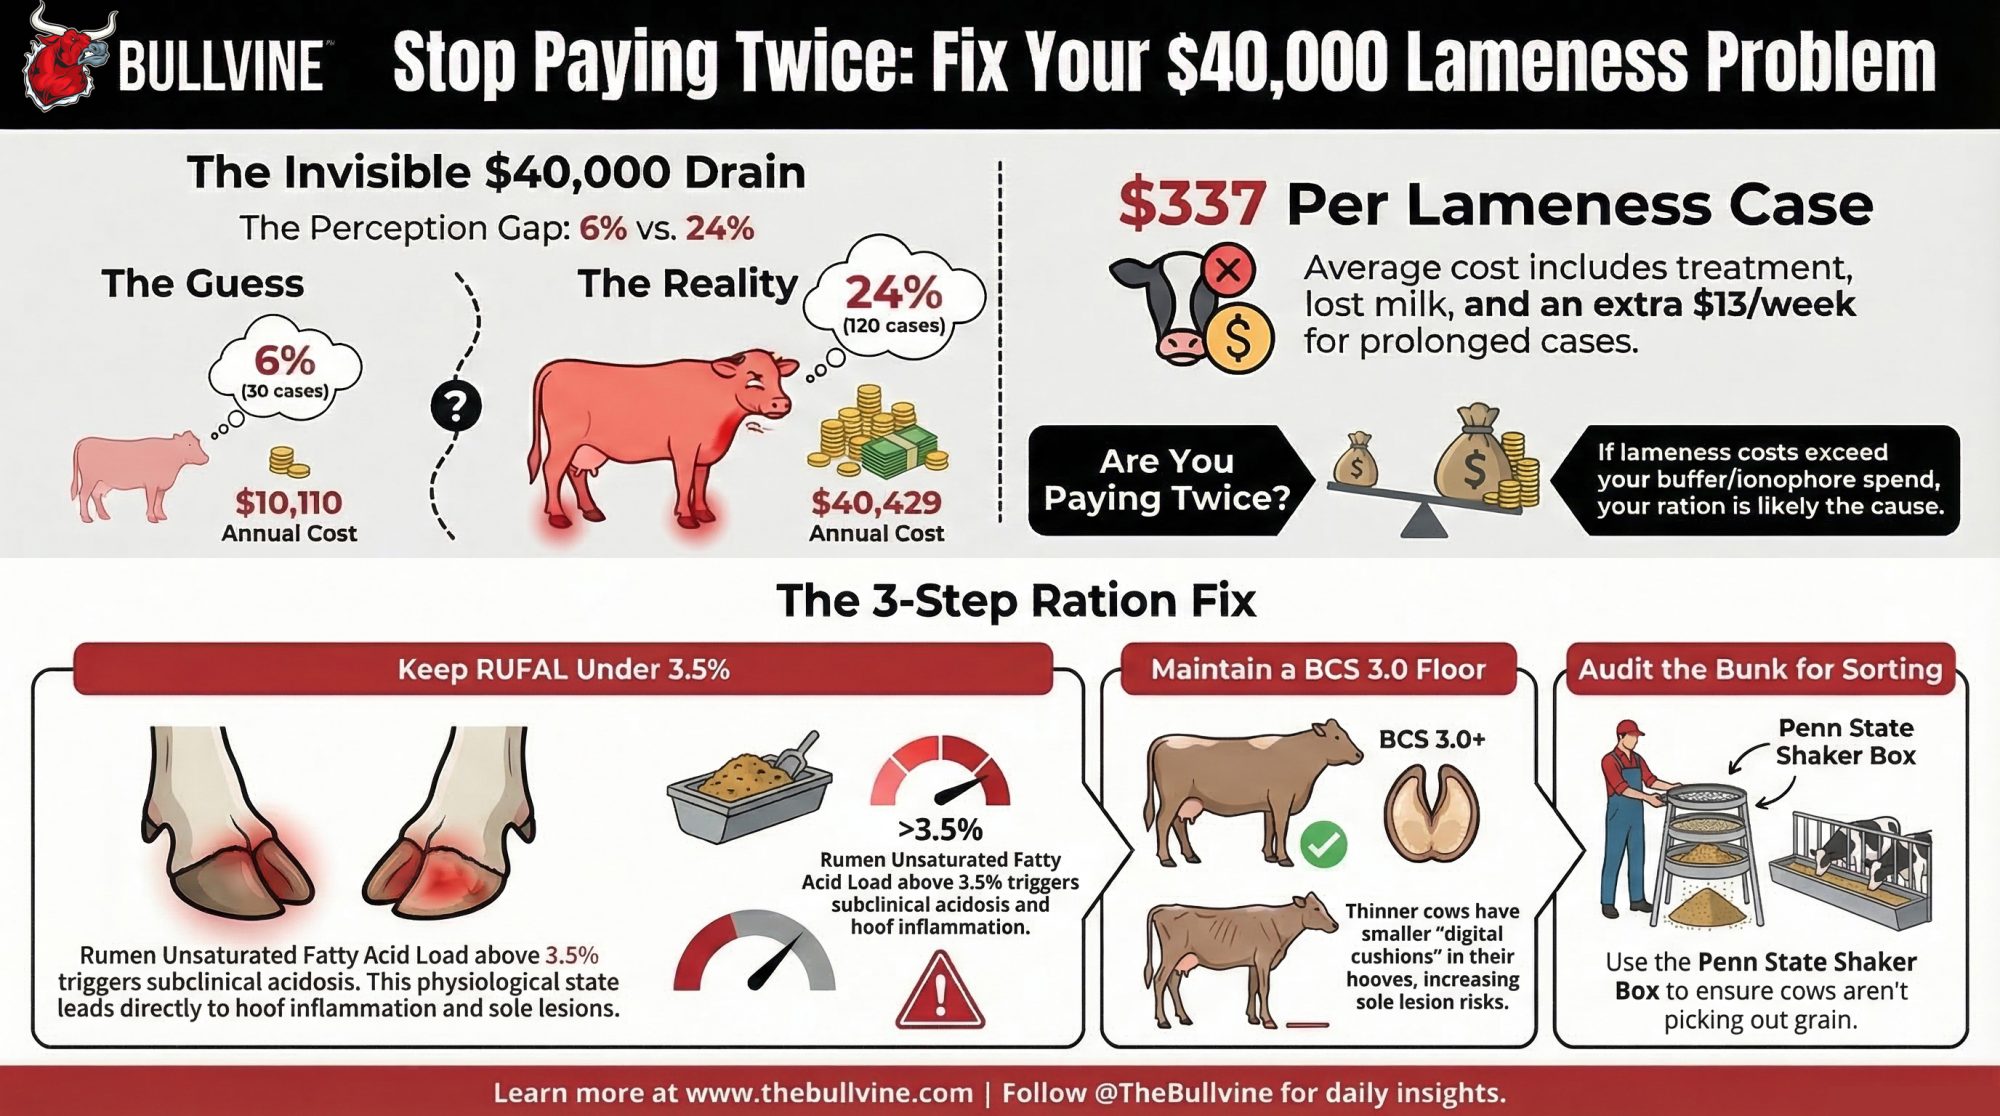
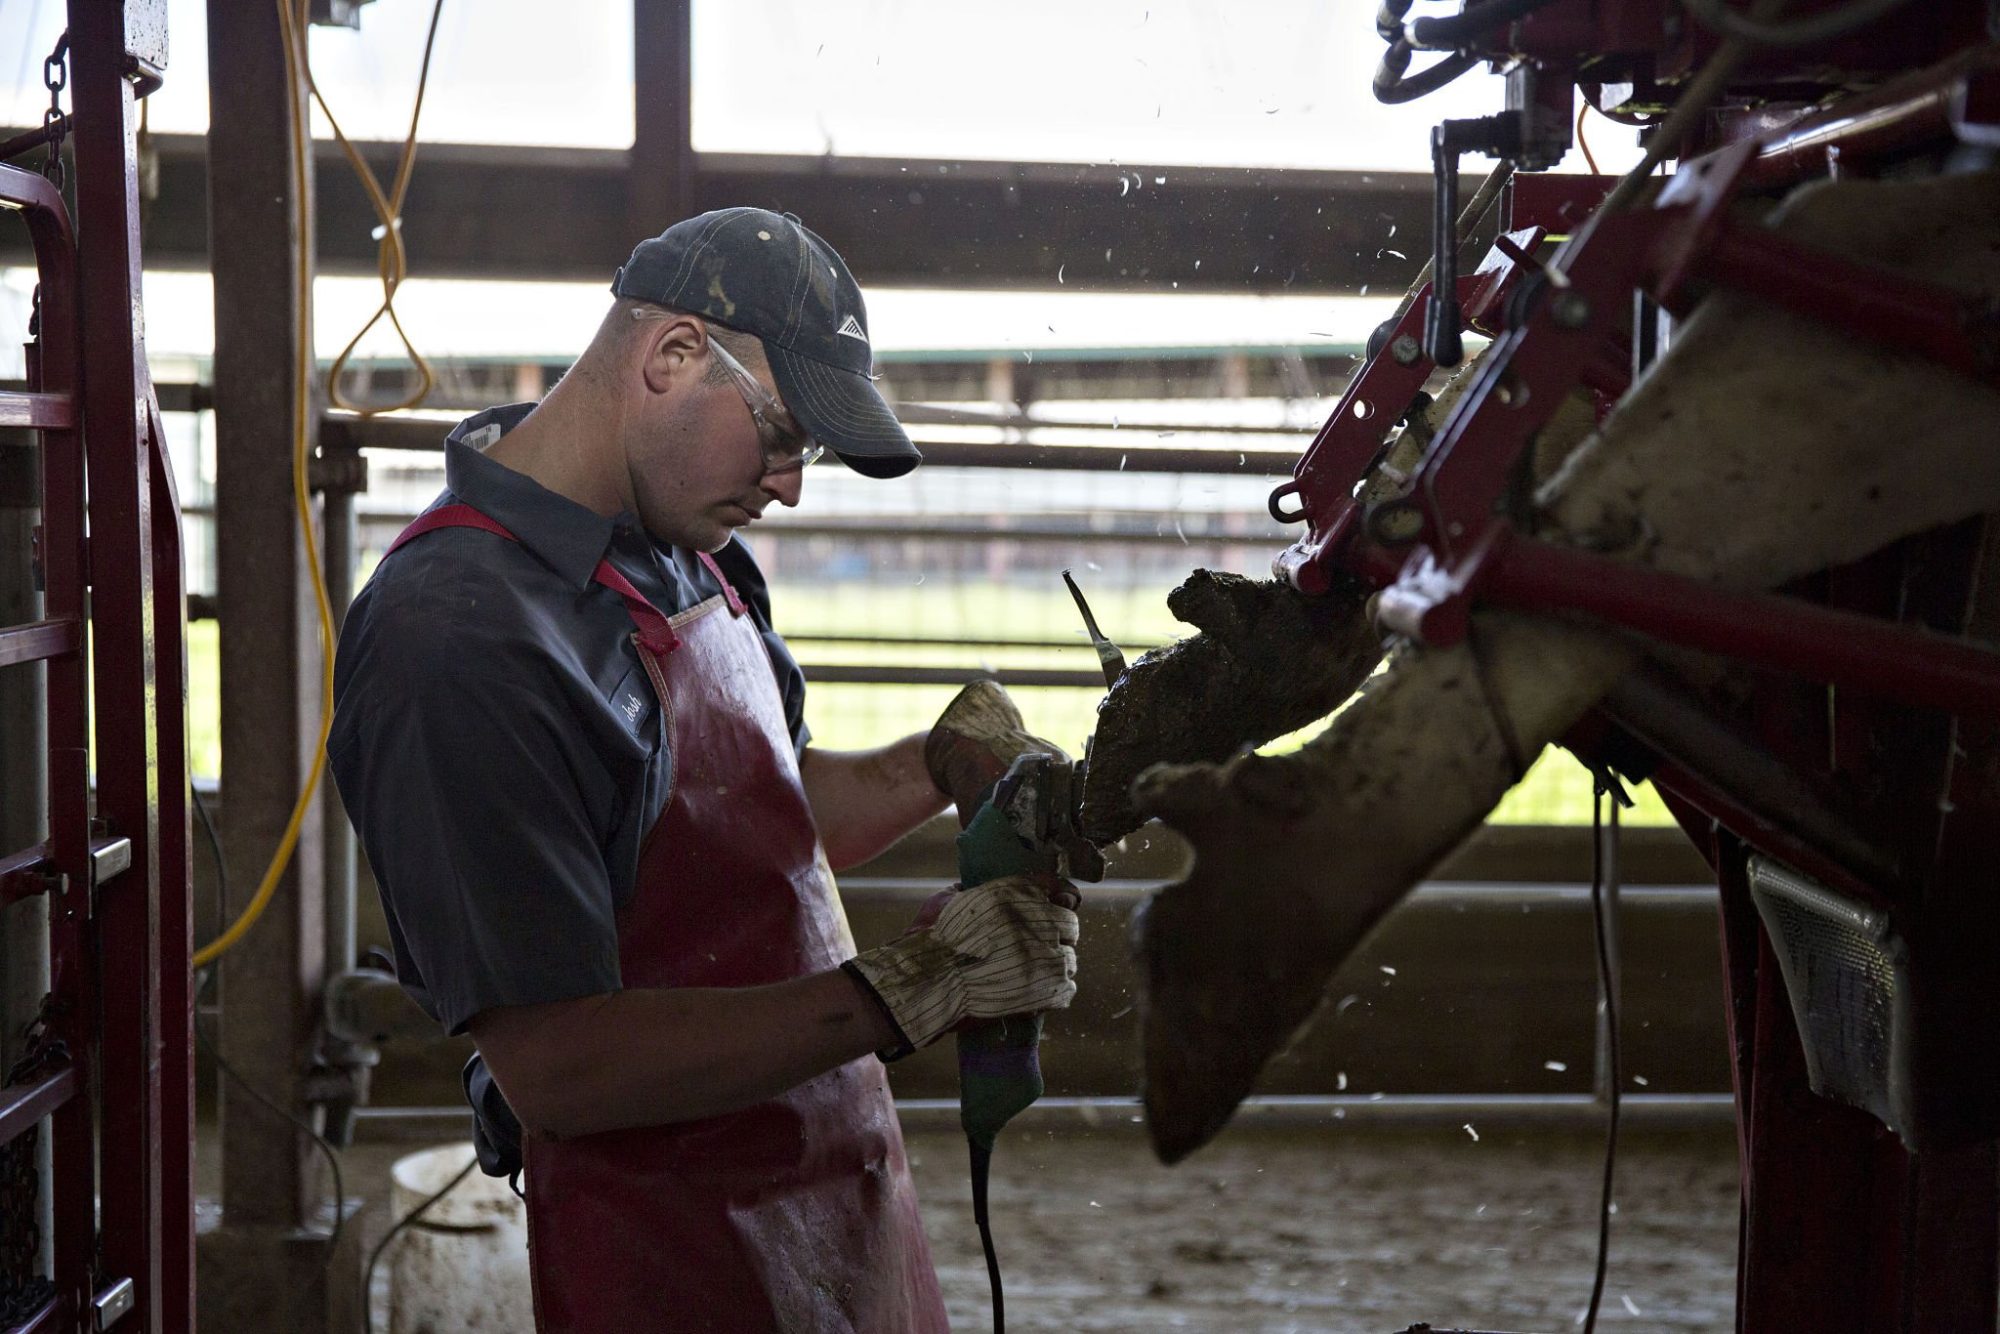
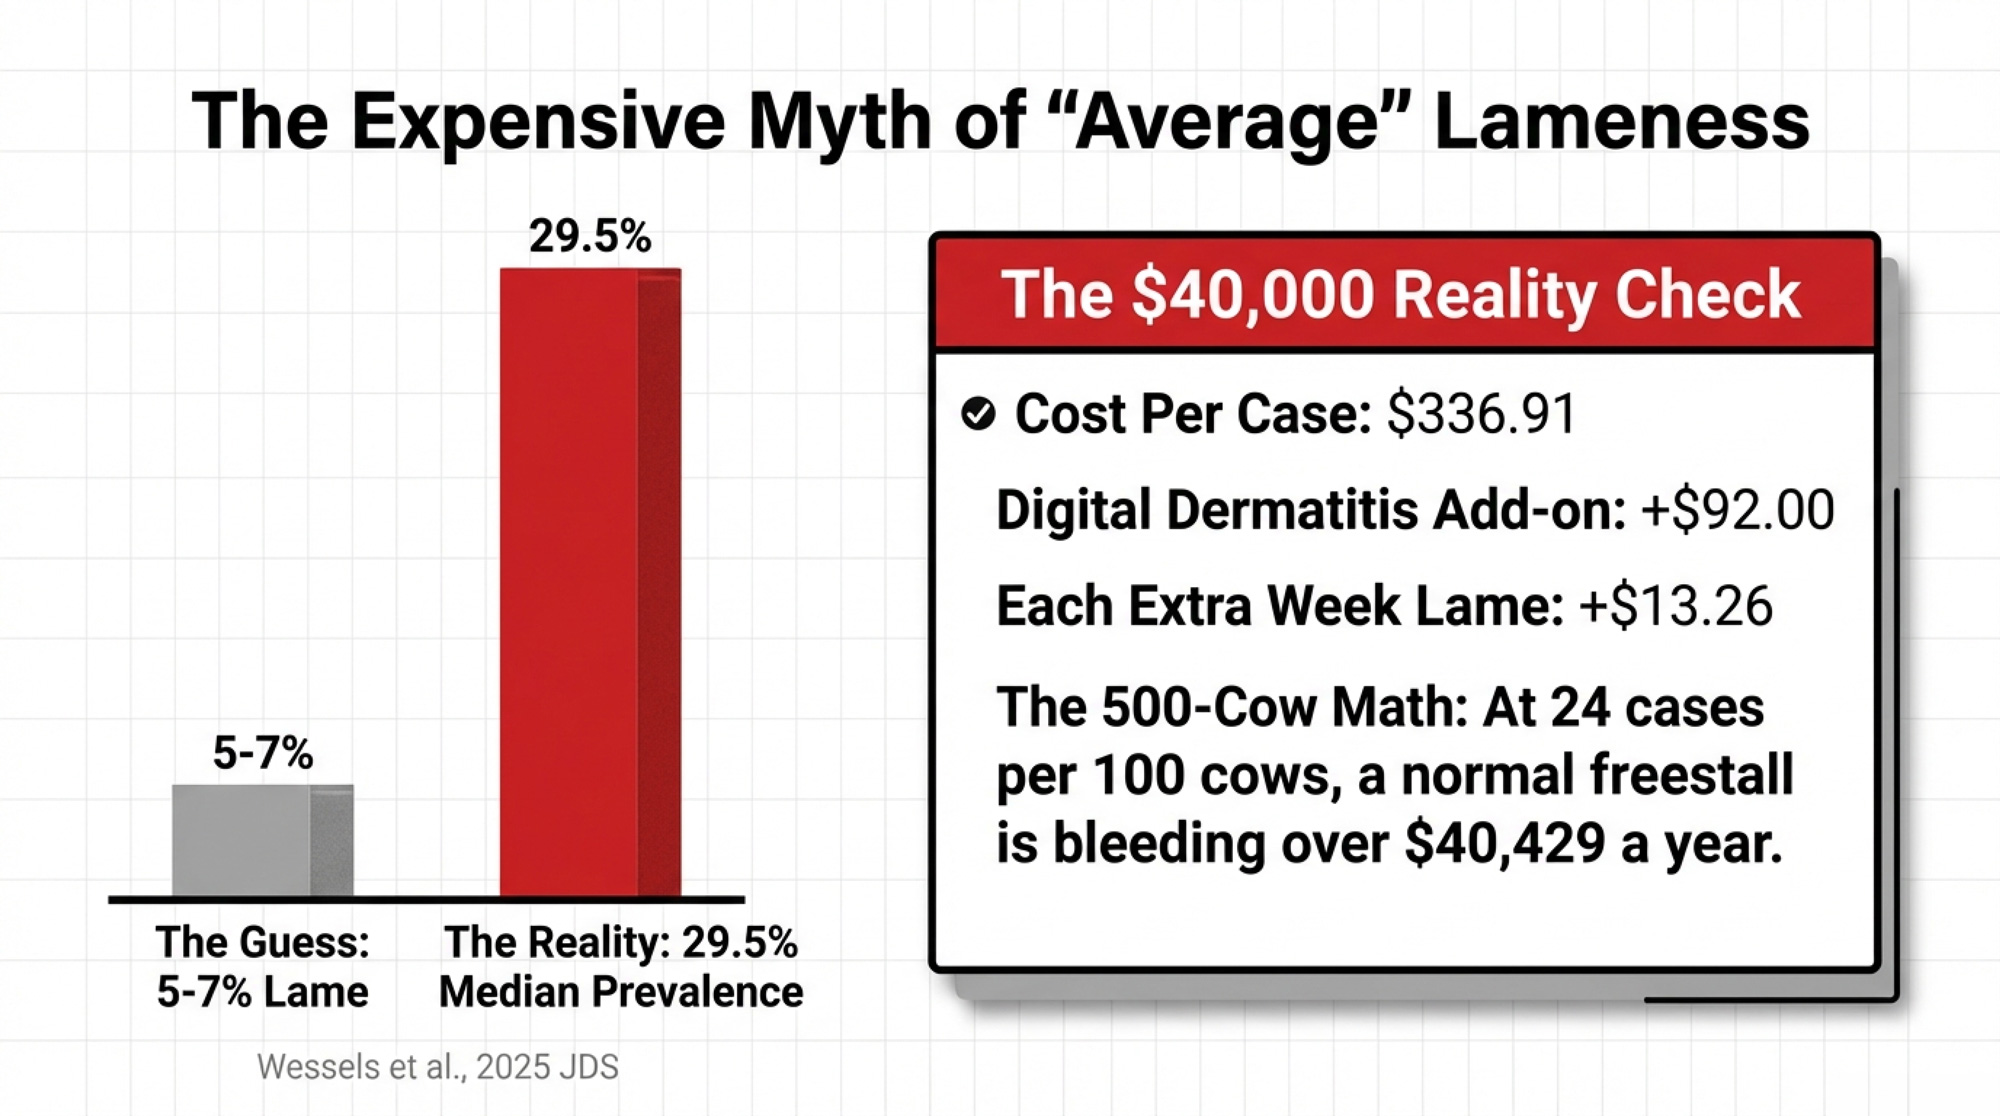
Executive Summary: Many freestall herds guess lameness at 5–7%, but proper scoring often lands closer to 20–25%, turning “normal” into a roughly $40,000‑a‑year problem at about $337 per case. Using the Robcis 2023 cost model and recent lameness research, this article walks through a composite 500‑cow herd in which one RUFAL audit traced that hidden bill back to the ration rather than just the trim chute. A high RUFAL (over about 3.5% of DM) quietly drives more subclinical acidosis, thinner digital cushions, and extra claw horn lesions — especially when low‑BCS dry cows and TMR sorting pile on. By pulling RUFAL down, enforcing a BCS 3.0 floor at calving, and tightening sorting with the Penn State shaker box, that herd cut lameness from 24 to under 18 cases per 100 cows and avoided roughly ,000 a year in lameness cost. The 30‑Day Lameness Audit and “Paying Twice” Calculator give you a simple way to put your buffer bill, lameness bill, and ration risk on one page. If your own math shows lameness costs bigger than your buffer spend, it’s a strong signal your ration and dry‑cow program — not your hoof trimmer — are the first place to go to work.

dairy lameness costs

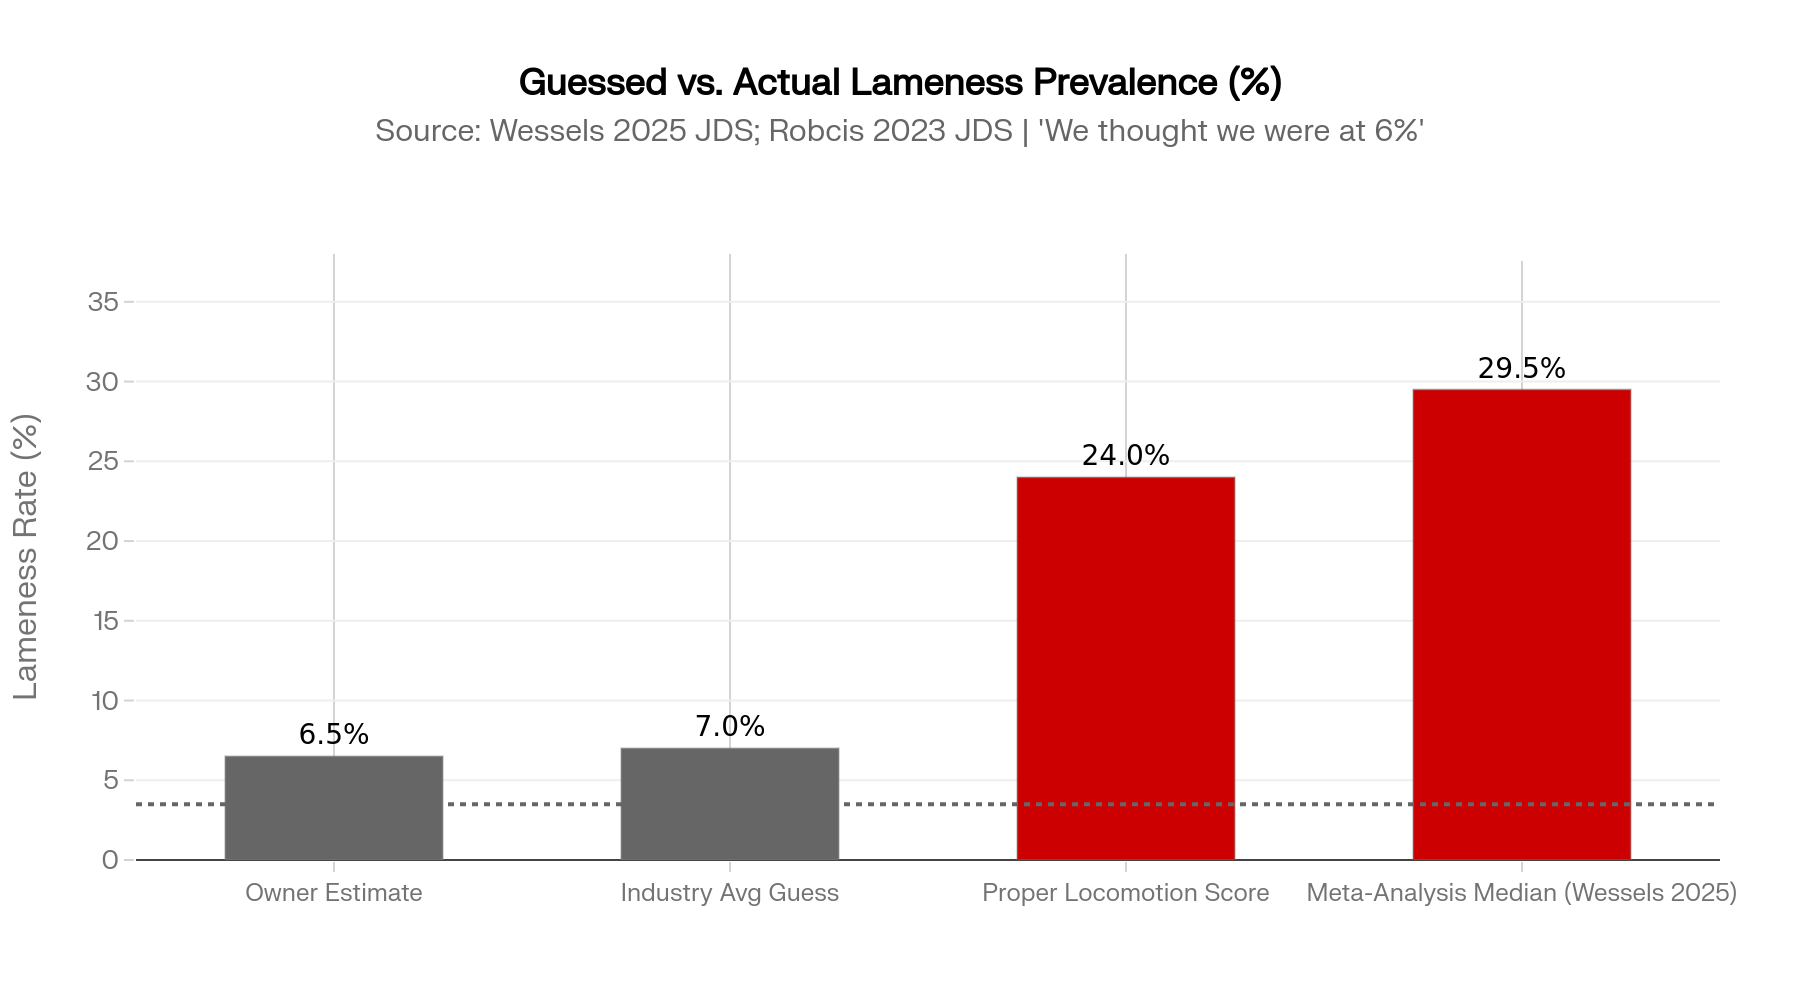
Nearly one in four dairy cows in freestall herds worldwide is lame right now — and most owners think their number is under 7%. A 2025 Journal of Dairy Science meta-analysis by Wessels et al. estimates a median lameness prevalence of 29.5% across studies. A 2023 Journal of Dairy Science bioeconomic model by Robcis et al. puts the average cost at €307.50 ($336.91 USD) per case, with digital dermatitis cases roughly $92 more expensive and an extra $13.26 tacked on for every additional week a cow stays lame.

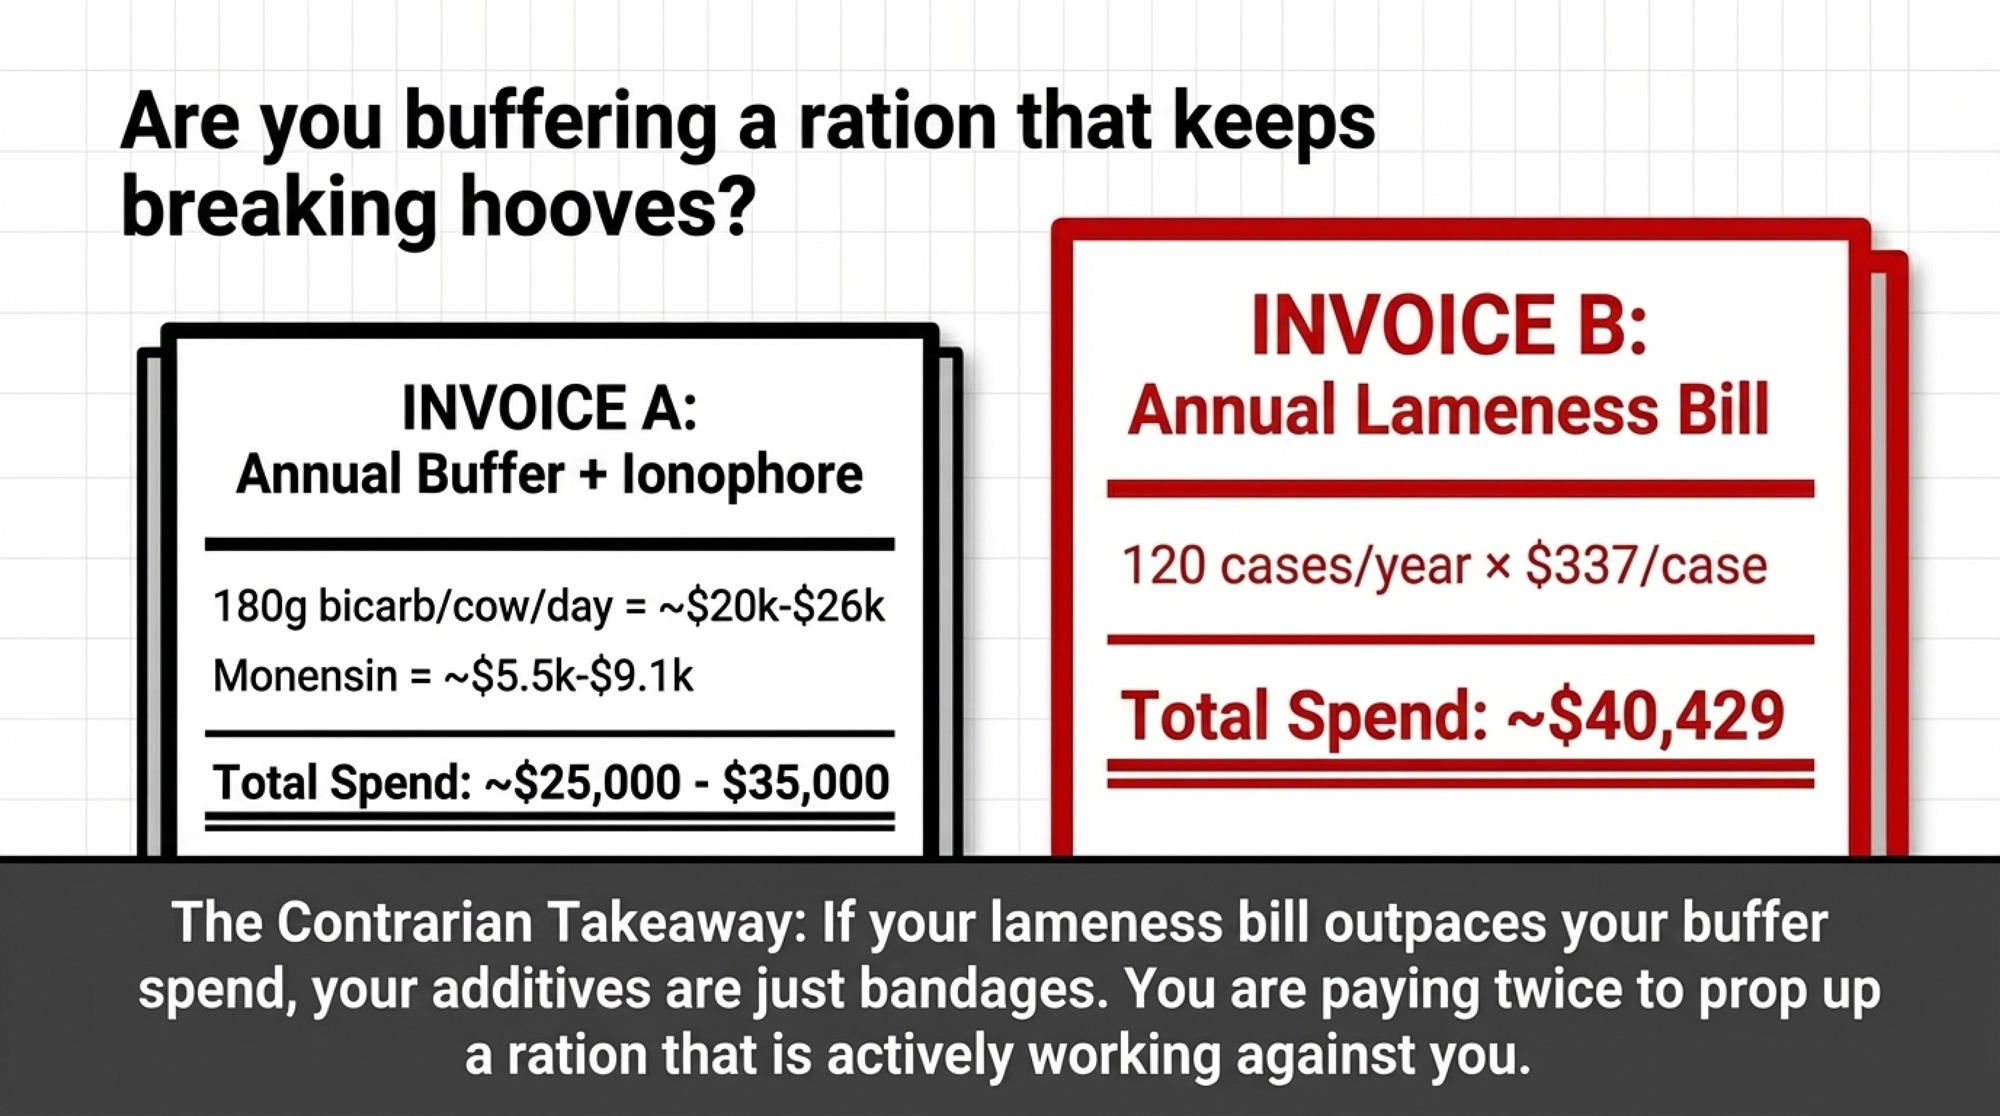
Those two numbers collided on a 500-cow North American freestall operation when the owner put the annual trim-chute costs and the sodium bicarbonate invoice on the same spreadsheet for the first time. What he found: the herd was spending over $40,000 a year on lame cows and another $25,000–35,000 buffering a ration that kept breaking hooves. He wasn’t running a bad dairy. He was running an average one. And the average was expensive.

What follows is a composite management case built from 2023–2025 lameness research and field data. No single farm is named — but the numbers, the patterns, and the ration problems are real.

“We Thought We Were at 6%.”

If you’ve ever guessed your herd’s lameness prevalence before a welfare audit, you already know this part. Someone says five percent. Maybe six. You picture the obvious head-bobbers and move on.

That’s what happened here. The owner and herd manager settled on “six or seven percent.” Then they brought in locomotion scoring — the three-point system (1 = sound, 3 = arched back with shorter stride and head bob, 5 = clearly favoring one or more hooves). Over two sessions, an outside vet scored every cow in the herd. The number wasn’t 6%. It was just under 24%.

The perception gap isn’t unique to this farm. A 2019 review in Animals (Salgado et al., doi:10.3390/ani9050270) found that farmers consistently underestimate lameness prevalence compared to trained scorers — often by a factor of two to four. Put that gap beside the Robcis cost model, and “six percent” starts to look like an expensive myth.

Two hard questions came out of that scoring session: What in our system is actually creating lame cows? And how much are we spending to manage the damage rather than prevent it?

The ration sheet had the first answer.

What Is RUFAL — and Why Is 3.5% the Line?

The cows were milking well. Components looked good. Total dietary fat didn’t seem extreme. But when the herd nutritionist ran the numbers through AMTS — one of the ration-balancing platforms that calculates RUFAL (NDS and CPM Dairy do too, though display units may differ between grams per day and percent of DM) — the story shifted.

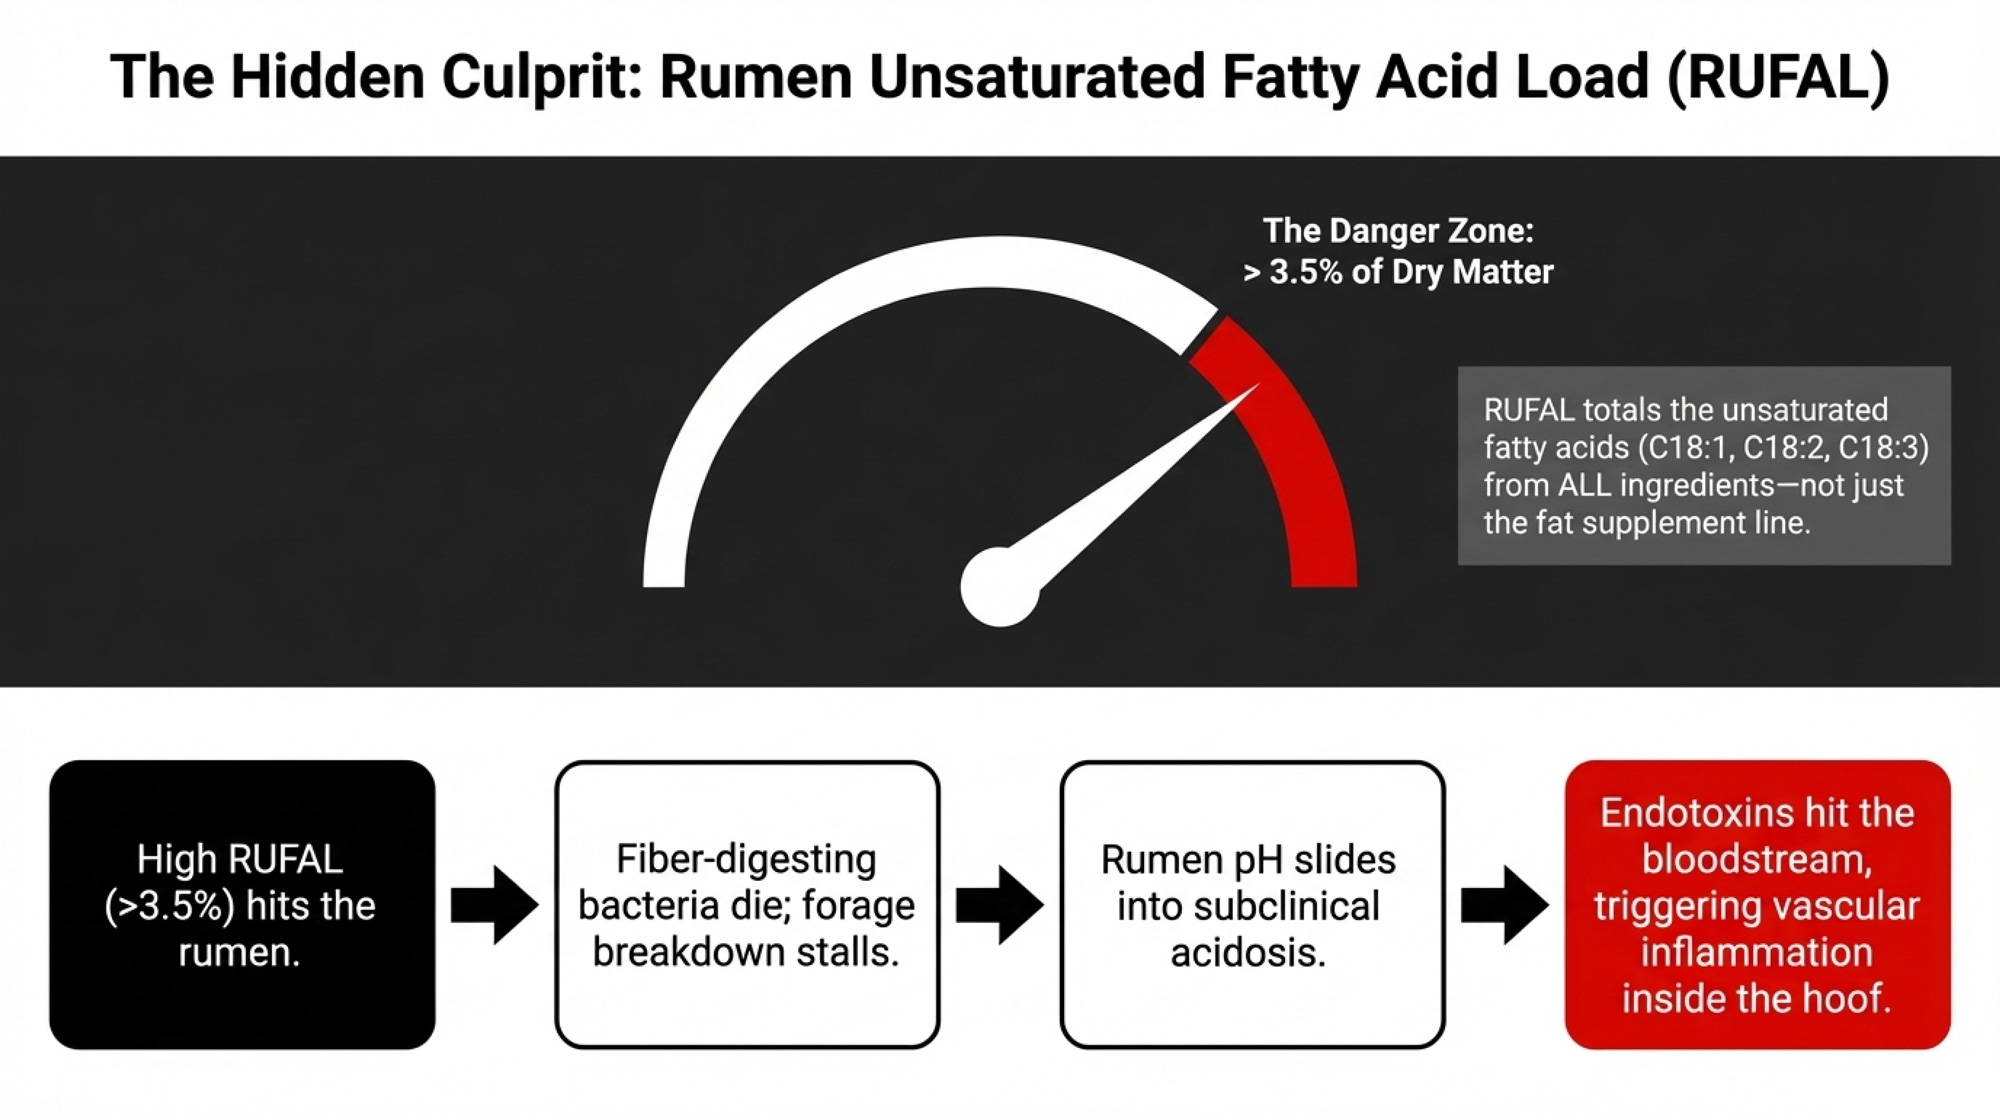
RUFAL — Rumen Unsaturated Fatty Acid Load — totals the unsaturated C18:1, C18:2, and C18:3 fatty acids entering the rumen from all ingredients: corn silage, high-moisture corn, DDGS, whole or extruded soybeans, vegetable oils — not just the “fat supplement” line. Dr. Tom Jenkins at Clemson University developed the concept. On this herd, the number came back at about 3.8% of the ration DM.

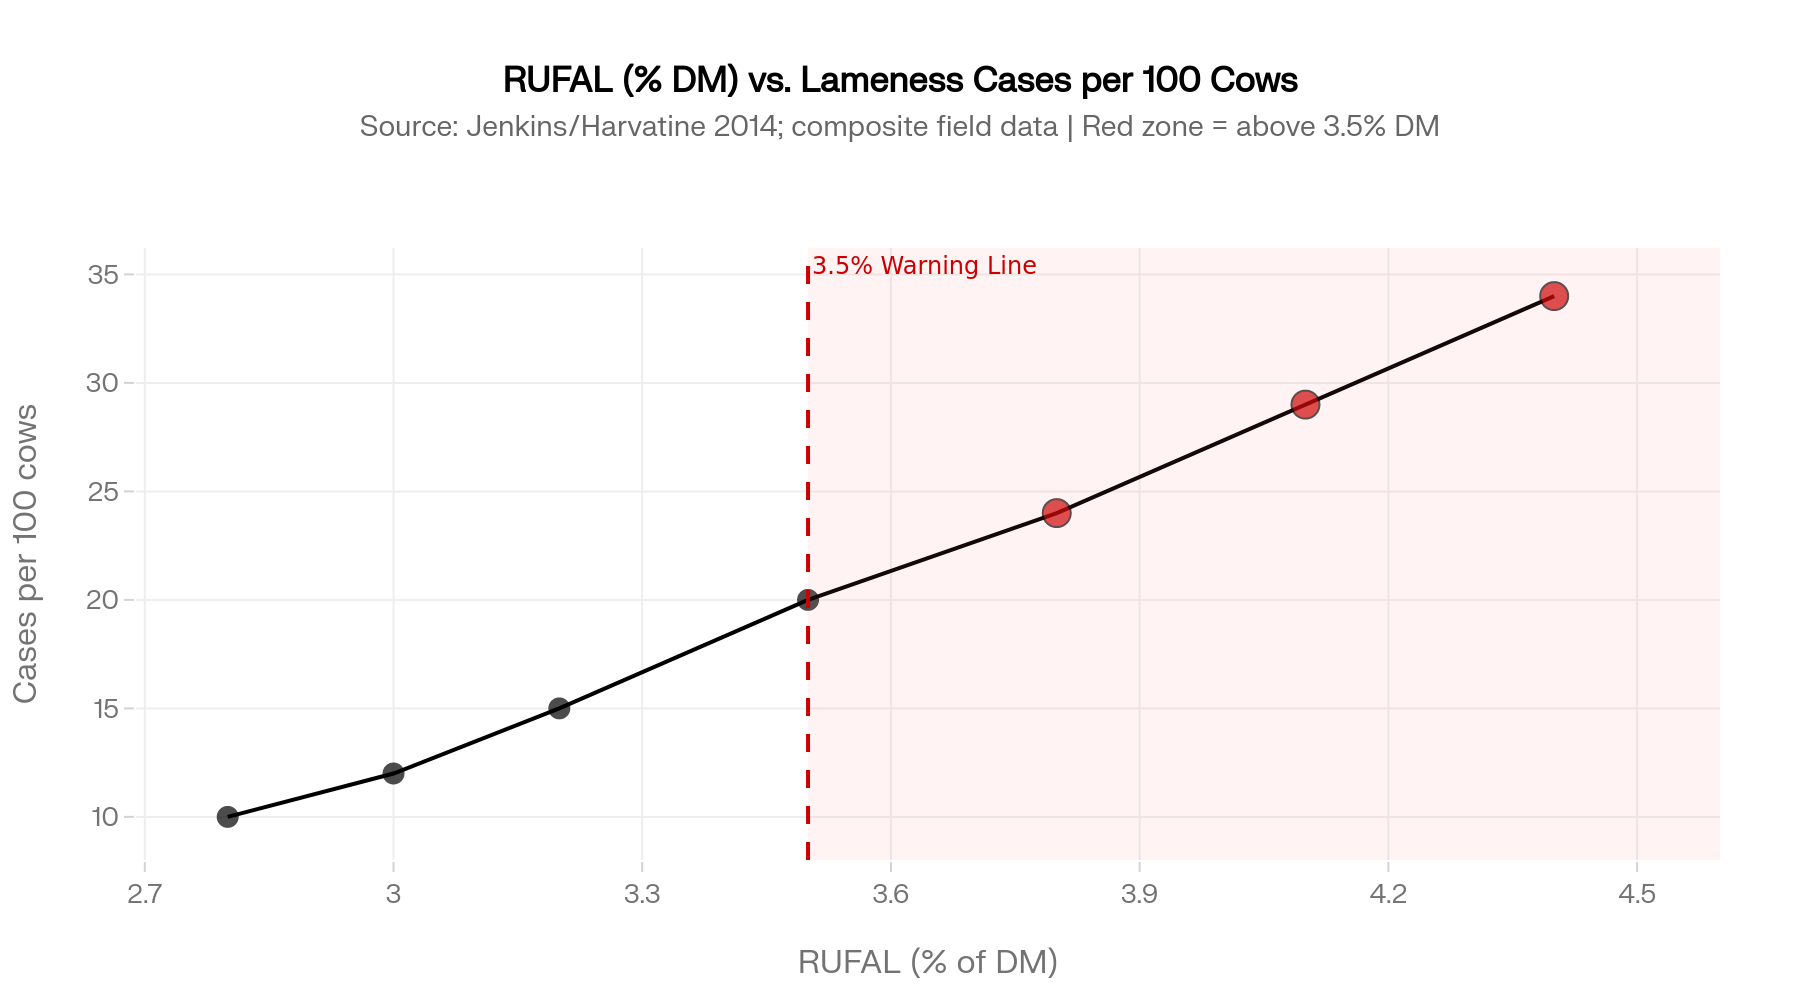
As Jenkins summarized in a 2013 presentation and later with Harvatine in 2014, values below about 3.5% of DM are viewed as lower-risk fat intakes, while those above 3.5% indicate fatty acid loads that “may be at risk of being too high.” That’s not a hard clinical cutoff — it’s a red-flag level at which rumen fat load warrants closer scrutiny.

Above 3.5% RUFAL, fiber-digesting bacteria take the hit first. Forage doesn’t break down as it should. Rumen pH slides toward subclinical acidosis more often, especially when cows sort and slug-feed. And it changes the mix of volatile fatty acids and endotoxins hitting the bloodstream — some of which are linked to vascular changes and inflammation inside the hoof.

RUFAL Cheat Sheet: What Pushes It Up and What Doesn’t

IngredientRUFAL ImpactApprox. C18 UFA (% EE)Risk Level at Typical Inclusion
Soybean oil / corn oil (free liquid)Very High~85–90%🔴 High — small additions move RUFAL sharply
Corn DDGS (full fat, 10–12% EE)High~60–65%🔴 High — linoleic acid rapidly rumen-available
Whole / extruded soybeansHigh~55–60%🔴 High — extrusion makes oil fully rumen-active
Corn silage (high-oil hybrids)Moderate-High~45–55%🟡 Moderate — adds up fast at 55–65% ration DM
High-moisture cornModerate~40–50%🟡 Moderate — germ oil more available than dry corn
Grass / legume foragesLow-Moderate~35–45%🟢 Lower — fat mostly intact in cell structure
Calcium salts of palm FA (e.g., Megalac)Low~5–10% C18🟢 Low — bypass rumen; mostly saturated
Hydrogenated tallow / prilled fatVery Low~2–5% C18🟢 Very Low — saturated, rumen-inert
C16:0 palmitic acid supplementsNone0% (C16, not C18)🟢 None — not counted in RUFAL calculation

When the Buffer Bill and the Lameness Bill Look the Same

The herd nutritionist stared at the RUFAL printout. Then she pulled up the annual bicarb and monensin invoices.

Buffer + ionophore spend (illustrative field math):

  • 24 kg DM/cow/day × 0.75% sodium bicarbonate = 180 g bicarb per cow per day. 
  • At $0.60–0.80/kg feed-grade bicarb: roughly $0.11–0.14 per cow per day.
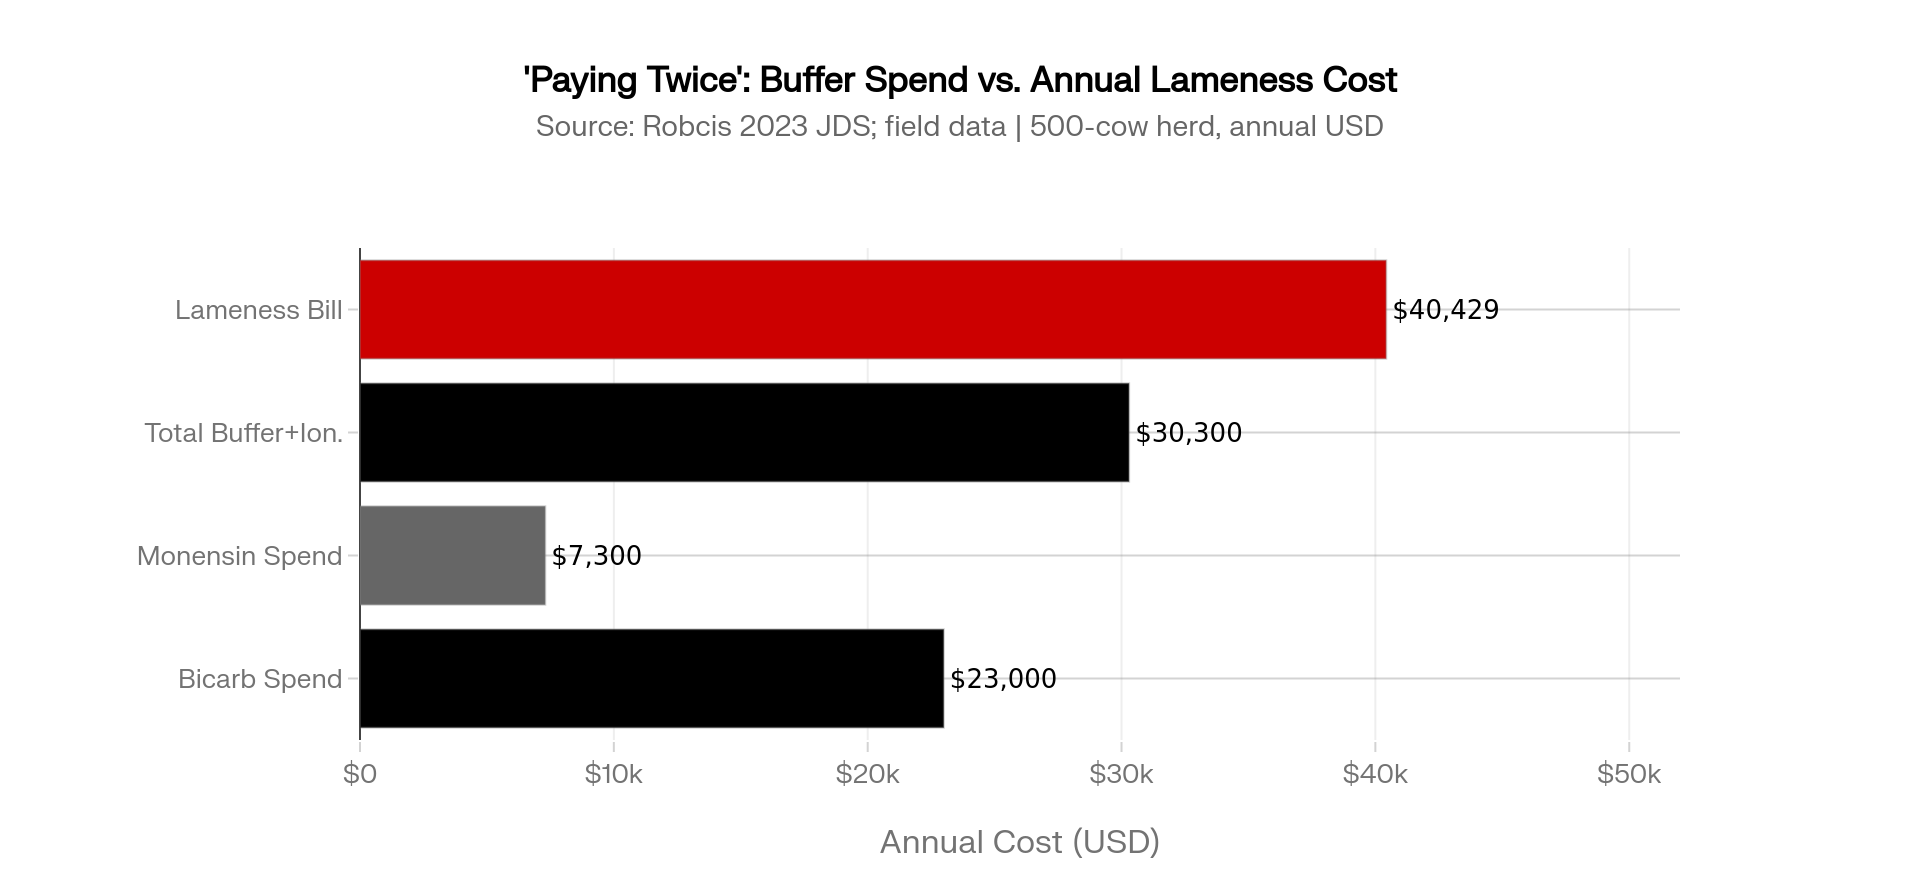
  • 500 cows × 365 days: approximately $20,000–26,000/year on bicarb.
  • Monensin at $0.03–0.05/cow/day adds roughly $5,500–9,100/year.
  • Combined: roughly $25,000–35,000 annually.

Lameness bill:

  • 120 cases/year (24 per 100 cows) × $336.91 per case = approximately $40,429 on the Robcis model. 

They weren’t wrong to use buffers and monensin. But here’s the decision frame that changed the conversation: If your RUFAL is below 3.5% and you’re still seeing subclinical acidosis, the buffer is doing its job. If RUFAL is above 3.5%, the buffer is a bandage — fix the ration first.

This herd was paying twice. Once to keep a high-RUFAL ration from falling over, and again when the system still generated enough lame cows to cost $40,000 a year.

📊 The “Paying Twice” Calculator

Cost A — Annual Buffer + Ionophore Spend
(Bicarb kg/cow/day × price/kg × 365 × herd size) + (monensin cost/cow/day × 365 × herd size)

Cost B — Annual Lameness Bill
(Total lameness cases in 12 months) × $337

If Cost B > Cost A, your ration may be working against you despite the additives propping it up.

This herd: Cost A ≈ $30,000. Cost B ≈ $40,429. Gap: over $10,000.

What Were the Thin Dry Cows Telling Them?

The next uncomfortable meeting wasn’t at the mixer. It was in the dry-cow pen.

When they pulled BCS scores, a pattern jumped out: too many cows were drying off below BCS 3.0, and first-lactation heifers were often closer to 2.5–2.75. Those same animals kept reappearing in the trim chute after freshening.

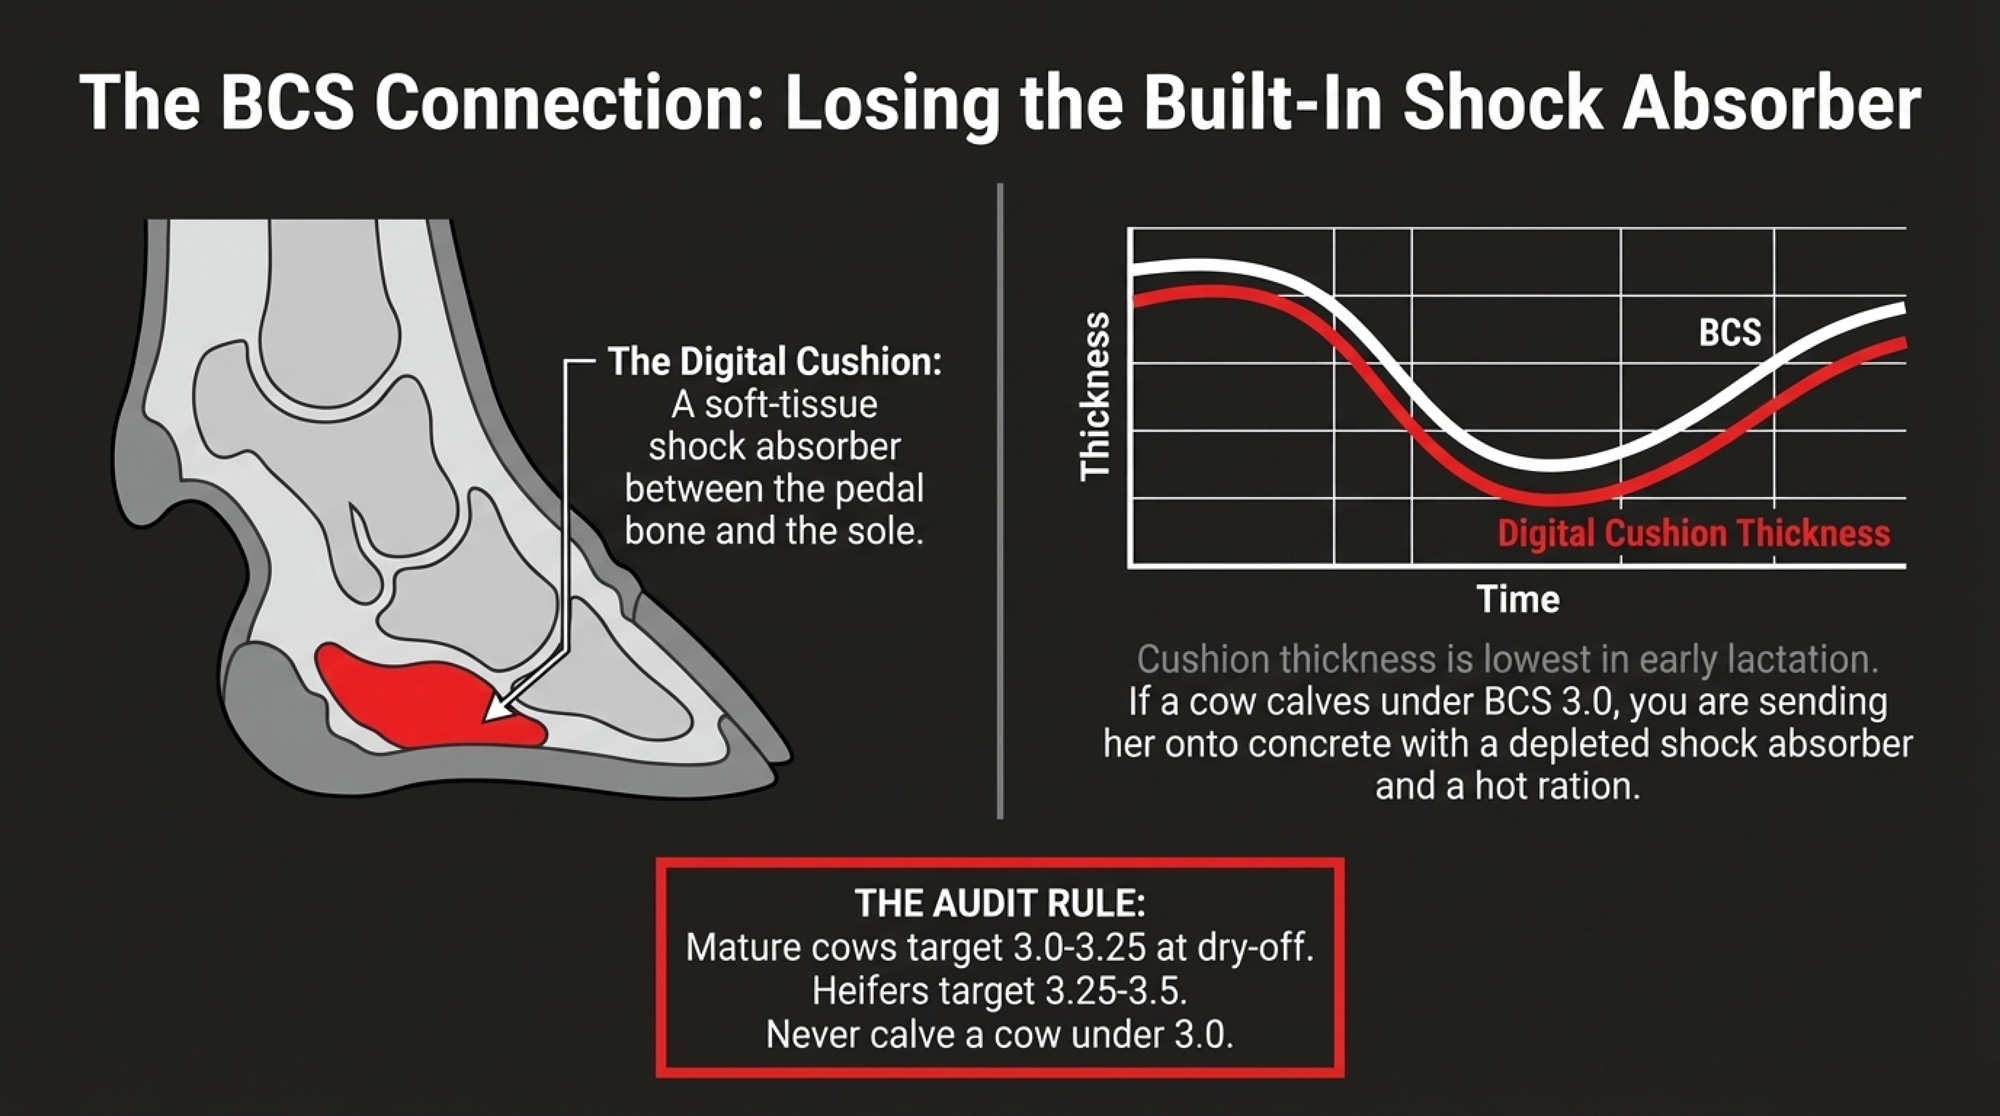
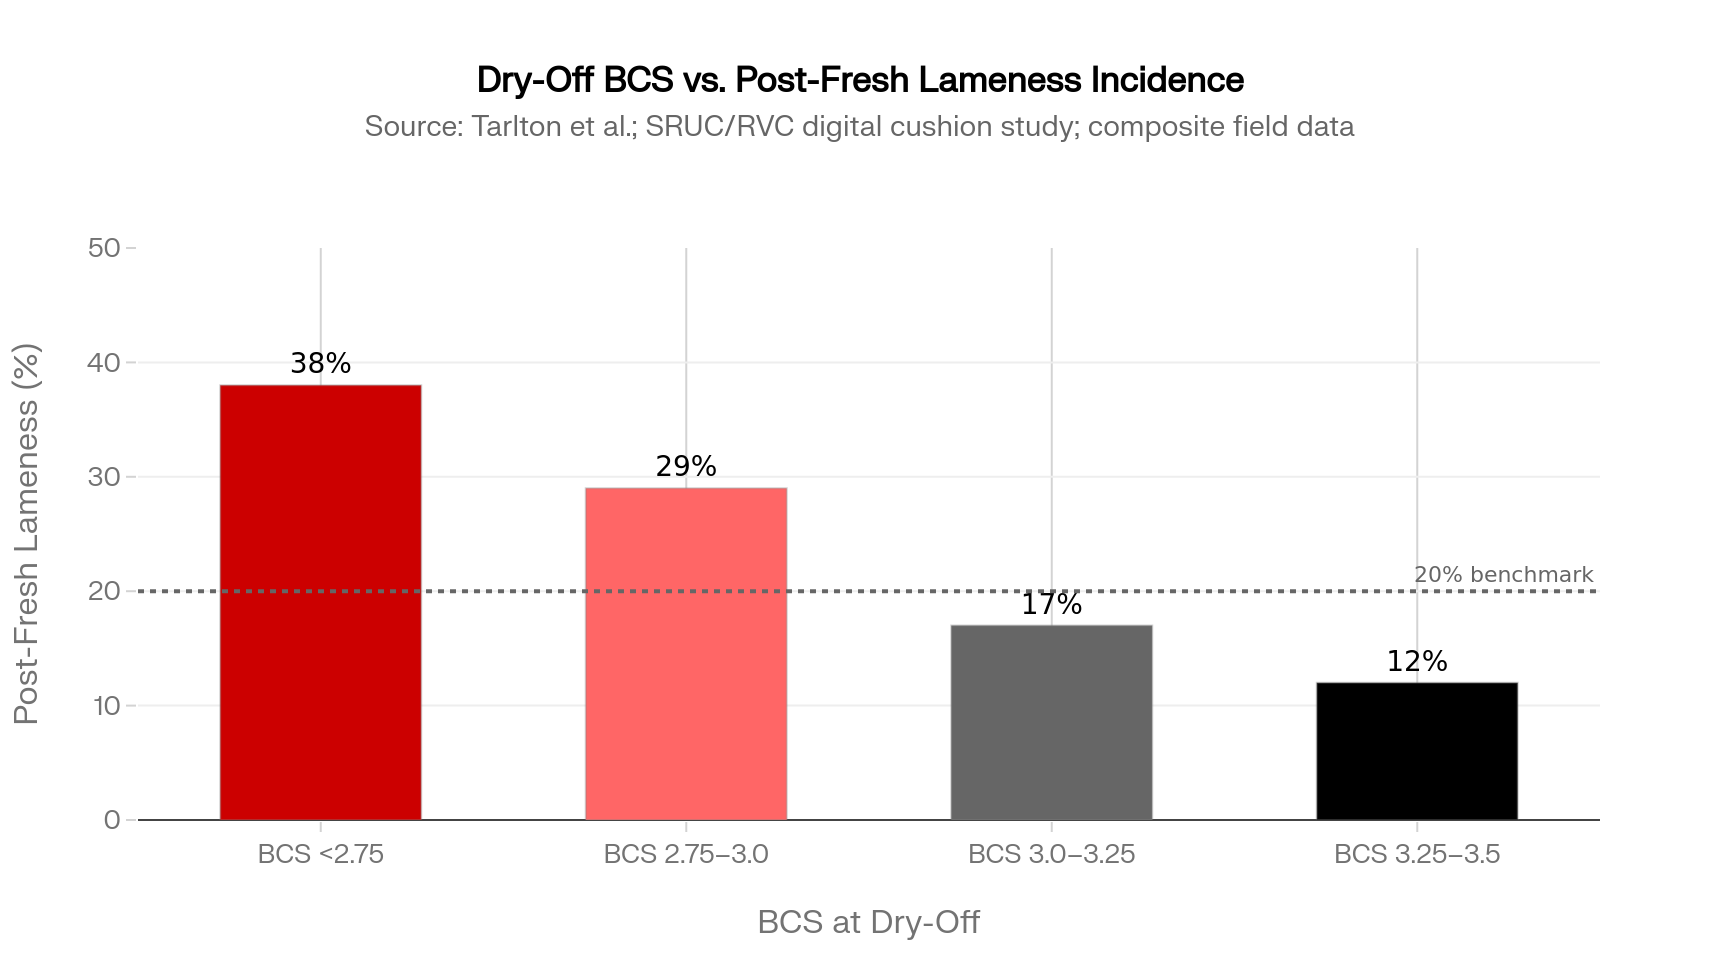
Coverage of a £1 million SRUC/RVC/Liverpool digital cushion study in Dairy Global reported that cows with greater digital cushion thickness had decreased odds of sole lesions (odds ratio about 0.74 for the typical ulcer site). That soft-tissue pad under the sole is thickest late in lactation and thinnest in early lactation — exactly when cows face the most metabolic stress and the most concrete. Earlier work from Tarlton and colleagues showed that hormonal changes around calving loosen the suspensory apparatus inside the claw, allowing the pedal bone to shift downward when cushion thickness is already at its lowest.

More recent work from the University of Nottingham, covered in The Bullvine’s December 2025 JDS roundup, found structural differences in the digital cushions of cows with lifetime histories of hoof horn lesions — including changes in collagen composition that may reduce shock absorption.

If you send a cow into that calving period at BCS 2.5, you’re not just flirting with ketosis. You’re thinning the shock absorber between bone and sole when she’s about to spend more time on concrete and eat a hotter ration. For a deeper look at how prepartum BCS affects DMI and energy balance, The Bullvine’s breakdown of the University of Florida BCS research lays out the numbers by BCS category.

The herd drew a line: mature cows at BCS 3.0–3.25 at dry-off, first-lactation heifers at about 3.25–3.5, and any animal below those targets in the last 60 days of lactation flagged as a “rebuild” cow.

Can RUFAL and Dry-Off BCS Really Change Your Lameness Bill?

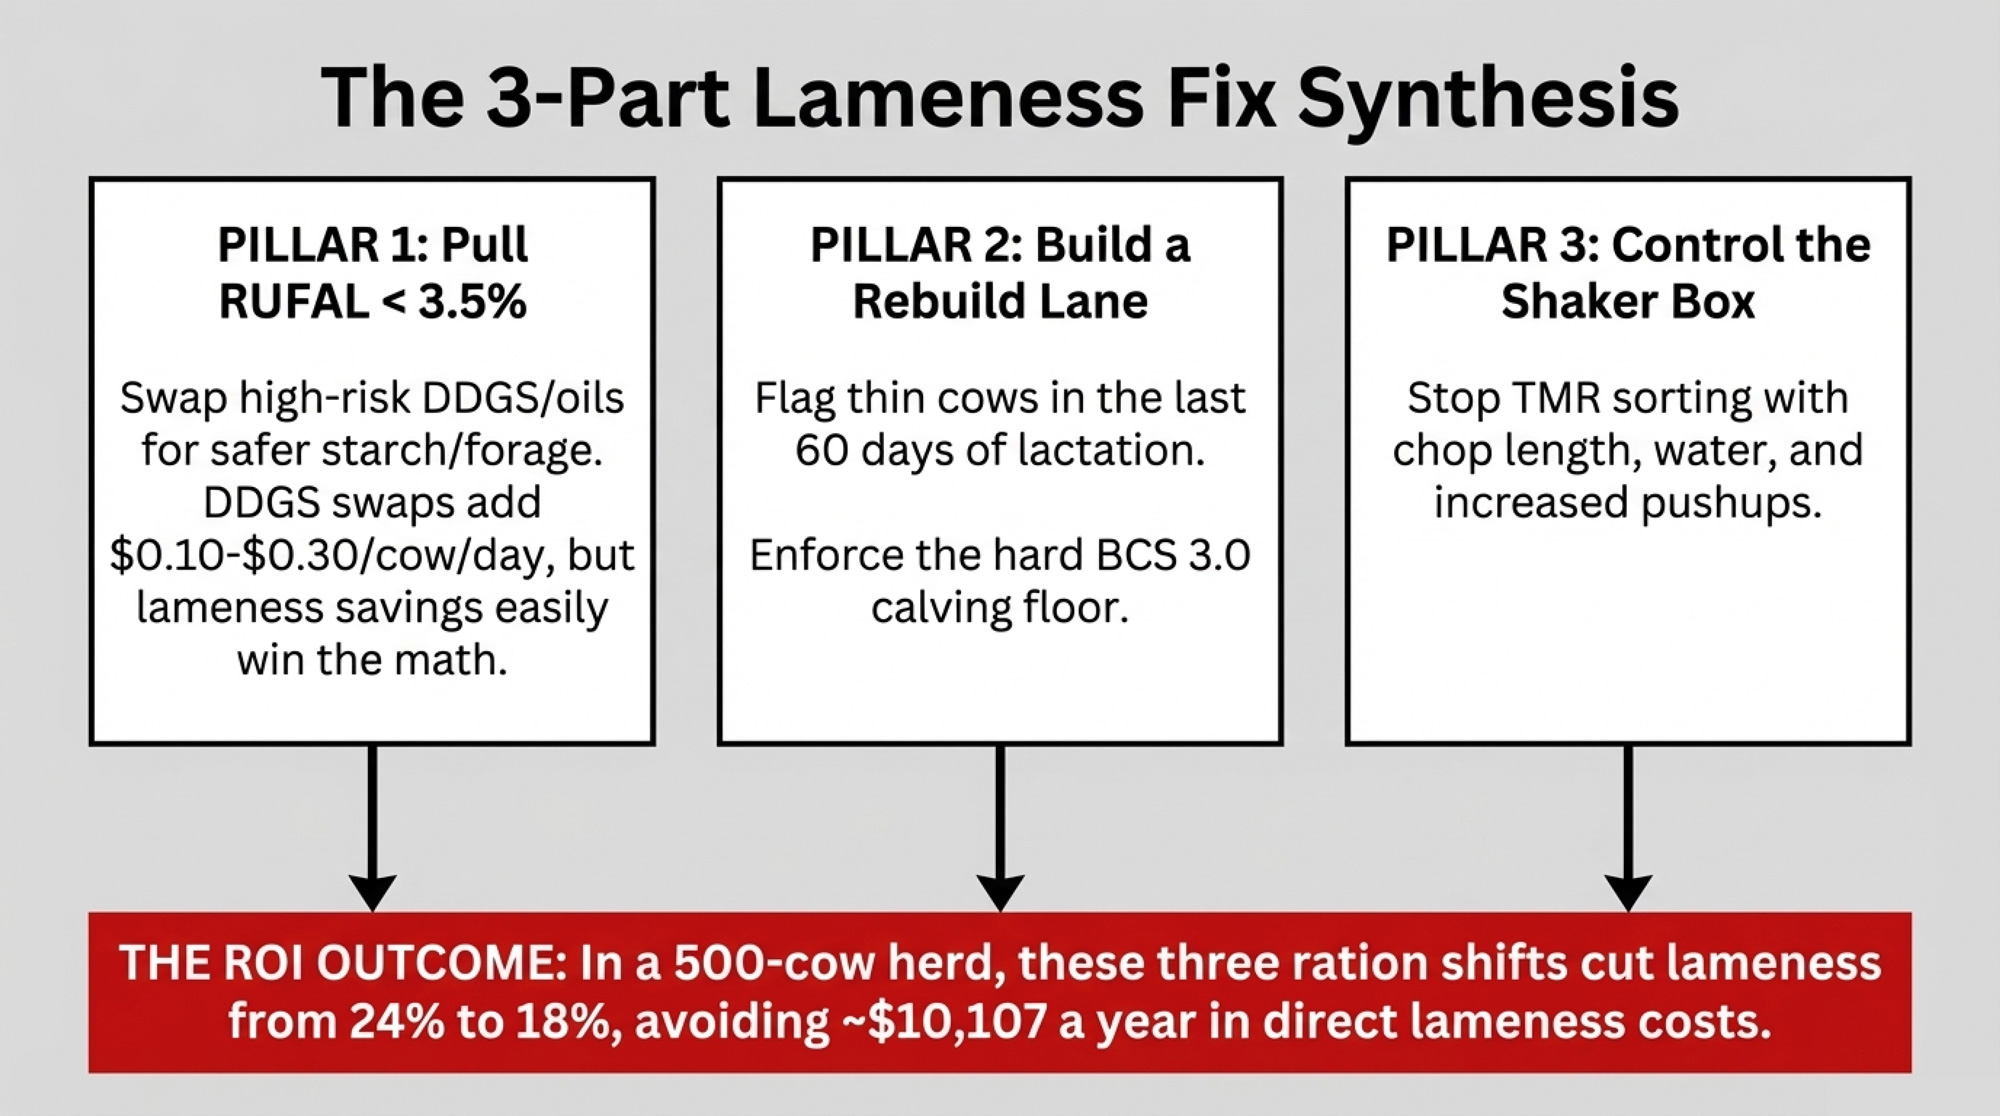
Over the next 90 days, the owner, nutritionist, and hoof trimmer agreed on three moves.

1. Pull RUFAL out of the danger zone.

They pulled back on DDGS and free vegetable oil, replaced some of that energy with better forage and starch sources, and shifted a portion of supplemental fat to a rumen-inert calcium salt product. The revised ration landed at about 3.2% RUFAL, down from 3.8%.

On cost: projected DDG prices for late 2025 and early 2026 are in the $145–155/ton range at $4.00 corn and $325 soybean meal, with a realistic band of $125–170/ton depending on corn and soybean meal swings. In many regions, that still makes DDGS a relatively cheap protein-energy source. Pulling it back to lower RUFAL may add $0.10–0.30 per cow per day in feed costs, depending on what replaces it. The question is whether the lameness savings outrun that ingredient cost — and on this herd’s numbers, they did.

2. Build a “rebuild” lane for thin cows.

They flagged cows and heifers under target BCS in the last 60 days of lactation, moved them into a smaller group with better bunk access and a ration targeting roughly 0.25–0.5 BCS gain before dry-off, and enforced a hard floor: no cow calves under BCS 3.0 unless there’s a clear health reason.

This requires pen space and labor. Not every barn layout can support a separate group; if you can’t build one, at minimum, flag thin cows at dry-off and adjust their close-up ration accordingly. For more on why that BCS window matters for fresh-cow outcomes, The Bullvine’s 90-day transition fix shows how calving most Holsteins at BCS 3.0–3.25 supports both fertility and health.

3. Stop letting sorting rewrite the ration.

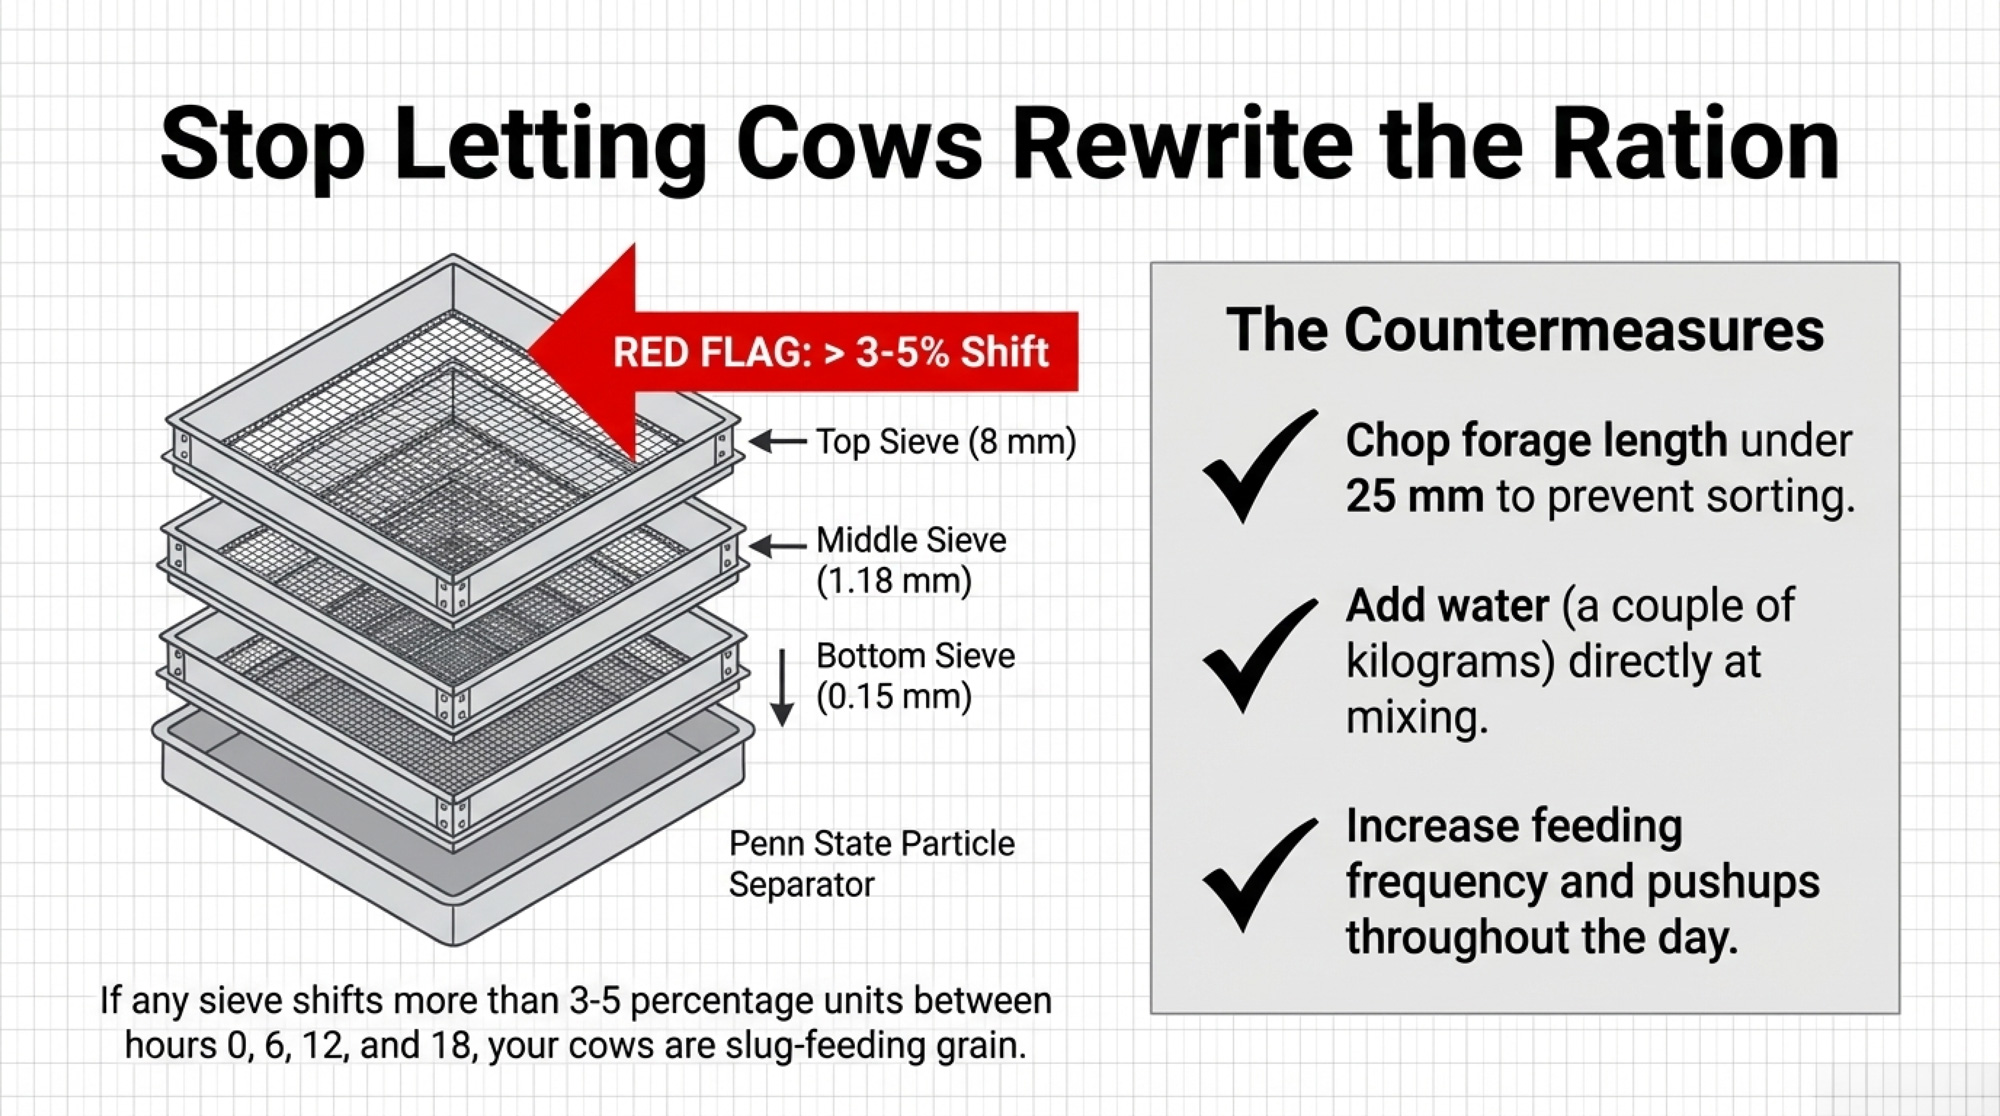
Running the Penn State particle separator at 0, 6, 12, and 18 hours told the real story. Penn State Extension guidelines flag a change of more than about 3–5 percentage units in any sieve over several hours as meaningful sorting. By 12 hours post-feeding, this herd’s top screen had swung past that. Cows were picking out grain and fines early and leaving a stemmy mess for the last shift.

Countermeasures: forage length cut under about 25 mm, a couple of kilograms of water added at mixing, and more frequent feeding and pushups. For a full walkthrough of the Penn State separator as a weekly tool — including tying it to fecal starch testing — see The Bullvine’s particle separator feature.

Did the Ration Changes Actually Reduce Lameness?

Nobody expected lameness to disappear. It didn’t. But over the next 12 months, lameness dropped from 24 cases per 100 cows to just under 18 per 100 — about 90 cases instead of 120.

That 30-case drop: 30 × $336.91 ≈ $10,107 in direct lameness cost avoided on the Robcis model. Beyond the spreadsheet, the hoof trimmer saw fewer repeat claw horn disruption lesions in the same claws, slightly better reproductive performance in fresh cows, and a trim list that felt more manageable.

Sodium bicarbonate stayed at 0.75% of DM. Monensin rates held. They didn’t need to crank either one up. Those tools were now supporting a ration that protected hooves rather than propping up one that kept breaking them.

When Is It the Barn — and When Is It the Ration?

All of this played out in a freestall barn that wasn’t perfect but wasn’t a horror show. Stalls were reasonably sized, bedding adequate, alleys scraped regularly, and parlor routines kept cows out of the pen less than four hours a day.

On this herd, the numbers said the environment wasn’t the primary driver. The big step-change came from RUFAL and BCS, backed by sorting control — not a barn redesign. For herds where the barn is the bottleneck, The Bullvine’s deep dive on time out of the pen shows how stall design, stocking density, and holding-pen time drive lameness and lost production. And for a broader look at what most “non-lame” cows are hiding under their feet, The Bullvine’s hoof lesions feature a breakdown of the scale of subclinical damage.

If your herd is sitting on worn concrete, narrow stalls, or overstocked pens, your math will look different. This isn’t a hall pass for ignoring the barn. It’s a reminder that for some freestall operations, the cheapest place to start is in the ration and the dry-off lane.

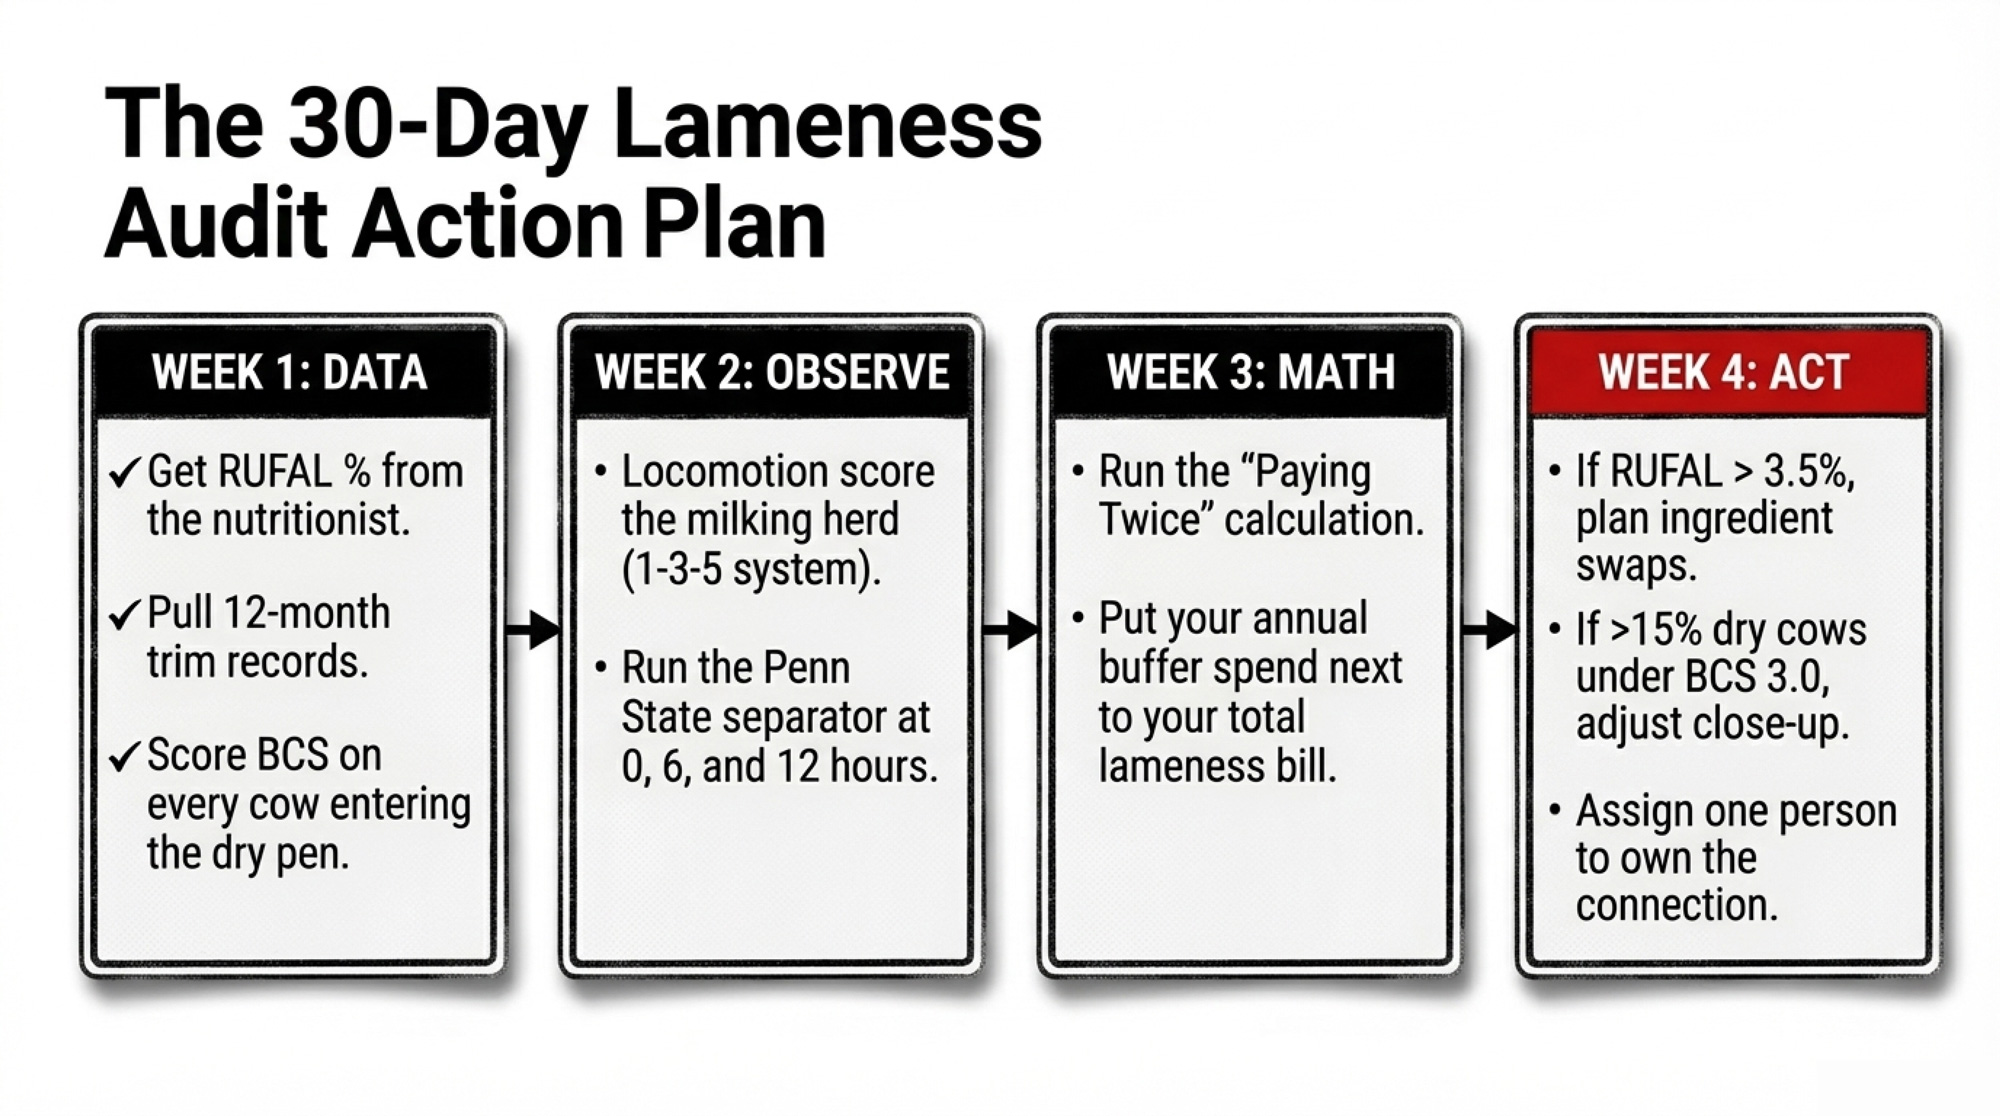
Your 30-Day Lameness Audit

You’re not running this exact herd. But you can steal a lot from how they put the pieces together.

Week 1: Get Your Three Numbers on One Page

  • RUFAL (% of DM): Run your current ration through AMTS, NDS, or CPM Dairy — or ask your nutritionist to pull it. Flag if it’s above 3.5%. 
  • Lameness cases per 100 cows per year: Pull your trim and treatment records for the last 12 months. If you don’t have them, that’s finding number one.
  • BCS at dry-off: Score every cow entering the dry pen this week. What percentage is below 3.0?

Week 2: Score, Sort, and Stare at the Bunk

  • Locomotion-score the entire milking herd using a 1-3-5 system. Compare your number to what you thought it was. If the gap is more than 2×, you’ve got a detection problem. 
  • Run the Penn State particle separator on fresh TMR, then again at 6 and 12 hours. Any box shifting more than 3–5 percentage units? You’ve got a sorting problem. 
  • Walk the bunk at 18+ hours. If it looks like corn cobs and stems, cows sorted the good stuff out hours ago. 

Week 3: Do the “Paying Twice” Math

  • Calculate your annual buffer + ionophore spend using the calculator above.
  • Calculate your annual lameness cost: (cases/year) × $337.
  • Put them side by side. If your lameness cost exceeds your buffer spend, your ration may be working against you.

Week 4: Decide and Assign

  • If RUFAL is above 3.5%, work with your nutritionist on an ingredient swap plan. Target getting below 3.5% within two ration changes.
  • If more than 15% of dry-off cows are below BCS 3.0, build a rebuild lane or, at a minimum, flag thin cows and adjust their close-up ration.
  • If sorting is confirmed, pick at least two countermeasures: shorter chop, added water, more frequent feeding/pushups, or a wet ingredient.
  • Assign one person to own the connection between RUFAL, dry-off BCS, and the trim-chute report. Nothing changed on this herd until the nutritionist, hoof trimmer, and owner were looking at the same numbers.
InputThis Herd (500 cows)Your Herd (fill in)
Bicarb inclusion (% DM)0.75%________
Bicarb cost ($/kg)$0.70________
Bicarb cost/cow/day~$0.12________
Annual bicarb spend~$23,000________
Monensin cost/cow/day~$0.04________
Annual monensin spend~$7,300________
Total Cost A (Buffer + Ionophore)~$30,300________
Lameness cases per 100 cows/yr24________
Cases per year (total herd)120________
Cost per case (Robcis 2023)$336.91$336.91
Total Cost B (Annual Lameness Bill)$40,429________
Gap (Cost B minus Cost A)$10,129 🔴________

What This Means for Your Ration and Your Trim Bill

If your RUFAL lives north of about 3.5% of DM and you’re seeing more than 30 lameness cases per 100 cows per year, you probably don’t have a “trim faster” problem — you have a ration and dry-cow problem showing up in the hoof.

Bringing RUFAL under 3.5% and enforcing a BCS floor of about 3.0 at calving are two of the cheapest moves you can make to change your lameness math — even before you touch the barn. Pulling RUFAL down may cost you on the ingredient line, especially if DDGS is your cheapest energy source. But if your lameness savings outrun that extra $0.10–0.30 per cow per day in feed cost, the math is still in your favor.

At 90 days, re-score the entire herd for locomotion. Compare your new per-100-cow lameness rate to the baseline you established in Week 1.

At 12 months, run the Paying Twice Calculator again with real post-change data. If your lameness cost dropped more than your ration-change cost, the RUFAL fix paid for itself.

The next time your nutritionist and hoof trimmer are at the same table, don’t just ask how to treat lame cows faster. Ask where your lameness bill really starts — and how long you’re willing to keep paying twice.

Key Takeaways:

  • When proper scoring puts lameness closer to 20–25% than the 5–7% you’d guess, you’re likely staring at a $40,000‑a‑year problem at about $337 per case.
  • Treat 3.5% of DM RUFAL as a warning line: above that, your ration is a major lameness risk, even if the barn and trimmer look good.
  • Don’t calve cows under BCS 3.0; thin cows bring softer digital cushions into the riskiest weeks and show up more often with claw horn lesions.
  • Pulling RUFAL under 3.5%, holding a BCS 3.0 floor, and fixing TMR sorting can realistically drop lameness from the mid‑20s to the high‑teens per 100 cows and keep roughly $10,000 a year in your pocket.
  • Any time your lameness bill is bigger than your buffer and ionophore spend, it’s your ration and dry‑cow program — not your hoof trimmer — that should move to the top of the to‑fix list.

Complete references and supporting documentation are available upon request by contacting the editorial team at editor@thebullvine.com.

Learn More

The Sunday Read Dairy Professionals Don’t Skip.

Every week, thousands of producers, breeders, and industry insiders open Bullvine Weekly for genetics insights, market shifts, and profit strategies they won’t find anywhere else. One email. Five minutes. Smarter decisions all week.
NewsSubscribe
First
Last
Consent

Send this to a friend