










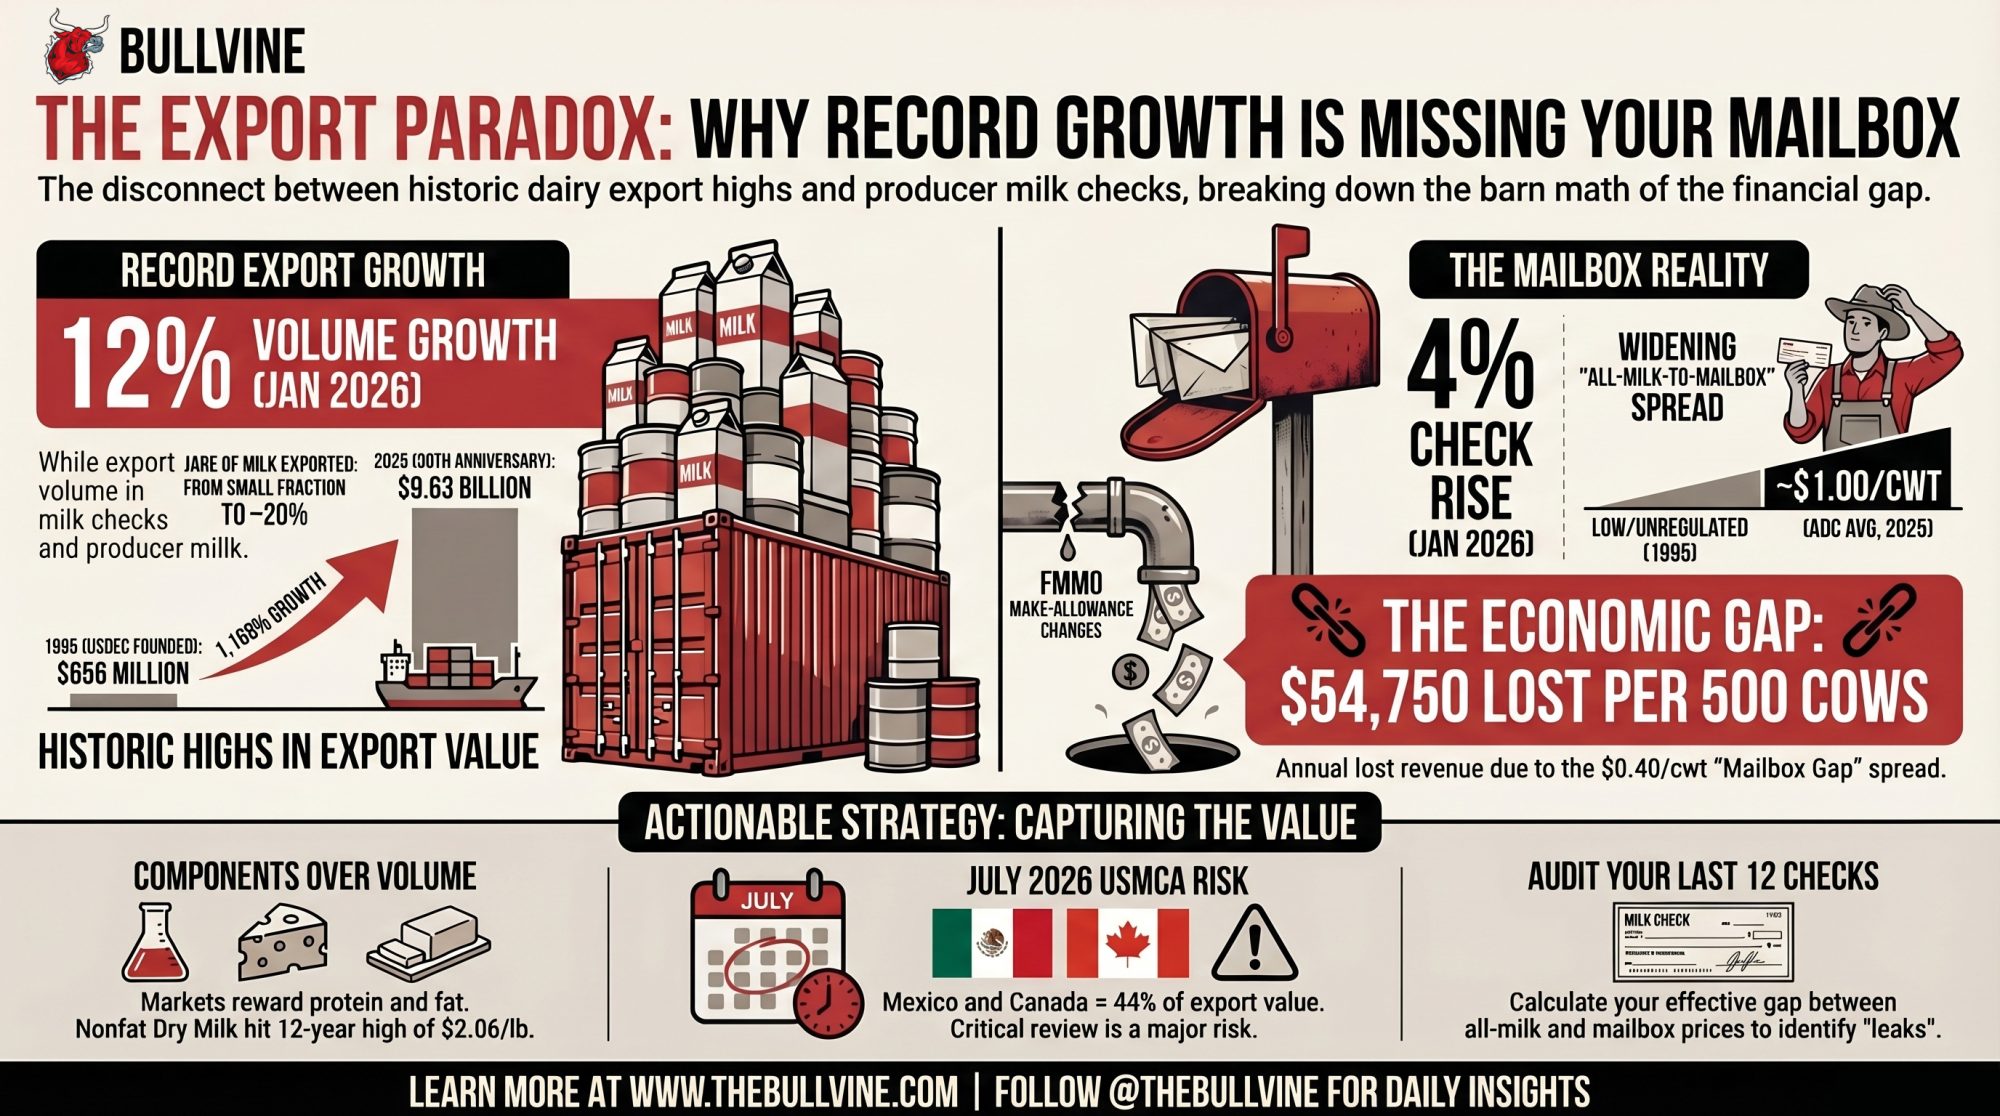
January exports hit a record 12% jump. Your milk check rose 4%. That $0.40/cwt gap isn’t abstract — on 500 cows, it’s $54,750 a year walking out the door.
Executive Summary: U.S. dairy exports shattered records in early 2026 — January volume up 12%, February cheese at an all-time 58,406 MT — but the gap between what the world pays and what hits your mailbox keeps widening. ADC estimates the all-milk-to-mailbox spread has grown roughly $0.40/cwt since the FMMO make-allowance changes took effect; on a 500-cow herd, that’s about $54,750 a year not reaching the bulk tank. NFDM hit $2.06/lb on April 9 — highest since January 2014 — as protein gets pulled into yogurt, UF milk, and high-margin whey instead of dryers. Mexico and Canada account for 44% of U.S. dairy export value ($3.6 billion), and the USMCA formal review is set for July, with Canada’s quota system still unresolved. The full article walks through the barn math on both sides of that gap, lays out 30- and 90-day checks you can run against your own numbers, and flags the corridor and contract risks that could move your check before year-end.
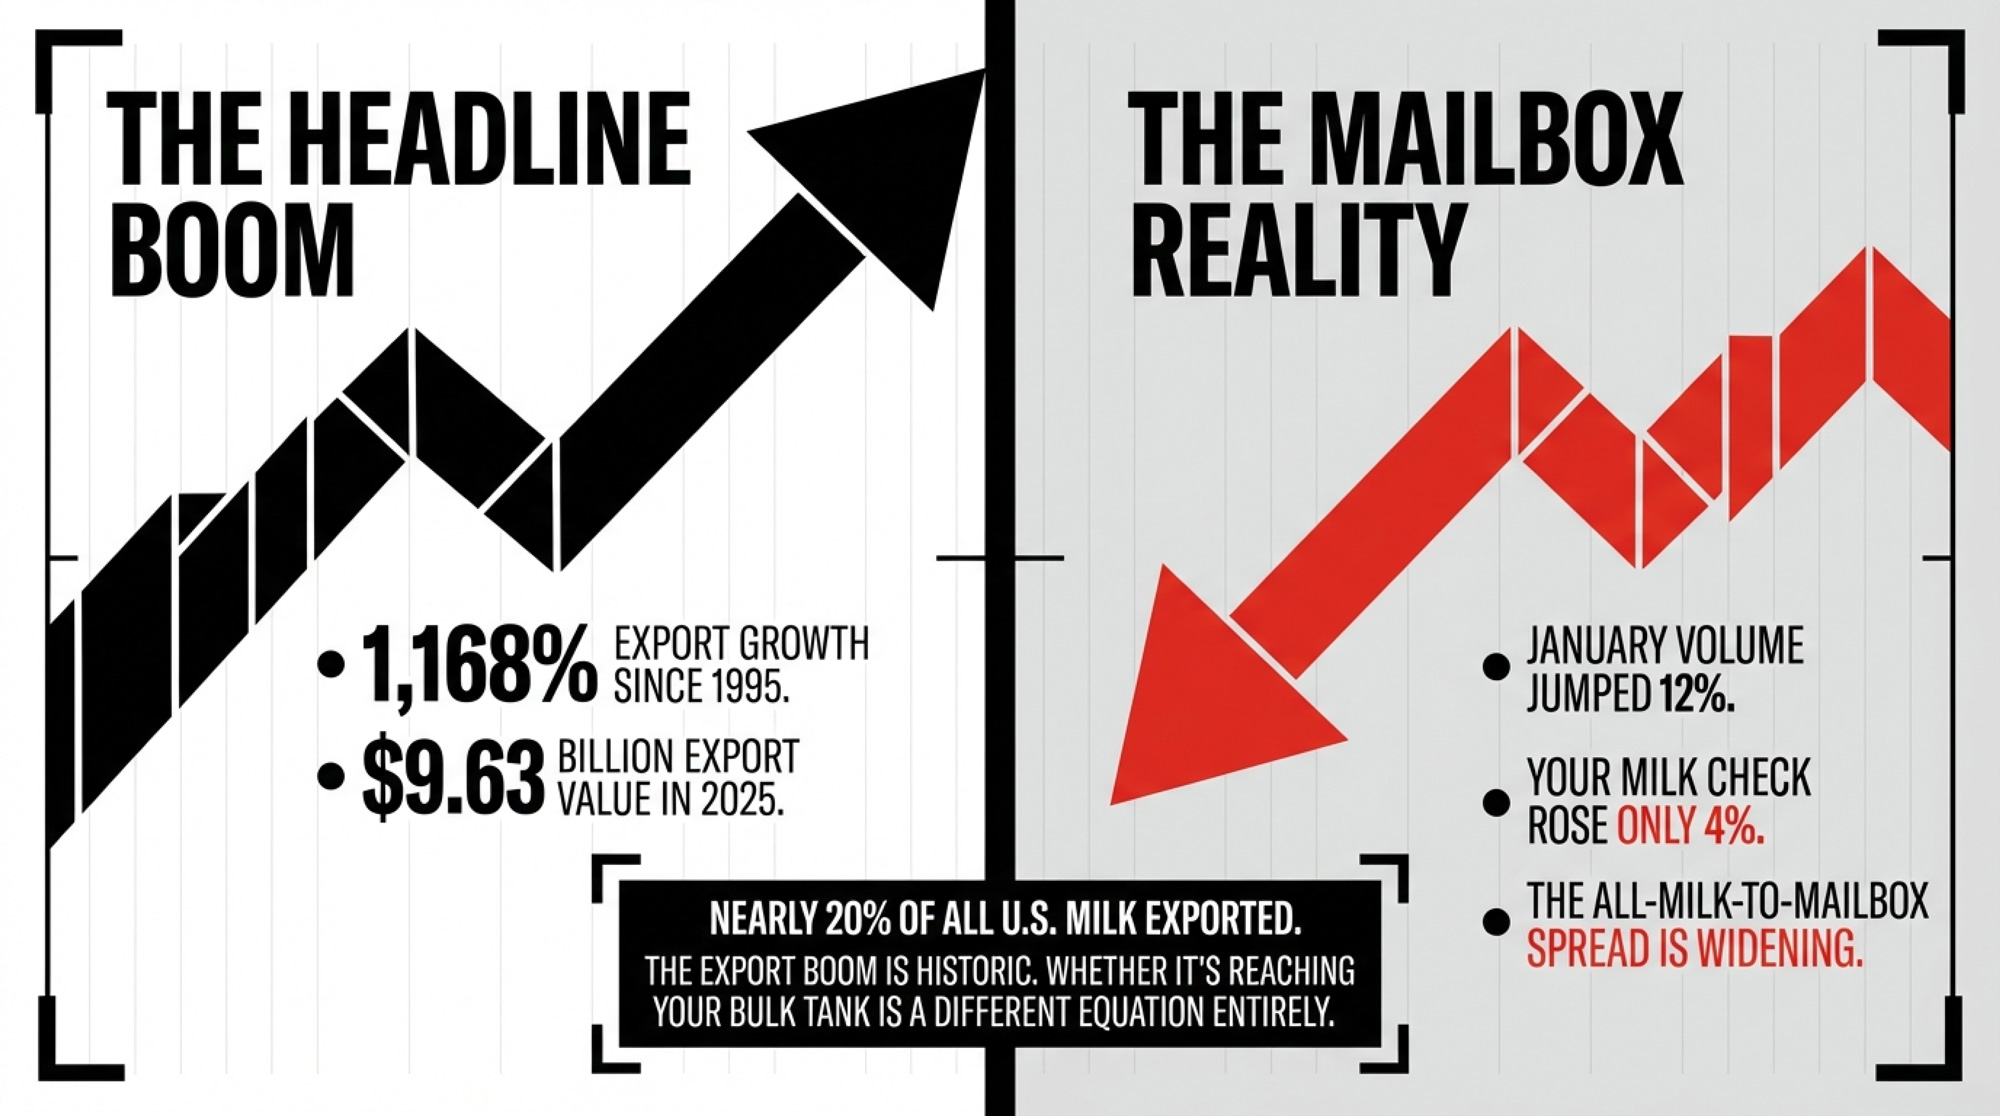
In January 2026, U.S. dairy export volume jumped 12% year‑over‑year on a milk solids equivalent basis — the biggest January ever recorded, according to USDEC data released March 12. February was even stronger: cheese exports hit an all‑time monthly high of 58,406 metric tons, 30% above last year and 6% above the previous record set in November 2025.
That’s nine straight months of year‑over‑year volume growth — with the most recent four all in double digits. By any measure, the world wants more American dairy than at any point in history. Yet while January volume climbed 12%, export value rose just 4% — to $740 million — and February’s value, at an estimated $804 million, was “only” up 11%.
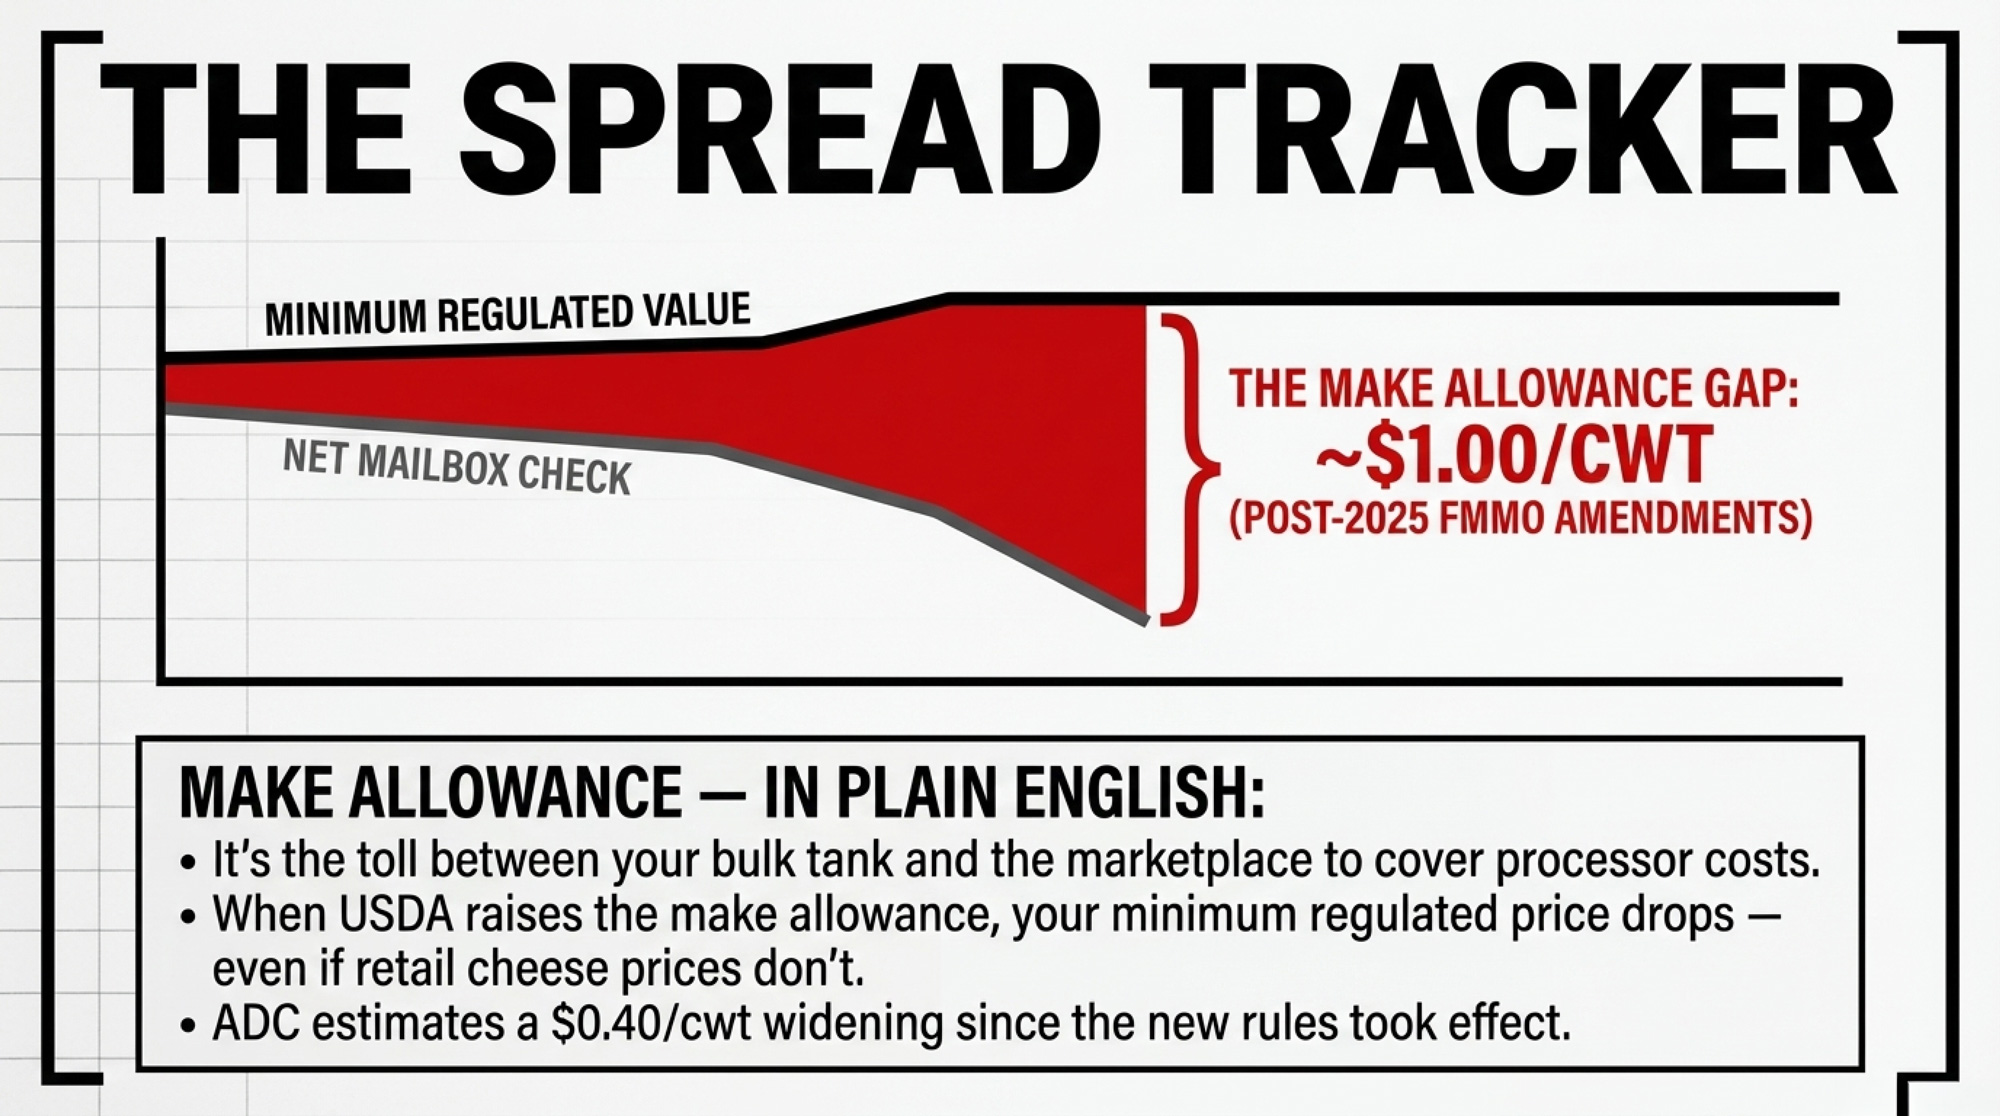
At the same time, the gap between your all‑milk price and what actually shows up in the mailbox has widened. According to the American Dairy Coalition (ADC) — a producer advocacy group tracking FMMO pricing impacts — that spread has averaged roughly $1.00/cwt since the 2025 make‑allowance changes, up from what ADC calculates as a ~$0.60 baseline. The export boom is real. Whether it’s reaching your bulk tank is a different equation entirely.
The spread isn’t static, though. USDA data showed it at $0.85/cwt in September 2025, and Progressive Dairy reported ~$0.96/cwt in January 2024 — before the FMMO amendments took effect. The gap varies by month, marketing order, and class utilization. ADC’s $0.60 baseline represents their chosen reference period, not a fixed historical average. The direction is real. The exact magnitude depends on where you sit.
What Did 30 Years of USDEC Actually Buy Your Herd?
In 1995, U.S. dairy was playing defense — worried about cheap Oceania imports, leaning on domestic price supports, skeptical that Americans could compete globally. Then, a handful of stakeholders created the U.S. Dairy Export Council with checkoff funding. That bet paid off beyond anyone’s projections.
Here’s how the scoreboard reads:
- 1995 export value: $656 million (per USDEC)
- 2024 export value: $8.32 billion — a 1,168% increase from the 1995 baseline (per USDEC’s 30th‑anniversary accounting; USDA FAS reports $8.2 billion for the same period — the gap likely reflects product‑scope differences)
- 2025 export value: $9.63 billion — a 15% jump over 2024 (per USDEC press release, February 24, 2026)
- 1995 share of U.S. milk production exported: a small fraction of total production, per USDA/ERS
- 2025 share of U.S. milk production exported: nearly 20% (per USDEC)
- 2025 MSE volume: 2.32 million metric tons — second‑highest on record, behind 2022’s 2.41 million MT
“We’ve gone from a minor player to a leading global supplier,” says USDEC president and CEO Krysta Harden, per the organization’s 30th‑anniversary blog. “We’re now positioned to become the No. 1 global exporter of dairy products.”
Nearly 1 in 5 pounds of U.S. milk now leaves the country. For a 500‑cow herd shipping 75 lb/cow/day, roughly 100 cows’ worth of your production depends on buyers in Mexico City, Jakarta, or Riyadh.
If you don’t think of yourself as an exporter, the math says otherwise.
The Export Boom vs. Your Milk Check
The headline numbers tell a story of historic growth. But the question that matters to your operation is simpler: Is any of this actually reaching your mailbox?
| Metric | Pre-Amendment (Before June 2025) | Post-Amendment (June 2025–Present) | Direction |
|---|---|---|---|
| U.S. Dairy Export Value | $8.32B (2024) | $9.63B (2025) | ↑ +15% |
| All-Milk to Mailbox Spread | ~$0.60/cwt (ADC baseline) | ~$1.00/cwt (ADC avg) | <span style=”color:red”>↑ Widened $0.40/cwt</span> |
| Processor Gross Margins | Baseline | +26% to +39% (ADC est.) | <span style=”color:red”>↑ Processors gaining</span> |
| Minimum Milk Values to Farmers | Baseline | Down ~5% (ADC est.) | <span style=”color:red”>↓ Farmers losing</span> |
| Annual Impact (500-cow herd) | — | −$54,750/yr from widening alone | <span style=”color:red”>Cash leaving the tank</span> |
| NFDM Spot Price | ~$1.20–$1.42/lb (late 2025) | $2.06/lb (April 9, 2026) | ↑ 12-year high |
| Feb 2026 Cheese Exports | 44,928 MT (Feb 2025) | 58,406 MT (all-time record) | ↑ +30% YoY |
| New Processing Capacity | — | $11B into 53 facilities (2025–2028) | ↑ IDFA pipeline |
*The 1,368% figure measures 1995→2025. USDEC’s 30th‑anniversary figure of 1,168% uses the 2024 endpoint of $8.32B.
USDA AMS began consistently tracking mailbox prices in the mid‑1990s, but pre‑amendment spread data is volatile by month and order. ADC’s ~$0.60 baseline is their reference; USDA data shows the spread was already around $0.85–$0.96 at various points before the amendments. The growth in exports is staggering. But the growth in the gap between your gross price and your net check deserves equal attention.
Make Allowance — In Plain English
The make allowance is the credit built into FMMO pricing formulas that covers processors’ costs of turning raw milk into cheese, butter, powder, or whey. When USDA raises the make allowance, your minimum regulated price drops — even if the retail or export price of cheese doesn’t change. Think of it as the toll between your bulk tank and the marketplace. In 2025, that toll got significantly more expensive.
The $0.40/cwt Question: Who’s Capturing the Export Gains?
Record volumes should mean a better check. So why doesn’t it feel that way?
The volume–value gap in January isn’t a mystery — it’s a trailing indicator. Falling U.S. cheese and butter prices in Q4 2025 dragged down the value of shipments contracted months earlier. February’s 11% value jump shows the market correcting. But the real disconnect is domestic, not global.
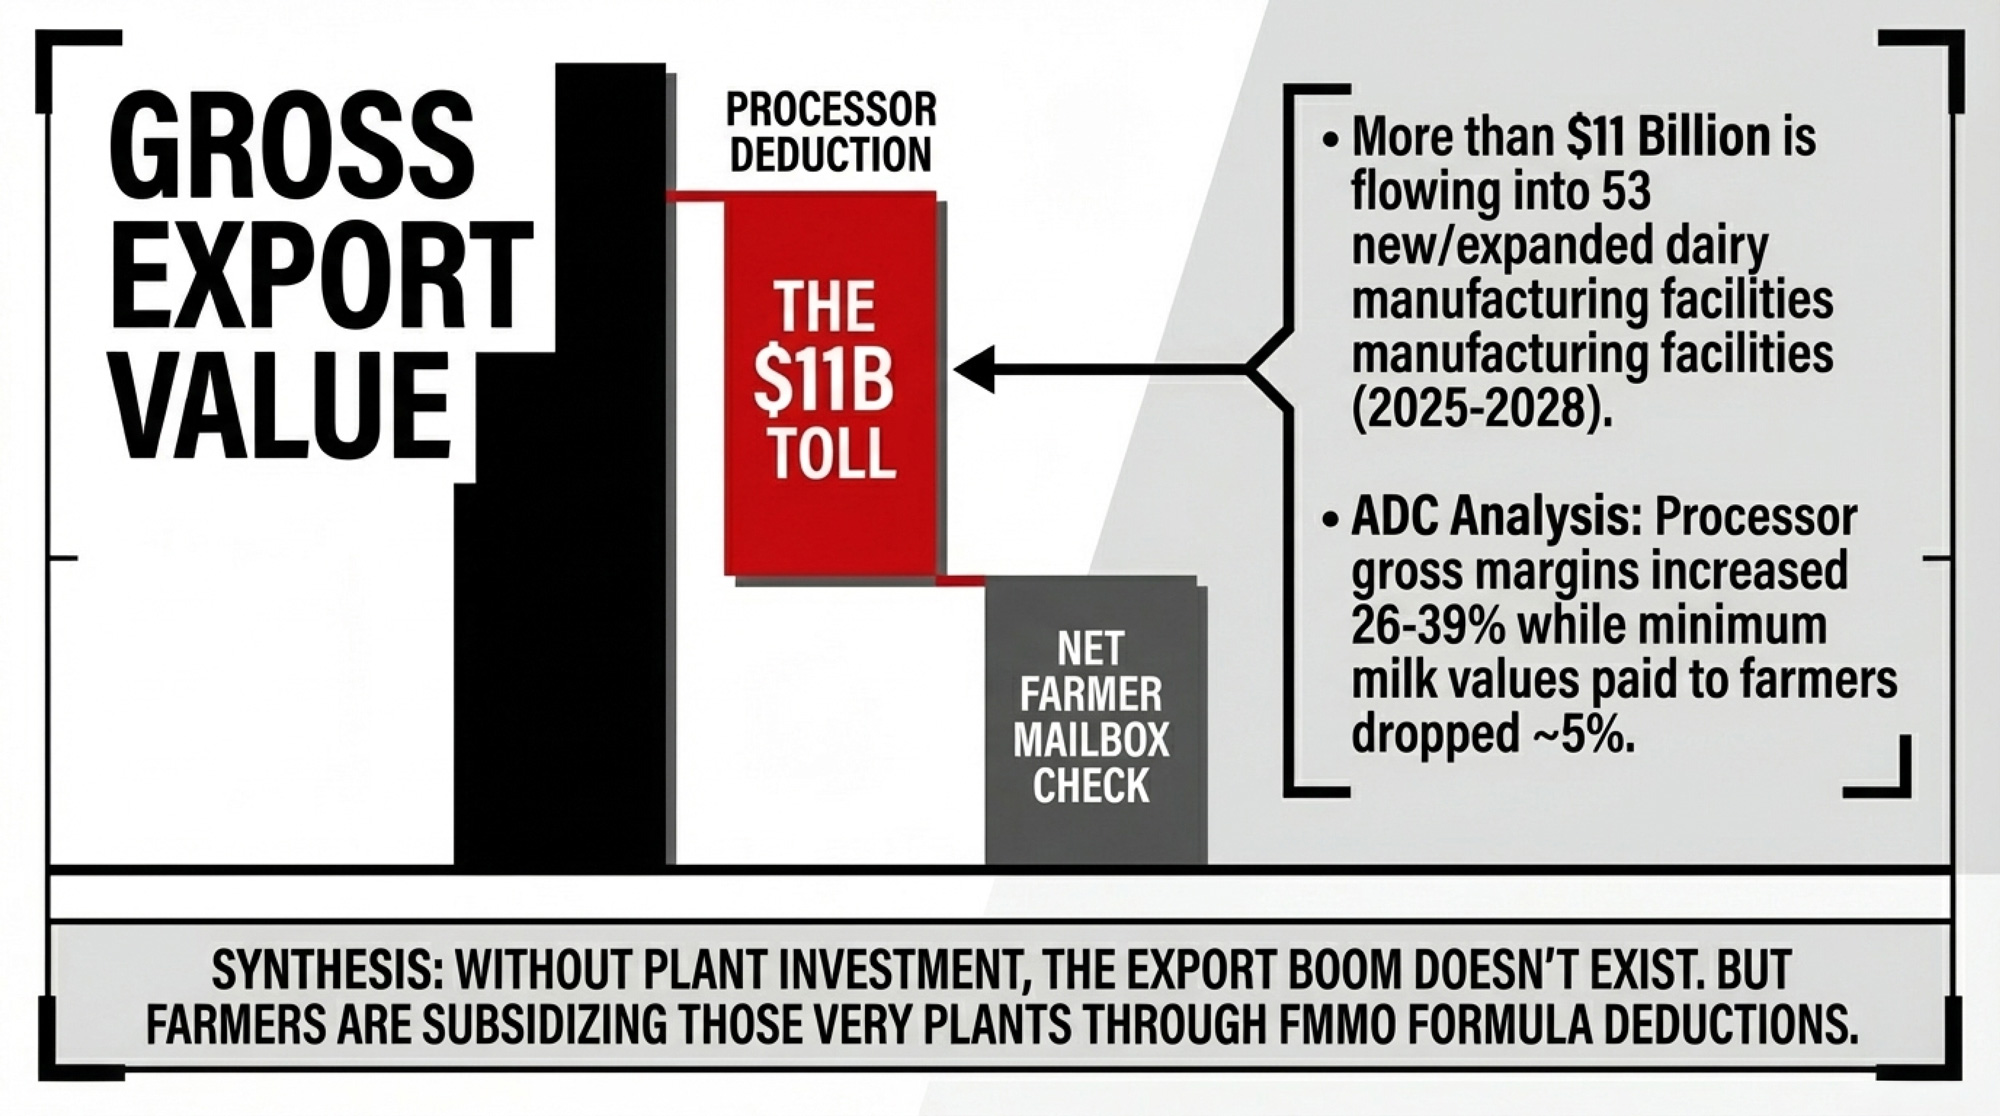
Following the 2025 FMMO amendments — which took effect June 1 and December 31, 2025 — make allowances climbed across products in line with USDA’s final decision. Analysts estimate the aggregate impact on the milk check at about $5.04/cwt when you sum the per‑pound changes across butter, cheese, NFDM, and dry whey. ADC’s analysis of the first eight months under the new rules estimates that processor gross margins increased 26% to 39% and minimum milk values paid to farmers dropped approximately 5% — figures ADC derived from USDA pricing data, though the methodology hasn’t been independently audited. IDFA has not publicly disputed or confirmed ADC’s calculations.
IDFA supported the increase, noting the rates hadn’t been adjusted since the last FMMO hearing process in 2007–2008. And there’s a reason processors pushed hard for it: IDFA president and CEO Michael Dykes told Dairy Herd and other outlets that more than $11 billion is flowing into 53 new or expanded dairy manufacturing facilities across 19 states, slated to come online between 2025 and 2028. These are the plants physically creating the export products, driving the boom. Without that investment, the boom doesn’t exist.
ADC’s counterargument: farmers shouldn’t be subsidizing those plants through formula deductions that widen the gap between the all‑milk price and the mailbox — a gap that, ADC argues, many producers don’t fully see when they look at their checks. Both sides have a point. The question is where the line sits — and right now, it’s moving in one direction.
What Does a $0.40/cwt Increase Look Like on a 500‑Cow Herd?
Becky Nyman — a fourth‑generation dairy farmer from Hilmar, California, and chair of the USDEC board — doesn’t sugarcoat the stakes. “Trade creates opportunities for farmers to stay on the farm,” she said at the 2026 USDEC Annual Membership Meeting. “With 96% of the global population living outside our borders, the opportunity to grow is immense.”
But Nyman is equally clear that exports aren’t charity. They’re the foundation of the modern milk check. And that foundation only works if the pricing system actually delivers those gains to the parlor — not just to the plants.
For any producer who runs their own barn math against ADC’s numbers, there’s a legitimate question: how much of the export boom is actually reaching the milk check that funds next month’s feed bill?
ADC calculates that the all‑milk‑to‑mailbox gap has widened by about $0.40/cwt since the FMMO changes took effect. Again, the baseline varies by source and timeframe, but the direction of widening is consistent across the data.
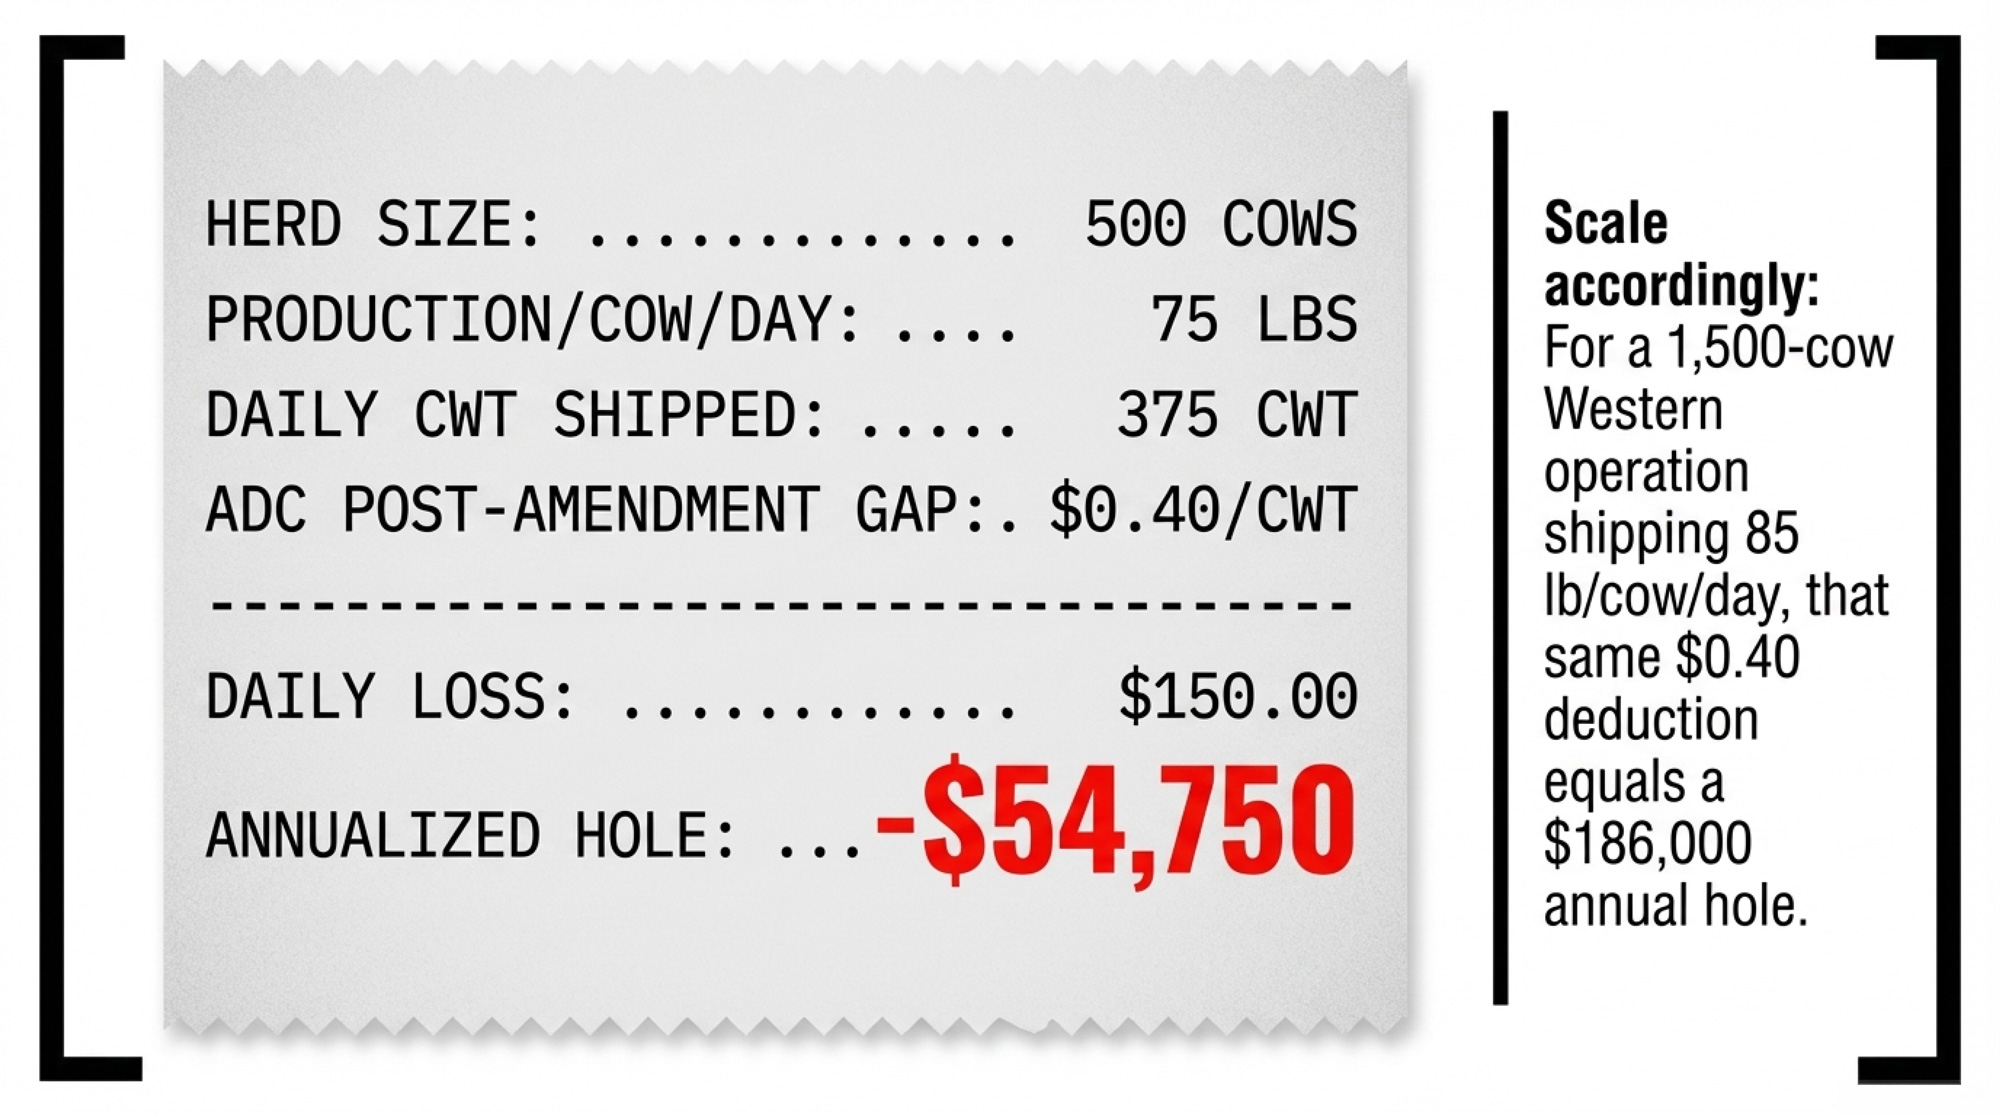
THE $54,750 QUESTION — Barn Math for a 500‑Cow Herd
- Herd size: 500 cows
- Shipped per cow per day: 75 lb (adjusted for dry cows, culls)
- Daily cwt shipped: 500 × 75 = 37,500 lb = 375 cwt/day
- The $0.40/cwt increase (post‑FMMO amendment, per ADC):
375 cwt × $0.40 = $150/day → $54,750/year - The full $1.00/cwt gap (total all‑milk to mailbox spread, ADC post‑amendment avg):
375 cwt × $1.00 = $375/day → $136,875/year
The $0.40 figure represents ADC’s estimated increase since the FMMO amendments were enacted. The $1.00 figure is ADC’s total gap estimate, including deductions that were in place before. Which number fits your operation depends on your marketing order, class utilization, and co‑op pool distribution. Plug in your own herd size and shipped volume.
Picture a 500‑cow Central Valley operation sitting down with its lender this spring. That $54,750 isn’t theoretical — it’s the difference between a line‑of‑credit buffer and a conversation nobody wants to have in July. And the lender’s looking at the same export headlines you are, wondering why the check doesn’t match the story.
For a 1,500‑cow Western operation shipping 85 lb/cow/day, scale accordingly: the $0.40 increase alone runs roughly $186,000 per year. Under ADC’s numbers, that’s money that’s no longer showing up in the mailbox.
How the Fat Boom and Protein Craze Change What Your Processor Wants
Two structural trends are reshaping what the world buys from U.S. dairy — and both land differently depending on your components and your processor’s export mix.
The fat boom. U.S. herds hit record butterfat levels in 2025, with total butter production up and inventories initially swelling. That surge helped push butter prices below $1.50/lb in late 2025, but aggressive exports helped clear the surplus. By late February 2026, butter inventories stood at 253.8 million pounds — down 17% from a year earlier, per the USDA Cold Storage report released March 24.
The tighter supply triggered a brief spot‑price spike above $2.10/lb on March 2, driven partly by “new crop” trade rules limiting eligible inventory. But butter has since settled back into the $1.73–$1.82 range as of early April.
For Central Valley operations — where butterfat tests typically run above the national average and processors export heavily to Mexico and Asia — more fat is a double‑edged dynamic. Nyman’s Hilmar operation sits in the middle of that corridor. Higher demand for what those herds produce, but tighter competition for the processing capacity to turn it into exportable products.
The protein craze. High‑quality whey proteins and milk protein isolates are getting pulled out of traditional spray dryers and into high‑margin products: Greek yogurt, cottage cheese, ultrafiltered milk, and protein‑enriched drinks. USDEC data indicate that high‑protein whey exports set a record in 2025 and remained strong into the new year.
The protein pull has a flip side. Nonfat dry milk production has dropped, and the squeeze is showing in prices.
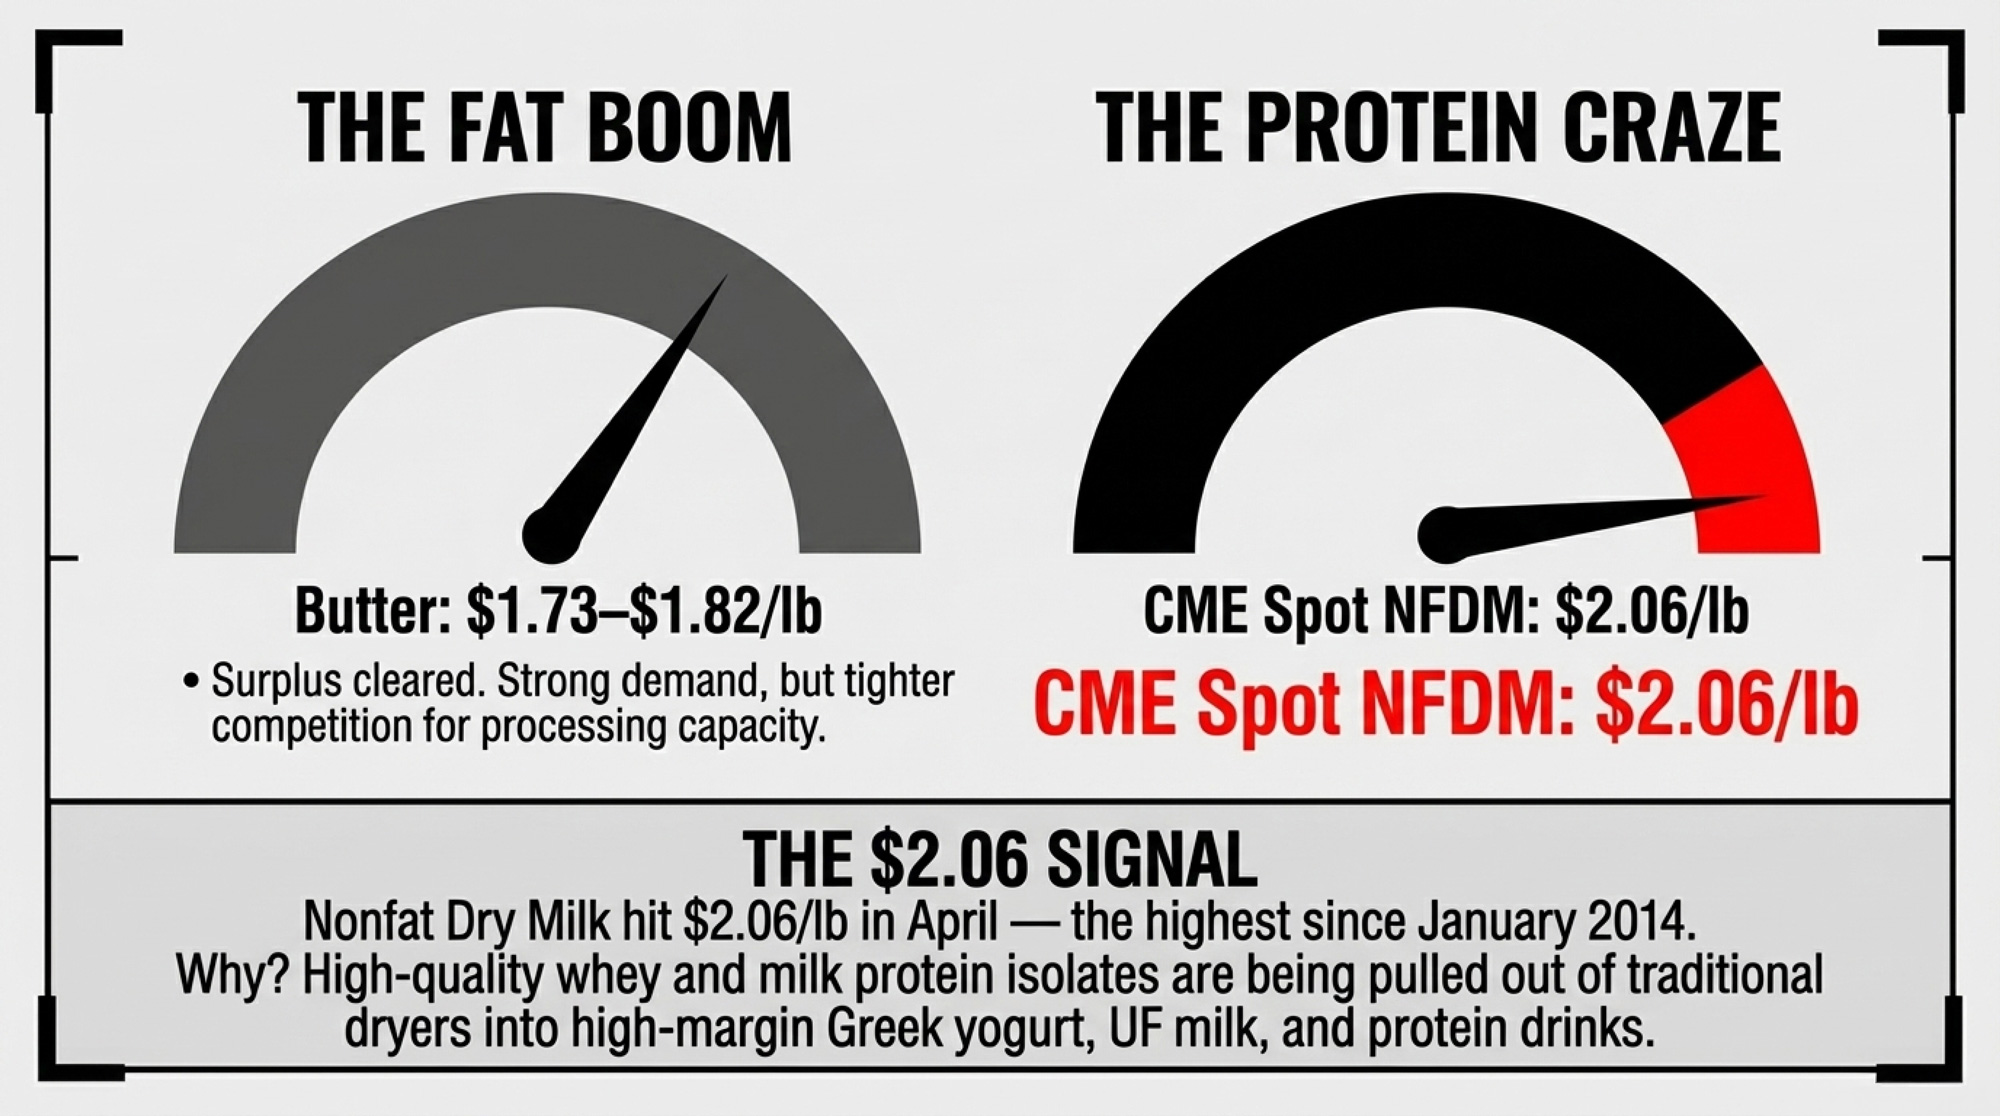
The $2.06 signal: CME spot NFDM hit $2.06/lb on April 9 — the highest level since January 2014, when it traded at $2.075. NFDM briefly topped $2.00 in mid‑2022 but never reached the current level. U.S. powder has been trading at a significant premium to both Oceania and European SMP, with many Asian bids running below domestic CME NFDM prices — often by a single‑digit cents‑per‑pound discount, as trade analysts note.
That premium reflects a successful value‑chain pivot. It also prices U.S. suppliers out of cost‑sensitive markets in Southeast Asia and Africa — the exact regions where the long‑term volume growth lives.
If your co‑op’s protein premium has moved meaningfully since 2023, it’s worth revisiting how you’re feeding for protein — not just fat. The market’s telling you which component it’ll pay up for.
Where Does 27% of Your Export Revenue Go — and What Could Disrupt It?
Mexico remains the No. 1 destination for American dairy, accounting for roughly a quarter of total export value in recent years and about $2.5–$2.6 billion in 2025, based on USDEC country‑level tracking and USDA trade data. Fresh cheese volumes to Mexico nearly tripled in February 2026, and total cheese shipments were up 38%. Proximity, rail logistics, and decades of partnership between USDEC, NMPF, and Mexican dairy organizations make this corridor remarkably durable.
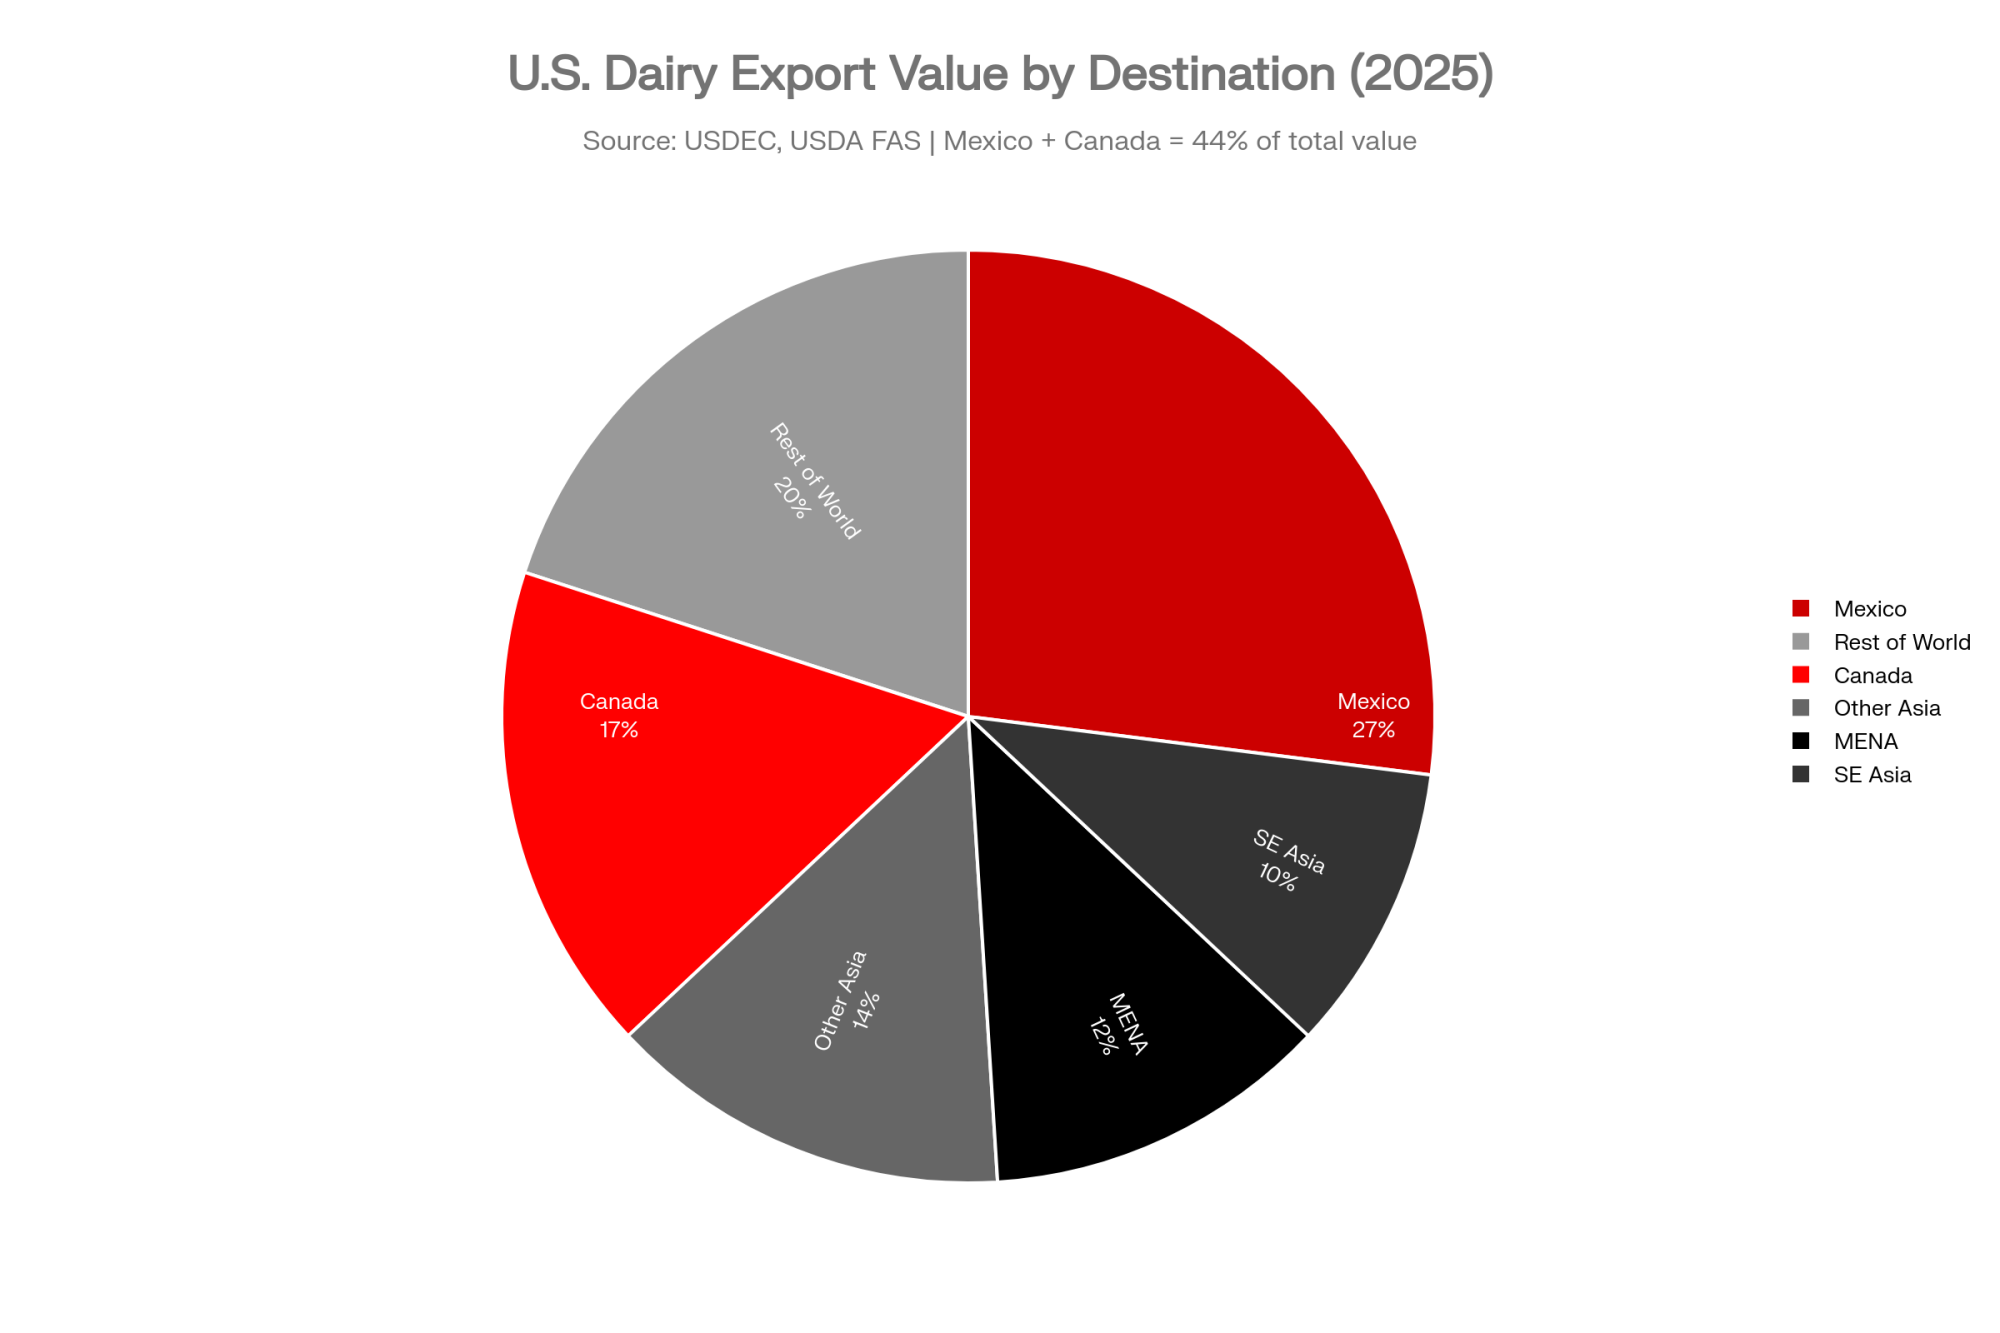
The Middle East is surging, too. According to USDEC trade data, butter shipments to MENA jumped dramatically in February, and total MSE volume to the region climbed sharply in the first two months of 2026. Southeast Asia continues to grow — NFDM/SMP shipments to the region rose significantly in January, and the U.S. Center for Dairy Excellence in Singapore, launched in 2019, has become a critical bridge connecting American suppliers with Asian customers through its sensory labs and demo kitchens.
In Indonesia, the government’s Free and Nutritious School Meals initiative is being rolled out to tens of millions of students and other vulnerable groups, with Rabobank estimating it could eventually serve around 83 million recipientsand require more than 2 billion liters of milk annually at full implementation. Indonesia currently relies on imports for more than 80% of its dairy supply, according to USDEC and Agri‑Pulse reporting.
USDEC, NMPF, and the Consortium for Common Food Names are leaning into that gap. In April 2025, U.S. and Indonesian officials signed a landmark dairy agreement that set a framework to boost dairy trade and support public nutrition, complementing joint work on the school meals program. In February 2026, the U.S. and Indonesia signed a new agreement that eliminates tariffs on all U.S. dairy exports, recognizes U.S. regulatory oversight, and commits to protecting common cheese names — explicitly building on the U.S.–Indonesia Dairy Partnership launched in 2024 and joint work on the Free and Nutritious School Meals initiative.
Nyman knows what it takes to build that access. As she shared, a high‑level trip to China brought her into a Ministry of Commerce meeting where trade barriers dominated the conversation. She chose to speak as a producer first — about community, about how dairy farmers worldwide share more in common than divides them. The minister, she recalled, used her words to find common ground.
That kind of moment doesn’t show up in USDEC’s export spreadsheets. But it’s part of why those spreadsheets keep growing.
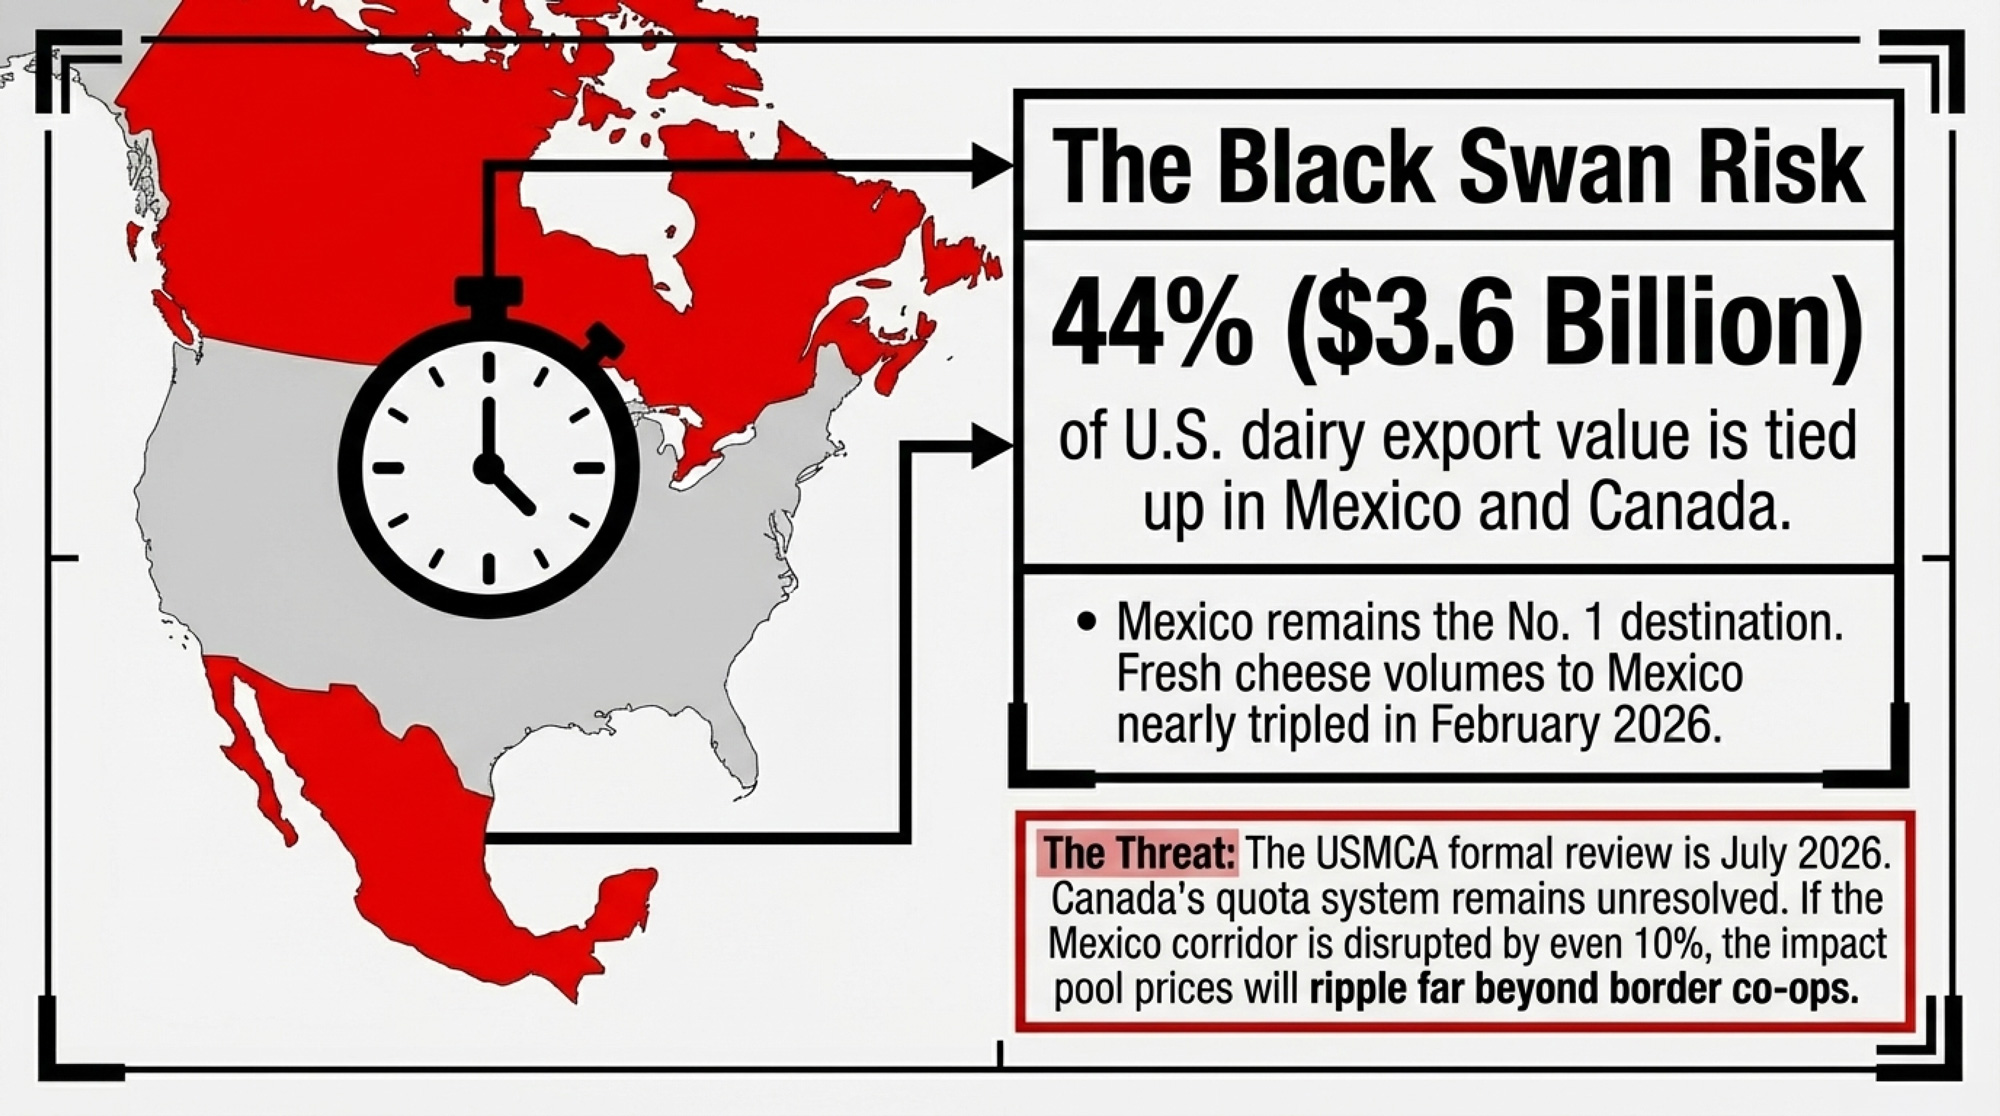
The July risk: U.S. dairy exports to Mexico and Canada exceeded $3.6 billion last year, accounting for 44% of total export value, according to USDEC and NMPF. The USMCA formal review is set for July 2026, with Canada’s quota system and tariff dynamics still unresolved. If Mexico’s corridor were disrupted by even 10–15%, the impact on pool prices would ripple well beyond the co‑ops that ship directly south of the border. For operations that depend heavily on Class III and IV utilization, even a modest shock in the Mexico corridor can show up as a meaningful hit to pool values and basis — especially stacked on top of already‑wider make allowances.
If more than a third of your plant’s volume goes to Mexico or Canada, that July review is a contract‑risk date, not just a policy headline.
What This Means for Your Operation
In the next 30 days:
- Pull your last 12 milk checks. Calculate the effective gap between your all‑milk price and your mailbox price, month by month. Compare Q1 2026 to Q1 2025. Don’t guess — run the numbers.
- If the gap has widened more than $0.50/cwt since mid‑2025, bring that number — not a complaint, the actual calculation — to your next co‑op meeting or processor conversation. If it hasn’t widened, your marketing order and class utilization may be buffering you, but know that the next FMMO hearing cycle could change that.
- Ask your processor or co‑op what share of their sales moves to export markets and which regions. If more than 30% of their volume is export‑dependent, you’re more exposed to trade disruption than the average FMMO pool assumes. That’s not a reason to panic — it’s a reason to know your DMC enrollment status and your processor’s contract notice period.
- Stress‑test at an all‑milk price of $18/cwt. Model your operation’s breakeven at $18/cwt for six months. If you flinch at that number, your banker probably does too — and it’s better to have that conversation on your terms than theirs.
In the next 90 days:
- Revisit your component goals with your nutritionist. Align butterfat, protein, and SCC targets against where your processor’s export mix is actually heading — not where it was three years ago. If your processor is shipping more cheese and whey protein than they were in 2023, your feeding and genetics program should reflect that.
- If your rolling 12‑month butterfat sits below 4.0% and protein below 3.2%, you’re probably leaving money on the table in a market that rewards components over volume. Review genetics, nutrition, and grouping strategies with your advisor.
- Mark July 2026 on your calendar. The USMCA review is the single most consequential trade‑policy event of the year for your milk check. Mexico and Canada represent 44% of the U.S. dairy export value. You should know what’s at stake before the headlines tell you.
Key Takeaways
- The export boom is real — and so is the pricing gap. Record Q1 2026 volumes confirm accelerating global demand, but the widening spread between all‑milk and mailbox means the gains aren’t landing dollar‑for‑dollar. On a 500‑cow herd, ADC’s estimated $0.40/cwt widening works out to roughly $54,750/year in additional deductions under the new FMMO math. Run it for your herd.
- Components are the strategy, not a bonus. Fat and protein drive the highest‑margin export categories — cheese, butter, and high‑protein ingredients. NFDM just hit $2.06/lb, the highest since 2014, because protein is being pulled into higher‑value products. If your herd is still optimized for volume, you’re misaligned with where the money is going.
- Mexico is the linchpin, and July is the deadline. Indonesia, MENA, and Southeast Asia are growing fast, but Mexico and Canada together account for 44% of U.S. dairy export value. Any USMCA disruption hits harder than most producers expect — and the formal review is three months away. If your processor ships heavily into that corridor, it’s your risk too.

The Bottom Line
Nyman likes to point out that per‑capita dairy consumption in parts of Asia runs 50–60 pounds per person, compared to roughly 600 in the U.S. The growth potential is abroad. It’s real. But potential doesn’t pay bills — pricing formulas do.
“The world needs what we produce,” Nyman said. “And together, we’re making sure they can access it.”
That access is the result of 30 years of work. What matters now — for the next 30 and for the next milk check — is whether your contracts, components, and cost structure are set up to capture the value when it arrives. Or whether someone else captures it first. Where does your breakeven sit if Mexico stumbles or make allowances widen again?
Complete references and supporting documentation are available upon request by contacting the editorial team at editor@thebullvine.com.
Learn More
- $11 Billion Dairy Rush: Is Your Milk Cheque Telling You You’re in a Growth Corridor or a Dead Zone? – This breakdown arms you with a 12-month basis-tracking tool to determine if your processor’s local capacity is expanding or stagnating. It exposes the structural regional shifts that dictate your long-term bargaining power and mailbox leverage.
- The Triple Cushion Trap: Why 2025’s Strong Margins Won’t Save You in 2026 – This strategic forecast reveals why relying on beef-on-dairy premiums and cheap feed is a dangerous game. It delivers a roadmap for repositioning your herd’s genetics and cost structure before 2026’s projected margin compression erases current equity gains.
- Gold Medal Margins: Italy Turns Less Milk into €22.8B. You’re Stuck at $18.95. – This case study breaks down unconventional value-multiplier strategies that successfully decouple farm revenue from commodity volume. It reveals how shifting your focus from “pounds of milk” to “finished product value” can secure significant per-unit premiums.
The Sunday Read Dairy Professionals Don’t Skip.

Every week, thousands of producers, breeders, and industry insiders open Bullvine Weekly for genetics insights, market shifts, and profit strategies they won’t find anywhere else. One email. Five minutes. Smarter decisions all week.

 Join the Revolution!



