










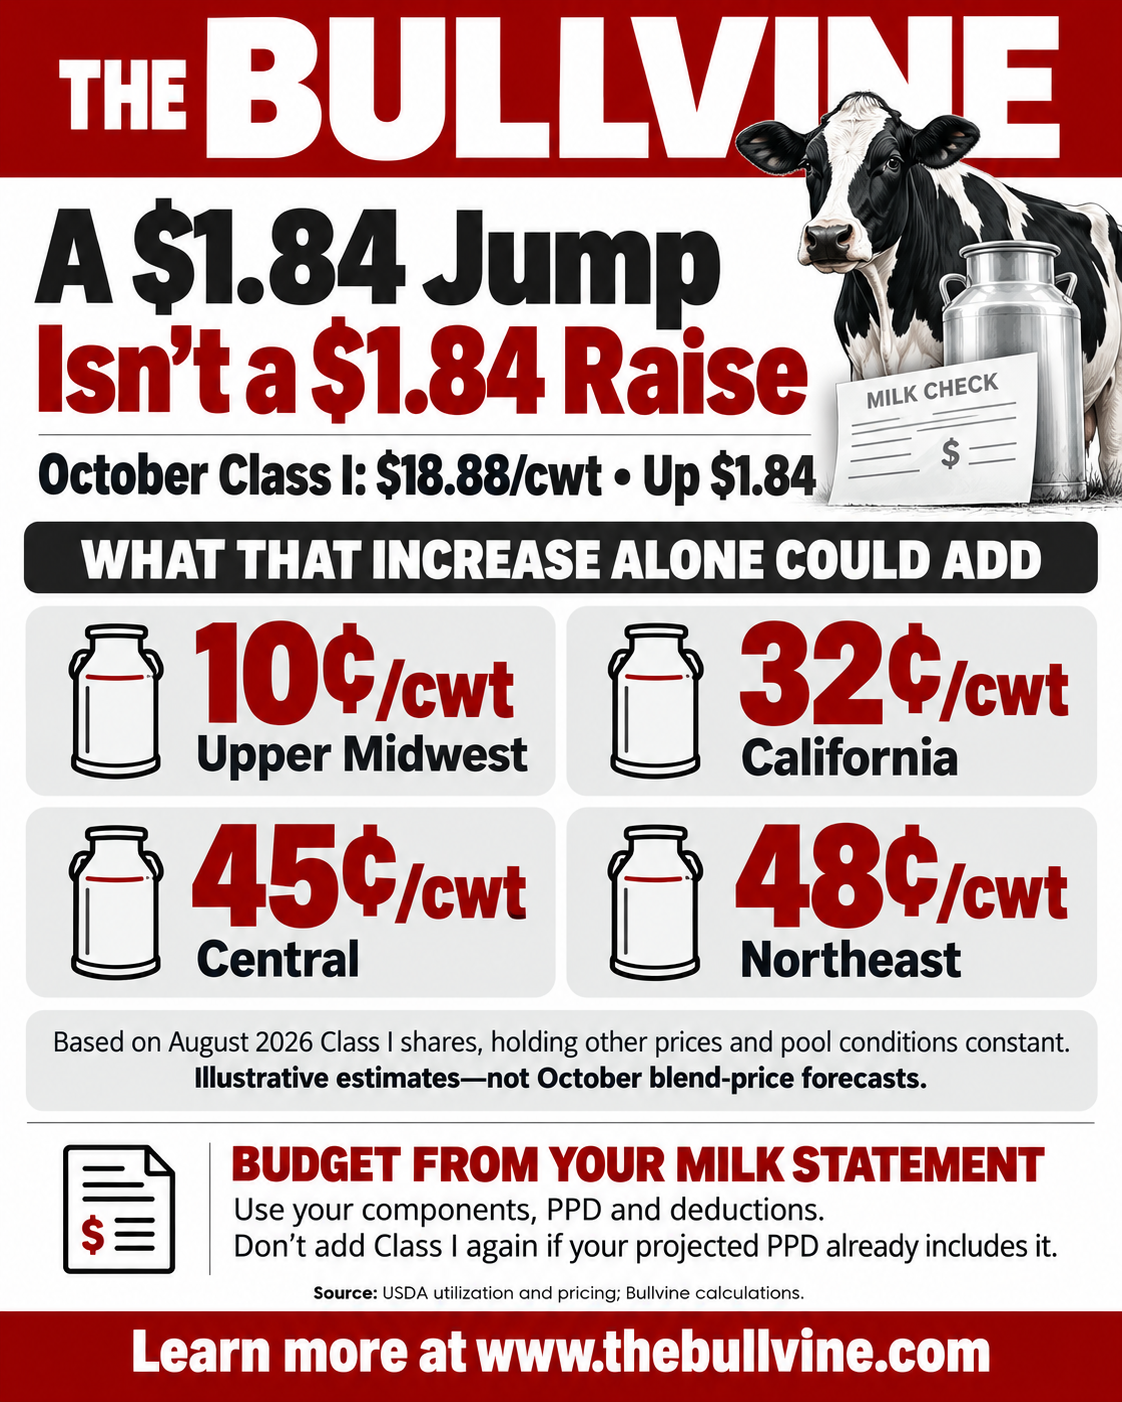
October’s base Class I hit $18.88. Run the $1.84 jump through August pool use and, on our math, an Upper Midwest blend picks up about a dime. The Northeast gets about 48 cents.
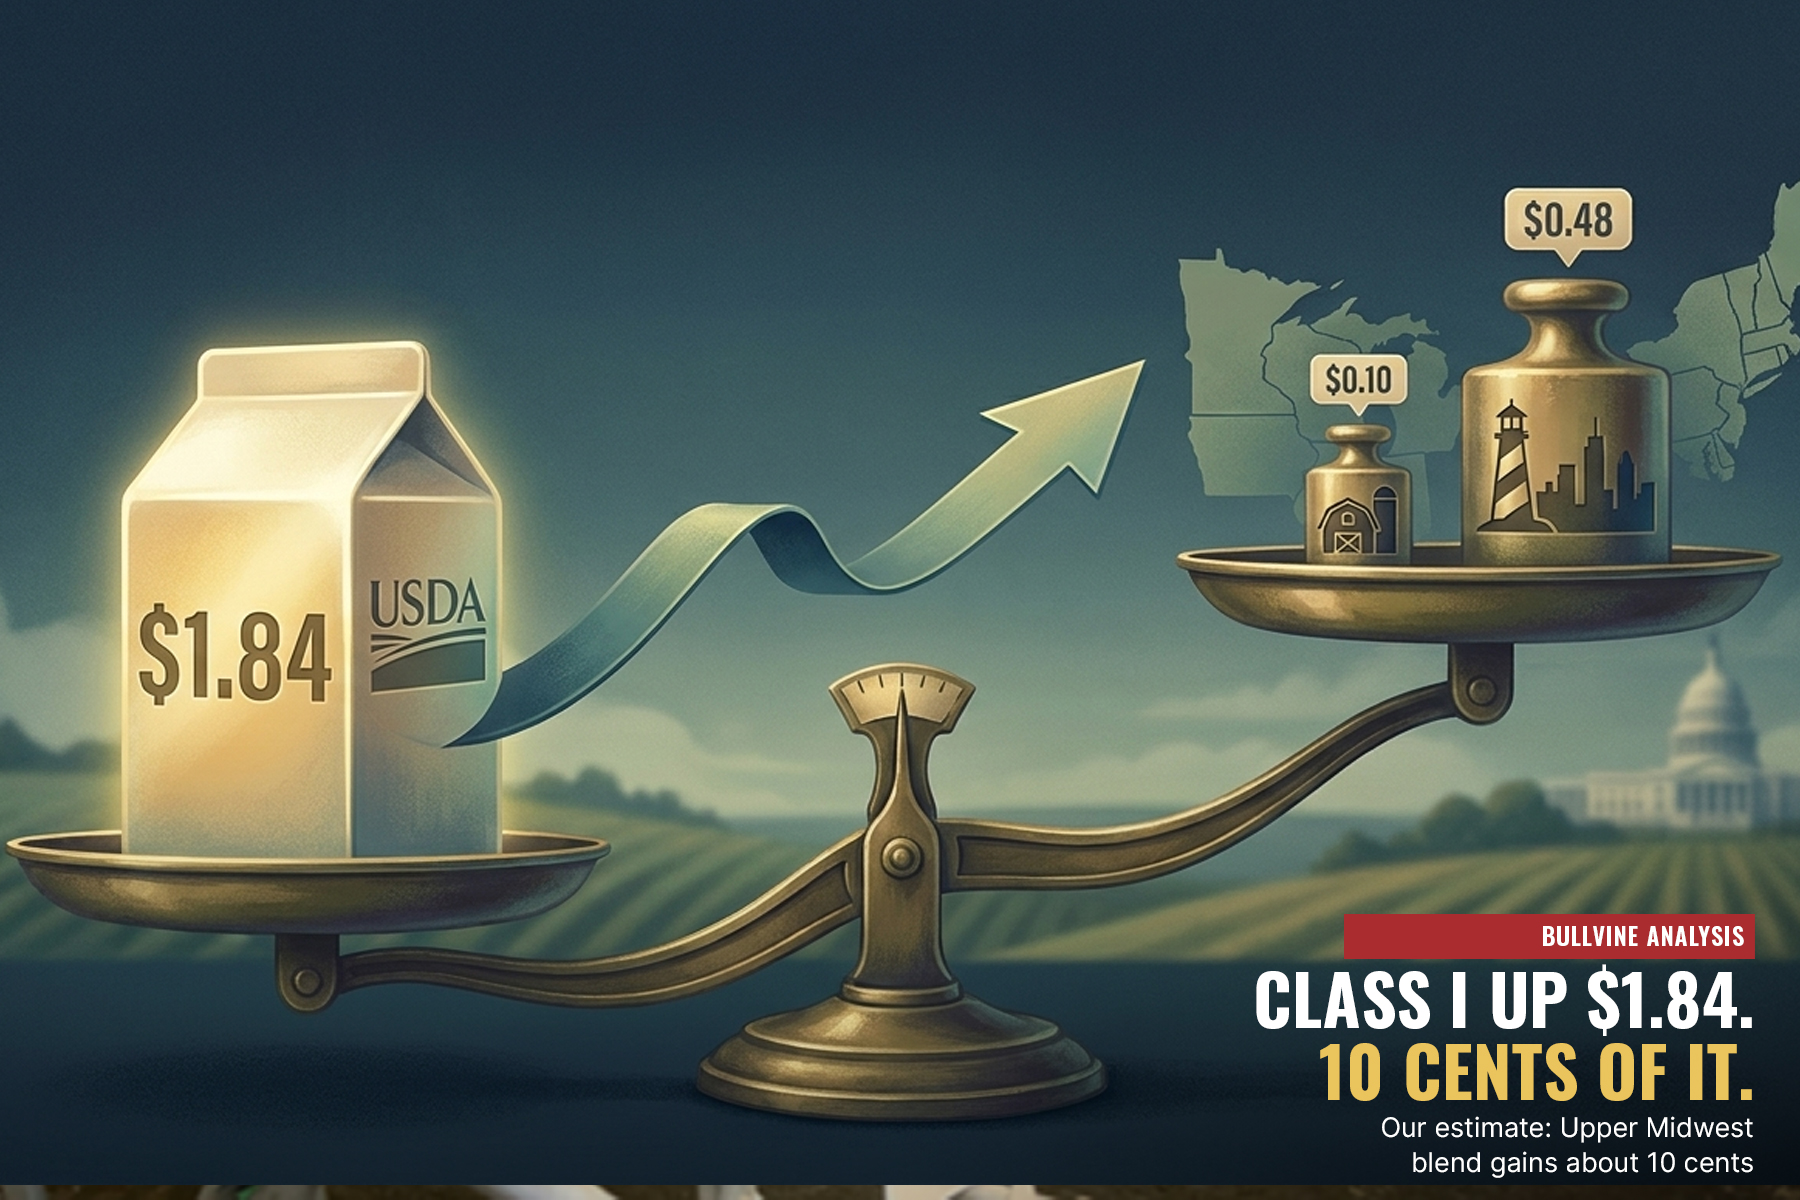
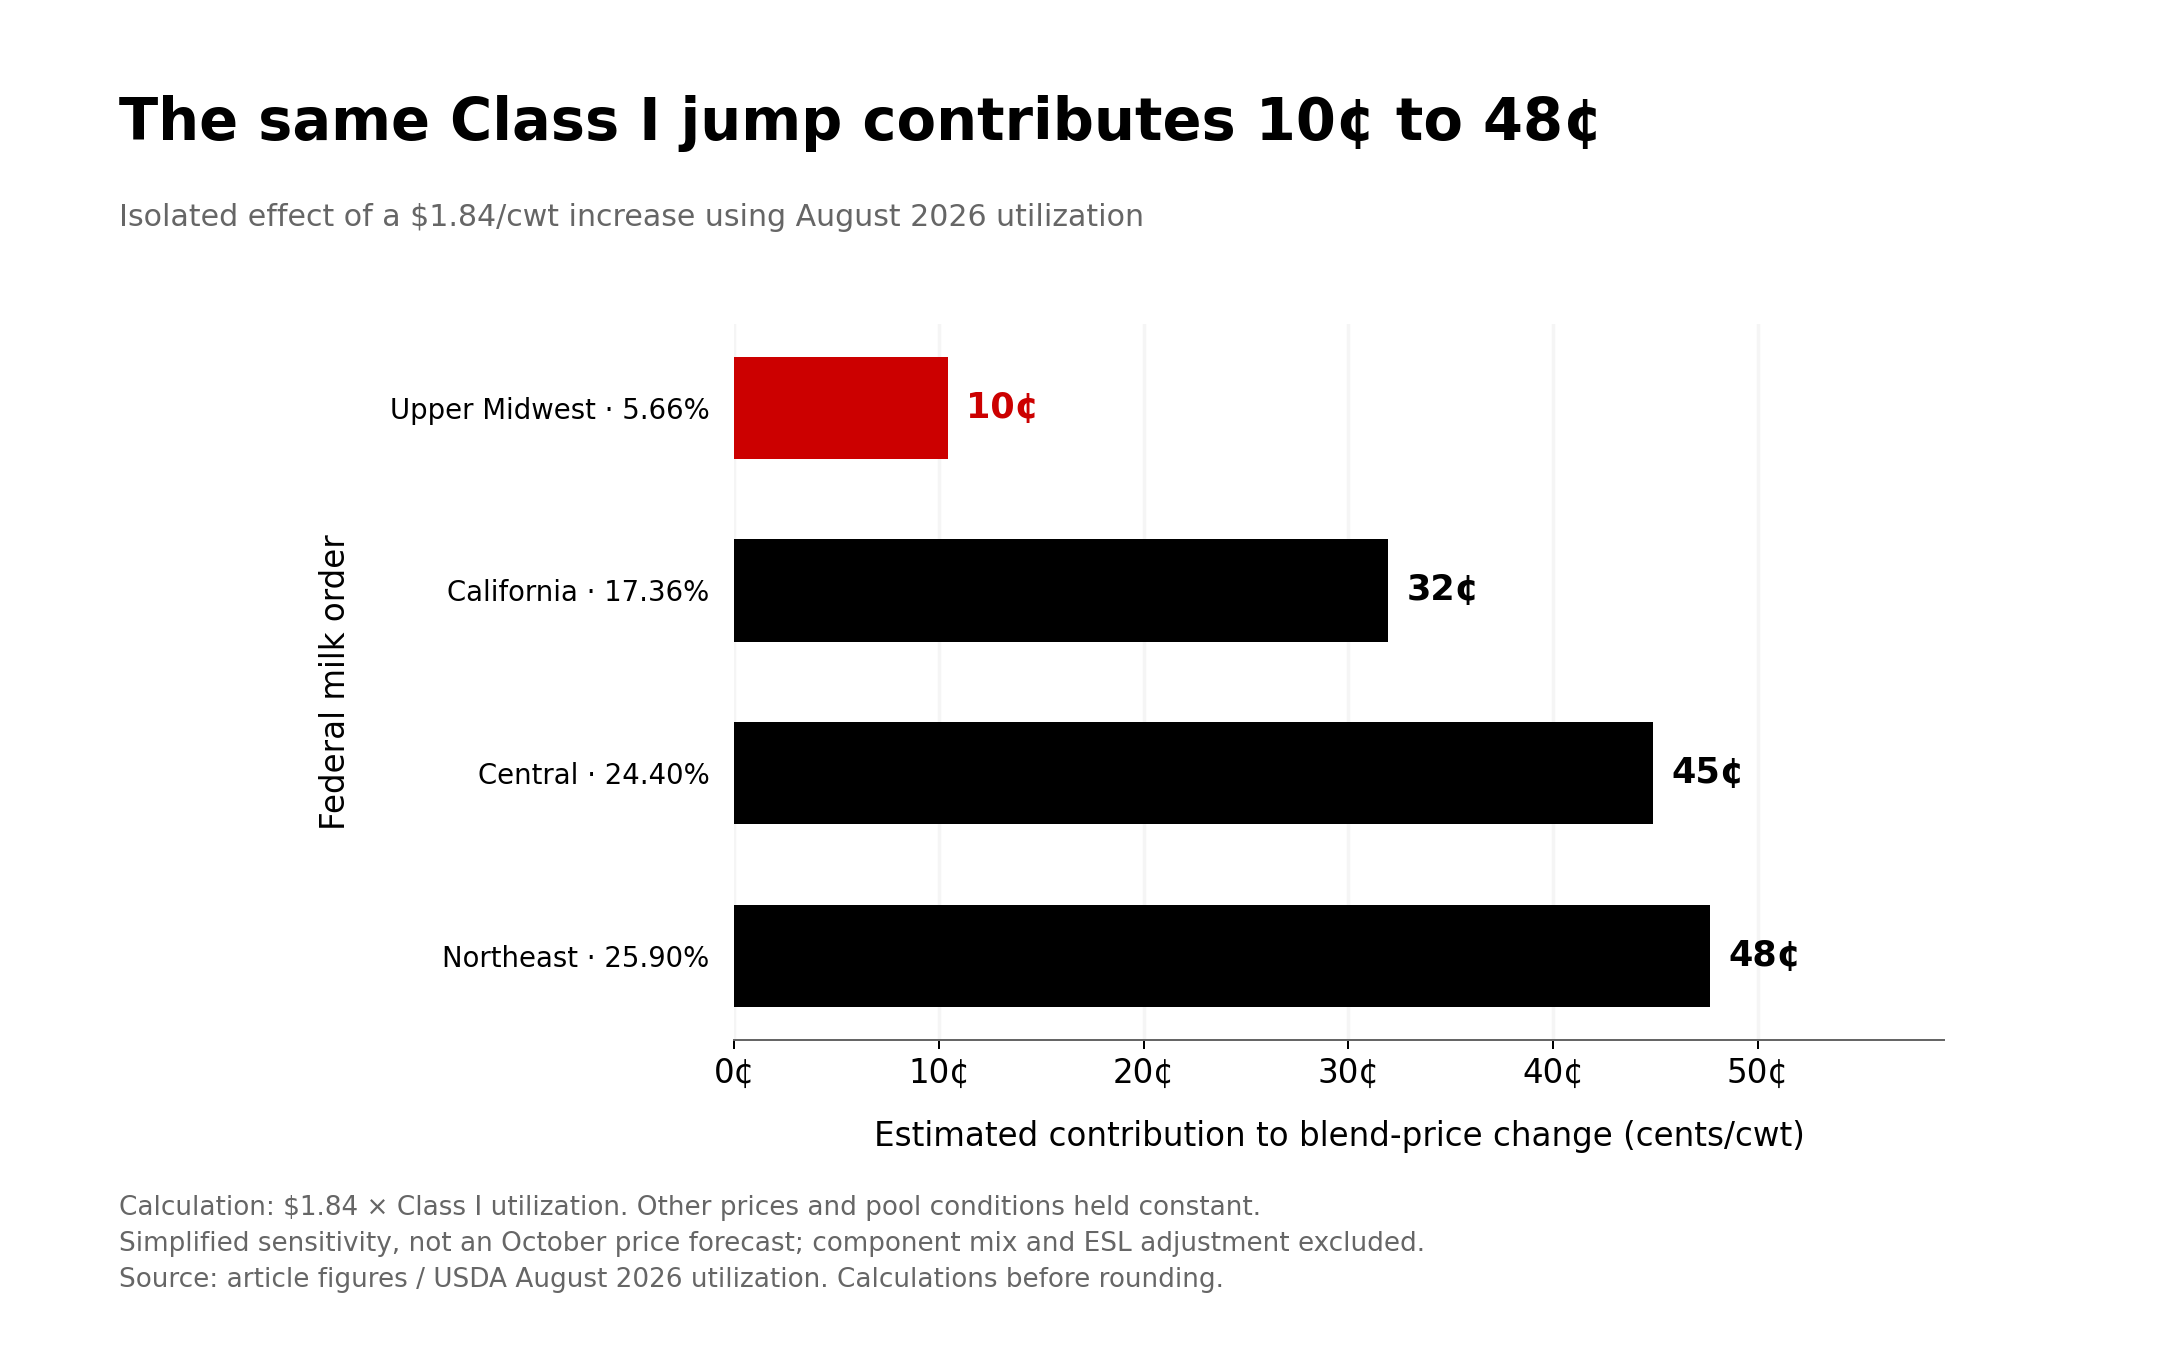
USDA set October’s base Class I milk price at $18.88/cwt. That’s $1.84 above September’s $17.04 and $2.53 above January’s $16.35. Run that $1.84 through actual August pool utilization and the first-pass blend effect is about 10 cents in the Upper Midwest, 32 cents in California, 45 cents in the Central Order and 48 cents in the Northeast.
All of those numbers are correct. None of them is $1.84.
The base Class I price is the minimum starting value for milk used in fluid products, before the location differential at the receiving plant. It isn’t the all-milk price or an order’s uniform price. It’s definitely not what’s left after components, the PPD, hauling, marketing charges and capital retains go through your statement.
Why October rose $1.84
USDA brought back the higher-of Class I mover on June 1, 2025. Updated Class I differentials and make allowances started the same day, and higher skim composition factors followed on December 1, 2025.
For October, the advanced Class IV skim value beat the Class III side. Nonfat dry milk carried the powder side, while weak butter capped the butterfat contribution. September’s final prices showed the same split: Class IV at $18.94 and Class III at $16.04.
That makes October a stronger price for fluid milk. It doesn’t mean every hundredweight in an order gained $1.84.
Utilization does the first cut
Bullvine math: simplified Class I pass-through
Blend change=Class I change×Class I utilization share
This leaves out moves in the other classes, components, location differentials, depooling and pool expenses. It’s not a forecast of the uniform price. It’s a way to keep a Class I headline in proportion.
USDA’s August 2026 utilization data, published September 24, gives each order a different multiplier:
| Order | August Class I utilization | 2026 range, Jan–Aug | Blend effect of October’s $1.84 (Bullvine math) |
| Upper Midwest, FMMO 30 | 5.66% | 5.66–12.25% | about $0.10/cwt |
| California, FMMO 51 | 17.36% | 17.36–23.13% | about $0.32/cwt |
| Central, FMMO 32 | 24.40% | 24.40–32.30% | about $0.45/cwt |
| Northeast, FMMO 1 | 25.90% | 25.90–28.88% | about $0.48/cwt |
August is the conservative month for comparing the four orders. Order 30’s September report has since come out at 6.4% Class I, which would push its pass-through to about 12 cents. At January’s utilization, the same $1.84 would have added about 23 cents in Order 30 and 53 cents in Order 1.
The counterevidence holds up. Fluid-heavy orders get far more of a Class I move. Order 1 passes through about four and a half times what Order 30 does. Farmshine’s analysis put the combined PPD benefit from the updated differentials at about $0.71/cwt at the Northeast base zone over the first four months of 2026, with the amount depending on plant location.
Herd math
The herd blocks use 24,390 lb per cow per year, the 2025 U.S. average cited in CoBank’s recent component analysis. That’s 243.9 cwt per cow, or about 20,325 cwt a month on 1,000 cows. Production is assumed flat across months and the same at every herd size.
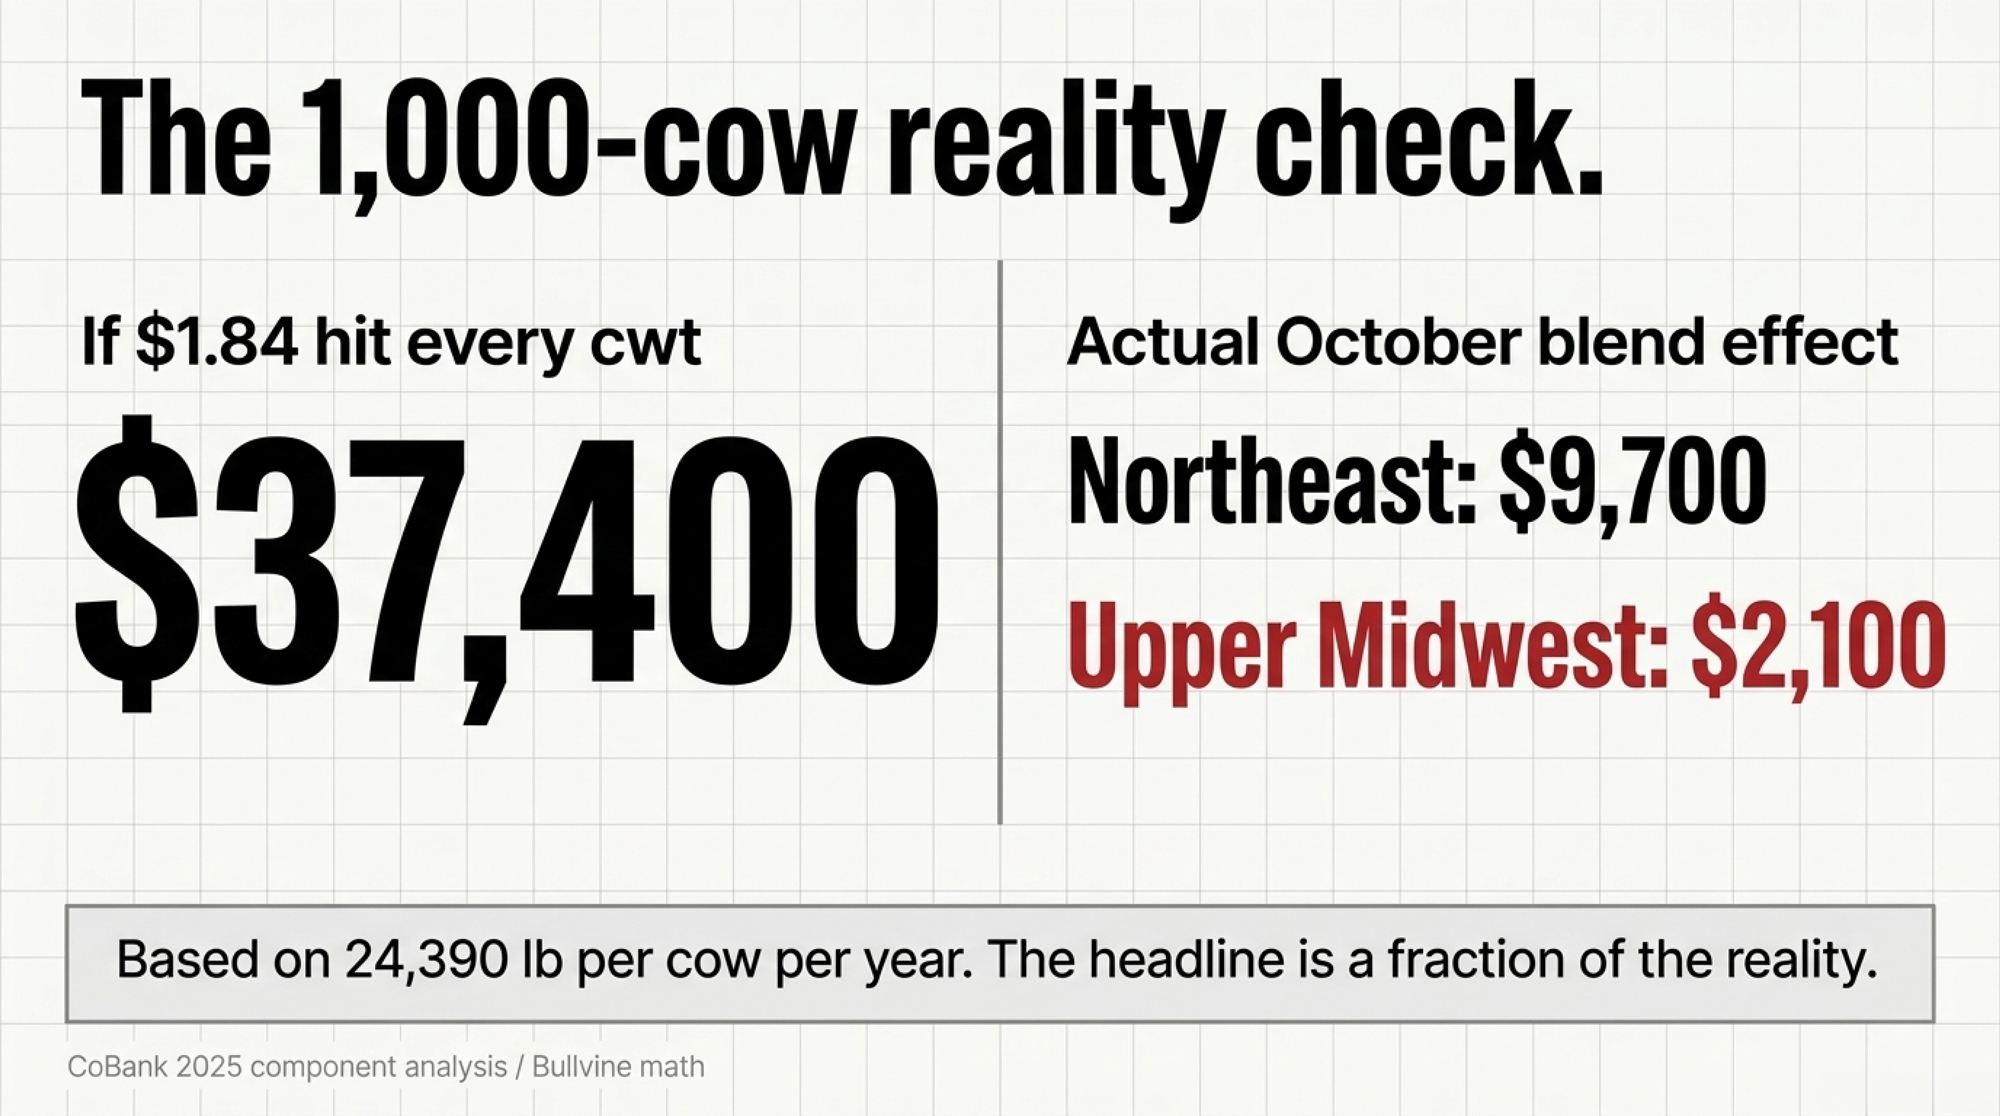
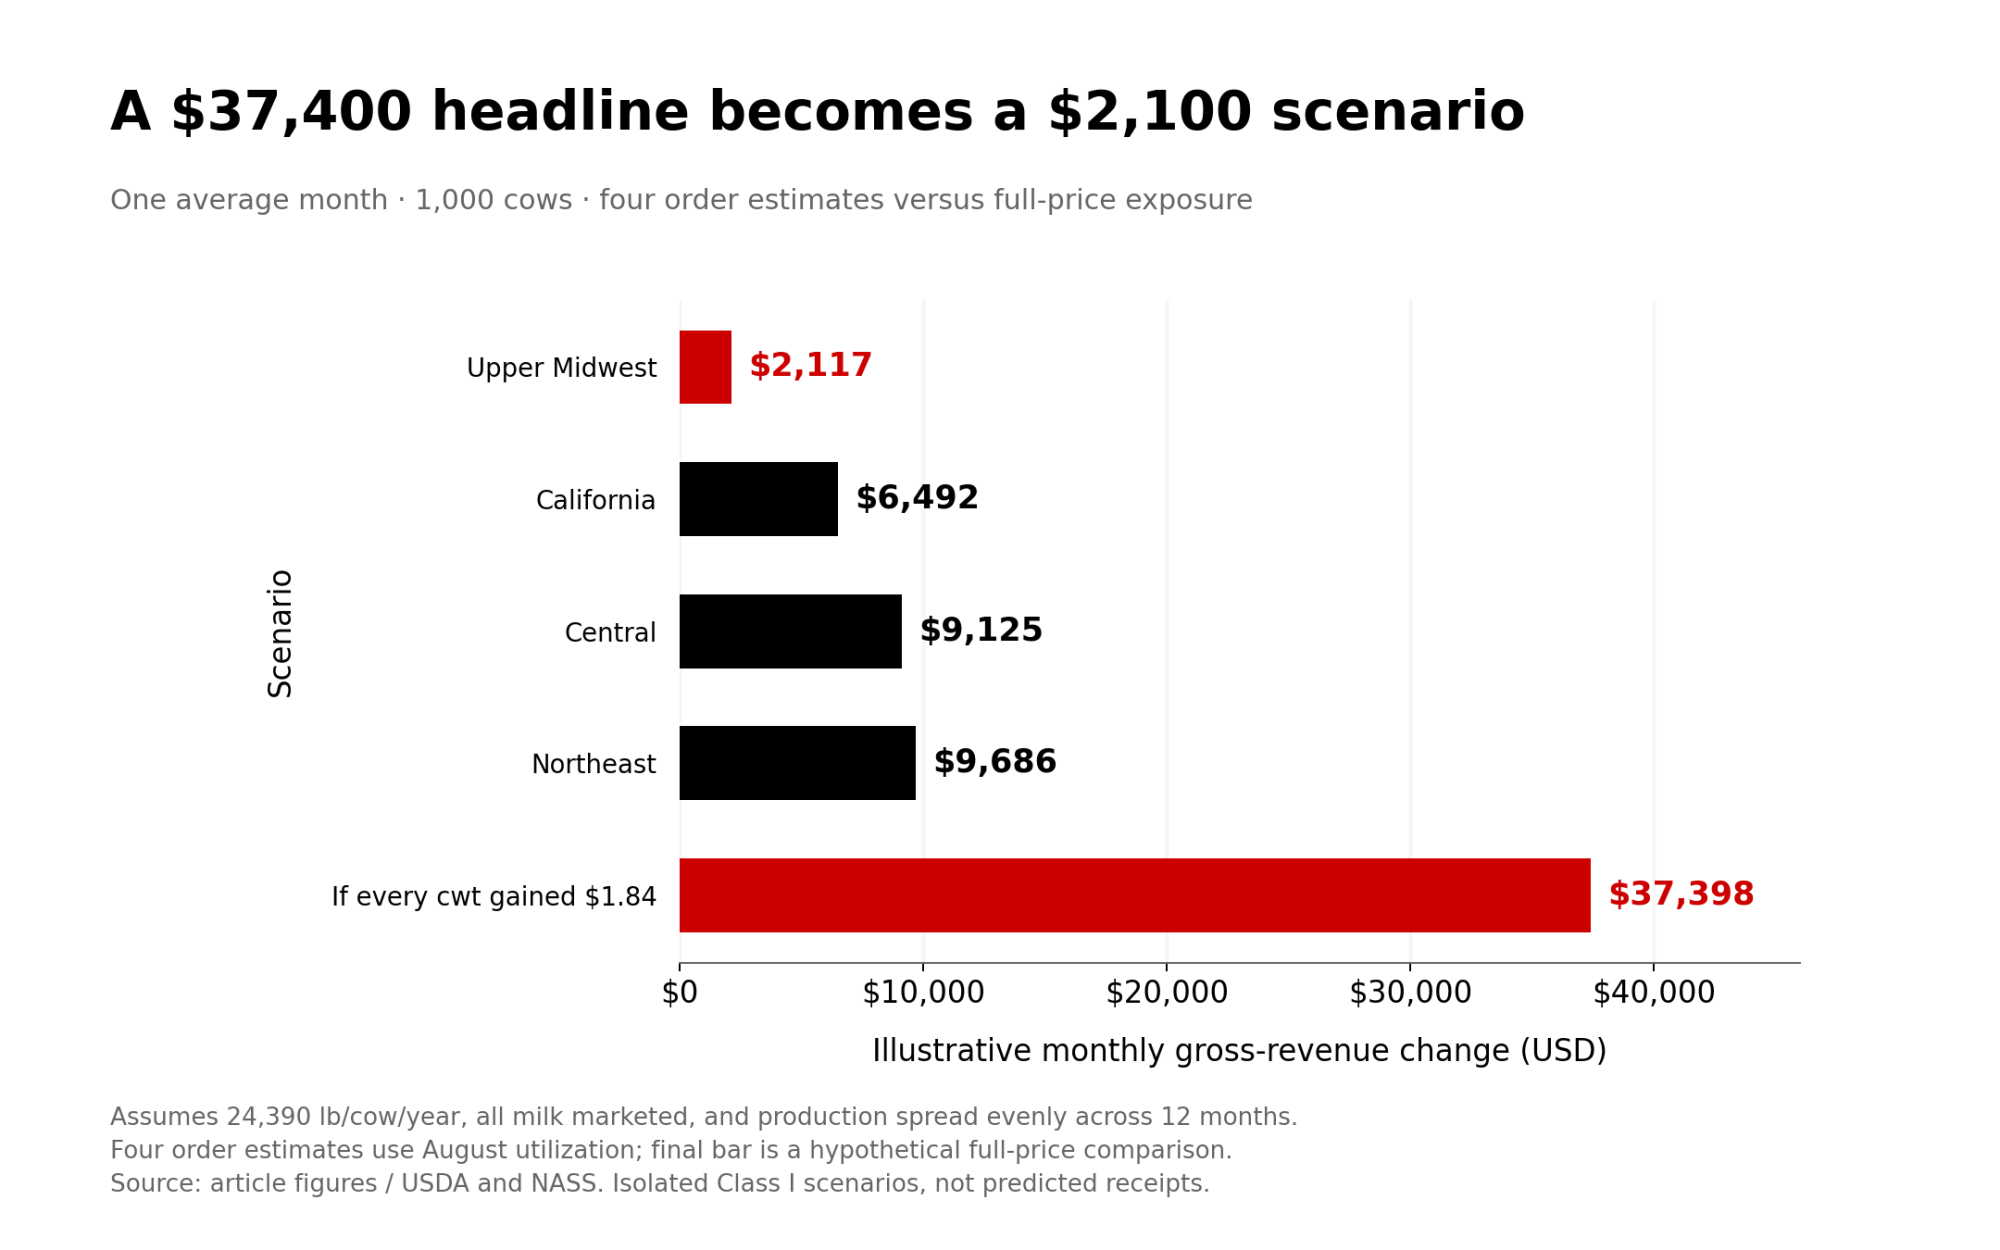
Bullvine math: October’s $1.84 Class I move, one month, 1,000 cows
| Order | Approximate blend effect | October dollars |
| Upper Midwest | $0.104 | about $2,100 |
| California | $0.319 | about $6,500 |
| Central | $0.449 | about $9,100 |
| Northeast | $0.477 | about $9,700 |
| If the full $1.84 hit every cwt | $1.84 | about $37,400 |
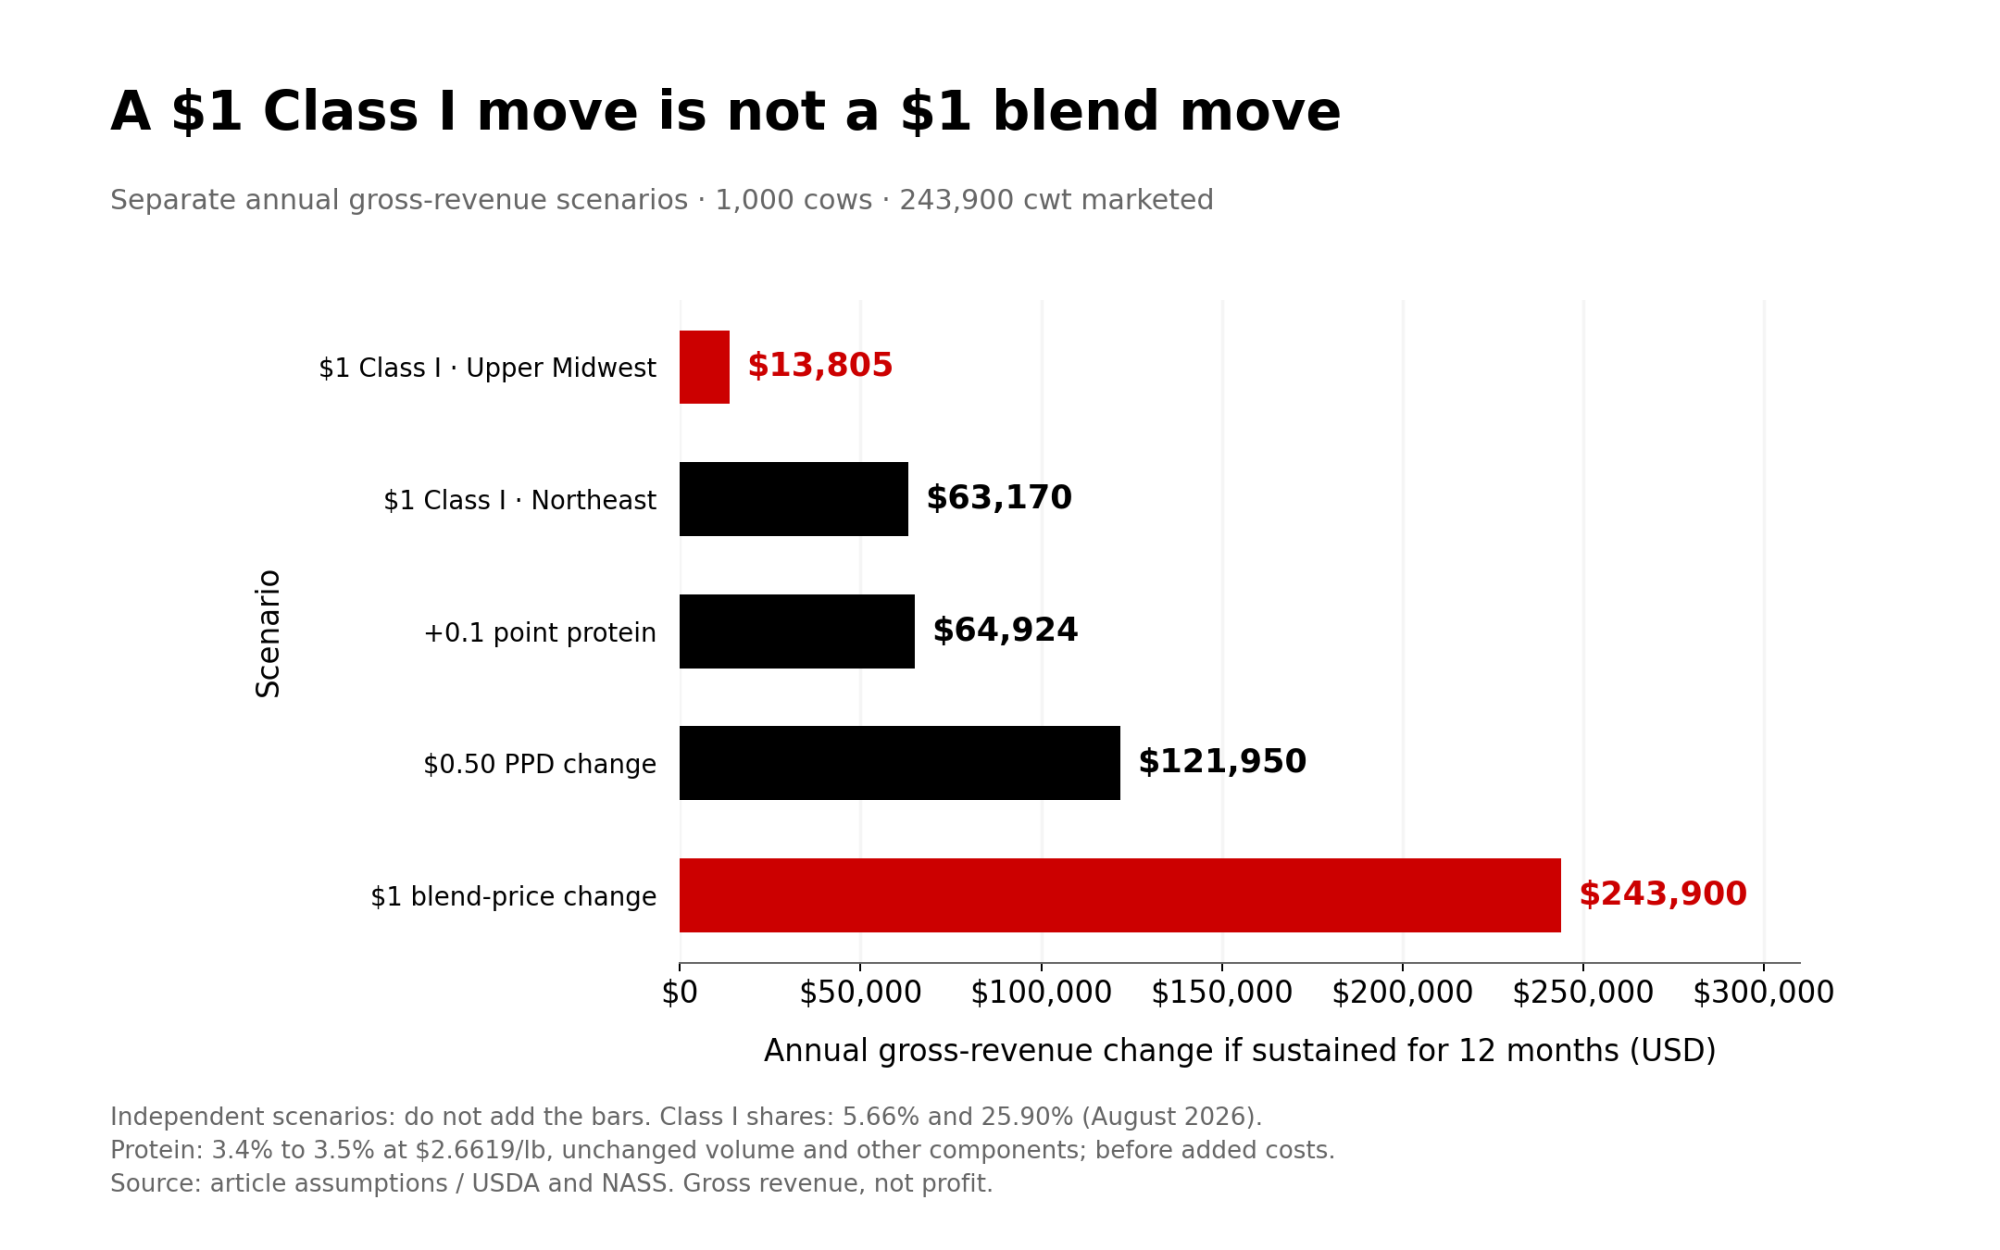
Bullvine math: annual effect of each lever, if it held for 12 months
| Lever | 300 cows (73,170 cwt) | 500 cows (121,950 cwt) | 1,000 cows (243,900 cwt) |
| $1 Class I move, Order 30 (5.66%) | $4,141 | $6,902 | $13,805 |
| $1 Class I move, Order 1 (25.90%) | $18,951 | $31,585 | $63,170 |
| $1 blend move | $73,170 | $121,950 | $243,900 |
| $0.50 PPD swing | $36,585 | $60,975 | $121,950 |
| +0.1 point protein at $2.6619/lb (September price) | $19,477 | $32,462 | $64,924 |
That’s the fix for the line that “$1/cwt equals $250,000 on 1,000 cows.” It’s roughly right for a $1 move in the blend, at this yield. For a $1 move in one class covering a fraction of the pool, it’s way off.
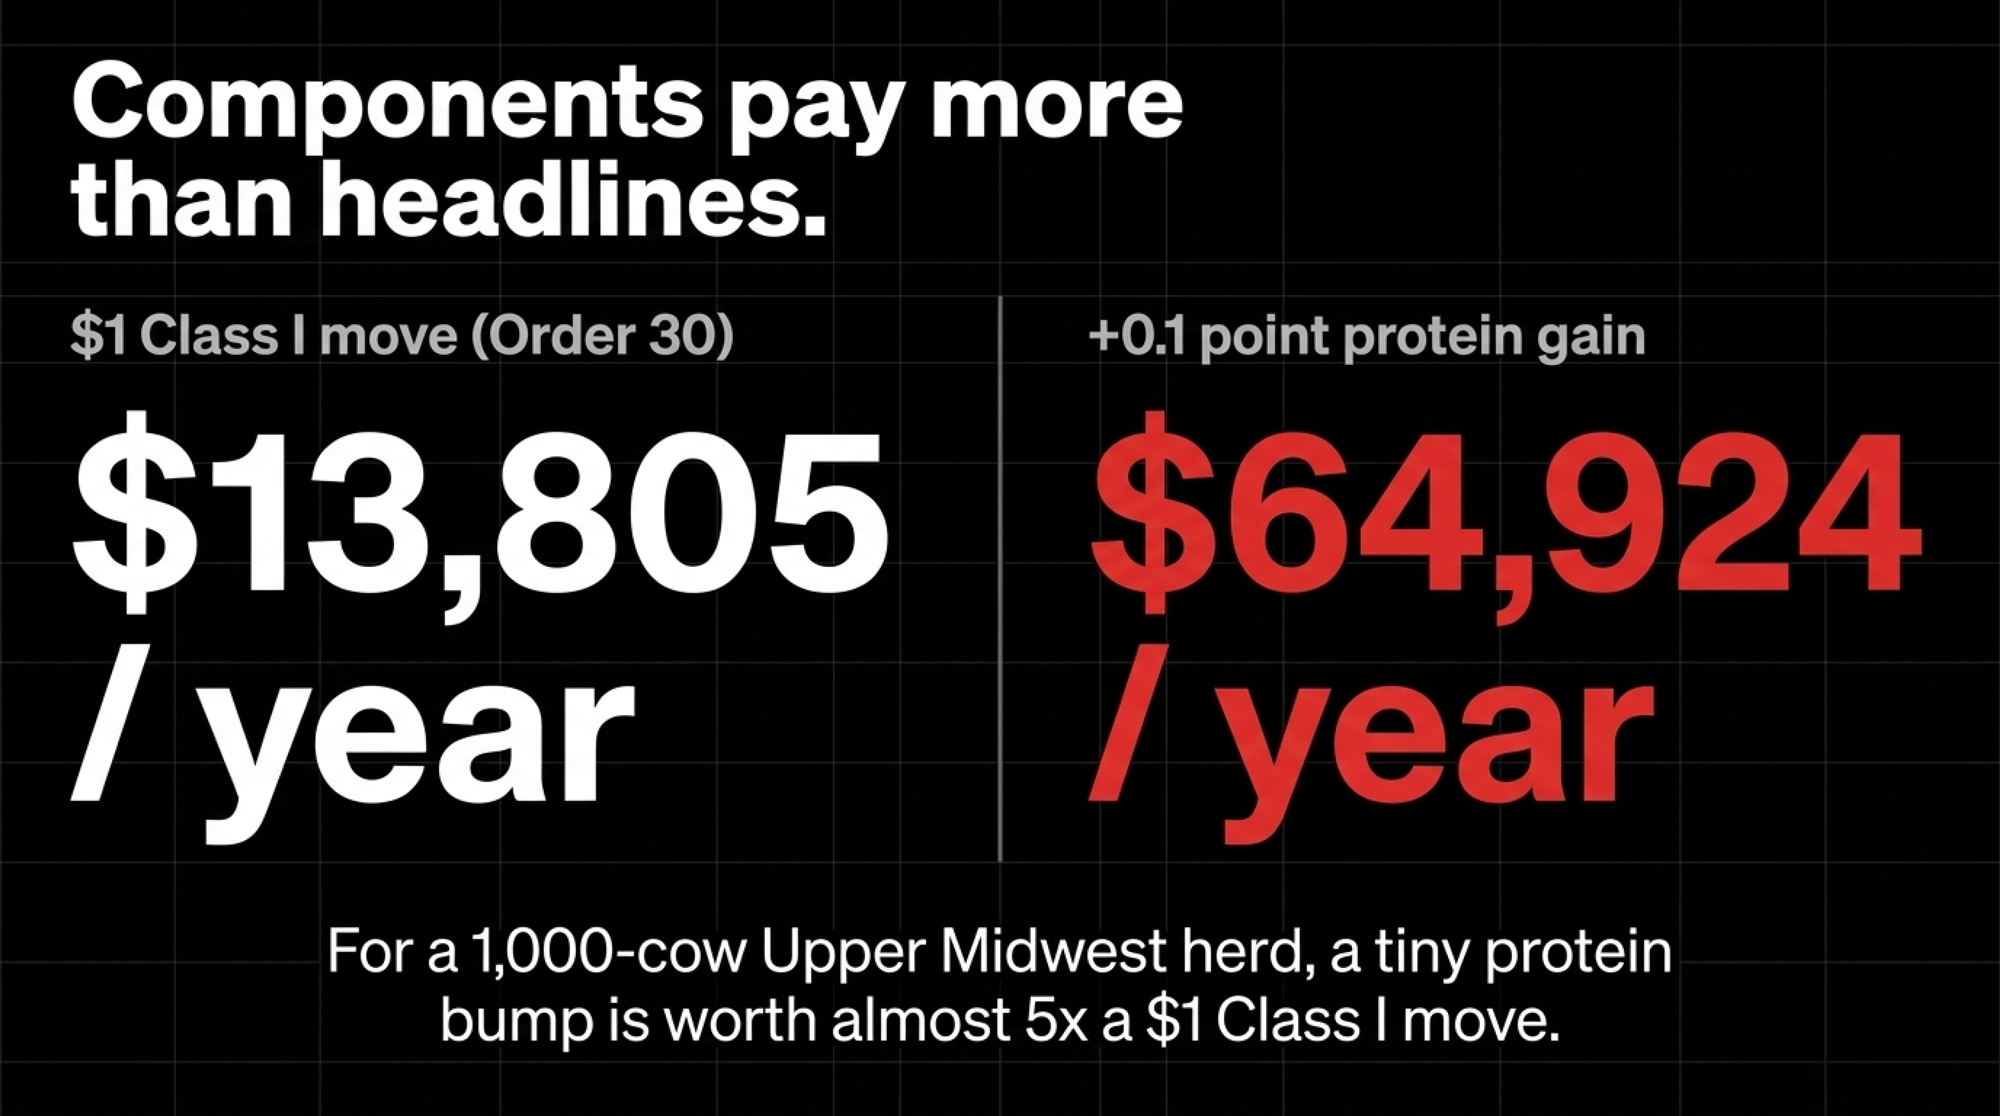
On a 1,000-cow Upper Midwest herd, a 0.1-point protein gain is worth almost five times a $1 Class I move, and a 50-cent PPD swing is worth more than that.
The PPD carries the rest
USDA announces a PPD in seven federal orders: Northeast, Upper Midwest, Central, Mideast, California, Pacific Northwest and Southwest. Those orders pay for butterfat, protein and other solids, plus the PPD, which is the uniform price minus the Class III price.
That makes the PPD sensitive to class spreads and to which manufacturing milk stays in the pool. Class I has to be pooled. Class II, III and IV milk can be left out when handlers meet the order’s rules. The incentive is strongest when a manufacturing class sits well above the uniform value.
That happened in 2026. Iowa State Extension reported Central Order pooled milk at about 1.35 billion lb in March, down from more than 1.50 billion a year earlier, with Class IV at only 12% of pooled milk. That pattern fits depooling while Class IV sat above Class III, but a drop in pooled volume alone doesn’t show which handler pulled which pounds.
Depooling is allowed under the order rules. The point isn’t that someone took farmers’ money. It’s that a high Class IV price can’t lift the blend if much of the high-value Class IV milk isn’t in the pool.
Walk one cheque
This is a constructed September example for an Upper Midwest Order 30 producer shipping at Order 30’s average tests. It’s not an actual producer statement. Every regulated line comes from USDA’s September Order 30 computation, released October 12.
Step 1: Class I at the plant. USDA set September’s base Class I at $17.04. At a Cook County, Illinois plant, the $3.20 differential made it $20.24. That’s what fluid handlers owed the pool, not what the producer got paid.
Step 2: pool result. Class I was 6.4% of Order 30’s September producer milk and Class III was 91.6%. The statistical uniform price was $16.62 at 3.5% butterfat.
Step 3: components at actual pool tests. Order 30 producer milk averaged 4.24% butterfat, 3.29% protein and 5.80% other solids in September.
Bullvine math: component value
- Butterfat: 4.24×1.4762=6.264.24×1.4762=6.26
- Protein: 3.29×2.6619=8.763.29×2.6619=8.76
- Other solids: 5.80×0.4147=2.415.80×0.4147=2.41
- Component value: about $17.42/cwt
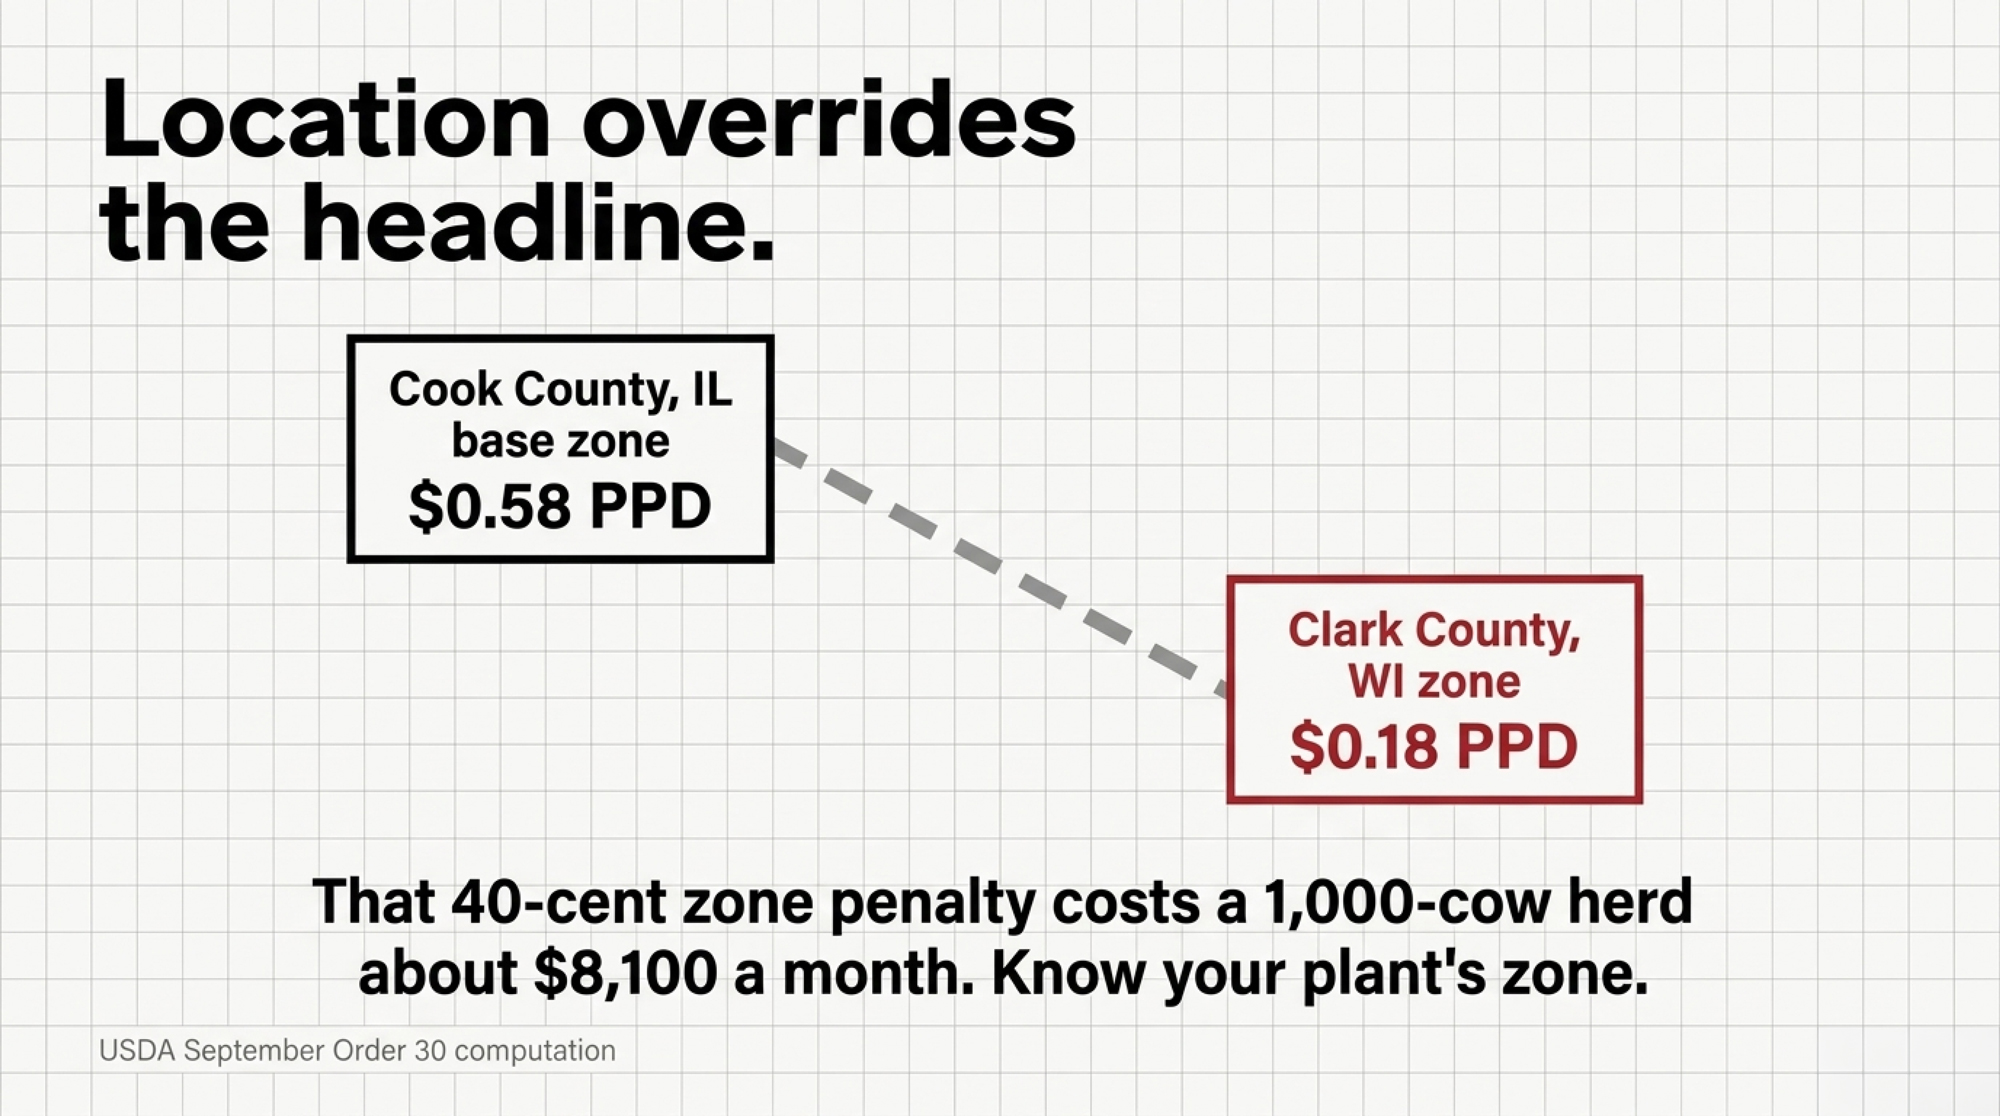
Step 4: PPD by zone. September’s PPD was $0.58 at the Cook County base zone. In the lower-differential zones it fell to $0.48, $0.28 and $0.18. Plants in Clark County, Wisconsin carried a $2.80 Class I rate, 40 cents under Cook County’s $3.20, which puts them in the $0.18 zone.
| Delivery point | PPD | Gross regulated value (Bullvine math) |
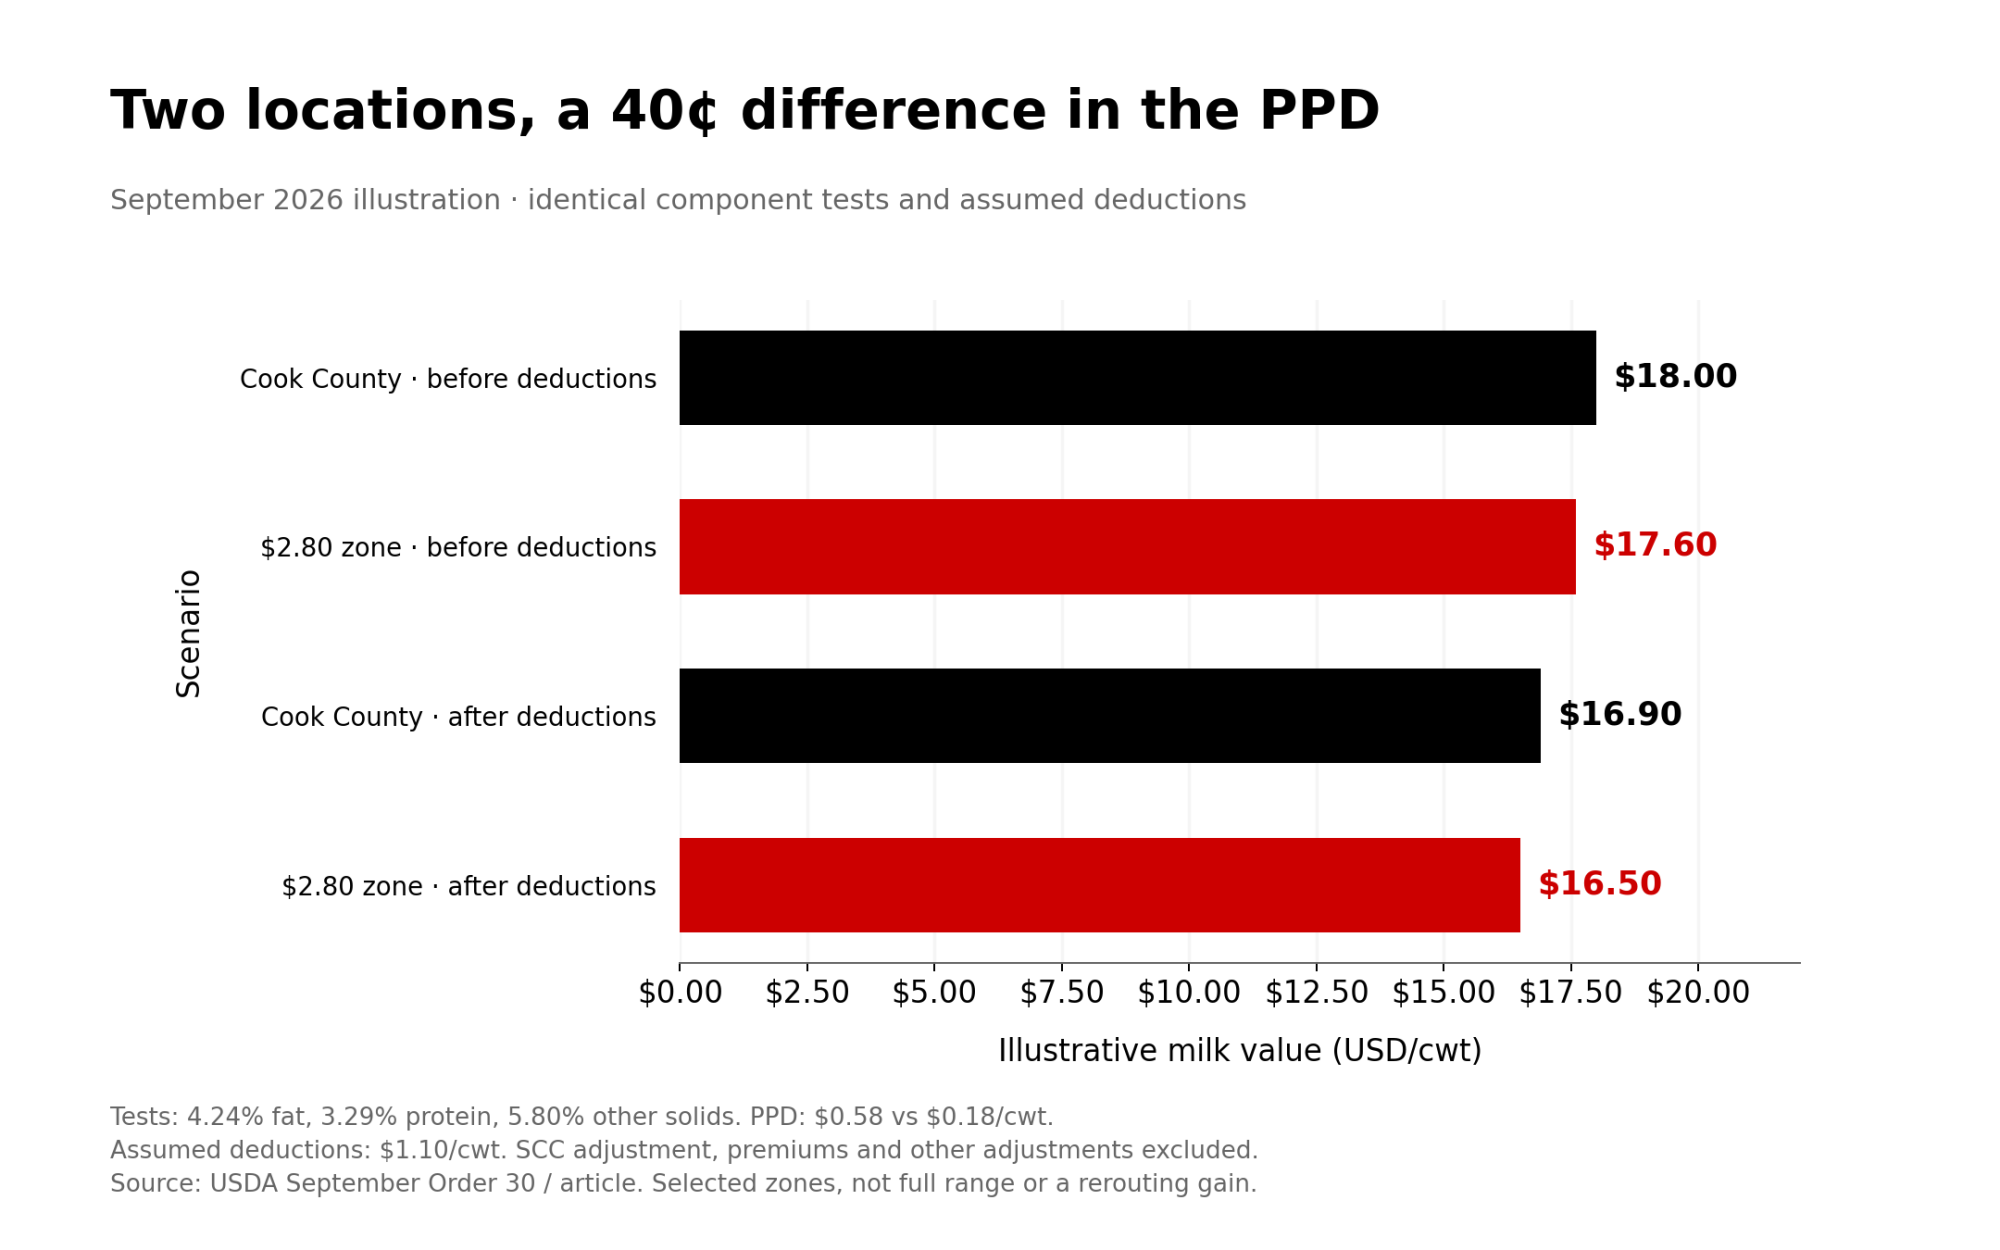
| Cook County, IL base zone | $0.58 | about $18.00/cwt |
| $2.80 zone, e.g. Clark County, WI | $0.18 | about $17.60/cwt |
Step 5: co-op lines. These are assumptions, not reported figures:
- Marketing charge: $0.15
- Capital retain: $0.25
- Hauling: $0.70
- Constructed net: about $16.90/cwt at the base zone and $16.50 in the Clark County zone, before quality and volume premiums, assessments or other member-specific lines
The $20.24 Chicago Class I price never showed up on the cheque. It went into the pool at a 6.4% share. Then components and a PPD that depends on location set the regulated value. Notice too that this producer’s $18.00 gross beat the $16.62 uniform price, but only because the milk tested above the standard.
Location turned out bigger than the headline. Bullvine math: the 40-cent PPD gap between the base zone and the Clark County zone is about $8,100 for one month on 1,000 cows. Order 30’s entire October Class I pass-through is worth about $2,100 on the same herd.
No standardized public schedule of co-op hauling, marketing charges and retains turned up. Those three lines stay labelled as assumptions until a published schedule or a consented statement replaces them.
Mailbox data run behind
AMS mailbox prices are the better yardstick for what farms actually got. They’re net of hauling, co-op dues, assessments and capital retains, they include premiums, and they’re regional averages that come out well after the class prices.
That lag rules out a clean October comparison today. October’s Class I price is known before the milk is marketed. October components, uniform prices, PPDs and mailbox prices come later.
The board moved this week
On October 1, USDA’s table had November Class III at $15.96 and November Class IV at $20.65, a $4.69 spread. The October contracts showed $15.13 and $20.34.
Class III has rallied since then. November Class III closed at $16.87 on October 14, up 34 cents on the day. That’s $1.89 above the October 9 quote and 91 cents above October 1.
The direction matters more than any one day. If Class IV holds near $20 while Class III climbs, the depooling incentive shrinks. If Class III gives the rally back, the March-style setup returns.
Market advisory firms that read this split for producers usually sell hedging and insurance services too. Weigh their recommendations with that in mind.
DMC and DRP measure different milk
USDA’s August DMC margin was $9.34/cwt: a $19.80 national all-milk price minus a $10.46 formula feed cost. Against $9.50 coverage, that’s a 16-cent shortfall before payment factors.
Put the same $19.80 milk price against a herd spending $12/cwt on feed. Its simple milk-over-feed margin is $7.80, not $9.34 (Bullvine scenario). DMC protects the national formula margin. It doesn’t know your mailbox price or your feed bill.
DRP protects quarterly revenue based on your elected Class III/IV weighting or component pricing, settled on announced USDA prices plus an area production adjustment. It doesn’t cover your mailbox price, your hauling bill or your zone PPD.
What this means for your operation
- Budget from the statement, not the headline. Start with shipped cwt, actual tests and your plant’s zone. Add your zone’s PPD history and subtract your own deductions. Bring in the Class I price last, multiplied by your order’s utilization.
- Know your multiplier. In August, a $1 Class I move was worth about 6 cents/cwt in Order 30 and 26 cents in Order 1. Check your market administrator’s latest monthly report before every budget run.
- Know your zone. In September, the Order 30 PPD ran from $0.58 to $0.18 depending on location. Your statement’s PPD line should line up with your plant’s zone. If it doesn’t, ask why.
- Watch the Class III/IV spread. November’s spread was $4.69 on October 1, and Class III has gained 91 cents since. A narrowing spread eases depooling pressure on PPDs.
- Price the protein. At September’s $2.6619/lb, 0.1 point of protein was worth about 27 cents/cwt. That beats a $1 Class I move in every order in the table.
- October 21–22: USDA’s November advanced prices come out. Rerun the pass-through table.
- December 18, 2026: 2027 DMC enrollment closes. Locked-in operations still have to file CCC-801 and pay the administrative fee. Tier 1 now covers the first 6 million lb.
- Before buying DRP: check with your agent which quarters are still open. Then compare your elected basis against your last 12 statements.
The Bullvine: FMMO Reality Check Calculator
Stop budgeting on USDA headlines. Plug in your herd size to see exactly how much of a Class I price jump actually makes it to your uniform blend price.
Complete references and supporting documentation are available upon request by contacting the editorial team at editor@thebullvine.com.
Learn More
- The $0.93 FMMO Hit: 3 Questions to Protect Your 2026 Milk Cheque — Calculate exactly how the recent FMMO make-allowance update drains $0.60 to $1.00/cwt from your milk check. You get three filtering questions to instantly separate background policy noise from contract threats demanding immediate operational changes.
- Dairy Farm Economics 2026: Milk Pricing, Margins & Risk Playbook — Macroeconomic shifts in quota caps, labor costs, and component ratios will dictate your next three years of profitability. This playbook exposes those hidden pressure points, defining the hard margin thresholds required to justify capital expansion.
- $2 Milk or $20 Milk: The Simple Testing Strategy Creating 1000% Premiums — Turn regulatory compliance into a marketing weapon to capture massive retail margins. By following the money on a $500 monthly pathogen testing protocol, this case study reveals how direct-to-consumer operations command $20-per-gallon fluid prices.
The Sunday Read Dairy Professionals Don’t Skip.

Every week, thousands of producers, breeders, and industry insiders open Bullvine Weekly for genetics insights, market shifts, and profit strategies they won’t find anywhere else. One email. Five minutes. Smarter decisions all week.
