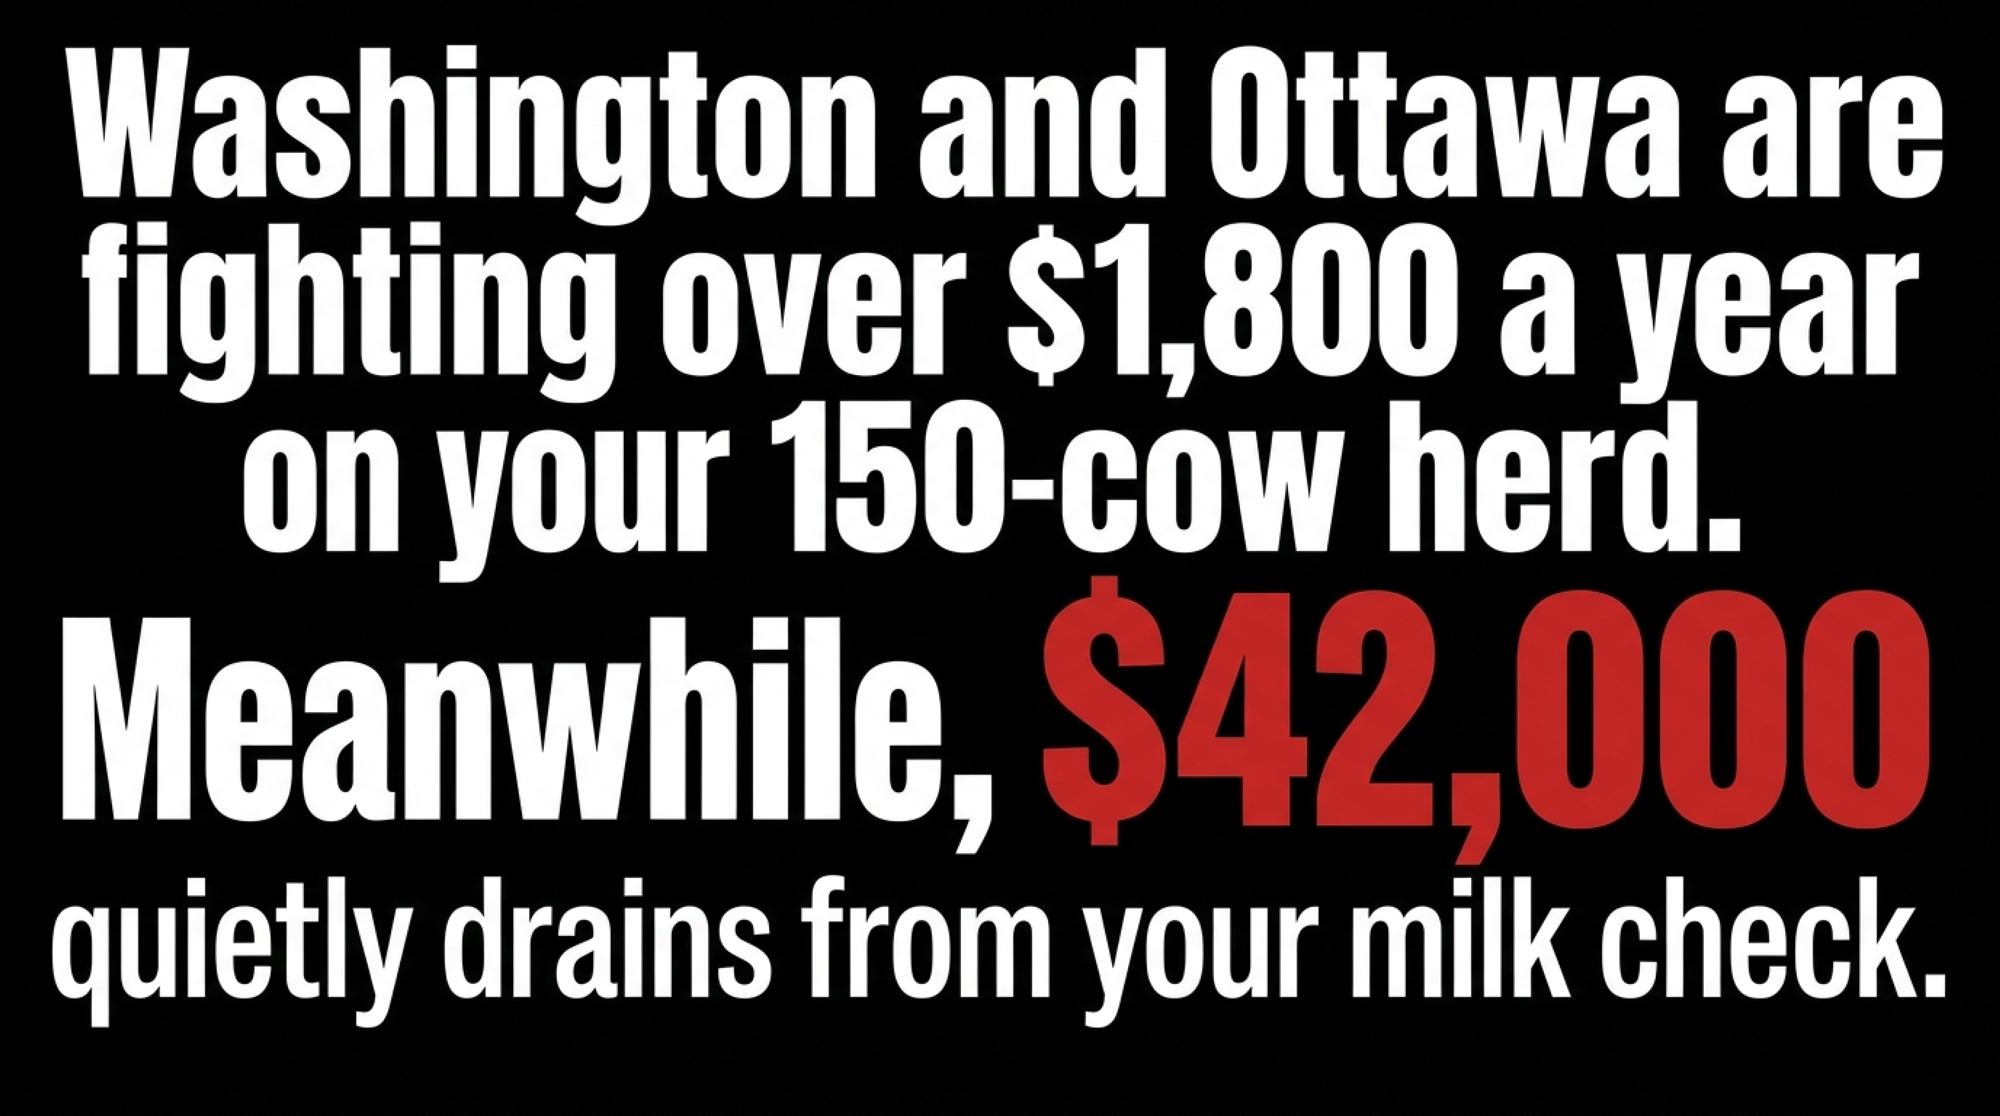
Two governments just went to war over about $1,800 a year on your 150-cow herd. The number actually draining your Class IV cheque? Closer to $42,000 — and the tariff doesn’t touch it.
Executive Summary: Trump signed a 50% tariff on Canadian dairy Monday night under Section 338 — the first time that Depression-era authority’s ever been used to impose duties — and it takes effect August 19, overriding the USMCA. Every outlet’s covering it as the same old TRQ fight, and here’s the thing nobody’s saying: full enforcement of that quota access is worth about a nickel a cwt, or roughly $1,800 a year on a 150-cow herd. The number that actually moves your milk check is the one the tariff doesn’t touch — the Canadian nonfat-solids surplus reclassified under HTS 1901.90 to slip past USMCA’s caps, which the USITC flagged in May as pressing down on your Class IV floor. Run a $1/cwt Class IV swing on that same 150-cow herd, and you’re at $42,000 a year; on 600 cows shipping heavy Class IV, it’s $170,000. So don’t hang your risk decision on August 19 — hang it on your own Class III/IV split, pull your last three settlement statements, and get your DRP position reviewed inside 30 days while HighGround’s Q1 2026 numbers still show a net $0.83/cwt to producers who carried it. The tariff is a border-optics fight; the leak is the one quietly bleeding your cheque.

Picture a Class IV shipper in southwest Wisconsin — pick any butter-and-powder operation you know — opening the Reuters alert that hit every dairy inbox in North America Monday night: a 50% tariff on Canadian dairy, effective August 19, signed under a Depression-era statute that’s sat dormant almost since the day it passed. The number that matters most to that operation isn’t in the headline. It’s buried three layers down, in a pricing mechanism most of the coverage skipped right past. And even on a modest 150-cow herd, it dwarfs the fight both governments are shouting about.
Here’s the short version. The tariff everyone’s watching is a border tax over a cheese-quota dispute, worth roughly $1,800 a year to a mid-size dairy on our math. The thing quietly pressuring your Class IV price is a completely separate protein-reclassification pathway that the U.S. International Trade Commission flagged back in May. Both are real. But only one of them scales with your herd — and it’s not the one on the front page.
The Two Fights at a Glance
Before the trade-law weeds, here’s the contrast that drives the whole piece:
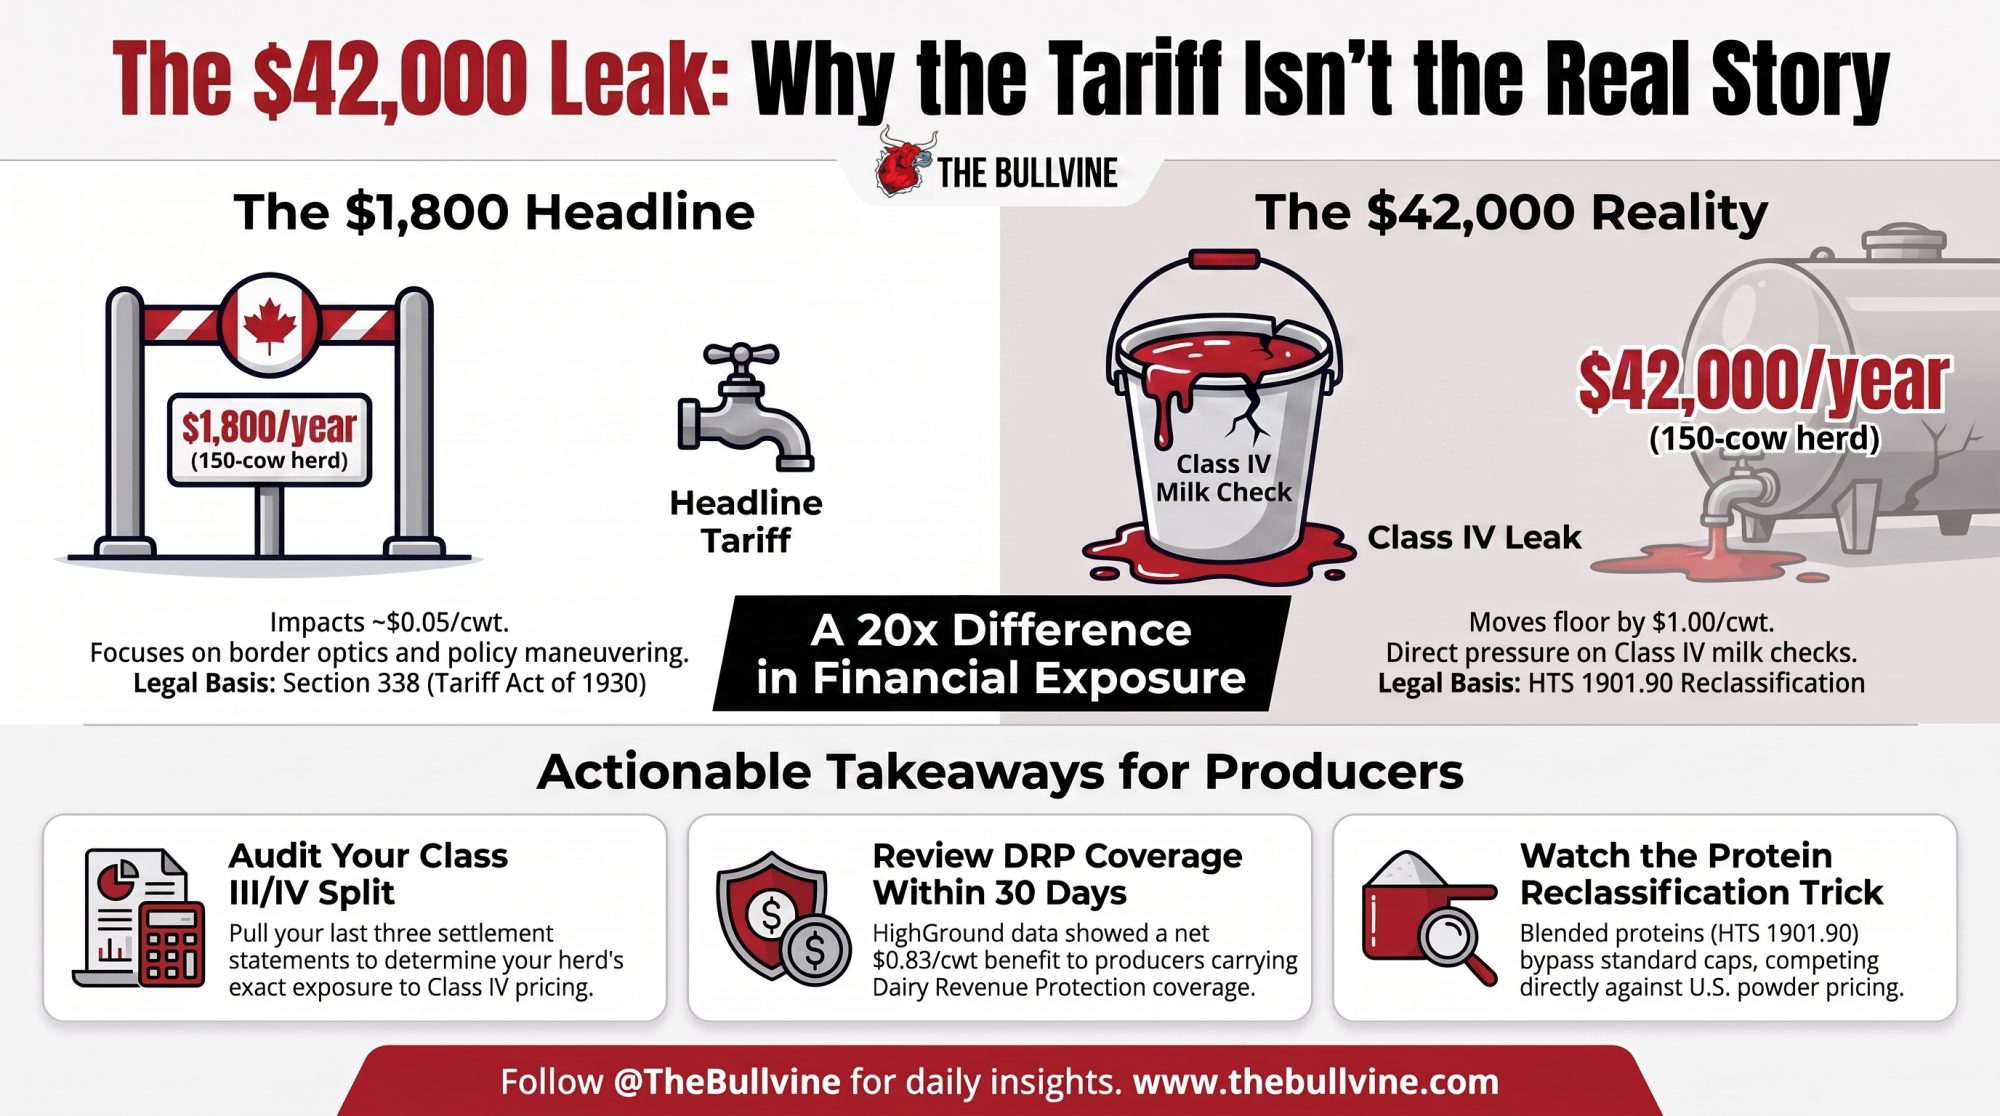
| Feature | The $1,800 Headline Tariff | The $42,000 Class IV Leak |
| Legal Authority | Section 338 (Tariff Act of 1930) | HTS 1901.90 reclassification / protein blends |
| Core Dispute | Canadian TRQ allocation rules for retailers | Uncapped nonfat solids entering U.S. Class IV pool |
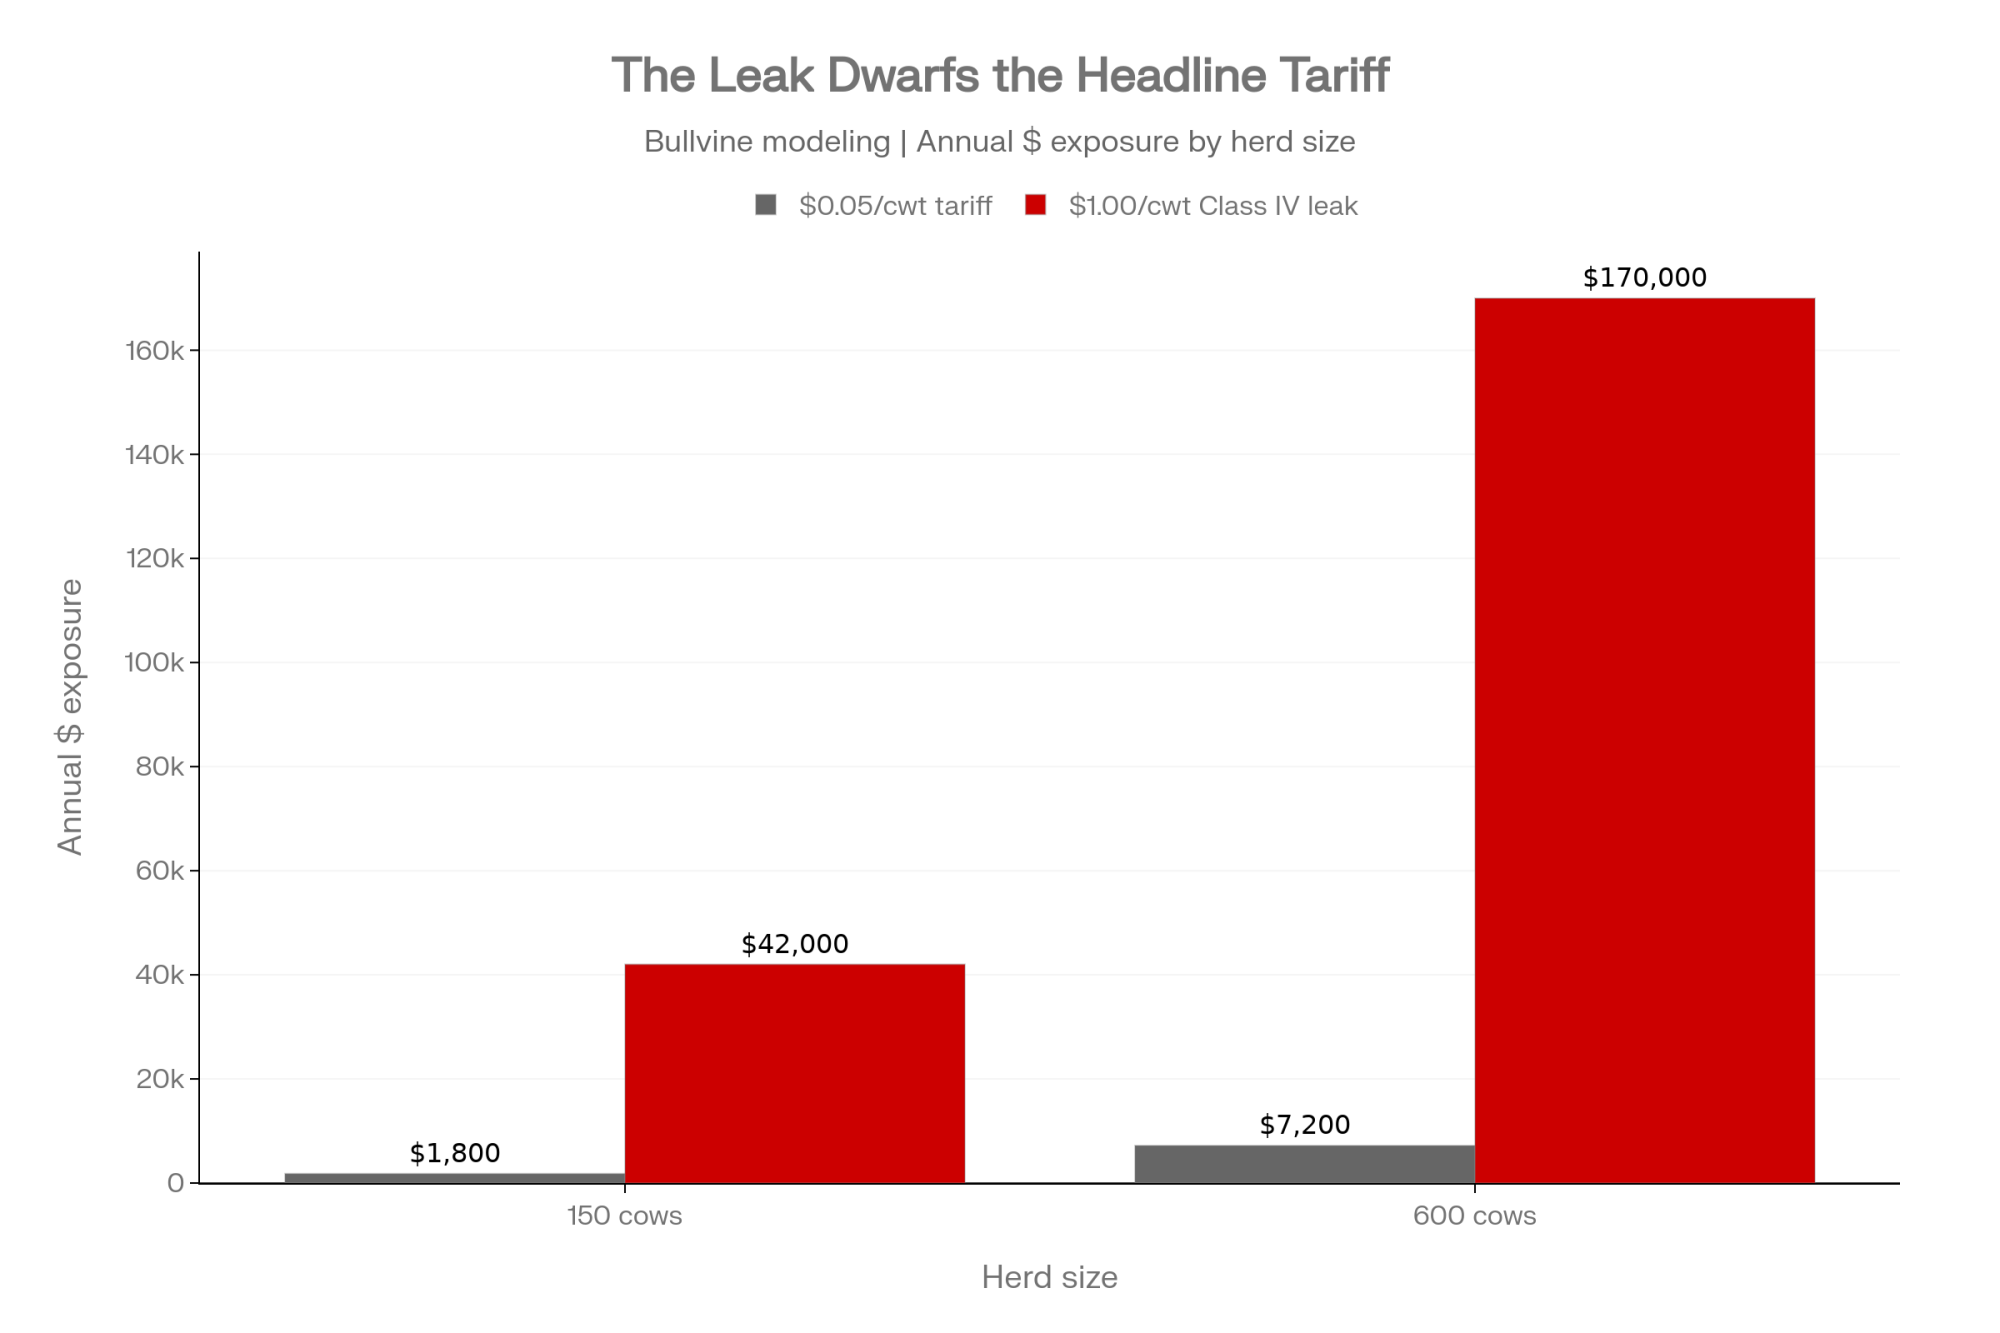
| Financial Exposure | about $0.05/cwt (roughly $1,800/yr on 150 cows) | up to $1.00/cwt (~$42,000/yr on 150 cows) |
| Primary Impact | Border trade optics & policy maneuvering | Direct pressure on U.S. Class IV milk cheque floor |
Both dollar figures are Bullvine modeling on a 150-cow herd producing roughly 36,000–42,000 cwt/year; see methodology note below.
What Actually Got Signed on July 20
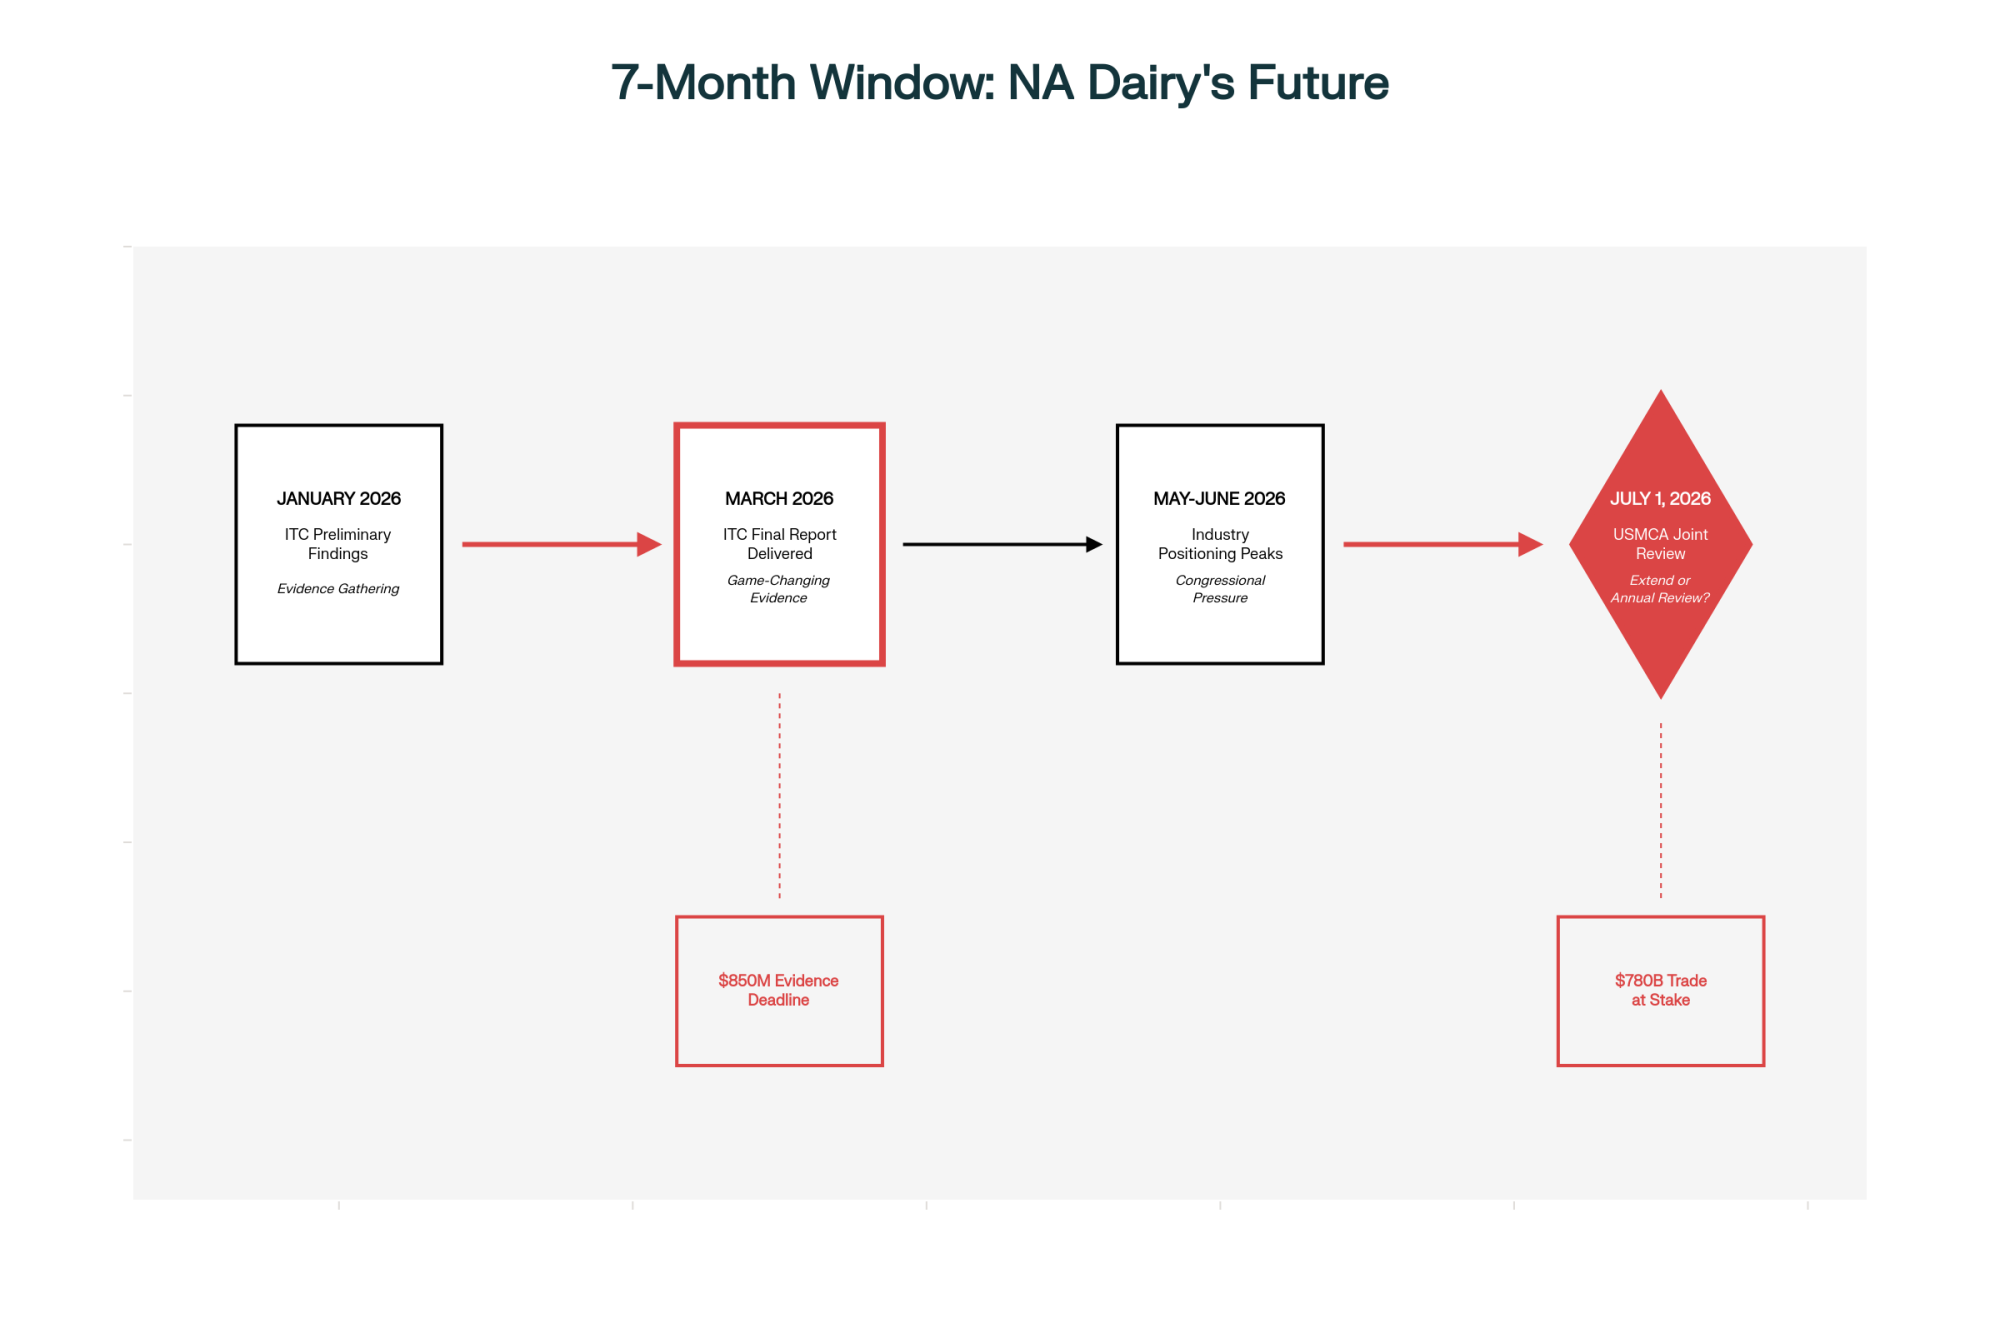
On July 20, 2026, President Trump signed three proclamations under Section 338 of the Tariff Act of 1930 — the first time that authority’s ever been used to actually impose duties, from a Smoot-Hawley-era statute that’s been dormant for the better part of a century. The dairy piece — filed under the proclamation’s new HTSUS Chapter 99 (heading 9903.03) series — hits milk and cream powders, whey, casein, and lactose, and it explicitly rides over USMCA. No exemption for dairy, even though energy, potash, fish, and critical minerals all got carved out. The White House set the effective date 30 days out, which is why August 19 matters — and why there’s still a negotiating runway before it bites.
Read the proclamation’s actual legal justification, though, and it’s narrower than the headlines. Washington’s stated beef is that Canada’s cheese tariff-rate quota under the USMCA bars retailers from holding the quota, while its cheese quota for the European Union under CETA grants those same retailers access. That’s not a broadside at supply management. It’s an eligibility-criteria complaint — almost administrative in its specificity.
And the operations most exposed here aren’t Canadian farms. They’re U.S. Class IV shippers whose price floor already sits underneath a flow of Canadian dairy protein that’s been moving south for years. That flow has nothing to do with the tariff that just got signed.
Two Fights, One Milk Cheque
Start with the headline number. USMCA promised American dairy roughly US$200 million a year in new tariff-free access into Canada, spread across 14 separate dairy TRQs, and, over six years, the fill rate averages near 42% across those categories. Divide that full $200 million across the 232 billion pounds of milk the U.S. produced in 2025, and you get about 8.6 cents per hundredweight — gross. After processing margin, freight, and the plain fact that much of the quota goes unfilled, the slice reaching farm-level milk cheques lands nearer a nickel a cwt. Call it $1,800 a year on a 150-cow dairy shipping around 36,000 cwt, on Bullvine’s modeling of USDA production and USTR access data. Real money. Just not the kind that decides whether your barn pencils out.
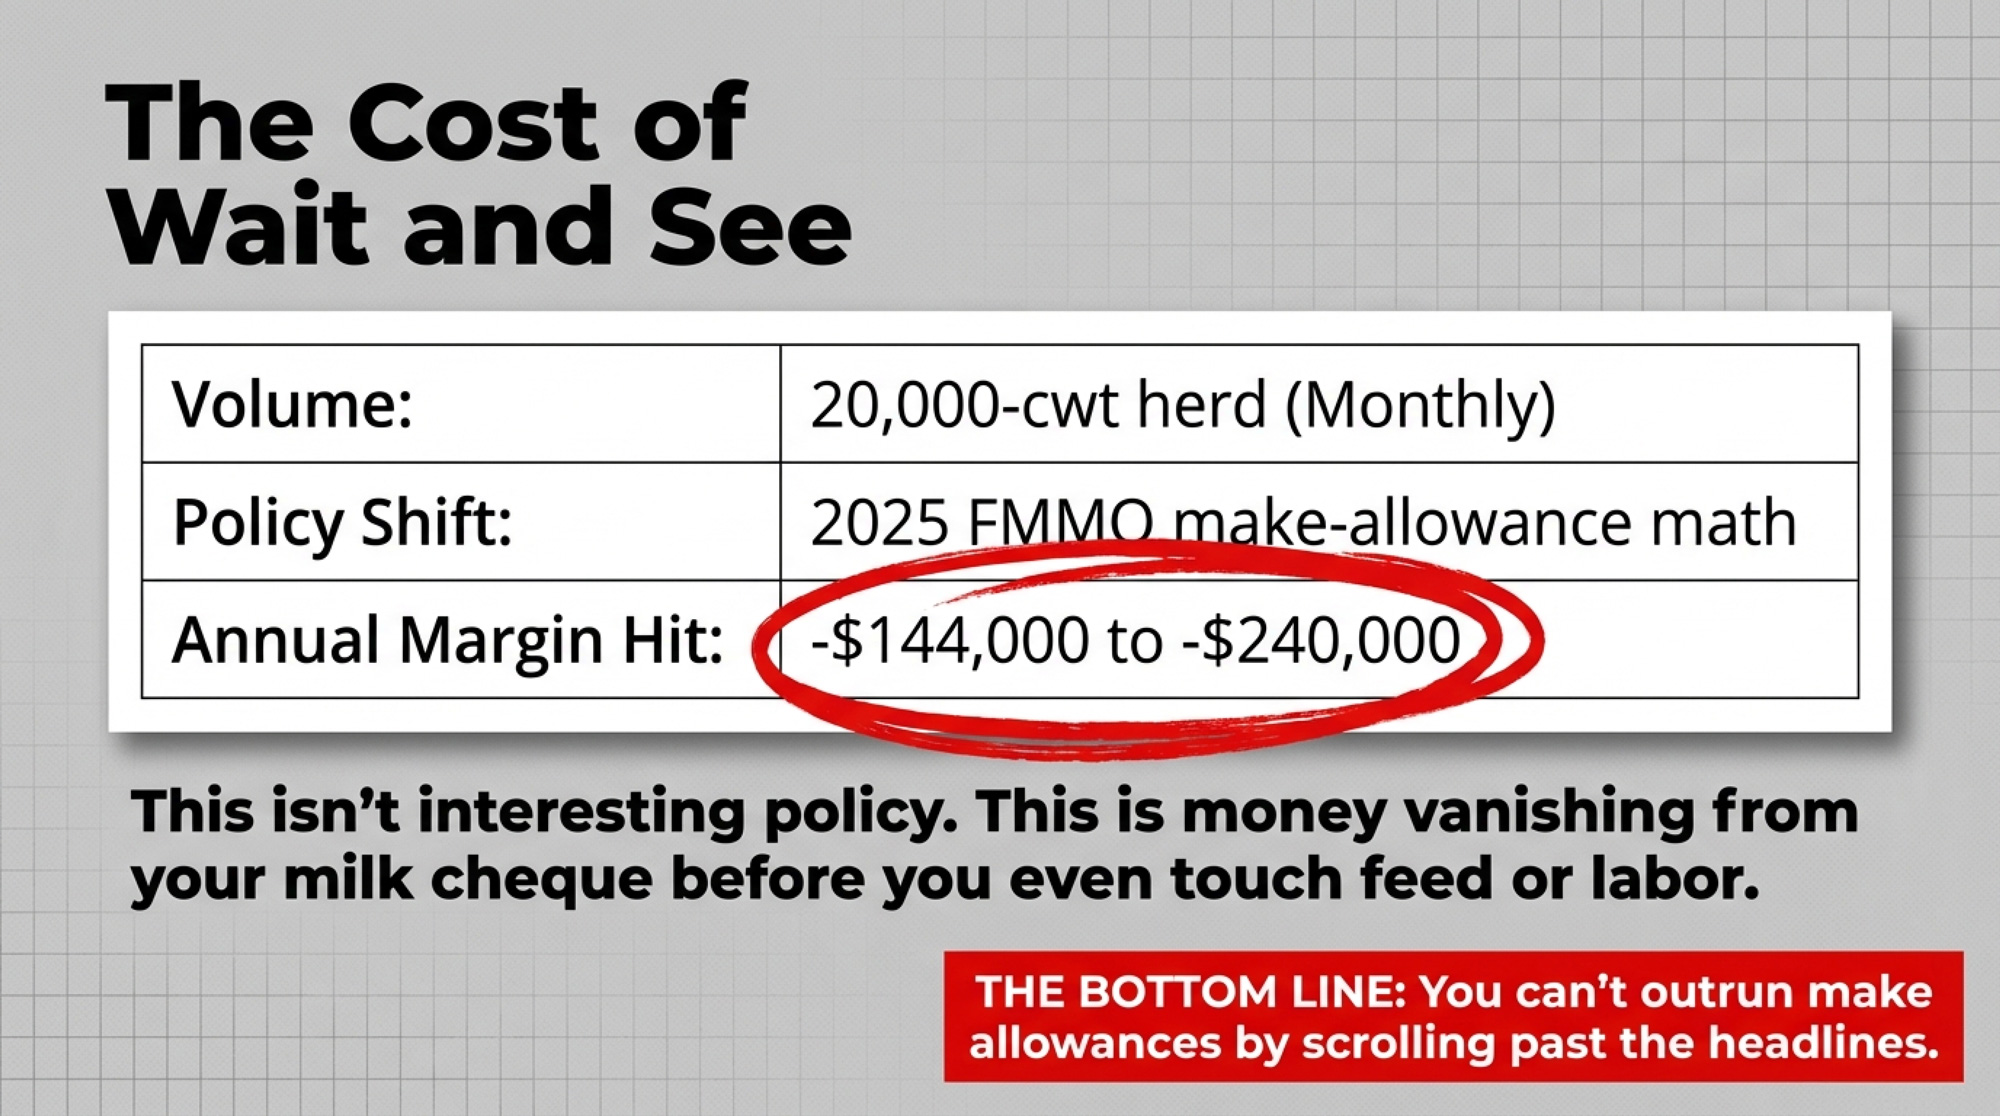
Now the number underneath it. The USITC found in May that Canada’s system “unlinks its relatively high farmgate price of milk from the price that NFS processors pay for milk components in Canada,” creating “a domestic structural surplus of nonfat milk solids components”. According to those same findings, that surplus heads south, much of it under Harmonized Tariff Schedule code 1901.90 and cousins that USMCA’s caps don’t touch, and competes on the U.S. market. It lands on the same Class IV pool your powder milk gets priced against.
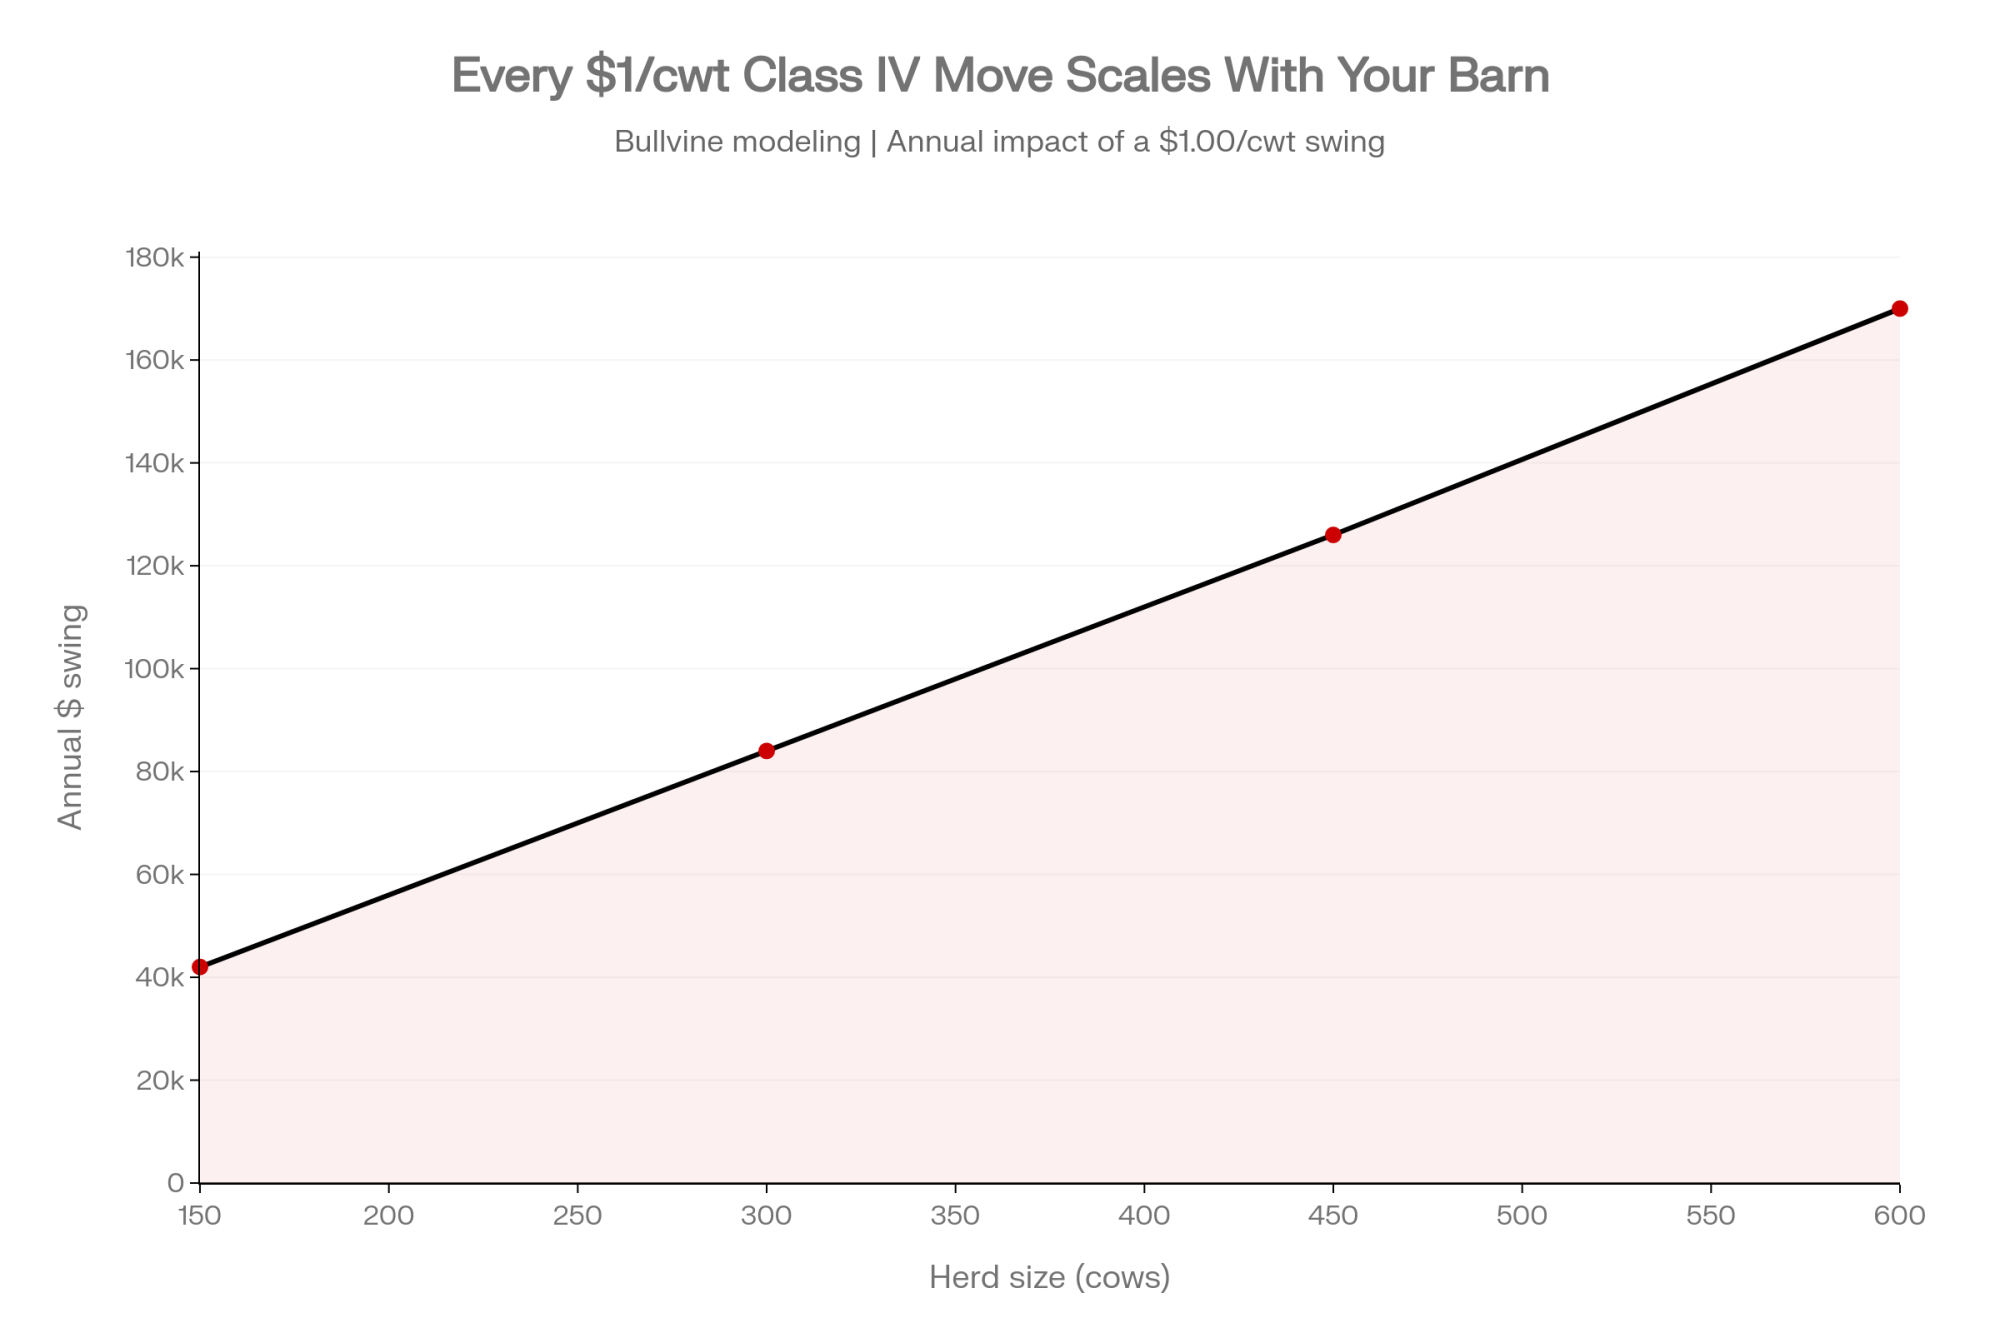
Here’s the barn math that flips the whole story. Take that same 150-cow herd, now shipping heavier — around 42,000 cwt when it’s running full Class IV. A $1.00/cwt swing in Class IV runs about $42,000 a year on that herd — and roughly $170,000 on a 600-cow Western operation shipping around 170,000 cwt. Most herds sit below that ceiling depending on their Class III/IV mix, so treat $42,000 as the top of the range, not the middle. Even so: same barn, same year, two fights. One’s worth a nickel. The other moves a full dollar.
How the Leak Actually Works
Here’s “unlinking” in plain terms. Canada prices raw milk high at the farm gate — that’s the whole point of supply management, and it’s kept Canadian dairy income far steadier than the U.S. rollercoaster for three decades. But pricing milk for its fat throws off more nonfat solids — protein, skim — than Canada’s home market wants at that regulated price. That surplus has to go somewhere.
Where it goes is south. And the mechanics are simple enough to explain to your banker or board in one breath:
The Reclassification Trick
- Standard skim powder (Chapter 04): Subject to USMCA tariff-rate quota caps — 35,000 tonnes, with a surcharge above it.
- Blended protein (Chapter 19 / HTS 1901.90): Combining ~56% skim milk powder with ~44% milk fat bypasses those Chapter 04 caps entirely, competing directly against U.S. Class IV powder pricing.
Same solids, different code — a classification Canada treats as fully compliant, and one Washington is now contesting.
So the U.S. had three separate grievances stacked on one industry: the TRQ market-access fight, this reclassification pathway, and the cheese-quota eligibility dispute. It had all three documented. When it finally pulled the trigger on July 20, it reached for the third — the narrowest one. Canada, for its part, has consistently defended its allocation and classification practices as USMCA-compliant — a position a dispute panel largely upheld in November 2023. That mismatch is the tell that August 19 doesn’t actually resolve anything.
How Much Does Waiting Until August 19 Actually Cost You?
On the tariff itself, less than the headlines imply. The long-running read on the TRQ fight is that fixing allocation does little to change the makeup of Canadian imports, because U.S. product still loses on price and logistics — and Canada won that November 2023 dispute panel on exactly that terrain, 2-1. The real cost of waiting sits on the Class IV side, and it’s harder to see because it never shows up as one big event. It’s a slow drag on your floor that’s been running for years.
So don’t hang your risk decision on the tariff date. Hang it on your own Class IV exposure. The calendar question isn’t “August 19” — it’s “how many more settlement cycles am I leaving unhedged while I wait to see what Ottawa and Washington do?”
Is Your Milk More Exposed Than You Think?
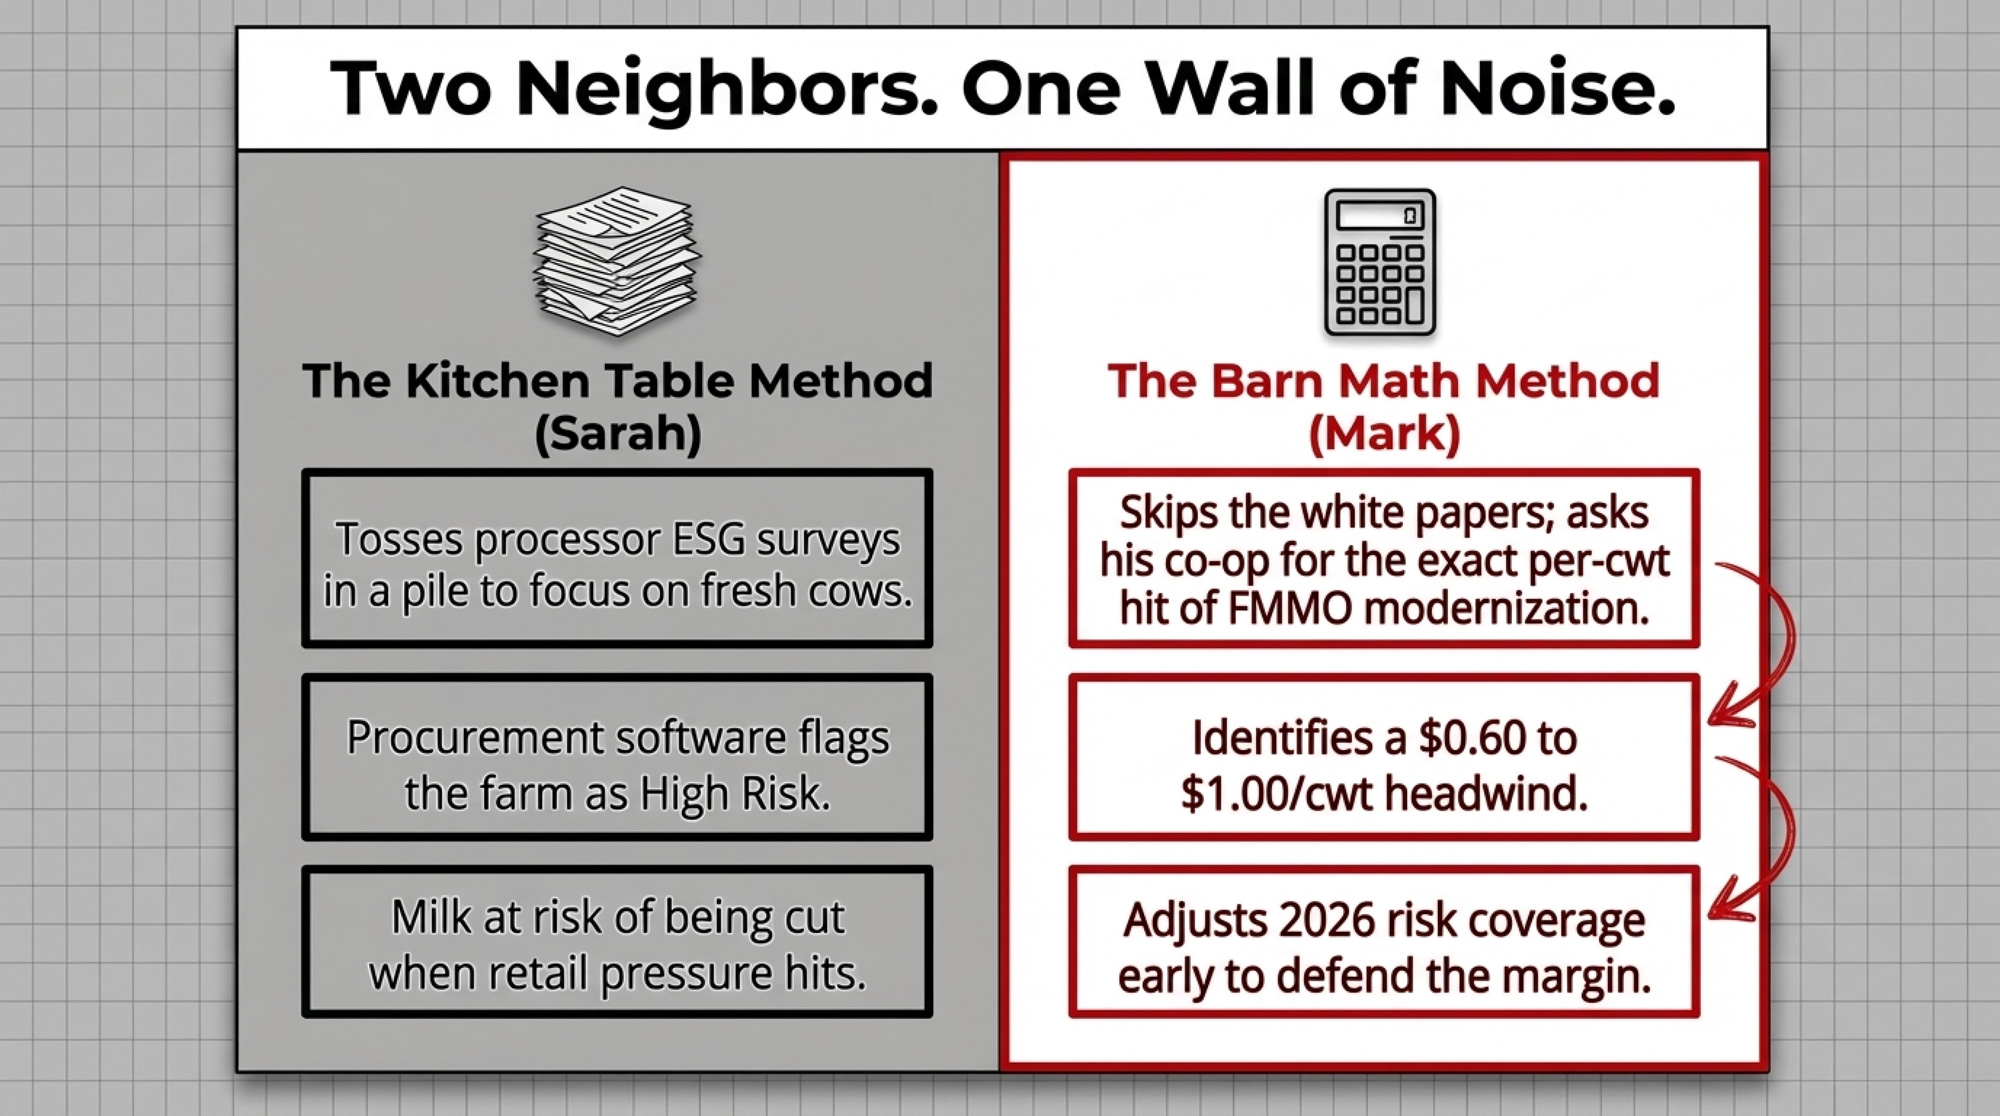
Pull your last three settlement statements before you do anything else. Work out what share of your cheque actually rides on Class IV versus Class III, because that ratio decides whether any of this touches you. A herd that’s 70% Class III barely feels the leak. One shipping heavy into butter and powder feels most of it.
That’s not a number you can eyeball from the barn. It’s a number you read off a statement — and most producers haven’t looked hard at that split in a year.
Options and Trade-Offs
You can’t renegotiate CUSMA from the parlor. But you can decide how much of your risk you’re leaving hostage to a Class IV price you don’t set. Here’s what producers are weighing right now.
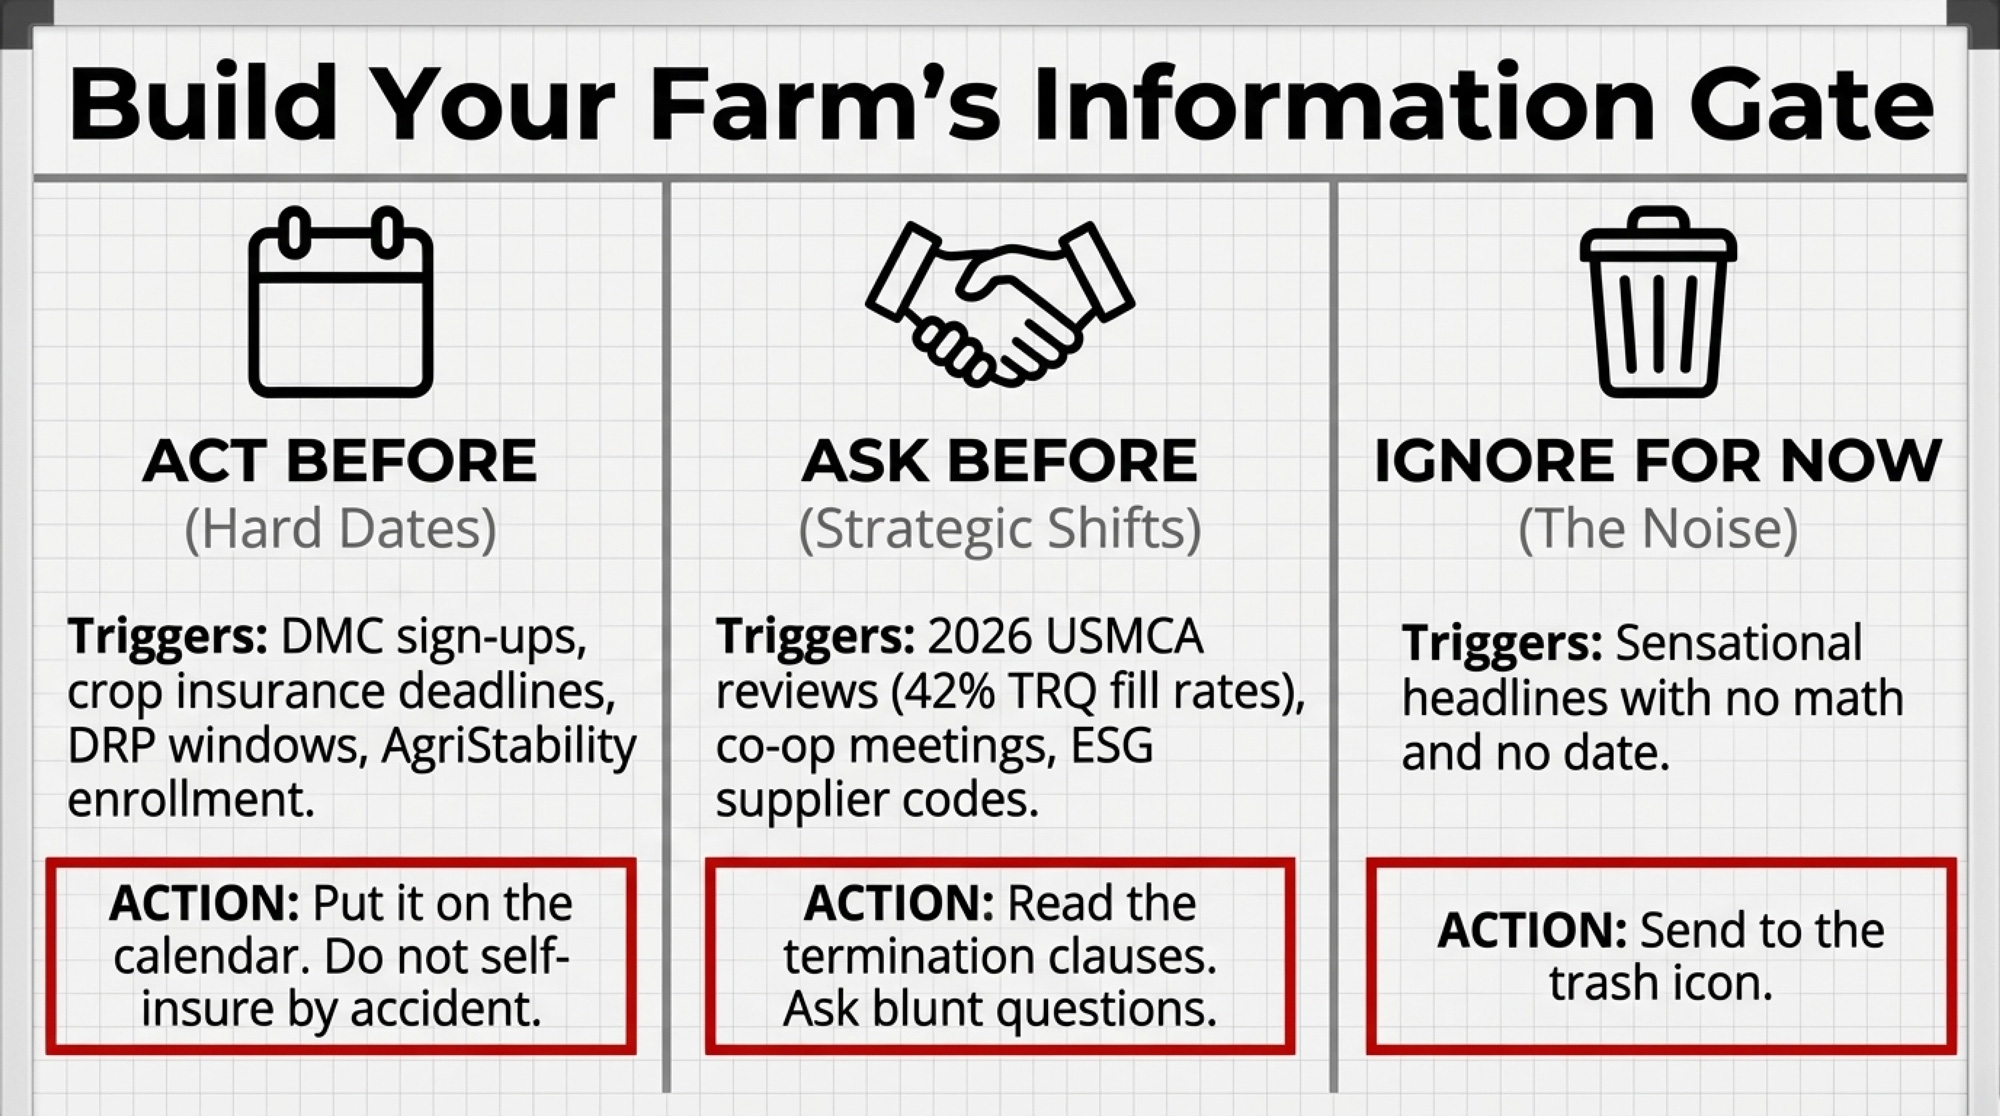
- Review your Dairy Revenue Protection position in the next 30 days. HighGround Dairy reported Q1 2026 DRP indemnities averaging $1.12/cwt against $0.28/cwt in premiums — a net $0.83/cwt to producers who carried coverage. When it makes sense: if a soft Class IV quarter would hurt. What it takes: a call to your crop-insurance contact this month, ahead of August 19. The catch: premiums are a real cost, and DRP smooths volatility — it doesn’t erase it. And the payout swings hard year to year — Q1 2025 indemnities averaged just $0.13/cwt, versus a record $2.03/cwt in Q4 2025.
- Read the cap language, not the fill-rate headlines. When the next negotiating round drops documents, read the annexes to see whether protein is counted by function — including blends and isolates — or just by label. When it makes sense: if you’re Class IV-heavy. The limit: if the language stays vague, that itself tells you the gap isn’t closing.
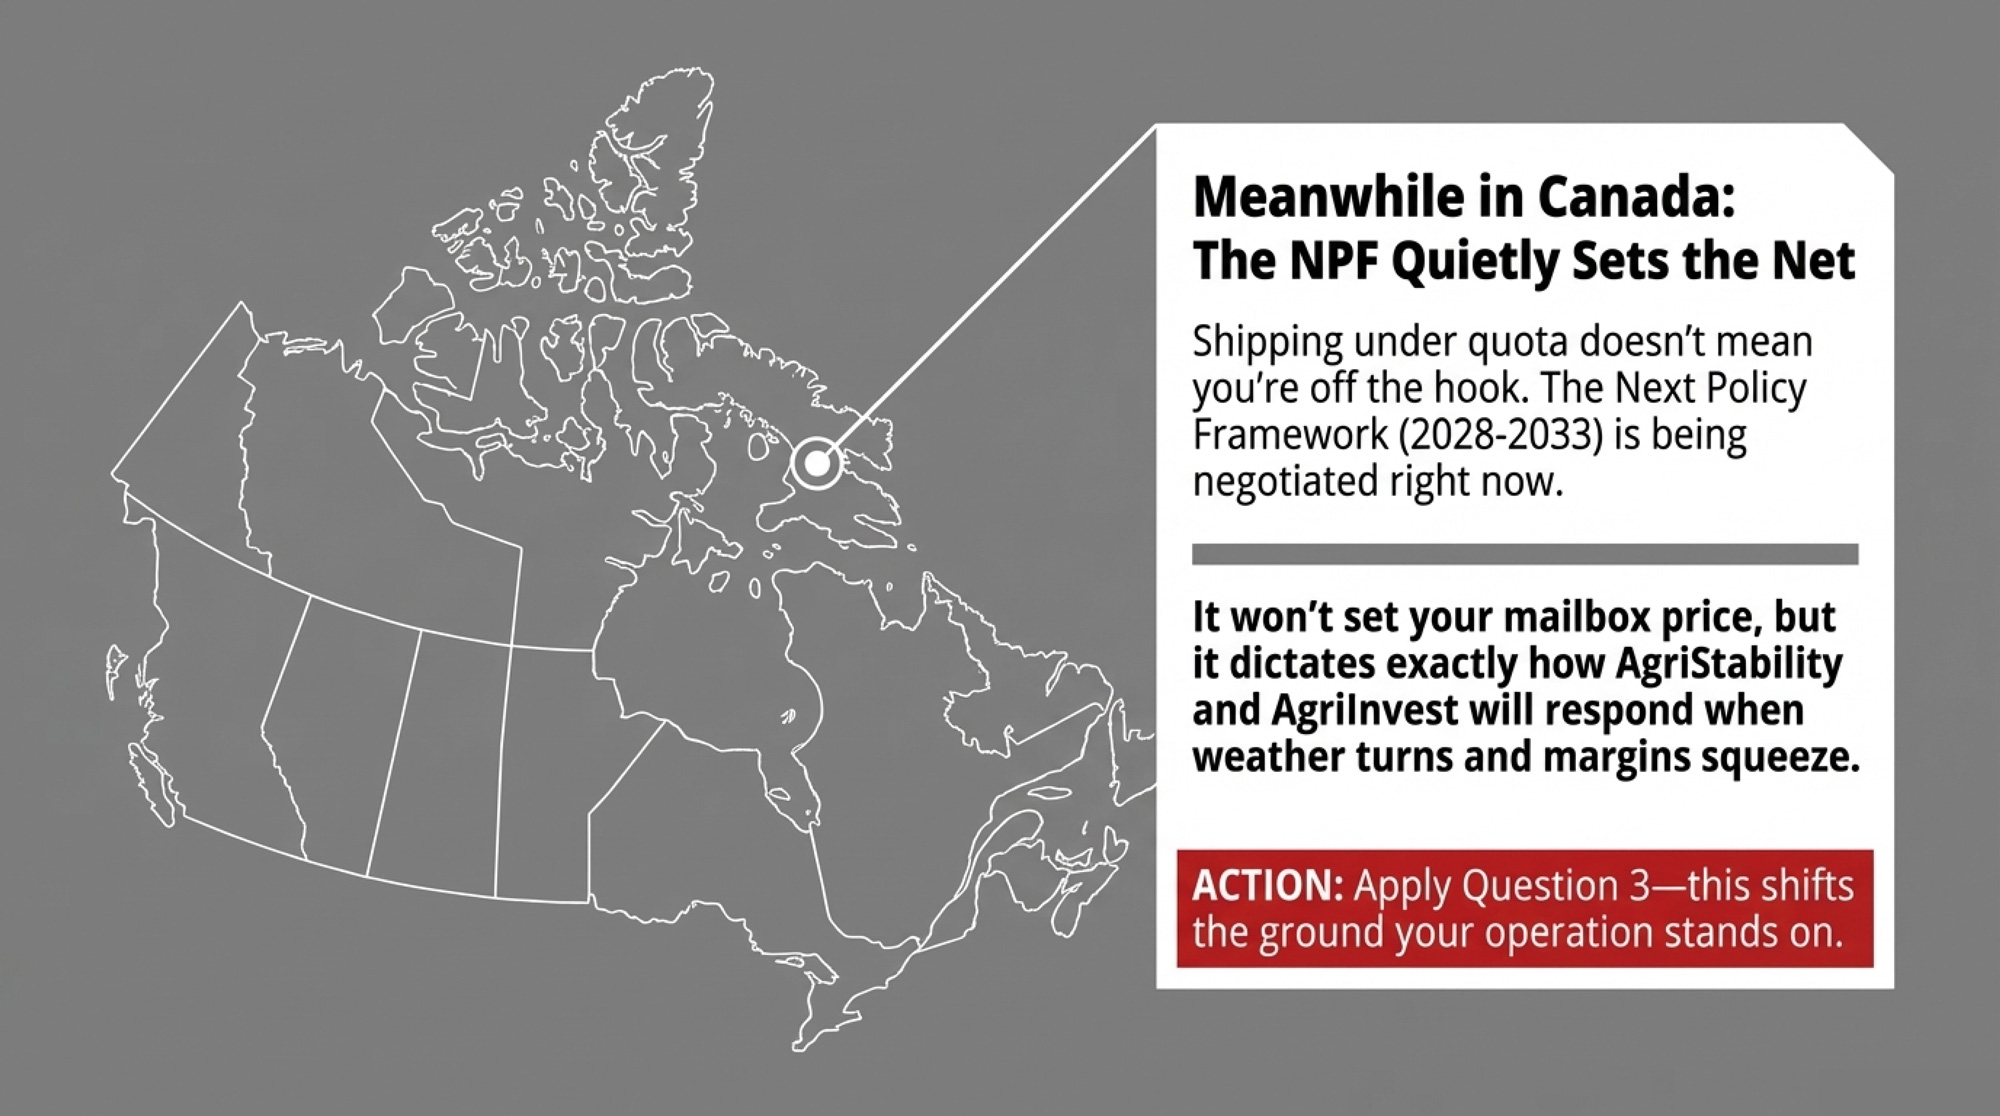
- Canadian producers: watch the component ratio, not the border. The 2026 shift toward protein value — the Western Milk Pool’s move from 85/10/5 to 70/25/5, effective April 1 — is already reshaping your cheque more than any tariff will, with high-fat, low-protein herds facing shortfalls up to $900 per cow. When it makes sense: for herds long on fat, short on protein. The catch: waiting a breeding cycle to react costs real revenue per cow.
Is This a New Fight, or the Next Chapter of an Old One?
| Year | Mechanism Used | Outcome |
| 2018–20 | USMCA eliminates Class 6/7 pricing | U.S. win on paper |
| Jan 2022 | Dispute panel challenge | U.S. won |
| Nov 2023 | Second dispute panel (rewrite) | Canada won 2-1 |
| May 2026 | USITC report on nonfat-solids surplus | Findings only, no remedy |
| Jul 2026 | Section 338 proclamation | 50% tariff, effective Aug 19 |
Sit with this part. The same U.S. complaint has surfaced in the NAFTA renegotiation, the elimination of Canada’s Class 6/7 pricing in the USMCA, a January 2022 dispute panel that the U.S. won, a November 2023 panel that ruled 2-1 for Canada’s rewrite, the May 2026 USITC report, and now Section 338. Five or six tools across three administrations and a solid decade.
The tell isn’t the tariff. It’s that after winning round one in 2022 and losing the rewrite argument in 2023, the U.S. has reached for everything except that dispute process ever since — escalating even while the scheduled 2026 joint review is still open. When a grievance outlives the process built to settle it, it stopped being about the facts of any single case a long time ago. August 19 is a chapter marker, not an origin point.
Key Takeaways
- Audit your Class III/IV split. Pull your last three settlement statements. You can’t hedge a Class IV risk if you don’t know your herd’s exact exposure percentage.
- Review DRP coverage within 30 days. Use August 19 as a firm operational deadline to evaluate Dairy Revenue Protection options with your agent before Q3/Q4 settlement cycles.
- Canadian herds — adjust breeding strategy now. Address fat-versus-protein ratios under the Western Milk Pool’s 70/25/5 structure before the next breeding cycle penalizes low-protein production.
- Monitor the trade negotiation text. Watch whether future USMCA/CUSMA updates cap protein by functional output — blends included — or strictly by product label.

So here’s the question worth taking to your advisor this week. If the Class IV floor you’re priced against has been quietly leaking for years — and the tariff everyone’s talking about doesn’t plug it — where does that leave your breakeven heading into a soft second half? Are you managing the risk you can actually see, or the one that made the front page?
We laid out the full protein-reclassification mechanism and the Class IV math by herd size in our companion piece, A Nickel vs. $170K: The Two USMCA Dairy Fights, Priced Out — the line-by-line version of that $1,800-versus-$42,000 gap, run on your own numbers. That’s where the real math lives.
Run Your Numbers
Dairy Profit Projector — Drop in your herd size, Class III/IV split, and futures, and the projector puts a real dollar figure on what a $1/cwt Class IV move does to your next 12 months — whole-herd margin, IOFC, and breakeven. Stress-test the swing this piece is built on before August 19, not after .
Learn More
- Class III Milk Price, DRP, and Your Spring 2026 Risk Plan — Breaks down five vital metrics required on paper before calling your insurance agent, delivering actionable DRP hedging lanes to capture downside protection without surrendering market upside.
- FMMO Reality Check: Why 2025’s $2.3 Billion Dairy Pricing Revolution Exposes the Fatal Flaw in American Milk Marketing — Exposes how Federal Order make-allowance updates silently transfer $91 million annually from producer milk pools to processing plant margins, arming you with long-term structural positioning strategies.
- Dairy Cattle Genetics Explained: TPI, NM$, GTPI and Genomics — Dismantles the selection tension between TPI and NM$ component formulas, showing how genomic testing and strategic culling unlock an $869 lifetime profit gap per head.
 The Sunday Read Dairy Professionals Don’t Skip.
 The Sunday Read Dairy Professionals Don’t Skip.
Every week, thousands of producers, breeders, and industry insiders open Bullvine Weekly for genetics insights, market shifts, and profit strategies they won’t find anywhere else. One email. Five minutes. Smarter decisions all week.