Archive for FMMO reform

The $1,500‑Per‑Cow Whey Trap: Why $11/lb Whey Only Shows Up as 69¢ on Your Milk Check

$11/lb whey. 69¢ on your milk check. We ran the FMMO barn math on a 300‑cow herd to see where the other $1,500 per cow actually went. 

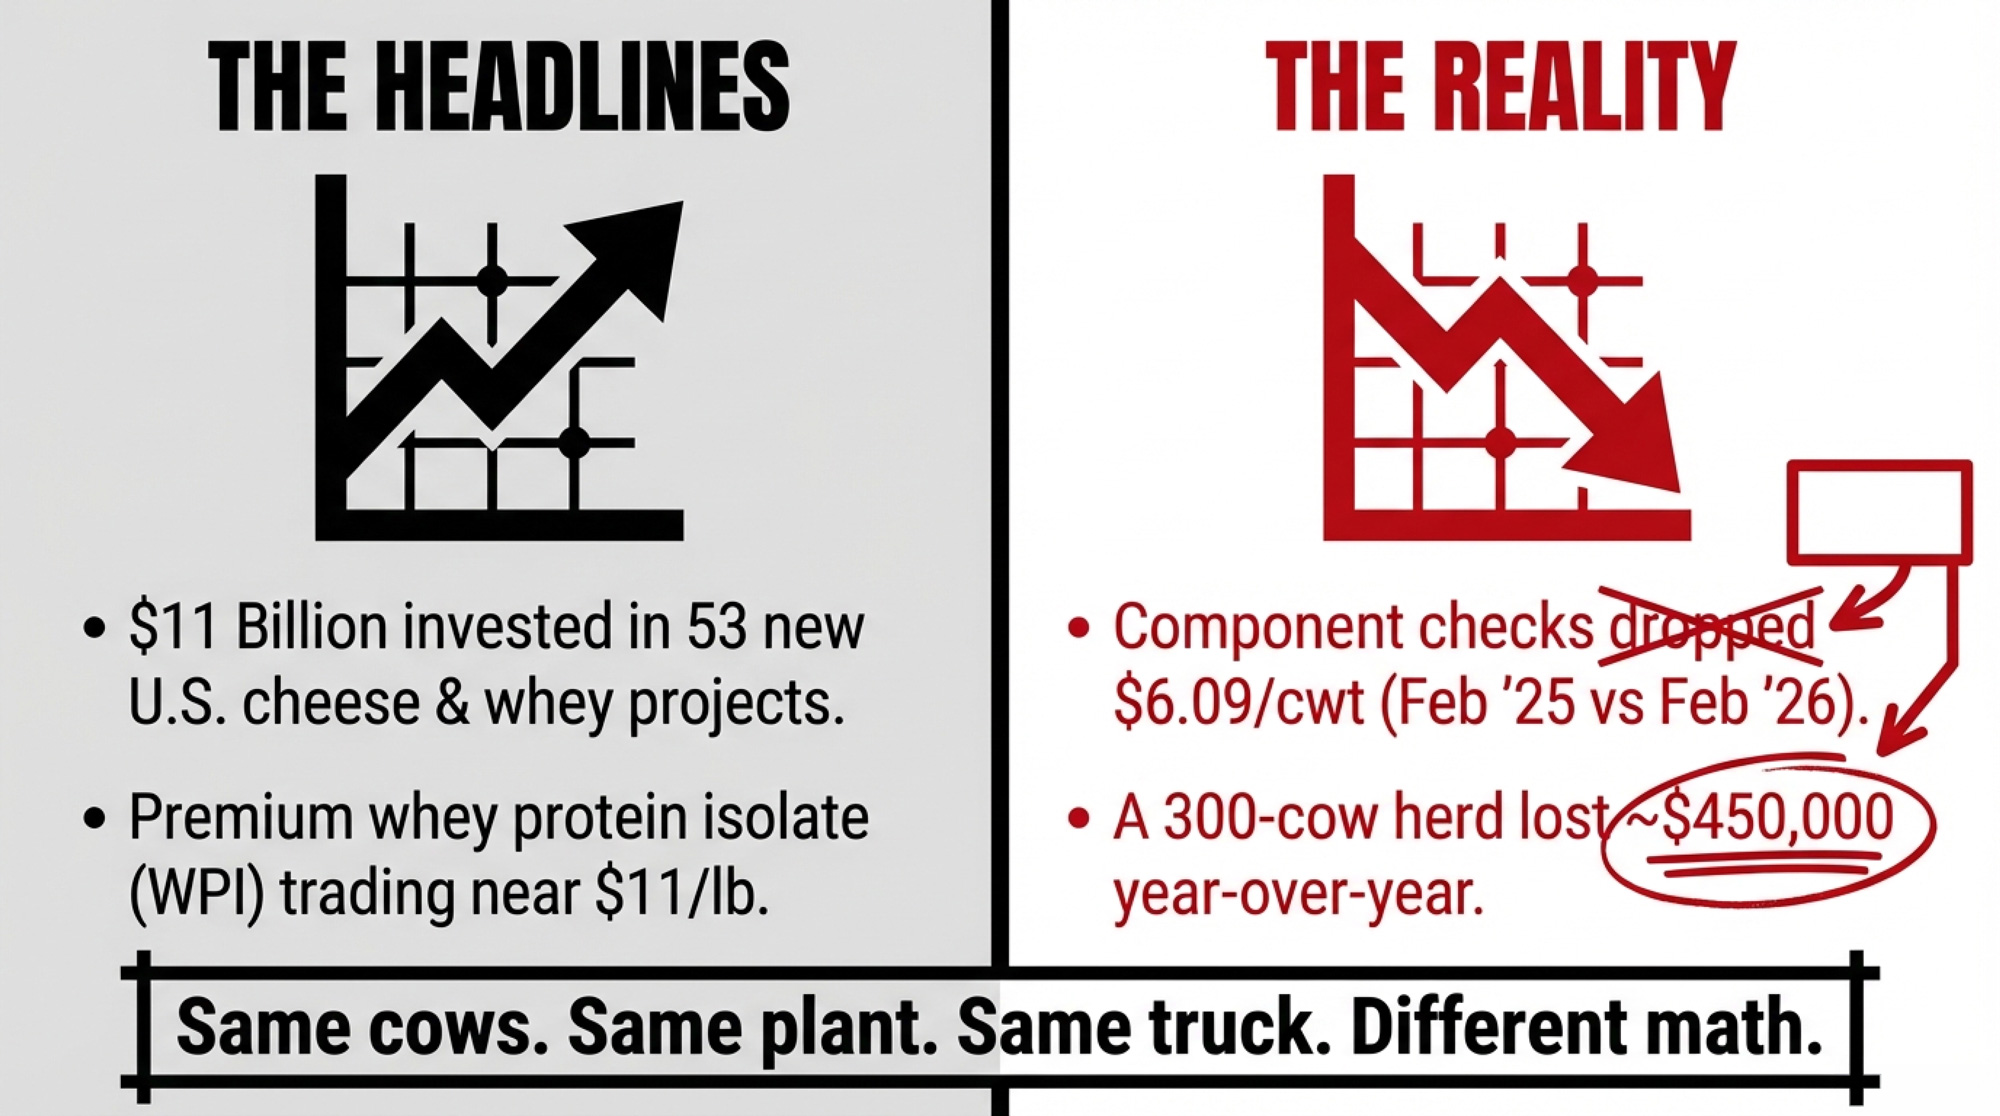
Executive Summary: Your component check dropped about $1,520 per cow from February 2025 to February 2026 while premium whey climbed to $11/lb and plants poured $11 billion into new cheese and whey capacity. FMMO’s new make‑allowance formula now prices other solids off 69‑cent dry whey and higher processor costs, cutting roughly 24¢/cwt from your other‑solids line even as whey markets rally. Butterfat and protein did the rest of the damage, taking total Class III components down about $6.09/cwt — a $450K‑plus swing on a 300‑cow herd. At the same time, beef‑on‑dairy calves are throwing off $500–$800/head, helping cash flow but leaving the U.S. roughly 800,000 heifers short heading into a capacity build‑out. The article walks through barn‑level scenarios if whey and cheese both correct, including how negative PPDs could stack another $1–$2/cwt on top of what you’ve already lost. Then it lays out a 30/90/365‑day playbook: audit your component line against AMS values, stress‑test your DMC and DRP coverage, and rebuild any expansion math around ~$15.50/cwt components instead of 2025 peaks. If you’ve got 200–500 cows on a component order and you’re not sure how much of that $11/lb whey is in your milk check, this is the 10‑minute read to run before your next contract or barn decision.

Milk check analysis

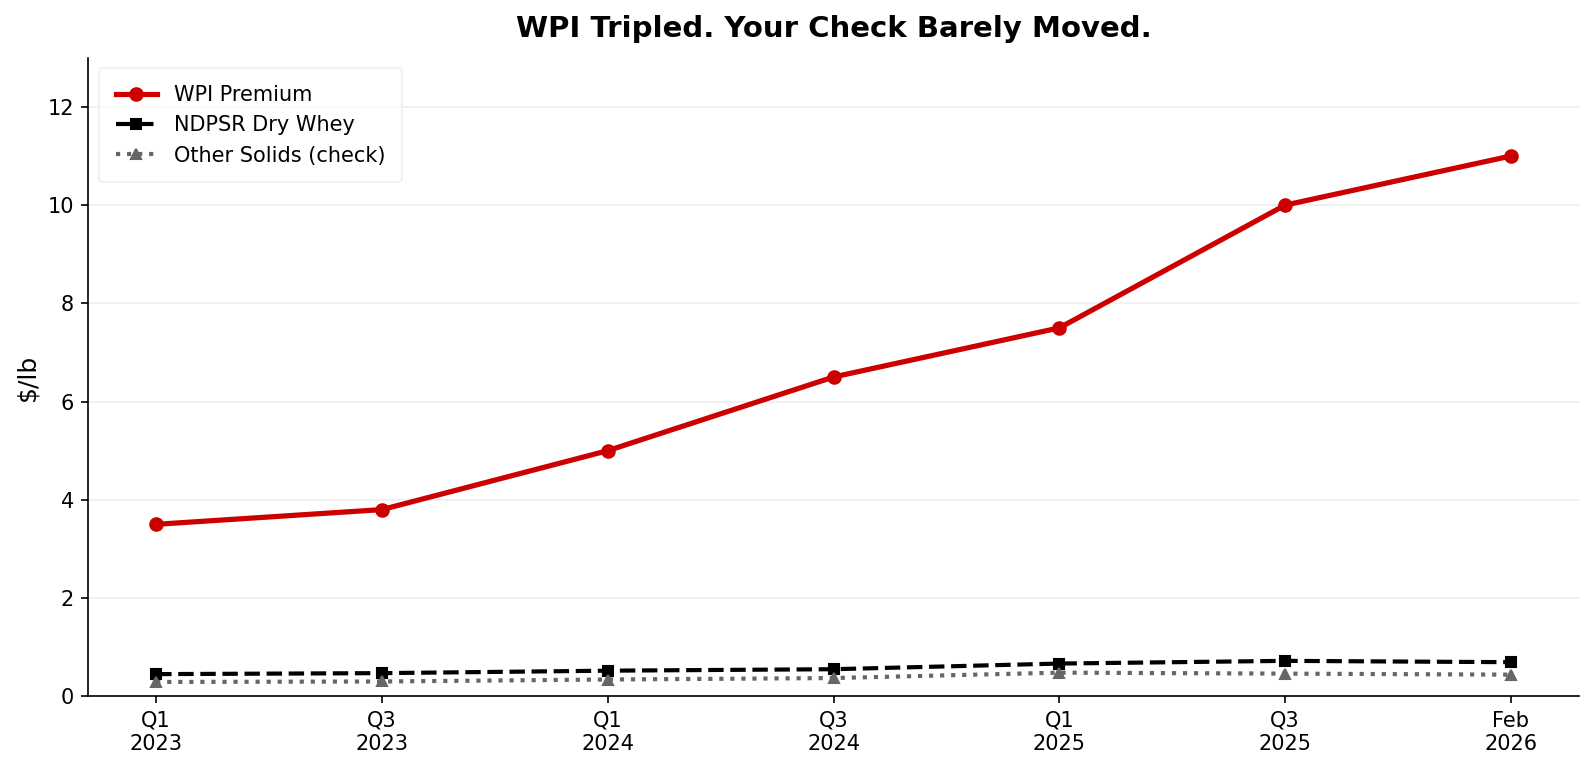
Eleven dollars a pound. That’s where high‑grade whey protein isolate has traded since late 2025, according to Ever.Ag Insight — roughly triple the price three years ago. Cheese plants are sometimes pulling more revenue from the whey stream than the cheese block itself. 

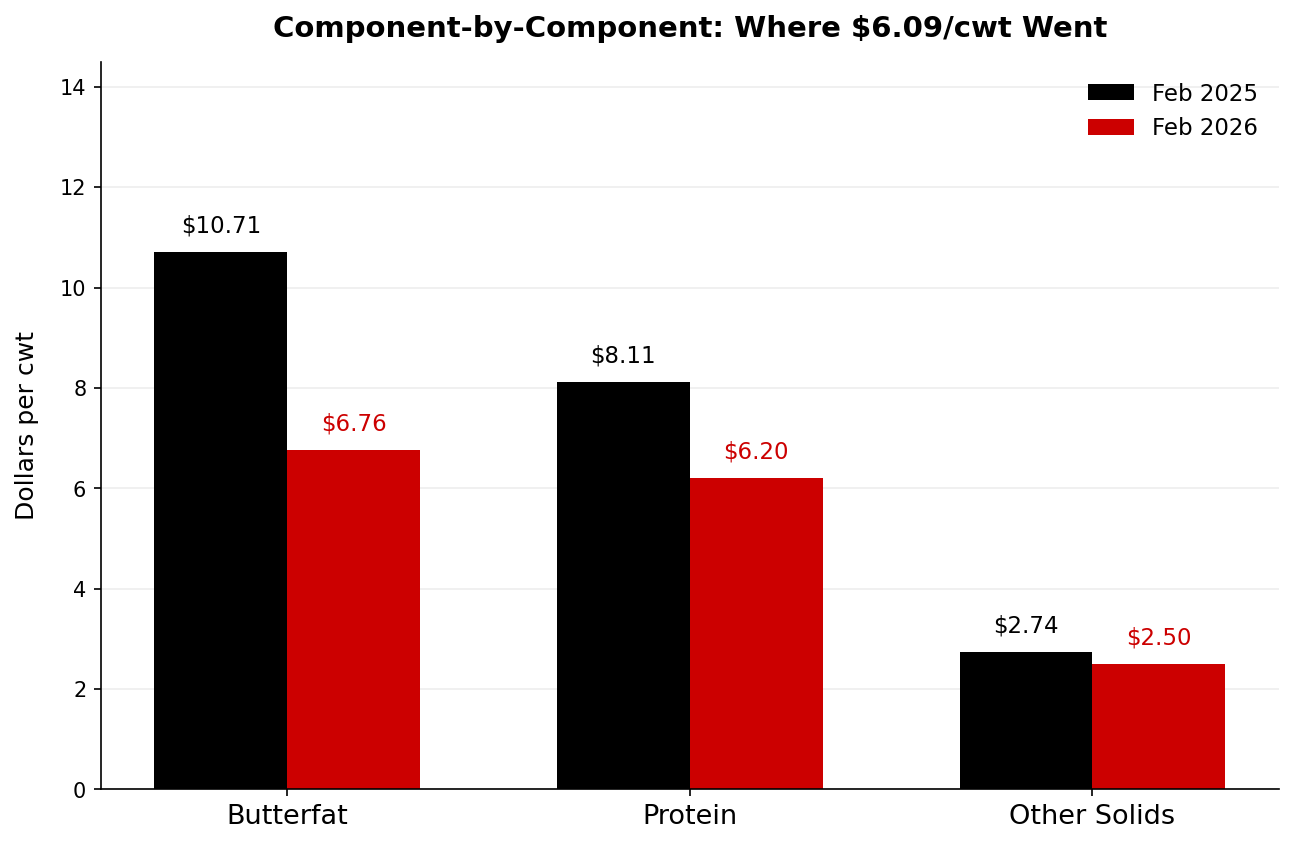
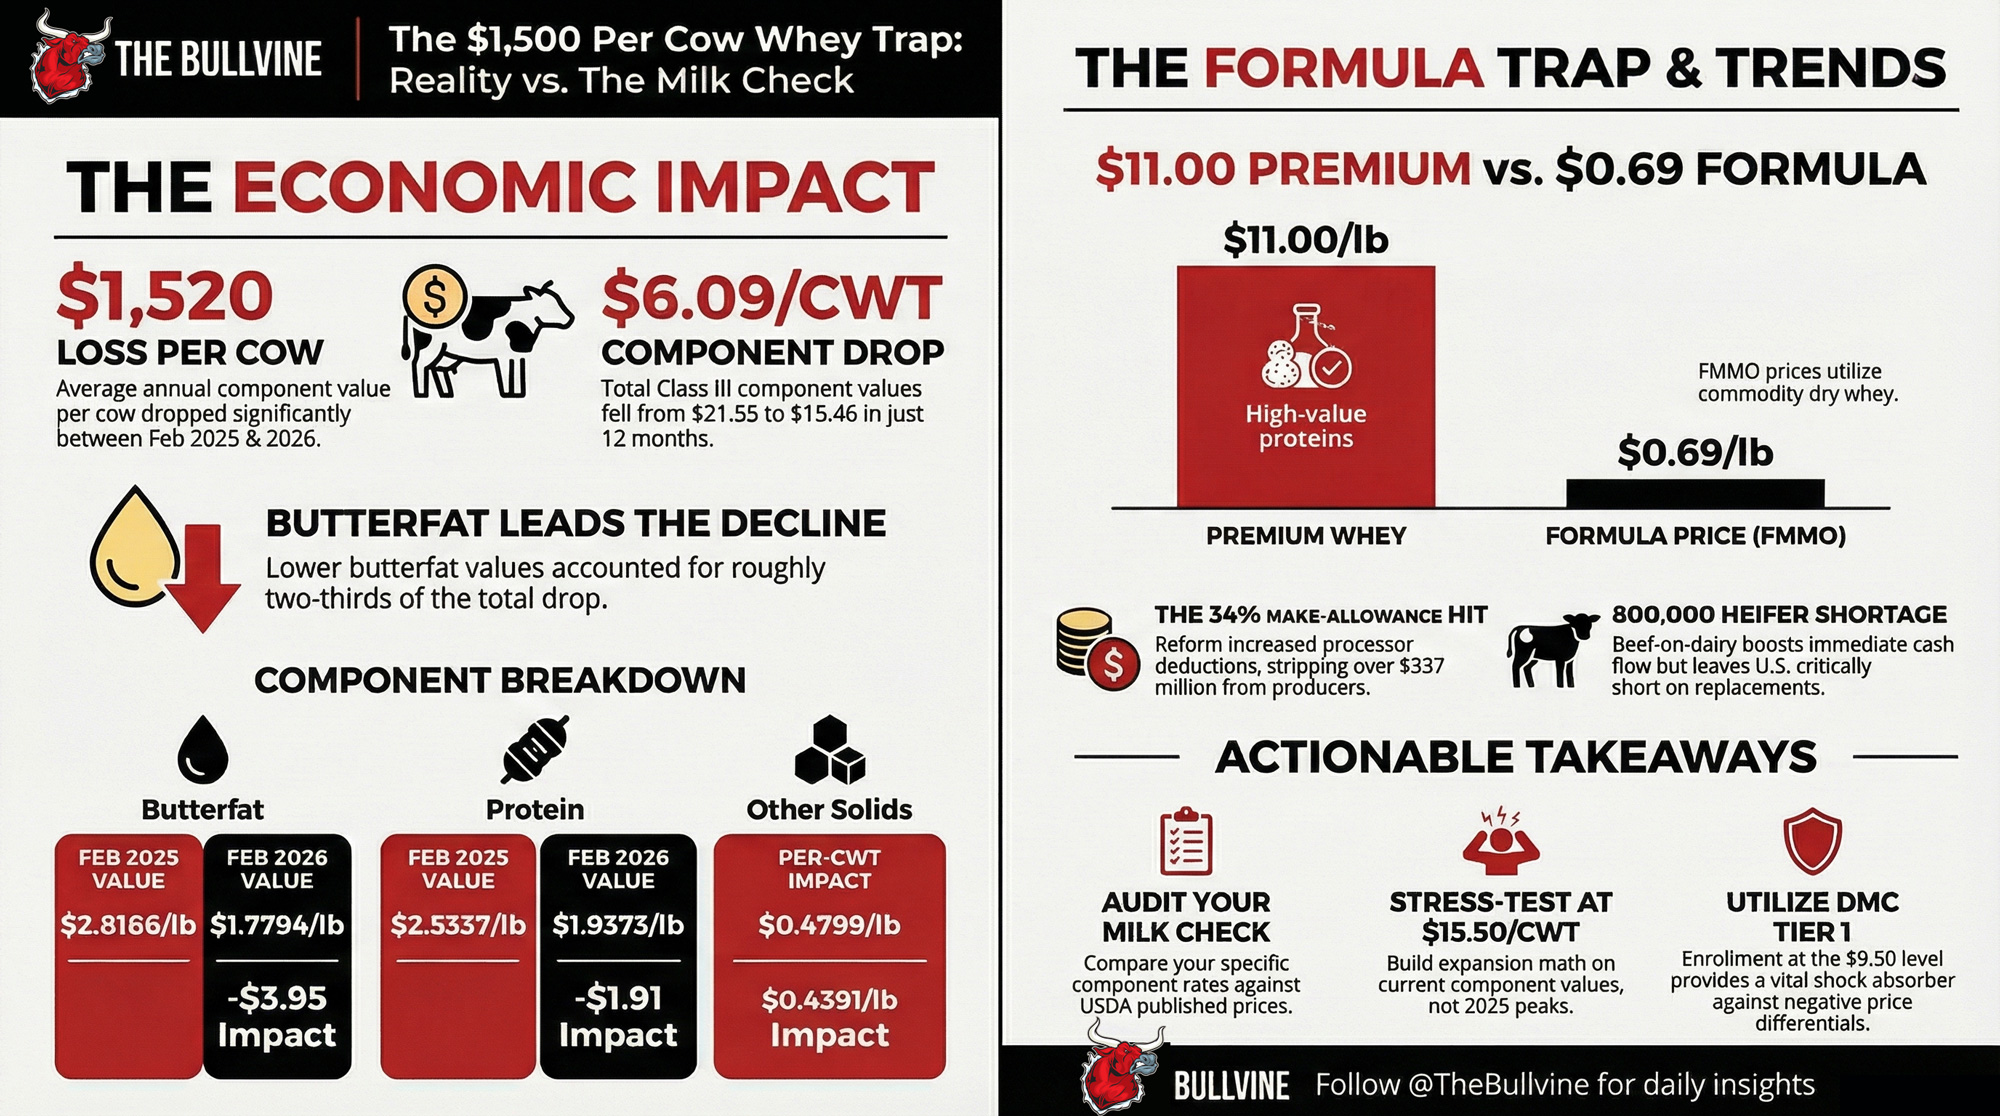
But pull your early‑2026 milk check, and a different number stares back. USDA’s February 2026 Class III component values, at standard test of 3.8% fat, 3.2% protein, and 5.7% other solids, work out to about $15.46/cwt — down from $21.55/cwt in February 2025. That’s a drop of $6.09/cwt, or roughly $1,520 per cow on 25,000 lb shipped. 

At the National Farmers Union’s 124th annual convention this March, Wisconsin Farmers Union president Darin Von Ruden dropped a number that landed hard: about $50,000. That’s how much less a 300‑cow dairy operator in southwest Wisconsin received on his January 2026 milk check compared with January 2025. Same cows. Same plant. Same truck. The formulas changed. As Von Ruden told Brownfield Ag News, this wasn’t a model herd or a spreadsheet example — it was a neighbor he’d spoken with the week before. 

And the $11 billion pouring into 53 new and expanded U.S. dairy processing projects across at least 19 states, according to IDFA, hasn’t changed that producer’s other‑solids line by a dime. 

How Much Whey Value Actually Reaches Your Milk Check?

Almost none. And the formula explains why.

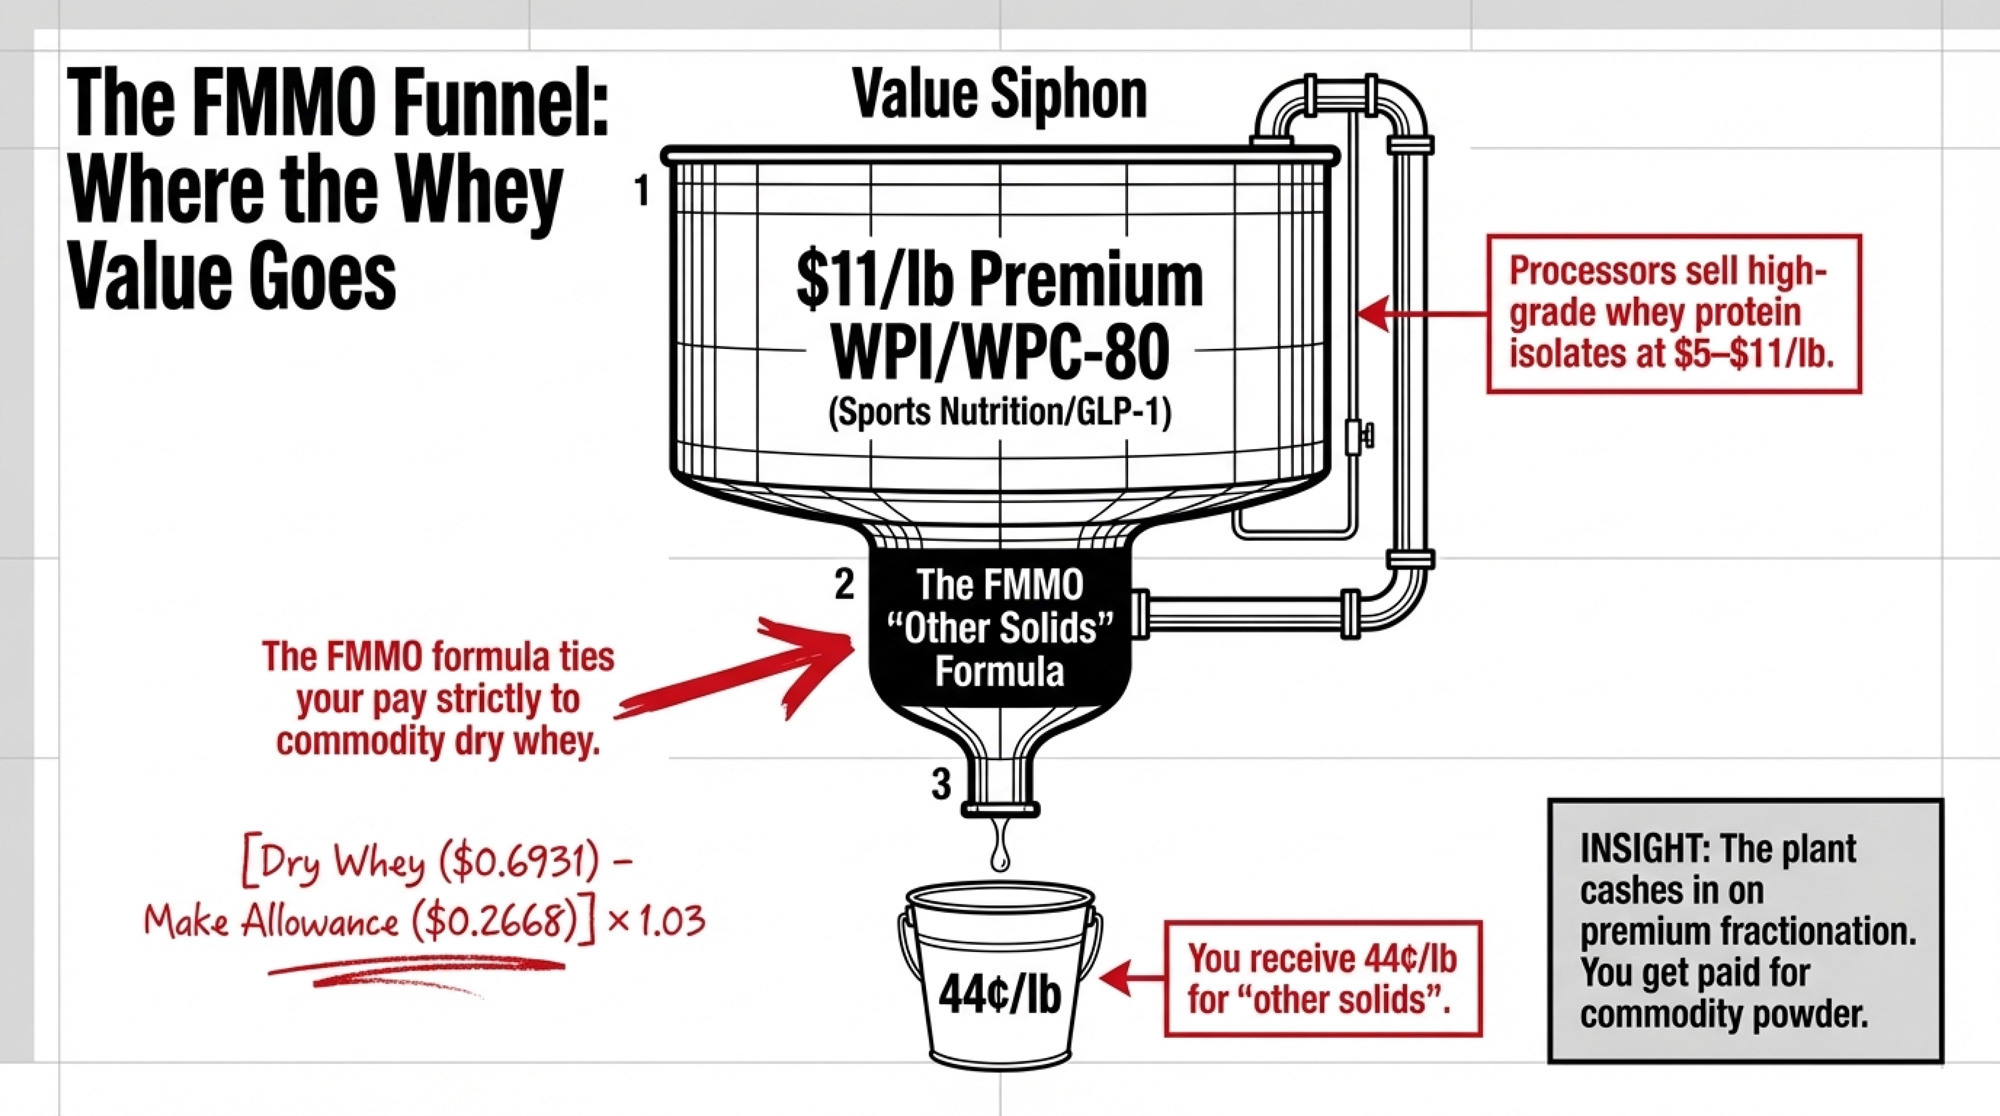
Your “other solids” component — the FMMO line where whey economics should show up — is calculated from commodity dry whey, not the premium WPI or WPC‑80 driving the headlines. Under USDA’s January 2025 Final Rule, effective June 1, 2025: 

Other‑solids price = (Dry whey price − $0.2668) × 1.03

USDA’s February 2026 “Announcement of Class and Component Prices” puts NDPSR dry whey at $0.6931/lb. Run the math: 

  • $0.6931 − $0.2668 = $0.4263
  • $0.4263 × 1.03 = $0.4391/lb of other solids.

That matches the published number exactly. Meanwhile, premium WPI trades near $11/lb, and WPC‑80 has approached €20,000/ton in Europe. Those are totally different products from the commodity dry whey that feeds the FMMO formula. 

Your other‑solids line is tethered to 69‑cent dry whey and pays 44¢/lb. Your processor’s ingredient desk is selling $5–$11/lb whey proteins into sports nutrition and GLP‑1 diets. That’s the first piece of the disconnect — and it’s the piece Rabobank’s Lucas Fuess has been warning about in interview after interview since late 2025. 

The Make‑Allowance Hit You Voted For

There’s a second piece, and this one was literally on the referendum ballot.

Dry whey did move up year‑over‑year. February 2025’s NDPSR average: $0.6650/lb. February 2026: $0.6931/lb  — an increase of 2.8¢/lb. But your other‑solids value didn’t climb. It slid. 

  • February 2025 other‑solids price: $0.4799/lb (old formula). 
  • February 2026 other‑solids price: $0.4391/lb (new formula). 

Dry whey up 2.8¢. Other solids down 4.1¢/lb.

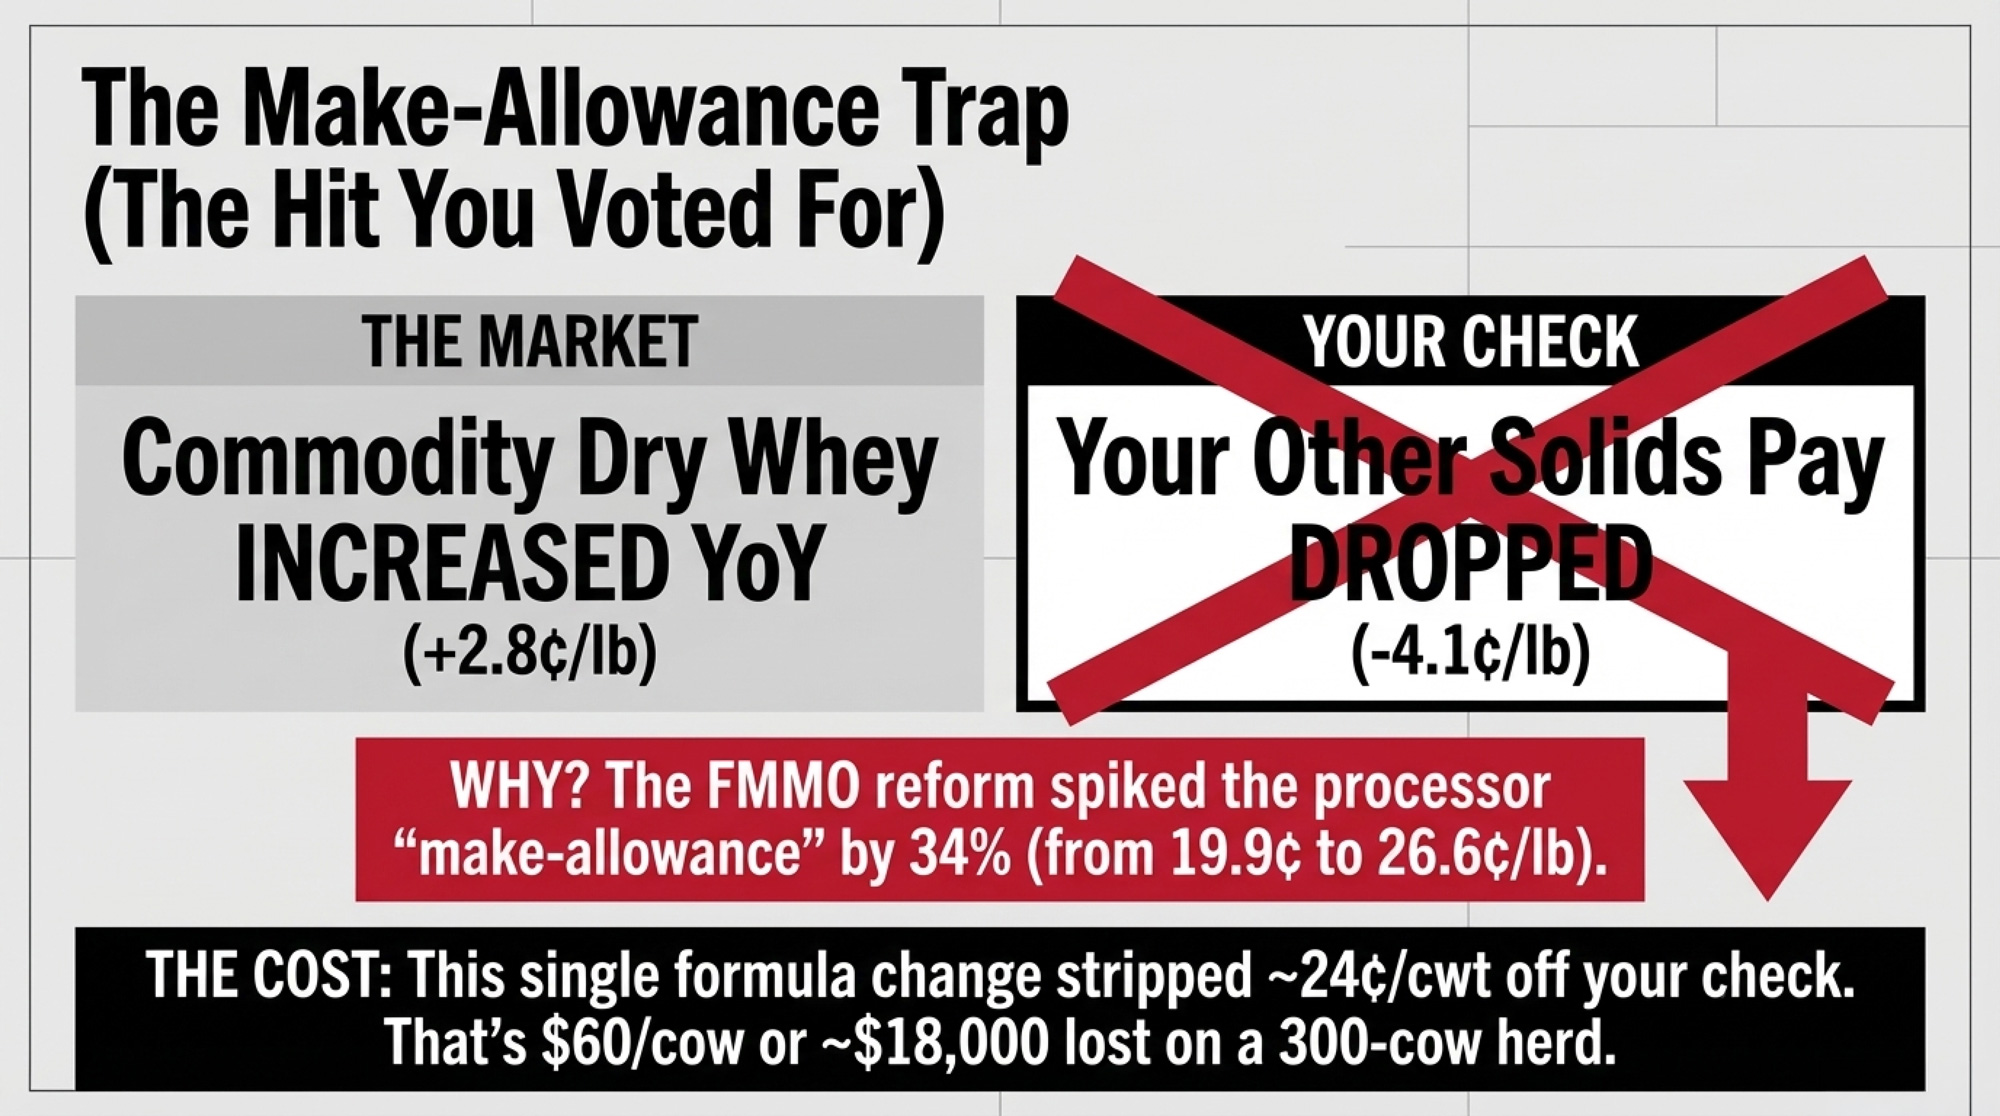
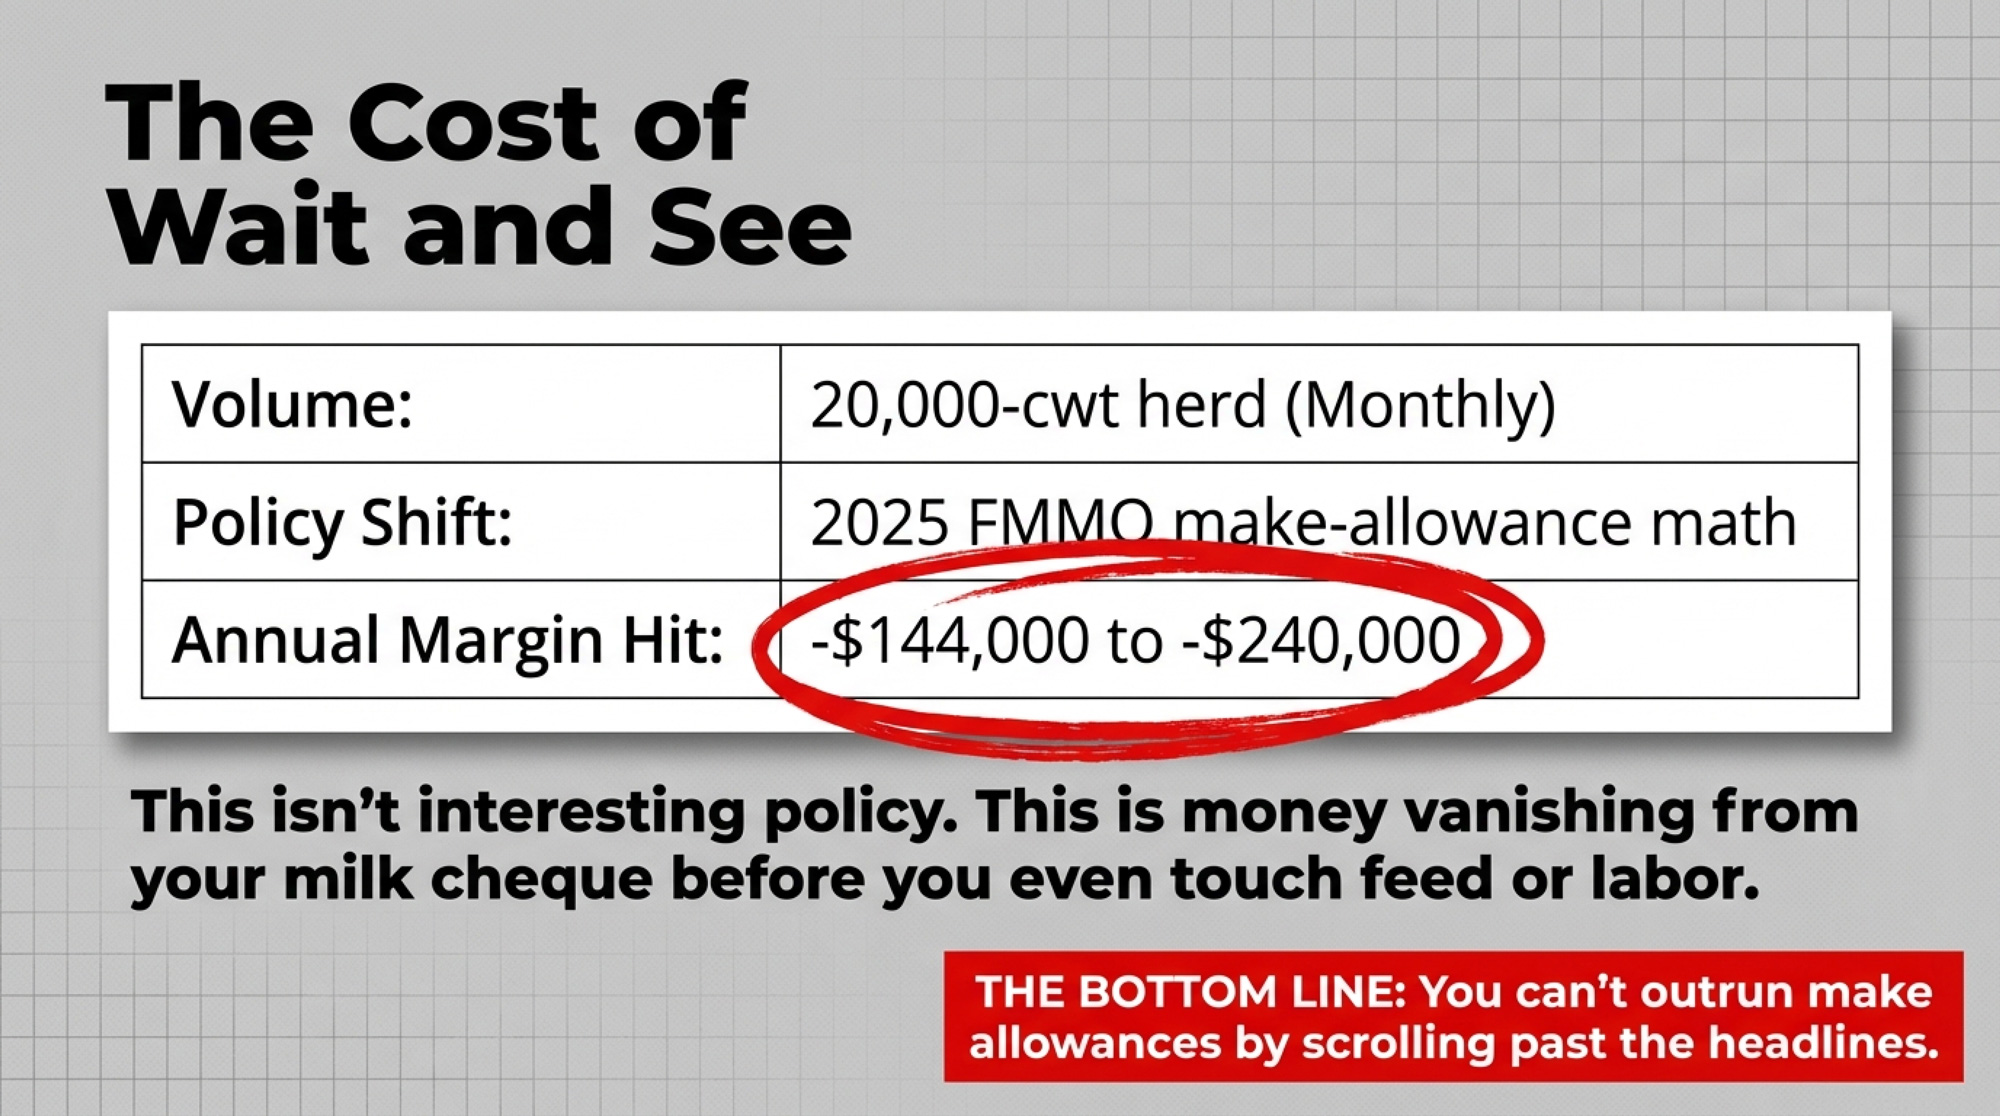
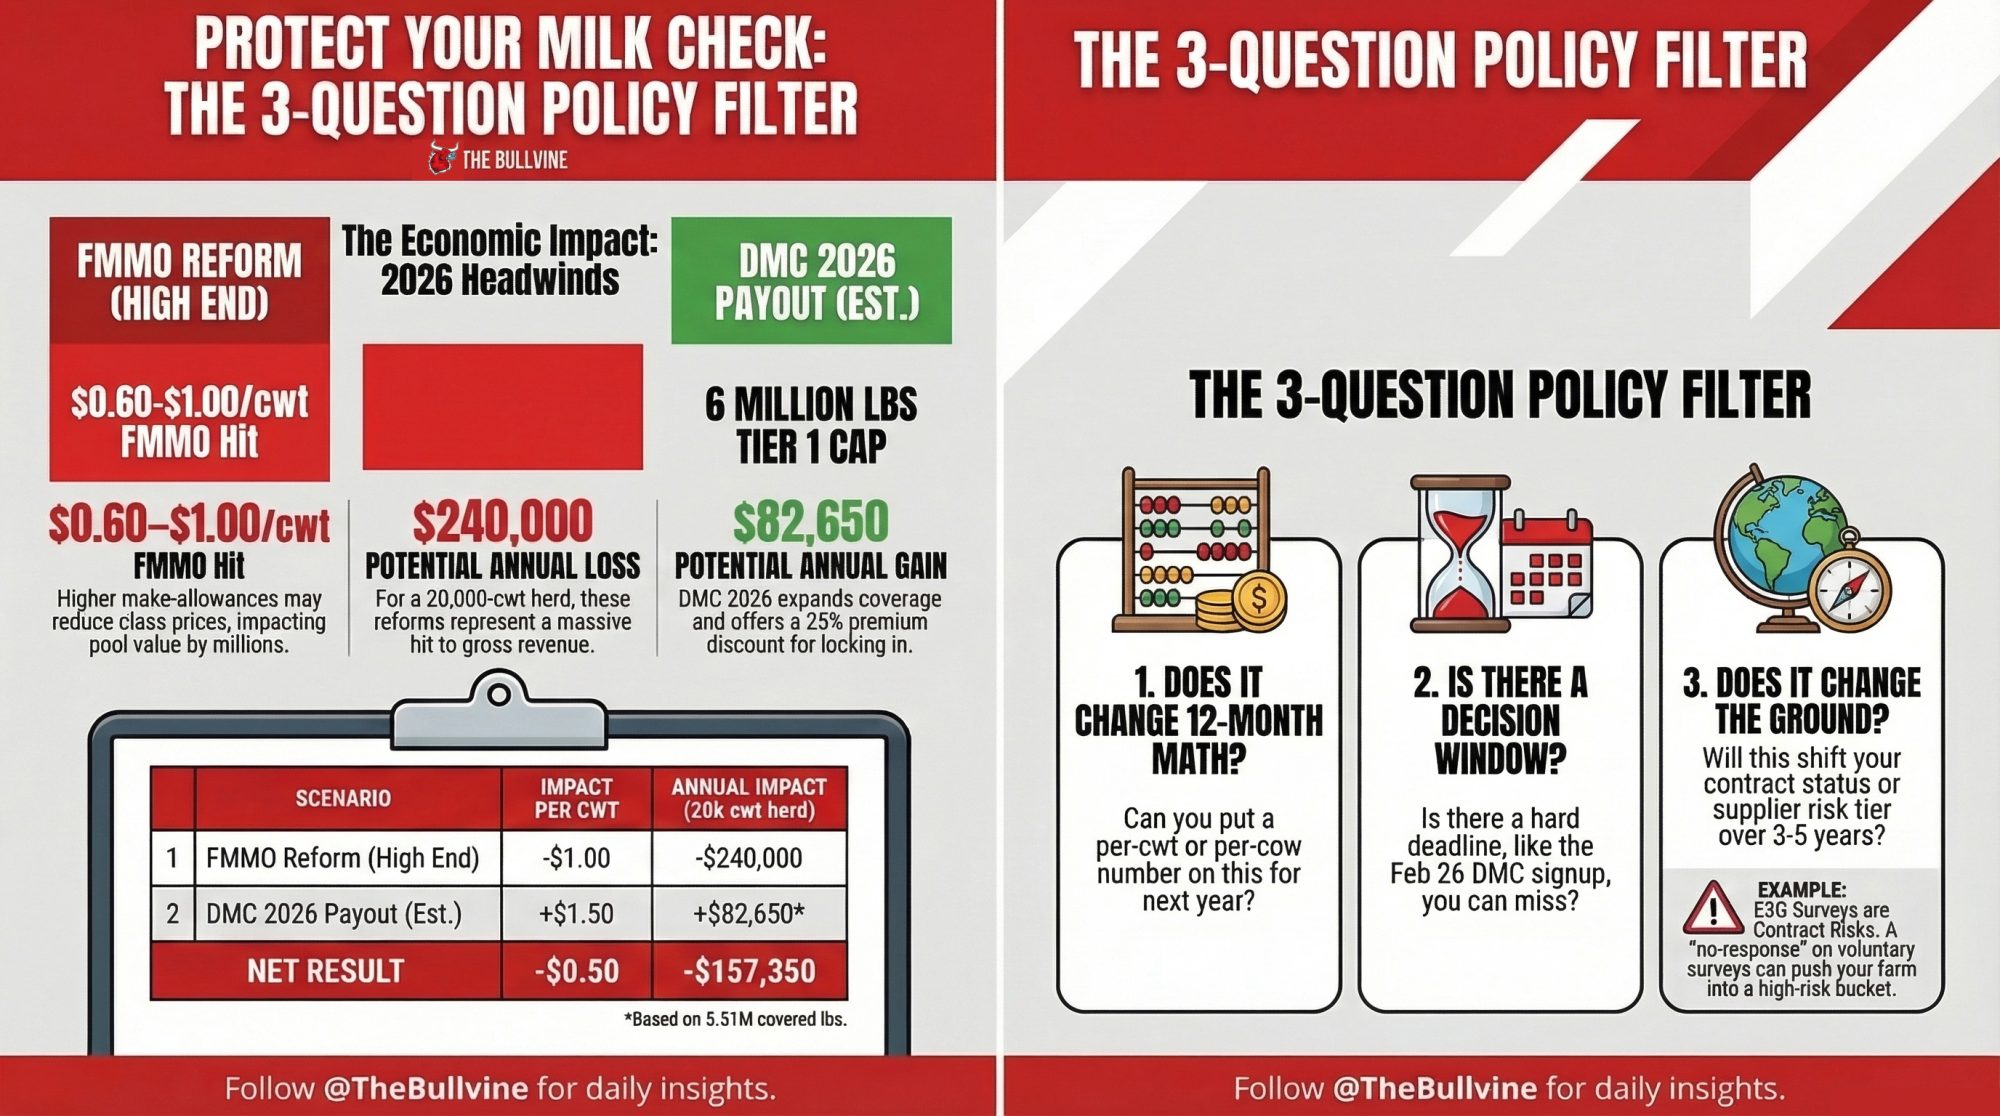
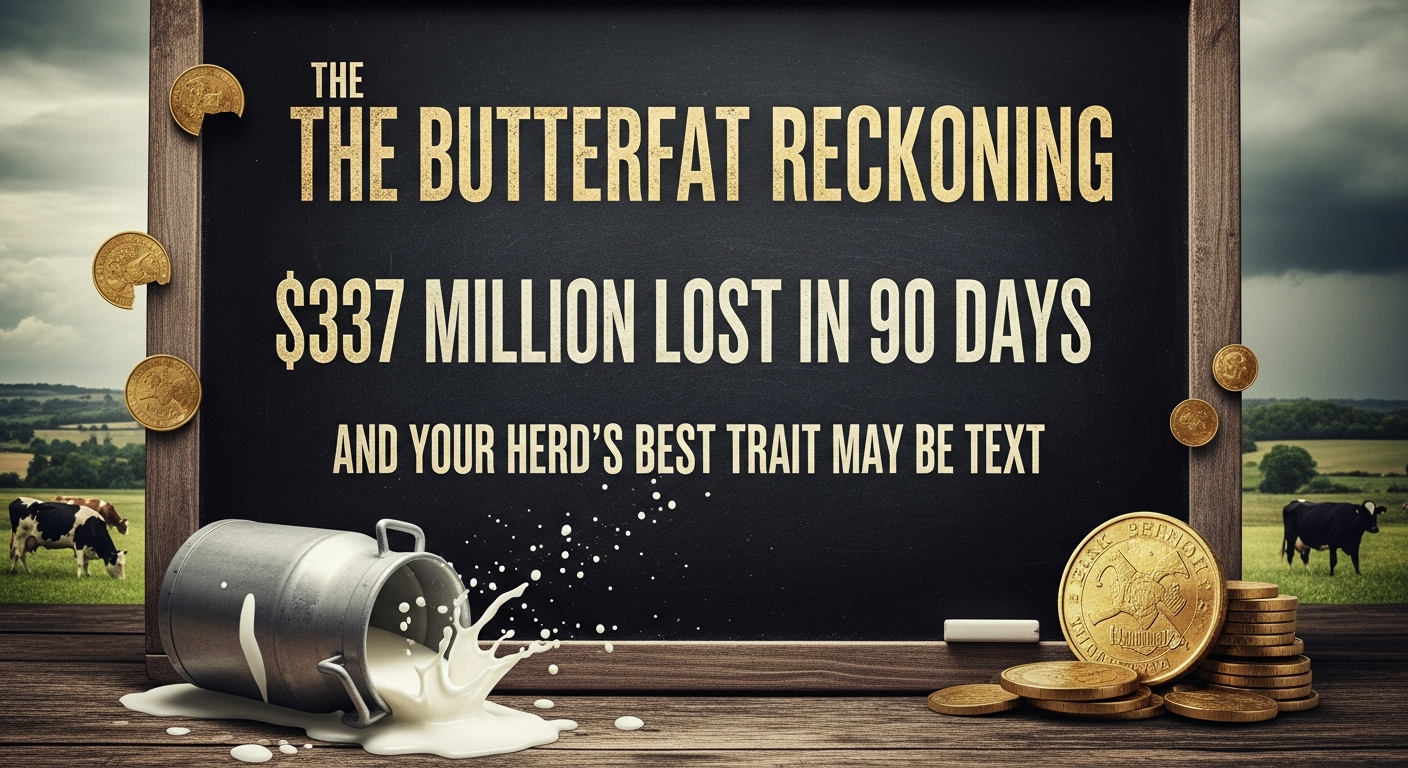
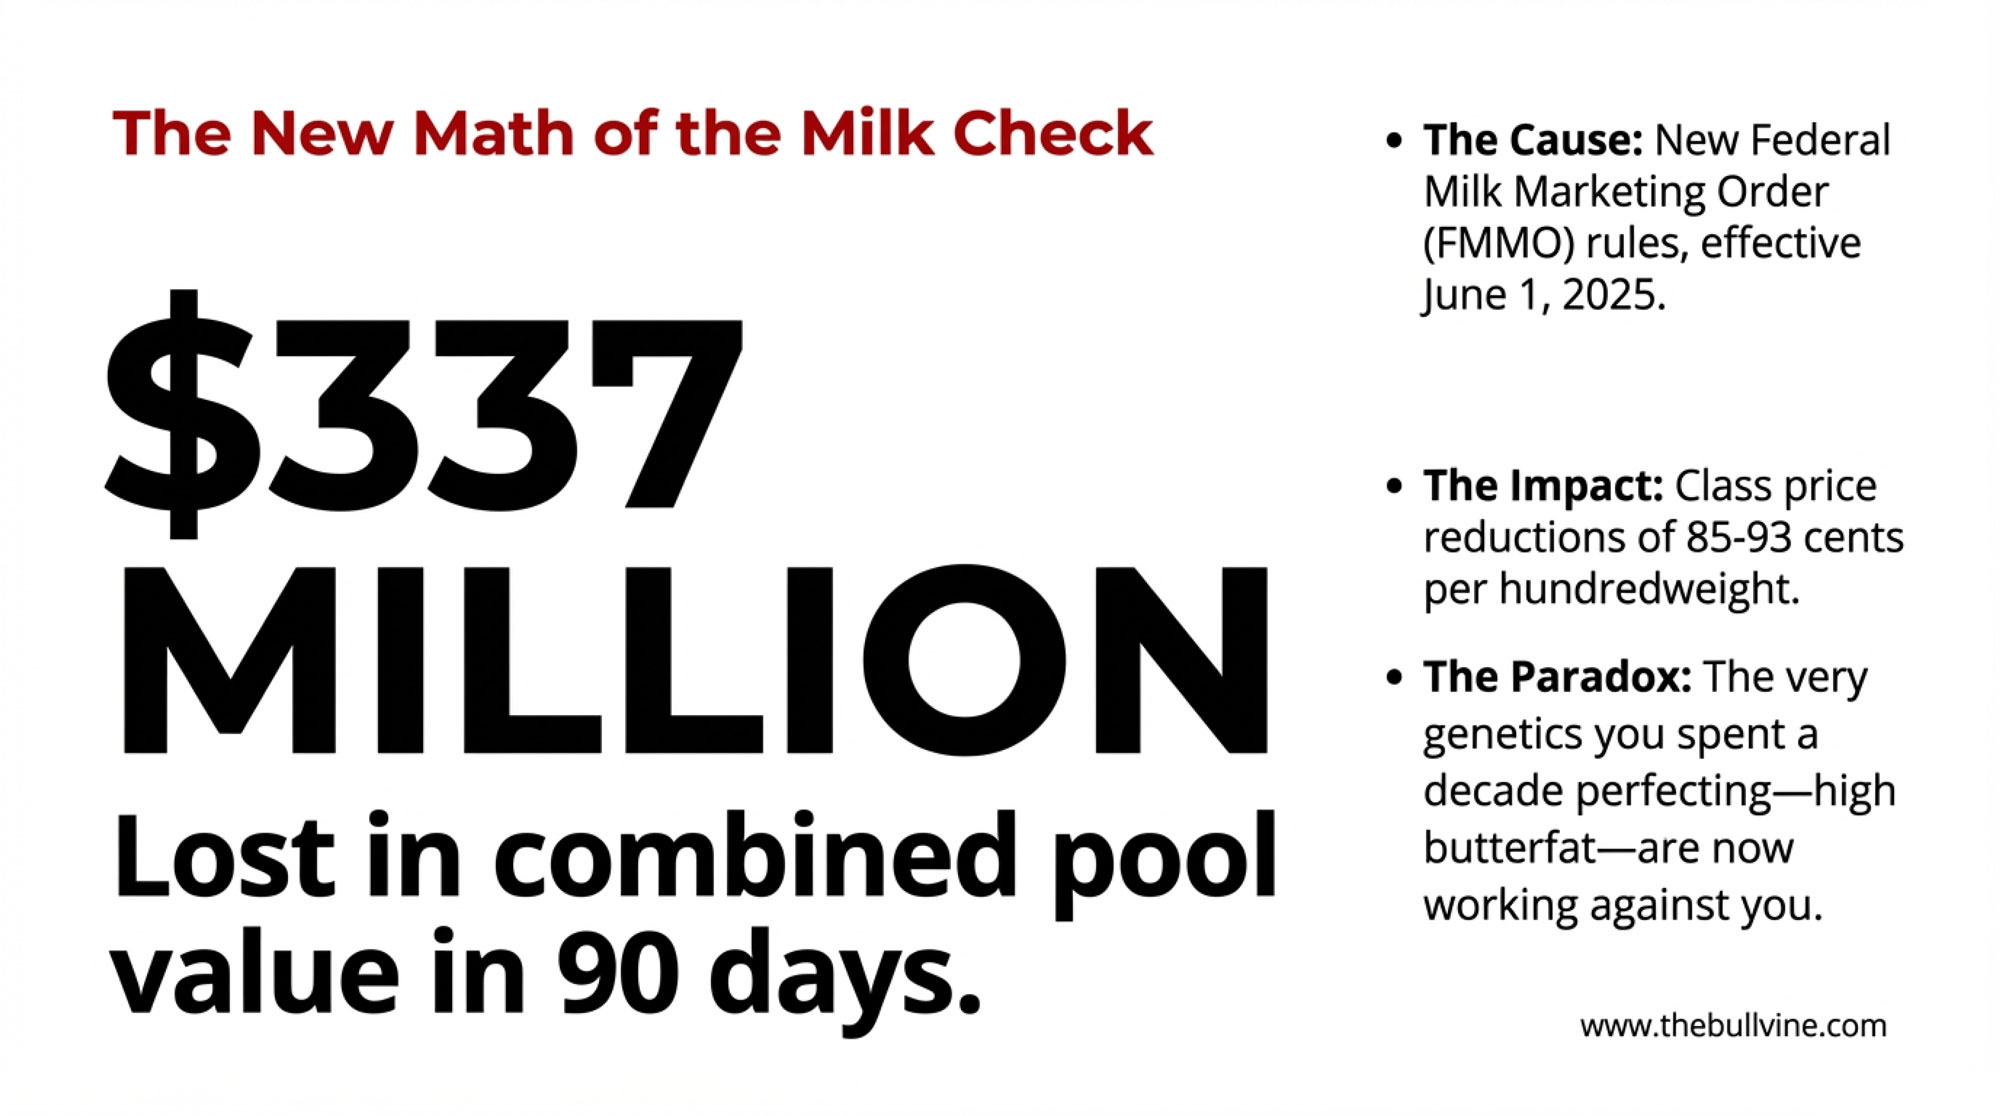
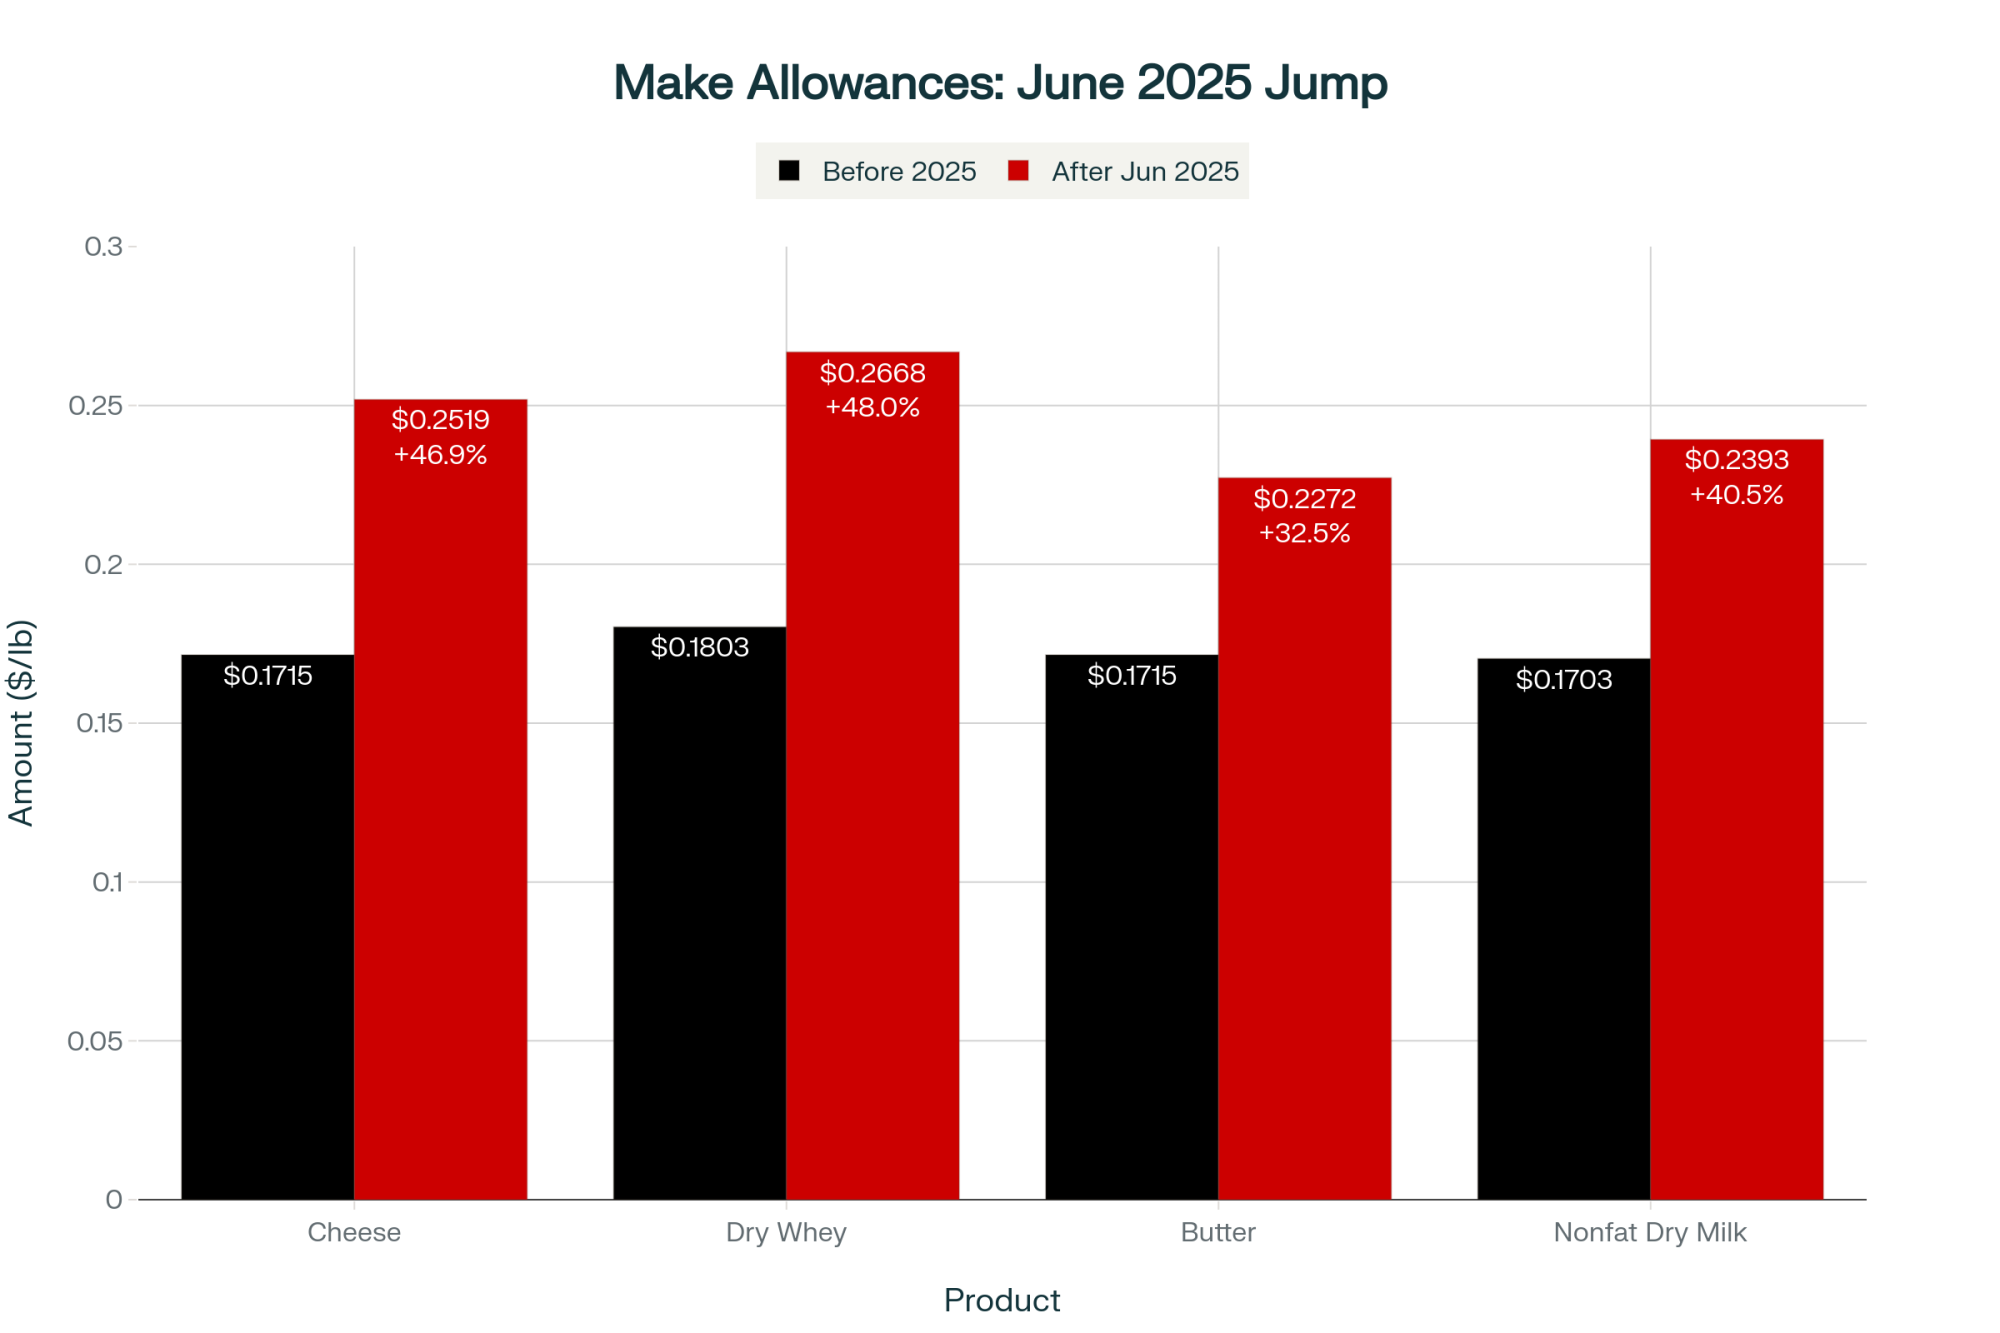
The reason: the FMMO reform raised the dry whey make allowance from $0.1991 to $0.2668/lb — a 34% jump,shifting value from producer to processor. Producers approved it in the December 2024–January 2025 referendum. AFBF economist Danny Munch calculated that in the first three months alone, higher make allowances stripped more than $337 million in combined pool value nationally — class price reductions of 85 to 93 cents per hundredweightdepending on the order (AFBF Market Intel, September 2025). As Munch told Brownfield Ag News, the higher allowances “more than wipe out” the gains from other reforms. 

Here’s the barn math at your test level (5.7 lbs OS/cwt):

  • 2025 OS component: $0.4799 × 5.7 = $2.74/cwt.
  • 2026 OS component: $0.4391 × 5.7 = $2.50/cwt.

That’s 24¢/cwt gone from other solids alone. Over 25,000 lb per cow, roughly $60/cow, and about $18,000 on a 300‑cow herd. Even though dry whey itself went up.

Premium whey triples. Commodity dry whey inches up. The make allowance change eats that small gain and then some. It’s exactly the make‑allowance hit we laid out in the FMMO piece earlier this month.

Where Did the ~$6/cwt Actually Go?

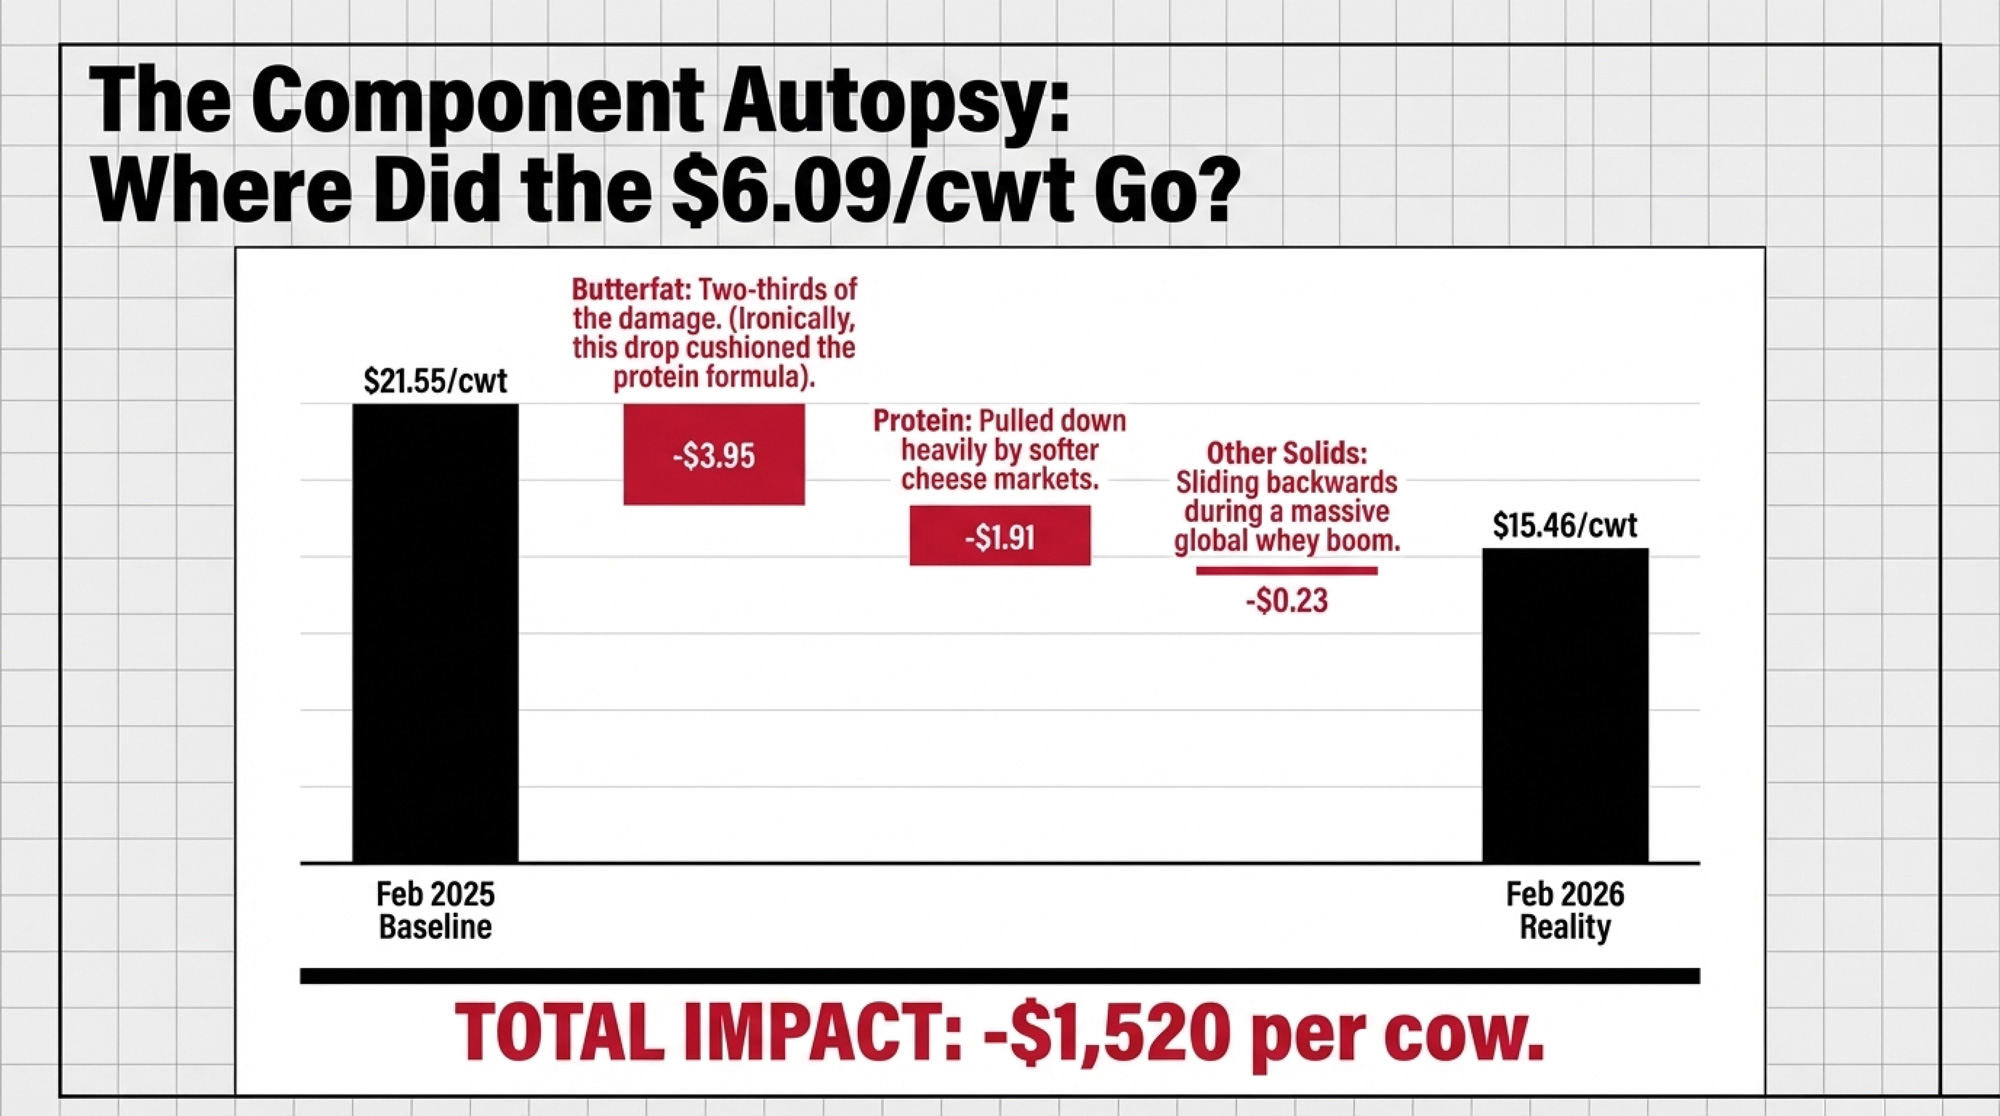
The component hit isn’t just whey. It’s the combination of weaker butterfat, softer cheese, and those other solids squeezed all at once.

Using USDA AMS component values for February 2025 vs. February 2026 at standard test: 

ComponentFeb 2025Feb 2026Change/lbPer‑cwt impact
Butterfat (3.8%)$2.8186/lb$1.7794/lb−$1.0392−$3.95
Protein (3.2%)$2.5337/lb$1.9373/lb−$0.5964−$1.91
Other solids (5.7%)$0.4799/lb$0.4391/lb−$0.0408−$0.23
Total   −$6.09/cwt

Butterfat did about two‑thirds of the damage. Softer cheese pulled protein lower and took another third. Other solids were the smallest slice — but in a whey boom, you’d expect them to be climbing, not sliding.

Per 25,000‑lb cow:

  • Feb 2025: $21.55/cwt × 250 cwt = $5,387/cow.
  • Feb 2026: $15.46/cwt × 250 cwt = $3,865/cow.

That’s about $1,520/cow gone — roughly $456,000 on Von Ruden’s 300‑cow neighbor. And through all of that, processors with whey-fractionation capacity booked elevated whey-ingredient margins. 

One quirk worth flagging: the FMMO protein formula includes a butterfat deduction. The butterfat drop in early 2026 actually cushioned the protein decline. If butterfat recovers while cheese stays soft, the protein line can fall further, even without another move in cheese. 

Who’s Building the Stainless — and Who’s Sharing?

StoneX dairy consultant John Lancaster told DairyReporter that “almost weekly you hear about a small or medium‑sized investment increasing capacity”. Put some names on that $11 billion: 

  • Glanbia/Southwest Cheese — adding significant WPI capacity in Clovis, New Mexico, through a JV with DFA. 
  • Idaho Milk Products — investing roughly $200 million in a new protein and powder blending facility. 
  • Wisconsin Whey Protein — finishing a plant targeting up to 13 million lbs of WPI annually. 
  • Arla Foods Ingredients contracted with Valley Queen in South Dakota for WPC manufacturing. 
  • Globally: Fonterra ($50M Studholme expansion, NZ), Tirlán (€126M new facility, Ireland), Amul (doubling a whey plant plus two new builds, India). 

Every pound of WPI starts as your cow’s milk going through a cheese vat. The FMMO formula turns that into $0.4391/lb of other solids. The plant’s ingredient desk sells that same stream at several dollars per pound. 

Whey ProductMarket Price (Feb 2026)FMMO Formula PayGap per PoundWho Captures It
Whey Protein Isolate (WPI)$11.00/lb$0.4391/lb$10.56Processor ingredient desk
WPC-80~$9.00/lb (€20k/t equiv.)$0.4391/lb$8.56Processor ingredient desk
NDPSR Dry Whey$0.6931/lb$0.4391/lb$0.254Partially shared via FMMO
Commodity Dried Whey Permeate~$0.38/lbNot in formulaN/AProcessor

Some co‑ops return a slice through patronage dividends or over‑order premiums tied to ingredient economics. In the Upper Midwest, industry sources report some operations have negotiated premiums of $0.20–$0.30/cwt above pool pricing, structured as multi‑year agreements. In a lot of plants, though, any whey value is buried inside the overall component or patronage numbers — not broken out on your statement. 

McCully Consulting’s Mike McCully predicts processors will soon be “forced into fights for milk by paying more, meaning some will not get all the milk they need”. That’s your leverage. But only if you know what your milk is worth to the plant buying it — and whether a competing plant within hauling range is offering a clearer premium. 

What Happens When $11 Billion in U.S. Dairy Capacity Comes Online?

Every extra pound of premium whey requires another cheese vat running. All that new stainless means more cheese — whether the market is ready or not.

Rabobank’s Fuess warned in March 2026 that these expansions “could temporarily lead to an oversupplied market and reduce cheese prices in the near term as the market works to absorb the additional output”. Cheese has already pulled back from around $1.90/lb a year ago to the mid‑$1.40s in early 2026. 

Exports are doing their best to bail the boat. USDEC data show U.S. dairy exports started 2026 with 12% year‑over‑year volume growth in January — the biggest January on record — with cheese up 11%, butter up 187%, and NFDM/SMP up 19%. 

But here’s the stress test. Using the USDA’s component formulas and historical price ranges, two downside scenarios:

Scenario A — Whey retreats, cheese softens:

  • Dry whey slides to $0.55/lb (mid‑2025 levels). Cheese eases ~10% into the high‑$1.20s.
  • Other solids drop to roughly $0.29/lb. Protein falls to mid‑$1.40s/lb.
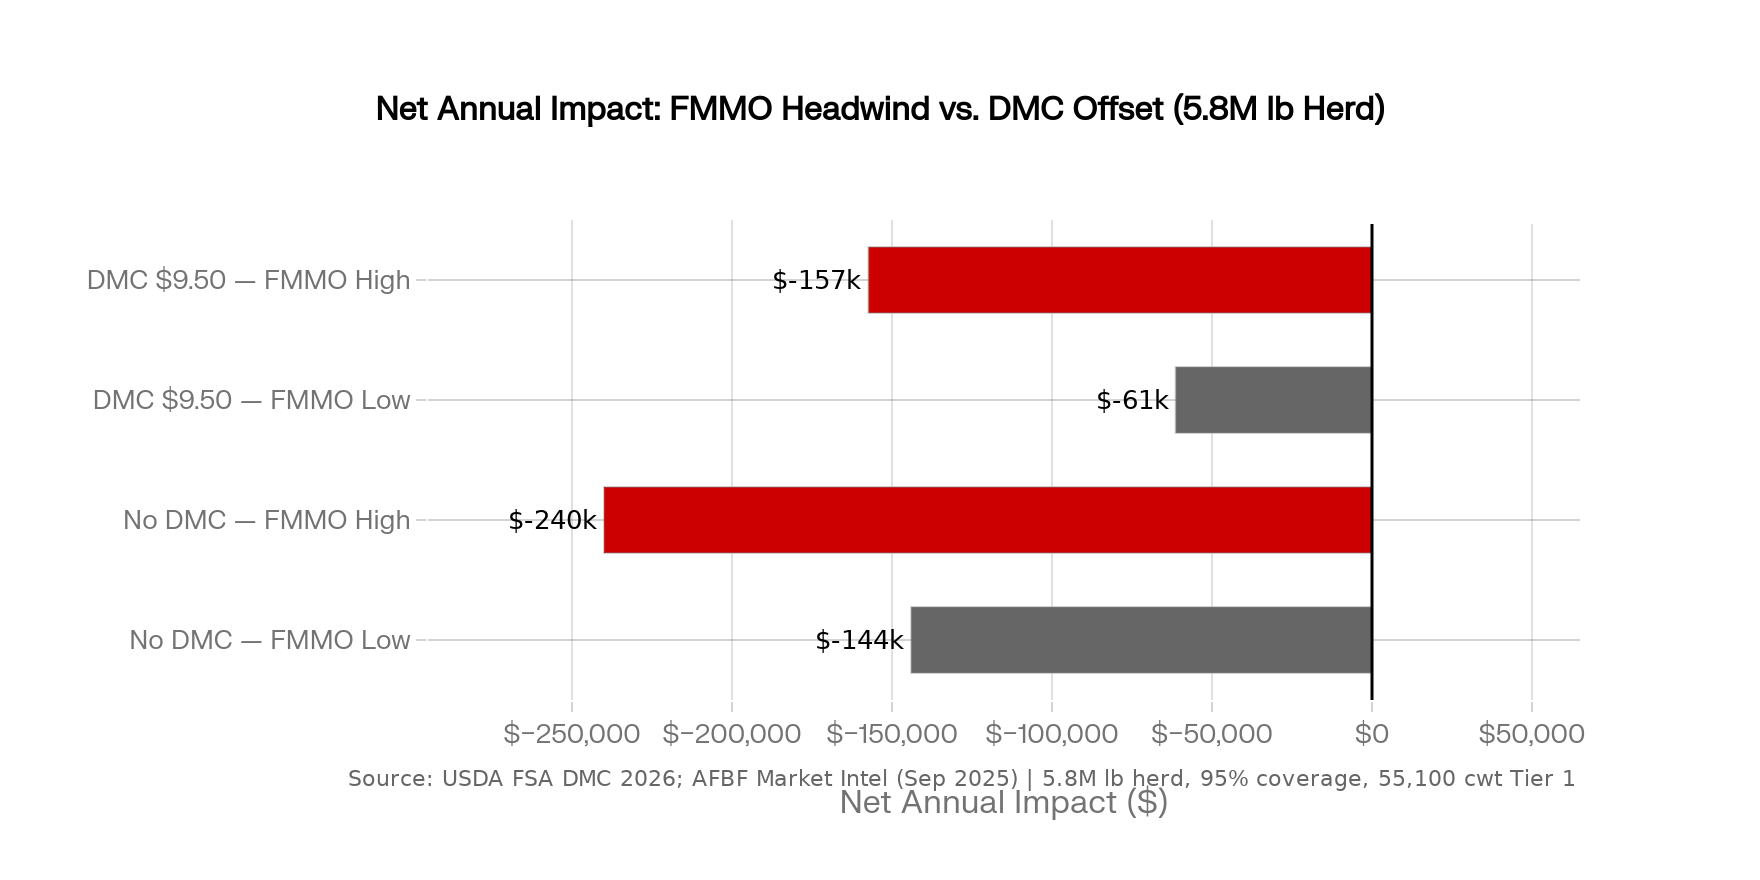
  • Net: about −$2.33/cwt from February 2026 levels → −$582/cow → −$175,000/year on 300 cows.

Scenario B — Deeper correction:

  • Dry whey returns to $0.45/lb (closer to 2023 levels). Cheese drops ~20% into the low‑$1.10s.
  • Other solids fall to roughly $0.19/lb. Protein slides toward $1.00/lb.
  • Net: about −$4.40/cwt → −$1,100/cow → −$330,000/year on 300 cows.

Scenario A isn’t far‑fetched. NDPSR dry whey sat in the 50–60¢ band for stretches of 2024 and 2025.

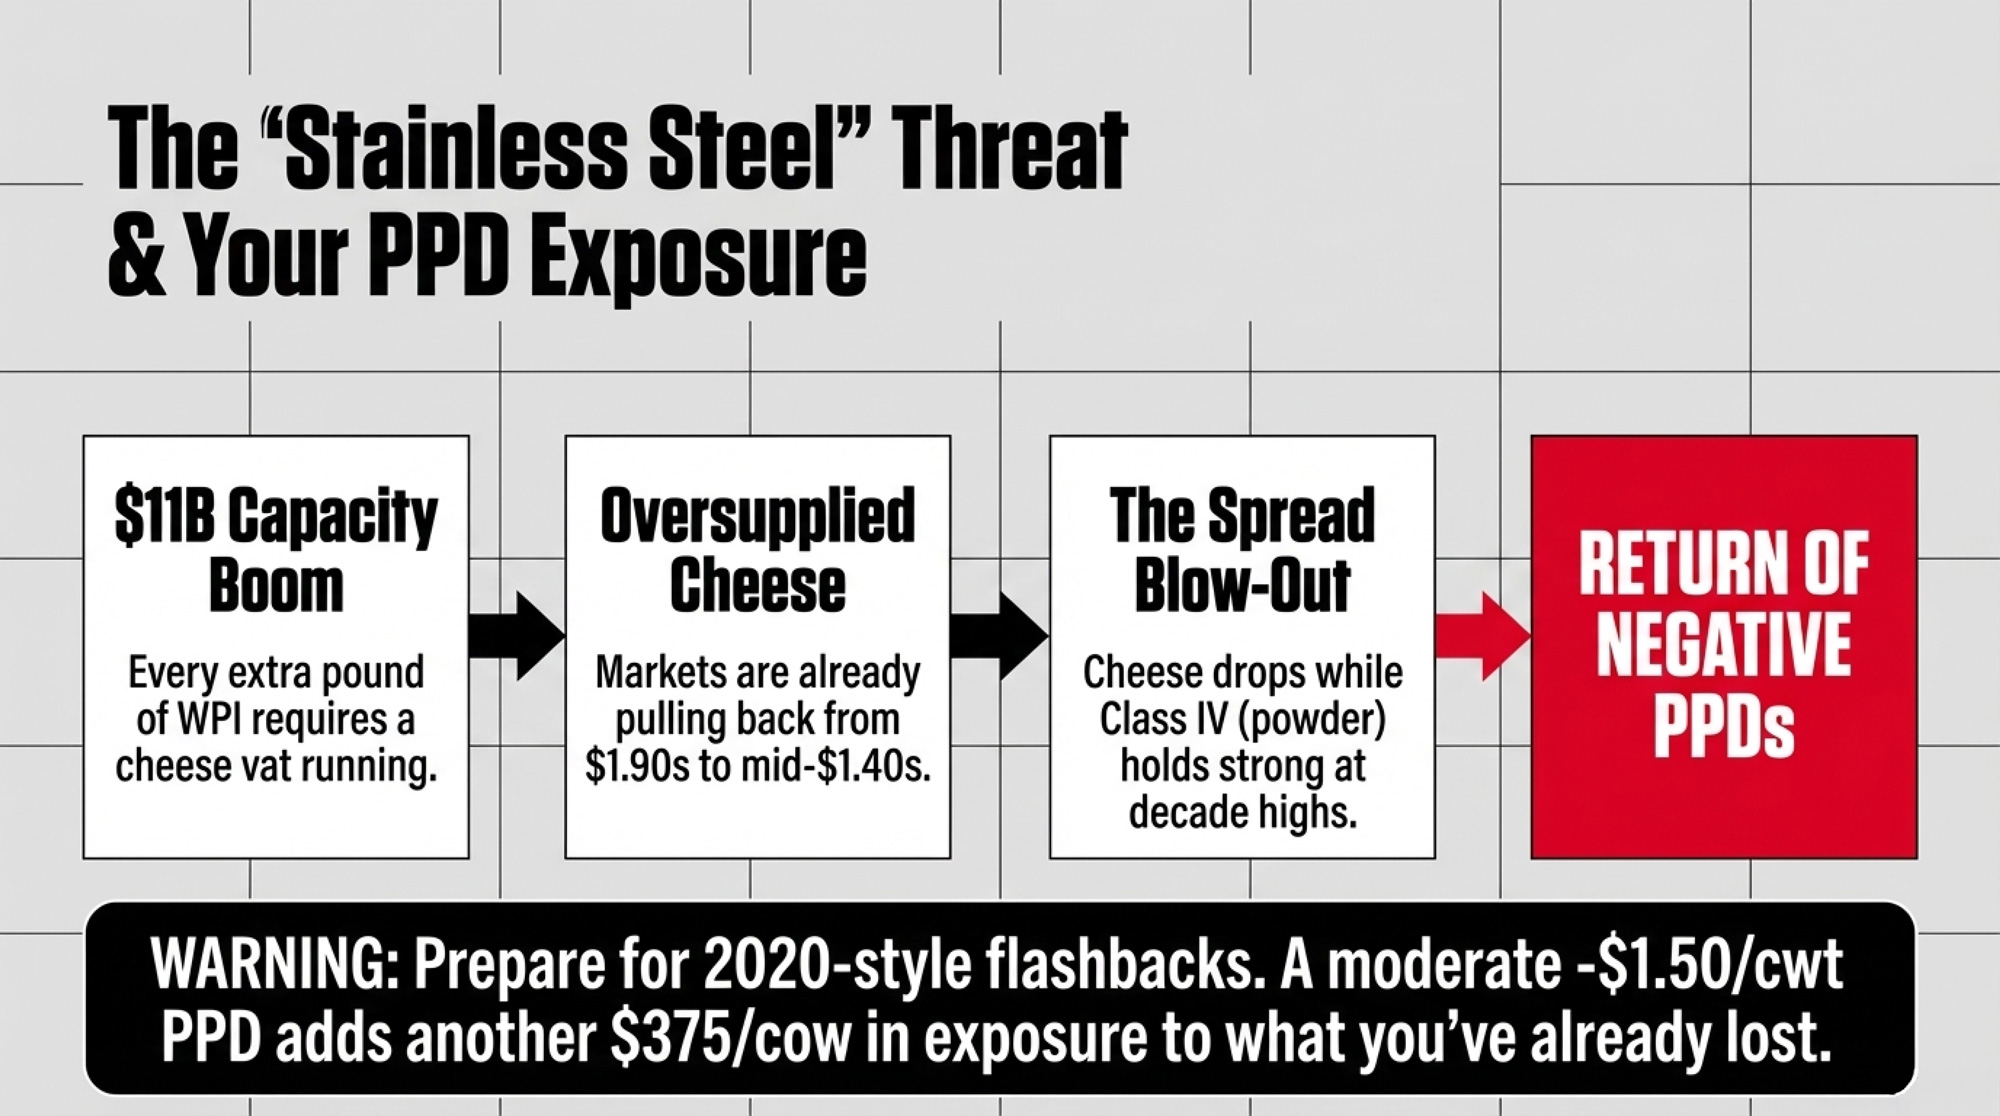
Now add the hidden multiplier: PPDs. If cheese drops while Class IV holds firm — CME nonfat dry milk has been trading at some of its strongest levels in more than a decade, near $1.94/lb in March 2026  — the spread blows out, and negative Producer Price Differentials come back. In 2020, some orders saw PPDs past −$4 to −$8/cwt. Even a moderate −$1.50/cwt PPD adds another ~$375/cow in exposure. 

If you lived through 2020–2021 negative PPDs, you know this isn’t theoretical. And it’s exactly the kind of peak‑price trap that backfired for Kiwi producers when Fonterra built budgets around NZ$9.70 milk.

The Calf Check: One of the Few Hedges Hitting Cash Today

While the FMMO formula fails to capture the $11/lb whey premium, beef‑on‑dairy is one place producers are actually winning back margin in cash.

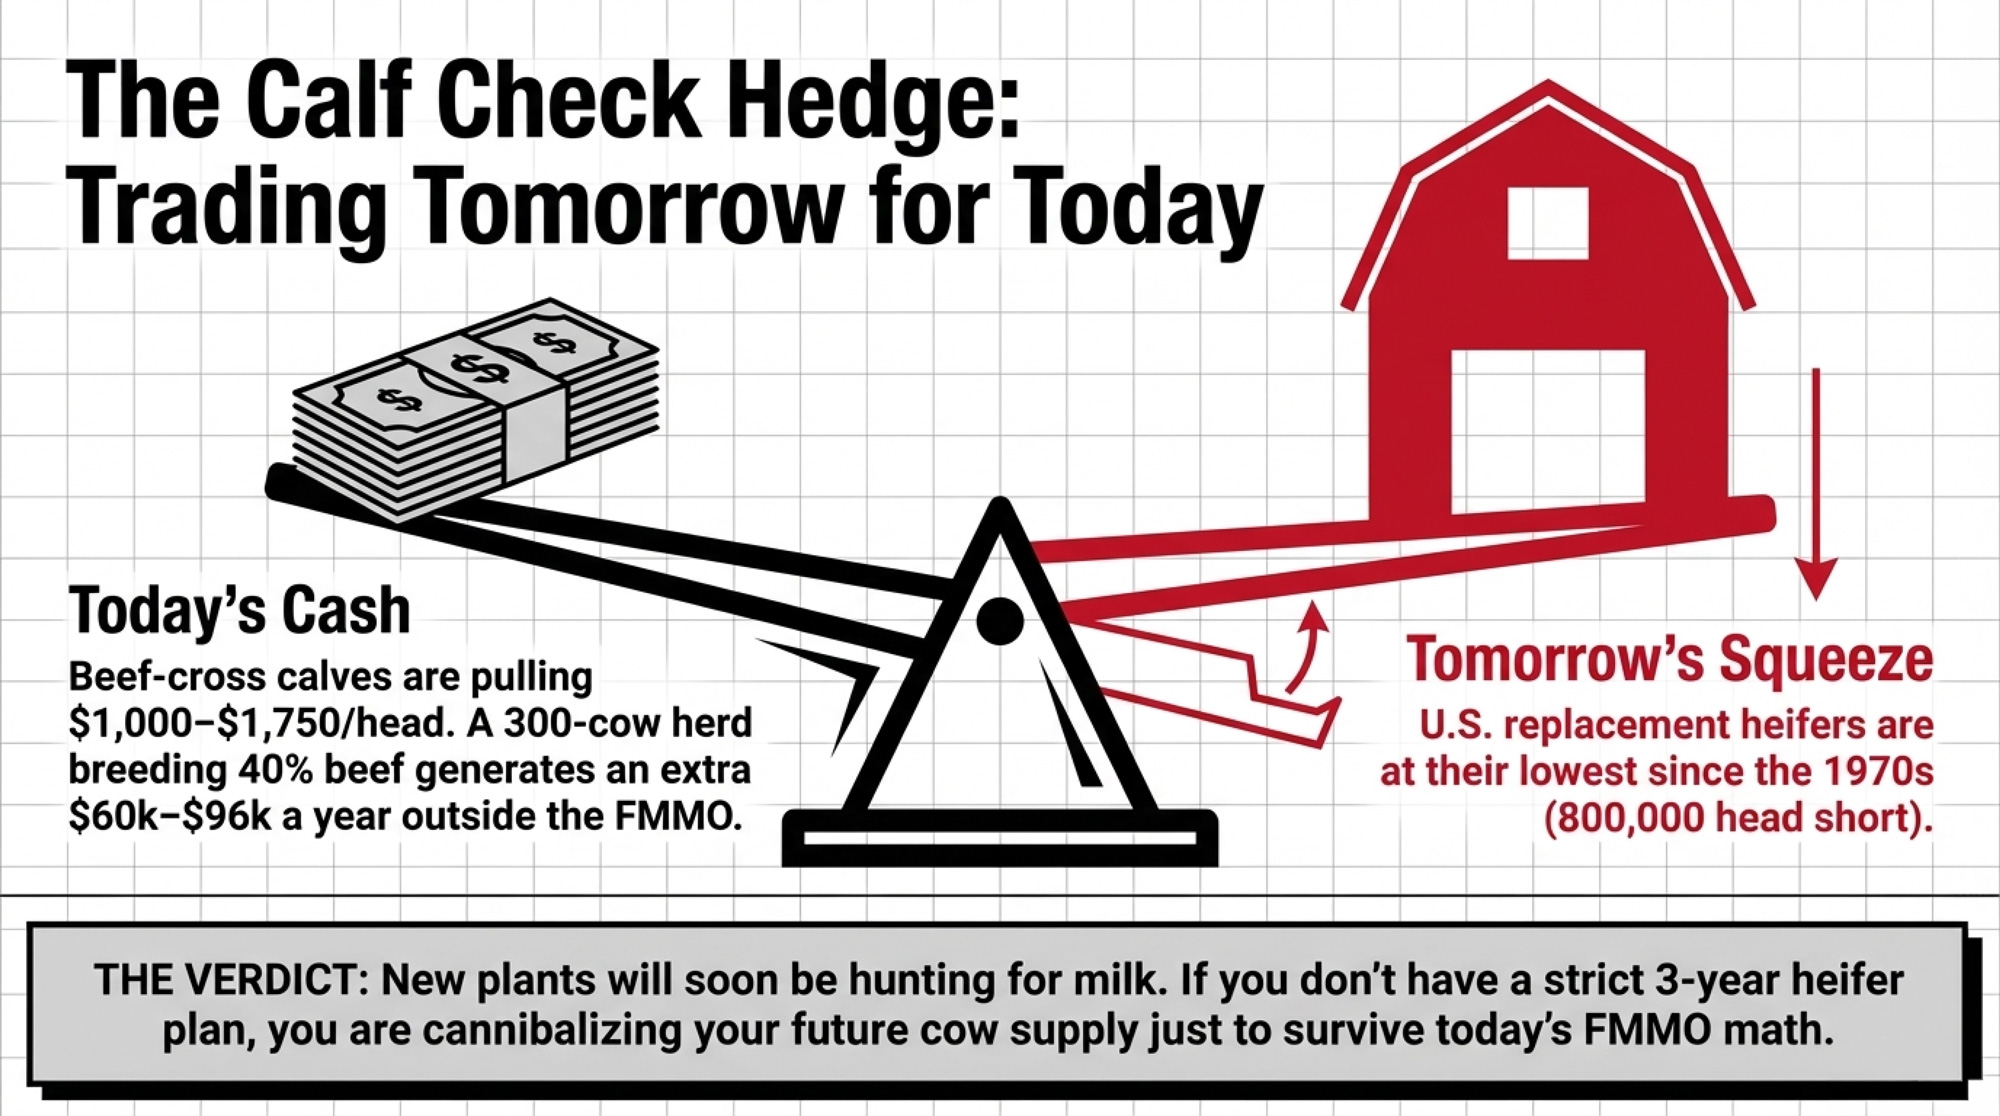
In strong Wisconsin markets, beef‑cross calves have brought up to $1,750 a head, with Premier’s January 2026 report listing beef‑dairy crosses at $1,000–$1,750. Holstein bull calves, by comparison, sit in the $700–$1,150 range. 

That extra $500–$800 per calf functions as a de facto hedge. On 300 cows breeding 40% to beef semen, that’s 120 calves generating roughly $60,000–$96,000/year that never touches a federal order.

The trade‑off is real, though. USDA’s January 1, 2026, cattle report puts U.S. dairy replacement heifers at 3.905 million head — the lowest since the late 1970s and about 16% below January 2020. CoBank dairy economist Corey Geigerprojects the gap at roughly 800,000 fewer replacements across 2025–2026 before inventories begin to rebound sometime in 2027. As Geiger put it: “We don’t see a rebound until 2027, and that will be up 285 thousand, but you’ve got to remember, that’s going to be after 800 thousand fewer heifers”. 

Fewer replacements mean fewer cows when all that new stainless steel starts hunting for milk. That takes you straight back to McCully’s question: “Who won’t get the milk?” 

Beef‑on‑dairy props up your cash and tightens the supply that new capacity needs. But it comes with a shelf life — and if more than half your AI program is going to beef without a three‑year heifer plan, you’re trading tomorrow’s cow supply for today’s calf check. We walked through exactly how that math can break on a 400‑cow herd last week.

What This Means for Your Operation

  • Your component check has already absorbed roughly $1,520/cow from February 2025 to February 2026 — about $456,000 on 300 cows. If your expansion budget or debt‑service math is built on early‑2025 component values, you’re building on a number that isn’t there anymore. 
  • The FMMO reform alone shaved about $60/cow off your other‑solids line via the higher make allowance — roughly $18,000/year on 300 cows — even as processors booked stronger whey ingredient margins. 
  • You need to know what your plant does with whey and how they share it. If your co‑op’s annual report shows whey ingredient revenue growing faster than patronage per cwt, that gap is worth understanding — and worth raising at your next member meeting.
  • Beef‑on‑dairy calves at $1,400–$1,750 are real margin, but they’re also tightening heifer supply in ways that make the coming milk bidding wars more brutal. Your beef‑to‑dairy AI ratio needs to line up with your three‑year heifer plan, not just this month’s calf check. 
  • Negative PPDs are the hidden multiplier. With Class IV buoyed by strong powder and cheese under pressure, the setup looks uncomfortably similar to 2020 and late 2024. Model another $1–$2/cwt of exposure.
  • Don’t build a barn on a commodity spike. Stress‑test every expansion pro forma at about $15.50/cwt component value, not $21. If it doesn’t cash‑flow there, you’re not investing — you’re betting.
  • Price the haul to a competing plant. If whey capacity is being added within hauling range, ask directly what the over‑order premium is and how ingredient economics show up in their payment structure. McCully’s “who won’t get the milk?” question is where your leverage comes from. 

Your 30/90/365‑Day Playbook

TimeframeKey ActionTarget BenchmarkRed Flag ThresholdTool / Source
30 DaysAudit milk check vs. USDA valuesProtein: $1.9373/lb; OS: $0.4391/lb; Fat: $1.7794/lb>$0.15/cwt below FMMO after haulingUSDA AMS February 2026 component prices
30 DaysRequest co-op whey breakdownPatronage per cwt growing with ingredient revenueWhey revenue growing faster than patronageCo-op annual report / equity statement
90 DaysStress-test DMC coverageTier 1 at $9.50 (up to 6M lb)Margin drops below $9.50 in Scenario AUSDA DMC / Center for Dairy Excellence
90 DaysModel PPD exposure$0/cwt PPDPPD turns -$1.50/cwt or worseClass III vs. Class IV spread monitor
12 MonthsRe-run expansion pro formaBase case: $15.50/cwt componentsOnly pencils out above $20/cwtInternal proforma, lender review
12 MonthsPrice hauling alternativesConfirm over-order premium structurePlant within haul range offers no premiumMcCully/StoneX consultant framework

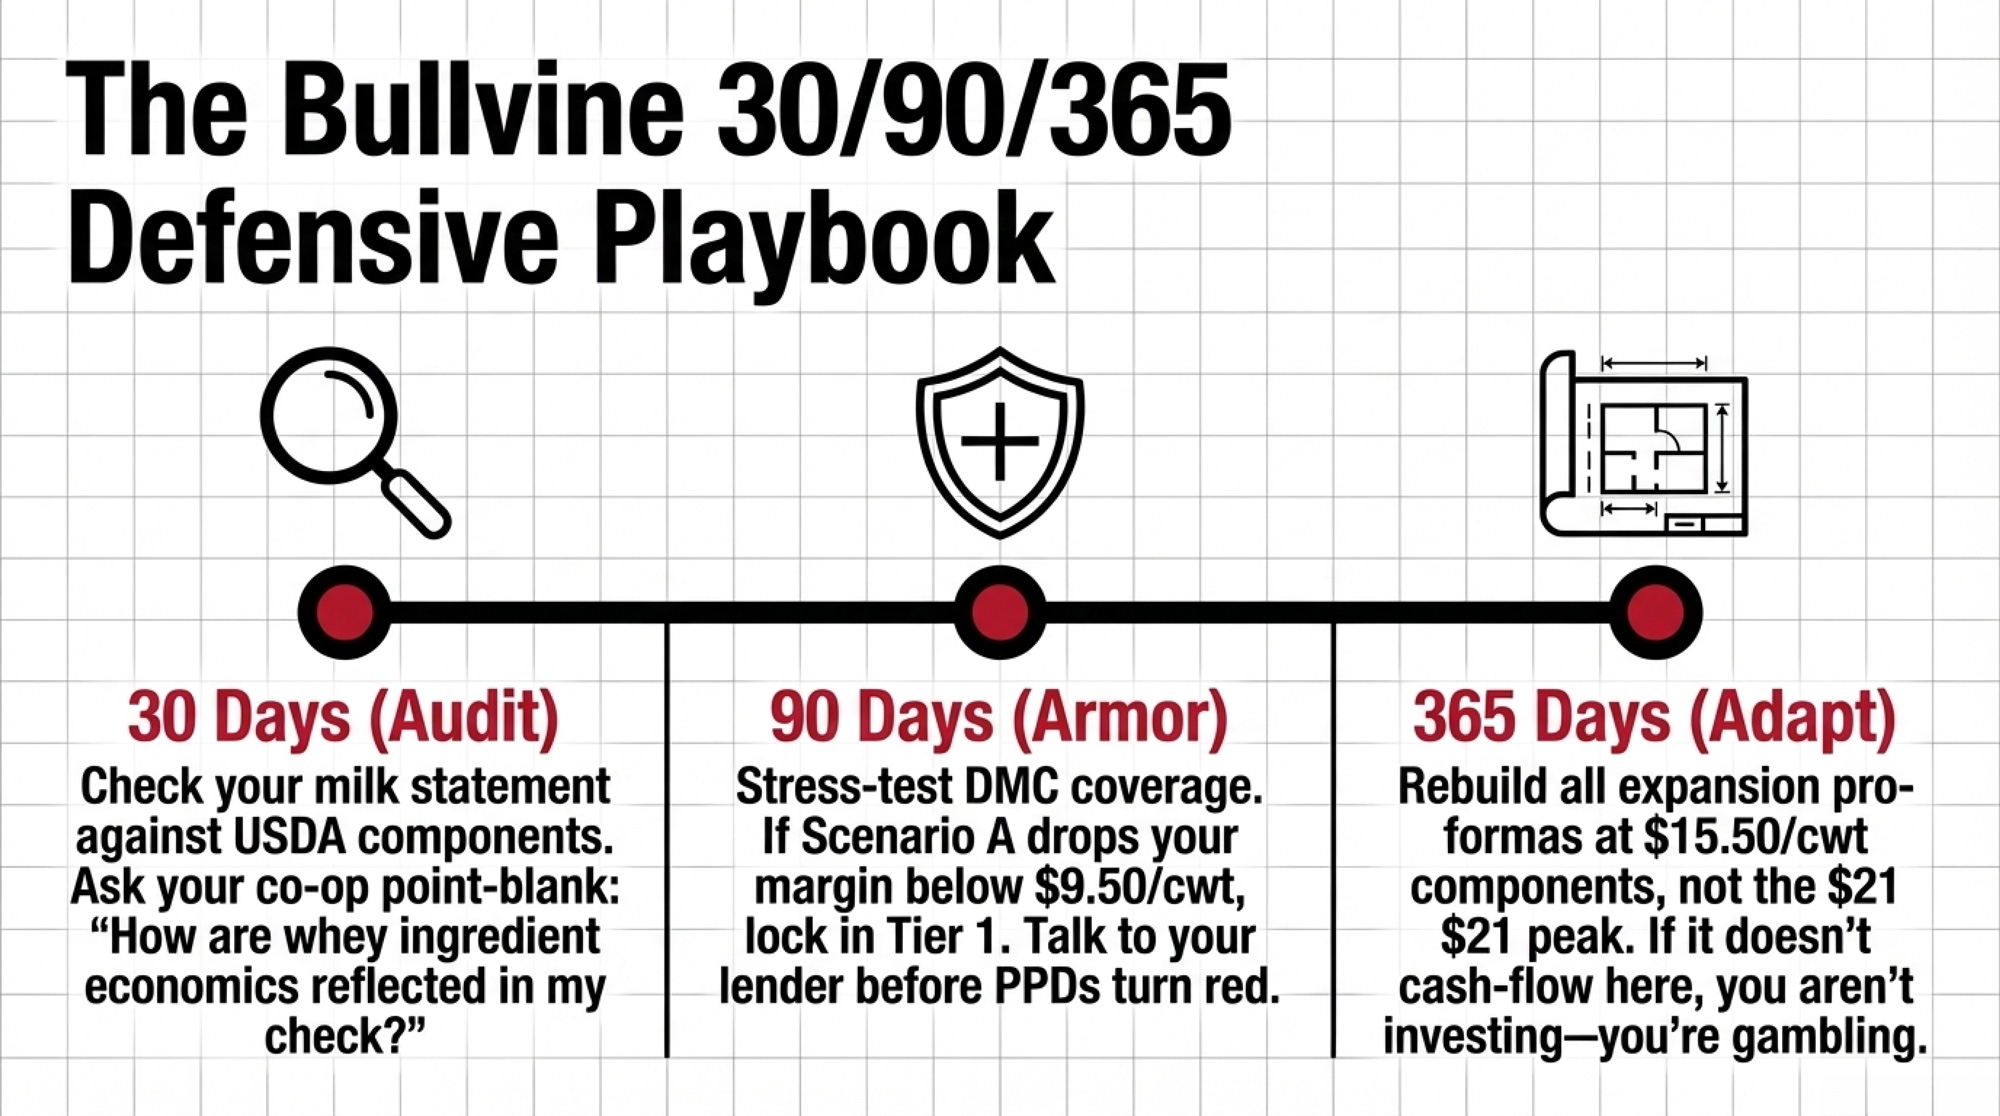
Within 30 days: Audit your check against USDA component values.

Pull your last three milk statements. Compare your protein, other solids, and butterfat rates to USDA’s February 2026 published component prices: protein at $1.9373/lb, other solids at $0.4391/lb, butterfat at $1.7794/lb

If your combined protein‑plus‑other‑solids payment runs more than $0.15/cwt below the FMMO values after hauling and marketing deductions, call your co‑op and ask one direct question: “How are whey ingredient economics reflected in my component check?”

If you get a non‑answer, request the co‑op’s annual financial report and equity statement. Compare ingredient revenue to patronage distributions. That gap — if it’s growing — is the conversation to bring to the next member meeting. It’s the kind of thing that costs real money when you put off the hard financial questions.

Within 90 days: Stress‑test your DMC coverage and talk to your lender.

USDA’s January 2026 DMC margin landed at $7.81/cwt, triggering a $1.69/cwt indemnity for herds enrolled at the $9.50 Tier 1 level. February’s margin was projected to be around $8.07/cwt by the Center for Dairy Excellence. 

Walk your own numbers through Scenario A:

  • Knock $2.33/cwt off your current component value.
  • Layer in a −$1.50/cwt PPD if you’re in an order that’s likely to go negative.
  • See where your income‑over‑feed margin lands relative to $9.50/cwt.

If the margin drops below $9.50 in that scenario, the expanded Tier 1 coverage — now up to 6 million pounds under the One Big Beautiful Bill Act  — is likely your cheapest shock absorber. 

Then bring both scenarios to your lender. Ask specifically: what debt‑service coverage ratio would they need to see — 1.2×? 1.3×? — to stay comfortable if those margins showed up for 12 months. Better to push that conversation now than have your banker push it when the PPD turns red.

Within 12 months: Rebuild your expansion math around post‑reform prices.

Run every major capital decision at three component levels:

  • $15.50/cwt — roughly where early‑2026 Class III components sit. 
  • $19.20/cwt — a 2025‑style “good year” average.
  • Scenario A with a −$1.50 PPD — your personal worst‑case stress.

You don’t control whether WPI stays at $11 or glides down to $6. You do control whether your business can survive both.

Key Takeaways

  • If your expansion or refinance pencils out only at a $20+ component value, you’re exposed. Re‑run at $15.50/cwt and see if it still holds water.
  • If you can’t see whey in your milk check, assume it’s not there. Plan your cash flow on FMMO components alone until your statement or co‑op report shows a clear whey‑linked premium.
  • If more than half your AI is going to beef without a three‑year heifer plan, you’re trading future cow supply for today’s calf check. Make sure that’s intentional.
  • If you’re not enrolled at $9.50 DMC Tier 1 and you’re running 200–500 cows, you’re choosing to self‑insure against a whey/cheese/PPD shock. Do the math with your lender, not in your head.

The Bottom Line

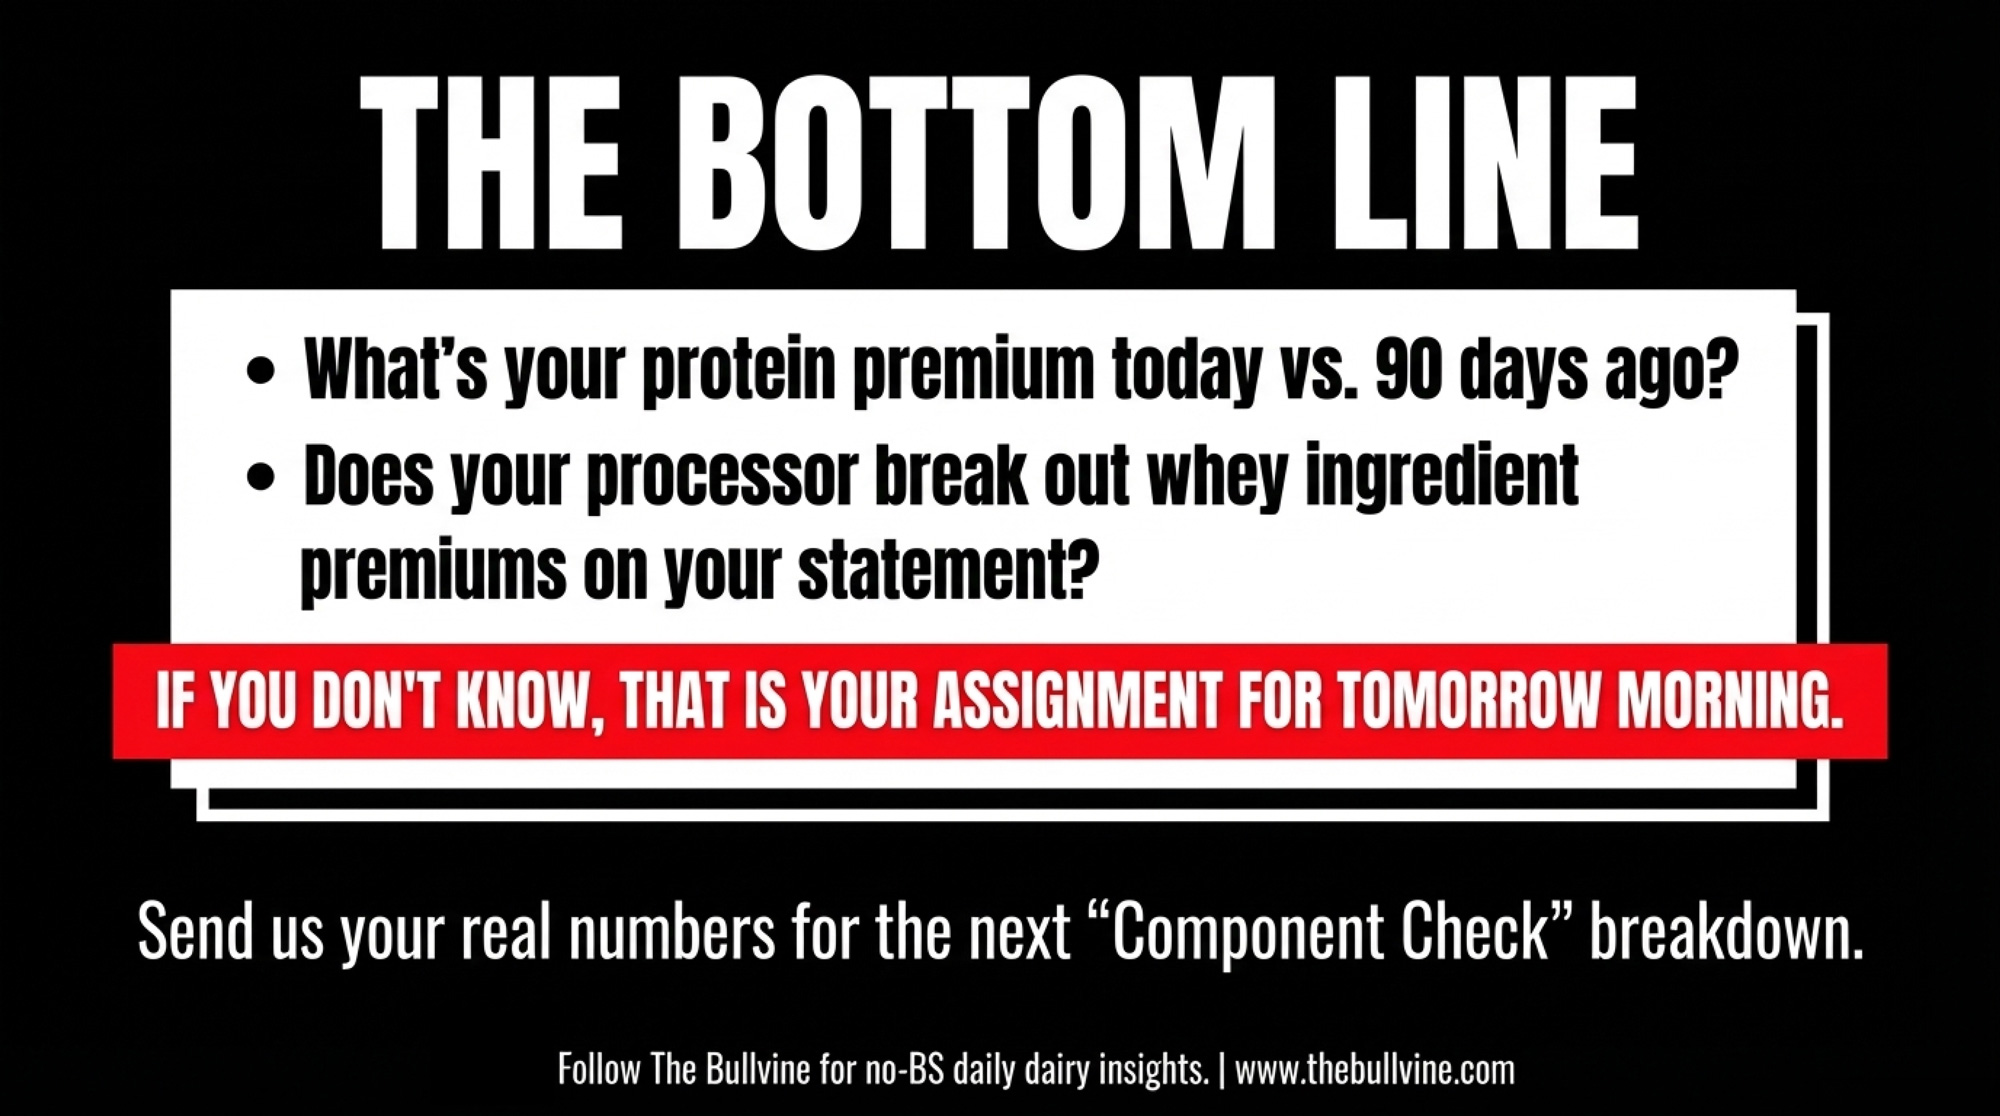
What’s your protein premium per cwt this month versus 90 days ago? Does your processor break out whey solids or ingredient premiums anywhere on your statement? And if you’re in a co‑op, how did last year’s patronage per cwt move compared to the co‑op’s reported whey ingredient revenue?

If you don’t know any of those answers, that’s your 30‑day assignment.

Next in “Component Check”: we run the math on how the April DMC margin and the whey premium interact on a 500‑cow milk check. If you want us to use your real numbers, send them.

This analysis uses publicly available USDA data, published analyst commentary, and FMMO pricing formulas. It’s intended as economic education and decision support for dairy producers, not as investment advice or a recommendation regarding any specific co‑op, processor, or financial product.

Complete references and supporting documentation are available upon request by contacting the editorial team at editor@thebullvine.com.

Learn More

The Sunday Read Dairy Professionals Don’t Skip.

Every week, thousands of producers, breeders, and industry insiders open Bullvine Weekly for genetics insights, market shifts, and profit strategies they won’t find anywhere else. One email. Five minutes. Smarter decisions all week.

NewsSubscribe
First
Last
Consent

The $0.93 FMMO Hit: 3 Questions to Protect Your 2026 Milk Cheque

$144,000–$240,000. That’s what a 20,000‑cwt herd can lose in a year from the new FMMO make‑allowance math. Before you shrug, run it through three hard questions.

You really see it when you look at how two neighbours handle the same noise. Let’s look at Mark. He’s a composite — built from the kinds of situations central Wisconsin producers are describing this year — but his numbers are real. Mark doesn’t read Federal Register notices. He runs a commercial dairy and measures time in milkings, not hearings. When the new FMMO rules kicked in around June 1, 2025, his co‑op’s economist didn’t send him a white paper. She sent him a number: AFBF economist Daniel Munch’s September 2025 Market Intel showed roughly 85–93¢/cwt in class‑price reductions from higher make allowances — and more than $337 million pulled from producer pool value in the first three months alone. 

For his order and plant mix, she translated that into a working range: expect somewhere around $0.60–$1.00/cwt less on each cheque over the next year. Mark ships about 20,000 cwt a month. At the low end, that’s $12,000 gone every month — roughly $144,000 over 12 months. At the high end, closer to $240,000. That’s not “interesting policy.” That’s whether you keep the loan officer relaxed and the feed mill paid on time.

Now picture the producer down the road — call her Sarah. She’s a composite, too, built from the ESG experiences multiple farms have described to us. Sarah tossed a new “Supplier Code of Conduct” email from her processor into the pile on the kitchen table. It linked to a glossy brochure about sustainability, asked her to complete an online questionnaire about manure, energy, and welfare, and used words like “partnership” and “journey.” Fresh cows in the pen and a scraper that wouldn’t start. The survey could wait.

A year later, the tone from procurement on these programs was different at some plants. Supplier codes and ESG surveys were feeding internal risk‑sorting tools that grouped farms by perceived risk level, tied to “time‑bound corrective action” language and, on paper, potential termination if issues weren’t addressed. ESG and procurement teams were using that data to show management which suppliers looked lower‑ or higher‑risk.

Mark and Sarah faced the same wall of noise: FMMO modernization, Dairy Margin Coverage 2026 changes, USMCA review chatter, ESG pressure from retailers and banks. The difference wasn’t that Mark cared more about policy. He just ran every headline through three questions before he gave it his time. Sarah didn’t have a filter at all.

Here’s how you steal those three questions for your own operation — and stop letting policy eat hours of your week without giving anything back to your margin.

Policy HeadlineChanges 12-Mo Math?Decision Deadline3–5 Year Ground ShiftBucket
FMMO make-allowance changes (Jun 2025)YES — $0.60–$1.00/cwtAlready in effectClass I formula, pool dilution🔴 Act Now
DMC 2026 Tier 1 expansion to 6M lbsYES — up to $0.15/cwt savingsFeb 26, 20266-year lock-in at 25% discount🔴 Act Now
USMCA 2026 joint reviewIndirect — TRQ fill rates avg 42%2026 review milestonesMarket access, import competition🟡 Watch
ESG supplier survey (processor)Not directly — risk tier riskVaries by contractAudit/termination clause risk🟡 Watch
Canada NPF 2028 consultationsNo — 2028+Jan 2026 input windowSafety net depth (AgriStability)Ignore for Now
Carbon tax adjustmentsMarginal — varies by province/stateOngoingInput cost creepIgnore for Now

What’s Actually Changed — FMMO Reform 2026 and the Rest of the Noise

On the U.S. side, USDA’s final FMMO decision raised make allowances, butter, nonfat dry milk, and whey, updated product composition factors, adjusted some Class I differentials, and returned the Class I mover to the higher of Class III or IV starting June 1, 2025. In that first look‑back, Munch’s AFBF Market Intel analysis calculated that higher make allowances alone trimmed 85–93¢/cwt off class prices and removed more than $337 million from combined producer pool value in the first three months. Composition factor updates add back around $110 million over the first half‑year — real money, but it doesn’t erase the hit.

Dairy Margin Coverage shifted under your feet, too. For 2026, USDA’s Farm Service Agency reset each farm’s production history to the highest annual marketings from 2021, 2022, or 2023 and expanded Tier 1 coverage from 5 million to 6 million pounds. The 2026 sign‑up window is also your one shot to lock in a coverage level and percentage for 2026–2031 in exchange for a 25% discount on Tier 1 premiums. Enrollment opened mid‑January and closes February 26, 2026, according to FSA national and state office reminders. Miss that, and you’re self‑insuring Tier 1 for the year.

Zoom out further, and trade is humming in the background. The 2026 joint review of the USMCA will reopen questions about dairy access among the U.S., Canada, and Mexico. USMCA promised U.S. dairy roughly $200 million in new annual access to the Canadian market — about 3.6% of Canada’s dairy consumption — but tariff‑rate quota data show average fill rates of only about 42%, with 9 of 14 quotas below 50% in 2022/23. That under‑use has already fuelled formal USMCA disputes and plenty of frustration among U.S. dairy groups and negotiators.

Then there’s “policy by contract.” Supplier codes from global processors say it plainly: they only partner with suppliers who comply with environmental, welfare, and labour requirements, they reserve audit rights, and they can terminate relationships if high‑risk issues aren’t corrected. ESG supply‑chain planning guidance tells those processors to score suppliers on risk, audit the flagged ones, and prioritise low‑risk milk when retailers and banks squeeze.

Meanwhile, North of the Border

If you’re shipping under quota, your stress looks different — but you’re not off the hook.

In Canada, the Sustainable Canadian Agricultural Partnership (Sustainable CAP) runs from 2023 through March 31, 2028, as the main framework behind AgriStability, AgriInvest, AgriInsurance, AgriRecovery, and cost‑shared sustainability and innovation programs. Ottawa launched consultations in January 2026 on the Next Policy Framework (NPF) that will replace it for 2028–2033. Federal and provincial governments are now gathering input on priorities like competitiveness, climate resilience, and risk management as they shape the next five‑year agreement.

For Canadian producers, that framework plays a role similar to that of DMC and other federal tools in the U.S. It doesn’t set your mailbox price, but it shapes how AgriStability, AgriInvest, and other supports respond when margins squeeze. You may not see “NPF 2028” printed on your milk cheque — but it quietly decides how deep the safety net is when weather and markets turn.

Every one of those pieces lands in your feed as “news.” The reality: only a few change your numbers, your deadlines, or your ground in a way that deserves more than a skim.

The Barn Math — DMC 2026 Lock‑In Versus the FMMO Headwind

Back to Mark and that FMMO reality check.

Using that 85–93¢/cwt class‑price impact range and a realistic view of his order’s utilization and plant mix, his co‑op’s economist told him to plan for something in the neighbourhood of $0.60–$1.00/cwt less on his cheque over the next year. Not a perfect model. A band you can work with.

Instead of burying that in prose, here’s how it looks on paper — with a DMC year that lines up with what you’ve already seen when margins got ugly.

ScenarioImpact per cwtMonthly (20,000 cwt)Annual Impact
FMMO (Low End)−$0.60−$12,000−$144,000
FMMO (High End)−$1.00−$20,000−$240,000
DMC 2026 Payout*+$1.50+$30,000≈+$82,650 (5.51M lbs covered)

*Example uses a 5.8M‑lb production history at 95% coverage (55,100 cwt) and a hypothetical .50/cwt average annual DMC payment — similar to some of the worst 2019–2020 margin months when modelled over a full year; used here as a stress‑test scenario, not a forecast.

For that 5.8M‑pound herd:

  • Covered pounds = 5.8M × 0.95 = 5.51M lbs.
  • Covered cwt = 5.51M ÷ 100 = 55,100 cwt.
  • Tier 1 premium at $0.15/cwt for $9.50 coverage — the 2026 Tier 1 rate listed by Penn State Extension with the 25% lock‑in discount baked in — comes to 55,100 × 0.15 ≈ = $8,265

Margin history from 2019–2025 includes several years where DMC payments at higher coverage levels more than covered annual premiums for many herds. It doesn’t take many bad months with average payments around $1.50/cwt to repay an $8,265 premium on that volume.

The ESG Side of the Cheque

Now look again at Sarah’s composite.

Her processor’s supplier code spelled out that they partner only with suppliers who comply with environmental, labour, and animal‑welfare requirements — and that they can audit farms, request documentation on emissions, energy, manure, and welfare, and require action plans if they find problems or data gaps. High‑risk suppliers get corrective action plans with deadlines. Failure to address issues can end the relationship.

That first survey email sounded optional. But in 2026, a no‑response on an ESG survey usually isn’t neutral — in many supplier‑risk systems, it’s treated as a data gap that pushes your farm toward the “higher‑risk” bucket, right alongside weak paperwork or unresolved issues. ESG and procurement teams are already using that data to rank suppliers for audits and, when things get tight, decide whose milk is simplest to keep.

ESG Response StatusHow Processor Software Reads YouTypical ConsequenceTimeline Risk
Survey completed, no flagsLow-risk supplierPriority in milk volume allocationStable
Survey completed, gaps notedMedium-riskCorrective action plan requested30–90 day window
Survey ignored / no responseHigh-risk (data gap = red flag)Audit triggered; at bottom of volume-cut listImmediate
Repeated non-responseUnacceptable supplier riskPotential relationship terminationContract cycle
Survey completed + audit passedVerified low-riskRetailer/bank ESG credit for processorPositive long-term

Good or bad, that’s how their software reads you.

You can’t outrun make allowances by scrolling your phone. The lesson is simpler: you need a fast way to decide whether a headline belongs in your barn math, your calendar, or your trash folder.

The Three‑Question Filter That Keeps Policy in Its Place

You don’t need to enjoy politics to protect your milk cheque. You need three questions you can ask about any policy headline, email, or rumour in under two minutes.

“Does this change my math within 12 months?”

“Does this create a decision window I can actually miss?”

“If this keeps marching for 3–5 years, does it change the ground my operation stands on?”

Here’s what each one is really asking.

How Much Does This Change Your 12‑Month Math?

This is your first cut. Any change that touches your milk price formula (FMMO changes, premiums, hauling adjustments), your safety‑net math (DMC rules, AgriStability margins), or known costs (carbon taxes, labour rules, feed subsidies) deserves a quick “can I put a believable per‑cwt or per‑cow number on this for the next year?”

For FMMO, you’ve already got a starting point: AFBF’s 85–93¢/cwt class‑price hit from higher make allowances. Once you run that through your order’s utilization and your plant’s product mix, it becomes a $0.60–$1.00/cwt working range for your cheque. For DMC, FSA and Extension have already laid out how the new 6M Tier 1 cap and production‑history reset change which part of your volume gets covered cheaply.

If you can’t get to a range for your own operation with help from one or two trusted sources, you either need better sources — or that headline probably doesn’t belong in your “urgent” pile.

How Much Does Waiting 30 Days on FMMO or Dairy Margin Coverage 2026 Actually Cost?

“Wait and see” feels reasonable when you’re tired, and the numbers are fuzzy. Sometimes it is. The trick is stopping it from becoming your default answer to everything that makes your head hurt.

Take that 5.8M‑pound DMC farm. If you shrug and let February 26 slide, you’ve decided to self‑insure Tier 1 for the year — even though margin history from 2019–2025 shows several years where DMC payments at high coverage more than covered premiums for many herds. That decision might be fine if your cost of production is low and you’re comfortable riding the margin. It’s not fine if you just never sat down with a pencil because somebody forwarded a scary link about something else that failed all three questions.

FMMO is the same story. If AFBF’s analysis and your plant’s product mix suggest a realistic $0.60–$1.00/cwt headwind on average mailbox prices once everything bakes in, “wait 30 days” doesn’t improve the forecast. It just pushes back when you revisit risk coverage, tighten cost targets, or re‑evaluate expansion projects that only work at pre‑reform prices.

The real question isn’t “Could this analysis be off?” It’s this: if that range is right and you do nothing, can your operation carry it for a year at current feed, interest, and labour? If your gut says no, waiting isn’t neutral anymore.

Is Your Contract Language Already Writing Policy for You?

On the operational side, a lot of the policy that will matter most to your farm over the next five years isn’t hiding in Parliament or Congress. It’s in contracts.

Supplier codes from global dairy companies are clear on three points. They expect compliance with specific environmental, animal‑welfare, and labour standards — often referencing local law and sometimes going beyond it. They reserve the right to audit your operation, request documentation, and require action plans if they identify problems or data gaps. And they give themselves the option to end relationships with suppliers who don’t correct high‑risk issues within set timelines.

ESG planning guidance tells these companies to categorise suppliers as low, medium, or high risk, then prioritise lower‑risk suppliers when squeezed by retailers, banks, or emission‑reduction commitments. Data you send — or don’t send — in that first “voluntary” survey directly feeds those scores.

If you haven’t read the ESG, audit, and termination sections of your own supplier code or milk contract in the last year, you’re letting someone else decide what risk tier your farm occupies without even knowing the tiers exist. You might be perfectly comfortable where you are. Or you might find out you’re at the bottom of the list only when volume cuts land on your desk.

Options and Trade‑Offs for Farmers

You can’t turn the policy tap off. You can decide how much gets past your gate. Here’s how producers are using the three‑question filter — and what each path demands.

Barn Math First, Politics Later

When it makes sense: You’re already using at least one risk tool (DMC, DRP, crop insurance) and you’re comfortable with a pencil and a calculator.

What it requires: Any time a big headline shows up — FMMO tweaks, DMC changes, USMCA review drama, ESG survey — ask yourself: “Can I get a credible per‑cwt range for this on my farm in the next 12 months?” If yes, what does that look like on your monthly cwt? Lean on one or two trusted sources for the heavy lifting — your co‑op economist, Extension, or a piece that translates policy into cheque math.

Risks/limits: If you don’t have those sources, you risk either underplaying real hits (like making allowances) or overreacting to noise. And barn math is only as honest as your breakeven — if the base numbers are fiction, the filter won’t save you.

The Calendar and Contract Gate

When it makes sense: You’re not spending evenings reading market intel, but you’ll respect hard dates and signatures.

What it requires: Put a single sheet or whiteboard in the office with three columns: “Act Before,” “Ask Before,” and “Ignore For Now.” “Act Before” gets DMC sign‑ups, crop insurance deadlines, DRP windows, and any AgriStability/AgriInvest enrollment dates on your side of the border. “Ask Before” applies to the USMCA 2026 review, co‑op meetings, and any session where your buyer explains their plan. “Ignore For Now” gets headlines that don’t pass any question and carry no date.

Risks/limits: If nobody owns updating that sheet weekly, it becomes wallpaper. Someone — you, a partner, the family member who actually reads this stuff — has to be the designated filter and move items between columns as things develop.

Treat ESG as Contract Risk, Not PR

When it makes sense: Your milk goes to a processor selling into big retail or export markets, and their website is full of “net‑zero,” “scope‑3,” and “responsible sourcing” language.

What it requires: Read every supplier code, sustainability annex, and contract update your buyer sends. Highlight anything about ESG data, audits, “continuous improvement,” or termination. Ask blunt questions: “If I don’t fill out this survey, what happens to my status?” and “Are you scoring suppliers? If so, how?” You don’t have to like the answers. But you’re making decisions with eyes open instead of assuming good farming speaks for itself.

Risks/limits: This won’t stop ESG from coming. It keeps you from being blindsided when procurement starts treating ESG like quality or SCC. If you strongly disagree with the direction, the bigger decision is whether to stay in that buyer’s system at all.

Install a Designated Filter in 30 Days

When it makes sense: You’re running 200–500 cows, you don’t have a “policy person,” and every week someone different is forwarding “urgent” links into the family group chat.

What it requires (within 30 days): Choose one person — the owner, a partner, or a family member who actually reads — and make it their explicit job to filter the policy. Give them 20–30 minutes once a week to run every headline, email, or rumour through the three questions and sort them: “Act Now,” “Watch,” or “Noise.” Only “Act Now” items go on the weekly meeting agenda. “Watch” items get a look at the end of the month. “Noise” dies on their notepad.

Risks/limits: Only works if everyone agrees to respect the filter. If you still treat every Facebook thread like an emergency, you’re back to chaos. But if you back the filter, you trade random panic for a predictable, small time cost that protects a very large cheque.

Key Takeaways

  • If you can’t get to a realistic 12‑month per‑cwt impact for your own volume, a policy headline doesn’t outrank chores. Ask your co‑op, Extension, or a trusted source to turn it into barn math first.
  • If there’s a date on it — DMC signup, a USMCA review milestone, a supplier‑code acknowledgment, a contract auto‑renewal — treat it as a decision window, not background noise. Saying nothing before the deadline is still a decision; it might not be the one you’d pick on purpose. 
  • If your main buyer talks about ESG, net‑zero, or “responsible sourcing,” treat supplier codes and sustainability surveys like policy notices, not marketing fluff. Read the audit, data, and termination clauses and decide whether you’re willing to live in the tier they assign you. 
  • If your production history sits between 5 and 6 million pounds, the 2026 DMC upgrade to a 6M Tier 1 cap and six‑year lock‑in changed your numbers enough that “same as last year” isn’t a safe default. Run the new math or call your FSA office now. 
  • If your order’s best estimates point to a $0.60–$1.00/cwt headwind from FMMO changes once make allowances and utilization settle, ignoring it isn’t neutral. Either your balance sheet carries that for a year, or you adjust risk coverage, costs, or capital plans now. 

The Bottom Line

The three questions didn’t make the noise go away for producers like Mark. They made it obvious which pieces belonged in barn math, which belonged on a calendar, and which belonged in the trash icon. Farms like Sarah’s didn’t have that filter. By the time they realised their “voluntary” ESG survey had been feeding into a risk-tiering system, their buyer already had a list of farms flagged as harder to keep when things got tight.

So, does your operation look more like Mark’s — pencil to cheque, questions before panic — or more like Sarah’s, finding out about the tiers a year late?

The question isn’t whether policy is getting louder. It’s whether, if FMMO tweaks, a missed DMC cycle, or an ESG‑driven contract change knocks $0.75/cwt off your cheque next year, you’d catch it early enough to move — or hear about it from a neighbour in the parlour after the fact.

Complete references and supporting documentation are available upon request by contacting the editorial team at editor@thebullvine.com.

Learn More

The Sunday Read Dairy Professionals Don’t Skip.

Every week, thousands of producers, breeders, and industry insiders open Bullvine Weekly for genetics insights, market shifts, and profit strategies they won’t find anywhere else. One email. Five minutes. Smarter decisions all week.

NewsSubscribe
First
Last
Consent

The Butterfat Reckoning: $337 Million Lost in 90 Days – And Your Herd’s Best Trait May Be Next

You bred for butterfat. You won. Now $337M is gone in 90 days—and processors want less of what made your herd profitable. The math changed. Did anyone tell you?

EXECUTIVE SUMMARY: U.S. dairy farmers lost $337 million in 90 days under new FMMO rules—and the genetics they spent a decade perfecting are now working against them. Butterfat climbed 13% since 2015, but protein didn’t keep pace: the average protein-to-fat ratio is 0.77, well below the 0.85-0.90 range processors need for efficient cheesemaking. Some plants have restructured contracts, paying reduced premiums for butterfat above threshold levels, while AFBF analysis shows Class price cuts of 85-93 cents per hundredweight. Canadian producers face parallel pressure—Western provinces shift from 85% butterfat pricing to 70% in April 2026. The playbook for 2026: get your contract terms in writing this week, calculate your herd’s ratio today, and select genetics for component balance rather than butterfat alone. The producers navigating this best understood their contracts before the rules changed.

When a 550-cow operator in east-central Wisconsin reviews his numbers these days, the economics look different than they did a few years back. His herd tests 4.58% butterfat—a genetic achievement that would have earned solid premium dollars not long ago. Today, his processor’s payment structure means production above a certain threshold earns reduced premiums.

“We did exactly what we were told to do for years,” he explained in a conversation for this article, asking that his name be withheld due to ongoing contract negotiations. “Now I’ve got daughters in the milking string from bulls I selected back in 2019, and I can’t change that overnight.”

He isn’t alone in this. Not by a long shot. For the past decade, U.S. dairy farmers responded to clear market signals. They bred for butterfat. They optimized rations for components. They invested in genetics that pushed Holstein herds from 3.75% butterfat in 2015 to 4.24% by 2024—a 13% increase in just ten years, according to USDA milk production data and Council on Dairy Cattle Breeding records. The CoBank Knowledge Exchange reported in September 2025 that this growth rate is roughly six times faster than that of the European Union or New Zealand over the same period.

Now, producers across the country are navigating a market where some of those premium structures are changing. Certain processors have adjusted how they value components above certain thresholds. Export markets that absorbed excess butterfat face trade policy questions. The situation keeps evolving, and thoughtful producers are adapting their strategies accordingly.

This isn’t a story about mistakes—farmers or otherwise. It’s a story about how pricing signals, genetic acceleration, and processor economics can create dynamics that shift over time. Understanding these forces helps us make better decisions going forward.

The Logic Behind Butterfat Focus

To understand the current landscape, it helps to revisit the reasoning that drove butterfat optimization. And honestly? The logic was sound based on the information and incentives available at the time.

Back in 2013, butterfat accounted for about 32% of the Class III milk price, according to Federal Milk Marketing Order data. By 2015, that figure had climbed above 50%. Then by July 2017—and those of you watching milk checks closely will remember this—butterfat was trading at $2.95 per pound while protein sat at $1.22. Nearly a 2.4:1 premium for fat over protein. Progressive Dairy documented this shift extensively, and it naturally influenced breeding priorities across the industry.

The genetic selection tools aligned with these market signals. Leadership at the Council on Dairy Cattle Breeding has explained that Net Merit$ weightings reflect what the market signals to producers—in this case, more fat and more components. The pricing system was essentially communicating: we value more butterfat.

The farm-level economics were compelling. According to analysis from June 2025, producing one pound of strategic butterfat over the past decade generated an average of $2.54 in gross income while requiring only about 52 cents in nutrient costs—a marginal net return of roughly $2.02 per pound. With numbers like that, breeding for fat made clear economic sense.

Key factors driving butterfat selection from 2014 to 2020:

  • Federal Milk Marketing Order pricing that rewarded components
  • Consumer demand is shifting toward butter, whole milk, and premium cheese
  • Genomic testing (available since 2009) enabling rapid genetic acceleration
  • Net Merit$ index weighting butterfat at historic highs
  • COVID-era quota systems that encouraged component density over volume

Genomic testing particularly accelerated the pace of change. Before 2009, genetic progress moved more gradually—farmers waited years for bull daughters to prove a sire’s value. After genomic testing became available, breeders could predict about 70% of a young bull’s genetic potential immediately, deploying high-butterfat genetics across the national herd within a few breeding cycles.

The April 2025 genetic base change illustrates this progress pretty clearly. Butterfat shifted by 45 pounds for Holsteins—an 87.5% larger adjustment than the 24-pound change in 2020, according to CDCB. That represents the fastest butterfat genetic gain in Holstein breed history.

Kevin Jorgensen, senior Holstein sire analyst at Select Sires, noted the continuing trajectory in January 2025: “Absolutely, we’re going to see additional gains. The emphasis placed upon this is not waning.”

So the genetics kept pushing forward even as some market dynamics began shifting underneath.

Understanding the Processor Side

This is where things get technical, but stick with me—it’s worth understanding because it explains what’s driving some of these contract changes.

Cheesemakers generally achieve better efficiency with milk at a protein-to-fat ratio roughly in the mid-0.80s to 0.90 range, though this varies somewhat by cheese type. At ratios in that range, fat and protein transfer into the cheese curd efficiently, waste is minimized, and yields are optimized. The American Dairy Products Institute has emphasized that standardizing the fat-to-protein ratio is one of the most important factors in ensuring optimal cheese quality and quantity.

Here’s the challenge. Current U.S. milk averages a ratio of about 0.77—down from the 0.82-0.84 range that held fairly steady from 2000 to 2017. The CoBank Knowledge Exchange reported in September 2025 that butterfat has been growing at roughly twice the pace of protein, which has driven the decline in that ratio. Both Feedstuffs and Hoard’s Dairyman covered this imbalance in their fall 2025 coverage.

MetricProtein-to-Fat Ratio
Current U.S. Average0.77
Processor Optimal Range (Low)0.85
Processor Optimal Range (High)0.90
Gap from Optimal-0.08 to -0.13

Research published in Frontiers in Veterinary Science has demonstrated that milk composition significantly affects cheese-making efficiency, with the protein-to-fat ratio playing a central role in determining both fresh and ripened cheese yields. When milk composition deviates from optimal ranges, processors can experience reductions in cheese output and higher nutrient losses in the whey stream.

Why does this matter to farmers? Because processors have costs they need to manage, and those costs ultimately affect what they can pay for milk.

Common processor approaches to managing composition:

  • Cream removal: Separating excess butterfat before cheesemaking, then selling that cream separately—sometimes at different margins than cheese
  • Protein fortification: Adding nonfat dry milk, condensed skim, or ultrafiltered milk to rebalance the ratio before processing
  • Ultrafiltration investment: Installing membrane technology to concentrate proteins and adjust composition

Each approach involves expense. From the processor’s perspective, they’re managing milk composition to optimize their operations. Understanding this helps explain why some contract structures are evolving.

What Farmers Are Experiencing

The picture became clearer for many producers in late 2025 when component premiums stopped scaling as they had previously. Reports from multiple regions indicate that some processors have introduced payment structures where the incremental value of butterfat above certain thresholds is reduced. While individual levels vary by contract, producers in several areas report that additional butterfat above their processor’s preferred range no longer receives full premiums.

In October 2025, cheese processors reported milk is too high in fat relative to milk protein. Some cheese plants were essentially saying, “Don’t send me more butterfat.” By December, industry analysis indicated that premiums for higher butterfat had diminished for production above certain thresholds. What we saw is, the milk check, it got way too heavy in components.

To illustrate how this might affect an operation:

For a 600-cow herd shipping about 13.8 million pounds of milk annually at 4.6% fat, if the payment structure recognized full premiums only up to a certain point—say around 4.5%—the 0.1-point difference would represent roughly 13,800 pounds of butterfat that might earn a reduced premium. At even $0.50 per pound reduction in premium value, that’s approximately $6,900 in foregone annual income—or roughly $11.50 per cow per year left on the table. The actual impact varies considerably by contract, but the math helps illustrate why this matters.

One aspect that keeps coming up in conversations is that these details weren’t always clearly communicated upfront. A central Wisconsin producer described his experience: “I had to sit down with three months of milk checks and back-calculate before I understood what was happening. Nobody had really walked me through how the payment structure worked at higher test levels.”

I heard something similar from a California producer in the San Joaquin Valley who’s been running the same analysis. “We’re at 4.4% fat and thought we were in good shape,” he shared. “Then I realized our processor changed how they calculate premiums above 4.2%. Different market out here, but same basic dynamic.”

This points to an opportunity—and one of the most practical recommendations we can make: understanding your specific contract terms in detail.

How Other Regions Approached Component Growth

An interesting comparison emerges when we look at how other major dairy regions experienced this same period. Why did European and New Zealand farmers see different outcomes?

The differences trace back to structural factors rather than farmer decision-making.

Breed composition plays a significant role. The U.S. dairy herd is predominantly Holstein—a single breed that responded uniformly to genomic selection pressure. When U.S. farmers bred for butterfat, the national herd moved in that direction together. New Zealand’s herd is about 60% Holstein-Friesian/Jersey crossbreeds—the “KiwiCross”—with the remainder split among various breeds. The EU has significant breed diversity across countries. Different breed mixes respond differently to selection pressure.

Jersey crosses naturally produce higher protein-to-fat ratios. When New Zealand farmers selected for components, they achieved more balanced improvements in both fat and protein.

Pricing structures created different incentives. U.S. Federal Milk Marketing Orders explicitly reward individual components—which is why U.S. farmers responded so directly to component signals. EU milk pricing is largely based on intervention prices for butter and skim milk powder rather than on component premiums paid directly to farmers, according to the European Commission DG AGRI Dashboard. Different incentive structures led to different breeding emphases.

Here’s how the numbers compare:

RegionButterfat 2015Butterfat 202410-Year Change
U.S.3.75%4.24%+13.0%
EU4.03%4.13%+2.5%
New Zealand5.02%5.14%+2.4%

Source: CoBank Knowledge Exchange analysis (September 2025) reporting actual 2024 calendar year data; CLAL international dairy statistics

New Zealand already had higher butterfat than the U.S. Their breeding programs emphasized maintaining ratio balance while improving overall efficiency. Neither approach is inherently superior—they reflect different market structures and breeding objectives. But understanding these differences helps contextualize the U.S. experience.

But the international comparison isn’t just academic—because those other regions are also our customers.

The Export Market Factor

During early to mid-2025, U.S. butterfat exports frequently ran more than 140% above year-earlier levels, with some months nearly tripling prior-year volumes, according to USDA Foreign Agricultural Service data. Brownfield Ag News reported in November 2025 that butterfat exports to Canada alone were up 73%, with butter exports climbing 190%.

That export growth absorbed domestic production and supported prices. But it also created dependencies worth monitoring.

Current export market concentration:

  • Mexico: More than 25% of all U.S. dairy exports—our largest and most consistent customer. CoBank’s December 2024 analysis noted that Mexico’s share of U.S. dairy product exports had grown to about 29% by late 2024.
  • Canada: Second-largest market by value at $1.14 billion in 2024
  • China: A key market for whey and specialty products, though exports have declined since 2022
Export MarketShare of U.S. Dairy Exports2026 Trade Risk
Mexico~29%USMCA renegotiation
Canada~18%Supply management tensions
China~12%Trade policy uncertainty
Other Markets~41%Mixed/regional

These three markets account for a substantial share of U.S. dairy export volume. All three face some degree of trade policy uncertainty heading into 2026, with USMCA renegotiation on the calendar and China trade dynamics continuing to evolve.

The American Farm Bureau Federation has described the U.S. dairy’s trade outlook as requiring careful navigation. CoBank’s lead dairy economist, Corey Geiger, has emphasized in multiple analyses that trade relationships—particularly with Mexico—are increasingly important to domestic market stability and that disruptions could pose significant challenges.

For producers focused primarily on their milk checks, trade policy can seem distant. But export market access affects domestic supply-demand balances, which ultimately influences what processors can pay.

What Canadian Producers Should Know

For our Canadian readers, the dynamics play out differently under supply management—but the underlying tension between fat and protein is creating similar conversations north of the border.

Canada’s Western Milk Pool is making a significant shift. The BC Milk Marketing Board announced in October 2025 that, effective April 1, 2026, Western Canadian provinces (British Columbia, Alberta, Saskatchewan, and Manitoba) will change their component pricing allocation from 85% butterfat / 10% protein / 5% other solids to 70% butterfat / 25% protein / 5% other solids. That’s a major rebalancing—protein’s share of producer payments will more than double.

ComponentCurrent (Pre-April 2026)New (April 1, 2026)Change
Butterfat85%70%-15 pts
Protein10%25%+15 pts
Other Solids5%5%

The signal is clear: even in a quota system that’s historically emphasized butterfat, there’s growing recognition that protein deserves more weight in producer payments. Canadian producers selecting genetics today should factor this shift into their breeding decisions. The April 2025 Canadian genetic evaluations highlighted sires like FRAHOLME VEC TRITON-PP, ranking 30th on GLPI with +940 kg Milk, +105 kg Fat, and +63 kg Protein—the kind of balanced production profile that may become increasingly valuable under the new payment structure.

Practical Approaches Farmers Are Taking

Producers who recognized these dynamics early have been adapting their strategies. Their approaches offer useful frameworks to consider—whether you’re running a 200-cow family operation in Vermont, a 2,000-cow dairy in the Central Valley, or something in between. Specific processor options and contract structures vary by location, but the underlying principles apply broadly.

Contract clarity has become a priority. The question on a lot of minds right now: “At what point does my component premium structure change, and how?” Getting this in writing enables informed decision-making about ration and genetic investments.

An eastern Wisconsin producer described his experience after getting clearer on his contract terms in fall 2025: “Once I understood exactly how the payment structure worked at different test levels, I could actually plan around it. Before that, I was working with incomplete information.”

Ration adjustments are becoming more common. Nutritionists report increased interest in shifting from maximum-butterfat rations toward balanced-component approaches. Typical adjustments include:

  • Reducing rumen-protected fat supplementation from 1.5% to 0.5% of dry matter
  • Increasing alfalfa hay/haylage proportion for protein support
  • Adding rumen-protected amino acids (lysine, methionine) to maintain protein while moderating fat

University of Minnesota dairy nutrition work led by Isaac Salfer, assistant professor of dairy nutrition, suggests that in many herds, component changes begin to show within roughly 4-6 weeks of a ration adjustment, with new steady-state levels often reached by 8-12 weeks—though actual timelines can vary by herd and ration specifics. These aren’t overnight changes, but they’re not multi-year horizons either.

  • Exploring processor options makes sense. Farmers with competitive alternatives are obtaining quotes from multiple processors before contract renewals. Even without switching, documented alternatives provide useful context for conversations with current partners.
  • Revenue diversification continues expanding. The beef-on-dairy approach has gained significant traction, with Holstein/Angus and Jersey/Angus cross calves commanding premium prices at weaning, according to recent USDA livestock market reports. Breeding a portion of the herd to beef genetics generates meaningful calf revenue—diversification that reduces dependence on any single revenue stream. Several producers I’ve spoken with describe this as one of their more impactful recent decisions.
  • Genetic planning is evolving. While existing genetics represent previous decisions—those daughters are already producing—future breeding choices can emphasize a balance between protein and fat alongside other traits. Sire catalogs still feature many high-butterfat genetics. Dairy Global reported in January 2025 that among the top 100 Holstein sires, only six were negative for the fat test. But balanced-ratio options exist. The April 2025 evaluations identified sires showing strong component balance—bulls transmitting positive deviations for both fat percentage and protein percentage, rather than fat alone. When reviewing sire summaries, look beyond total pounds to the percentage deviations and the fat-to-protein relationship in the proof.

What’s Likely to Change

Now, I know federal order math isn’t anyone’s favorite topic, but the numbers here matter because they’re already hitting milk checks.

The 2025 FMMO reform isn’t just a policy update—it’s a fundamental reset of the American milk check. After a record 49-day national hearing that concluded in January 2024, USDA released its final decision on November 12, 2024. Producers in all 11 federal orders voted to approve the changes, and the new pricing formulas took effect June 1, 2025, according to USDA’s Agricultural Marketing Service.

Product CategoryMake Allowance Increase (¢/lb)
Cheese5.0
Butter5.4
Nonfat Dry Milk5.9
Dry Whey6.6

The changes are substantial. Make allowances increased by 5 to 7 cents per pound across cheese, butter, nonfat dry milk, and dry whey—representing a larger share of wholesale value going to processors. Farm Credit East documented the specific increases: cheese up 5 cents, butter up 5.4 cents, nonfat dry milk up 5.9 cents, and dry whey up 6.6 cents per pound.

The financial impact has been significant. Danny Munch, economist with the American Farm Bureau Federation, told Brownfield Ag News in June 2025 that once you net the negative make allowances against the benefits from updated Class I differentials and the return to the “higher of” Class I mover, dairy farmers still face meaningful losses. By September 2025, AFBF’s detailed analysis showed farmers had lost more than $337 million in combined pool value in just the first three months under the new rules, with Class price reductions ranging from 85 to 93 cents per hundredweight depending on the order.

The composition factor changes—updating baseline assumptions to 3.3% protein, 6% other solids, and 9.3% nonfat solids—took effect December 1, 2025, according to USDA’s final rule. These updated factors finally acknowledge what’s actually in today’s milk rather than formulas designed when milk tested around 3.5-3.6% fat and 3.1% protein.

Between processor payment restructuring and FMMO reform impacts, high-butterfat herds face a potential double squeeze heading into 2026. The producers navigating this best are those who understood their contracts before the rules changed—and who are now positioning their herds for what processors actually need, not what the old incentives rewarded.

Processor consolidation continues. The Arla Foods/DMK Group merger, expected to complete in 2026, will create a cooperative of more than 12,000 member farms processing approximately 19 billion kilograms of milk annually—the largest dairy company in Europe, according to Dairy Reporter’s April 2025 coverage. Similar consolidation dynamics exist in other regions. Larger processors typically have greater standardization capacity and different economics for managing milk composition.

Component evaluation discussions are evolving. CoBank economists suggested in their September 2025 analysis that protein may increasingly drive breeding decisions as market conditions evolve. Industry discussions increasingly focus on developing selection tools that emphasize component ratio balance rather than maximizing individual components—a recognition that what processors need and what the genetic indexes have been rewarding may not always align perfectly.

Industry leaders continue pushing for mandatory processor cost surveys to inform future make allowance discussions. NMPF CEO Jim Mulhern emphasized in October 2025 comments to Brownfield Ag News that ongoing reform is necessary for the federal order system to remain effective. The conversations are happening at every level, from cooperative boardrooms to Capitol Hill.

Your Monday Morning Checklist

  1. Get your contract in writing—this week. Call your processor or co-op field rep and request complete written documentation of how component payments work at different test levels. Don’t accept verbal explanations. You need the actual payment schedule showing where premiums flatten or decline.
  2. Calculate your herd’s protein-to-fat ratio today. Pull your last DHI test or bulk tank analysis. Divide protein percentage by fat percentage. If you’re below 0.80, you’re producing milk that costs your processor money to rebalance. That matters for your next contract conversation.
  3. Review one month of ration costs against component returns. Sit down with your nutritionist this month and calculate the actual ROI on your rumen-protected fat supplementation. At current component values, is that investment still paying?
  4. Get a competitive quote before your next contract renewal. Even if you have no intention of switching processors, having documented alternatives strengthens your position. Make three calls.
  5. Flag three sires in your tank for ratio review. Look at your current AI lineup. For each sire, check whether the fat percentage deviation significantly exceeds the protein percentage deviation. Consider whether that balance still serves your operation’s future.
  6. Set a calendar reminder for trade and policy news. Block 15 minutes monthly to scan USDA export reports and FMMO announcements. What happens in Washington and at the border affects your milk check more than most producers realize.

The Bottom Line

The butterfat gains achieved between 2015 and 2024 represent remarkable genetic progress. U.S. farmers responded effectively to market signals and improved their components, while their global counterparts didn’t. The current situation isn’t about those decisions being wrong—it’s about market conditions evolving and creating opportunities for strategic adjustment.

What producers across the Midwest and beyond are experiencing is a transition period. The signals were real, the decisions were rational, and the current landscape calls for thoughtful adaptation. The opportunity now lies in applying the same analytical approach that drove butterfat gains toward more balanced outcomes: genetics aligned with processor requirements, contracts with clear terms, and diversified revenue that provides flexibility.

The question every producer should be asking their co-op board right now: When did you know component pricing was shifting, and why didn’t you tell us?

“I’m not upset about it,” the east-central Wisconsin producer reflected. “I’m just adjusting. That’s what we do. But I wish somebody had laid out the whole picture five years ago instead of just highlighting the premium check.”

Farmers who recognized these dynamics and began adapting in 2025 will likely view this period as a recalibration rather than a setback. The question for every operation is whether current decisions account for where markets are heading—not just where they’ve been.

Additional Resources

For those interested in exploring these topics further:

  • Council on Dairy Cattle Breeding (CDCB): Genetic evaluation tools and Net Merit$ component weightings at uscdcb.com
  • University of Minnesota Extension Dairy: Research on component management through nutrition at extension.umn.edu/dairy
  • CoBank Knowledge Exchange: Quarterly dairy economic analyses, including component and trade reports at cobank.com
  • USDA Agricultural Marketing Service: Federal Order pricing data and component values at ams.usda.gov/market-news/dairy

In upcoming coverage, The Bullvine will examine specific breeding strategies for optimizing the protein-to-fat ratio over a five-year genetic plan—including which sire lines are showing promising balance characteristics for evolving market conditions.

KEY TAKEAWAYS 

  • $337 million gone in 90 days — FMMO reforms cut Class prices 85-93¢/cwt. This isn’t projection—it’s already hitting milk checks.
  • The ratio gap is driving it — U.S. milk averages 0.77 protein-to-fat. Processors need 0.85-0.90. That mismatch explains why contracts are changing.
  • Premium structures are shifting — Some plants now cap full butterfat premiums at threshold levels. Most producers haven’t seen their actual payment schedule. Have you?
  • Canada confirms the trend — Western provinces shift from 85% butterfat pricing to 70% in April 2026. Protein’s value is rising on both sides of the border.
  • Three moves to make this week: (1) Get your contract payment terms in writing. (2) Calculate your herd’s protein-to-fat ratio. (3) Review your sire lineup for component balance.

Complete references and supporting documentation are available upon request by contacting the editorial team at editor@thebullvine.com.

Learn More

The Sunday Read Dairy Professionals Don’t Skip.

Every week, thousands of producers, breeders, and industry insiders open Bullvine Weekly for genetics insights, market shifts, and profit strategies they won’t find anywhere else. One email. Five minutes. Smarter decisions all week.

NewsSubscribe
First
Last
Consent

Your Next Milk Check Changes Everything: Why GLP-1 Drugs Just Made Protein King

Your grandfather chased butterfat. Your kids will chase protein. The switch happens on December 1. Miss it and you’re playing catch-up forever.

EXECUTIVE SUMMARY: The pharmaceutical industry just rewrote dairy economics: 30 million Americans on GLP-1 weight-loss drugs can’t digest traditional cheese but desperately need protein, ending 20 years of butterfat dominance. December 1st brings Federal Milk Marketing Order reforms requiring a 3.3% minimum protein—a threshold that will trigger deductions for unprepared farms. Three proven strategies offer paths forward: amino acid optimization (generating $38,000+ within 60 days), Jersey crossbreeding (worth $850-1,100 per cow annually), or direct processor contracts (securing $270,000+ yearly for a 650-cow operation). The split is already visible—early adapters report record profits while operations with 55%+ debt-to-asset ratios and sub-3.2% protein face elimination. December 15 marks the strategic decision deadline before January’s bank reviews. This isn’t a temporary market disruption but a permanent shift where protein premiums of $1.40-1.75/cwt will separate survivors from statistics. The market has spoken: adapt to protein economics or exit on your terms before the choice gets made for you.

Dairy Protein Strategy

I was reviewing the latest milk check when something struck me. The numbers looked familiar enough, but there’s a fundamental shift happening underneath—one that started, surprisingly enough, in pharmaceutical boardrooms rather than our dairy barns.

When Eli Lilly announced last month that its GLP-1 drug, tirzepatide, became the world’s bestselling medicine, with over $10 billion in third-quarter sales alone, most of us probably didn’t pay much attention. But here’s what’s interesting: this pharmaceutical success story is about to reshape how we think about milk components, and it’s happening faster than most producers realize.

According to Gallup’s health tracking released in October, 12.4% of American adults are now using injectable GLP-1 medications for weight loss. That’s more than double the 5.8% from February 2024. And the Trump administration’s recent negotiations with Eli Lilly and Novo Nordisk to reduce prices from around $1,000 monthly to $350 for injectables through Medicare and certain insurance programs—with oral versions potentially hitting $150 once the FDA approves them—well, that’s when adoption really takes off.

Dave Richards from IFF Consumer Insights shared something fascinating from their September 2025 report: households using these medications are fundamentally changing how they consume dairy. The implications reach far beyond individual shopping carts.

GLP-1 adoption among US adults has accelerated dramatically, doubling from 5.8% in February 2024 to 12.4% by October 2025, with projections exceeding 20% by March 2027 when oral formulations hit $150/month

Why Protein Is Suddenly Everything

The timing here is remarkable. Come December 1st—we’re talking 19 days from now—Federal Milk Marketing Order reforms kick in. The baseline protein standard jumps from 3.1% to 3.3%. If you’re shipping below that threshold, you’ll see deductions starting with your January milk check. Meanwhile, CME spot dry whey hit $0.75 per pound this week, marking an 11-month high according to the Daily Dairy Report.

Tom Henderson, who runs 600 cows near Eau Claire, Wisconsin, put it perfectly when we talked last week. “We’ve been chasing butterfat for twenty years,” he said, looking at his component premiums tracking sheet that goes back to 2008. “Now my co-op’s offering $1.40 per hundredweight premium for anything above 3.4% protein. That’s more than I’ve ever seen for fat premiums, even in the good years.”

What farmers are finding is that this isn’t just a U.S. phenomenon. The Canadian Dairy Commission announced in September that four western provinces—British Columbia, Alberta, Saskatchewan, and Manitoba—will shift their component pricing ratios come April 2026. They’re dropping butterfat’s payment weight from 85% to 70% while increasing protein from 10% to 25%. That’s a fundamental acknowledgment that the market has changed.

Looking at today’s futures tells the whole story. November Class III milk (your cheese milk) trades at $17.16 per hundredweight. Class IV (butter-powder)? $13.63. That $3.53 spread reveals exactly what processors value now.

You know, I’ve been watching robotic milking systems for years, and what’s interesting is how they might actually help with this protein push. A producer near Watertown, New York, told me his robots let him feed different groups more precisely—his high-protein genetics get exactly what they need, when they need it. “The robots don’t just milk,” he said. “They’re data collection points for component optimization.”

Timeline Watch: Critical Dates Approaching

  • Now through November 30: Last chance for nutrition adjustments to impact December protein tests
  • December 1: FMMO protein baseline increases to 3.3%
  • January 15: First milk check with potential deductions arrives
  • January 31: Banks finalize credit reviews based on new component economics

Understanding the GLP-1 Effect on Dairy Consumption

GLP-1 adoption among US adults has accelerated dramatically, doubling from 5.8% in February 2024 to 12.4% by October 2025, with projections exceeding 20% by March 2027 when oral formulations hit $150/month

Dr. Sarah Martinez, from UC Davis’s nutrition research program, has been studying the effects of GLP-1 since 2023. What she’s discovered explains a lot. These medications dramatically slow gastric emptying—food stays in the stomach much longer. While that’s great for feeling full, it creates real problems with high-fat foods.

Her research, published in the Journal of Clinical Endocrinology this September, shows that GLP-1 users experience increased discomfort with foods containing more than 20% fat. Think about that—cheddar cheese is 33% fat. Low-fat cottage cheese? Just 4%. The difference becomes physically uncomfortable for these consumers.

“My patients tell me they can’t even look at a grilled cheese sandwich anymore,” Dr. Robert Chen told me. He’s an endocrinologist at Mayo Clinic who’s prescribed GLP-1s to over 800 patients since 2022. “But they’re desperate for protein to prevent muscle loss during weight loss. We recommend 1.0 to 1.5 grams per kilogram of body weight daily.”

The IFF tracking data confirms what doctors are seeing clinically. GLP-1 households show unmistakable consumption shifts:

Declining consumption:

  • Cheese: down 7.2%
  • Butter: down 5.8%
  • Ice cream and whipped cream: down 5.5%
  • Fluid milk and cream: down 4.7%

Growing consumption:

  • Cottage cheese: up 13%
  • Greek yogurt: up 2.4% overall (premium Greek up 8.3%)
  • Whey protein beverages: up 38%

I’ve noticed something else, talking to grocery store managers from California to New York—the cottage cheese boom isn’t just about protein. It’s convenience. Single-serve containers that provide instant protein when appetite returns. No prep required.

What’s particularly telling is what’s happening in Europe. A dairy economist I know in the Netherlands mentioned their processors are already reformulating products for the “Ozempic generation”—lower fat, higher protein, smaller portions. They’re six months ahead of us on this trend.

Down in New Zealand, where grass-based systems dominate, they’re having different conversations. A producer I spoke with at a recent conference said they’re exploring supplementation strategies they never would’ve considered five years ago. “Grass milk’s great,” he said, “but grass alone won’t hit these protein targets.”

Three Strategies That Are Actually Working

StrategySpeed to ResultAnnual ImpactInvestmentRisk LevelTimeline
Nutrition Optimization60 days$38,000$3,500/monthLowStart immediately
Jersey Crossbreeding18-30 months$850-1,100/cow$18-35/breedingMediumHeifers freshen in 24-30 mo
Processor ContractsImmediate$270,000+ (650 cows)Relationship mgmtLowLock in 30 days

I’ve been talking to producers across different regions, and what’s fascinating is how operations are approaching this challenge. The smartest ones? They’re doing all three of these simultaneously.

Strategy 1: Fast-Track Nutrition (60-75 Day Results)

Mike Johannsen runs a nutrition consulting firm in Madison, working with about 40 dairy operations. “Forget dumping more crude protein in the ration,” he told me at World Dairy Expo. “That’s expensive and usually makes things worse.”

According to Johannsen, what works is precision amino acid balancing. Keep metabolizable protein at requirement levels but optimize the profile: lysine at 7.2-7.5% of metabolizable protein, methionine at 2.4-2.5%, maintaining that crucial 3:1 ratio.

A 480-cow operation near Fond du Lac documented everything for me. Started September at 3.12% protein. By late November, they’re expecting 3.28%. That translates to $38,000 additional annual revenue at current premiums. And here’s the kicker—they actually reduced crude protein by 1.5 percentage points and cut feed costs twelve cents per hundredweight.

Current market pricing for rumen-protected amino acids ranges from $8 to $ 12 per pound for lysine and $6 to $ 9 for methionine. For a 500-cow operation, you’re looking at roughly $3,500 monthly. But the documented returns are $3-5 for every dollar invested when you balance it right.

I talked to a producer near Modesto, California, who’s seeing similar results. “The heat stress out here makes protein optimization even more critical,” she explained. “We’re hitting 3.35% protein consistently now, up from 3.08% in July.”

What’s interesting about seasonal patterns—spring grass tends to be lower in metabolizable protein than people think. A nutritionist in Vermont told me that May and June are actually their toughest months for meeting protein targets in pasture-based systems. “Fresh grass looks great, but the protein’s all degradable. We need to supplement even on pasture.”

Strategy 2: The Genetics Play (18-30 Month Payoff)

This one’s controversial, I know. But the University of Minnesota’s 20-year crossbreeding study, which wrapped up in 2023 under Dr. Les Hansen, makes you think. Jersey × Holstein F1 crossbreds produce milk with 4.0-4.3% protein versus purebred Holstein’s 3.1-3.2%. Yes, they produce 3,000-4,000 pounds less milk annually, but their net income matches or beats purebreds due to better fertility (4-17 fewer days open), lower replacement costs, and those protein premiums.

Amy Steinberg, a genetic consultant working across Minnesota and Wisconsin, breaks it down simply. “This isn’t about converting your whole herd to Jerseys,” she explains. “Use Jersey AI on your bottom 40% ranked for protein genetics. Keep your top 30% pure Holstein with sexed semen for replacements.”

Jersey semen costs $18-35 per unit—same ballpark as decent Holstein genetics. Those F1 heifers will freshen at 24-30 months with 4%+ protein. At today’s premiums, each F1 cow could generate $850-1,100 extra annually just from protein.

I watched a breeding at a third-generation farm near Shawano last week. The producer laughed, “Grandpa would roll over seeing Jersey semen in our tank. But grandpa wasn’t dealing with GLP-1 drugs and protein premiums.”

Even producers in Texas are exploring this. One 2,000-cow operation near Stephenville told me they’re crossbreeding their bottom third. “The heat tolerance of the F1s is a bonus we didn’t expect,” the manager said. “They’re handling 105-degree days better than our Holsteins.”

Strategy 3: Direct Processor Deals (Immediate Impact)

Several producers aren’t waiting for their co-ops to act. One Green Bay area producer—let’s call him Steve—just locked a three-year contract with a regional yogurt manufacturer. He guarantees 95% of production at 3.8-4.2% protein, 3.7-4.0% butterfat, and somatic cells under 200,000. In return? $1.50 per hundredweight premium over base. That’s $270,000 extra annually on 650 cows.

The processor gets consistent milk that they can standardize products around. Steve gets price stability while neighbors scramble. Both win.

A Northeast producer near Lancaster, Pennsylvania, negotiated something similar with a specialty cheese maker. “They wanted consistent components for their aged products,” he explained. “We’re getting $1.65 over base for hitting their targets.”

Quick Math: Your Three Options

  • Nutrition route: $3,500/month cost, $3-5 return per dollar, results in 60 days
  • Genetics route: $18-35 per breeding, $850-1,100 annual premium per F1, results in 18-30 months
  • Processor contracts: $1.00-1.75/cwt premiums, 3-year stability, starts immediately

The Calendar Is Not Your Friend

Looking at what’s coming, the window for positioning is narrower than most realize:

December 1, 2025: FMMO protein baseline shifts. Below 3.3%? Deductions start.

January 15-31, 2026: Annual bank reviews. Mark Stevens from Farm Credit Services of Southern Wisconsin tells me they’re already identifying operations with debt-to-asset ratios over 60% and protein under 3.2%. “We’re not trying to force exits,” he emphasizes. “But farms without component improvement plans raise viability questions.”

April 1, 2026: Canadian pricing shifts take effect, influencing cross-border dynamics.

2026-2027: New processing capacity from Lactalis, Leprino, others comes online. Competition for high-protein milk intensifies.

March 2027: FDA expected to approve oral GLP-1s based on current trials. When pills cost $150 instead of $1,000 for shots, adoption explodes.

Who’s Most Vulnerable Right Now

Farm vulnerability matrix maps debt-to-asset ratios against current protein production, revealing three distinct zones: thriving operations (low debt, high protein), vulnerable farms requiring immediate action (moderate debt, marginal protein), and critical situations where strategic exit preserves equity

Let’s be honest about who needs to act immediately. Based on what lenders and co-op reps are telling me, here’s the danger profile:

  • 500-1,500 cow operations shipping commodity milk
  • Testing 3.0-3.2% protein currently
  • Debt-to-asset ratio over 55%
  • Production costs $18-21 per hundredweight
  • Milk price averaging $13.50-14.50

If this describes your operation, December’s protein shift could eliminate your remaining margin. You’ve got 60 days to make nutrition changes, or you need to start planning an exit that preserves equity.

Dr. Chris Wolf, Cornell’s dairy economist, sees a clear split developing. “Operations that pivot to high-protein, quality milk will find opportunities. Those locked into commodity production with high debt face significant challenges.”

What worries me is the middle group—farms that could adapt but are waiting to see what happens. Every week of delay is a week competitors lock contracts and implement changes.

The Community Impact We Can’t Ignore

What really keeps me up at night is what happens when 20-30% of farms in a region exit within two years.

Wisconsin has lost thousands of dairy farms over recent decades while maintaining stable production, according to USDA data. Fewer families, smaller tax bases, struggling Main Streets. Rick Peterson from Crawford County’s economic development office showed me projections—losing 25% more farms by 2027 means $400,000-600,000 less for schools annually. The hospital might close its birthing unit. Main Street loses another third of its businesses.

“Each farm exit eliminates five to seven related jobs,” Peterson explains. Feed dealers, mechanics, accountants—it cascades through the community.

I drove through Richland County last month. Three dairy farms for sale in ten miles. The café owner told me business is down 20% this year. “When farms go, everything follows,” she said quietly.

But I also visited Tillamook County, Oregon, where processors and producers worked together on component premiums early. They’ve maintained farm numbers better than most. “We saw this coming and acted collectively,” a local co-op board member explained. “Not everyone can do that, but it made the difference here.”

What Success Looks Like in 2030

Five-year financial transformation projection for a 500-cow dairy operation: protein optimization combined with genetics and market positioning drives net income from $127,000 to $495,000 annually while improving debt-to-asset ratio from 62% to 38%

But it’s not all challenging news. Producers who execute this transition well achieve remarkable improvements.

Jim Bradley, a dairy nutritionist and economist consulting for Upper Midwest banks, helped me model a typical 500-cow operation. Starting point: 3.10% protein, $13.90 milk, 62% debt-to-asset. By 2030, with proper execution:

  • Protein reaches 4.05% through nutrition and F1 genetics
  • Milk price hits $17.00/cwt with premiums
  • Net income grows from $127,000 to $495,000 annually
  • Debt-to-asset improves to 38%

“This isn’t speculation,” Bradley insists. “These projections reflect actual results from operations that started transitioning in early 2024.”

A Vermont producer who started his transition 18 months ago confirms this. “We’re already seeing $180,000 more annually just from protein premiums. The genetics haven’t even kicked in yet.”

Your Action Plan for the Next 30 Days

After dozens of conversations with producers from California to Vermont, here’s what separates those who’ll thrive from those who’ll struggle:

Make your strategic decision by December 15: Pivot to capture premiums or plan a strategic exit? Both are valid. Waiting to see isn’t.

If pivoting:

Call your nutritionist this week. Amino acid balancing can boost protein 0.15-0.25% within 60 days, often reducing feed costs. Budget $0.03-0.08 per hundredweight for protected amino acids.

Rank cows by protein genetics. Bottom 40% get Jersey AI. Top 30% get sexed semen for replacements. Middle tier? Consider beef semen—those calves bring $800-1,200 versus $50 for Holstein bulls.

Meet with three processors before November 30. Your current handler plus alternatives. Bring component data and projections. Producers securing $1.40-1.75/cwt premiums are negotiating now, not during the crisis.

Talk to your lender before January reviews. Present your plan. Show market understanding. Lenders support strategic direction, question apparent oblivion.

If exiting:

Engage transition specialists immediately. Strategic exits preserve 70-80% equity. Forced liquidations preserve 40-50%. The difference determines retirement versus bankruptcy. The National Farm Transition Network has advisors who can help.

The Choice Facing Each of Us

This transformation is happening now—in bulk tanks, processing plants, and lending offices across dairy country. The convergence of GLP-1 adoption, FMMO reforms, and processor consolidation creates unprecedented challenges and significant opportunities for those positioned to capitalize on them.

The strategic window measures in weeks, not years. Producers who make informed decisions by December 15 and execute systematically will likely view November 2025 as the month they secured their future. Those who delay may remember it as the moment when opportunity passed by.

Ironically, dairy products perfectly match GLP-1 users’ nutritional needs—quality protein in digestible formats. But capturing this requires acknowledging that successful strategies from the past twenty years won’t work for the next five.

The market has clearly stated its protein priorities. Whether you’re milking 50 cows in Vermont or 5,000 in New Mexico, the question isn’t whether to adapt, but whether you’ll adapt quickly enough to capture premiums before they become the new baseline.

In our rapidly evolving industry, decisive action—even if imperfect—often beats waiting for complete information that never materializes. This might be one of those moments where the cost of inaction exceeds the risk of imperfect action.

For implementation guidance on protein optimization or transition planning, consult your regional extension dairy specialist or agricultural lender familiar with current market dynamics. Time-sensitive conditions make professional consultation advisable.

KEY TAKEAWAYS

  • Protein is now king: GLP-1 drugs affecting 30M Americans killed butterfat’s 20-year reign—protein premiums hit $1.40-1.75/cwt while Class IV milk trades $3.53 below Class III
  • December 15 = Decision Day: Make your strategic choice before December 1st’s 3.3% protein requirement triggers deductions and January’s bank reviews force your hand
  • Three paths to profit: Fast nutrition fix ($38K return, 60 days) | Jersey crossbreeding ($1,100/cow/year, 18-30 months) | Direct processor deals ($270K+/year, immediate)
  • The survival line: Farms below 3.2% protein with >55% debt face elimination—but strategic exits now preserve 70-80% equity versus 40% in forced liquidation
  • First-mover advantage expires soon: Producers securing premium contracts today will be selling commodity milk to those same processors in 2027

Complete references and supporting documentation are available upon request by contacting the editorial team at editor@thebullvine.com.

Learn More:

The Sunday Read Dairy Professionals Don’t Skip.

Every week, thousands of producers, breeders, and industry insiders open Bullvine Weekly for genetics insights, market shifts, and profit strategies they won’t find anywhere else. One email. Five minutes. Smarter decisions all week.

NewsSubscribe
First
Last
Consent

Who Speaks for Your Milk Check? The Push to Reform Dairy’s Voting Power

Not every deduction on a milk check is math—some are politics. Here’s how U.S. farmers lost $337 million without casting a single vote

Executive Summary: In 2025, U.S. dairy farmers lost $337 million in just three months following FMMO reforms that increased processor make allowances using voluntary, unverified cost data. The change exposed a fundamental flaw: most producers never voted on the rule that reduced their pay. The American Farm Bureau Federation is now leading a campaign for modified bloc voting, restoring producers’ right to vote independently rather than through cooperative boards. At the same time, pressure is growing for USDA audits of processor costs and itemized cooperative milk checks, ensuring transparency and accountability from plant to producer. A similar structure in Canada illustrates the power of individual voice—where direct farmer ownership and votes drive protective policy outcomes. Together, these reforms mark a turning point toward verified data, fair pay, and representation that aligns with the farmers doing the milking.

Milk Check Transparency

You know that feeling when the milk check comes and something doesn’t line up. The herd’s healthy, butterfat performance is steady, feed costs haven’t spiked—but the final number is off. That’s been a common story across farms this year.

Earlier this fall, both the U.S. Department of Agriculture’s Agricultural Marketing Service (AMS) and the American Farm Bureau Federation (AFBF) confirmed what many suspected. The most recent Federal Milk Marketing Order (FMMO) pricing reforms shifted about $337 million from farmers to processors in just three months.

What’s striking isn’t just the number—it’s how the decision happened. Most producers never saw a ballot. And that missing vote might be the most expensive one they never got to cast.

How a Technical Rule Became a Real Pay Cut

Make allowances surged 32-48% in June 2025 based on unverified processor data—the highest jumps in dry whey and cheese directly slashed what farmers received per hundredweight

Here’s what set this off. In June, USDA raised make allowances—the assumed cost of processing milk into dairy products—by 25 to 43 percent. The reasoning was simple enough: labor, packaging, and energy costs have risen since the last review in 2008.

Here’s the part that farmers are still talking about. Those numbers came from voluntary processor surveys and not from audited financials. By law, USDA still lacks the authority to require processors to open their books under the Agricultural Marketing Agreement Act of 1937.

As AFBF dairy economist Danny Munch explained during the organization’s fall dairy policy update,

“We’re basing a national pay system on unverified numbers, and the only side that benefits is the one submitting the data.”

USDA’s Pool Settlement Reports show how fast that imbalance added up: $64 million in the Upper Midwest, $62 million in the Northeast, and $55 million in California.

For a 150-cow herd shipping about 24,000 hundredweight a year, that’s about $18,000 to $20,000 gone—roughly equivalent to this year’s surge in energy costs, or a major herd health outlay.

Regional distribution of the $337 million in FMMO losses reveals that smaller regions collectively bore nearly half the burden, intensifying the impact on individual farms

Regional Impact Summary (June–September 2025)

  • Upper Midwest: –$64 million
  • Northeast: –$62 million
  • California: –$55 million
    (Source: USDA AMS, Q3 2025 Pool Data)

Who Cast the Vote That Changed It?

AspectCurrent Bloc VotingModified Bloc Voting (AFBF Proposal)
Who Controls Your Vote?Cooperative board decides for all membersYOU decide—opt in or vote independently
Member ChoiceNone—vote cast automaticallyFull choice: authorize co-op or vote direct
Transparency LevelLow: No individual vote trackingHigh: Individual votes counted
Conflict of InterestHIGH: Co-ops process AND voteLOW: Direct farmer control
Individual AccountabilityNone—members never see ballotFull—every producer has voice

That question gets to the heart of a deeper issue. When FMMO proposals go out for a referendum, producers are supposed to decide. But under the current system, most never touch a ballot.

That’s because cooperatives cast bloc votes representing all their members. The idea was originally intended to save administrative time in the 1940s, when local co-ops marketed milk from small family dairies.

Fast forward 80 years. Dairy Farmers of America, Land O’ Lakes, and California Dairies Inc. now handle more than 60 percent of the nation’s milk, according to the USDA’s Economic Research Service (2024). Those organizations don’t just market milk—they process it. When processing margins rise, they gain on one side while the member pay price shrinks on the other.

That’s why AFBF, joined by several state-level farm bureaus, is pressing for modified bloc voting.

Under this approach, co-ops could still submit bloc votes, but only for members who authorize them. Others could opt out and cast their own ballots directly. It’s a small procedural shift with big implications for fairness.

As Munch told producers in Wisconsin, “If your paycheck depends on it, you should get to decide how it’s structured.”

Why Voting Reform Comes First

Some producers have asked why start with voting rights rather than mandatory audits or cost-verification reforms? It’s a logical question—but one with a simple answer.

Every major FMMO change still requires a producer vote to pass. If co-ops continue controlling those votes, the same imbalances in representation will persist—even with better data. Modified voting gives individuals a voice before the next cost survey or order amendment lands on the table.

Think of it this way: fair data means knowing the numbers are right; fair voting means knowing your opinion counts before the next decimal gets moved.

The Transparency Gap That Shows Up Every Month

For most of us, the problem isn’t hidden in Washington—it’s sitting right on the milk check.

Private processors are required to list detail on component prices, deductions, and the Producer Price Differential (PPD). Cooperatives, though, are exempt. Since they’re considered farmer-owned, they aren’t required to disclose the same payment details.

That might sound routine, but it creates an information gap. A University of Wisconsin Extension report (2024) found that 70 percent of cooperative pay statements lacked full explanations for deductions over $0.25 per hundredweight. Terms like “market adjustment” or “balancing charge” were often used without further specification.

As Mark Stevenson, emeritus policy specialist at UW–Madison, put it, “You can’t manage what you can’t measure.”

Plenty of producers can relate. Even herds with solid butterfat and protein trends are seeing unexplained adjustments that chip away at gross pay. That lack of clarity feeds the same frustration driving the broader voting reform effort: farmers want transparency, not theory.

Looking North: What Canadian Quotas Tell Us About Voice

Canada’s dairy producers own individual quotas and cast direct votes that shape trade policy; U.S. farmers are fighting to regain that same power through modified bloc voting and mandatory processor audits

It’s worth pausing to look north for perspective. Canada operates under a supply management system that balances domestic production and demand through quotas. Each farmer owns a quota, currently worth about CA $30,000 per cow (Agriculture and Agri-Food Canada, 2025), and that ownership translates directly into control.

In 2017, Canadian dairy farmers organized a significant voter push within the Conservative Party, ultimately flipping a leadership contest by less than 1%. This year, the Canadian Parliament passed Bill C‑202, which makes it illegal for ministers to negotiate away dairy protections in trade deals.

The U.S. doesn’t have a quota system, and few producers would want one. But here’s the takeaway: when farmers hold direct, non-negotiable voting authority, policy outcomes tend to protect producers instead of eroding them.

Where These Reforms Stand Now

For the first time in years, the groundwork for reform is visible.

A provision in the 2025 Farm Appropriations Act now gives USDA AMS the authority to conduct audited processor cost surveys. The agency plans to begin that process in 2027, replacing voluntary surveys with verifiable data collection.

Meanwhile, new proposals are emerging to standardize cooperative milk-payment statements so co-op members receive the same level of itemized transparency as proprietary producers.

And finally, AFBF’s modified bloc voting proposal continues building bipartisan traction, with several state delegations already urging USDA to schedule a hearing for 2026.

These are all incremental steps—but together, they form the backbone of a more accountable system.

What It Means for Different Dairies

Whether you milk 80 cows in New York’s Finger Lakes or 8,000 in a California dry lot, clarity is good business. Verified cost surveys stabilize Class III and IV price forecasts. Transparency builds trust and simplifies planning.

Cornell University’s Dairy Markets Research Program (2024) notes that “information symmetry improves efficiency and stability at every scale.” In simpler terms, fair data and fair governance don’t pick winners—they lift the whole market.

Co-ops That Are Already Leading

Some cooperatives aren’t waiting for regulation to catch up. Rolling Hills Dairy Cooperative in Wisconsin already provides members with detailed monthly pool and freight summaries through an online portal. Select Milk Producersin Texas publishes audited hauling and balancing charges so members can see exactly what the deductions mean.

Rolling Hills general manager Tom Larkin says the results were immediate: “Once members could see where their money went, trust followed. Transparency lined us up on the same side again.”

That kind of leadership shows reform doesn’t have to start in Washington—it can begin wherever farmers demand a clearer deal.

Five Things Producers Can Do Now

  1. Compare your check. Match component prices to your federal order’s monthly reports; the differences may surprise you.
  2. Ask for documentation. Request written breakdowns for deductions labeled “market adjustment” or “balancing.”
  3. Collaborate. Compare notes with neighboring farms—shared data reveals patterns.
  4. Engage early. Follow your state Farm Bureau updates and dairy policy hearings.
  5. Exercise your vote. Whether under current co-op structures or future modified voting, make sure your ballot represents your voice.

The Bottom Line

After covering dairy policy for years—and spending plenty of time around farmers who live it—I’ve noticed that most producers can handle market volatility and feed swings. What they can’t handle is opacity.

The call for reform isn’t rebellion; it’s about modernizing a system that no longer reflects how milk is marketed or how producers define ownership.

If democracy belongs anywhere, it’s in the milk check. Because when producers see the numbers, cast their own votes, and know where their dollars go, trust stops being a slogan—it becomes part of doing business.

Key Takeaways:

  • $337 million disappeared from producers’ milk checks in three months following FMMO reforms based on voluntary processor cost data that USDA could not verify.
  • Most farmers never voted on the rules that reduced their income, because cooperatives cast bloc votes on behalf of all members—often blending farmer and processor interests.
  • AFBF’s proposed modified bloc voting system would restore the right for every producer to cast an individual ballot, bringing direct democracy back into milk pricing.
  • Mandatory processor cost audits and itemized co-op pay statements are now gaining traction, opening the door to verified data, clear deductions, and accountable pay.
  • Transparency isn’t anti-cooperative—it’s pro-farmer. As seen in Canada’s producer-driven system, ownership and voice together equal stability and fair value for milk.

Complete references and supporting documentation are available upon request by contacting the editorial team at editor@thebullvine.com.

Learn More

The Sunday Read Dairy Professionals Don’t Skip.

Every week, thousands of producers, breeders, and industry insiders open Bullvine Weekly for genetics insights, market shifts, and profit strategies they won’t find anywhere else. One email. Five minutes. Smarter decisions all week.

NewsSubscribe
First
Last
Consent

Is the Federal Milk Marketing Order Reform Benefiting Dairy Farmers or Only the Processors?

Does the Federal Milk Marketing Order reform help dairy farmers or benefit processors? Find out if these changes are truly advantageous for your farm.

Is the Federal Milk Marketing Order (FMMO) reform truly beneficial for dairy farmers, or does it primarily benefit processors? This pressing question has ignited a heated debate as the industry is poised for significant changes. The U.S. Department of Agriculture (USDA) proposes revisions to update pricing formulas for all 11 FMMOs. A referendum until December 31, 2024, allows eligible dairy producers to vote on these proposed changes. If two-thirds agree, new pricing models will roll out; if not, some FMMOs might be dissolved, creating more uncertainty. This referendum will significantly impact whether these changes strengthen the farmers’ position or continue tilting the scales in favor of processors, affecting the industry’s financial health and future direction.

The Federal Milk Marketing Order: A Tale of Market Evolution and Modern Reform

The Federal Milk Marketing Order (FMMO) has a rich historical context, dating back to the Agricultural Marketing Agreement Act of 1937. This act, born out of the tumult of the Great Depression, aimed to stabilize chaotic agricultural markets. The FMMO, a key component of this act, was designed to mitigate milk price fluctuations that adversely affected producers and consumers. It achieved this by establishing fair minimum prices based on the intended use of the milk, whether for fluid consumption or the production of products like Cheese and Butter. 

Fast-forward to today: The dairy industry has transformed, sparking the need for reform. When these orders were first implemented, they didn’t foresee shifts like changes in consumer preferences or technological advances in processing. Present-day producers face challenges like increased supply chain consolidation and international trade pressures that the original pricing formulas didn’t consider. 

The USDA regularly updates these orders through its Agricultural Marketing Service to reflect current market realities. A recent 49-day hearing initiated by the dairy industry highlighted the urgent need to revise these orders due to changing dynamics. The hearing focused on necessary changes to factors like milk composition. It surveyed commodity prices, addressing long-standing inefficiencies in the pricing system. 

The proposed amendments are a wide-ranging effort to modernize milk pricing and marketing. They are meant to align the FMMO with today’s market and ensure this framework benefits all involved—producers, processors, and consumers. As the USDA progresses with the referendum, it is dedicated to balancing federal oversight with industry flexibility, keeping the American dairy sector competitive and sustainable in our rapidly shifting agricultural economy. 

A New Era for Milk Pricing: Unpacking the Reflective Amendments to Federal Milk Marketing Orders

The Federal Milk Marketing Orders are getting a makeover to suit today’s market needs better. Here’s a simplified look at what’s changing: 

  • Milk Composition Factors: Protein is now at 3.3%, other solids at 6.0%, and nonfat solids at 9.3%. This update aims to match the milk farmers’ supply more accurately with pricing.
  • Surveyed Commodity Products: Forget the 500-pound barrel cheddar cheese prices. Based on market realities, the focus is shifting to the 40-pound block cheddar cheese prices.
  • Class III and Class IV Formula Factors: Manufacturing allowances adjust to new rates, such as $0.2519 for Cheese and $0.2272 for Butter. The butterfat recovery is bumped to 91%, reflecting more efficient costs and methods.
  • Base Class I Skim Milk Price: The pricing will stabilize the market by taking the higher Class III or Class IV skim milk prices and making a new adjustment for products with an extended shelf life.
  • Class I Differentials: The changes will better reflect the costs in varying counties, ensuring that milk pricing is locally fair and transparent.

These updates aim to align milk marketing with modern-day realities, striving for a fairer and more transparent pricing system in light of evolving production and market conditions.

The Great Milk Debate: Are Farmers Being Milked?

The Federal Milk Marketing Order (FMMO) changes have sparked serious debate among dairy farmers nationwide. These updated pricing formulas promise to modernize milk price settings, offering potential benefits. Adjusting milk composition factors and surveying commodity products aim to align prices with current production costs better. With its high-Class I milk utilization, the Southeast stands to gain from these updates, possibly seeing improved returns. This potential for improved returns should bring a sense of hope and optimism to dairy farmers. 

Yet, there’s significant criticism, especially from farmers who fear financial loss. Concerns arise in areas like the Upper Midwest, where farmers predict a potential revenue drop of $0.70 to $0.80 per hundredweight. This is especially worrying in a sector already under pressure. Regional differences in impact also raise issues of market control. In areas dominated by processors, there’s fear that they could further tighten their hold, leaving farmers with little say over milk prices. This is a significant worry where cooperatives blur the lines between producers and processors, leading farmers to question the benefits of these reforms. 

Ultimately, these reforms aim to align pricing with today’s economic reality. Still, their success depends on local dynamics and market structures. Dairy farmers must weigh modernization against the risk of financial instability.

Processors vs. Farmers: Who Really Benefits from the FMMO Amendments?

As the controversy over the Federal Milk Marketing Order amendments grows, many are eyeing the potential benefits for milk processors. The adjustments, which focus on pricing formulas and allowances, seem poised to bolster processors’ margins. 

Updating the manufacturing allowances for Cheese, Butter, NFDM, and dry whey might reduce processors’ financial strain. These changes could help them manage costs efficiently while providing a safety net to protect their profits. 

The shift to using only 40-pound block cheddar prices instead of including 500-pound barrels simplifies the pricing process. This might benefit processors focusing on block cheese, allowing for a more stable financial outlook. 

Dairy farmers, however, express concerns that these changes seem skewed. They worry about a widening gap between their earnings and processors’ profits. Pressure mounts as farmers fear losing significant earnings per hundredweight, and they question whether these reforms genuinely support them. 

The debate is lively. Critics argue that processors might exploit these new conditions at farmers’ expense. As the dairy industry shifts, tensions run high, and farmers are unsure how these changes will affect them.

Regional Ripples: Navigating the FMMO’s Uneven Impact Across America 

Understanding the impact of the Federal Milk Marketing Order reforms across regions is essential as they approach. The Midwest, a cornerstone of the dairy industry, faces challenges different from those in the Southeast. By understanding these regional differences, dairy farmers can feel more informed and prepared for the potential impact of the reforms. Skepticism surrounds the proposed changes in the Midwest, which has strong milk production. High production costs and minimal Class I milk usage limit the benefits. Farmers in states like Wisconsin may find these reforms disrupting their delicate financial situation. 

In contrast, the Southeast presents a different picture. Here, higher Class I usage offers the potential for increased revenue. In states like Florida, where demand for milk exceeds supply, these reforms could be favorable. The area’s unique pricing structure and dependence on imported milk might make the changes advantageous. 

The regional adjustments within these reforms are crucial. In the Northeast, where production costs are similar to those in the Midwest but Class I usage is high, opinions are divided. Some see the changes as a step towards market stability, while others doubt long-term benefits. With such varied conditions, the FMMO reforms could create division rather than unity among dairy farmers. As the referendum continues, these regional differences will influence discussions, affect votes, and shape the agricultural story.

The Bottom Line

The path of Federal Milk Marketing Order reforms is stirring tensions in the dairy world. These changes aim to bring milk pricing up to speed with industry developments. Yet, there’s a conflict: do they favor processors more than farmers? This varies across the country. The Southeast may benefit, while the Midwest has reservations. Here’s the big question: Will these reforms make things fairer or widen the gap even further? 

If you’re involved, it’s crucial to participate. Voting in the referendum is your chance to protect your interests. Joining industry groups and sharing your thoughts with processors can boost your influence. 

Dairy producers and professionals must stay informed and use their power. The USDA website and agricultural groups have plenty of information and ways to get involved. As the vote deadline nears, remember that your decision today shapes the future of dairy. Are you ready to drive this change?

Key Takeaways:

  • The USDA’s referendum on the Federal Milk Marketing Order reflects significant proposed amendments to milk pricing categories aimed at modernizing industry standards.
  • The proposed changes are controversial, with debates centered around whether they substantially benefit farmers or disproportionately favor milk processors.
  • Regional disparities exist, with some areas potentially benefiting more than others, highlighting the complexities of the US dairy market.
  • The referendum’s outcome could result in either implementing new pricing structures or terminating certain FMMOs if not approved by a two-thirds majority.
  • Industry stakeholders express skepticism regarding the long-term benefits of government reform for dairy farmers, suggesting that the influence of processors remains a critical concern.
  • The discussions emphasize the persistent tension between the need for fair pricing mechanisms and the interests of different market players.

Summary:

The National Federal Milk Marketing Order (FMMO) referendum, driven by the U.S. Department of Agriculture, addresses key shifts in the dairy industry with proposed amendments to modernize milk pricing systems. From updating milk composition factors to revising cheese price surveys and altering Class III and Class IV formula factors, these changes aim to reflect evolving market dynamics better. The U.S. Department of Agriculture (USDA) seeks to modernize milk pricing to benefit producers, processors, and consumers by aligning milk composition factors with modern standards and focusing on 40-pound cheddar cheese prices. With manufacturing allowances adjusted and butterfat recovery increased to 91%, the Base Class I Skim Milk Price is stabilized, and Class I Differentials are updated for county-specific costs. However, the initiative raises a critical question: Are these proposals genuinely advantageous for farmers, or do they primarily benefit processors? Some farmers fear a potential revenue decline of $0.70 to $0.80 per hundredweight, highlighting the need to balance modernization with financial stability.

Learn more:

Join the Revolution!

Bullvine Daily is your essential e-zine for staying ahead in the dairy industry. With over 30,000 subscribers, we bring you the week’s top news, helping you manage tasks efficiently. Stay informed about milk production, tech adoption, and more, so you can concentrate on your dairy operations. 

NewsSubscribe
First
Last
Consent
Send this to a friend