Archive for Class IV milk price

Kansas Milk Growth Slowed to +15.4% While California Shrank

Cull thirty percent of four hundred cows and you’re buying 120 replacements a year. Every $500 the market moves costs you $60,000 — and not one extra cow in the barn.

EXECUTIVE SUMMARY

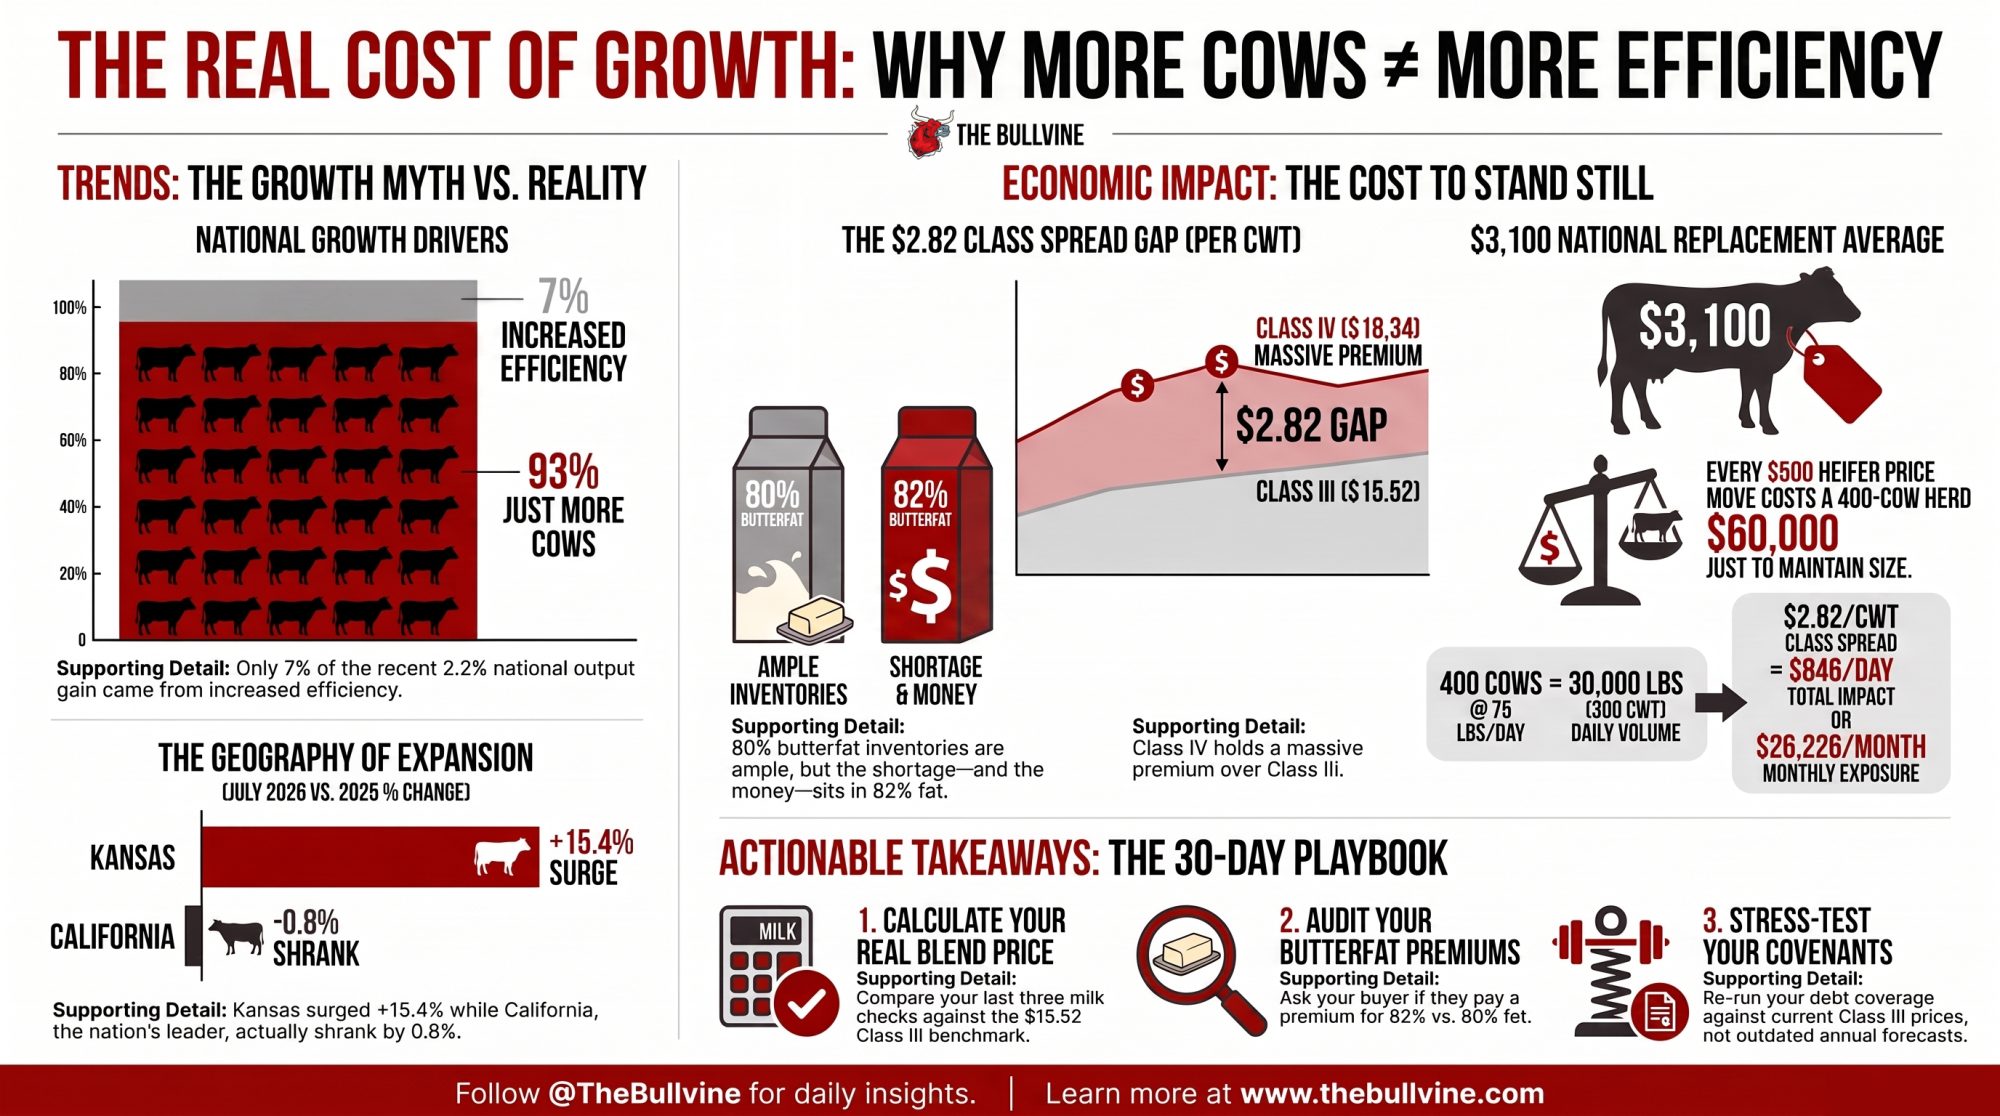
  • The growth was cows, not cows milking better. Output hit 20.1 billion pounds, up 2.2%, but per-cow output rose three pounds — 93% of the gain walked in on four legs. Kansas is the extreme case at 98% animals, and its growth already decelerated from 18.7% in June to 15.4% in July. California, the largest dairy state in the country, actually shrank 0.8%.
  • The class spread is the money question. Class IV fell to $18.34 in July, down $3.98 from May, leaving a $2.82 gap over Class III’s $15.52. On a 400-cow herd shipping 75 lbs, that’s roughly $26,226 a month of exposure — and which side you’re on is a clause in your co-op agreement, not a market call.
  • Butter’s paradox is a grade problem, not a tonnage problem. Prices kept sliding while the market read tight because 80% butterfat inventories are ample and 82% is where the shortage sits. Most premium structures don’t price that split.
  • Replacements decide whether expansion math still works. Springing heifers run $3,100 nationally and $3,400–$4,400 in Upper Midwest barns. Every $500 move costs a 400-cow herd about $60,000 just to hold size. If you financed stalls against an all-milk forecast instead of an actual Class III print, the next 90 days are a covenant conversation.
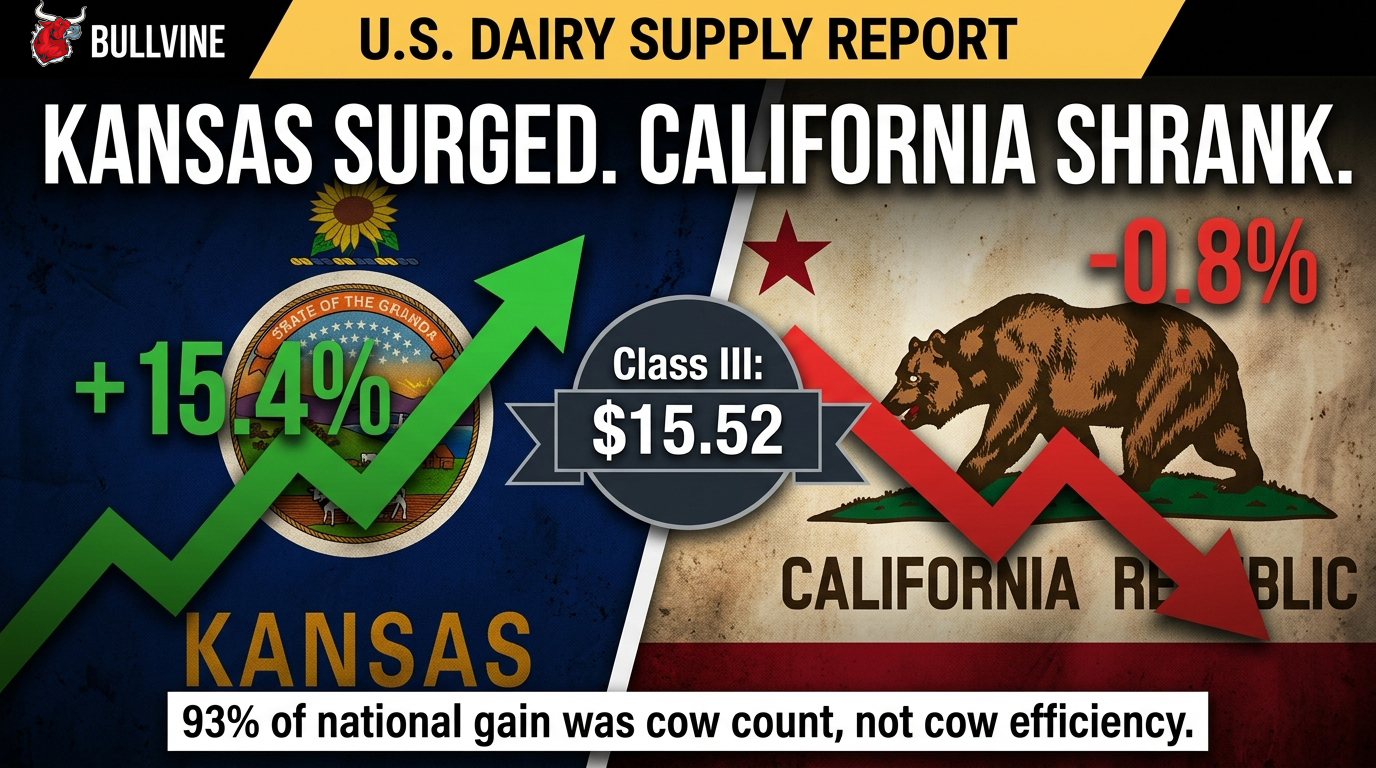
Class III milk settled at $15.52/cwt in July 2026 — down $1.40 from May’s peak and the second straight monthly decline. If you financed fresh stalls into that curve, explaining your 2026 margin over feed to your lender just got uncomfortable.

Kansas shipped 494 million pounds in July, up 15.4% year over year on a herd of 245,000 head. Twelve months earlier, that herd stood at 213,000. But Kansas grew 18.7% in June and 15.4% in July, and the state added roughly 1,000 head between those two months after adding 32,000 across the full year. That’s not acceleration. That’s a build winding down.

Nationally, output hit 20.1 billion pounds, up 2.2%, per USDA NASS Milk Production released August 21. The headline reads like productivity. It isn’t.

Which States Actually Shrank in July 2026?

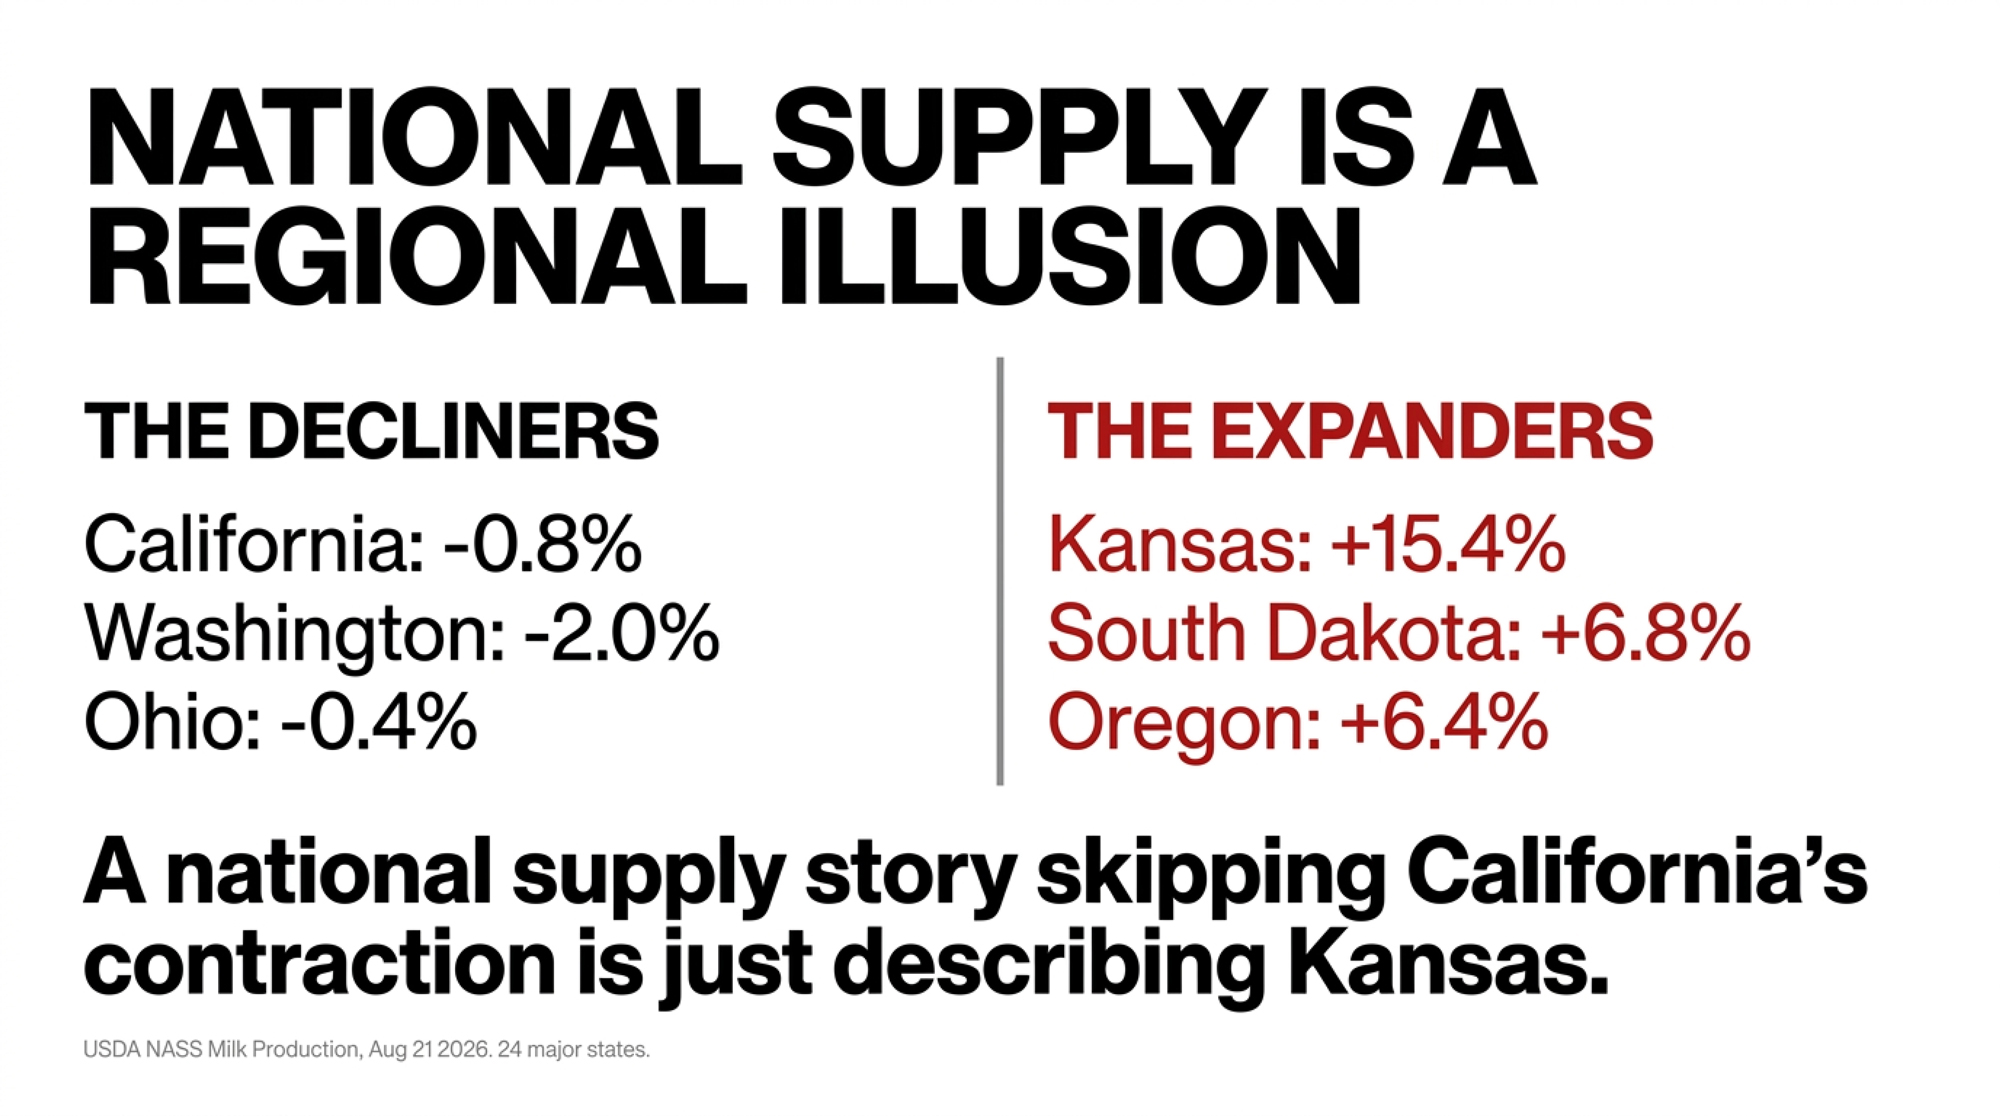
Three did, and one matters enormously. California fell 0.8%. The largest dairy state in the country produced less milk in July 2026 than a year earlier. Washington dropped 2.0%. Ohio slipped 0.4%. Pennsylvania and Vermont came in flat.

A national supply-growth story that skips California’s contraction isn’t describing national supply. It’s describing Kansas and Texas.

That’s the real geography here: growth concentrated in a few expanding states, offset by decline in established ones. National cow numbers held at 9,710,000 head from June to July — unchanged, after twelve months of building.
The 3 Pounds That Rewrite the Report
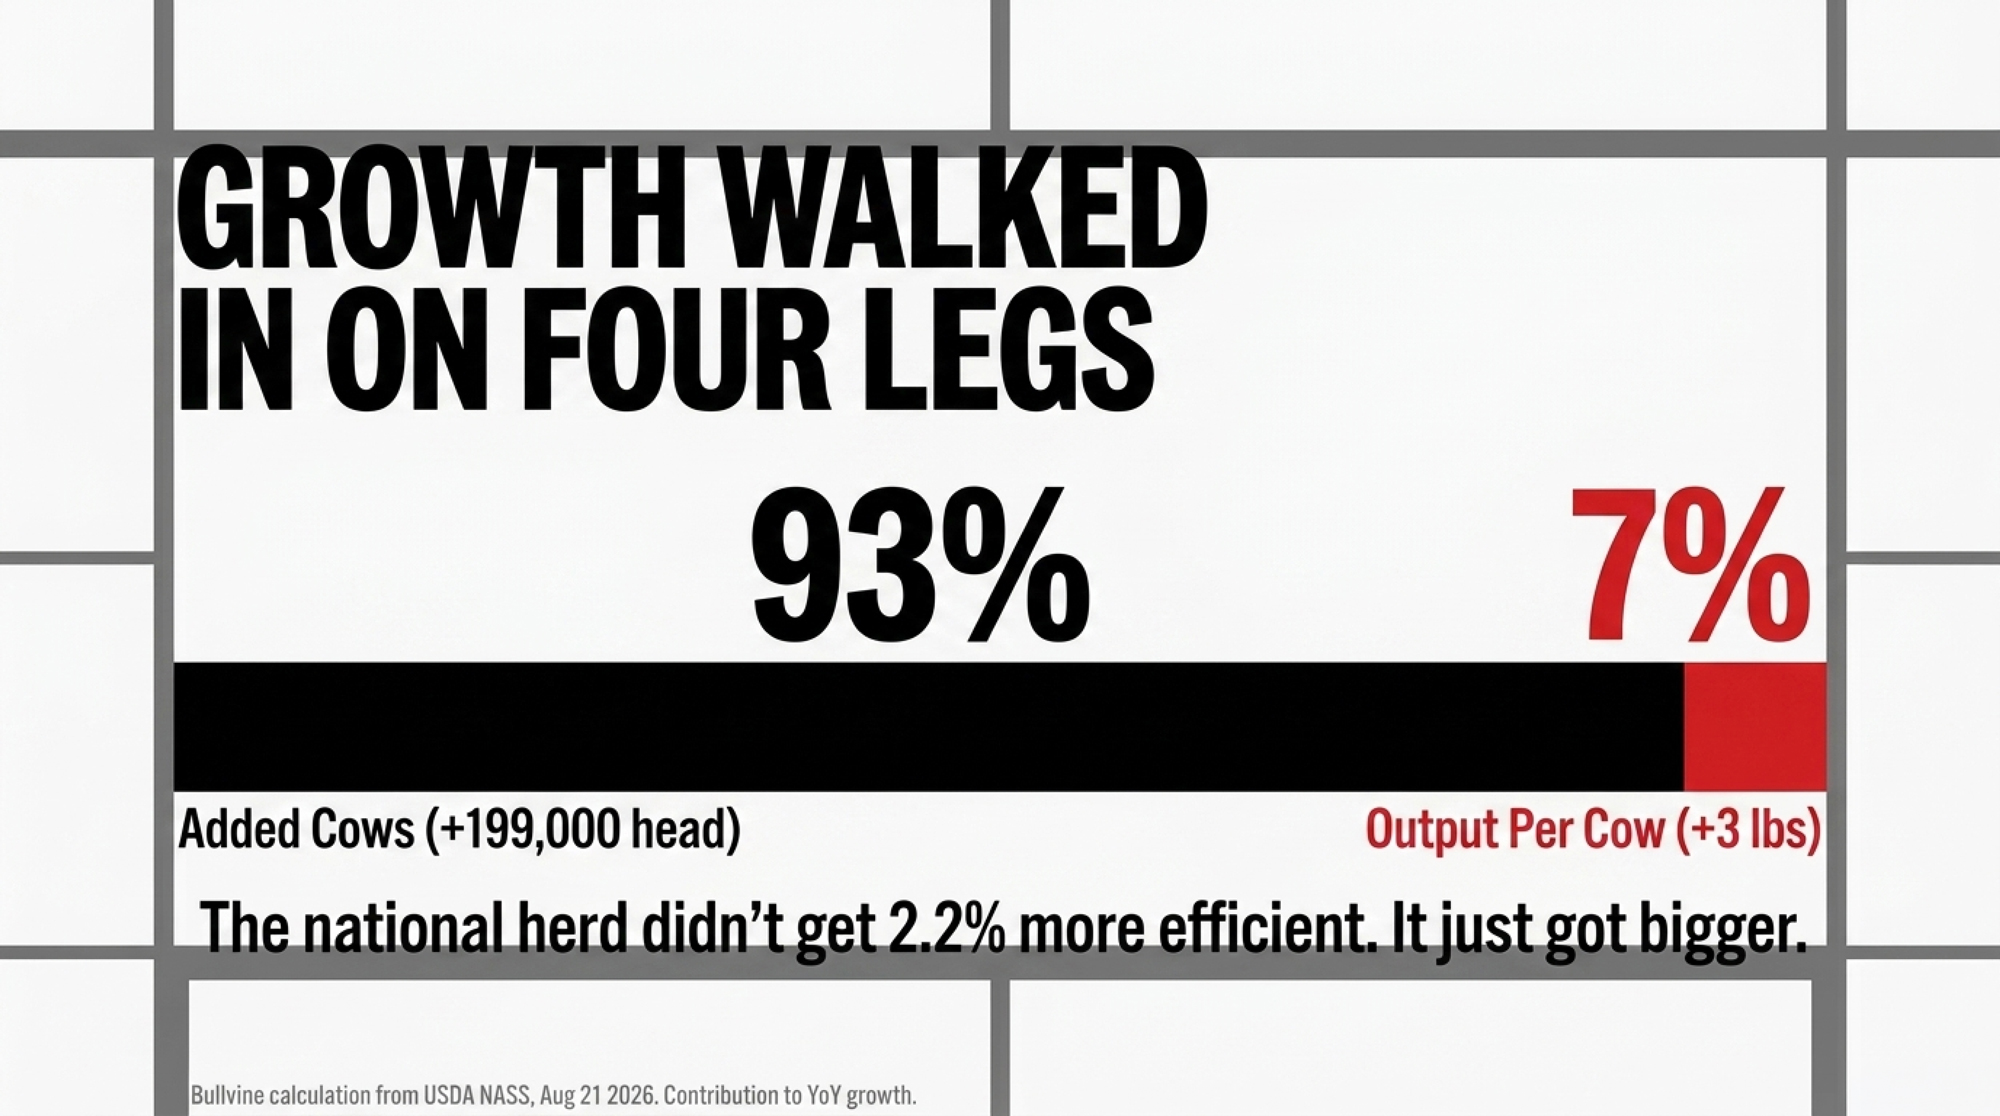
Production per cow rose from 2,072 to 2,075 pounds nationally. Three pounds. Across the 24 major states, 2,088 to 2,093. The herd, meanwhile, went from 9.511 million head to 9.710 million — up 199,000 cows.

Cow numbers grew 2.09%. Per-cow output grew 0.14%. By The Bullvine’s calculation from those NASS figures, cows account for roughly 93% of the year-over-year growth and per-cow output for about 7%. Those shares describe contribution to the gain, not share of total volume.

Everyone assumed 2.2% meant the national herd got more efficient. It got bigger.

Kansas is the purer case. Per-cow output there went from 2,010 to 2,015 pounds — five pounds, or 0.25%. Cow numbers rose 15.02%. Roughly 98% of Kansas’s growth came from animals, almost none from the cows already standing there.

And before anyone reads July as a turn: NASS revised June’s 24-state figure up by 124 million pounds, or 0.7%. One month is one data point, and this series is routinely rewritten. The next release lands mid-September.

Why Did Class III Fall While Class IV Fell Harder?

The two halves of the pool separated. Federal Order class prices for 2026:

Month (2026)Class III ($/cwt)Class IV ($/cwt)Spread ($/cwt)
January14.5913.55−1.04
February14.9416.291.35
March16.1618.942.78
April16.8220.223.40
May16.9222.325.40
June15.9820.964.98
July15.5218.342.82

Class III and Class IV are USDA AMS-announced Federal Order prices, per Dairy Market News, Vol. 93 Report 34, week of August 17–21, 2026. August prices had not yet been announced at the time of publication. Spread column calculated by The Bullvine.

The full-year series tells a different story than a four-month excerpt would. Class III climbed from January through May, then gave back $1.40 across June and July. Class IV ran harder in both directions — up nearly $9 from January to May, then down $3.98 in two months.

Watch the spread column. In January, Class III sat $1.04 above Class IV. By May, the gap had flipped and widened to $5.40. It’s narrowed in each of the two months since, to $2.82 in July. So the divergence is real, but it’s compressing — Class IV is falling toward Class III rather than the two pulling further apart.

Still $2.82, though. Which side you sit on isn’t a market view. It’s a clause in your co-op agreement.

Running the Numbers: The Class Spread on a 400-Cow Herd
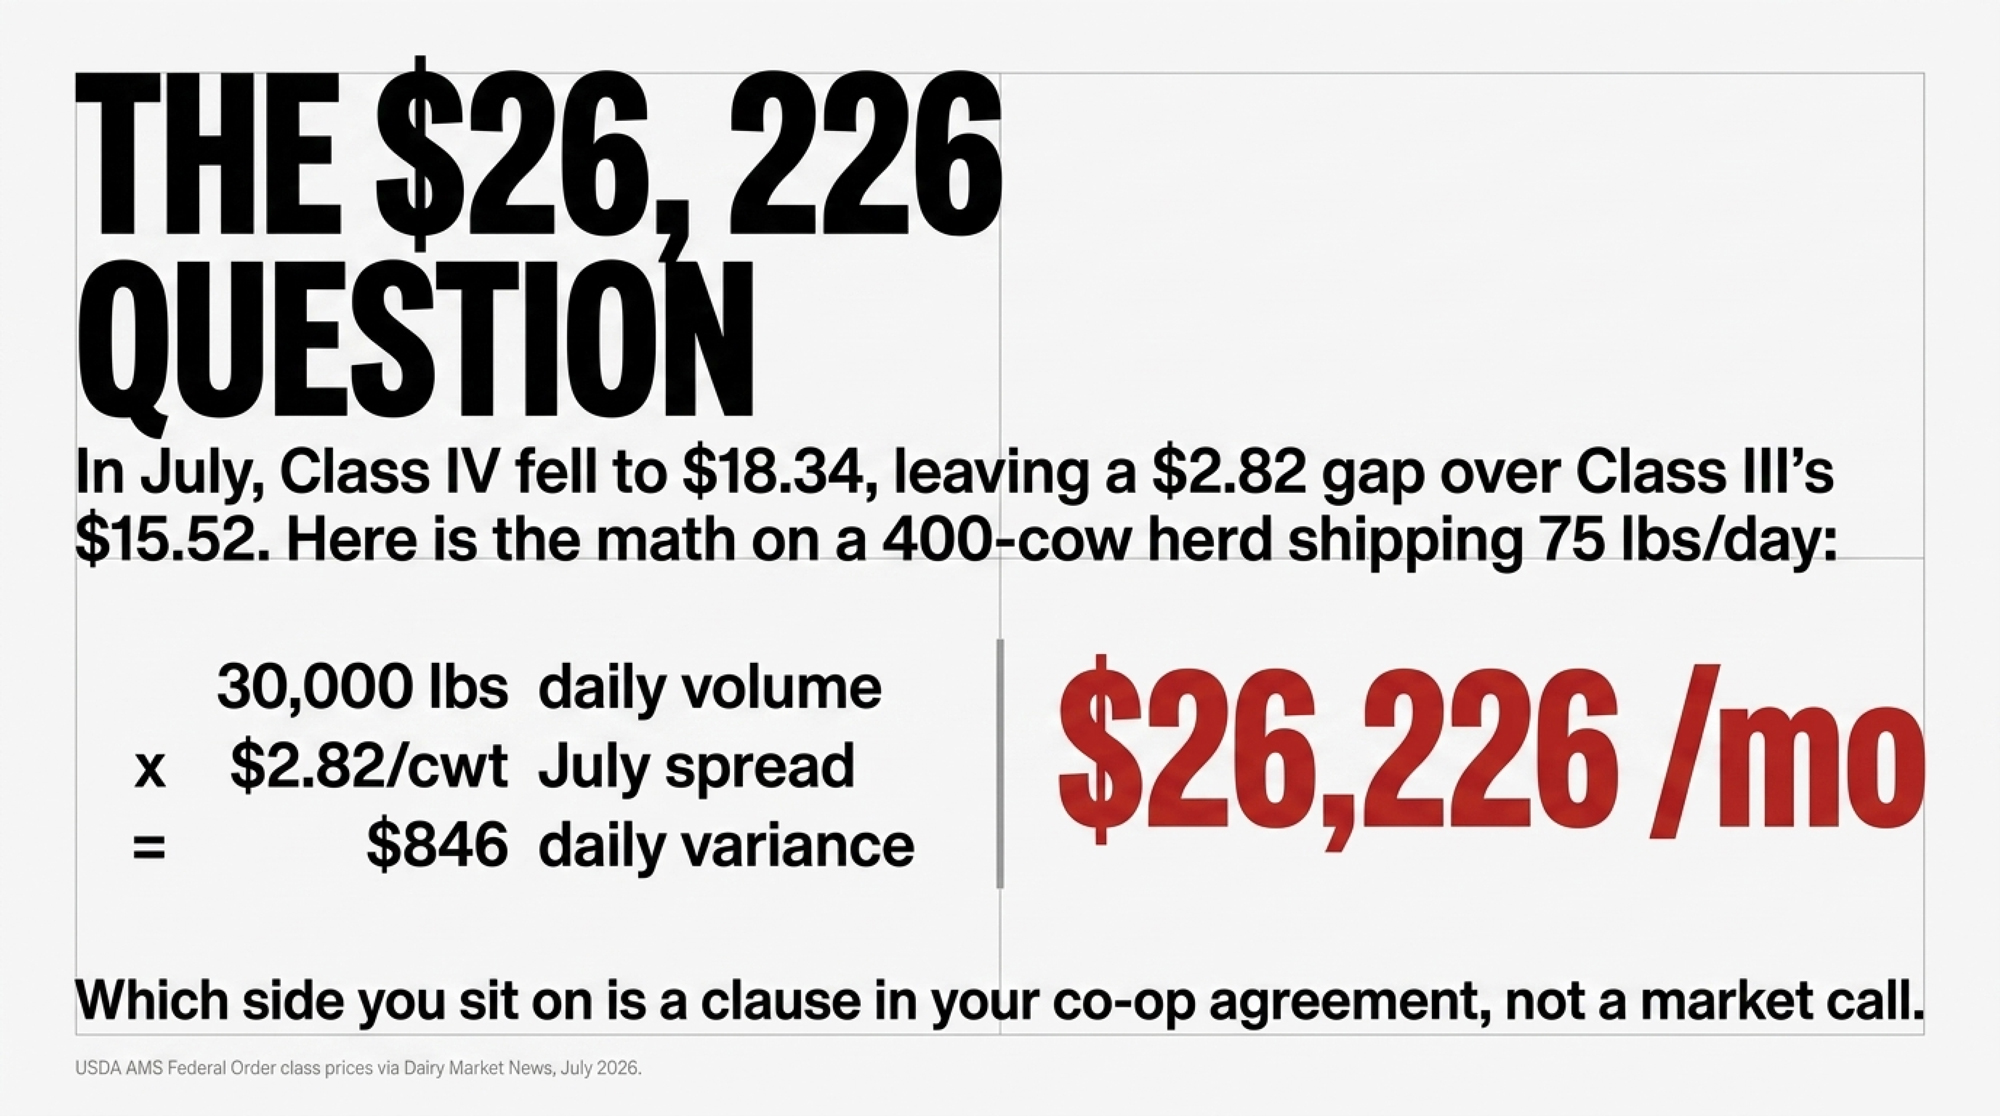
ParameterCalculationExposure
Daily shipped volume400 cows × 75 lbs/day30,000 lbs (300 cwt)
July class spread$18.34 (Class IV) − $15.52 (Class III)$2.82/cwt
Daily margin variance300 cwt × $2.82/cwt$846/day
31-day exposure$846/day × 31 days$26,226/month

That’s the gross gap between milk priced against butter-powder and milk priced against cheese-whey for one month, before producer price differential, hauling, or component adjustment. Your mailbox price won’t match either class cleanly — most producers receive a weighted blend. Read this as the scale of the exposure, not a cheque you lost.
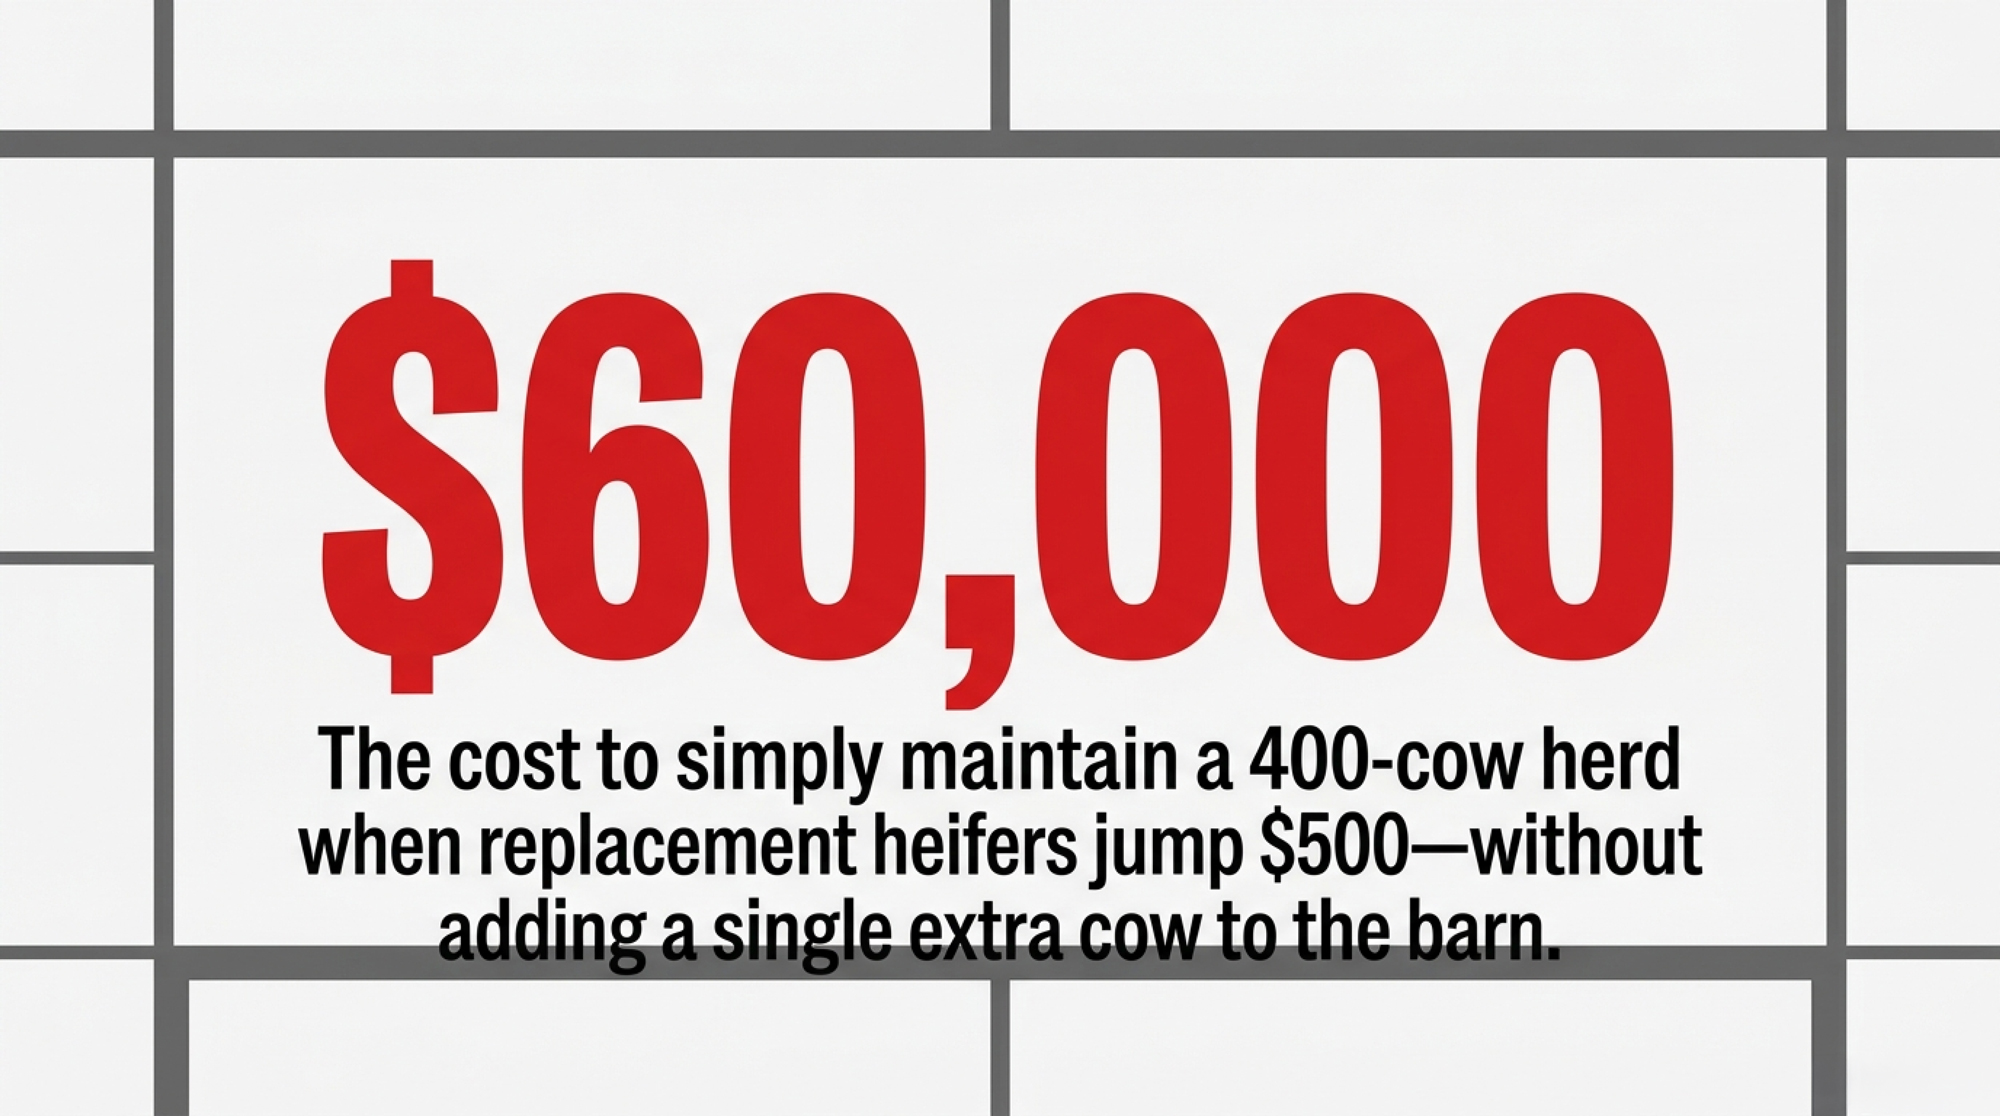
Replacements compound it. Springing heifers ran about $3,100 a head nationally this spring, with Minnesota and Wisconsin barns pushing $3,400 to $4,400, per CoBank and USDA figures. The record monthly average hit $3,110 in October 2025. A 400-cow herd culling 30% needs 120 replacements a year — so every $500 move in heifer price shifts your cost to stand still by $60,000. Same herd. Same tank. Sixty thousand dollars.

Total dairy heifer inventory sits at 3.914 million head, the lowest since 1978. Our deep-dive on the tightest replacement heifer market since 1978 and what it does to beef-on-dairy strategy runs the herd-turnover budget in detail.

Cull values give you a current read from the same week. Conventional cull cows averaged $150.94/cwt at a Pacific Northwest auction reported August 17–21, with the top ten at $187.19/cwt. On a 1,236-lb cow at that average, that’s roughly $1,866 walking out the door against a $3,100 replacement walking in — a gap near $1,234 on every turn, by our arithmetic, before you’ve improved a single thing about the herd.

The Canadian Takeaway

Ontario and Quebec readers: every price in this analysis is a U.S. Federal Milk Marketing Order figure or a CME settlement. None of it sets a Canadian farm-gate price, which runs through supply management and provincial board pricing rather than class utilization.

What transfers is the supply signal. U.S. output at 20.1 billion pounds a month, with cheese exports running at record pace, shapes the world price Canadian processors and exporters watch — and it shapes what imported product costs at the border. The useful takeaway isn’t the $15.52. It’s that U.S. supply growth is coming from animals rather than efficiency, and that the fat side of the U.S. market is softer than the protein side.

The Turn: Butter Splits by Grade, Not by Tonnage
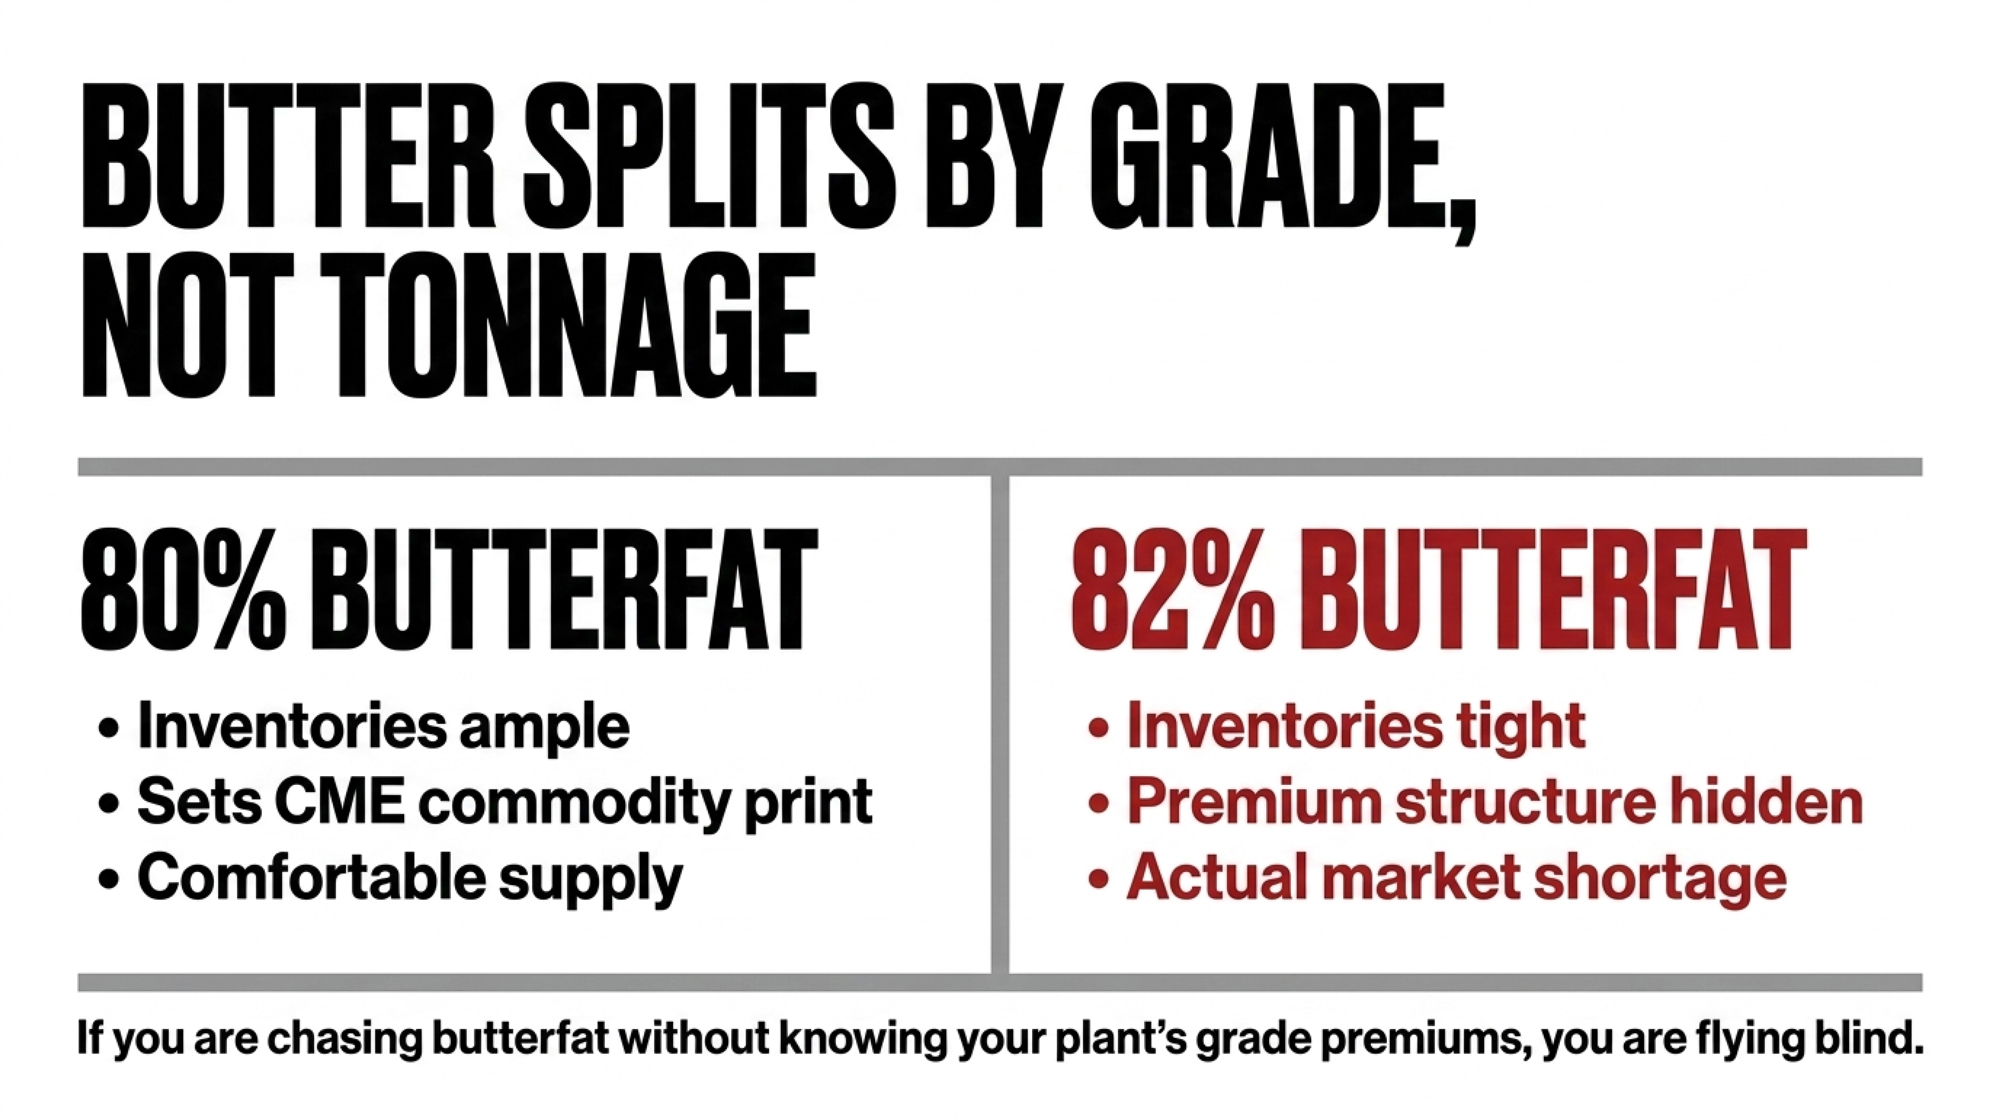
Butter prices kept sliding through August while the market read tight. Dairy Market News explains why the two aren’t contradictory: 80% butterfat inventories remain ample, while 82% butterfat supplies are tighter. Central-region contacts put it the same way — 80 percent butterfat inventories high, 82 percent tight.

Be precise about what’s actually short. DMN reports cream inventories tight with spot availability varying by region, while butter inventories read stable in the West and are actively building in the East ahead of post-Labor Day retail promotions and holiday baking. So the tightness sits in cream and in the higher-fat grade. Commodity-grade butter — the stuff that sets the CME print — is comfortable.

That’s the whole puzzle. The fat surplus isn’t a tonnage story. It’s a grade story.

Butterfat GradeInventory StatusMarket Signal
80% butterfatAmple / high inventoriesPrices sliding — surplus
82% butterfatTight supplyRead as “shortage” but rarely priced separately

CME Grade AA butter closed at $1.4625/lb on August 21, weekly average $1.4510, down 2.45 cents. Blocks closed at $1.5275 against a weekly average of $1.5620; barrels closed at $1.5650. Selected cold storage centers held 66,320 thousand pounds of butter on August 17, down 1% from August 1, while cheese holdings rose 5% to 86,020.

Three years of chasing butterfat on the assumption that fat is fat, and the grade line is where the money actually sits. DMN documents the split qualitatively — high 80% inventories against tight 82% supply — without publishing a price differential between the two grades. If you’re paid on component tests, that absence is itself worth a conversation with your field rep.

There’s a regional wrinkle. DMN reports the Mountain States — Idaho, Utah and Colorado — seeing decreased milk volumes from smoke, haze and high heat, with a noticeable drop in milkfat levels. Northwest plants are bringing in outside cream. Western churns run at full capacity with unsalted butter for export as the priority, because butter produced outside the U.S. trades at a significant premium to domestic product.

What the Futures Curve Says That July Doesn’t

As of the August 20 settlements, CME Class III futures stood at $16.80 for September and $17.13 for October. Class IV sat at $18.86 and $19.10. Nonfat dry milk for September ran 175.200 cents against 159.325 for August.

Every one of those sits above July’s actual print. The market was pricing recovery, not deterioration.

Read the week, though, not just the close. Class III September softened from $17.43 on August 14 to $16.80 by August 20, and October slid from $17.45 to $17.13 across the same five sessions. The curve still says recovery. It was also revising that recovery downward — worth knowing before you treat $16.80 as a floor, and worth re-checking against this week’s settlements before you act.

NDM was the loudest signal in the report. Grade A closed at $1.8000 on August 21, up 5.5 cents on the week, with the CME spot price gaining 11 cents since the prior Thursday. DMN attributes it to building domestic demand plus export interest from Southeast Asia and Mexico, with milk diverted to Class I for the school year leaving less for dryers.

September advanced Class I came in at $17.04, down $1.72, so near-term pressure is real. But if you’re making a twenty-year decision off a single Federal Order print — the most pessimistic number currently on the board — you’re using the wrong input.

Culling says producers are already sorting. Dairy cow slaughter through August 8 totaled 1,651,600 head against 1,581,700 a year earlier, up 4.4%. Herd growing, culling running ahead of last year. That’s a herd being rebuilt, not simply expanded. Whether your co-op’s base year lets that new milk earn blend or base is a separate question, and we broke down how base-year mechanics decide what your expansion milk actually earns this week.

Is the New Capacity Built for the Milk You’re Shipping?

Dairy processors have committed more than $11 billion across 19 states and 50-plus projects between 2025 and early 2028, tied to a projected 15 billion additional pounds of U.S. milk by 2030 — figures IDFA reported and Food Engineering carried in August 2026. New York leads at $2.8 billion, followed by Texas at $1.5 billion, Wisconsin at $1.1 billion, Idaho at $720 million, and Iowa at $701 million. Kansas herd growth clustered where that processing capacity gave the milk a buyer, which is the siting logic you’d expect.

An even path to 15 billion pounds implies roughly 2.5 billion pounds added per year from a 2025 baseline. July’s 2.2% pace on a 236-billion-pound base implies closer to 5 billion if sustained — that’s The Bullvine’s arithmetic on IDFA’s stated target, not an IDFA or USDA projection. The flat June-to-July cow count and Kansas’s deceleration are both real arguments the pace won’t hold.

IDFA’s public materials describe the buildout in aggregate. We couldn’t locate a project-level breakdown showing how much of that $11 billion processes butterfat versus cheese and protein, or which plants run now versus commission in 2027–2028.

Whey economics show where the capital is pointed. Whey protein isolate traded from $14 into the upper $14s in the week ending August 21, with contacts reporting demand outpacing supply. WPC 34% inventories are extremely tight, with manufacturers prioritizing higher-protein products — tight enough that some calf milk replacer makers have substituted nonfat dry milk. That’s the protein side of the buildout showing up in spot markets. Not the fat side.

Call it a collision course and you’re overclaiming. Call it a clean catch-up and you’re ignoring the half nobody’s published.

Kansas Water: Two Clocks, Different Speeds

Sixty percent of Kansas topsoil rated short or very short of moisture in the week ending August 18, per USDA Crop Progress data reported by RFD-TV. Check the current week’s Crop Progress before you treat that as today’s condition — but as a feed-cost signal right now, it’s live.

The longer clock runs independently of any single dry August. Kansas Geological Survey monitoring has documented multi-decade Ogallala decline across western Kansas, with annual rates varying sharply by groundwater management district and by year. A dry August can fix itself with a wet fall. Aquifer drawdown doesn’t reverse on one good year, or two. The input risk belongs to the producers carrying the notes — plants buy milk, they don’t carry the note or the water right — and the drop from 18.7% to 15.4% may be the first sign the build is finishing on its own, before either clock forces the question.

What About Demand?

Cheese exports ran up roughly 24% in the first half of 2026, on pace to top 700,000 metric tons and a third straight record year, according to USDEC and USDA FAS figures reported in trade coverage this month. That’s why the cheese side has somewhere to put additional milk.

Domestic is softer. Natural American cheese use fell to its lowest May level since 2022 on weak foodservice, and June domestic cheese disappearance dropped 1.5% year over year, per HighGround Dairy analysis. DMN adds that U.S. export interest persists but is limited by elevated domestic price points for premium cheeses, pushing offshore business toward lower-priced commodity styles — while European demand stays strong and European milk output declines on summer heat.

Central-region cheese contacts report good demand alongside high inventories from active production schedules. Spot milk moved lower on both ends, from $1.00 under to $3.00 over Class, with some loads trading below Class price on plant downtime.

Export strength is carrying cheese. That’s different durability than strong domestic demand, and it’s worth knowing which one your plant leans on.

The 30/90/365-Day Playbook for Herds Carrying Expansion Debt

Add cows and you buy volume, scale, and leverage with a plant that needs milk. You also lock in feed, labor, facility, and replacement costs that don’t flex when Class III gives back $1.40 in two months. Push components and you buy margin per hundredweight, adjustable inside a feed cycle — but the 80%/82% split shows not all fat gets paid the same, and a premium structure can shift without a single cow changing.

Kansas took the volume bet next to real processing capacity. Defensible. Whether it’s durable depends on inputs nobody controls — and the state’s own growth rate just slowed 3.3 points in a month, which may settle the question before the water does. If you want this math run against a single herd’s replacement pipeline, we worked through the $585-per-service breeding trap on a 500-cow herd.

30-Day Actions

  • Pull your last three milk checks and calculate your actual blend price per cwt, then set it against July’s $15.52 Class III and $18.34 Class IV. Find your real class weighting instead of assuming it. Requires statements and twenty minutes. Backfires if you use one month — pull three.
  • Ask your field rep what share of your milk went to Class III versus Class IV last quarter, and whether your plant pays differently on 80% versus 82% butterfat. One phone call. Watch for utilization shifting month to month, which makes a single quarter less useful than a trend.
  • Red-flag trigger: if your debt service coverage ratio has run under 1.20 for three consecutive months on your lender’s or CPA’s method, treat it as urgent rather than seasonal.

90-Day Actions

  • Re-run your covenant against $15.52 Class III, not the $19.85 all-milk annual forecast. A modeled 5,000-cow High Plains greenfield — $8,000/stall, $40M note, 7% over 20 years, 1.20x DSCR — needed farm-gate milk near $19.07/cwt to clear covenant against Class III near $16.82 in April. Class III has since fallen to $15.52. Those parameters are illustrative and don’t describe any specific operation, but the structure transfers. Requires your amortization schedule and current component data. Backfires if you only stress the downside — run the futures curve too.
  • Price replacements against current local quotes, not last year’s. At $3,100 nationally and $3,400–$4,400 in Upper Midwest barns, a 120-head annual replacement need spans roughly $372,000 to $528,000 depending on where you buy. Requires your actual cull rate and a real local quote. Watch for heifer prices moving faster than your budget cycle.
  • Get component data in front of your nutritionist alongside the grade question. Requires recent tests and a straight answer from your buyer on premium structure. Backfires if you chase specifications your plant doesn’t price differently.

365-Day Moves

  • Decide whether your next increment of milk comes from new cows or cows you already own. Nationally it was 93% animals; in Kansas, roughly 98%. Yours doesn’t have to be. Requires capital planning, facility assessment, honest per-cow benchmarking.
  • If you irrigate in the Ogallala footprint, pull your own groundwater management district’s annual water-level report rather than relying on state or regional averages. District-level rates diverge sharply, and the district you farm in matters more than the state trend. Watch for LEMA allocation changes arriving faster than your cropping plan.
  • Opportunity signal: if September and October Class III settle at or above the $16.80 and $17.13 the curve carried on August 20, and your margin over feed holds, July was the bottom. Confirm against actual settlements, not August’s curve — which softened 63 cents on the September contract in a single week.

So pull your statements. What’s your actual blend price per cwt this month versus 90 days ago, and what share of your milk did your co-op utilize in Class III? If that number isn’t at your fingertips, you don’t yet know whether July’s report was your problem or somebody else’s.

Key Takeaways

  • July’s 2.2% national gain was 93% more cows and 7% better cows. Kansas was 98% cows. Animal-driven growth locks in feed, labor, facility, and heifer costs that don’t flex when Class III gives back $1.40 in two months.
  • The July class spread was $2.82 — $18.34 Class IV against $15.52 Class III. On 400 cows at 75 lbs, that’s roughly $26,226 in a month, and which side you’re on is a clause in your co-op agreement, not a market call. Pull three milk checks and find your real weighting.
  • Butter kept sliding while the market read tight because 80% butterfat inventories are ample and 82% is where the shortage sits. Ask your buyer whether they actually pay differently on grade before you chase fat.
  • Springing heifers at $3,100 nationally and $3,400–$4,400 in Upper Midwest barns mean every $500 move costs a 400-cow herd about $60,000 to hold size. Price replacements locally in the next 30 days, not off last year’s number.
Complete references and supporting documentation are available upon request by contacting the editorial team at editor@thebullvine.com.

Learn More

  • Cull cow replacement cost: $2340 vs $3500 in 2026 — Dismantles the reflex of convenience-culling by exposing the $1,160 cash deficit between a $2,340 slaughter cheque and a $3,500 replacement, arming you with a clear scorecard to keep sound cows earning margin instead of buying expensive replacements.
  • $19.85 milk price forecast 2026: your base year decides — Follows the money on $11 billion in new plant construction to expose how cooperative base-year rules penalize expansion volume into discounted surplus tiers when USDA’s all-milk forecast slips below $20/cwt.
  • Cracking the Code: Behavioral Traits and Feed Efficiency — Delivers a sensor-driven roadmap linking wearable rumination and resting data to residual feed intake, showing how to engineer higher milk efficiency from existing cows rather than purchasing more stalls.

The Sunday Read Dairy Professionals Don’t Skip.

Every week, thousands of producers, breeders, and industry insiders open Bullvine Weekly for genetics insights, market shifts, and profit strategies they won’t find anywhere else. One email. Five minutes. Smarter decisions all week.

NewsSubscribe
First
Last
Consent

Both Sides Are Fighting Over $1,800. Your Real Number Is $42,000.

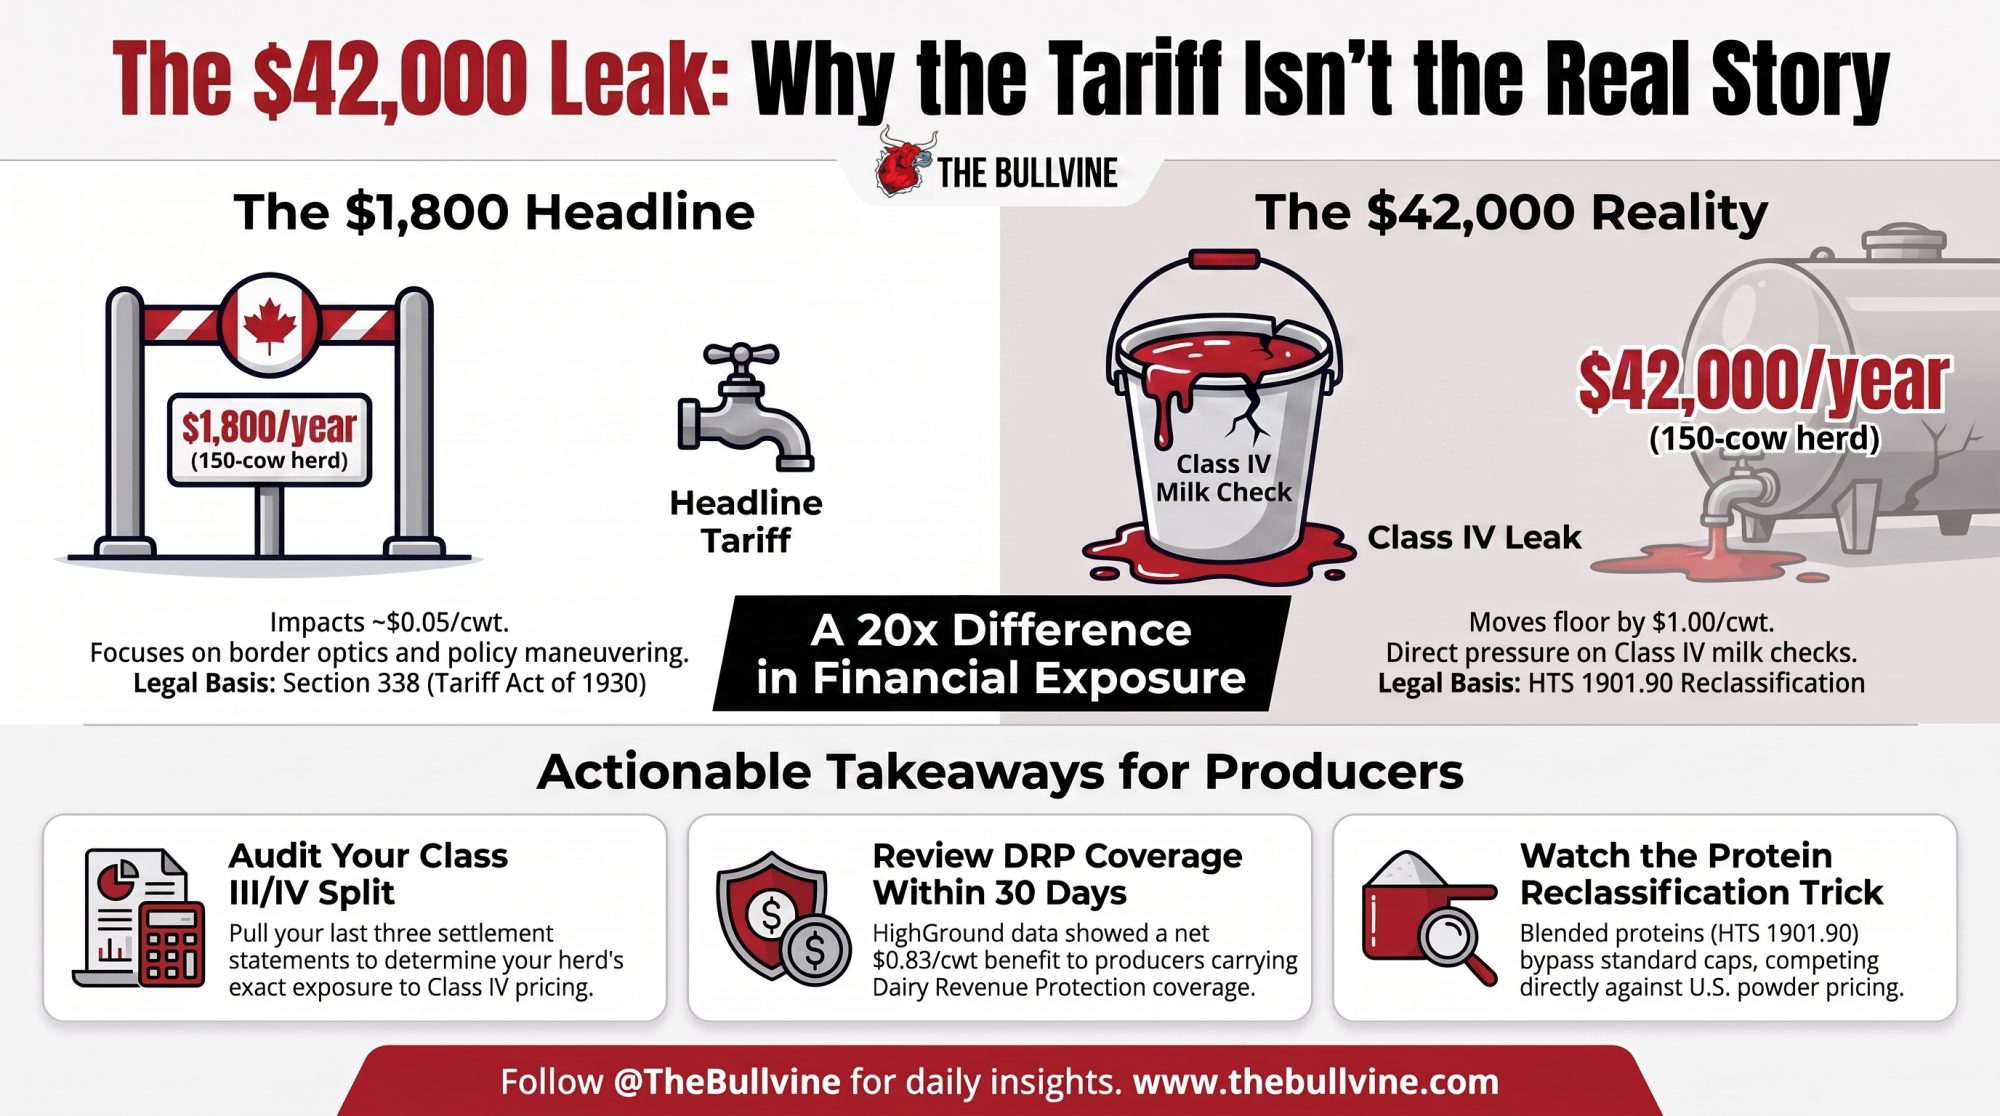
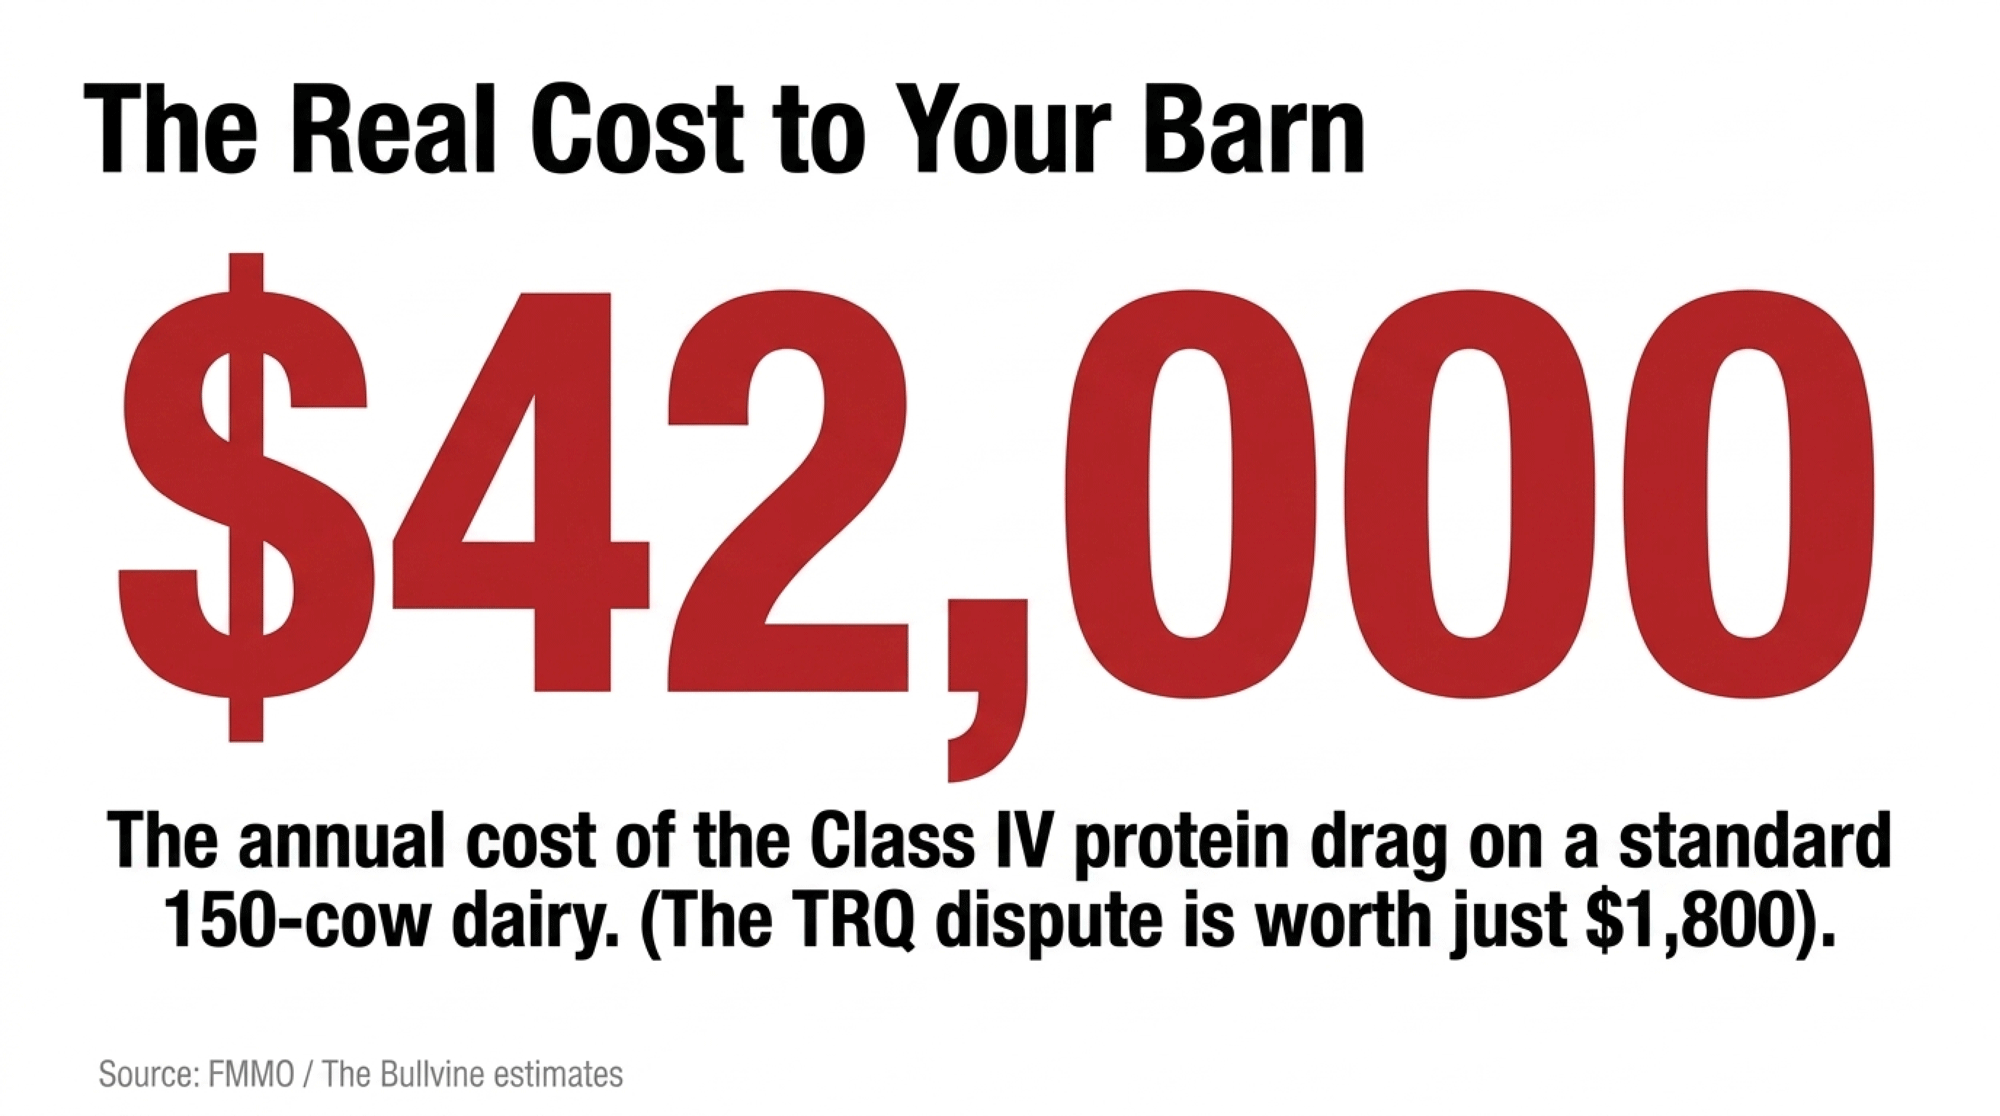
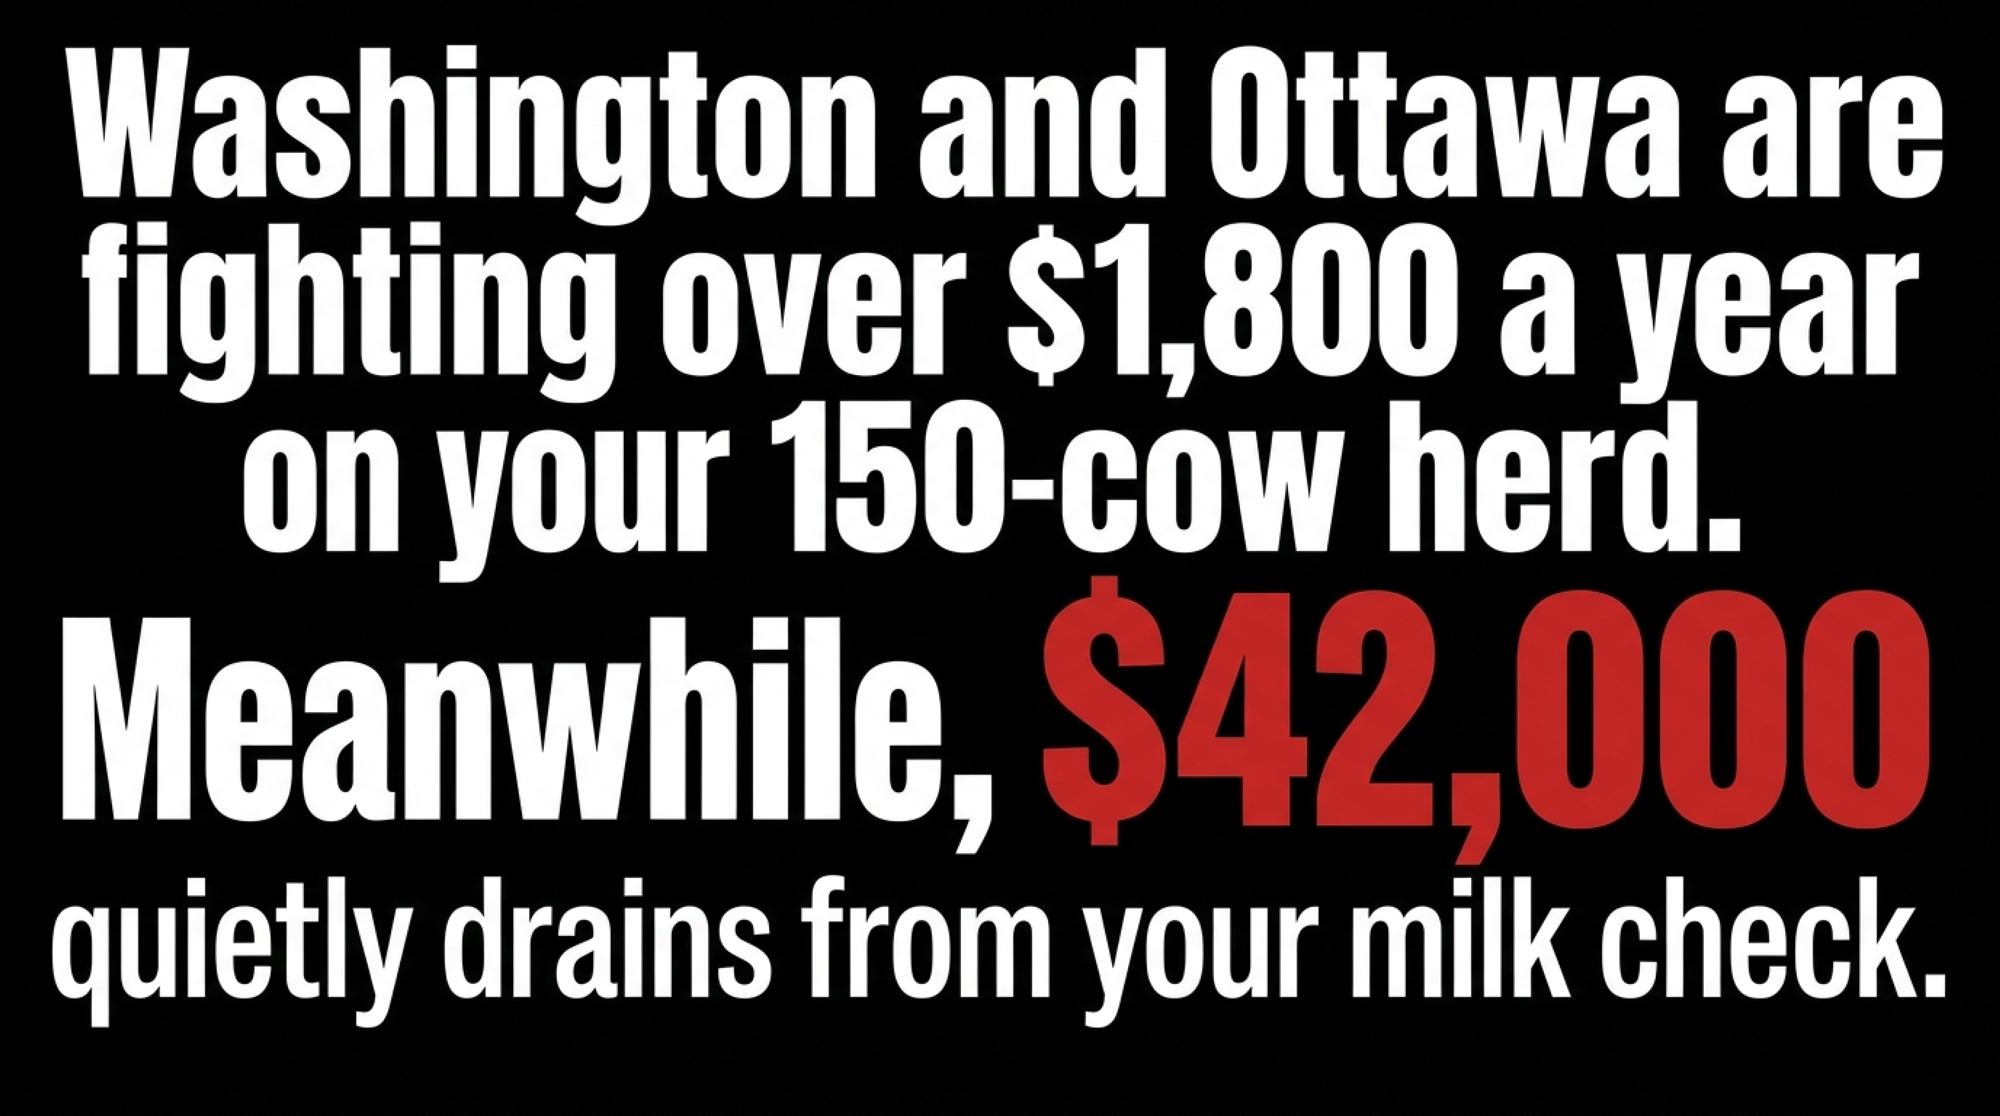
Two governments just went to war over about $1,800 a year on your 150-cow herd. The number actually draining your Class IV cheque? Closer to $42,000 — and the tariff doesn’t touch it.

Executive Summary: Trump signed a 50% tariff on Canadian dairy Monday night under Section 338 — the first time that Depression-era authority’s ever been used to impose duties — and it takes effect August 19, overriding the USMCA. Every outlet’s covering it as the same old TRQ fight, and here’s the thing nobody’s saying: full enforcement of that quota access is worth about a nickel a cwt, or roughly $1,800 a year on a 150-cow herd. The number that actually moves your milk check is the one the tariff doesn’t touch — the Canadian nonfat-solids surplus reclassified under HTS 1901.90 to slip past USMCA’s caps, which the USITC flagged in May as pressing down on your Class IV floor. Run a $1/cwt Class IV swing on that same 150-cow herd, and you’re at $42,000 a year; on 600 cows shipping heavy Class IV, it’s $170,000. So don’t hang your risk decision on August 19 — hang it on your own Class III/IV split, pull your last three settlement statements, and get your DRP position reviewed inside 30 days while HighGround’s Q1 2026 numbers still show a net $0.83/cwt to producers who carried it. The tariff is a border-optics fight; the leak is the one quietly bleeding your cheque.

Picture a Class IV shipper in southwest Wisconsin — pick any butter-and-powder operation you know — opening the Reuters alert that hit every dairy inbox in North America Monday night: a 50% tariff on Canadian dairy, effective August 19, signed under a Depression-era statute that’s sat dormant almost since the day it passed. The number that matters most to that operation isn’t in the headline. It’s buried three layers down, in a pricing mechanism most of the coverage skipped right past. And even on a modest 150-cow herd, it dwarfs the fight both governments are shouting about. 

Here’s the short version. The tariff everyone’s watching is a border tax over a cheese-quota dispute, worth roughly $1,800 a year to a mid-size dairy on our math. The thing quietly pressuring your Class IV price is a completely separate protein-reclassification pathway that the U.S. International Trade Commission flagged back in May. Both are real. But only one of them scales with your herd — and it’s not the one on the front page. 

The Two Fights at a Glance

Before the trade-law weeds, here’s the contrast that drives the whole piece:

FeatureThe $1,800 Headline TariffThe $42,000 Class IV Leak
Legal AuthoritySection 338 (Tariff Act of 1930)  HTS 1901.90 reclassification / protein blends  
Core DisputeCanadian TRQ allocation rules for retailers  Uncapped nonfat solids entering U.S. Class IV pool  
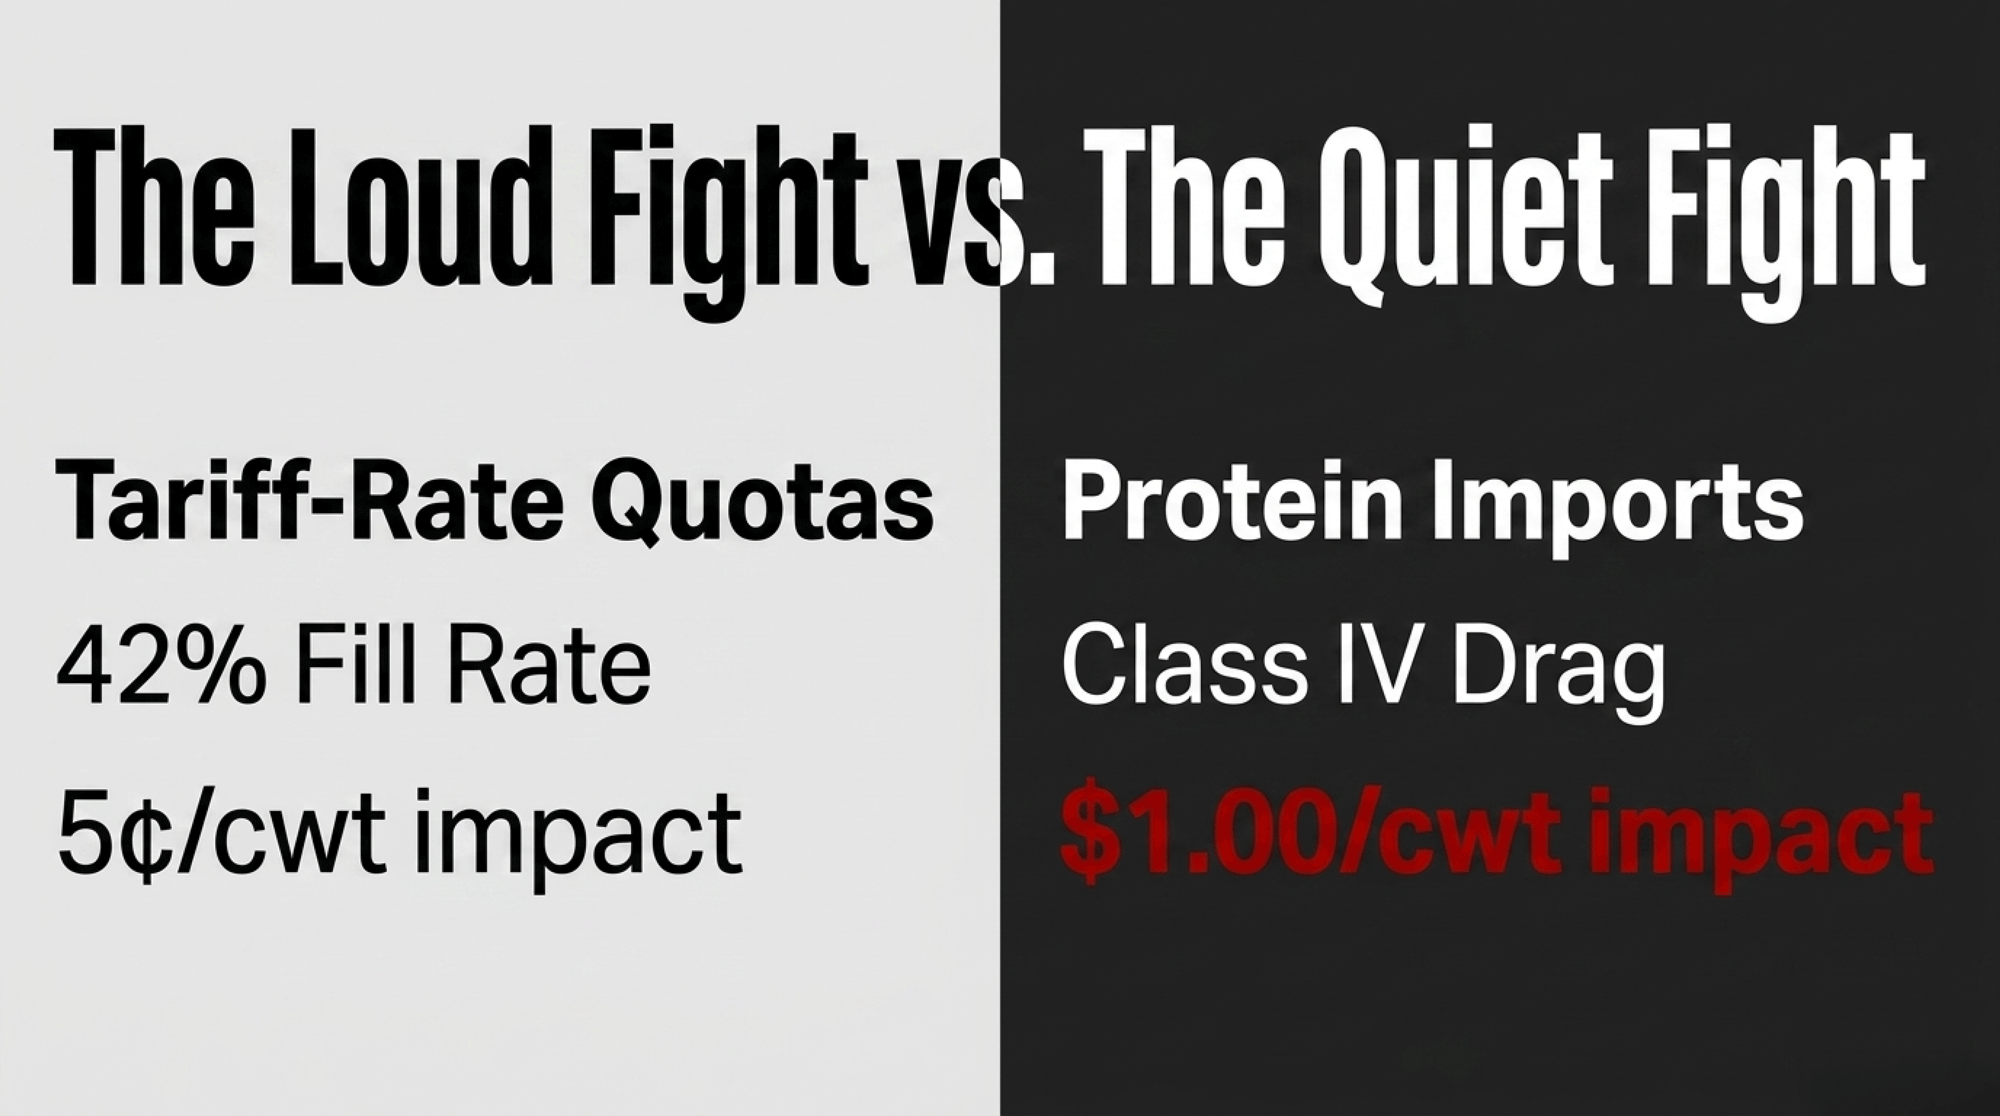
Financial Exposureabout $0.05/cwt (roughly $1,800/yr on 150 cows)  up to $1.00/cwt (~$42,000/yr on 150 cows)  
Primary ImpactBorder trade optics & policy maneuveringDirect pressure on U.S. Class IV milk cheque floor  

Both dollar figures are Bullvine modeling on a 150-cow herd producing roughly 36,000–42,000 cwt/year; see methodology note below.

What Actually Got Signed on July 20

On July 20, 2026, President Trump signed three proclamations under Section 338 of the Tariff Act of 1930 — the first time that authority’s ever been used to actually impose duties, from a Smoot-Hawley-era statute that’s been dormant for the better part of a century. The dairy piece — filed under the proclamation’s new HTSUS Chapter 99 (heading 9903.03) series — hits milk and cream powders, whey, casein, and lactose, and it explicitly rides over USMCA. No exemption for dairy, even though energy, potash, fish, and critical minerals all got carved out. The White House set the effective date 30 days out, which is why August 19 matters — and why there’s still a negotiating runway before it bites. 

Read the proclamation’s actual legal justification, though, and it’s narrower than the headlines. Washington’s stated beef is that Canada’s cheese tariff-rate quota under the USMCA bars retailers from holding the quota, while its cheese quota for the European Union under CETA grants those same retailers access. That’s not a broadside at supply management. It’s an eligibility-criteria complaint — almost administrative in its specificity. 

And the operations most exposed here aren’t Canadian farms. They’re U.S. Class IV shippers whose price floor already sits underneath a flow of Canadian dairy protein that’s been moving south for years. That flow has nothing to do with the tariff that just got signed.

Two Fights, One Milk Cheque

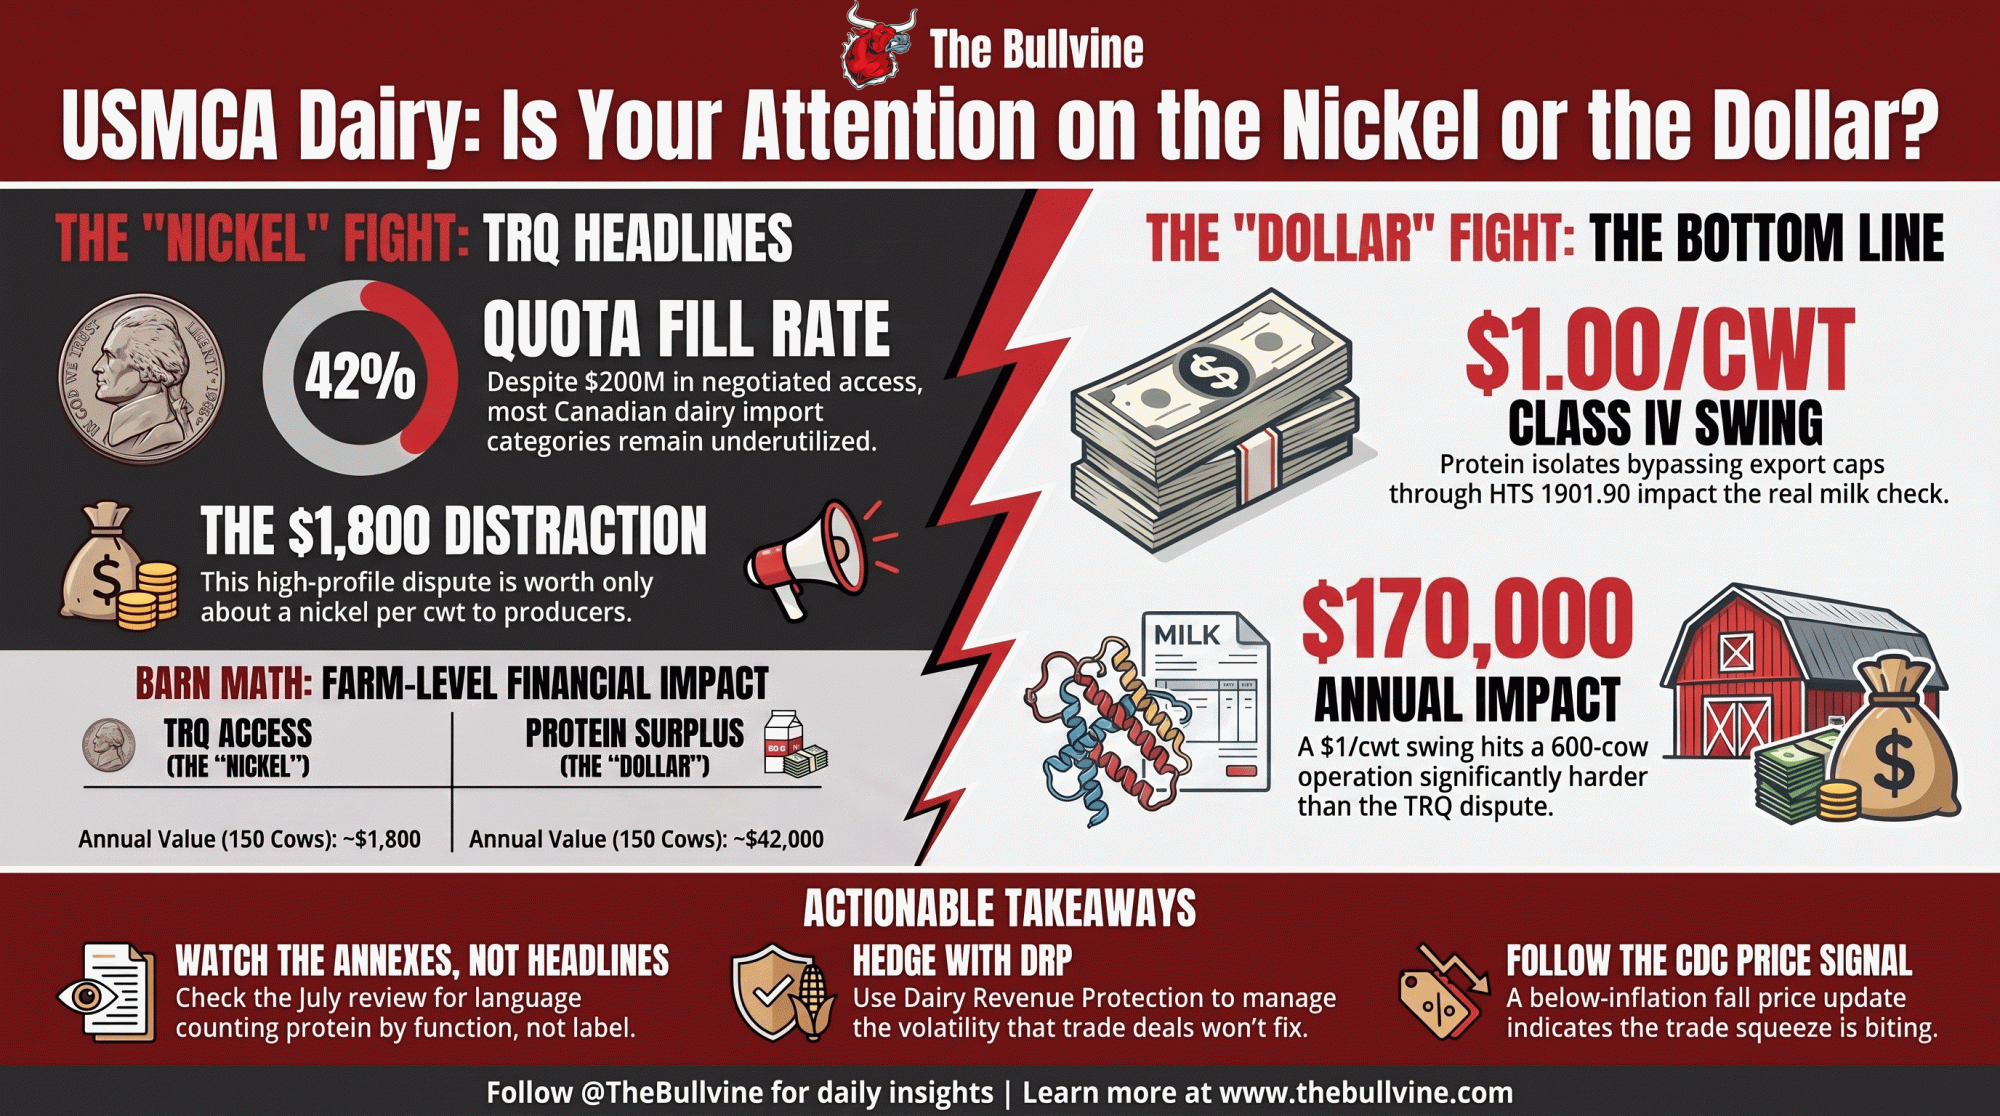
Start with the headline number. USMCA promised American dairy roughly US$200 million a year in new tariff-free access into Canada, spread across 14 separate dairy TRQs, and, over six years, the fill rate averages near 42% across those categories. Divide that full $200 million across the 232 billion pounds of milk the U.S. produced in 2025, and you get about 8.6 cents per hundredweight — gross. After processing margin, freight, and the plain fact that much of the quota goes unfilled, the slice reaching farm-level milk cheques lands nearer a nickel a cwt. Call it $1,800 a year on a 150-cow dairy shipping around 36,000 cwt, on Bullvine’s modeling of USDA production and USTR access data. Real money. Just not the kind that decides whether your barn pencils out. 

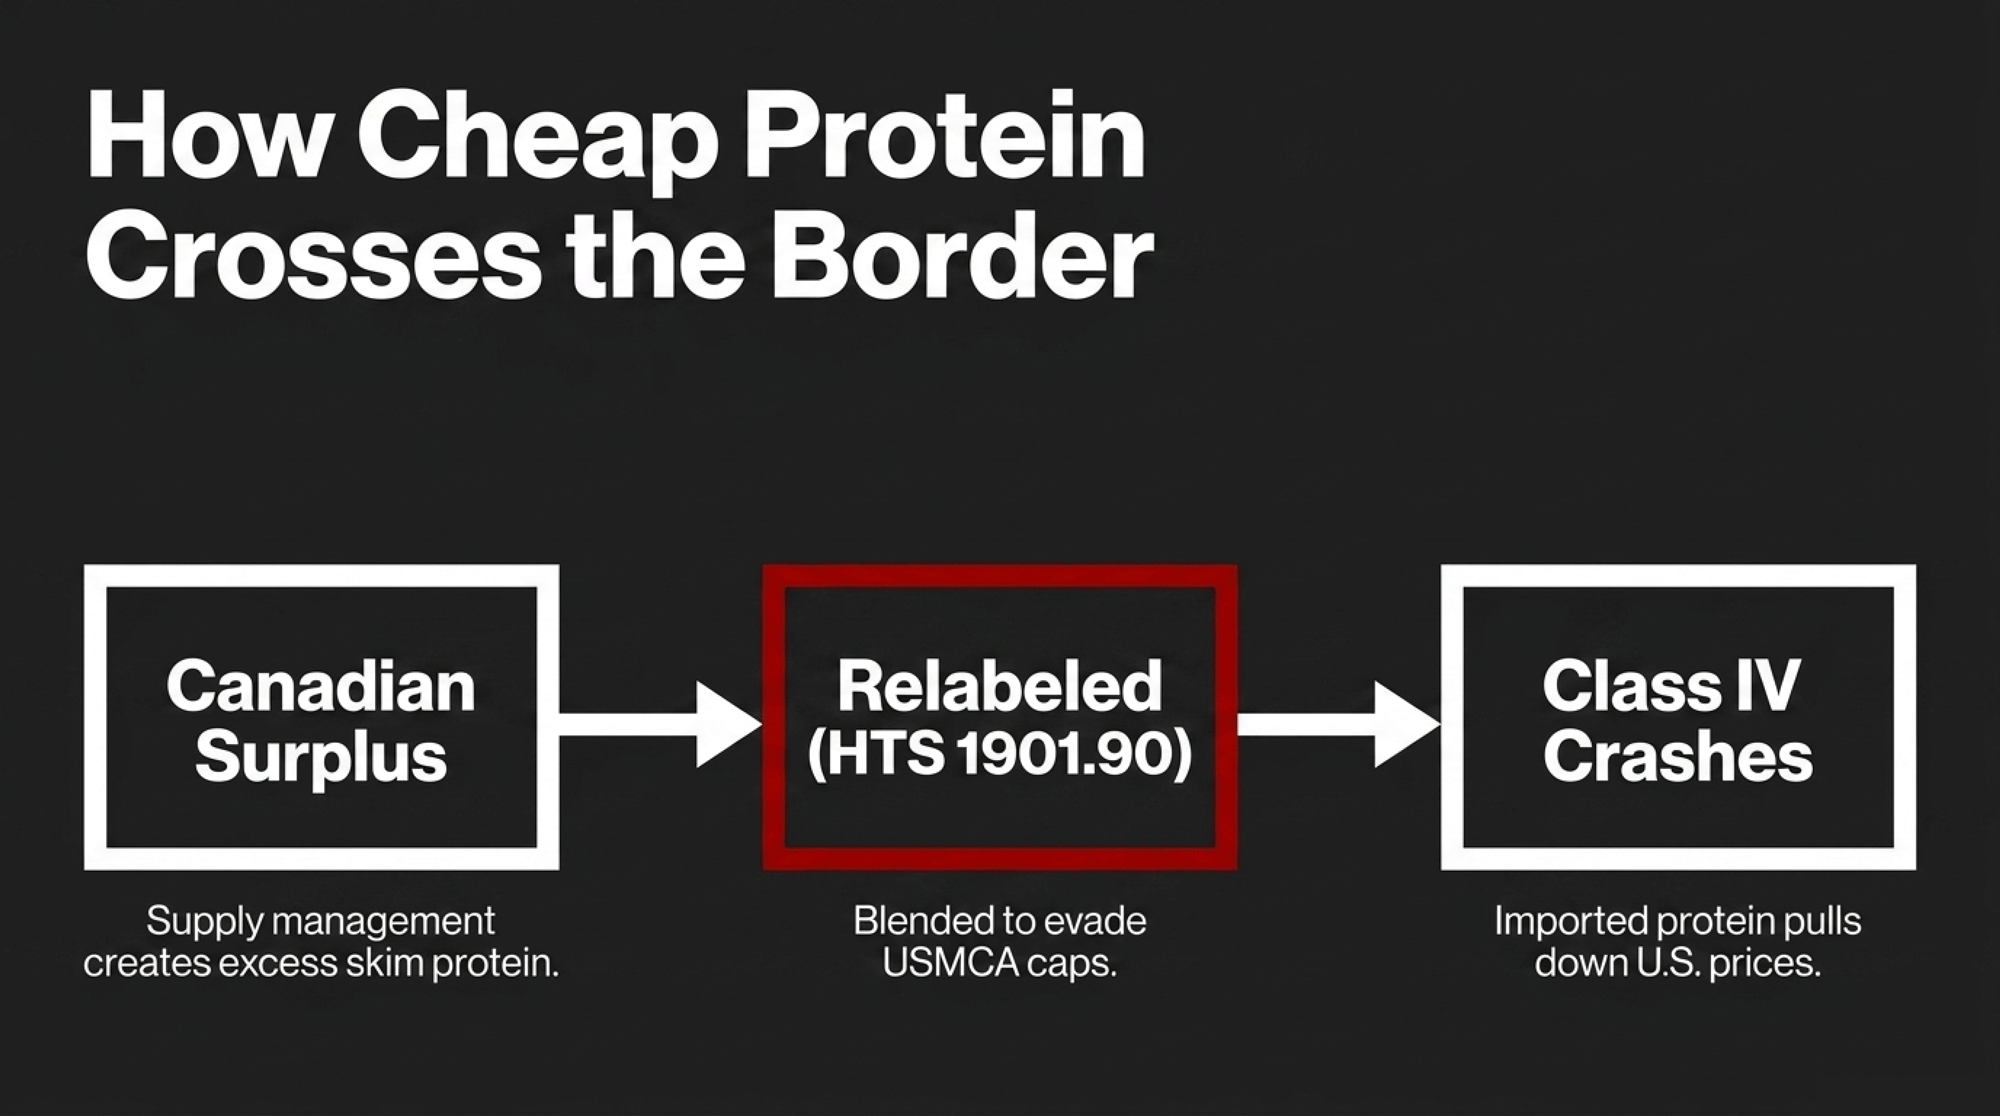
Now the number underneath it. The USITC found in May that Canada’s system “unlinks its relatively high farmgate price of milk from the price that NFS processors pay for milk components in Canada,” creating “a domestic structural surplus of nonfat milk solids components”. According to those same findings, that surplus heads south, much of it under Harmonized Tariff Schedule code 1901.90 and cousins that USMCA’s caps don’t touch, and competes on the U.S. market. It lands on the same Class IV pool your powder milk gets priced against. 

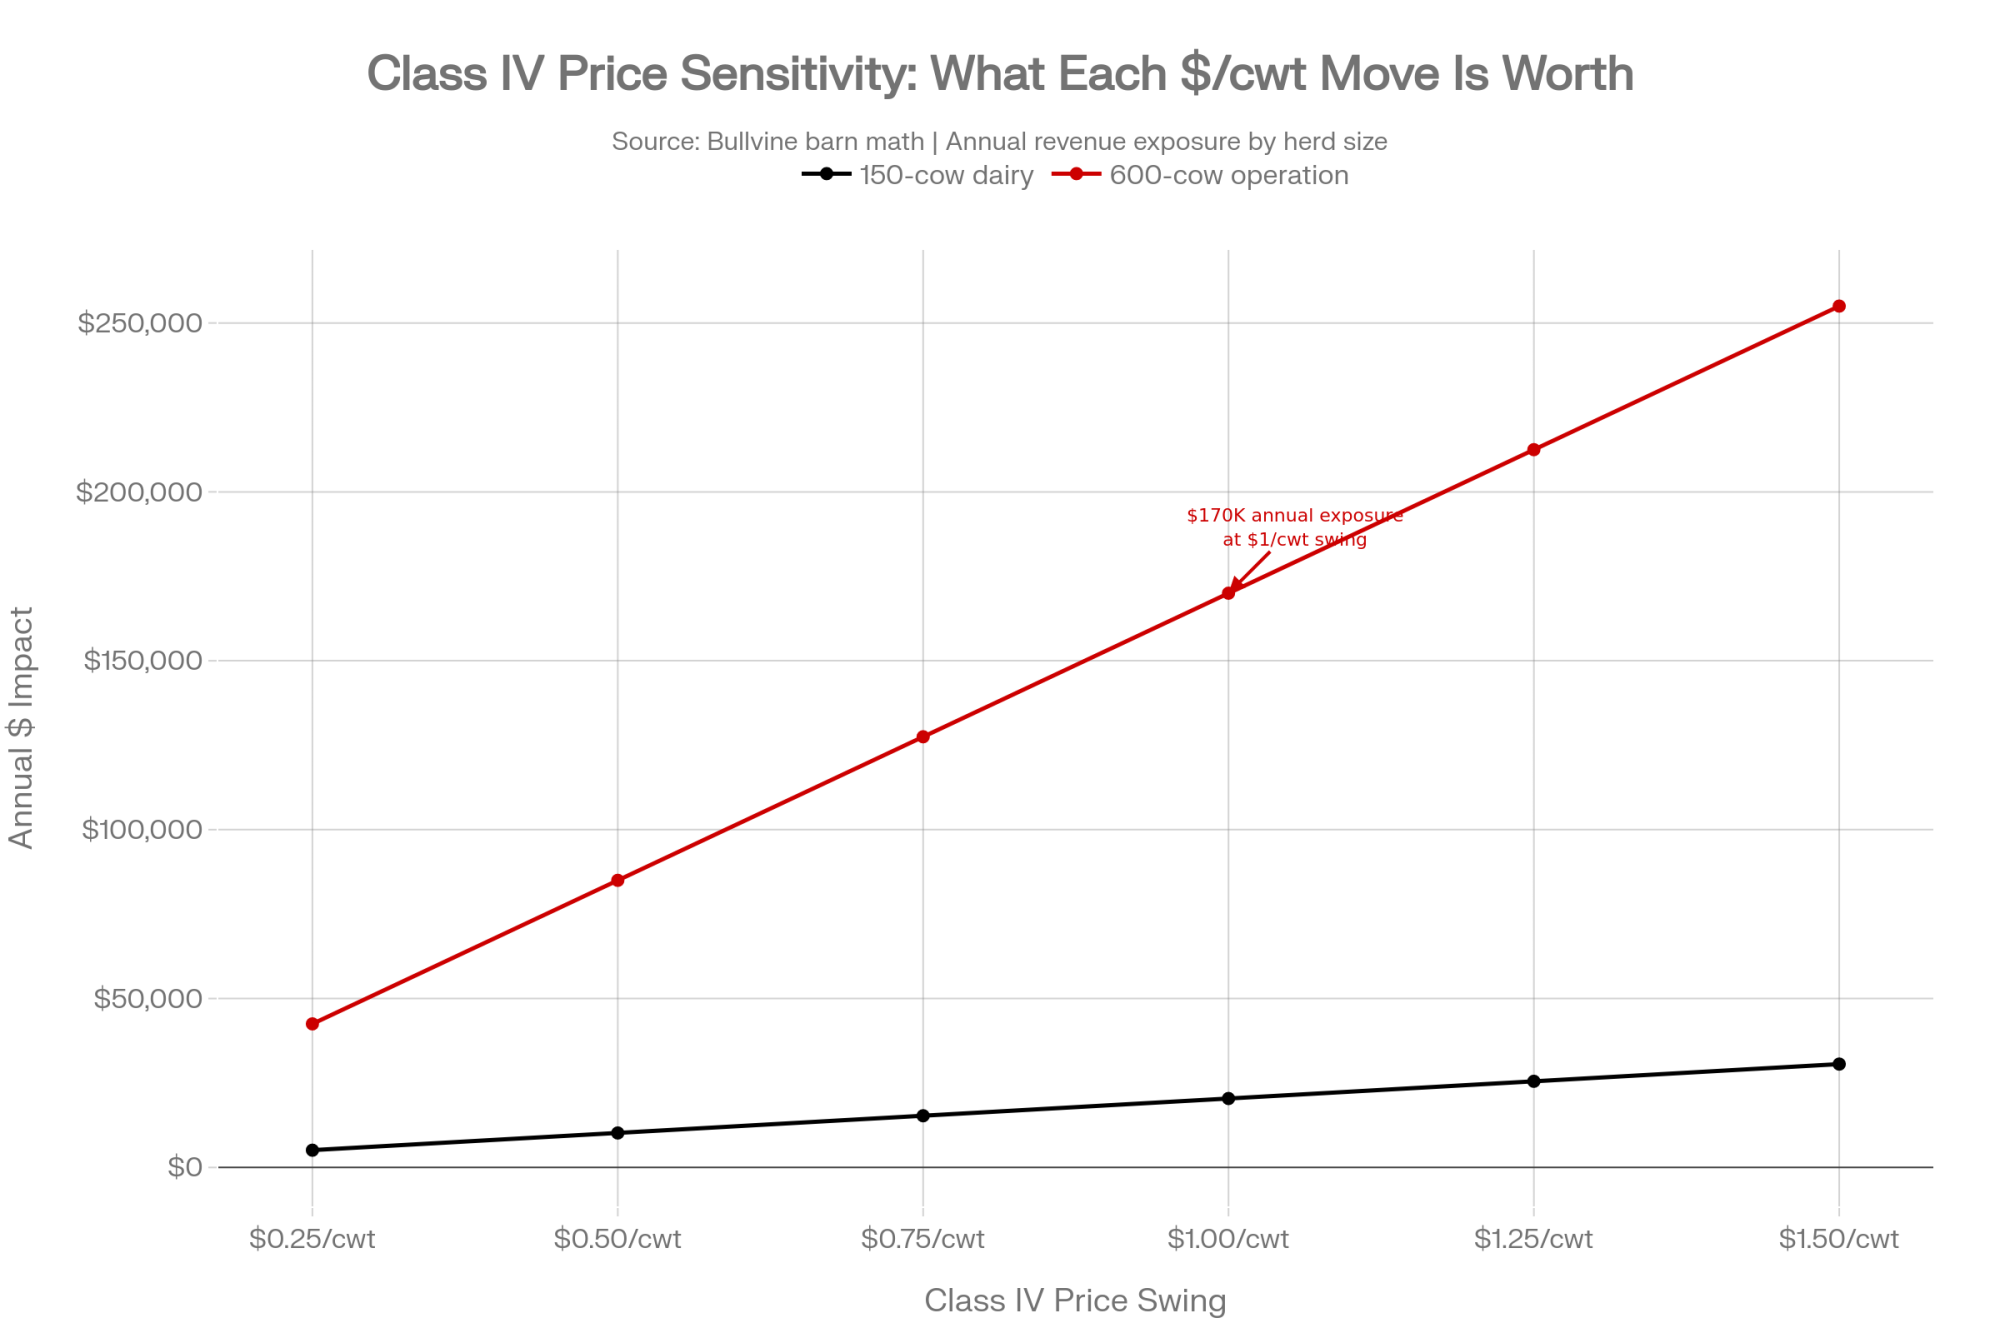
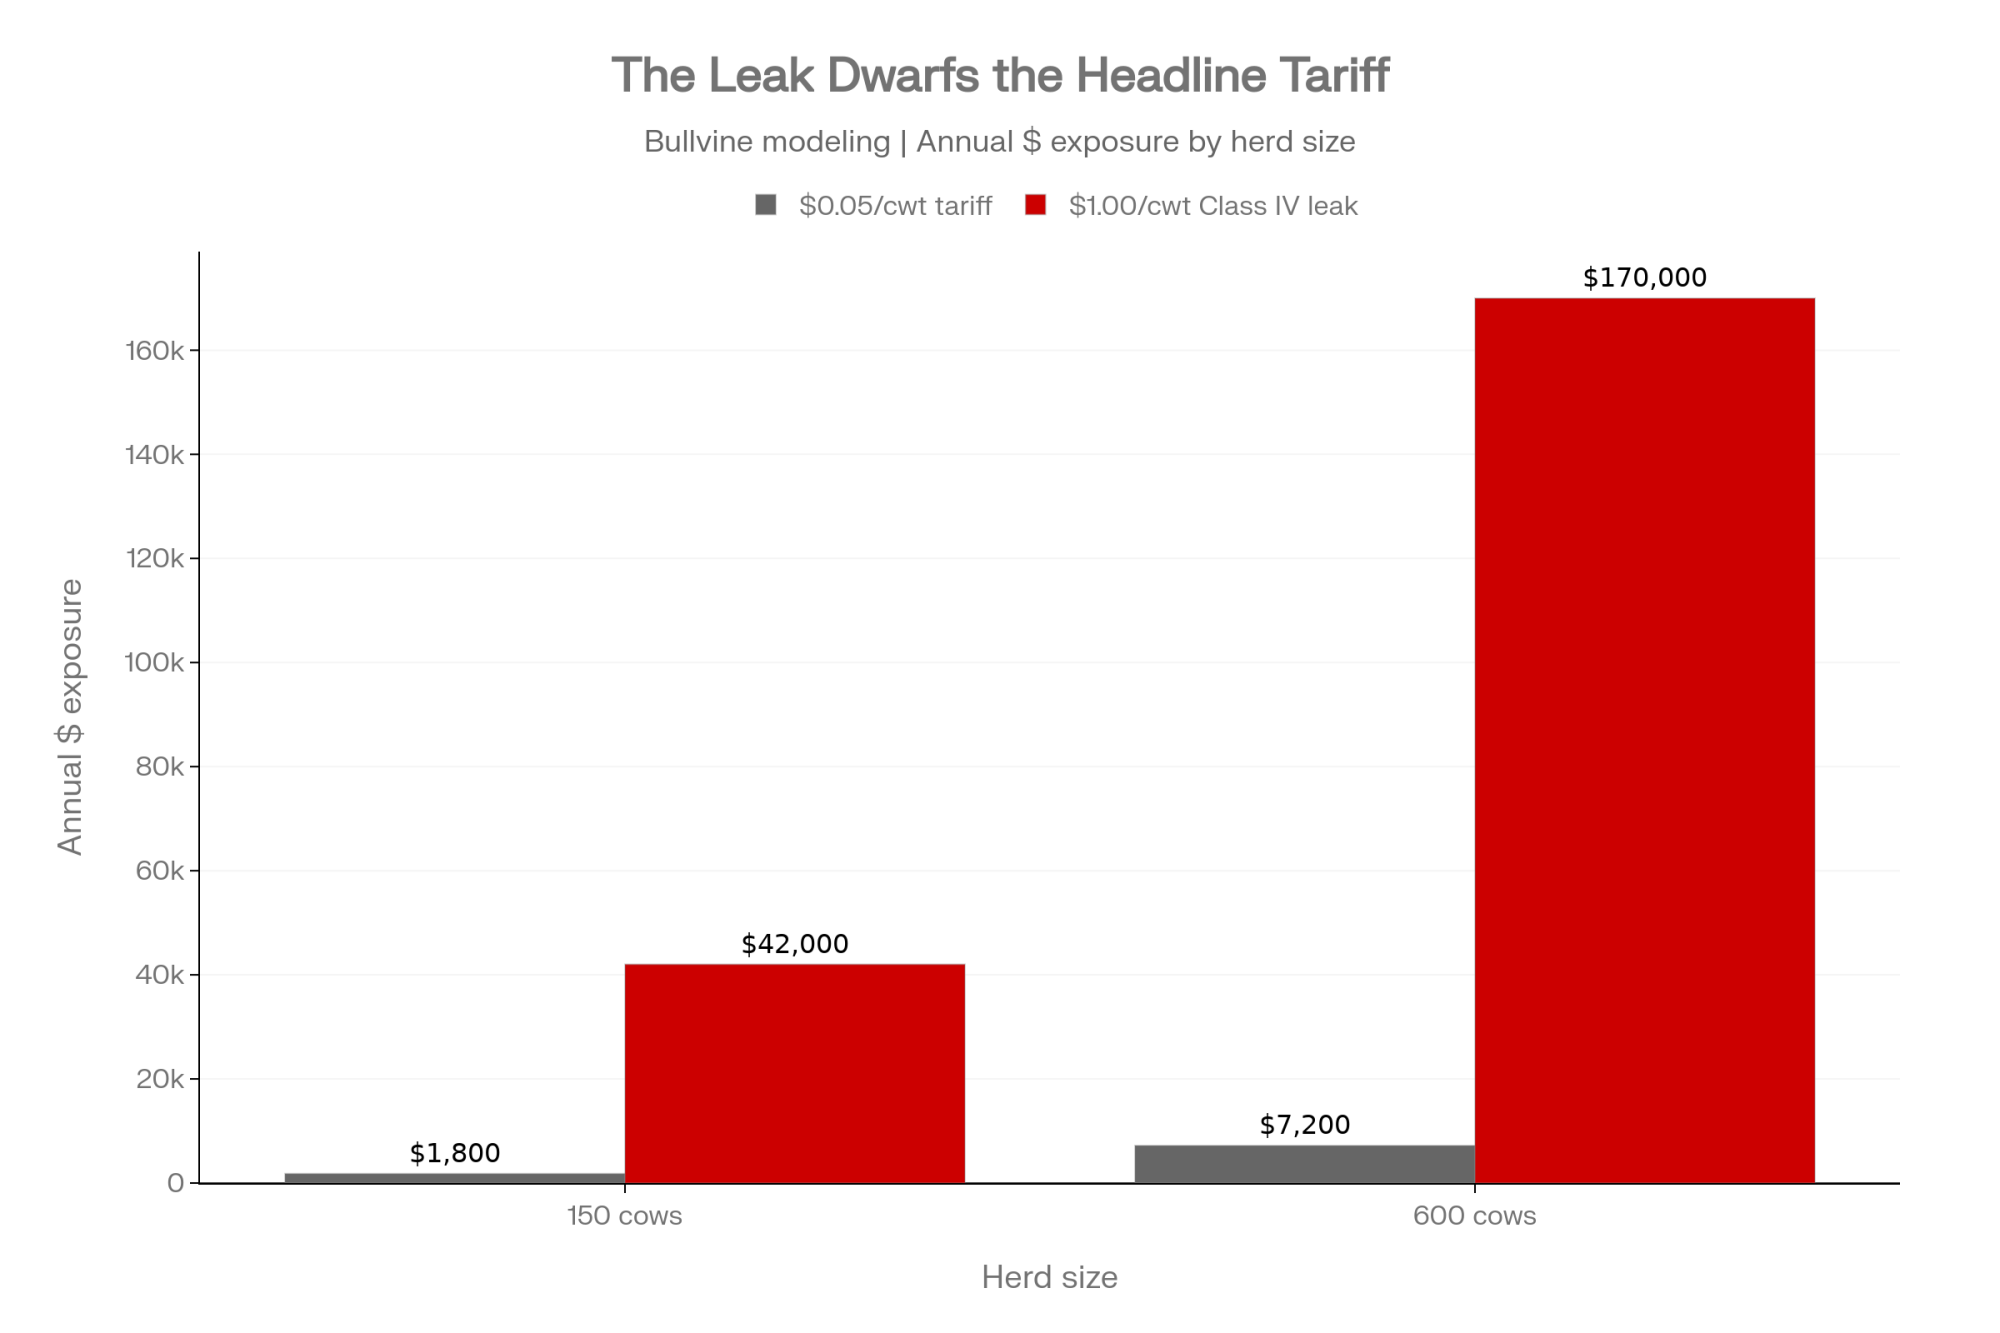
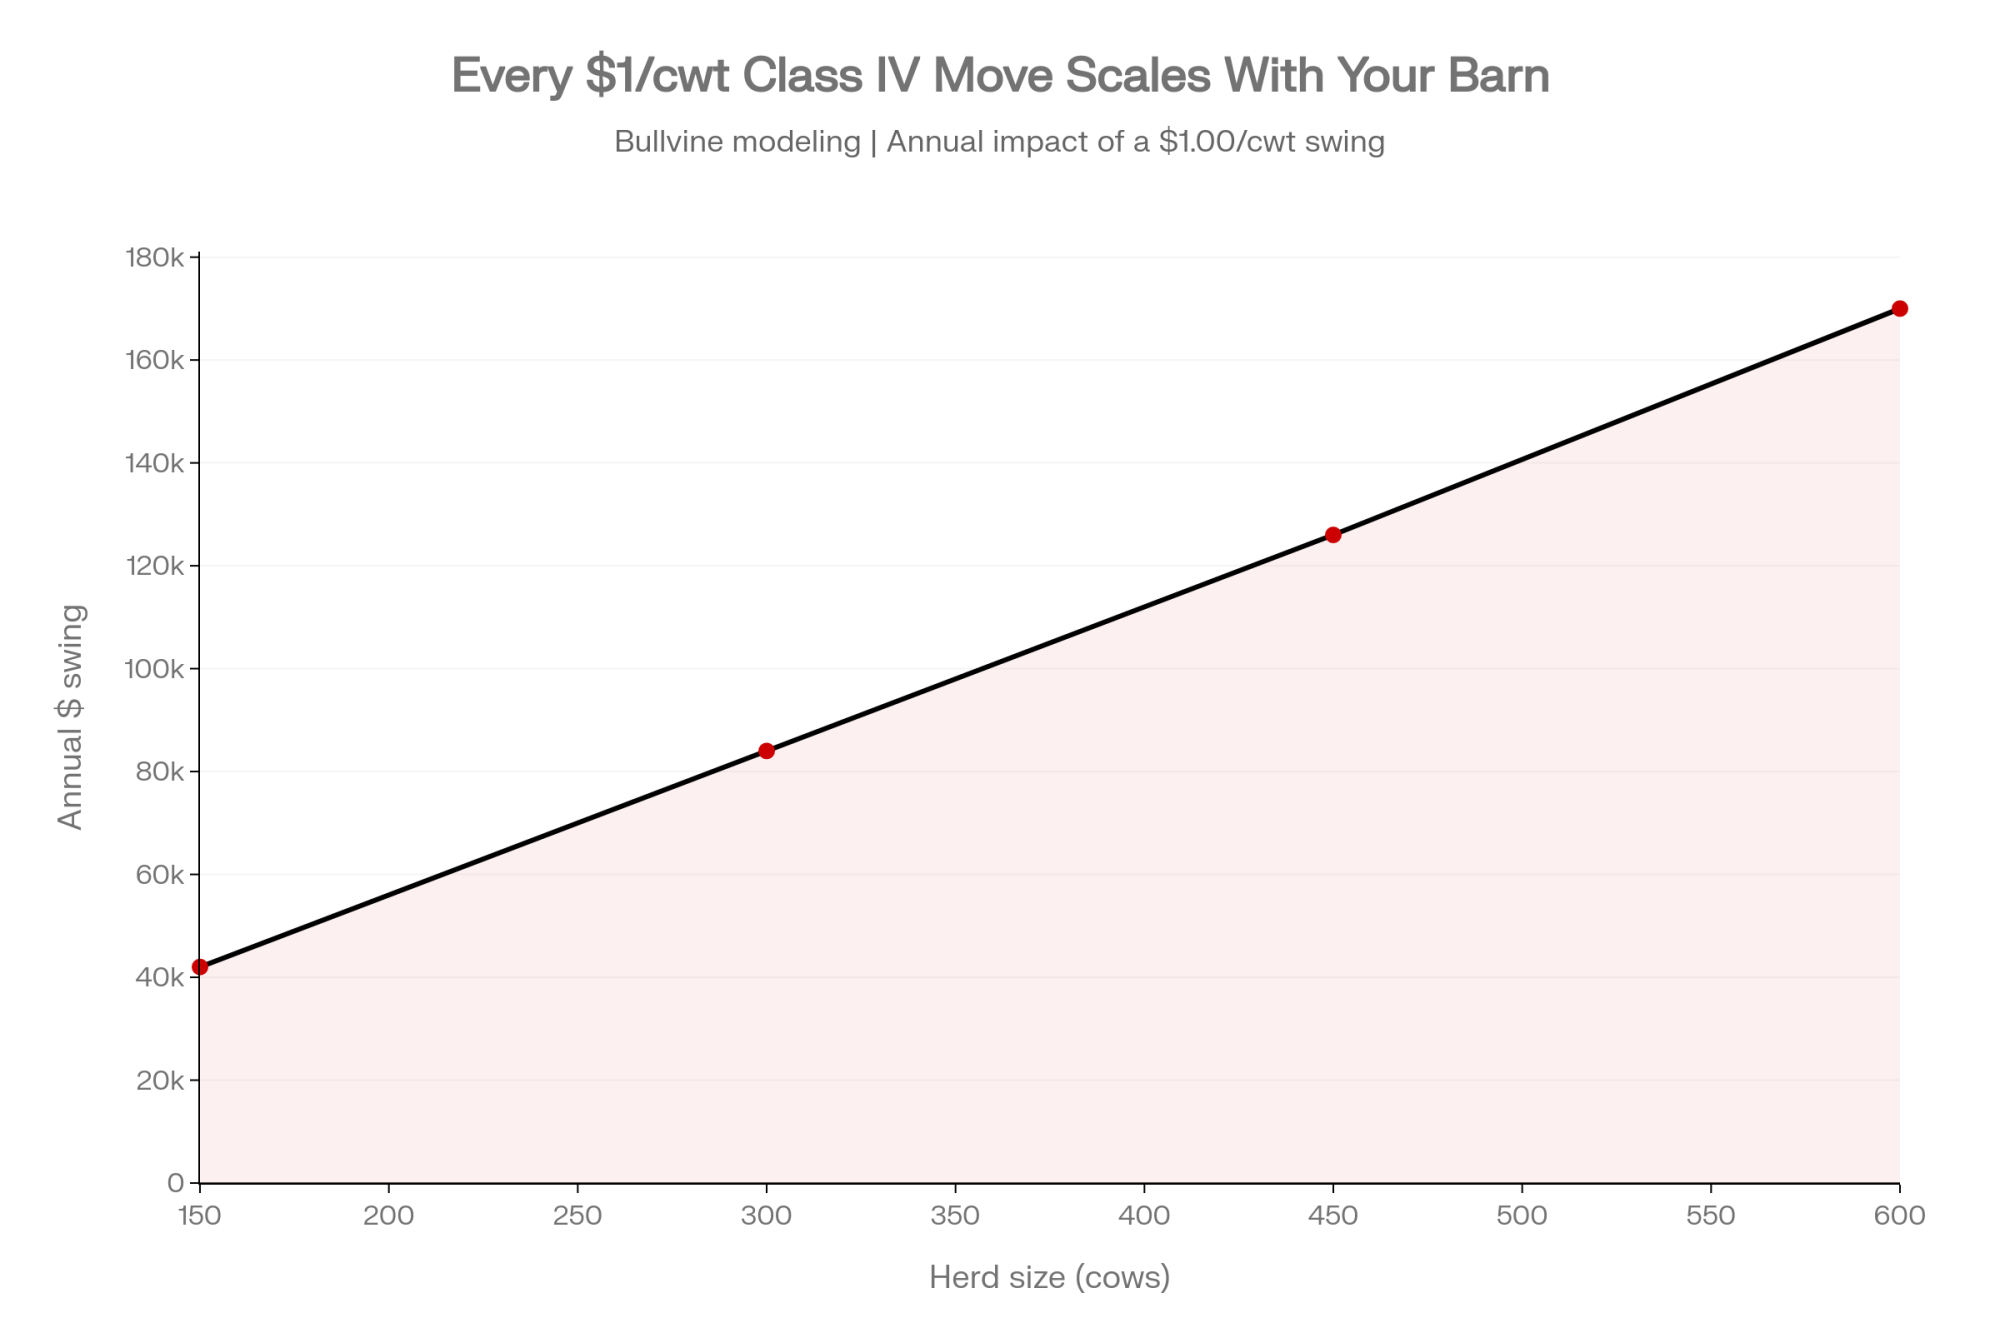
Here’s the barn math that flips the whole story. Take that same 150-cow herd, now shipping heavier — around 42,000 cwt when it’s running full Class IV. A $1.00/cwt swing in Class IV runs about $42,000 a year on that herd — and roughly $170,000 on a 600-cow Western operation shipping around 170,000 cwt. Most herds sit below that ceiling depending on their Class III/IV mix, so treat $42,000 as the top of the range, not the middle. Even so: same barn, same year, two fights. One’s worth a nickel. The other moves a full dollar. 

How the Leak Actually Works

Here’s “unlinking” in plain terms. Canada prices raw milk high at the farm gate — that’s the whole point of supply management, and it’s kept Canadian dairy income far steadier than the U.S. rollercoaster for three decades. But pricing milk for its fat throws off more nonfat solids — protein, skim — than Canada’s home market wants at that regulated price. That surplus has to go somewhere.

Where it goes is south. And the mechanics are simple enough to explain to your banker or board in one breath:

The Reclassification Trick

  • Standard skim powder (Chapter 04): Subject to USMCA tariff-rate quota caps — 35,000 tonnes, with a surcharge above it. 
  • Blended protein (Chapter 19 / HTS 1901.90): Combining ~56% skim milk powder with ~44% milk fat bypasses those Chapter 04 caps entirely, competing directly against U.S. Class IV powder pricing. 

Same solids, different code — a classification Canada treats as fully compliant, and one Washington is now contesting.

So the U.S. had three separate grievances stacked on one industry: the TRQ market-access fight, this reclassification pathway, and the cheese-quota eligibility dispute. It had all three documented. When it finally pulled the trigger on July 20, it reached for the third — the narrowest one. Canada, for its part, has consistently defended its allocation and classification practices as USMCA-compliant — a position a dispute panel largely upheld in November 2023. That mismatch is the tell that August 19 doesn’t actually resolve anything. 

How Much Does Waiting Until August 19 Actually Cost You?

On the tariff itself, less than the headlines imply. The long-running read on the TRQ fight is that fixing allocation does little to change the makeup of Canadian imports, because U.S. product still loses on price and logistics — and Canada won that November 2023 dispute panel on exactly that terrain, 2-1. The real cost of waiting sits on the Class IV side, and it’s harder to see because it never shows up as one big event. It’s a slow drag on your floor that’s been running for years. 

So don’t hang your risk decision on the tariff date. Hang it on your own Class IV exposure. The calendar question isn’t “August 19” — it’s “how many more settlement cycles am I leaving unhedged while I wait to see what Ottawa and Washington do?”

Is Your Milk More Exposed Than You Think?

Pull your last three settlement statements before you do anything else. Work out what share of your cheque actually rides on Class IV versus Class III, because that ratio decides whether any of this touches you. A herd that’s 70% Class III barely feels the leak. One shipping heavy into butter and powder feels most of it.

That’s not a number you can eyeball from the barn. It’s a number you read off a statement — and most producers haven’t looked hard at that split in a year.

Options and Trade-Offs

You can’t renegotiate CUSMA from the parlor. But you can decide how much of your risk you’re leaving hostage to a Class IV price you don’t set. Here’s what producers are weighing right now.

  • Review your Dairy Revenue Protection position in the next 30 days. HighGround Dairy reported Q1 2026 DRP indemnities averaging $1.12/cwt against $0.28/cwt in premiums — a net $0.83/cwt to producers who carried coverage. When it makes sense: if a soft Class IV quarter would hurt. What it takes: a call to your crop-insurance contact this month, ahead of August 19. The catch: premiums are a real cost, and DRP smooths volatility — it doesn’t erase it. And the payout swings hard year to year — Q1 2025 indemnities averaged just $0.13/cwt, versus a record $2.03/cwt in Q4 2025. 
  • Read the cap language, not the fill-rate headlines. When the next negotiating round drops documents, read the annexes to see whether protein is counted by function — including blends and isolates — or just by label. When it makes sense: if you’re Class IV-heavy. The limit: if the language stays vague, that itself tells you the gap isn’t closing. 
  • Canadian producers: watch the component ratio, not the border. The 2026 shift toward protein value — the Western Milk Pool’s move from 85/10/5 to 70/25/5, effective April 1 — is already reshaping your cheque more than any tariff will, with high-fat, low-protein herds facing shortfalls up to $900 per cow. When it makes sense: for herds long on fat, short on protein. The catch: waiting a breeding cycle to react costs real revenue per cow. 

Is This a New Fight, or the Next Chapter of an Old One?

YearMechanism UsedOutcome
2018–20USMCA eliminates Class 6/7 pricingU.S. win on paper
Jan 2022Dispute panel challengeU.S. won
Nov 2023Second dispute panel (rewrite)Canada won 2-1
May 2026USITC report on nonfat-solids surplusFindings only, no remedy
Jul 2026Section 338 proclamation50% tariff, effective Aug 19

Sit with this part. The same U.S. complaint has surfaced in the NAFTA renegotiation, the elimination of Canada’s Class 6/7 pricing in the USMCA, a January 2022 dispute panel that the U.S. won, a November 2023 panel that ruled 2-1 for Canada’s rewrite, the May 2026 USITC report, and now Section 338. Five or six tools across three administrations and a solid decade. 

The tell isn’t the tariff. It’s that after winning round one in 2022 and losing the rewrite argument in 2023, the U.S. has reached for everything except that dispute process ever since — escalating even while the scheduled 2026 joint review is still open. When a grievance outlives the process built to settle it, it stopped being about the facts of any single case a long time ago. August 19 is a chapter marker, not an origin point. 

Key Takeaways

  • Audit your Class III/IV split. Pull your last three settlement statements. You can’t hedge a Class IV risk if you don’t know your herd’s exact exposure percentage.
  • Review DRP coverage within 30 days. Use August 19 as a firm operational deadline to evaluate Dairy Revenue Protection options with your agent before Q3/Q4 settlement cycles. 
  • Canadian herds — adjust breeding strategy now. Address fat-versus-protein ratios under the Western Milk Pool’s 70/25/5 structure before the next breeding cycle penalizes low-protein production. 
  • Monitor the trade negotiation text. Watch whether future USMCA/CUSMA updates cap protein by functional output — blends included — or strictly by product label. 

So here’s the question worth taking to your advisor this week. If the Class IV floor you’re priced against has been quietly leaking for years — and the tariff everyone’s talking about doesn’t plug it — where does that leave your breakeven heading into a soft second half? Are you managing the risk you can actually see, or the one that made the front page?

We laid out the full protein-reclassification mechanism and the Class IV math by herd size in our companion piece, A Nickel vs. $170K: The Two USMCA Dairy Fights, Priced Out — the line-by-line version of that $1,800-versus-$42,000 gap, run on your own numbers. That’s where the real math lives. 

Run Your Numbers

Dairy Profit Projector — Drop in your herd size, Class III/IV split, and futures, and the projector puts a real dollar figure on what a $1/cwt Class IV move does to your next 12 months — whole-herd margin, IOFC, and breakeven. Stress-test the swing this piece is built on before August 19, not after .

Learn More

The Sunday Read Dairy Professionals Don’t Skip.

Every week, thousands of producers, breeders, and industry insiders open Bullvine Weekly for genetics insights, market shifts, and profit strategies they won’t find anywhere else. One email. Five minutes. Smarter decisions all week.
NewsSubscribe
First
Last
Consent

A Nickel vs. $170K: The Two USMCA Dairy Fights, Priced Out

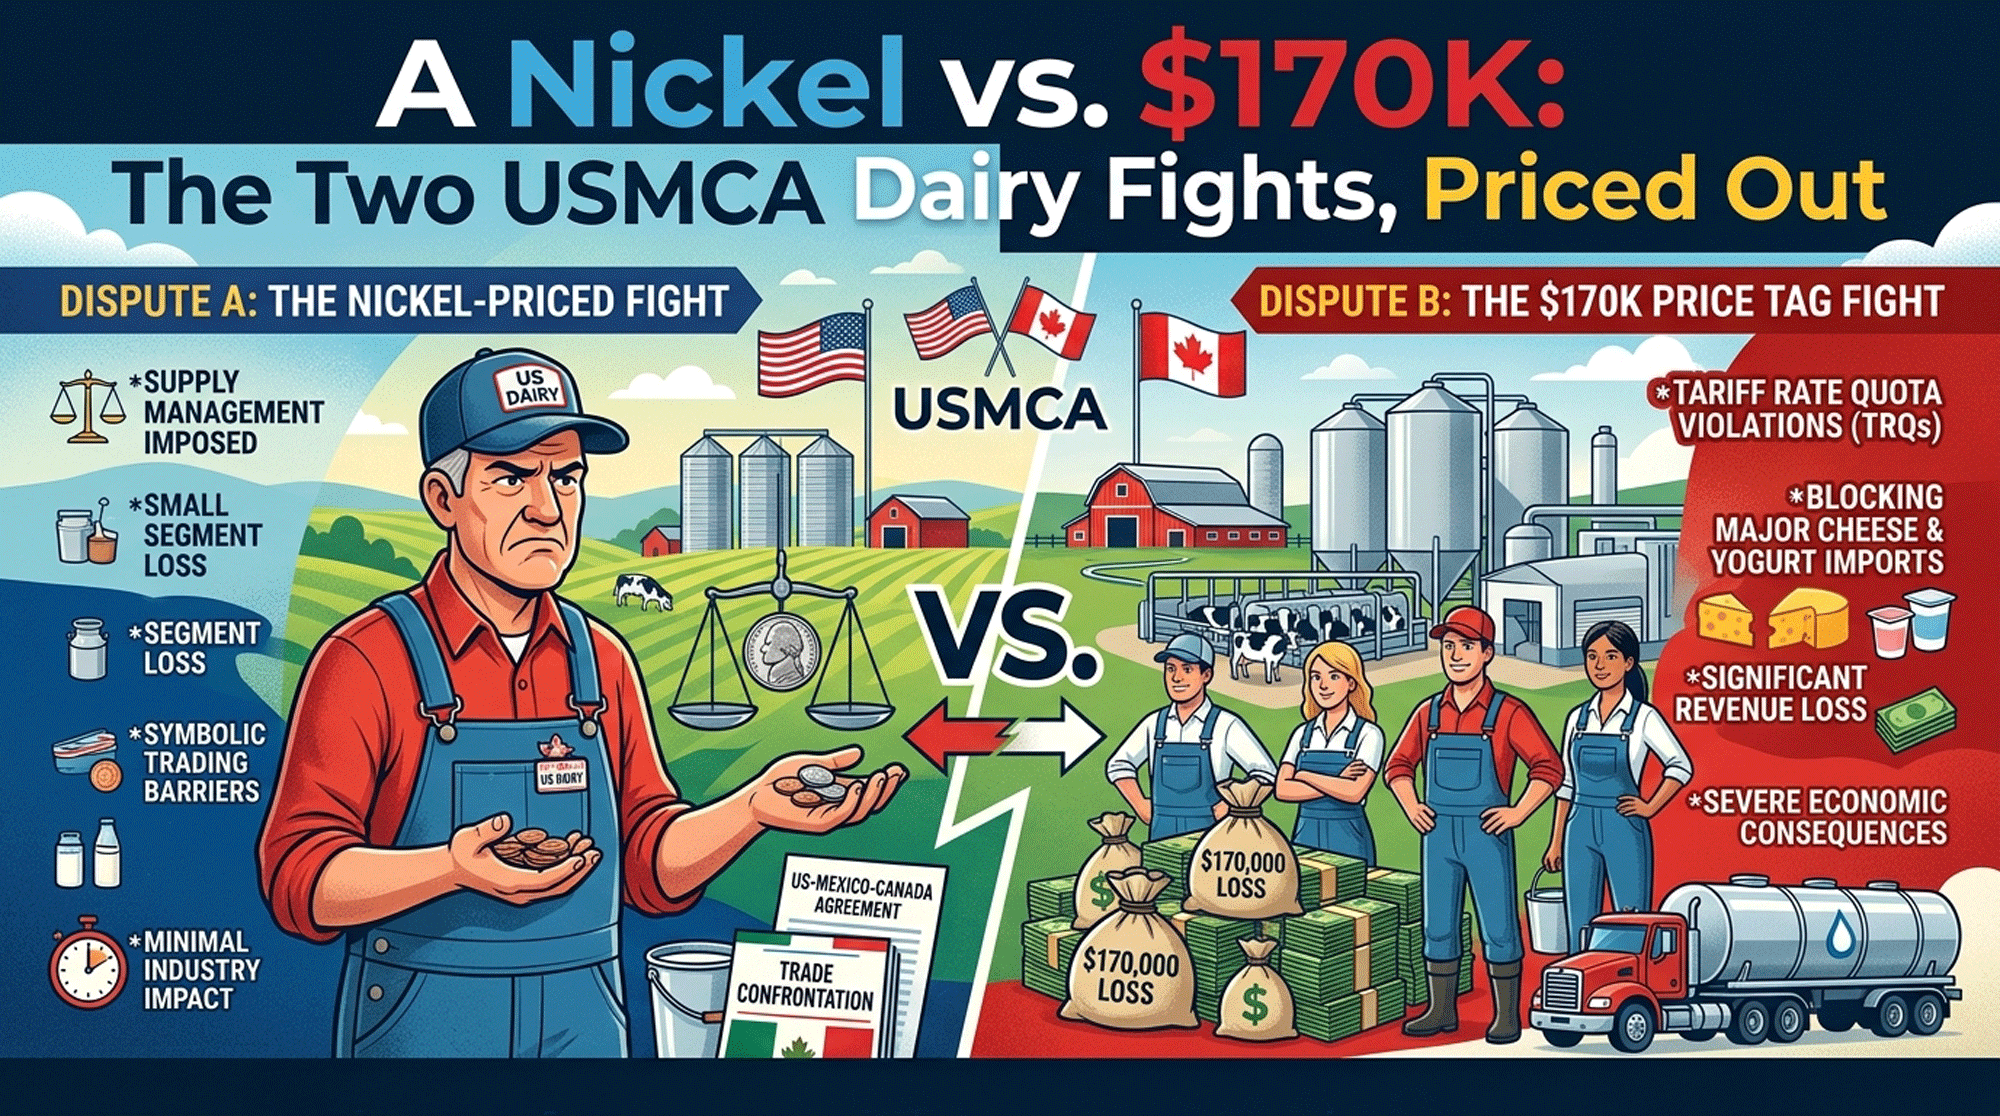
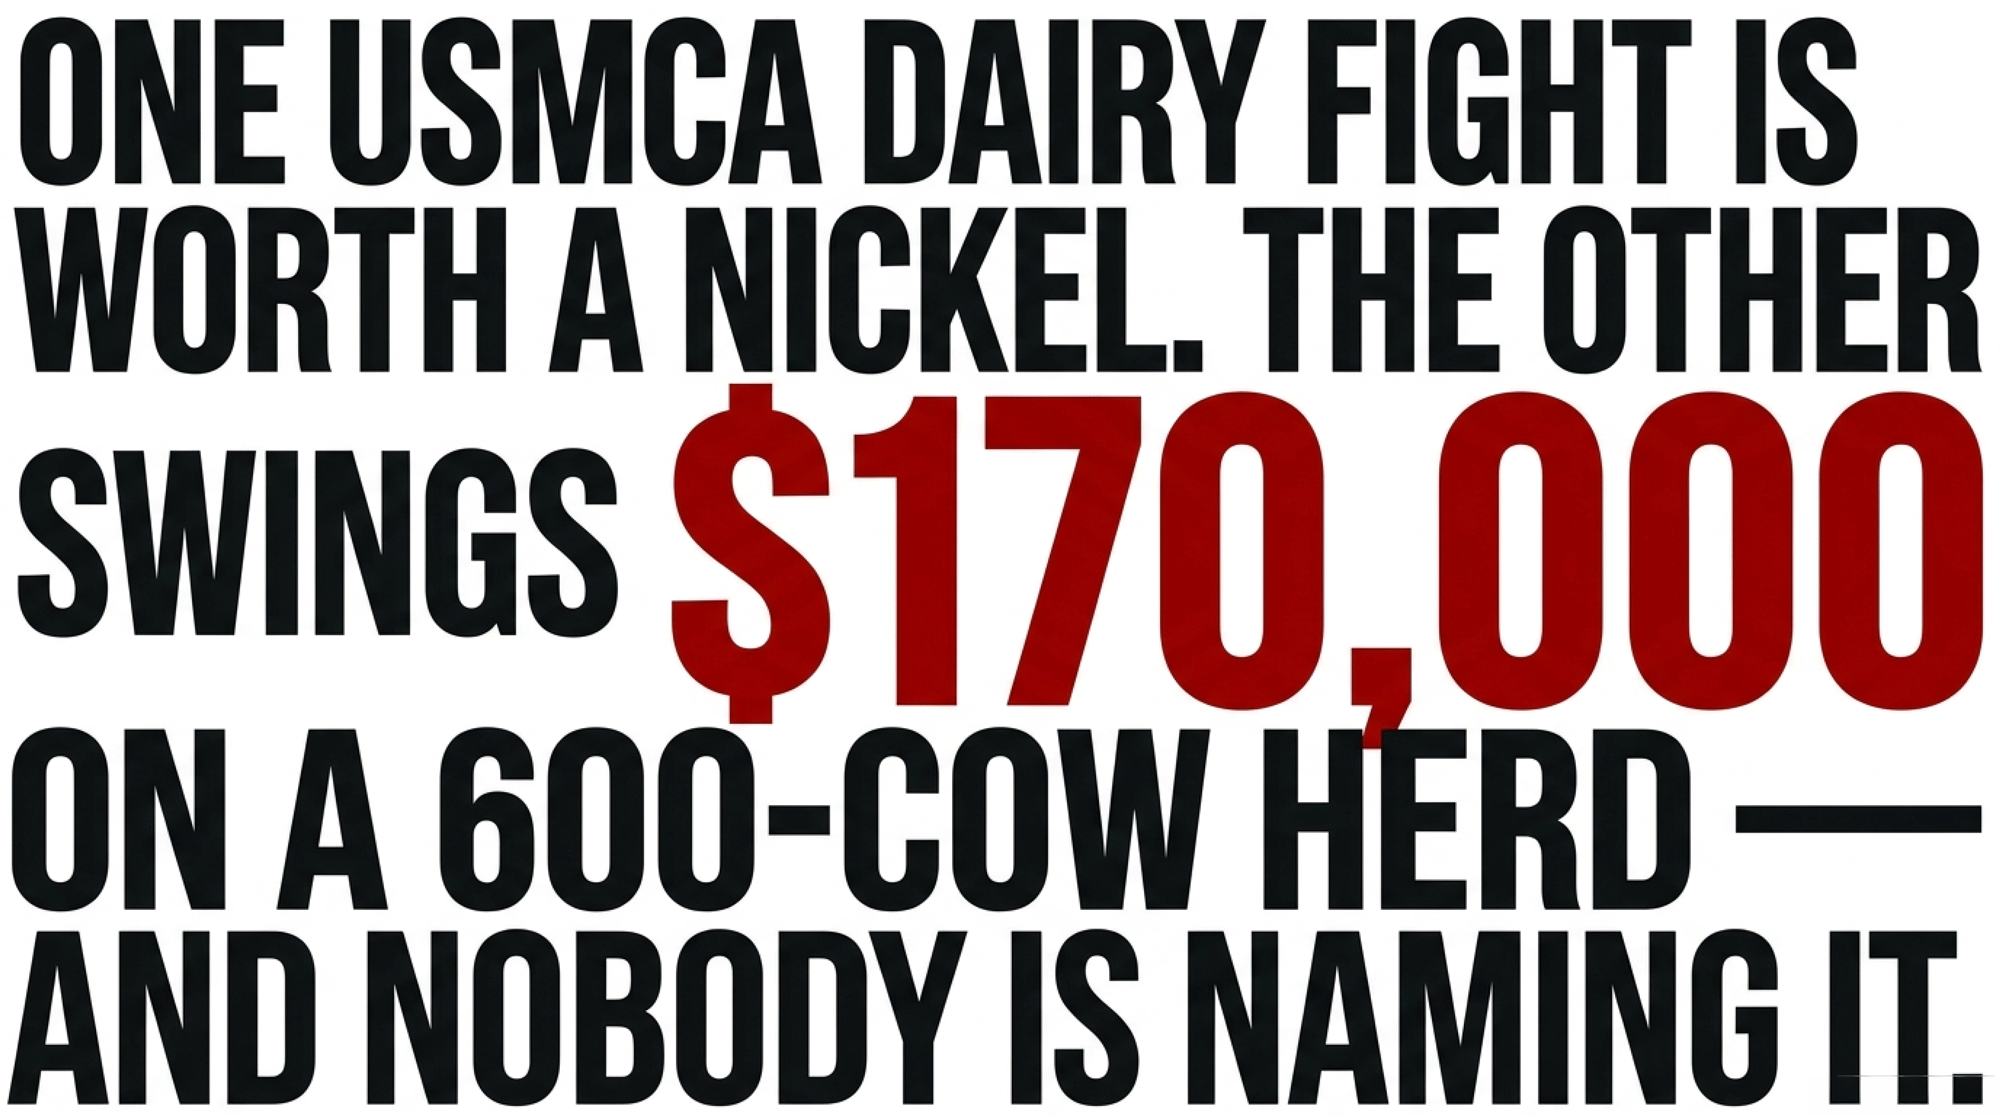
Two USMCA dairy fights are on the table this month. One’s worth about a nickel a cwt. The other swings $170K on a 600-cow herd — and nobody at the table is naming it.

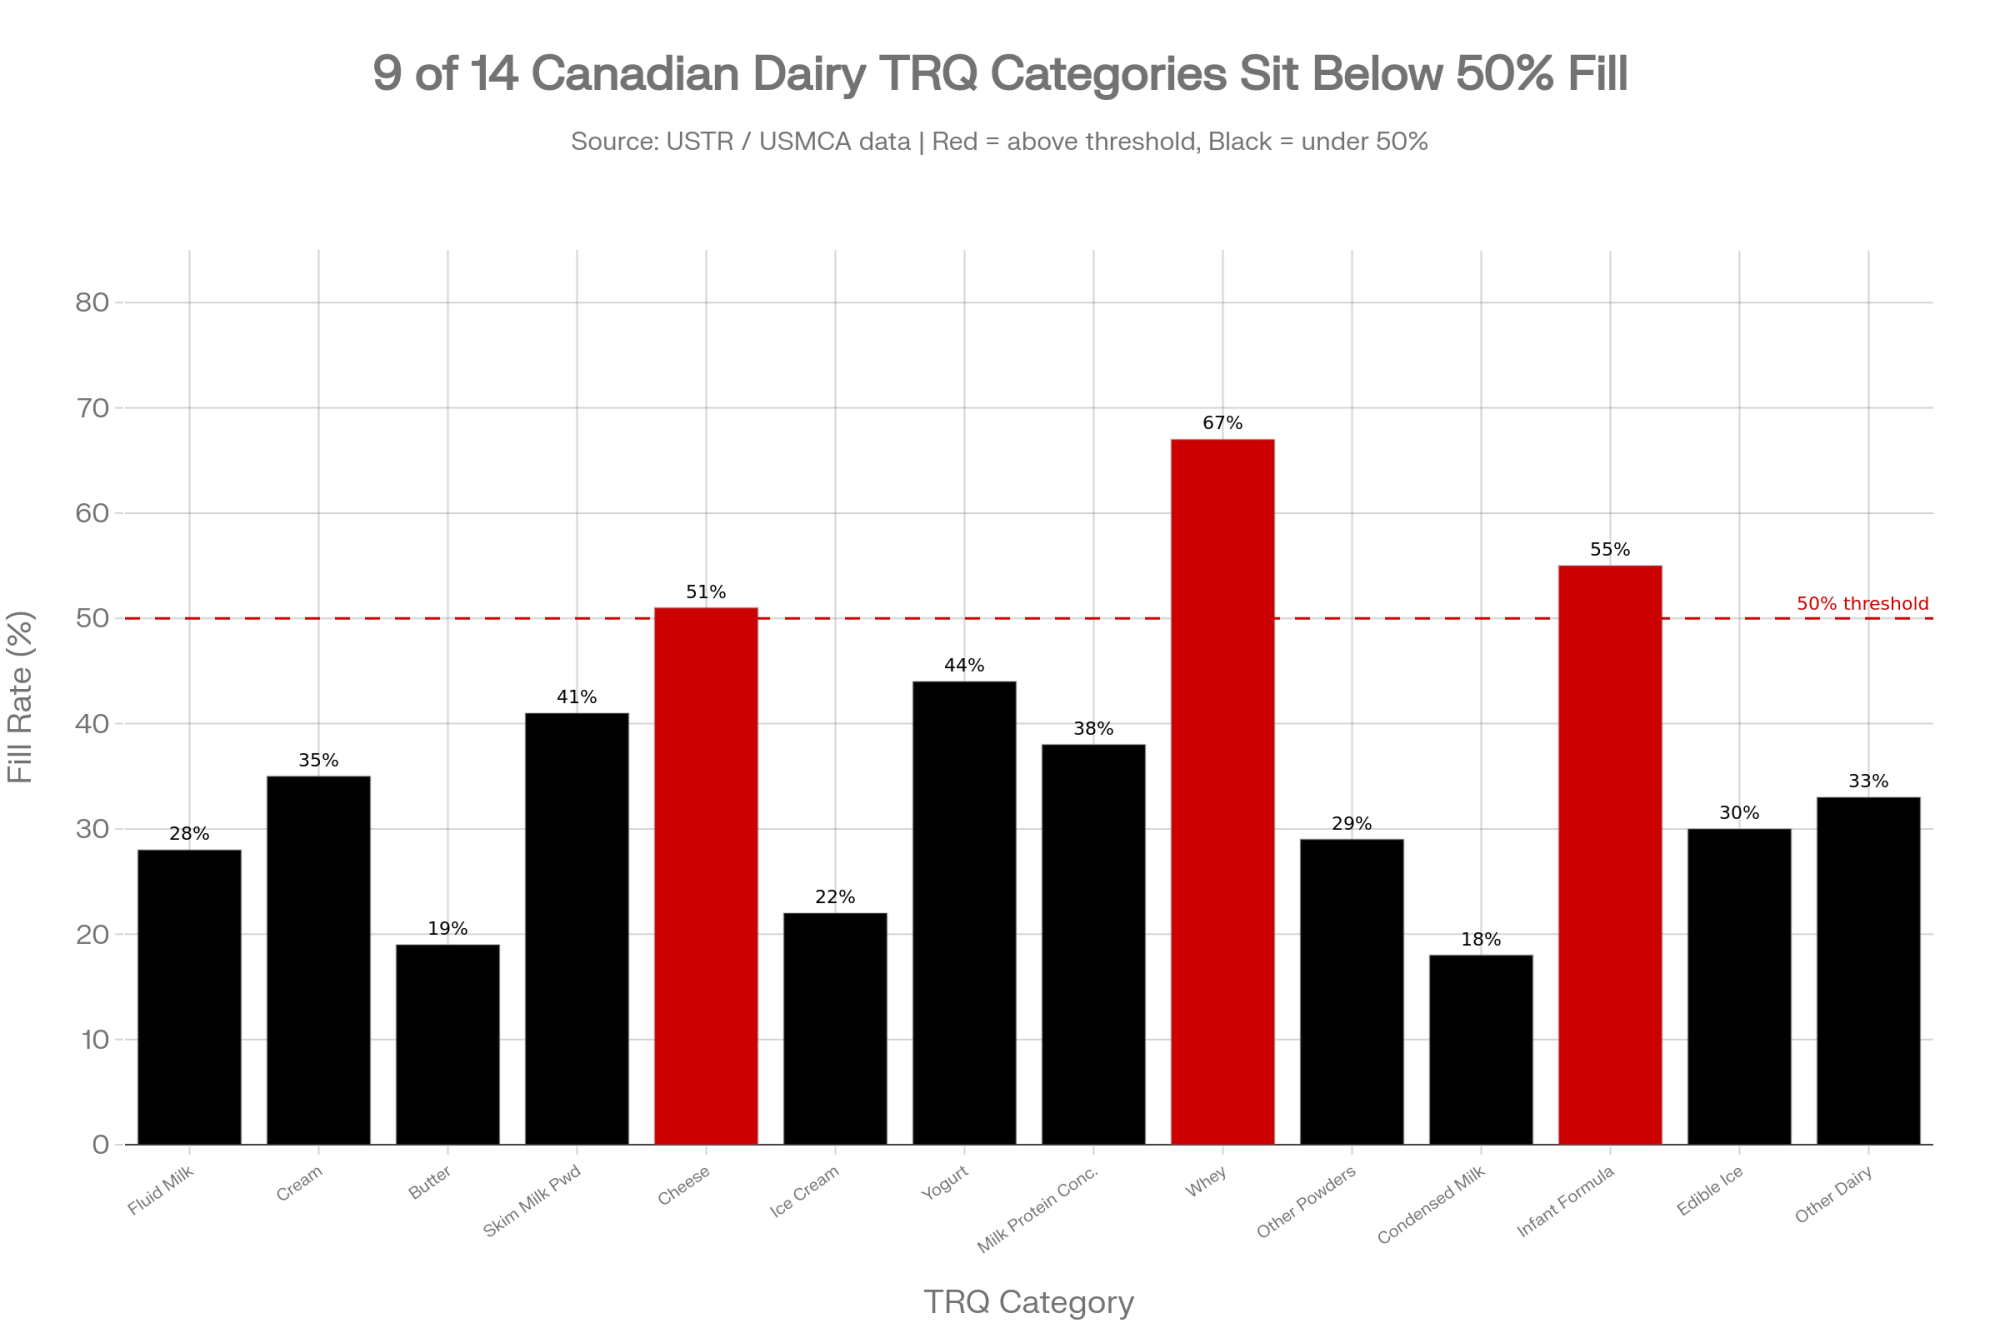
Executive Summary: On July 1, USTR declined to renew USMCA in its current form, reopening the dairy file — and both governments are loudly fighting over the wrong number. Washington wants the $200 million in annual access Canada allegedly never delivered (TRQ fill sits near 42%, with 9 of 14 categories under 50%), but spread across US milk production that’s worth about a nickel a cwt — roughly $1,800 a year on a 150-cow dairy. The fight that actually moves your milk check is the quiet one: Canada’s structural protein surplus moving into the US under uncapped codes like HTS 1901.90, leaning on Class IV. On a 600-cow herd, a $1/cwt Class IV swing is $170,000 a year — and even on a 150-cow herd it’s about $42,000, still an order of magnitude past the TRQ nickel. US Class IV shippers should read the cap annex language, not the fill-rate headlines, when the July round drops; Canadian producers sitting on ~CA$2.5M in quota equity behind Bill C-202 should watch the CDC’s fall price signal. The number to watch isn’t 42% — it’s whether the new text counts protein by what it does, not what the label says.

On February 12, 2026, Ted Vander Schaaf sat in front of the U.S. Senate Finance Committee and made the case that Canada isn’t delivering the dairy market access it promised under USMCA. Vander Schaaf milks about 1,250 Holsteins in Idaho and is a member-owner of Northwest Dairy Association, the co-op behind Darigold — so the outcome hits his own milk check. USMCA promised American dairy roughly US$200 million a year in new tariff-free access into Canada. Six years in, most of that access sits unused. That’s the fight you’ll see in every headline about the July review.

Here’s the part nobody puts on the podium. Divide that full $200 million across the 231.7 billion pounds of milk the U.S. produced in 2025, and you get about 8.6 cents a hundredweight — and that’s the gross headline figure, the whole tariff benefit if every dollar of it reached the farm. It doesn’t. That $200 million is processor-and-exporter margin at the border; the slice that flows back to producer milk checks, after processing, freight, and the fact that barely 42% of the quota even fills, realistically lands near a nickel a cwt — roughly $1,800 a year on a 150-cow dairy. It’s real money. It’s just not the money that decides whether your barn pencils out. The fight that actually moves your milk price is quieter, buried in a tariff code, and almost nobody’s naming it (Federal Milk Marketing Order data).

What’s Changing and Why

On July 1, 2026, USMCA hit its first mandatory joint review — and the U.S. Trade Representative confirmed Washington “did not agree to renew the USMCA in its current form,” though the agreement stays in force while talks continue. Within hours, U.S. dairy groups accused Canada of ignoring its commitments, Canada said it’s holding up its end, and another negotiating round got scheduled for this month. The flashpoint is Canada’s tariff-rate quotas — the TRQs. USMCA handed U.S. dairy 14 separate TRQ categories, each a set tonnage of milk, cream, cheese, or powder that can cross the border duty-free.

The catch is that those quotas barely get used. U.S. exporters have filled about 42% of their allocated Canadian dairy quotas since the deal took effect, with 9 of the 14 categories sitting under 50%. The U.S. argument: Canada hands most of the import licenses to its own processors, who’ve got no reason to bring in competing American product. Canada’s counter is that trade is growing fine — total U.S. dairy exports to Canada climbed to US$1.31 billion in 2025, up 78% since 2020. Keep those two numbers apart, because the debate constantly blurs them: the $1.31 billion is total two-way sales, most of it flowing through channels that never existed in the TRQ fight; the $200 million is the new, negotiated access USMCA was supposed to open on top of it. Trade grew. The specific quotas Americans bargained for still don’t fill.

So the U.S. did what you do when you think a deal’s been broken. It went to dispute settlement — twice. It won the first panel in January 2022, which found Canada had breached the agreement by reserving TRQ pools exclusively for processors. Canada rewrote its rules. A second panel in November 2023 ruled 2-1 that the rewrite didn’t violate USMCA, with one panelist dissenting that Canada’s narrow eligibility rules still shut out importers who’d bring retail-ready American product to Canadian shelves. Two rounds of litigation. One win each. And the fill rate barely moved. As UC Davis economists put it, the dispute is “mainly the result of politics, and the economic benefits at issue are relatively small” (International Trade Insights).

How This Plays Out on Real Farms

Now the quiet fight — the one with real dollars behind it.

Canada’s supply management sets milk production to match domestic butterfat demand. Produce milk for its fat, though, and you generate a pile of leftover protein and skim solids. A U.S. International Trade Commission report released in late May 2026 said it plainly: Canada’s quota system creates “a domestic structural surplus of nonfat milk solids components,” and its pricing “unlinks its relatively high farmgate price of milk from the price that processors pay for milk components” through regulated “price discrimination”. In plain terms, Canadian processors can buy that surplus protein at prices below the regulated farmgate value and move it into export channels (U.S. Dairy Export Council).

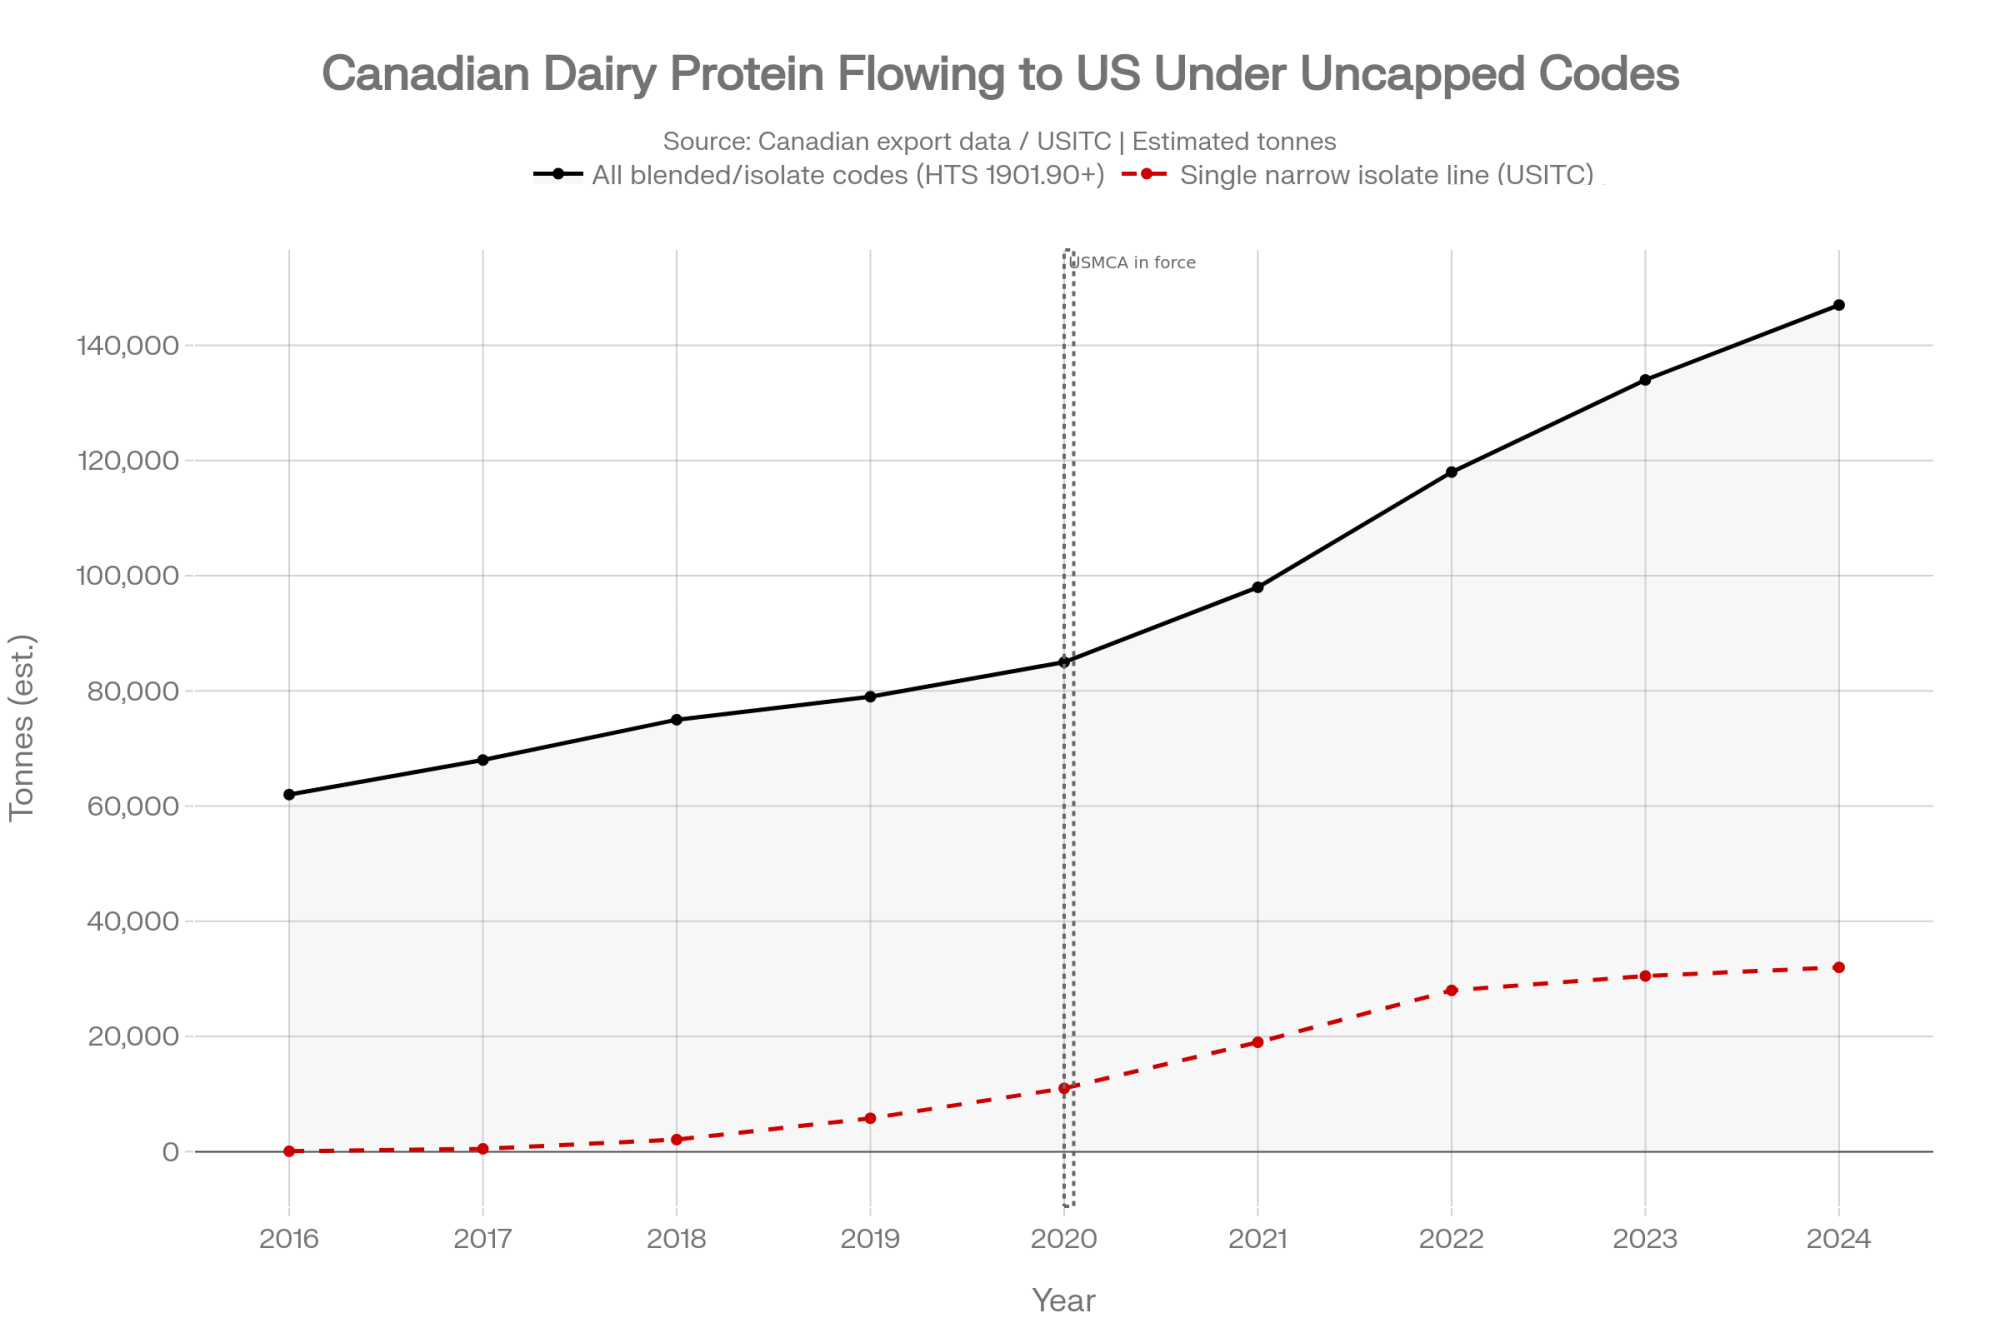
USMCA was built to cap exactly this. It limits Canada’s skim milk powder and milk protein concentrate exports to 35,000 tonnes, with a C$0.54/kg surcharge above that line. But the caps only bite on some product codes. A growing share of that surplus is exported as blended dairy products and protein isolates — classified under Harmonized Tariff Schedule (HTS) code 1901.90 and similar headings that USMCA’s disciplines don’t cover. Those classifications are lawful and long-standing under Canadian customs rules; whether USMCA should cover them is exactly what the U.S. wants renegotiated. Bullvine estimates roughly 147,000 tonnes of total milk solids moved into the U.S. under these broad blended-product codes in 2024 — up from an estimated 77,000 tonnes before USMCA — based on Canadian export data. That’s the wide bucket. Inside it, the USITC clocked one narrow protein-isolate line jumping from 76 tonnes in 2013–2015 to over 32,000 tonnes by 2022–2024 — a single HTS heading, not the whole flow, which is how you get two figures at very different scales in the same story (The Bullvine).

Here’s the barn math that flips the story. That extra low-priced protein leans directly on U.S. Class IV — and because Class IV pricing is driven heavily by nonfat dry milk and skim powder values, cheap imported protein pulls the whole class down with it. On a 600-cow herd shipping about 170,000 cwt a year — a high-output Western operation running well above the 2025 U.S. average of 24,390 lbs/cow — a $1.00/cwt swing in your milk price is worth roughly $170,000 a year; even a half-dollar move runs about $85,000. And this isn’t a big-herd trick: run that same $1/cwt swing on the 150-cow dairy from the TRQ example and it’s still about $42,000 a year — versus the $1,800 that fight is worth. Same barn, same year, two fights. One’s worth a nickel. The other moves a full dollar — and it’s the one nobody’s negotiating.

The Mechanics Behind the Outcomes

Why does the loud fight get all the airtime while the expensive one hides in a customs table? Because TRQs come with a clean headline and a clear villain: “Canada promised $200 million and delivered 42%.” That fits on a bumper sticker. The protein story needs you to sit through structural surplus, regulated pricing, and Chapter 19 tariff classification — none of which trend on anybody’s feed (U.S. Dairy Export Council).

The classification piece is the whole game. Classic skim milk powder sits under Chapter 04 dairy headings, the ones USMCA disciplines with caps and surcharges. But Canada’s border agency has long allowed that a product with added ingredients — a “preparation predominantly based on” dairy — can be classified under Chapter 19 instead. A U.S. customs ruling shows the kind of product in play: a blend of 56% skim milk powder and 44% milk fat, treated as a food preparation rather than a dairy product. Same solids. Different code. Outside the fence. Legal — and, from the U.S. side, exactly the point (Canada Border Services Agency).

AttributeChapter 04 (Classic Dairy)Chapter 19 (Food Preparations — HTS 1901.90)
Typical productsSkim milk powder, MPC, butter, cheeseBlended dairy powders, protein isolates with added ingredients, food prep bases
Example composition>97% milk solids, no added non-dairy ingredients56% skim milk powder + 44% milk fat with permitted additions
USMCA cap applies?✅ Yes — 35,000-tonne cap + CA$0.54/kg surcharge above threshold❌ No — sits outside USMCA Chapter 3 dairy disciplines
Canadian export volume trend (est.)Regulated; constrained by cap~147,000 tonnes into US (2024 est., up from ~77,000 pre-USMCA)
U.S. legal challenge statusSettled; two dispute panels completedUSITC Section 332 probe opened July 2025 — allegation, not finding
Price impact channelLimited — capped volume constrains floor pressureDirect — uncapped volume leans on US NDPSR and Class IV price
What renegotiation would doAlready covered; tighten fill enforcementExtend cap language to cover “protein by function” — the real ask

The U.S. isn’t leaving that argument to trade lawyers. In July 2025, the USITC opened a Section 332 probe into whether Canadian exporters are evading the caps by blending or relabeling surplus proteins — an allegation Canada disputes and the panel record so far hasn’t upheld. New Zealand and Australian dairy groups joined U.S. groups in a January 2025 joint call, arguing that Canadian processors’ access to structurally cheap surplus protein “is distorting its export of a range of dairy products”. Dairy Farmers of Canada, for its part, has publicly held that the current terms are sufficient and that Canada is meeting its USMCA obligations. When three exporting nations point at the same door, it’s not a rounding error — but it’s a policy fight over what the rules should cover, not a finding that anyone broke them. If you want the full walk-through of how the two panels changed the rulebook without changing the trucks, that’s its own story.

For the deeper backstory on how Canada’s system holds the line, see our supply management coverage hub — clean legal wins, messy farm realities.

How Much Does Chasing the Loud Fight Actually Cost You?

Run the honest calculation. If your operation spends real attention — advisor hours, association dues, mental bandwidth — tracking every TRQ headline, you’re chasing a nickel. Even a best-case doubling of enforcement takes that 150-cow herd from $1,800 to maybe $5,400 a year. UC Davis economists went further, concluding that fixing TRQ allocation would likely “do little to nothing” for the makeup of Canadian dairy imports, because U.S. product still loses on price and logistics against Canada’s own processors (The Bullvine).

That doesn’t make the TRQ fight pointless. Precedent matters, and a deal you can’t enforce isn’t a deal. But if you’re a producer deciding where to point your worry this month, don’t confuse the fight that fills press releases with the one that fills your milk check. Where does your breakeven actually sit right now — and which of these two numbers would move it?

FightThe Mechanism150-cow Value/yr600-cow Value/yrWho Controls the OutcomeWhat to Watch
TRQ Fill Rate14 quota categories; ~42% average fill; US argues Canada reserves licenses for domestic processors~$1,800~$7,200USTR / Global Affairs Canada negotiatorsFill rate improving past 50% in new allocation rules
Protein Reclassification (Class IV)Surplus Canadian protein moving as HTS 1901.90 blends, outside USMCA caps; leaning on Class IV NDPSR~$42,000 (red flag)~$170,000 (red flag)USMCA annex language in July roundWhether “isolate” or “protein by function” appears in new cap text
DRP Hedge (US)Dairy Revenue Protection; Q1 2026 indemnities avg $1.12/cwt vs $0.28/cwt premiumNet ~$14,280 valueNet ~$57,120 valueFarm-level decisionQ2 2026 premium resets
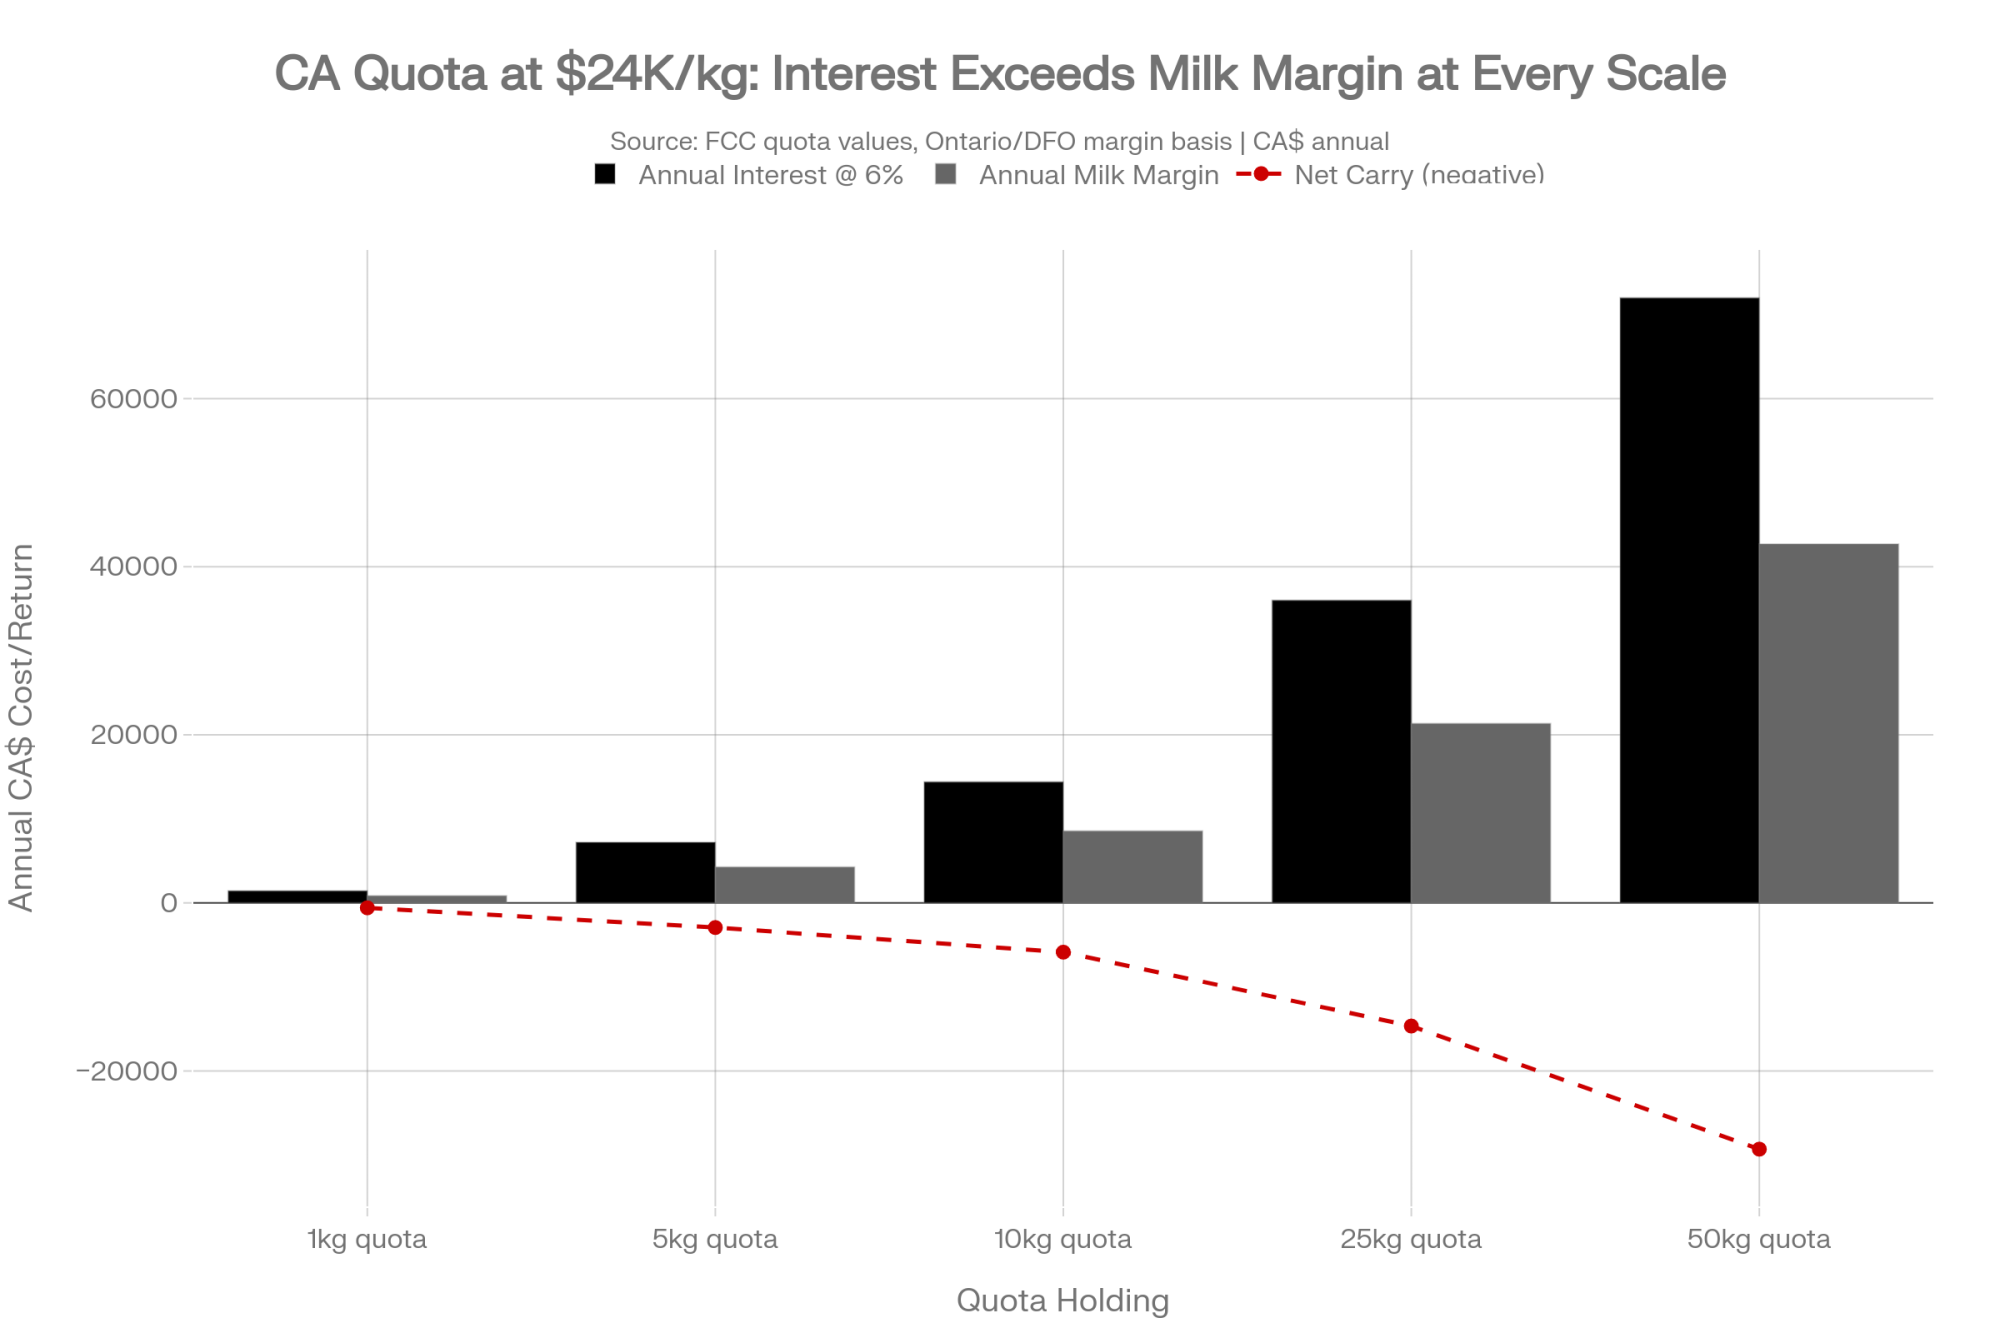
Canadian Quota CarryCA$24K–$27K/kg butterfat; 6% commercial rate; milk margin ~CA$854/kg — negative net carry~–CA$586/kg held~–CA$586/kg heldFCC rates + CDC price signalFall 2026 CDC farmgate announcement
US Dairy Exports to Canada (total)Two-way flow growing; US$1.31B in 2025, up 78% since 2020 — but not the negotiated TRQ accessDiffuse / indirectDiffuse / indirectBroader trade environmentSeparate from TRQ dispute

Is Canada Actually Getting What It Paid For?

Not quite — and that’s the part neither government says out loud. Canada bought stability with supply management: administered prices, no wild swings, and no reliance on the direct subsidies U.S. farmers lean on. That stability isn’t abstract. Farm Credit Canada’s 2026 reporting pegs mid-size quota holdings near CA$2.5 million, at CA$24,000 to CA$27,000 per kilogram of butterfat — an 85-cow Quebec herd carrying multi-million-dollar quota equity before you count a single cow or barn. Daniel Gobeil, who milks in Quebec and heads Les Producteurs de lait du Québec, put the mood plainly at his group’s 2025 annual meeting: “There is very strong consensus in Quebec on the importance of keeping supply management intact and protecting our sector” (Les Producteurs de lait du Québec).

That’s not abstract politics to a producer sitting on that balance sheet. When Bill C-202 passed, Dairy Farmers of Canada welcomed “any effort aimed at ensuring no further supply managed concessions are made in trade negotiations”. And in April 2026, with the review bearing down, Gobeil delivered a line — in French, roughly translated — that should tell every producer where the pressure sits: on the government’s promise to hold firm, “we’ll judge them on the results”. Translation from the kitchen table — don’t let anyone bargain away the asset I’ve mortgaged my farm to buy (Les Producteurs de lait du Québec / Newswire).

But the same global cost shocks hitting Idaho are hitting Quebec. Feed, labour, and debt service don’t care which pricing system you’re under. Rabobank’s analysts have been projecting 7–9% annual farm exits across North America through 2027 — on a base of roughly 39,000 U.S. operations, that’s somewhere between 2,700 and 3,500 farms closing in a single year, driven by margin compression, not border tonnage. That’s why Parliament passed Bill C-202 — locking supply management out of the negotiation entirely — and it received Royal Assent on June 26, 2025, before the review talks even opened. When you’re sitting on CA$2.5 million in quota, a law that stops anyone from writing down the asset reads less like protectionism and more like a seatbelt (Parliament of Canada, LEGISinfo).

Options and Trade-Offs for Farmers

You can’t negotiate the treaty. You can read the signals coming out of the review and position for them. Here’s what producers on both sides are watching and doing.

U.S. Class IV shippers — read the cap language, not the fill data (do this within 30 days)

  • The signal: Whether USTR and Global Affairs Canada rewrite the protein disciplines to count all high-protein dairy — blends and isolates included — against the cap (National Milk Producers Federation).
  • When the July round drops documents: Read the annexes, not the press release.
  • Works when: You’re Class IV-heavy.
  • Requires: Someone reading trade text.
  • Risk: The language stays vague — which tells you the coverage gap isn’t closing, and that’s worth knowing too.

U.S. producers — hedge the volatility no treaty will fix

  • The signal: HighGround Dairy’s Q1 2026 Dairy Revenue Protection results reported estimated indemnities averaging $1.12/cwt against premium costs of $0.28/cwt.
  • Works when: Your breakeven’s tight.
  • Risk: Premiums are a real cost, and DRP smooths volatility rather than erasing it.

Canadian producers — stress-test the quota-heavy balance sheet

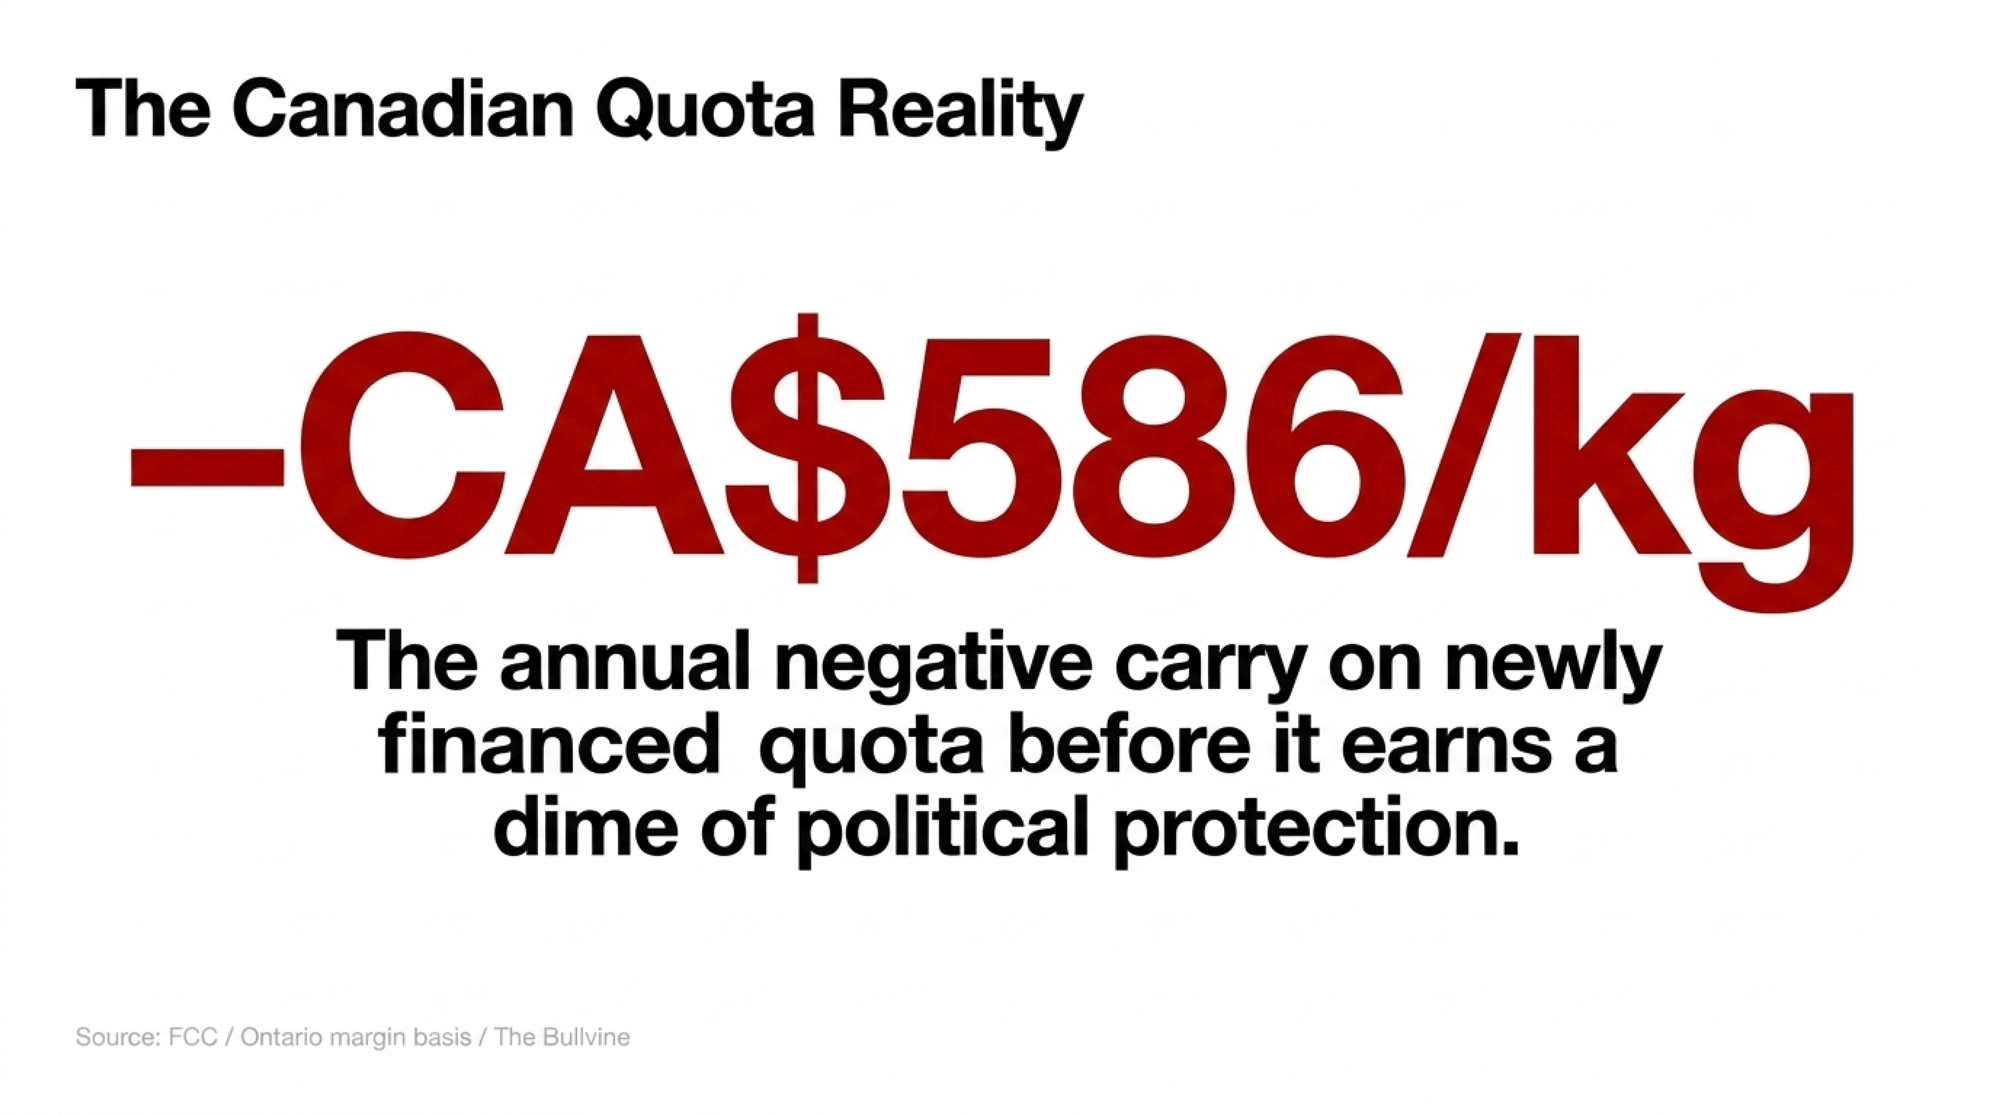
  • The signal: Take the CA$24,000/kg quota cap and finance it at a 6% commercial rate — that’s CA$1,440/kg a year in interest alone. Net the roughly CA$854/kg that kilo of butterfat earns in blended milk margin against it, and you’re carrying about –$586/kg a year in negative carry on newly financed quota until the milk pays it back. (Farm Credit Canada quota values; Ontario/DFO margin basis — see FCC dairy sector updates.)
  • Works when: You’re weighing any expansion or succession move.
  • Risk: A system that wins legal arguments can still leave you exposed to input costs no trade law touches.

Everyone — treat the CDC’s fall price announcement as a pressure gauge

  • The signal: For Feb. 1, 2026, the Canadian Dairy Commission raised farmgate prices 2.3255% through its National Pricing Formula. Watch this fall’s number for Feb. 2027 (Canadian Dairy Commission).
  • How to read it: A formula-consistent bump says Canada feels its system’s intact; a below-inflation move hints the trade pressure is starting to bite.

To pressure-test your own position, run a DSCR on your quota before the next expansion decision.

Key Takeaways

  • If you’re Class IV-exposed, judge the July review by one thing: whether the cap language starts counting protein by what it does, not by what the label says (NMPF).
  • If you ship in the U.S., run your DRP math this month — Q1 2026 indemnities averaged $1.12/cwt against $0.28/cwt premiums, and volatility won’t wait for a trade deal.
  • If you farm under supply management, price quota equity into every succession and expansion decision. At CA$24,000/kg and 6%, newly financed quota nets about –$586/kg a year before it earns a dime of political protection (FCC).
  • Put the CDC’s fall announcement on your calendar. A below-formula move is the clearest tell that Canada feels the trade squeeze (Canadian Dairy Commission).
  • Before the next TRQ headline pulls your attention, ask whether you’re tracking a nickel or a dollar. The math isn’t close.

The July round will generate a stack of statements calling itself a win. The real test is whether the annex language behind those statements ever mentions the word “isolate” — because that’s the sentence that decides whether you should start modeling Class IV upside or file another press release with better formatting. Gobeil said he’ll judge Ottawa on the results; you should judge the whole review the same way. So pull your last twelve milk checks and ask which of these two fights actually shows up in the numbers.

We’re breaking down the full protein-reclassification mechanism and a Class IV sensitivity model by herd size in next week’s Bullvine Weekly — that’s where the barn-level numbers live. For the groundwork now, here’s the full margin and DRP playbook.

Run Your Numbers

Dairy Profit Projector — This article says a $1/cwt Class IV swing is worth $170K on 600 cows and $42K on 150. The Dairy Profit Projector turns that into your number: drop in your herd, milk price, and ration to see 12-month margin, breakeven, and margin per cwt or hL — US or Canadian.

Editor’s note: The farm operations sized in the barn-math examples — a 150-cow reference dairy, an 85-cow Quebec herd, and a 600-cow Class IV shipper — are modeled composites used for illustration. Named individuals (Ted Vander Schaaf, Daniel Gobeil) and all dollar figures are sourced as cited. The nickel/cwt realized figure is a Bullvine estimate haircutting the gross 8.6¢/cwt tariff benefit for farmgate pass-through and the ~42% fill rate; the –$586/kg net-carry figure is a Bullvine calculation from Farm Credit Canada quota values and an Ontario milk-margin basis; the 147,000- and 77,000-tonne reclassified-solids figures are Bullvine estimates from Canadian export data, with the USITC’s 32,000-tonne figure being one narrow HTS line inside that broader bucket. The tariff classifications described are lawful under current Canadian customs rules; the U.S. reclassification-evasion claim is an allegation under USITC investigation, not an established finding, and the underlying dispute is over what USMCA should cover, not whether any party has broken the law.

Complete references and supporting documentation are available upon request by contacting the editorial team at editor@thebullvine.com.

Learn More

The Sunday Read Dairy Professionals Don’t Skip.

Every week, thousands of producers, breeders, and industry insiders open Bullvine Weekly for genetics insights, market shifts, and profit strategies they won’t find anywhere else. One email. Five minutes. Smarter decisions all week.
NewsSubscribe
First
Last
Consent

CME Dairy Report for July 21, 2025: NDM catches fire while cheese takes a nap

NDM jumped 8 trades to $1.30/lb while cheese went silent – your Class IV milk check could be $1,125 richer this month if you act now.

EXECUTIVE SUMMARY: Here’s what happened while you were doing morning chores – the dairy market just split in two, and most producers don’t even realize it yet. Class IV milk is running $1.60/cwt above Class III because powder exports are on fire while domestic cheese demand sits dead in the water. That spread means a 500-cow operation could see an extra $2,400 monthly just by understanding how their milk gets priced. Meanwhile, heat stress is crushing butterfat numbers by 0.05 percentage points across the Midwest – sounds small until you realize that’s costing a typical 200-cow herd about $920 per month in lost component revenue. Global currency shifts have made our powder competitive for the first time this year, with Mexico and Southeast Asia buying everything we can ship. You need to get on the phone with your co-op today and find out exactly where your milk’s going.

KEY TAKEAWAYS

  • Lock Your Feed Costs Before It’s Too Late – Corn at $4.225/bu is climbing fast, costing unhedged operations roughly $30 daily for a 500-cow herd. Get firm quotes through December and cover at least 60% of your Q4 needs immediately while basis levels still favor new-crop contracts.
  • Capture the Class IV Premium While It Lasts – Futures trading nearly $1/cwt above Class III offers real money for producers shipping to powder plants. Even covering 25% of your production creates meaningful downside protection worth $1,125 monthly for a 300-cow operation.
  • Beat Heat Stress Before August Hits – Component losses from inadequate cooling systems are walking money out the door. Invest in fans and misters now – operations with proper heat mitigation are holding butterfat tests while neighbors lose 0.05 percentage points worth real revenue per cow.
  • Ride the Export Wave – U.S. powder is competitive globally for the first time in 2025, with our NDM at $2,866/MT beating European pricing. This export strength is driving Class IV premiums, so make sure your milk marketing strategy captures this opportunity before currency markets shift again.
dairy market analysis, Class IV milk price, dairy risk management, improving dairy margins, heat stress management

You know that moment when you’re watching the CME board and something just… clicks differently? That was today’s session in a nutshell. NDM jumped a full cent to $1.30/lb with real conviction behind it – eight actual trades, not just theoretical pricing hanging in space. Meanwhile, cheese? Complete radio silence. Zero trades in blocks, zero in barrels.

Key Market Signals

  • NDM Strength vs. Cheese Silence: Strong export demand is driving Class IV prices higher, while a lack of trading in the cheese market stalls Class III, widening the price spread to $1.60/cwt
  • On-Farm Margin Pressure: Heat stress is directly impacting component levels while tight milk-to-feed ratios around 1.8 continue squeezing producer margins
  • Structural Market Shift: The Class III/IV divergence is becoming permanent; producers must adapt risk management strategies accordingly
  • Export Advantage: Currency weakness has made U.S. dairy products genuinely competitive globally for the first time this year

Here’s what’s really happening – and trust me, this isn’t just another sleepy summer Monday. We’re witnessing a structural shift unfold in real time, and it’s reshaping how we need to approach milk pricing strategies, whether we like it or not.

If you’re shipping to a Class IV-heavy pool, this NDM strength is your friend. Could mean real money in your August and September checks. But tied primarily to Class III? Well… let’s just say this divergence isn’t doing those milk checks any favors.

What strikes me about today is how the order books told completely different stories. NDM had genuine two-way interest – buyers stepping up at $1.30, sellers backing away. That’s real price discovery happening. Cheese had practically nothing. Four bids for blocks with zero offers, barrels sitting there with one lonely offer and no bids.

Today’s spot reality – powder strength meets cheese paralysis

The numbers tell the story, but the trading patterns reveal where this market is headed.

ProductClosing PriceDaily MoveWhat’s Actually HappeningYour Bottom Line
Cheese Blocks$1.6425/lbNo Change (zero trades)Price discovery is broken – just theoretical levelsClass III stays stuck
Cheese Barrels$1.6600/lbNo Change (zero trades)Nobody wants to commit at these pricesThat barrel premium holds, though
Butter$2.5000/lb-1.25¢Modest selling pressure, but seven bids underneathMinimal Class IV impact
NDM$1.3000/lb+1.00¢Eight trades with real conviction – export demand is backYour Class IV engine right here
Dry Whey$0.5625/lb+0.50¢Half-cent bounce, but still dragging on Class IIIEvery bit helps

Look, when NDM’s trading that kind of volume while cheese sits completely idle, it tells me exactly where the real demand is coming from. Industry contacts report that Mexico continues to maintain steady purchasing patterns for U.S. powder, with ongoing interest from Southeast Asian food manufacturers that require protein for their operations.

The butter moved down to exactly $2.50? I’m reading that as profit-taking more than any fundamental weakness. Those seven bids lined up underneath indicate that there’s still solid underlying demand.

Trading floor intelligence – what the order books are really saying

Here’s the thing about today’s session that won’t make the headlines… the cheese market isn’t just quiet, it’s fundamentally broken from a price discovery standpoint. When you’ve got this kind of bid-ask spread with no actual trading happening, that’s not a market functioning normally.

Market participants describe the cheese market as lacking momentum, with buyers and sellers reluctant to commit at current price levels. The sentiment echoes what I’m hearing from multiple contacts: the real action seems confined to powder markets, where export bids remain genuine and consistent.

The NDM action was completely different. Steady buying throughout the session, working the price up to the day’s high. That’s what you want to see if you’re betting on Class IV strength continuing – real demand meeting real supply with both sides engaged.

What’s particularly telling is how the volume backed up the moves. Those eight NDM trades gave that penny rally real credibility. Compare that to butter dropping on just four trades, and you can see which direction has more staying power.

The milk-to-feed cost situation is becoming a critical factor for Q4 planning. Using the standard USDA formula, with corn at $4.225 per bushel and soybean meal at $284.90 per ton, we’re sitting right around 1.8 on that critical ratio. That’s the “feed costs eating more than half your milk revenue” territory that makes producers nervous.

Regional spotlight – California heat stress hitting where it hurts

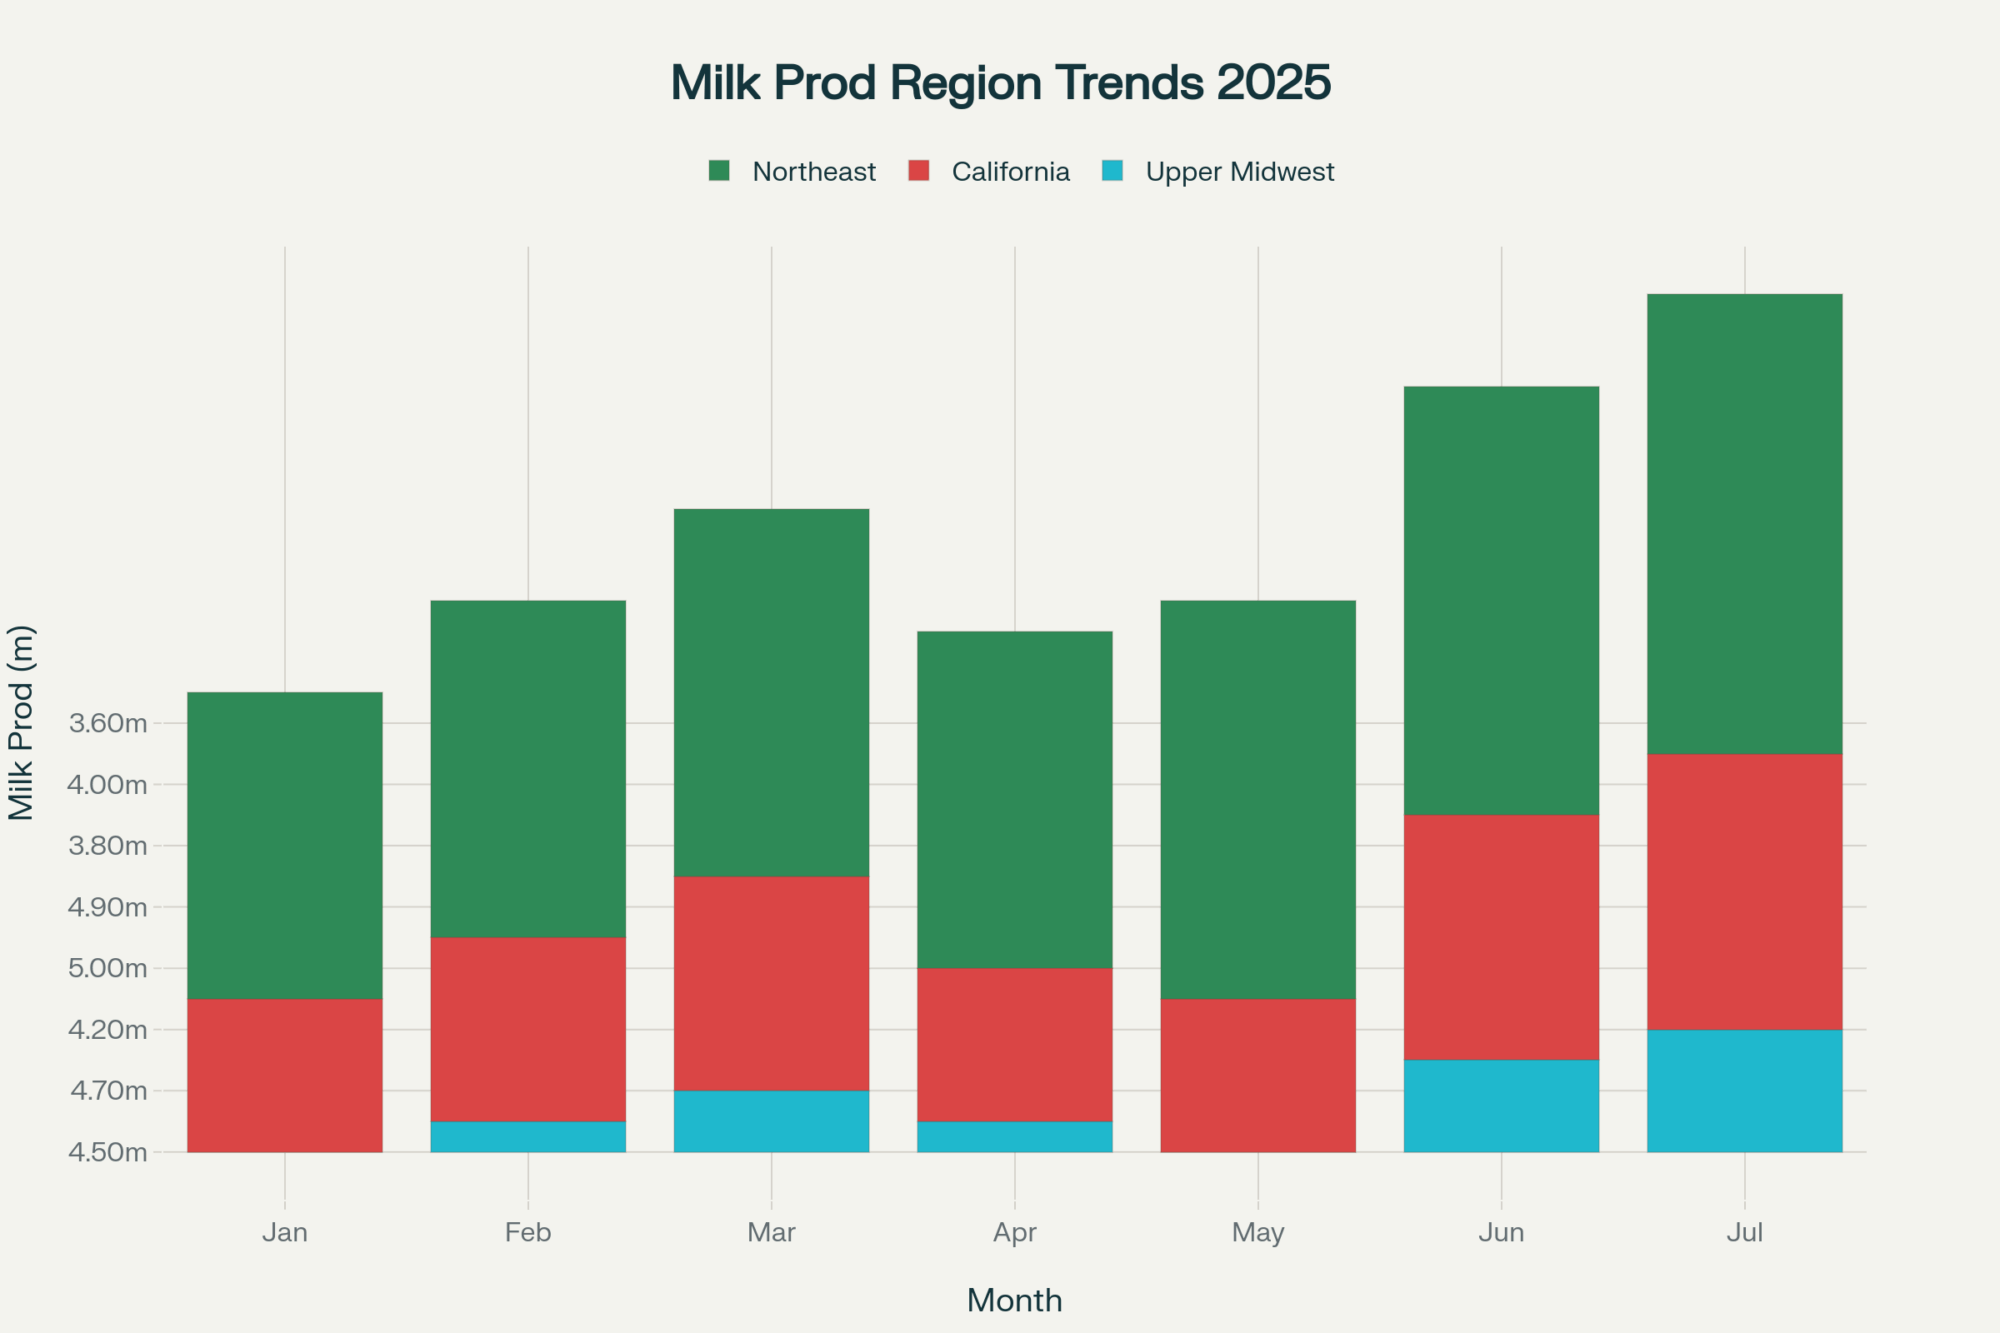
Rotating regional spotlight: milk production trends in major US dairy regions in 2025

Let me focus on California this week because what’s happening there could ripple through national pricing patterns. The Golden State’s Central Valley has been experiencing some brutal conditions – we’re talking about consecutive days above 105°F with nighttime lows barely dropping below 80°F.

Central Valley dairy operators report significant increases in electricity costs from running cooling systems continuously during extreme heat events. This is becoming a direct hit to margins that doesn’t show up in anyone’s milk price discussions.

What’s fascinating—and concerning—is how this heat stress is manifesting in the butterfat numbers. According to recent work from the University of Illinois, heat stress typically causes about a 1% decline in annual milk yield on average. But what we’re seeing regionally is more nuanced. Smaller operations (under 100 cows) are getting hit with a 1.6% yield loss, while larger dairies with better cooling infrastructure are managing to minimize some of these losses.

Dairy extension specialists report that butterfat tests are declining during heat stress periods across multiple regions. Doesn’t sound like much until you multiply it across a decent-sized herd shipping significant daily volume – we’re talking about real money walking out the door just from component degradation.

The thing is, this isn’t hitting everyone equally. Operations with better heat stress management, including adequate shade, proper ventilation, and possibly some misters, are holding butterfat tests closer to normal seasonal levels. Farms that didn’t invest in cooling infrastructure? They’re feeling it hard.

Industry observations suggest that dairies that invested in heat mitigation systems several years ago are now seeing those investments pay for themselves every month, while operations without cooling infrastructure are watching their neighbors maintain components, while theirs deteriorate.

Global competitive positioning – and why our powder is moving

Something that doesn’t get discussed enough is that our competitive position internationally has shifted noticeably since early summer. The dollar’s been weaker – about a 5% decrease since June – which is making our dairy products genuinely competitive again.

Current International Price Landscape

ProductU.S. PriceCompetitive PositionMarket Advantage
NDM/SMP$1.30/lb ($2,866/MT)Competitive with EU pricingFirst time this year we’re price-competitive
Butter$2.50/lb ($5,512/MT)Significant advantage vs. OceaniaMassive pricing edge in key markets

What’s happening in Europe is particularly interesting from a supply perspective. They’re currently hitting their typical mid-July seasonal peak, but are projecting a modest decline for 2025 overall. European reports suggest that the seasonal drop-off typically starts within the next few weeks, which could tighten global powder supplies heading into Q4.

New Zealand is still deep in its off-season – most farms won’t start their spring flush until late August or early September. The latest Global Dairy Trade auction, held on July 15, showed an overall price index increase of 1.1%, marking the first rise since May. Here’s what caught my attention: North Asia and Southeast Asia/Oceania combined purchased 69% of the total product offered.

Mexico continues to be our most reliable customer and remains the dominant destination for U.S. dairy exports, according to USDA trade data. They’re showing no signs of backing away from U.S. supplies, despite some trade policy uncertainties circulating.

Production reality check – the butterfat story nobody’s talking about

Summer dairy production… it’s always about the components as much as the volume, right? What we’re seeing across major dairy regions right now is textbook July heat stress – impacting both per-cow production and, more critically for your milk check, butterfat and protein levels.

The University of Illinois research analyzed over 56 million cow-level production records from 18,000 dairy farms across nine Midwest states. They adjusted the milk data for protein and fat content to estimate milk quality, which determines the price more accurately – and their findings confirm what many producers are experiencing firsthand.

The thing is, this isn’t hitting everyone equally. Operations with better heat stress management are holding their component levels, but farms without adequate cooling infrastructure are seeing more pronounced drops.

What’s particularly noteworthy is how the investment in heat mitigation pays off. Industry contacts describe scenarios where dairies installed fans and misters several years ago, incurring significant upfront costs. However, this year, while some neighboring operations are seeing their components decline, the farms with cooling systems are holding steady.

USDA forecasts and what those revision patterns really tell us

The official numbers paint an interesting picture if you know how to read between the lines. USDA’s July Livestock, Dairy, and Poultry Outlook projects milk production at 228.3 billion pounds for 2025, with 229.1 billion for 2026. However, what’s more interesting is that they’ve been consistently revising upward.

USDA Forecast Revision Pattern (2025 Milk Production)

  • April: 226.9 billion lbs
  • May: 227.3 billion lbs
  • July: 228.3 billion lbs

That consistent upward revision pattern of 600-900 million pounds each time? That tells me they’re seeing more resilience in production than initially expected. The dairy cow forecast has been revised upward by 15,000 head to 9.435 million for 2025.

Here’s what they don’t tell you in these reports: the USDA doesn’t provide confidence intervals on its forecasts. Based on their historical revision patterns and the volatility we’ve observed, I estimate that there’s probably a meaningful range around the 228.3 billion pound forecast. But that’s reading between the lines.

Export projections appear solid, with 13.8 billion pounds on a milk-fat basis for 2025 and 45.3 billion pounds on a skim-solids basis. They’re specifically citing competitive U.S. pricing for cheese and butter as key drivers, which lines up with what we’re seeing in the competitive positioning data.

Risk scenarios – what could shake up this market

Alright, let me walk through what could go sideways… based on historical patterns and current market conditions, here’s how I see the major risks playing out:

Weather Disruption appears to be a moderate concern. We’re in the heart of summer, and significant heat dome or drought conditions hit both sides of the equation – milk production and feed costs. If we see a repeat of 2012-style conditions, historical precedent suggests that feed costs could increase by 15-20% while milk production drops by 2-3% nationally. For typical operations, this involves looking at feed cost increases of roughly $45-$ 60 per cow per month, while dealing with reduced income per cow.

The economic impact on Demand remains a legitimate concern. Food service demand for cheese stays vulnerable to broader economic pressures. The 2008-2009 experience showed cheese consumption dropping about 8-10% as restaurants cut back and consumers traded down. For a 300-cow operation shipping 45,000 pounds of milk monthly, this would represent significant revenue pressure.

Currency Volatility represents our highest probability wildcard, as these markets can shift quickly. The dollar’s recent weakness has been helping our export competitiveness, but a strong rally could make our products 10-15% less competitive practically overnight. Considering recent trade patterns, this could substantially reduce our powder exports.

Processing Capacity Issues keep me thinking at night. Some plants are operating near full capacity, and any major equipment issues or labor disruptions can create supply bottlenecks. Remember the 2019 situation in New Mexico? That showed how quickly processing disruptions can distort pricing patterns – we’re talking potential swings of $1-2 per hundredweight if a major plant goes offline during peak production season.

Trade Policy Changes seem to have a lower probability in the near term, but Mexico’s purchasing patterns and any shifts in trade relationships deserve close watching.

Industry observations suggest that these risks aren’t independent – they tend to cluster during periods of market stress, making planning even more critical.

Industry voices and market sentiment

I’ve been making calls around the industry this week, and the sentiment is, honestly, mixed.

Industry contacts report that cheese inventories are at adequate levels for near-term demand, although processors are closely monitoring seasonal consumption patterns. Food service buyers have adopted a more cautious approach following recent price volatility, waiting to see if further changes materialize before committing to new purchases.

Meanwhile, powder market participants describe completely different dynamics. The action feels genuine, with consistent buying interest from Mexican customers, and some Southeast Asian food manufacturers remain active. It’s a completely different dynamic than cheese right now.

What is particularly noteworthy is the division among industry economists on whether the Class III/IV spread represents permanent structural change or temporary market dysfunction. Some see it as the new reality of export-oriented pricing, while others think it’ll correct itself once domestic cheese demand finds its seasonal footing.

Historical context – how this July compares

Let me give you some perspective on where we stand. Looking back at July pricing patterns over recent years, current absolute price levels are moderate compared to the peaks we’ve seen, but this Class III/IV spread is at the higher end of the historical range.

What’s striking is that, while we’re not seeing the extreme price levels of 2022, this structural divergence between Class III and Class IV persists. That pattern we keep talking about? The data supports it.

What producers should be doing right now – and why timing matters

Look, I’ve been around this industry long enough to know that timing decisions is never easy. But there are some pretty clear signals in today’s market action worth your attention.

First priority—and I can’t stress this enough —is to understand exactly how your milk gets priced. If you’re in a pool weighted toward Class IV, you’re sitting in a much better position than operations tied primarily to Class III. With Class IV futures holding above $19 per hundredweight while Class III sits in the mid-$17s, that spread could translate to real money.

Feed pricing decisions… here’s where I worry for those who haven’t acted yet. December corn at $4.225 per bushel and soybean meal under $285 per ton might look expensive compared to last year, but with weather premiums building in the markets and global grain stocks tightening, waiting for cheaper prices could be costly. Consider covering at least 50-60% of your fall and winter needs now.

The risk management conversation gets more interesting every week. DRP premiums for Class IV coverage are still reasonable, and given the volatility we’re seeing between the two milk price classes, some upside protection could prove worthwhile. I suggest discussing with your crop insurance agent strategies that capitalize on this Class III/IV spread opportunity.

Don’t overlook operational fundamentals either. Heat stress management, component optimization, cash flow planning – with margins under pressure and weather challenging, farms that execute consistently on basics will outperform those that don’t.

The bigger picture – where this market is headed

What we witnessed today represents something larger than just another mixed trading session. This growing divergence between domestically focused products, such as cheese, and export-driven commodities, like powder, is becoming structural, and it has real implications for how we approach milk pricing and risk management.

The export component of our demand has become significantly more influential in price formation than it was even two years ago. Currency movements, international production patterns, global trade policies – these factors carry more weight in our daily milk checks than they used to.

Here’s what keeps me thinking… we’re not going back to the old normal, where Class III and IV moved in lockstep. Operations that recognize this shift and adapt their strategies accordingly—whether that means adjusting marketing timelines, reconsidering plant relationships, or rethinking risk management approaches—will position themselves better than those operating under old assumptions.

This isn’t temporary volatility we can wait out. It’s the new reality of how dairy markets operate in 2025, and the producers who adapt most quickly to these changing dynamics will be the ones who thrive.

Complete references and supporting documentation are available upon request by contacting the editorial team at editor@thebullvine.com.

Learn More:

The Sunday Read Dairy Professionals Don’t Skip.

Every week, thousands of producers, breeders, and industry insiders open Bullvine Weekly for genetics insights, market shifts, and profit strategies they won’t find anywhere else. One email. Five minutes. Smarter decisions all week.
NewsSubscribe
First
Last
Consent
Send this to a friend