










Cull thirty percent of four hundred cows and you’re buying 120 replacements a year. Every $500 the market moves costs you $60,000 — and not one extra cow in the barn.
EXECUTIVE SUMMARY
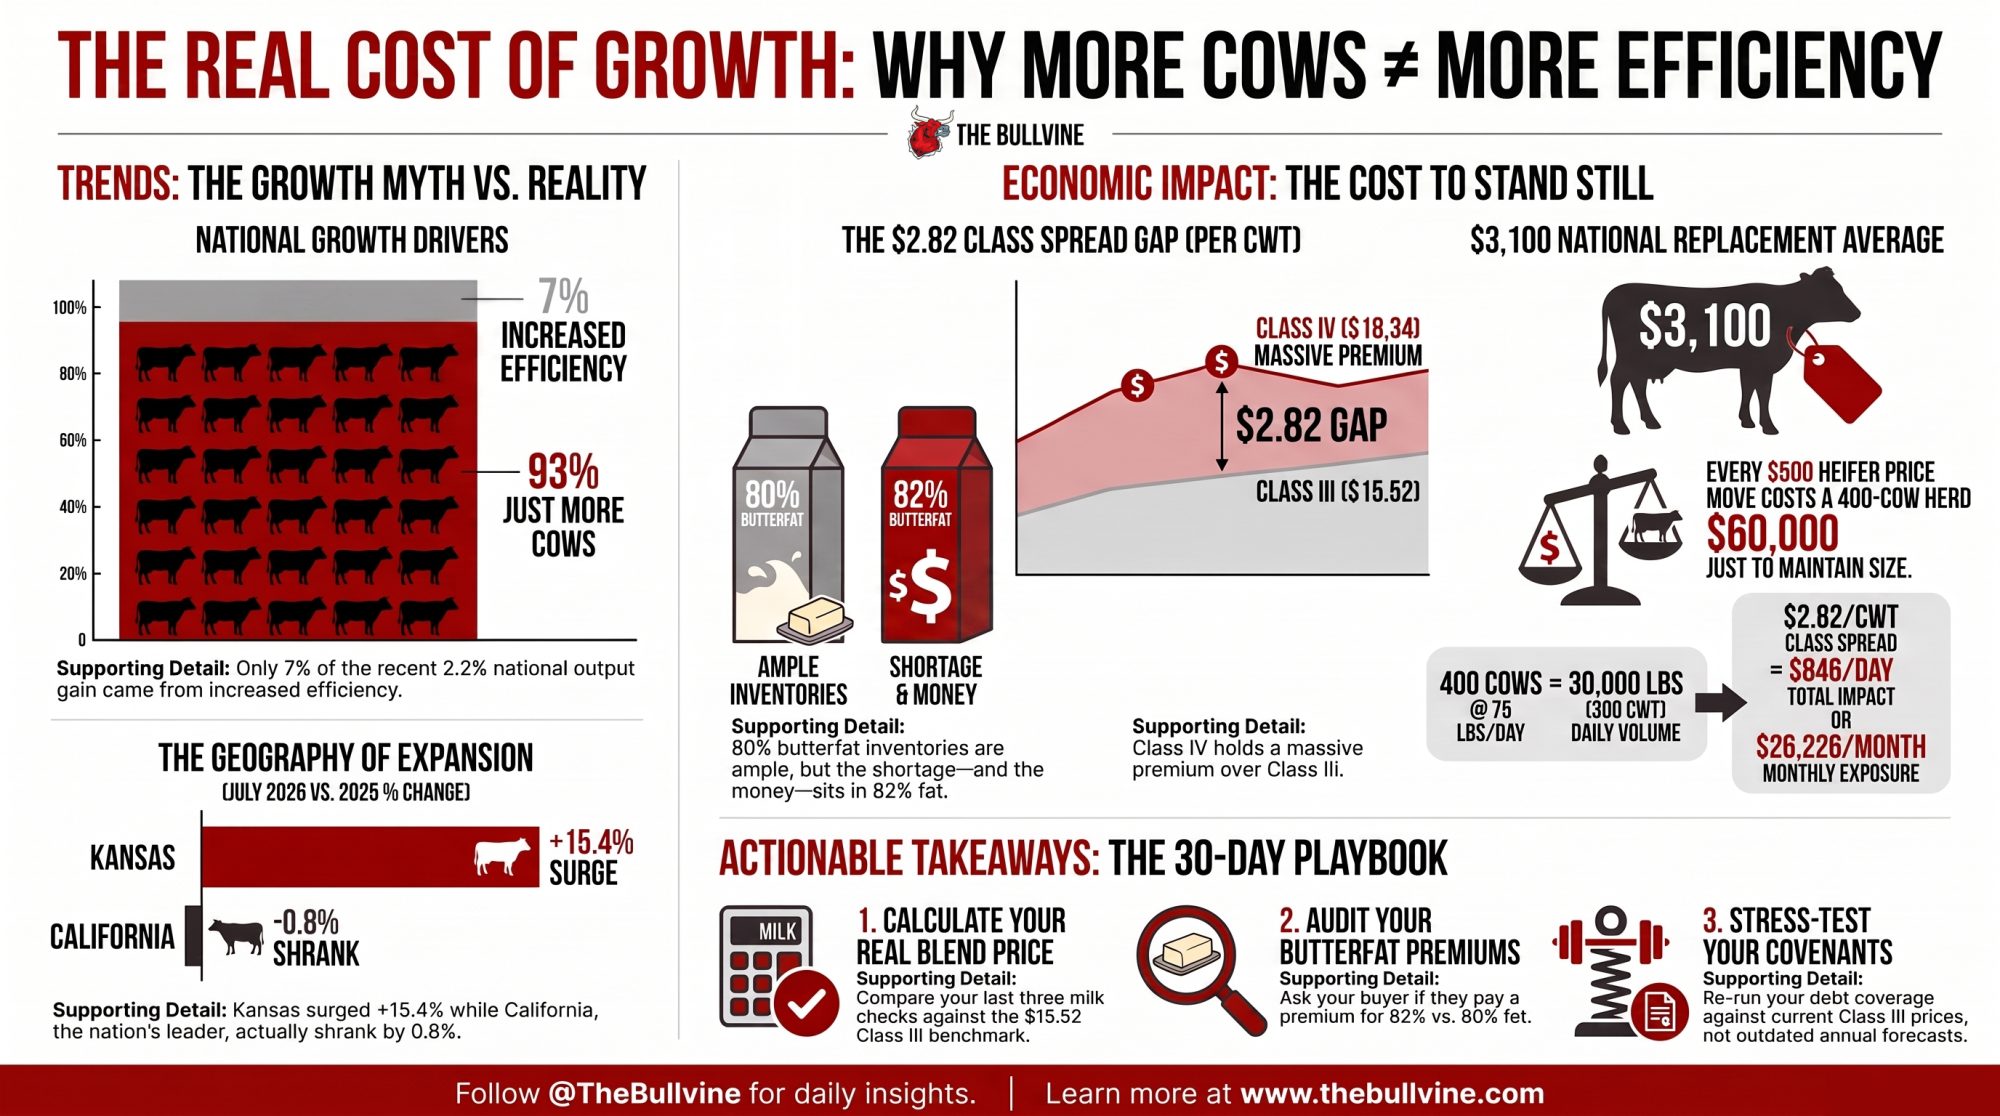
- The growth was cows, not cows milking better. Output hit 20.1 billion pounds, up 2.2%, but per-cow output rose three pounds — 93% of the gain walked in on four legs. Kansas is the extreme case at 98% animals, and its growth already decelerated from 18.7% in June to 15.4% in July. California, the largest dairy state in the country, actually shrank 0.8%.
- The class spread is the money question. Class IV fell to $18.34 in July, down $3.98 from May, leaving a $2.82 gap over Class III’s $15.52. On a 400-cow herd shipping 75 lbs, that’s roughly $26,226 a month of exposure — and which side you’re on is a clause in your co-op agreement, not a market call.
- Butter’s paradox is a grade problem, not a tonnage problem. Prices kept sliding while the market read tight because 80% butterfat inventories are ample and 82% is where the shortage sits. Most premium structures don’t price that split.
- Replacements decide whether expansion math still works. Springing heifers run $3,100 nationally and $3,400–$4,400 in Upper Midwest barns. Every $500 move costs a 400-cow herd about $60,000 just to hold size. If you financed stalls against an all-milk forecast instead of an actual Class III print, the next 90 days are a covenant conversation.
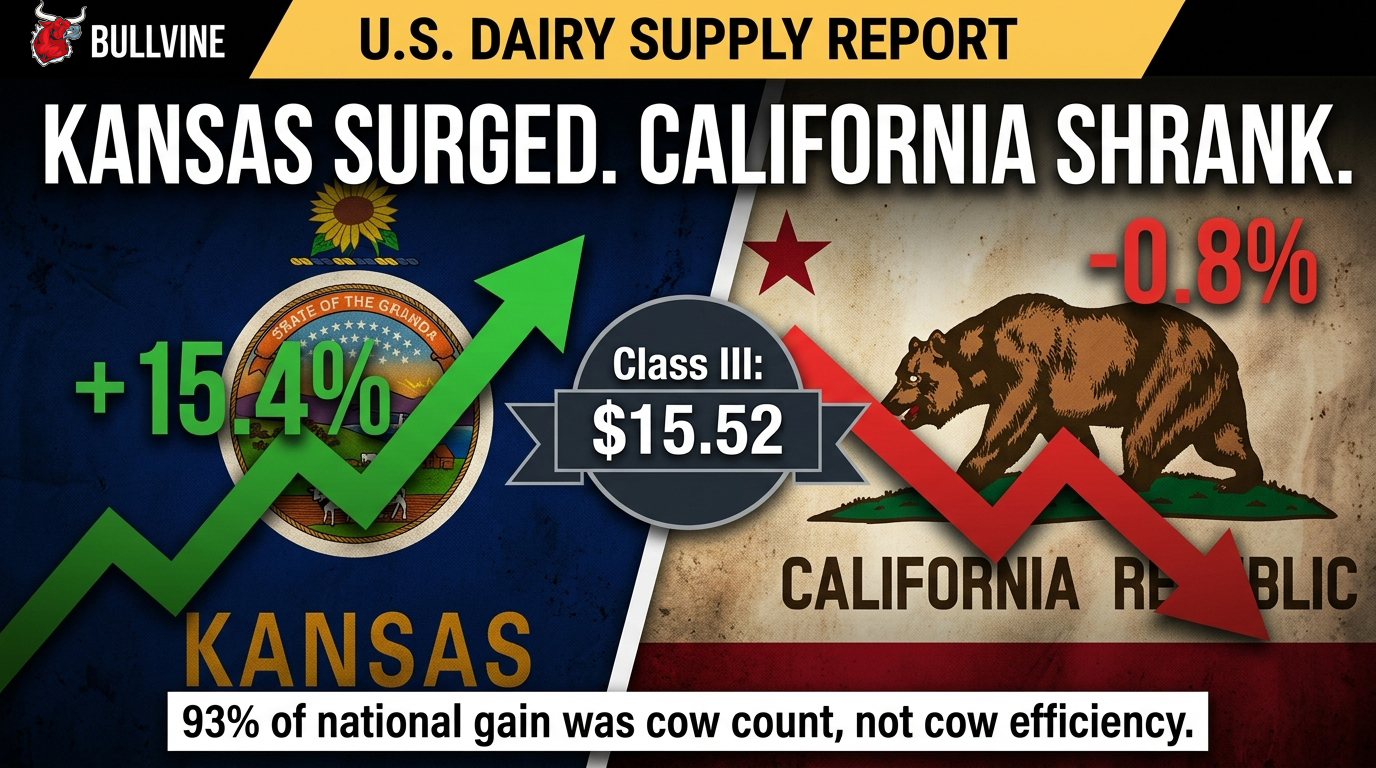
Class III milk settled at $15.52/cwt in July 2026 — down $1.40 from May’s peak and the second straight monthly decline. If you financed fresh stalls into that curve, explaining your 2026 margin over feed to your lender just got uncomfortable.
Kansas shipped 494 million pounds in July, up 15.4% year over year on a herd of 245,000 head. Twelve months earlier, that herd stood at 213,000. But Kansas grew 18.7% in June and 15.4% in July, and the state added roughly 1,000 head between those two months after adding 32,000 across the full year. That’s not acceleration. That’s a build winding down.
Nationally, output hit 20.1 billion pounds, up 2.2%, per USDA NASS Milk Production released August 21. The headline reads like productivity. It isn’t.
Which States Actually Shrank in July 2026?
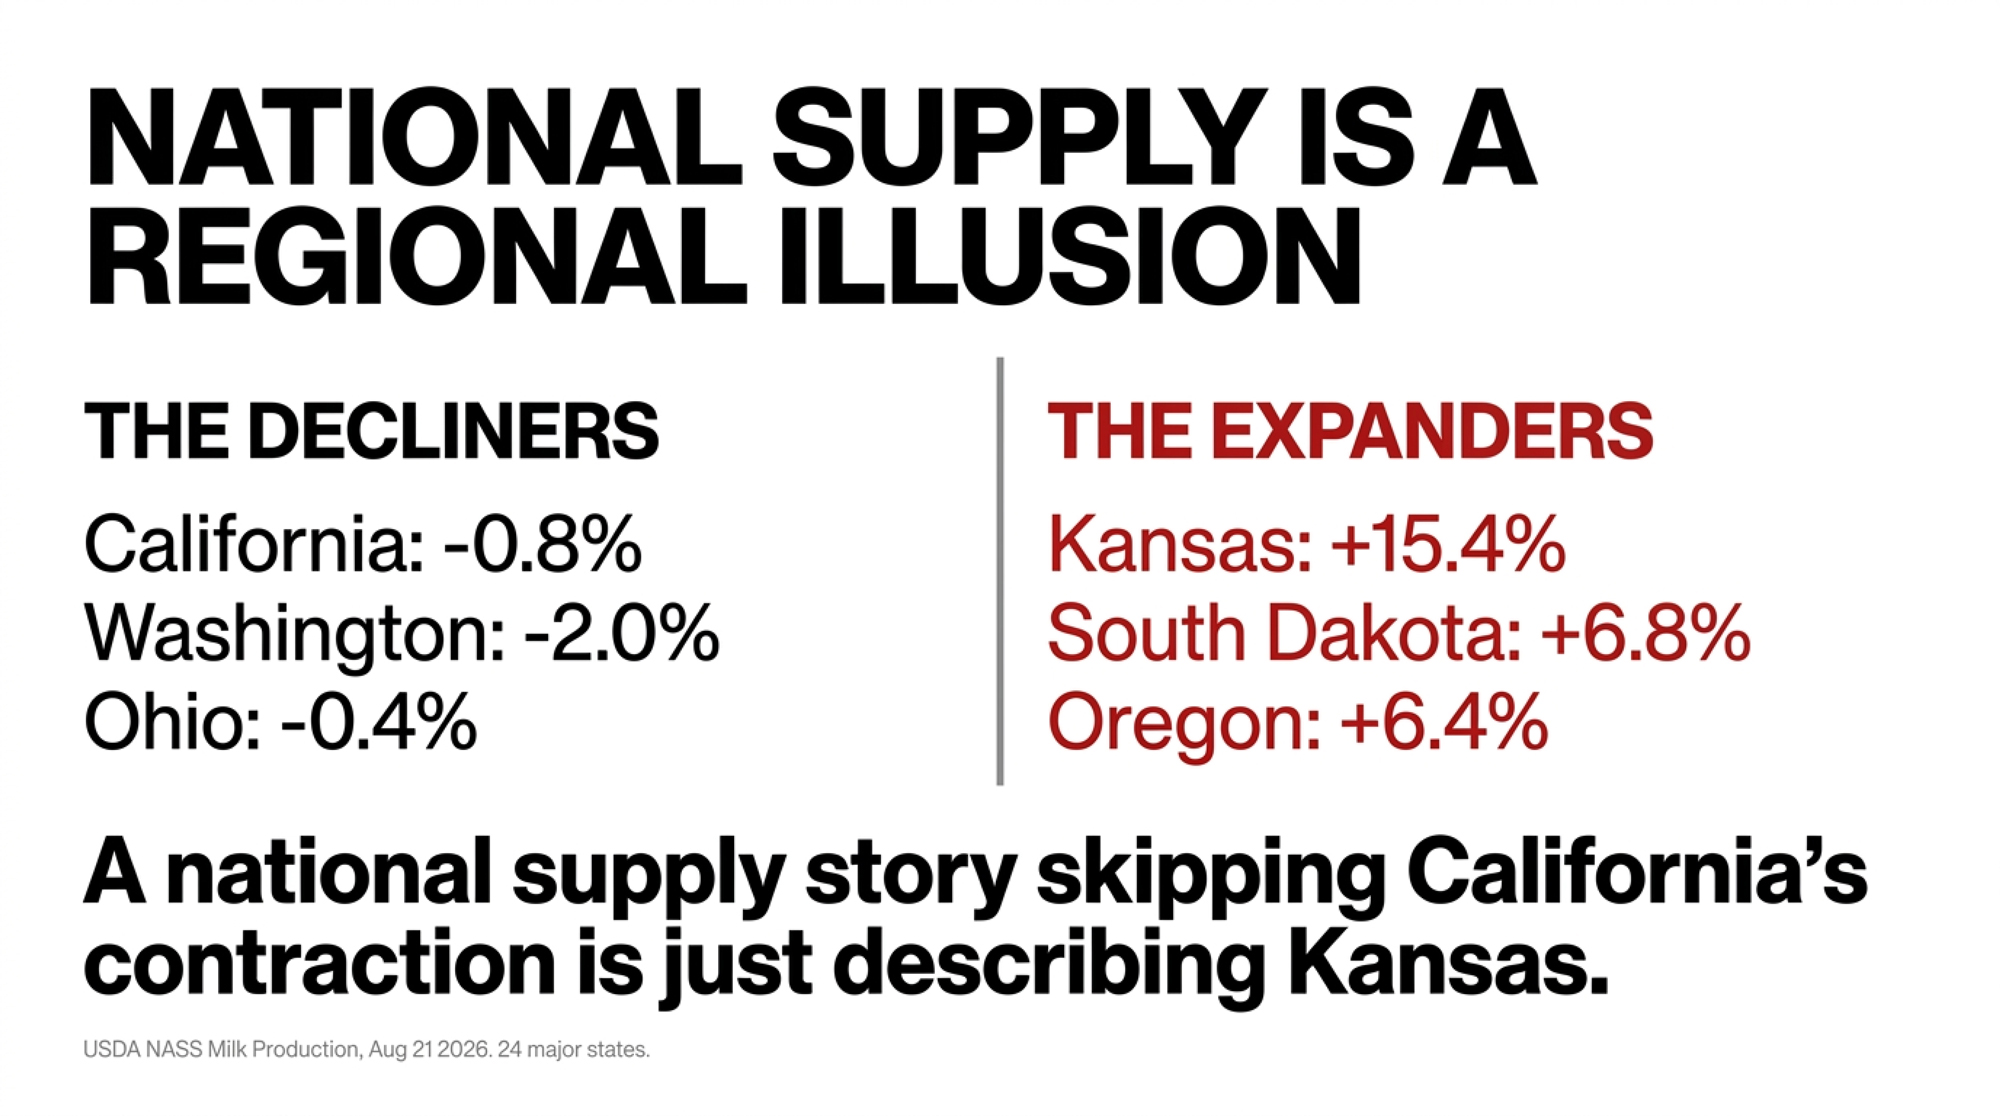
Three did, and one matters enormously. California fell 0.8%. The largest dairy state in the country produced less milk in July 2026 than a year earlier. Washington dropped 2.0%. Ohio slipped 0.4%. Pennsylvania and Vermont came in flat.
A national supply-growth story that skips California’s contraction isn’t describing national supply. It’s describing Kansas and Texas.
That’s the real geography here: growth concentrated in a few expanding states, offset by decline in established ones. National cow numbers held at 9,710,000 head from June to July — unchanged, after twelve months of building.
The 3 Pounds That Rewrite the Report
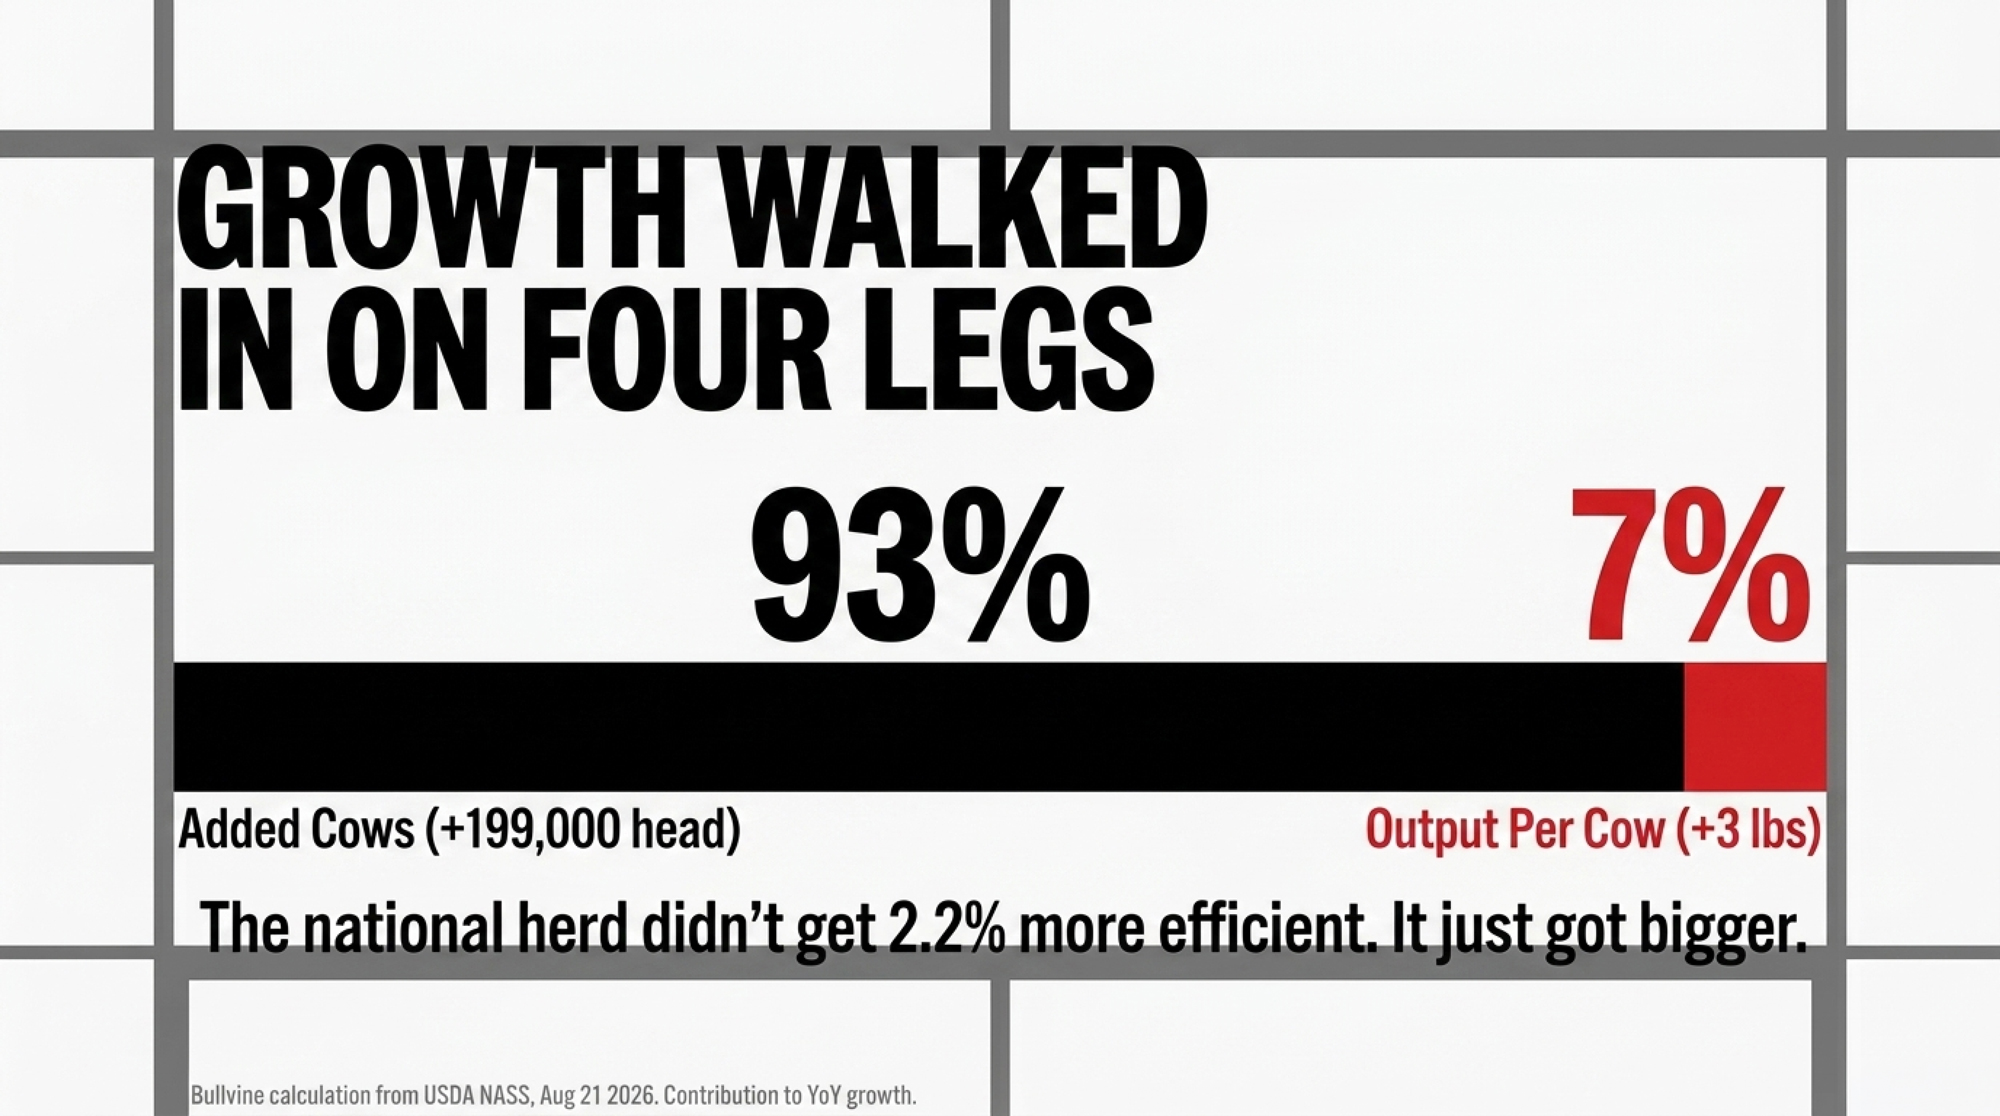
Production per cow rose from 2,072 to 2,075 pounds nationally. Three pounds. Across the 24 major states, 2,088 to 2,093. The herd, meanwhile, went from 9.511 million head to 9.710 million — up 199,000 cows.
Cow numbers grew 2.09%. Per-cow output grew 0.14%. By The Bullvine’s calculation from those NASS figures, cows account for roughly 93% of the year-over-year growth and per-cow output for about 7%. Those shares describe contribution to the gain, not share of total volume.
Everyone assumed 2.2% meant the national herd got more efficient. It got bigger.
Kansas is the purer case. Per-cow output there went from 2,010 to 2,015 pounds — five pounds, or 0.25%. Cow numbers rose 15.02%. Roughly 98% of Kansas’s growth came from animals, almost none from the cows already standing there.
And before anyone reads July as a turn: NASS revised June’s 24-state figure up by 124 million pounds, or 0.7%. One month is one data point, and this series is routinely rewritten. The next release lands mid-September.
Why Did Class III Fall While Class IV Fell Harder?
The two halves of the pool separated. Federal Order class prices for 2026:
| Month (2026) | Class III ($/cwt) | Class IV ($/cwt) | Spread ($/cwt) |
| January | 14.59 | 13.55 | −1.04 |
| February | 14.94 | 16.29 | 1.35 |
| March | 16.16 | 18.94 | 2.78 |
| April | 16.82 | 20.22 | 3.40 |
| May | 16.92 | 22.32 | 5.40 |
| June | 15.98 | 20.96 | 4.98 |
| July | 15.52 | 18.34 | 2.82 |
Class III and Class IV are USDA AMS-announced Federal Order prices, per Dairy Market News, Vol. 93 Report 34, week of August 17–21, 2026. August prices had not yet been announced at the time of publication. Spread column calculated by The Bullvine.
The full-year series tells a different story than a four-month excerpt would. Class III climbed from January through May, then gave back $1.40 across June and July. Class IV ran harder in both directions — up nearly $9 from January to May, then down $3.98 in two months.
Watch the spread column. In January, Class III sat $1.04 above Class IV. By May, the gap had flipped and widened to $5.40. It’s narrowed in each of the two months since, to $2.82 in July. So the divergence is real, but it’s compressing — Class IV is falling toward Class III rather than the two pulling further apart.
Still $2.82, though. Which side you sit on isn’t a market view. It’s a clause in your co-op agreement.
Running the Numbers: The Class Spread on a 400-Cow Herd
| Parameter | Calculation | Exposure |
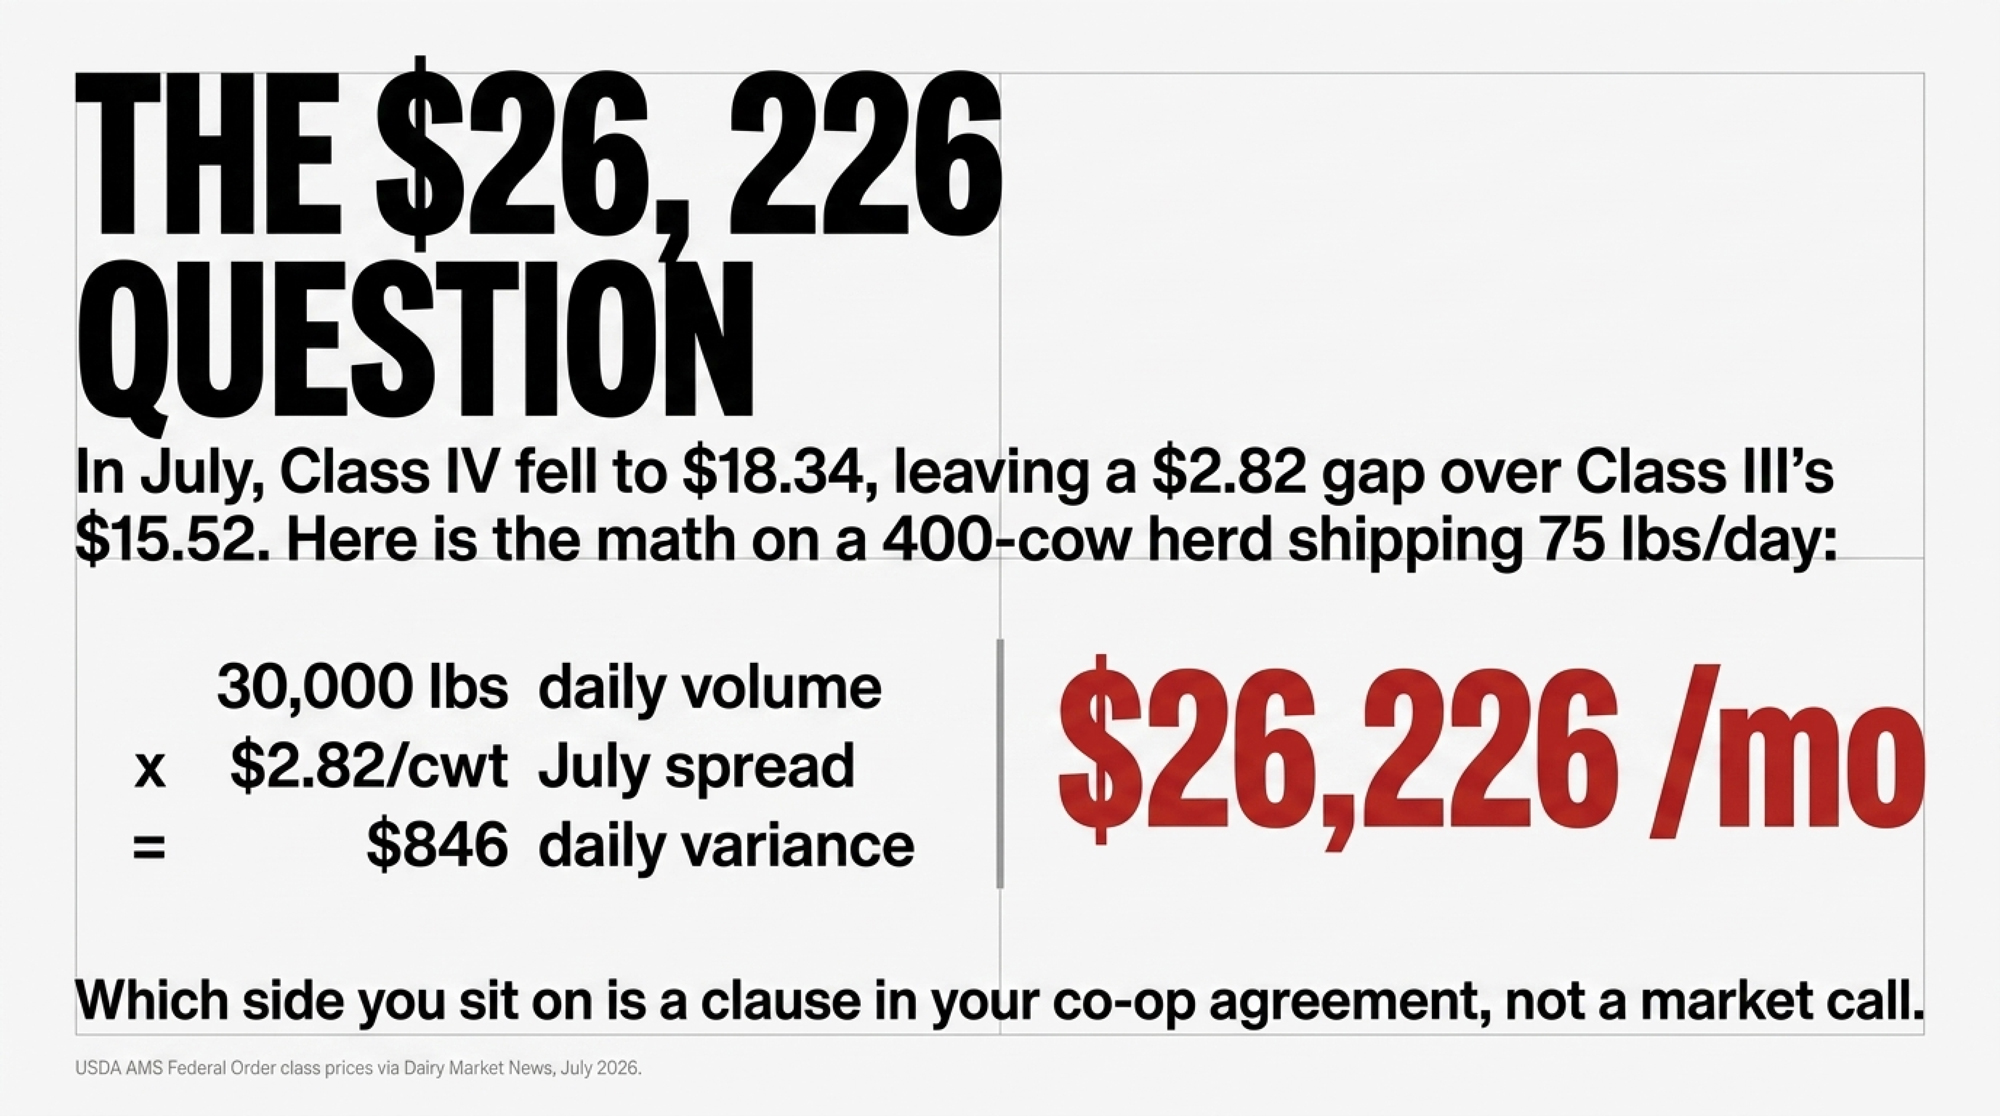
| Daily shipped volume | 400 cows × 75 lbs/day | 30,000 lbs (300 cwt) |
| July class spread | $18.34 (Class IV) − $15.52 (Class III) | $2.82/cwt |
| Daily margin variance | 300 cwt × $2.82/cwt | $846/day |
| 31-day exposure | $846/day × 31 days | $26,226/month |
That’s the gross gap between milk priced against butter-powder and milk priced against cheese-whey for one month, before producer price differential, hauling, or component adjustment. Your mailbox price won’t match either class cleanly — most producers receive a weighted blend. Read this as the scale of the exposure, not a cheque you lost.
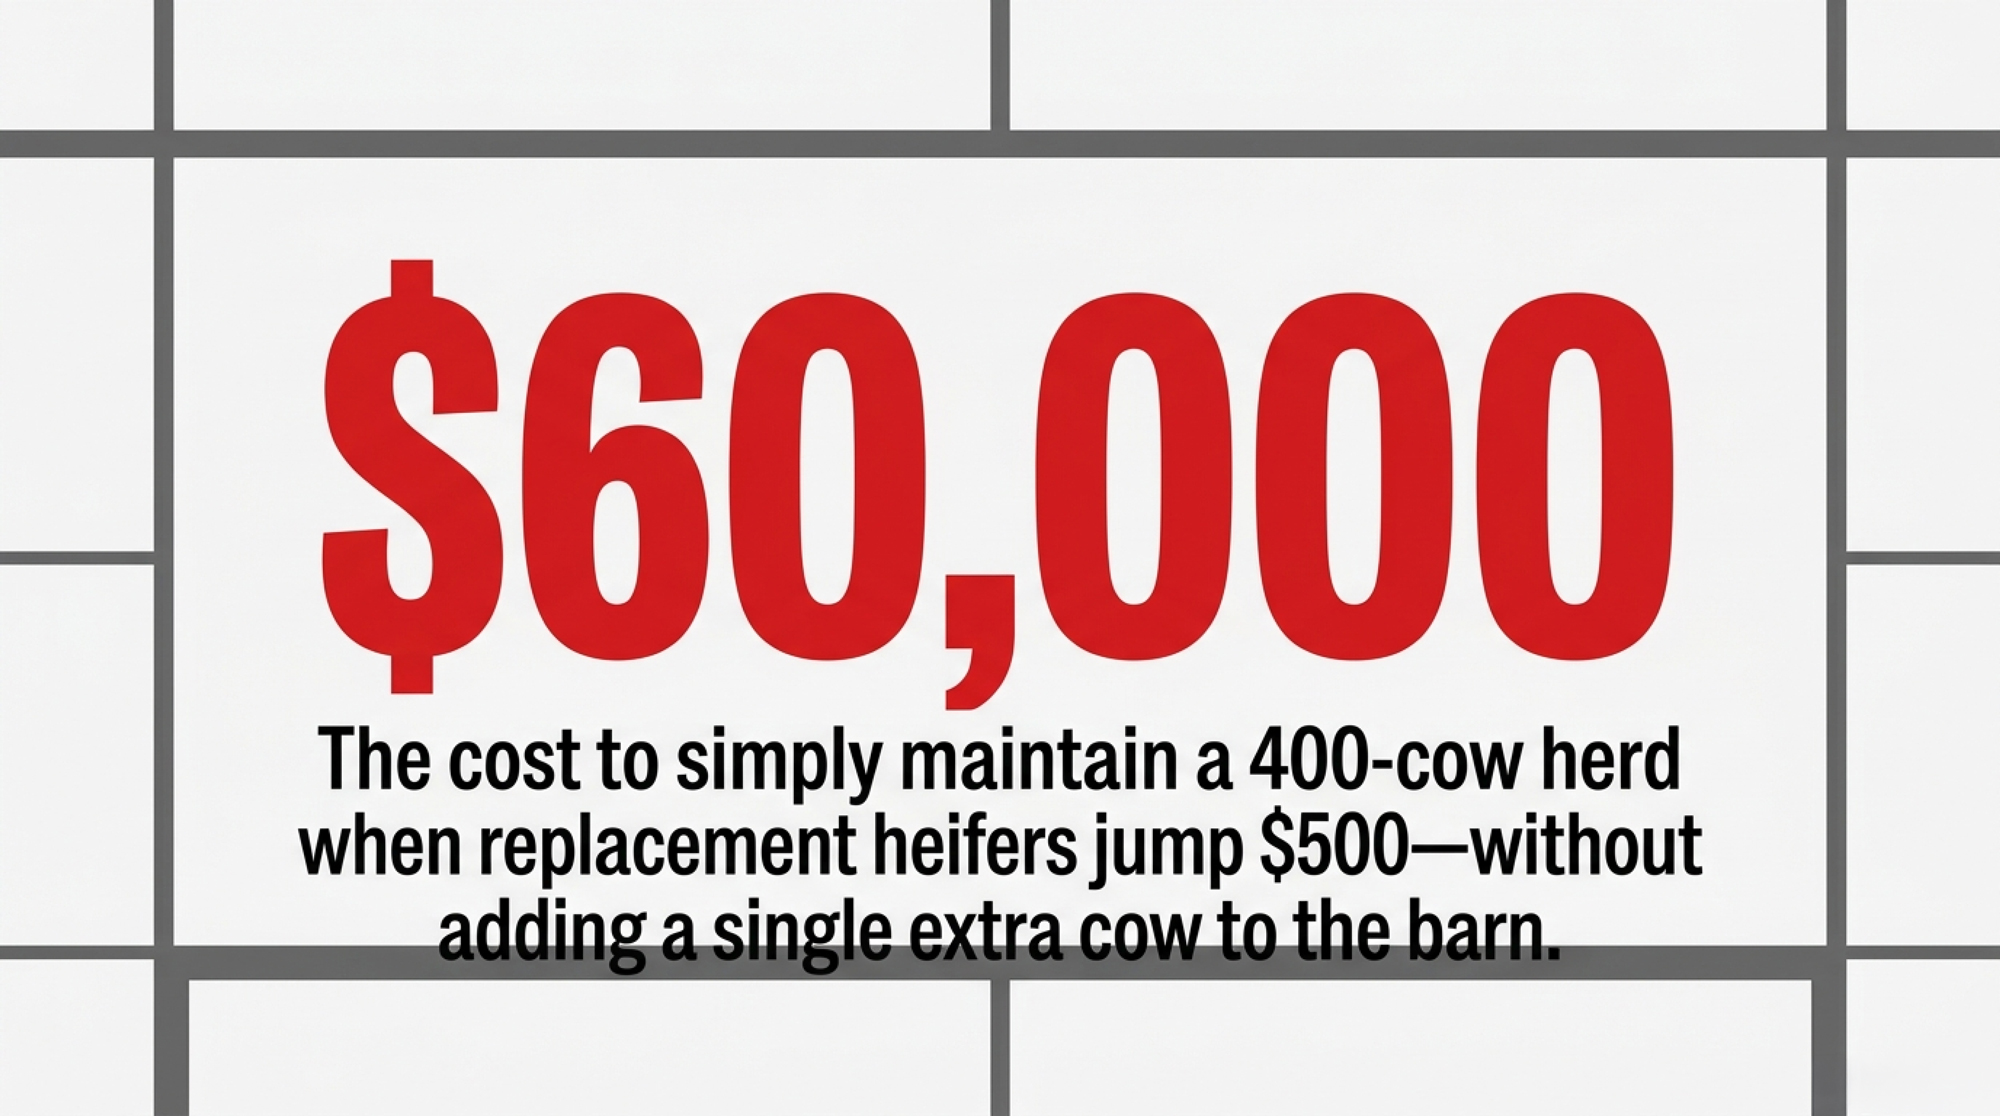
Replacements compound it. Springing heifers ran about $3,100 a head nationally this spring, with Minnesota and Wisconsin barns pushing $3,400 to $4,400, per CoBank and USDA figures. The record monthly average hit $3,110 in October 2025. A 400-cow herd culling 30% needs 120 replacements a year — so every $500 move in heifer price shifts your cost to stand still by $60,000. Same herd. Same tank. Sixty thousand dollars.
Total dairy heifer inventory sits at 3.914 million head, the lowest since 1978. Our deep-dive on the tightest replacement heifer market since 1978 and what it does to beef-on-dairy strategy runs the herd-turnover budget in detail.
Cull values give you a current read from the same week. Conventional cull cows averaged $150.94/cwt at a Pacific Northwest auction reported August 17–21, with the top ten at $187.19/cwt. On a 1,236-lb cow at that average, that’s roughly $1,866 walking out the door against a $3,100 replacement walking in — a gap near $1,234 on every turn, by our arithmetic, before you’ve improved a single thing about the herd.
The Canadian Takeaway
Ontario and Quebec readers: every price in this analysis is a U.S. Federal Milk Marketing Order figure or a CME settlement. None of it sets a Canadian farm-gate price, which runs through supply management and provincial board pricing rather than class utilization.
What transfers is the supply signal. U.S. output at 20.1 billion pounds a month, with cheese exports running at record pace, shapes the world price Canadian processors and exporters watch — and it shapes what imported product costs at the border. The useful takeaway isn’t the $15.52. It’s that U.S. supply growth is coming from animals rather than efficiency, and that the fat side of the U.S. market is softer than the protein side.
The Turn: Butter Splits by Grade, Not by Tonnage
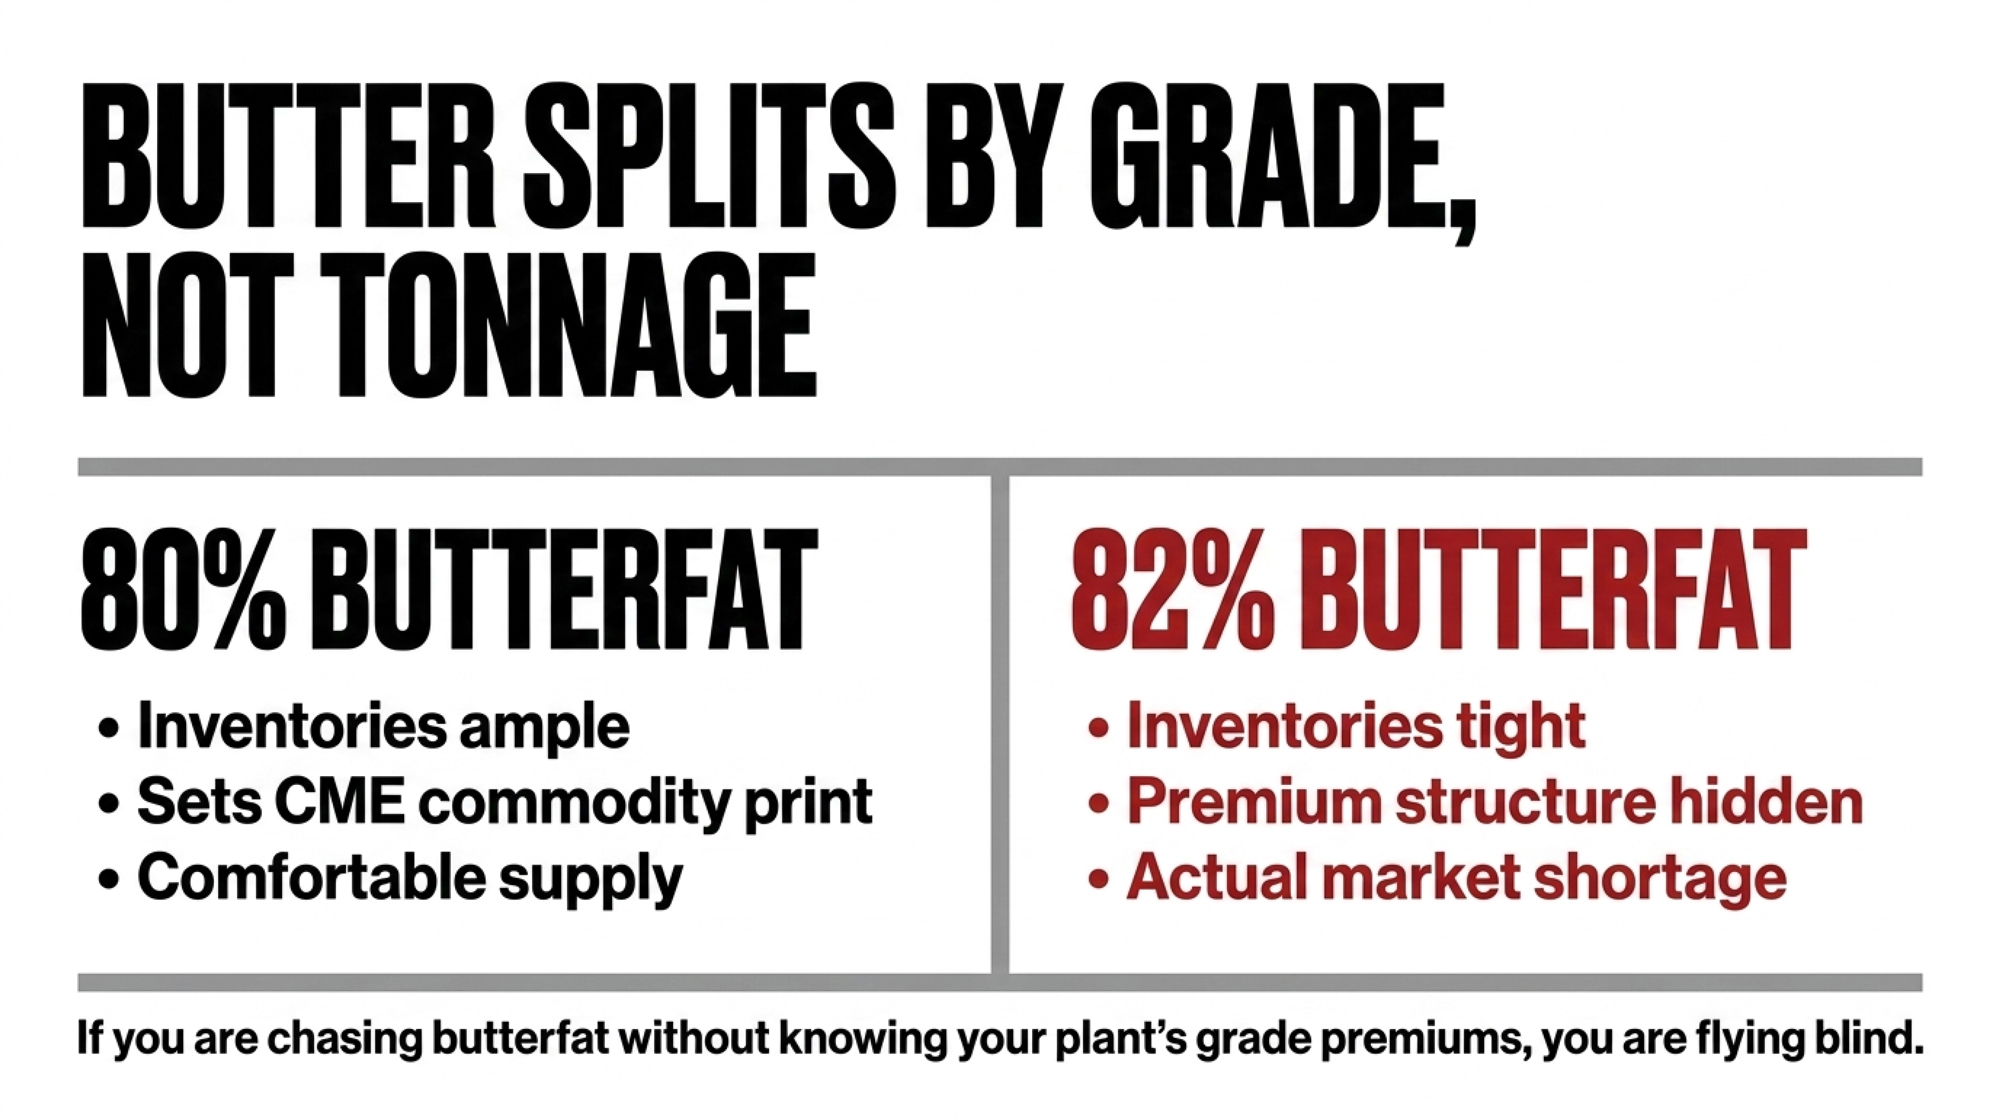
Butter prices kept sliding through August while the market read tight. Dairy Market News explains why the two aren’t contradictory: 80% butterfat inventories remain ample, while 82% butterfat supplies are tighter. Central-region contacts put it the same way — 80 percent butterfat inventories high, 82 percent tight.
Be precise about what’s actually short. DMN reports cream inventories tight with spot availability varying by region, while butter inventories read stable in the West and are actively building in the East ahead of post-Labor Day retail promotions and holiday baking. So the tightness sits in cream and in the higher-fat grade. Commodity-grade butter — the stuff that sets the CME print — is comfortable.
That’s the whole puzzle. The fat surplus isn’t a tonnage story. It’s a grade story.
| Butterfat Grade | Inventory Status | Market Signal |
|---|---|---|
| 80% butterfat | Ample / high inventories | Prices sliding — surplus |
| 82% butterfat | Tight supply | Read as “shortage” but rarely priced separately |
CME Grade AA butter closed at $1.4625/lb on August 21, weekly average $1.4510, down 2.45 cents. Blocks closed at $1.5275 against a weekly average of $1.5620; barrels closed at $1.5650. Selected cold storage centers held 66,320 thousand pounds of butter on August 17, down 1% from August 1, while cheese holdings rose 5% to 86,020.
Three years of chasing butterfat on the assumption that fat is fat, and the grade line is where the money actually sits. DMN documents the split qualitatively — high 80% inventories against tight 82% supply — without publishing a price differential between the two grades. If you’re paid on component tests, that absence is itself worth a conversation with your field rep.
There’s a regional wrinkle. DMN reports the Mountain States — Idaho, Utah and Colorado — seeing decreased milk volumes from smoke, haze and high heat, with a noticeable drop in milkfat levels. Northwest plants are bringing in outside cream. Western churns run at full capacity with unsalted butter for export as the priority, because butter produced outside the U.S. trades at a significant premium to domestic product.
What the Futures Curve Says That July Doesn’t
As of the August 20 settlements, CME Class III futures stood at $16.80 for September and $17.13 for October. Class IV sat at $18.86 and $19.10. Nonfat dry milk for September ran 175.200 cents against 159.325 for August.
Every one of those sits above July’s actual print. The market was pricing recovery, not deterioration.
Read the week, though, not just the close. Class III September softened from $17.43 on August 14 to $16.80 by August 20, and October slid from $17.45 to $17.13 across the same five sessions. The curve still says recovery. It was also revising that recovery downward — worth knowing before you treat $16.80 as a floor, and worth re-checking against this week’s settlements before you act.
NDM was the loudest signal in the report. Grade A closed at $1.8000 on August 21, up 5.5 cents on the week, with the CME spot price gaining 11 cents since the prior Thursday. DMN attributes it to building domestic demand plus export interest from Southeast Asia and Mexico, with milk diverted to Class I for the school year leaving less for dryers.
September advanced Class I came in at $17.04, down $1.72, so near-term pressure is real. But if you’re making a twenty-year decision off a single Federal Order print — the most pessimistic number currently on the board — you’re using the wrong input.
Culling says producers are already sorting. Dairy cow slaughter through August 8 totaled 1,651,600 head against 1,581,700 a year earlier, up 4.4%. Herd growing, culling running ahead of last year. That’s a herd being rebuilt, not simply expanded. Whether your co-op’s base year lets that new milk earn blend or base is a separate question, and we broke down how base-year mechanics decide what your expansion milk actually earns this week.
Is the New Capacity Built for the Milk You’re Shipping?
Dairy processors have committed more than $11 billion across 19 states and 50-plus projects between 2025 and early 2028, tied to a projected 15 billion additional pounds of U.S. milk by 2030 — figures IDFA reported and Food Engineering carried in August 2026. New York leads at $2.8 billion, followed by Texas at $1.5 billion, Wisconsin at $1.1 billion, Idaho at $720 million, and Iowa at $701 million. Kansas herd growth clustered where that processing capacity gave the milk a buyer, which is the siting logic you’d expect.
An even path to 15 billion pounds implies roughly 2.5 billion pounds added per year from a 2025 baseline. July’s 2.2% pace on a 236-billion-pound base implies closer to 5 billion if sustained — that’s The Bullvine’s arithmetic on IDFA’s stated target, not an IDFA or USDA projection. The flat June-to-July cow count and Kansas’s deceleration are both real arguments the pace won’t hold.
IDFA’s public materials describe the buildout in aggregate. We couldn’t locate a project-level breakdown showing how much of that $11 billion processes butterfat versus cheese and protein, or which plants run now versus commission in 2027–2028.
Whey economics show where the capital is pointed. Whey protein isolate traded from $14 into the upper $14s in the week ending August 21, with contacts reporting demand outpacing supply. WPC 34% inventories are extremely tight, with manufacturers prioritizing higher-protein products — tight enough that some calf milk replacer makers have substituted nonfat dry milk. That’s the protein side of the buildout showing up in spot markets. Not the fat side.
Call it a collision course and you’re overclaiming. Call it a clean catch-up and you’re ignoring the half nobody’s published.
Kansas Water: Two Clocks, Different Speeds
Sixty percent of Kansas topsoil rated short or very short of moisture in the week ending August 18, per USDA Crop Progress data reported by RFD-TV. Check the current week’s Crop Progress before you treat that as today’s condition — but as a feed-cost signal right now, it’s live.
The longer clock runs independently of any single dry August. Kansas Geological Survey monitoring has documented multi-decade Ogallala decline across western Kansas, with annual rates varying sharply by groundwater management district and by year. A dry August can fix itself with a wet fall. Aquifer drawdown doesn’t reverse on one good year, or two. The input risk belongs to the producers carrying the notes — plants buy milk, they don’t carry the note or the water right — and the drop from 18.7% to 15.4% may be the first sign the build is finishing on its own, before either clock forces the question.
What About Demand?
Cheese exports ran up roughly 24% in the first half of 2026, on pace to top 700,000 metric tons and a third straight record year, according to USDEC and USDA FAS figures reported in trade coverage this month. That’s why the cheese side has somewhere to put additional milk.
Domestic is softer. Natural American cheese use fell to its lowest May level since 2022 on weak foodservice, and June domestic cheese disappearance dropped 1.5% year over year, per HighGround Dairy analysis. DMN adds that U.S. export interest persists but is limited by elevated domestic price points for premium cheeses, pushing offshore business toward lower-priced commodity styles — while European demand stays strong and European milk output declines on summer heat.
Central-region cheese contacts report good demand alongside high inventories from active production schedules. Spot milk moved lower on both ends, from $1.00 under to $3.00 over Class, with some loads trading below Class price on plant downtime.
Export strength is carrying cheese. That’s different durability than strong domestic demand, and it’s worth knowing which one your plant leans on.
The 30/90/365-Day Playbook for Herds Carrying Expansion Debt
Add cows and you buy volume, scale, and leverage with a plant that needs milk. You also lock in feed, labor, facility, and replacement costs that don’t flex when Class III gives back $1.40 in two months. Push components and you buy margin per hundredweight, adjustable inside a feed cycle — but the 80%/82% split shows not all fat gets paid the same, and a premium structure can shift without a single cow changing.
Kansas took the volume bet next to real processing capacity. Defensible. Whether it’s durable depends on inputs nobody controls — and the state’s own growth rate just slowed 3.3 points in a month, which may settle the question before the water does. If you want this math run against a single herd’s replacement pipeline, we worked through the $585-per-service breeding trap on a 500-cow herd.
30-Day Actions
- Pull your last three milk checks and calculate your actual blend price per cwt, then set it against July’s $15.52 Class III and $18.34 Class IV. Find your real class weighting instead of assuming it. Requires statements and twenty minutes. Backfires if you use one month — pull three.
- Ask your field rep what share of your milk went to Class III versus Class IV last quarter, and whether your plant pays differently on 80% versus 82% butterfat. One phone call. Watch for utilization shifting month to month, which makes a single quarter less useful than a trend.
- Red-flag trigger: if your debt service coverage ratio has run under 1.20 for three consecutive months on your lender’s or CPA’s method, treat it as urgent rather than seasonal.
90-Day Actions
- Re-run your covenant against $15.52 Class III, not the $19.85 all-milk annual forecast. A modeled 5,000-cow High Plains greenfield — $8,000/stall, $40M note, 7% over 20 years, 1.20x DSCR — needed farm-gate milk near $19.07/cwt to clear covenant against Class III near $16.82 in April. Class III has since fallen to $15.52. Those parameters are illustrative and don’t describe any specific operation, but the structure transfers. Requires your amortization schedule and current component data. Backfires if you only stress the downside — run the futures curve too.
- Price replacements against current local quotes, not last year’s. At $3,100 nationally and $3,400–$4,400 in Upper Midwest barns, a 120-head annual replacement need spans roughly $372,000 to $528,000 depending on where you buy. Requires your actual cull rate and a real local quote. Watch for heifer prices moving faster than your budget cycle.
- Get component data in front of your nutritionist alongside the grade question. Requires recent tests and a straight answer from your buyer on premium structure. Backfires if you chase specifications your plant doesn’t price differently.
365-Day Moves
- Decide whether your next increment of milk comes from new cows or cows you already own. Nationally it was 93% animals; in Kansas, roughly 98%. Yours doesn’t have to be. Requires capital planning, facility assessment, honest per-cow benchmarking.
- If you irrigate in the Ogallala footprint, pull your own groundwater management district’s annual water-level report rather than relying on state or regional averages. District-level rates diverge sharply, and the district you farm in matters more than the state trend. Watch for LEMA allocation changes arriving faster than your cropping plan.
- Opportunity signal: if September and October Class III settle at or above the $16.80 and $17.13 the curve carried on August 20, and your margin over feed holds, July was the bottom. Confirm against actual settlements, not August’s curve — which softened 63 cents on the September contract in a single week.
So pull your statements. What’s your actual blend price per cwt this month versus 90 days ago, and what share of your milk did your co-op utilize in Class III? If that number isn’t at your fingertips, you don’t yet know whether July’s report was your problem or somebody else’s.
Key Takeaways
- July’s 2.2% national gain was 93% more cows and 7% better cows. Kansas was 98% cows. Animal-driven growth locks in feed, labor, facility, and heifer costs that don’t flex when Class III gives back $1.40 in two months.
- The July class spread was $2.82 — $18.34 Class IV against $15.52 Class III. On 400 cows at 75 lbs, that’s roughly $26,226 in a month, and which side you’re on is a clause in your co-op agreement, not a market call. Pull three milk checks and find your real weighting.
- Butter kept sliding while the market read tight because 80% butterfat inventories are ample and 82% is where the shortage sits. Ask your buyer whether they actually pay differently on grade before you chase fat.
- Springing heifers at $3,100 nationally and $3,400–$4,400 in Upper Midwest barns mean every $500 move costs a 400-cow herd about $60,000 to hold size. Price replacements locally in the next 30 days, not off last year’s number.
Complete references and supporting documentation are available upon request by contacting the editorial team at editor@thebullvine.com.
Learn More
- Cull cow replacement cost: $2340 vs $3500 in 2026 — Dismantles the reflex of convenience-culling by exposing the $1,160 cash deficit between a $2,340 slaughter cheque and a $3,500 replacement, arming you with a clear scorecard to keep sound cows earning margin instead of buying expensive replacements.
- $19.85 milk price forecast 2026: your base year decides — Follows the money on $11 billion in new plant construction to expose how cooperative base-year rules penalize expansion volume into discounted surplus tiers when USDA’s all-milk forecast slips below $20/cwt.
- Cracking the Code: Behavioral Traits and Feed Efficiency — Delivers a sensor-driven roadmap linking wearable rumination and resting data to residual feed intake, showing how to engineer higher milk efficiency from existing cows rather than purchasing more stalls.
The Sunday Read Dairy Professionals Don’t Skip.

Every week, thousands of producers, breeders, and industry insiders open Bullvine Weekly for genetics insights, market shifts, and profit strategies they won’t find anywhere else. One email. Five minutes. Smarter decisions all week.
