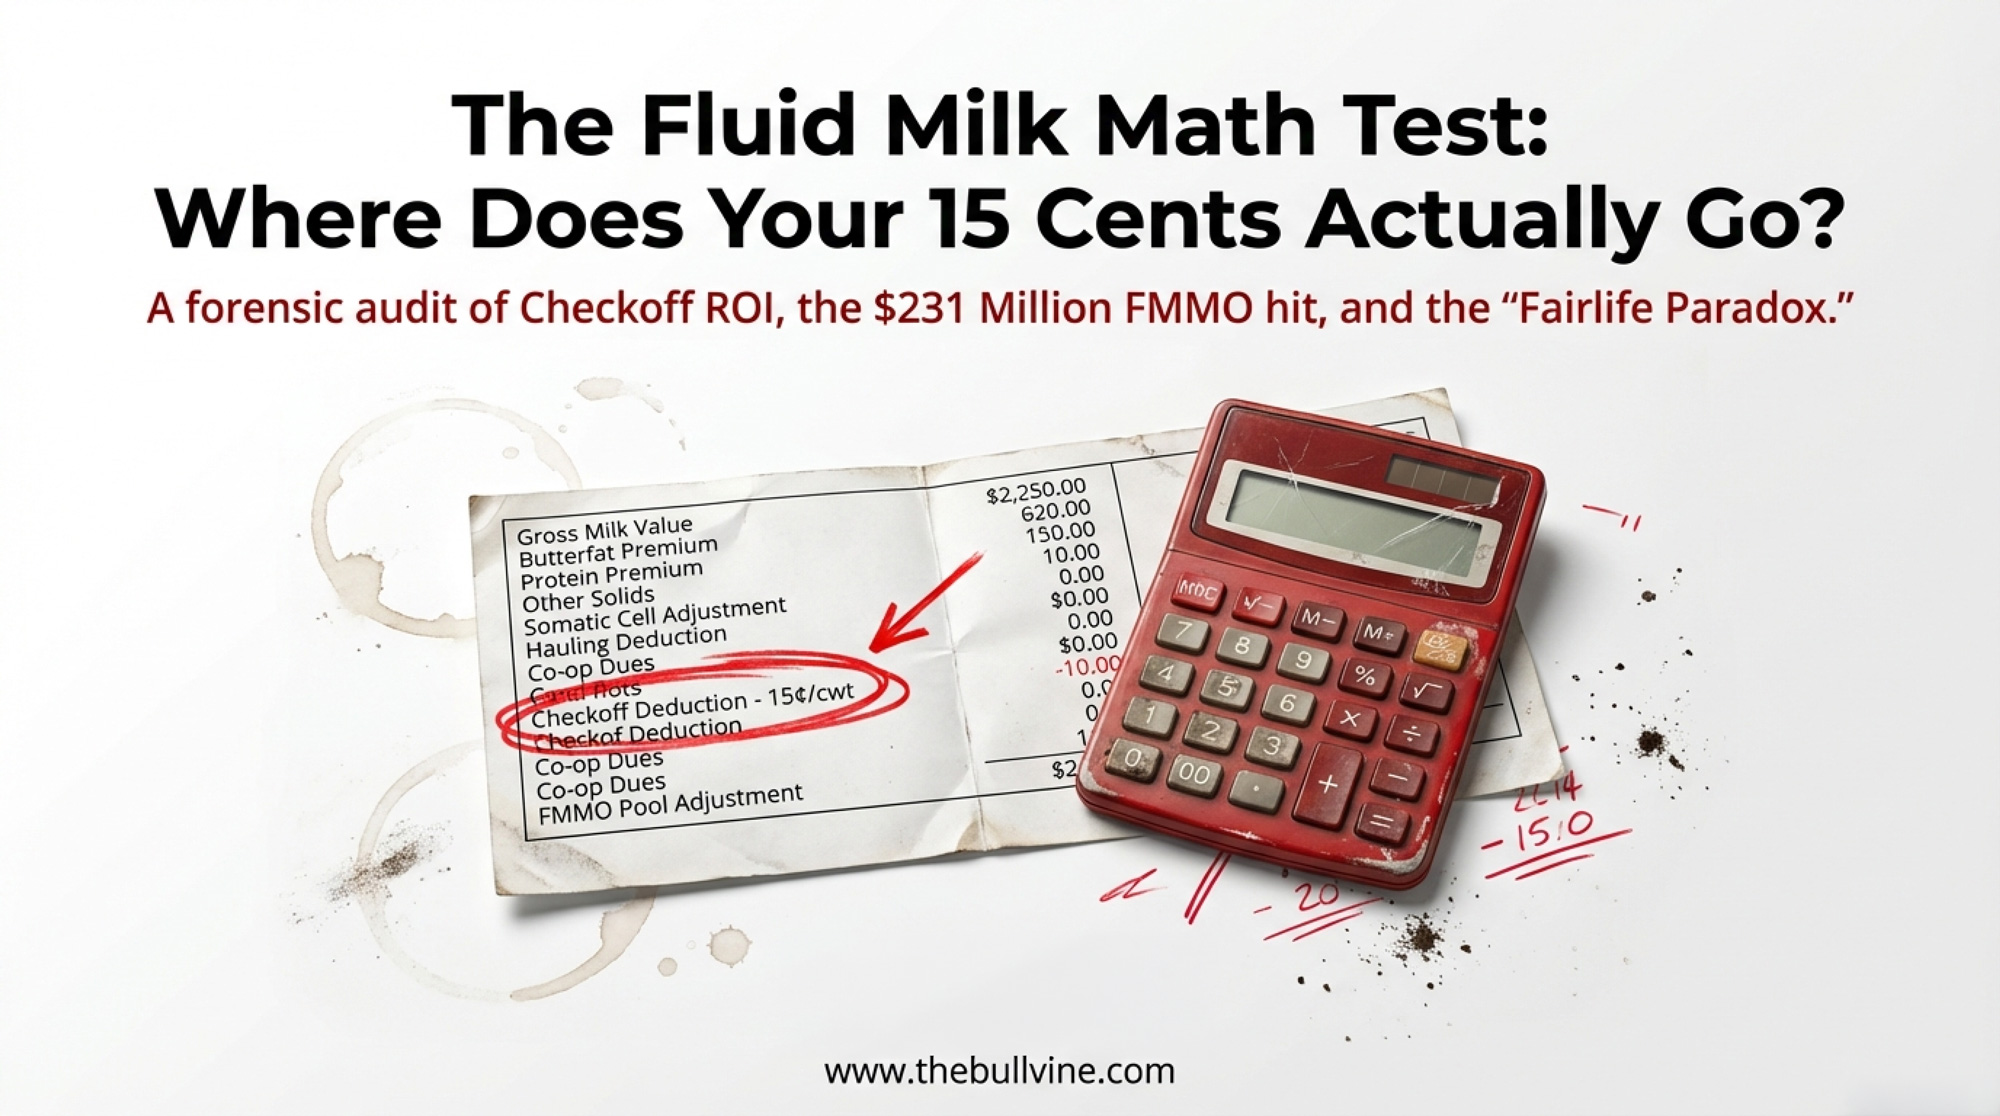
Fluid milk finally rose in 2024, then slipped again in 2025. This isn’t a comeback—it’s a math test for any herd that lives on Class I.
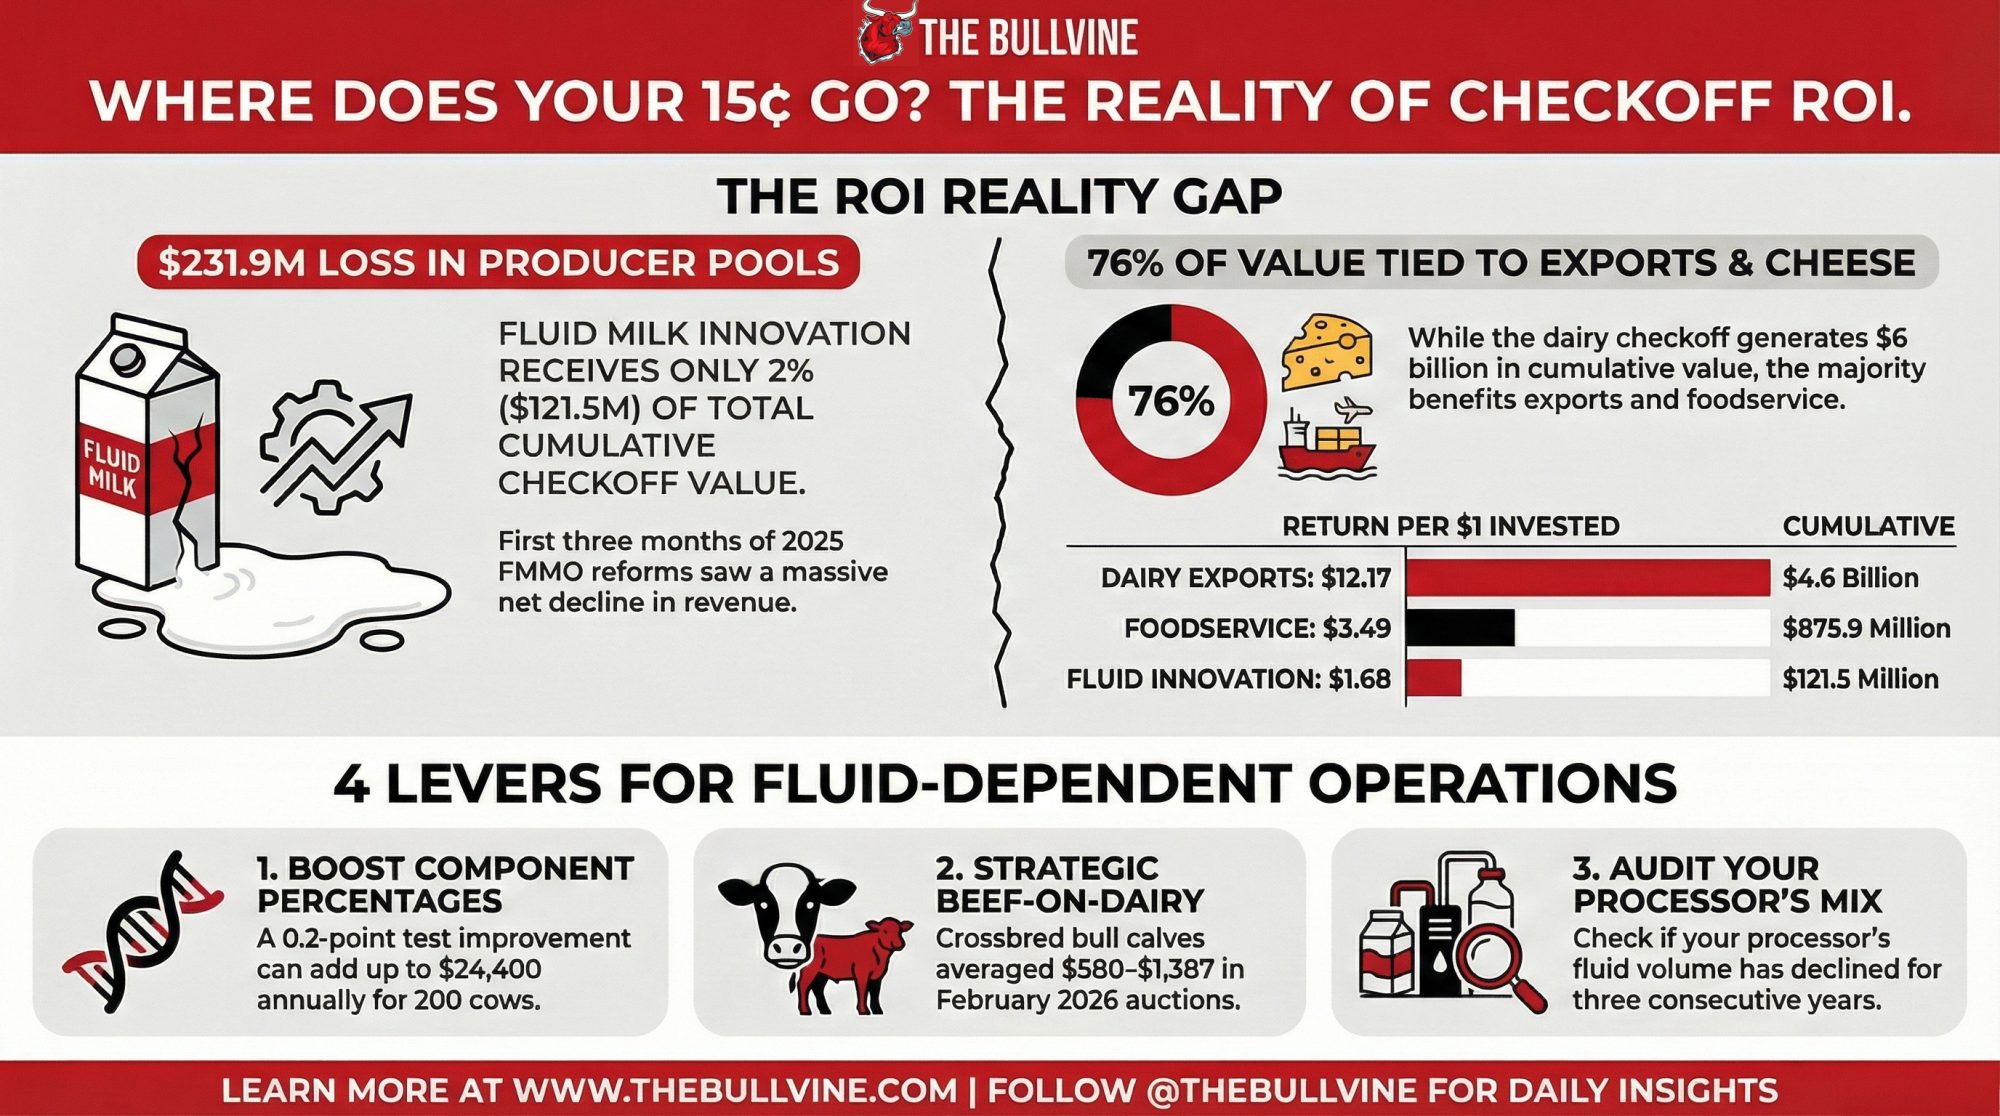
Executive Summary: U.S. dairy producers pay 15¢/cwt into the national checkoff. Texas A&M’s independent model says it adds about $1/cwt to the all‑milk price — but 76% of the $6 billion in cumulative value is tied to cheese exports and foodservice. In comparison, fluid milk innovation gets just $121.5 million and a $1.68 return per dollar. For a 275‑cow herd like Mike Yager’s in Wisconsin, that modelled uplift looks good on paper, yet the June 2025 FMMO reform yanked 1.9 million from producer pools in three months, with his Upper Midwest order losing million to higher make allowances and gaining only million back in differentials. The brief 2024 uptick in fluid sales was driven by higher‑priced whole, organic, and value‑added products, but it flipped negative again in 2025, so this is not a structural demand comeback for conventional Class I milk. At the same time, Coca‑Cola’s fairlife has grown into a billion ultra‑filtered milk brand, showing how checkoff‑supported category growth can create huge value that mostly lands on corporate balance sheets rather than your milk statement. This analysis uses barn‑math walk‑throughs and four practical levers — boosting components, using beef‑on‑dairy strategically, reassessing your processor’s product mix, and tracking school milk and FMMO policy shifts — so you can see how much checkoff ROI actually hits your own fluid milk check and where you still have room to move.
When Mike Yager spoke to Brownfield Ag News last November, he was milking 275 Holsteins at Road View Dairy near Mineral Point, Wisconsin. First-generation operation — he and his wife, Sherri, started it in 1992. He put a question on the air that every dairy checkoff contributor deserves an answer to: “I want to see the difference… the 13.3 billion less we received for the milk in income between those two years… but I’m pretty sure dairy prices were higher for the consumer, so where did all of that money go?”
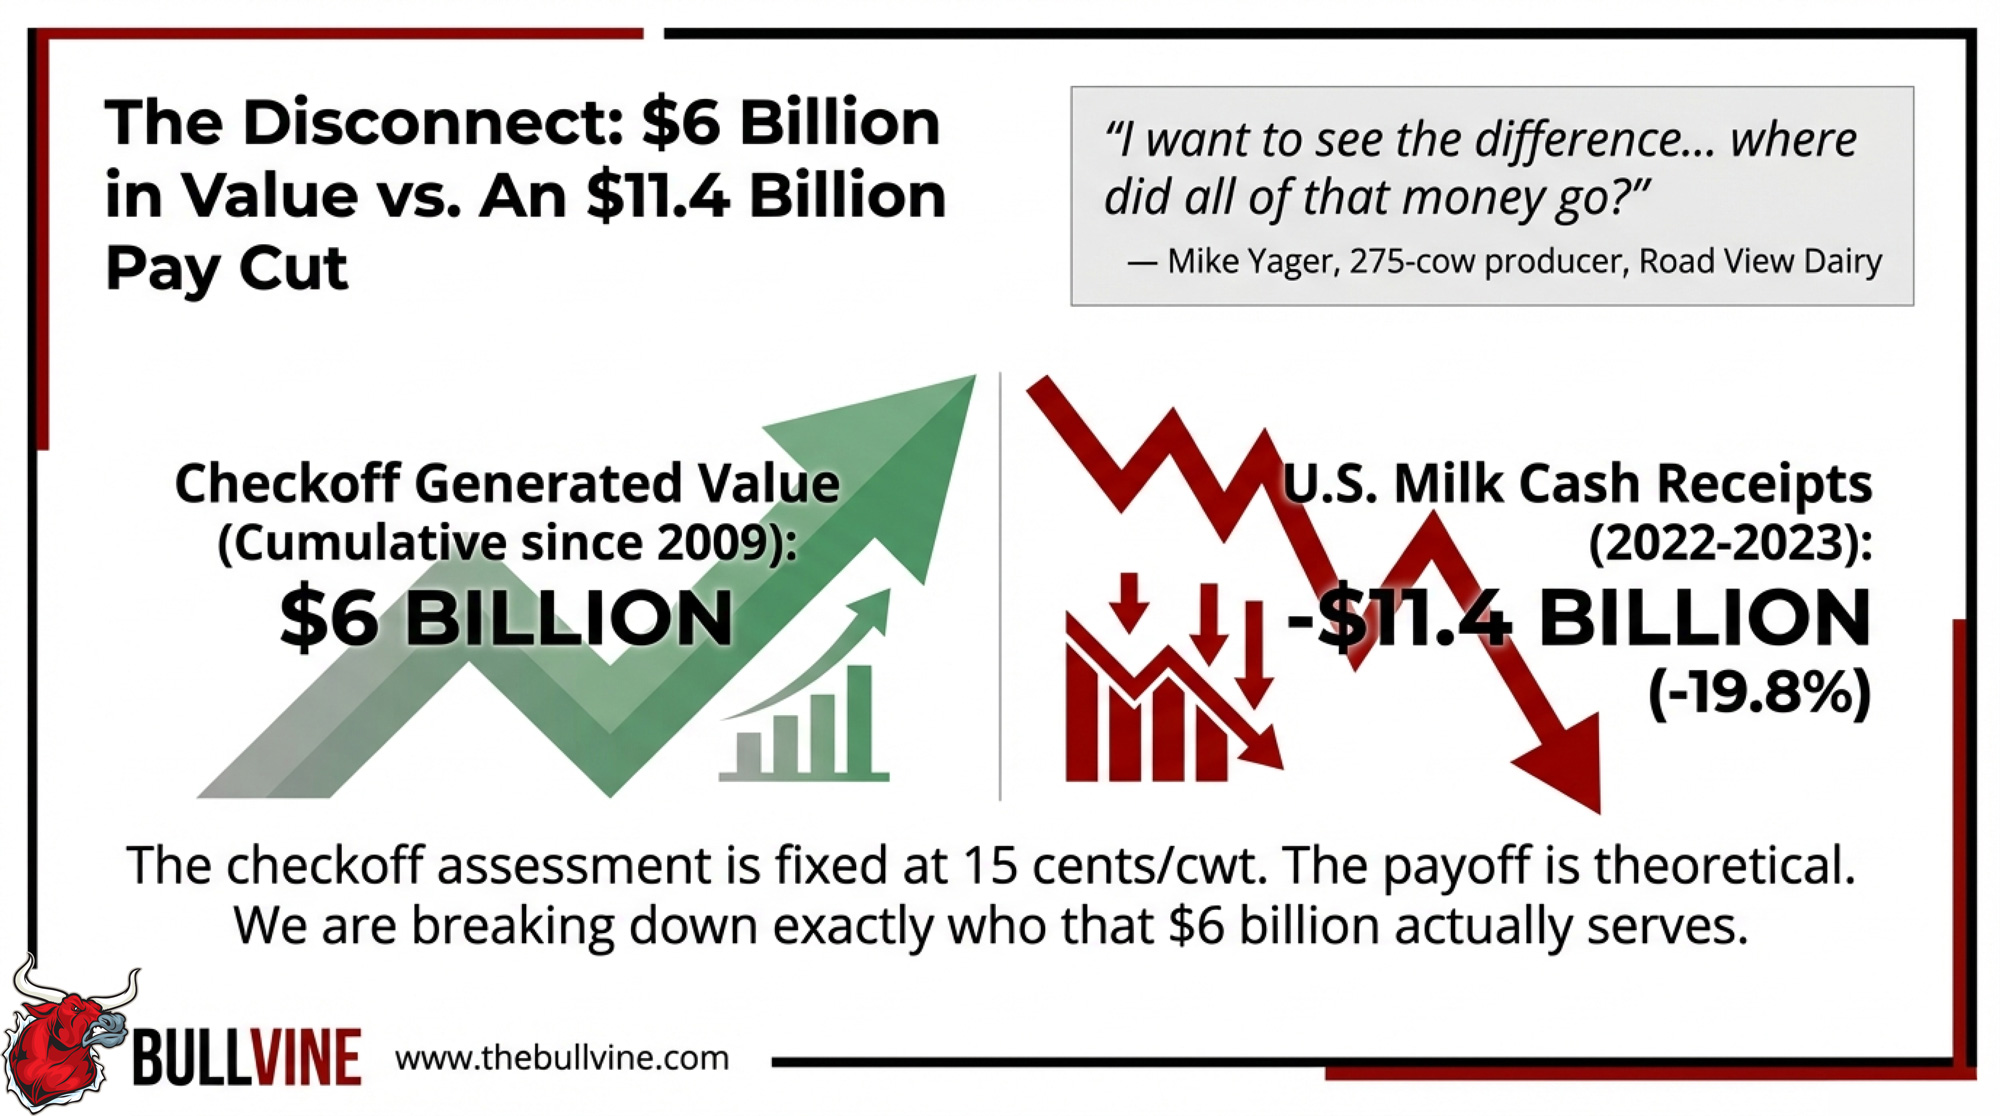
He’s asking where the money went. USDA NASS data show a $11.4 billion nominal decline in U.S. milk cash receipts — from $57.3 billion in 2022 to $45.9 billion in 2023 (USDA NASS, April 2024 and April 2023). That’s a 19.8% haircut in one year. Meanwhile, Yager and every other U.S. producer continued to pay 15 cents per hundredweight into the national dairy checkoff. For his 275-cow herd at the time, that’s roughly $7,500 a year. Dairy Management Inc. says those collective dollars generated $6 billion in cumulative farmer value since 2009.
Six billion sounds like it’s working. Pull the number apart, and the story changes.
Where Your 15 Cents Actually Lands
Dr. Oral Capps Jr. at Texas A&M has conducted the federally mandated independent checkoff evaluation since 2011. His breakdown of that $6 billion, presented at DMI’s joint annual meeting with MilkPEP in Arlington, Texas, last November, tells you everything about who benefits most:
| Program Area | Period | Cumulative Value | Return per $1 |
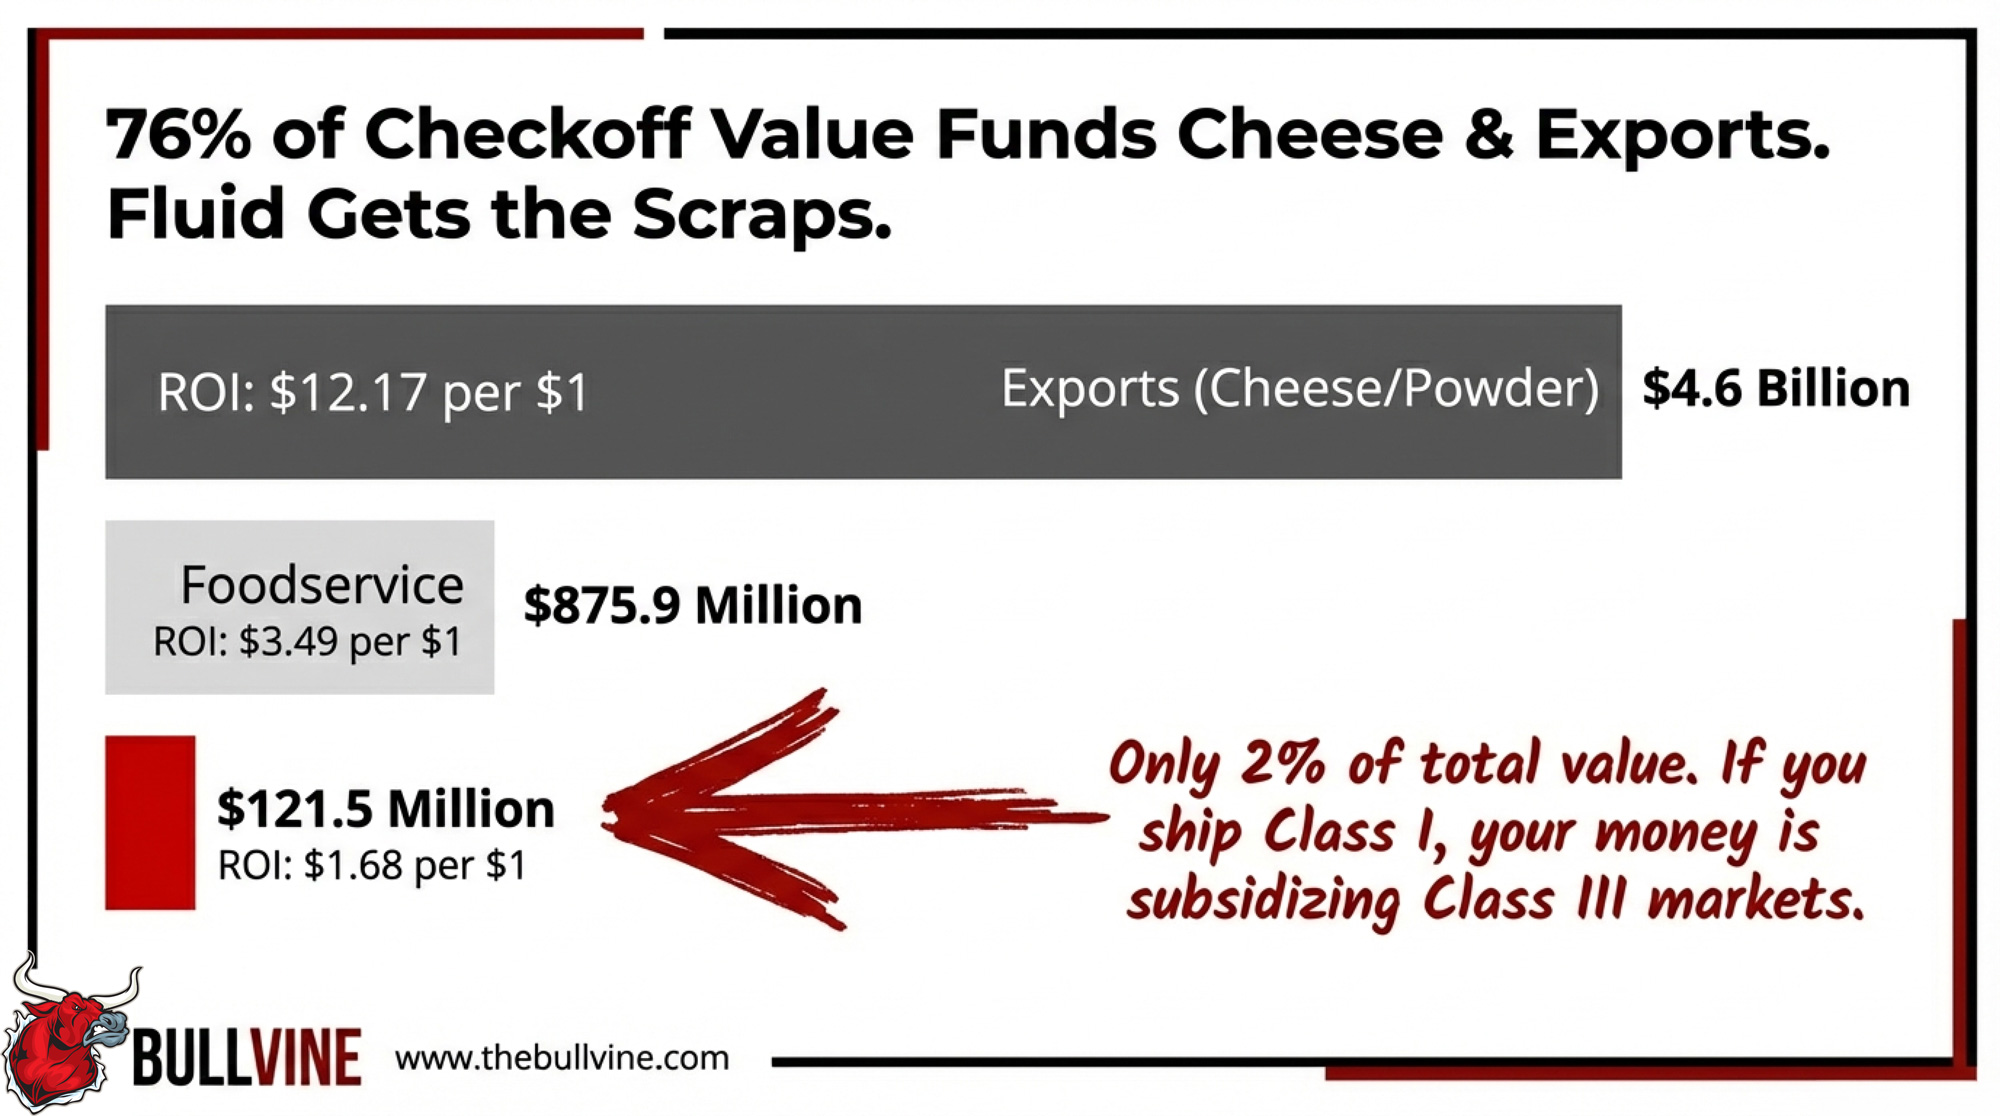
| Dairy exports | 2013–2024 | $4.6 billion | $12.17 |
| Foodservice (Domino’s, Taco Bell, McDonald’s, Raising Cane’s) | 2009–2024 | $875.9 million | $3.49 |
| Whole-fat dairy science | 2012–2024 | ~$400 million | $34.55 |
| Fluid milk innovation | 2018–2024 | $121.5 million | $1.68 |
Source: Capps/Texas A&M independent analysis, November 2025; DMI Economic Impact Report
Exports — overwhelmingly cheese, whey, and powder — account for 76% of total value. Foodservice is the checkoff’s most defensible win: DMI embeds dairy food scientists inside partner test kitchens with contractual volume commitments. Producers invested $195.3 million since 2009. That generated $875.9 million in incremental revenue.
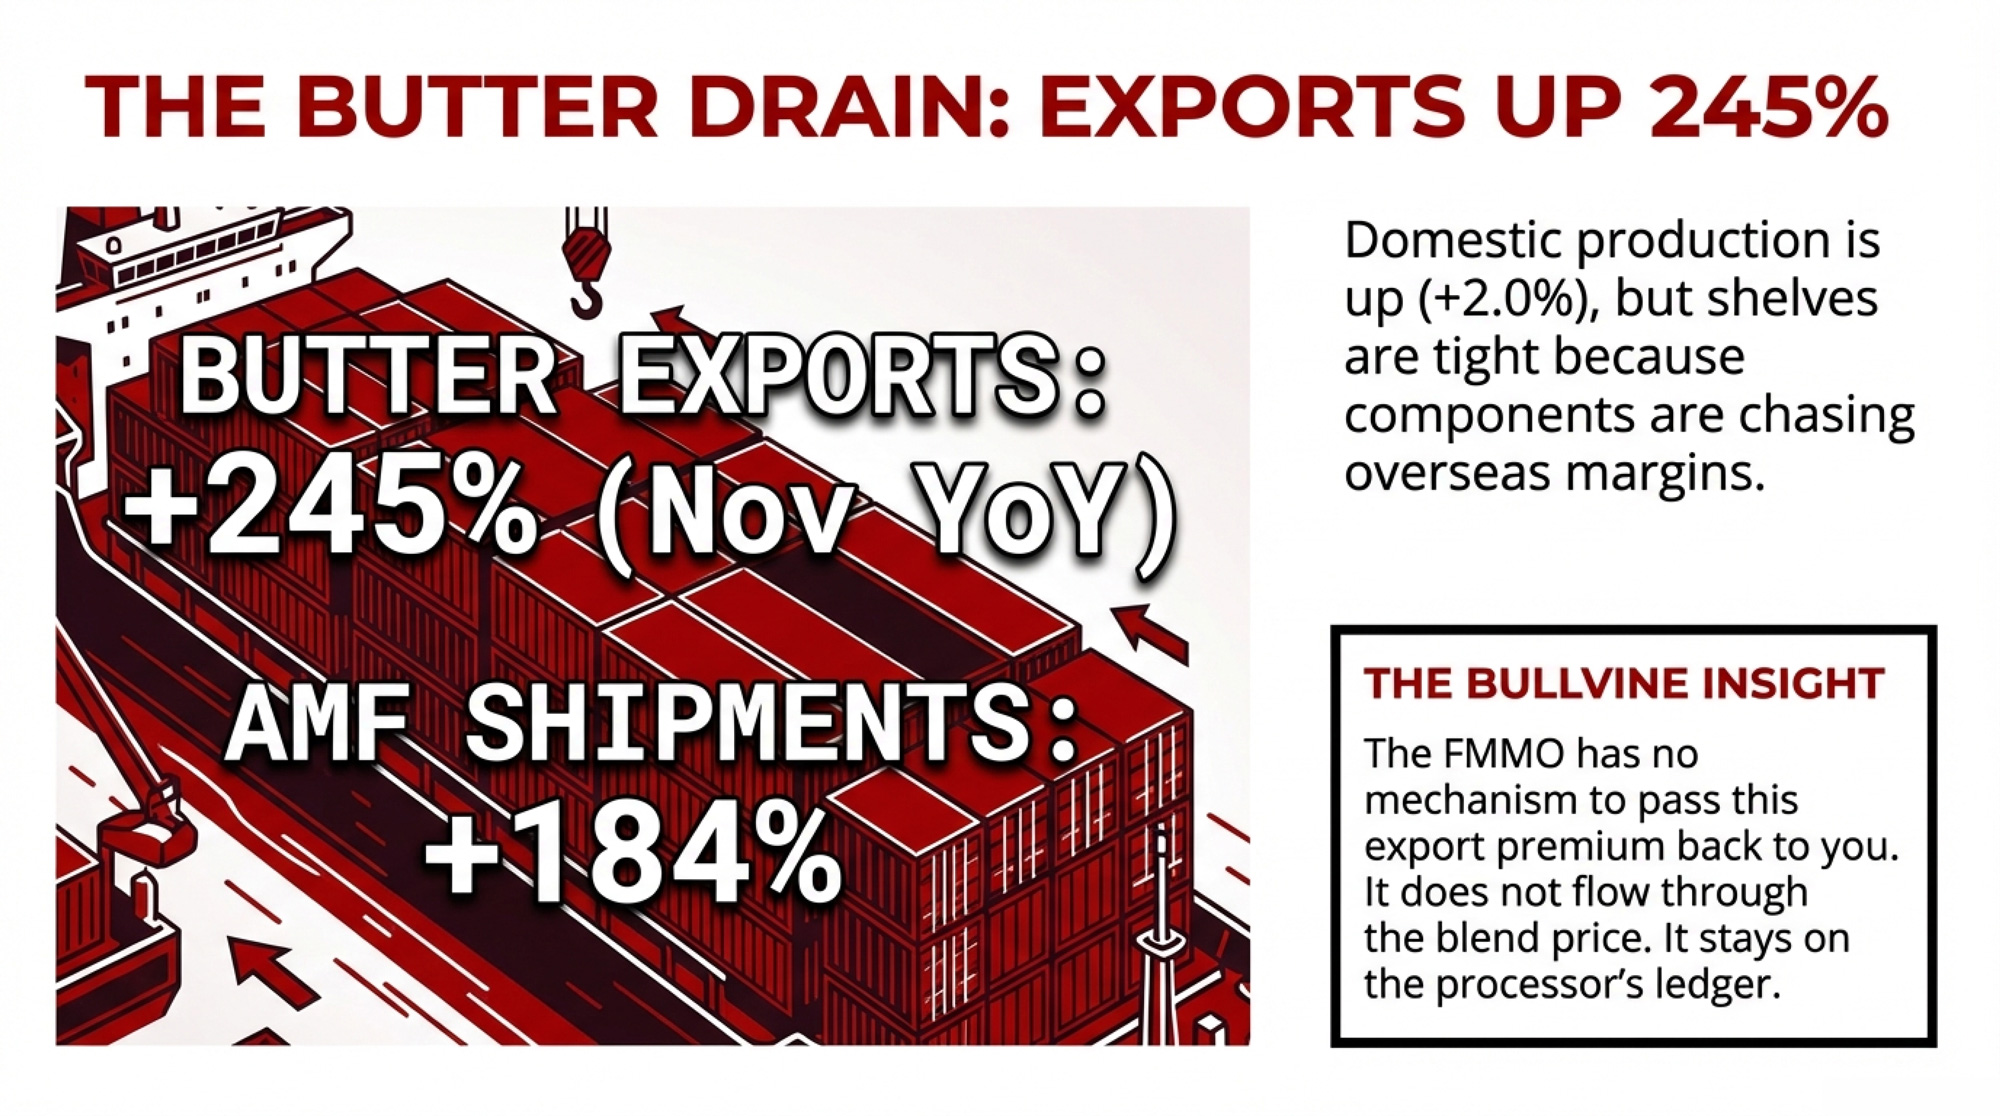
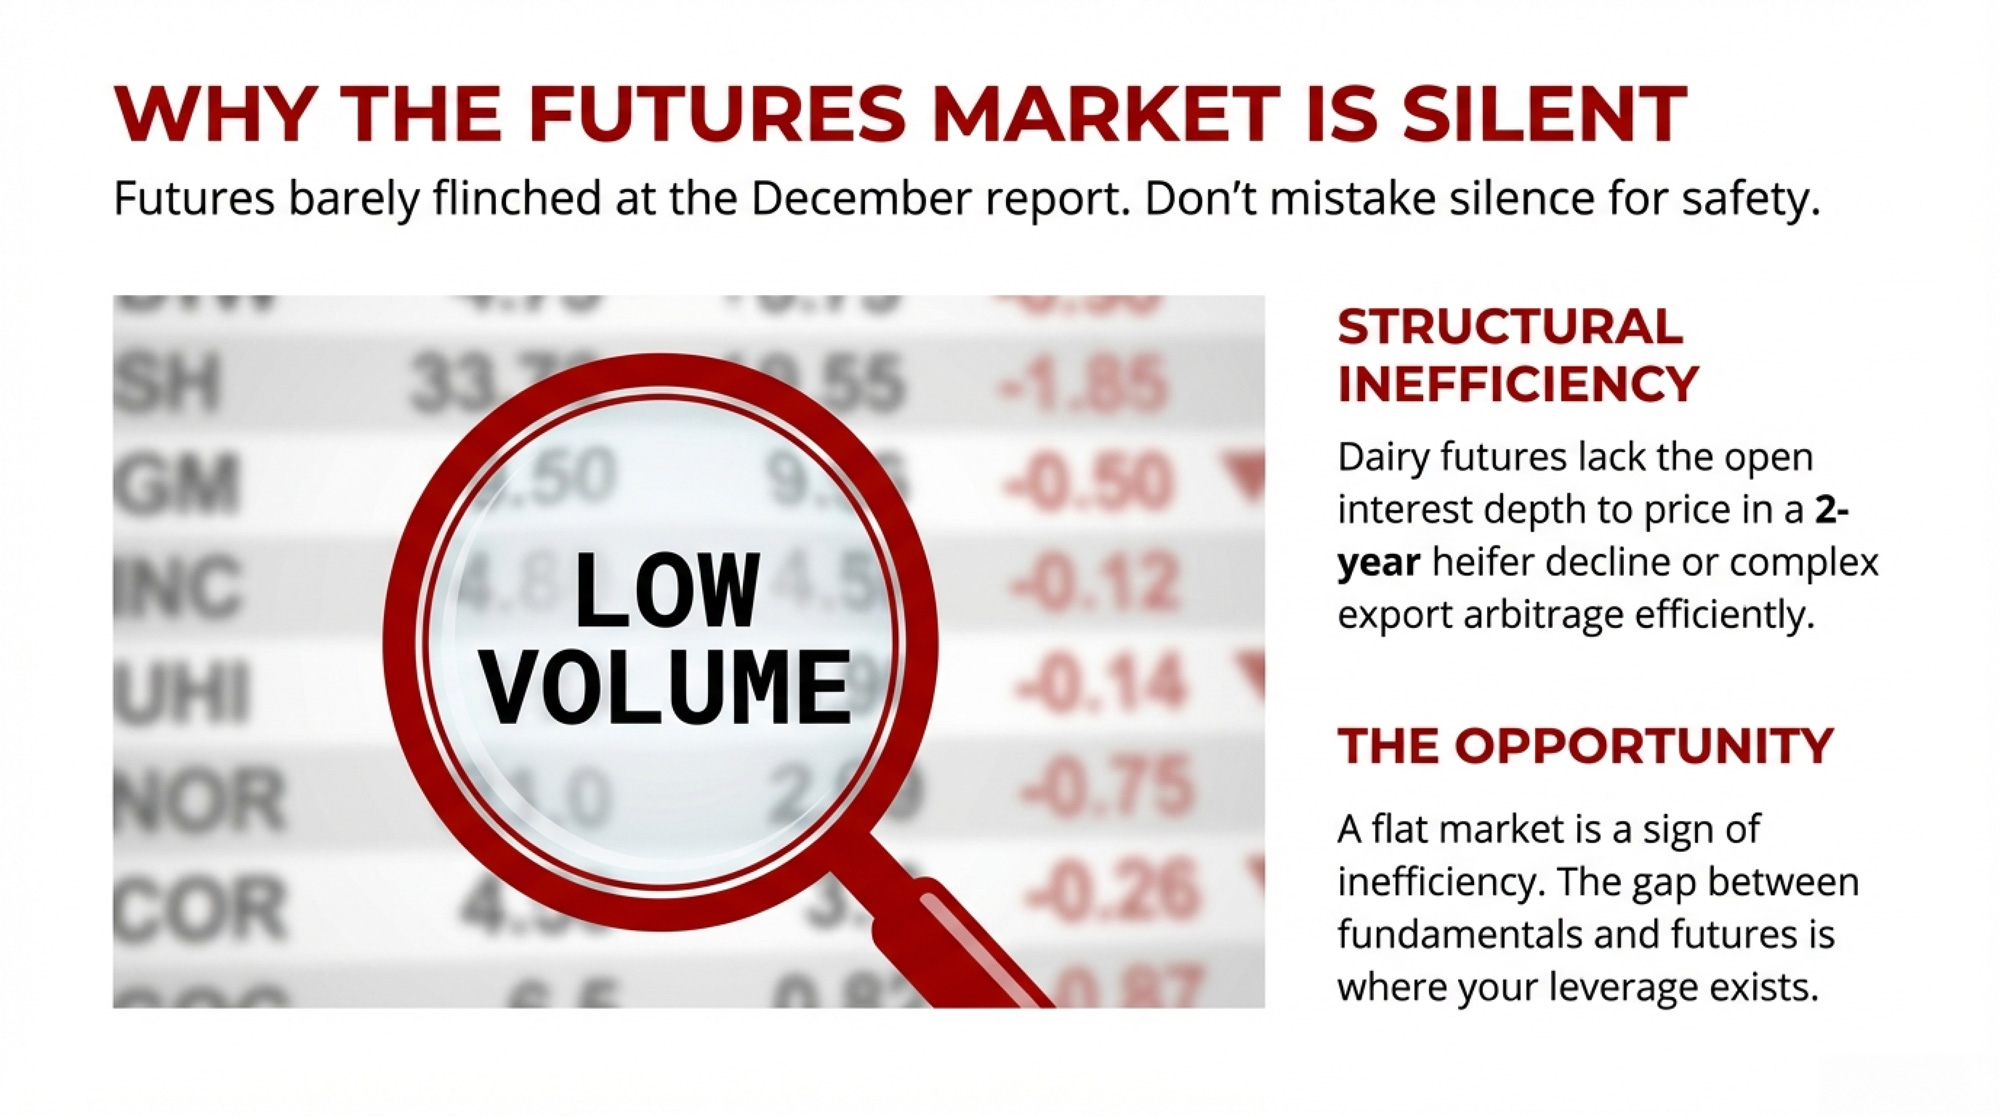
Here’s the structural catch that matters for your milk check: nearly all of this is cheese demand, which lifts Class III pricing. If you’re a fluid shipper, that value reaches you only through FMMO pool blending — diluted across every pound in the system.
The fluid milk innovation bucket? Smallest segment. $121.5 million over six years, returning $1.68 per dollar invested. Not nothing. But it’s 2% of the total cumulative value.
What Does the Dairy Checkoff Actually Return to a 275-Cow Operation?
Capps’ simulations estimate the all-milk price would sit about $1/cwt lower without the checkoff. That’s a national econometric model — peer-reviewed, independently mandated, and the best available estimate we have. Here’s what it means in formal terms for a herd like Yager’s 275 cows:
Annual checkoff assessment:(Cows × lbs per cow) ÷ 100 × $0.15“
Modeled revenue support:(Cows × lbs per cow) ÷ 100 × $1.00
Theoretical net benefit:[(Cows × lbs per cow) ÷ 100 × $1.00] − [(Cows × lbs per cow) ÷ 100 × $0.15]
That’s a 6.7-to-1 return at the national level. For a 200-cow herd at the same per-cow production, $50,000 in modeled support versus $7,500 in assessments. Same 6.7-to-1 ratio. Plug in your own numbers — the formula scales linearly.
The critical qualifier: this is a national model, not an individual farm measurement. It assumes the full all-milk price effect reaches every producer equally. It doesn’t. A Southeast fluid shipper and a Wisconsin cheese-country operation live in different economic universes — and the June 2025 FMMO reform made that gap wider.
How the FMMO Reform Changed the Checkoff Math
The reform that took effect June 1, 2025, raised allowances, restored the higher-of Class I mover, increased Class I differentials, removed 500-lb barrel cheese from pricing surveys, and — six months later — updated milk composition factors.
AFBF economist Daniel Munch scored the first three months in September 2025. Here’s the headline math:
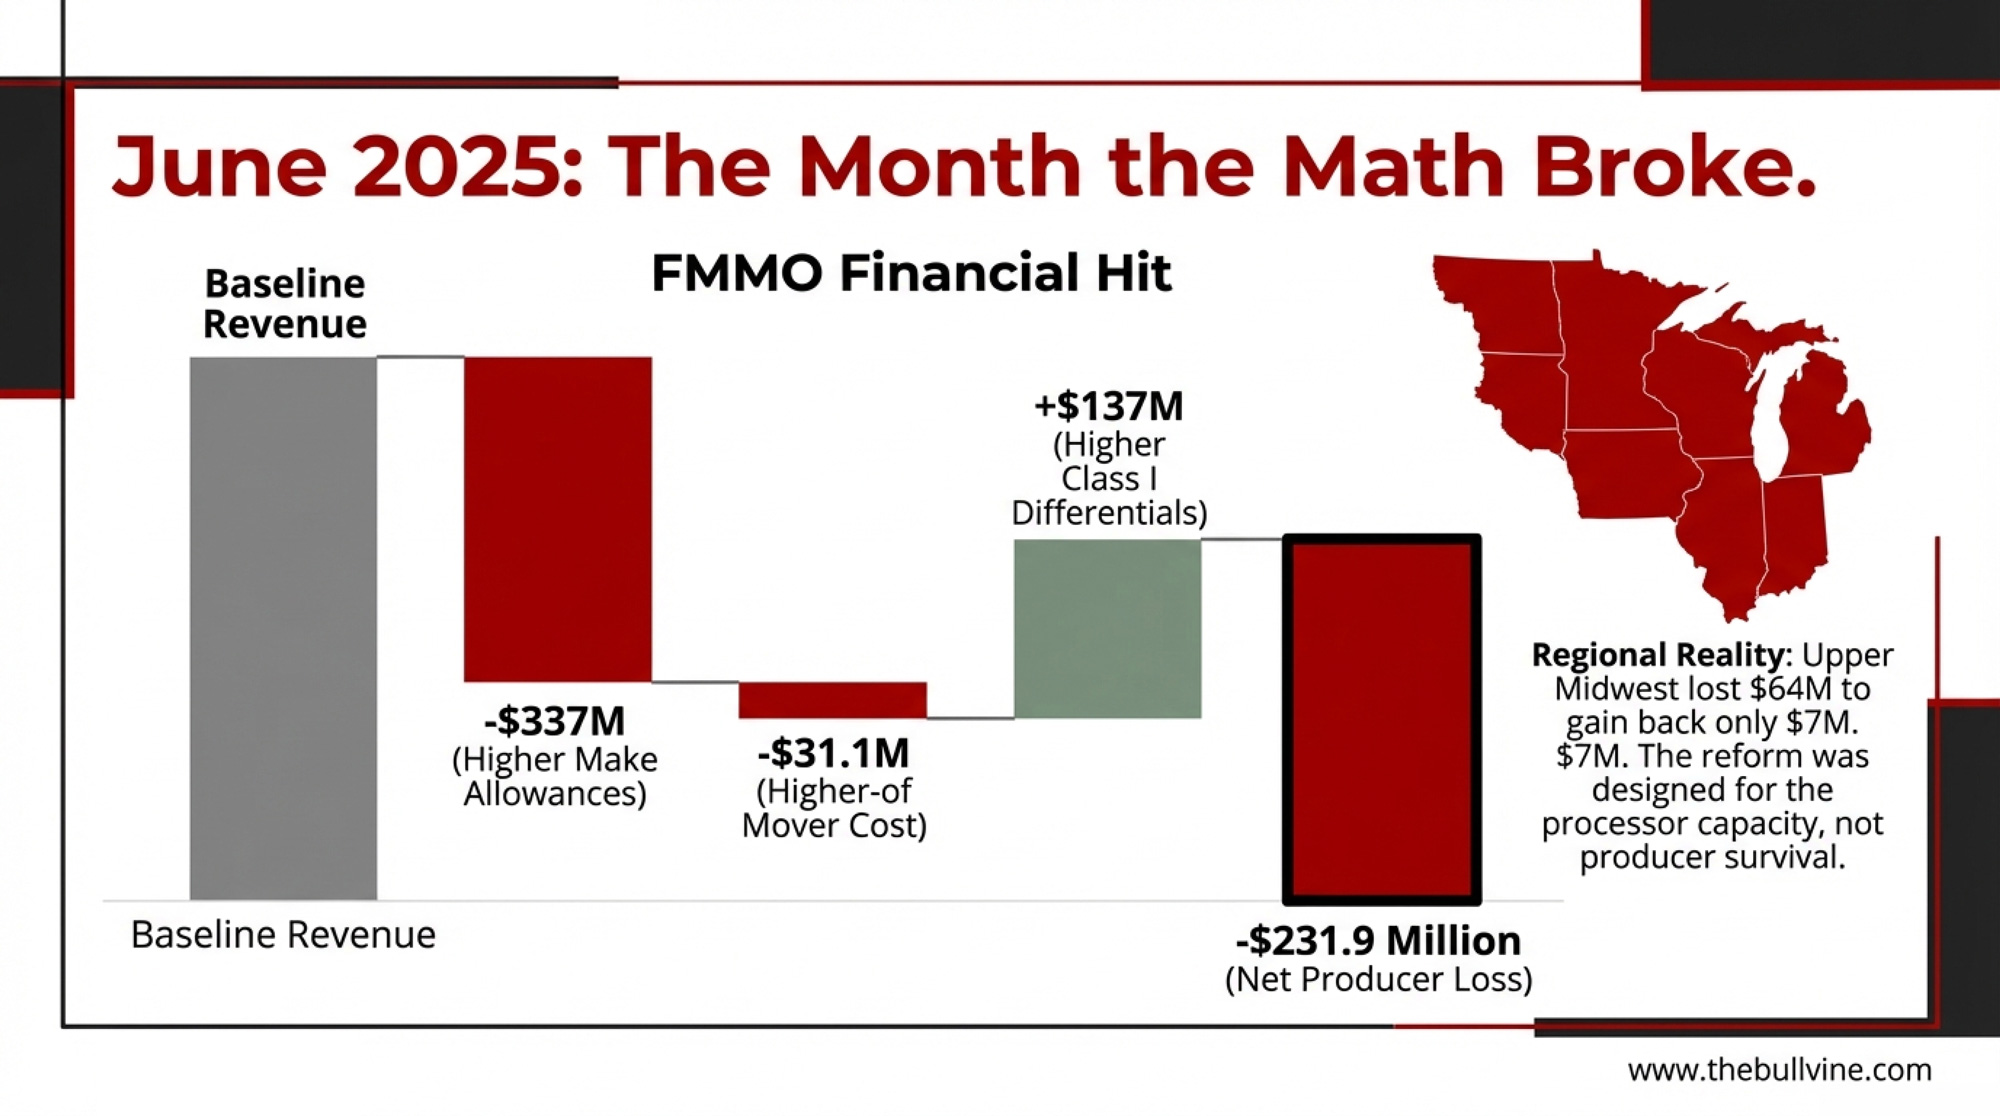
- Make allowances, cut $337 million from pool revenues — class prices dropped 85 to 93 cents per hundredweight.
- Higher Class I differentials clawed back $137 million — but the skew was sharply regional.
- Higher-of mover costs $31.1 million versus the old formula in calm markets
- Net result: $231.9 million less in producer pool revenues across all 11 orders
The regional breakdown is where this gets personal: The Upper Midwest lost $64 million in make allowance costs and recovered just $7 million in differentials — the widest gap of any order with complete data. California: $55 million out, $7 million back. The Northeast fared comparatively better — $62 million in losses but $34 million in differential recovery — because it carries the highest Class I utilization among the large orders. Cooperatives in the Northeast, where Class I utilization is highest, have pointed to the differential recovery as partial validation. The Mideast recovered $30 million in differentials, but AFBF didn’t break out its individual make allowance hit.
| Federal Order | Make Allowance Cost | Differential Recovery | Net Impact | Per-Cwt Effect |
|---|---|---|---|---|
| Upper Midwest | -$64M | +$7M | -$57M | -$0.86 |
| California | -$55M | +$7M | -$48M | -$0.73 |
| Northeast | -$62M | +$34M | -$28M | -$0.42 |
| Mideast | Not disclosed | +$30M | Unknown | — |
| All Orders | -$337M | +$137M | -$231.9M | -$0.35 avg |
Yager’s herd sits in that Upper Midwest order — where producers absorbed the largest make allowance hit of any region. Sixty-four million out, roughly a dime on the dollar back. The reform was designed to help processors invest in capacity. It wasn’t designed for a 275-cow Mineral Point operation.
Dairy economist Calvin Covington confirmed the Southeast will see the “majority of benefit” from updated differentials, with composition factors adding about 35 cents per cwt to Class I prices in the southeastern orders still using fat/skim pricing.
University of Minnesota dairy economist Marin Bozic offered a contrarian read to Brownfield Ag News in January 2025: he expects more milk to be pooled under the new formulas, not less, because “the processors have stronger incentives to bring that milk to the pool to try to get a piece of the producer price differential and forward that to their patrons”. Over-order premiums, in his view, “will come back.” Worth watching — but not here yet.
The 2024 Recovery That Wasn’t
Total U.S. fluid milk sales rose in 2024 — the first year-over-year gain since 2009. USDA AMS in-area route sales showed roughly 0.5%; ERS total estimates ran closer to 0.6–0.8%.
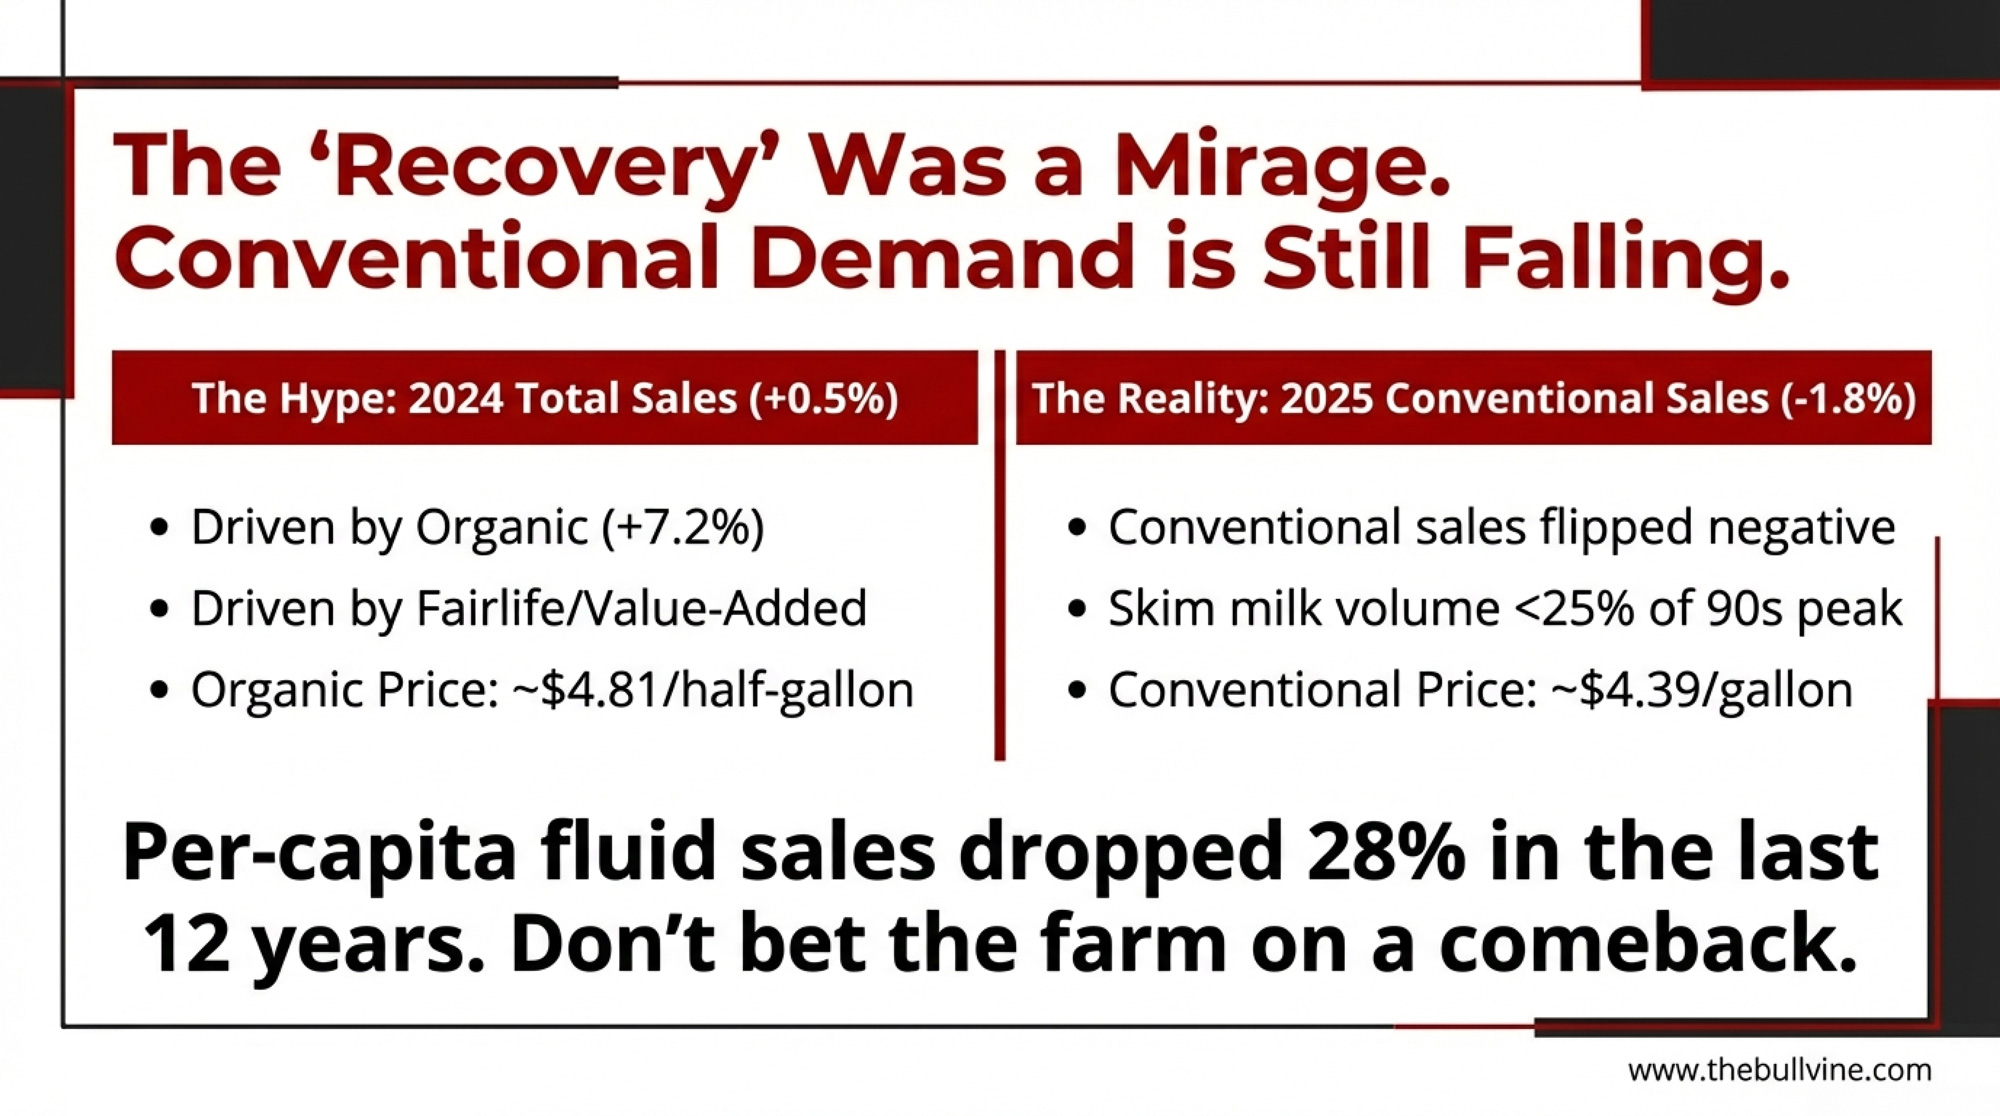
Dig into the segments, and the optimism fades. Whole milk topped 15 billion pounds, up 1.6% — first time since 2007 outside the COVID-era spike. Organic rose 7.2% to approximately 3 billion pounds. Value-added products like fairlife kept climbing. But reduced-fat (2%) fell 4.4%. Skim sits at less than a quarter of its late-1990s peak.
None of those growth segments is cheap milk. Conventional whole averaged a record $4.39 per gallon in 2024 — up 5 cents from 2023, based on federal order market administrator surveys across 30 cities (Hoard’s Dairyman, January 22, 2025). Organic whole averaged $4.81 per half gallon. More than double conventional on a per-gallon basis.
Karen Gefvert of Edge Dairy Farmer Cooperative called it: the increase “was not significant, and is likely just sort of a pause in the inevitable continuous decline in fluid milk sales”.
She was right. By February 2025, USDA AMS monthly data showed total sales down 2.2%, year-to-date down 1.3%. First-half 2025: down 0.5% on a leap-day-adjusted basis, totaling 21.1 billion pounds. November 2025: total fluid down 1.8%, conventional down 1.5%, organic down 6.0% (USDA AMS, January 2026).
Per-capita sales dropped 20% over 35 years from 1975 to 2010. Then fell another 28% in just the next 12 (from USDA data). The acceleration matters more than any single-year recovery.
The $7 Billion Brand Your Checkoff Built — for Coca-Cola
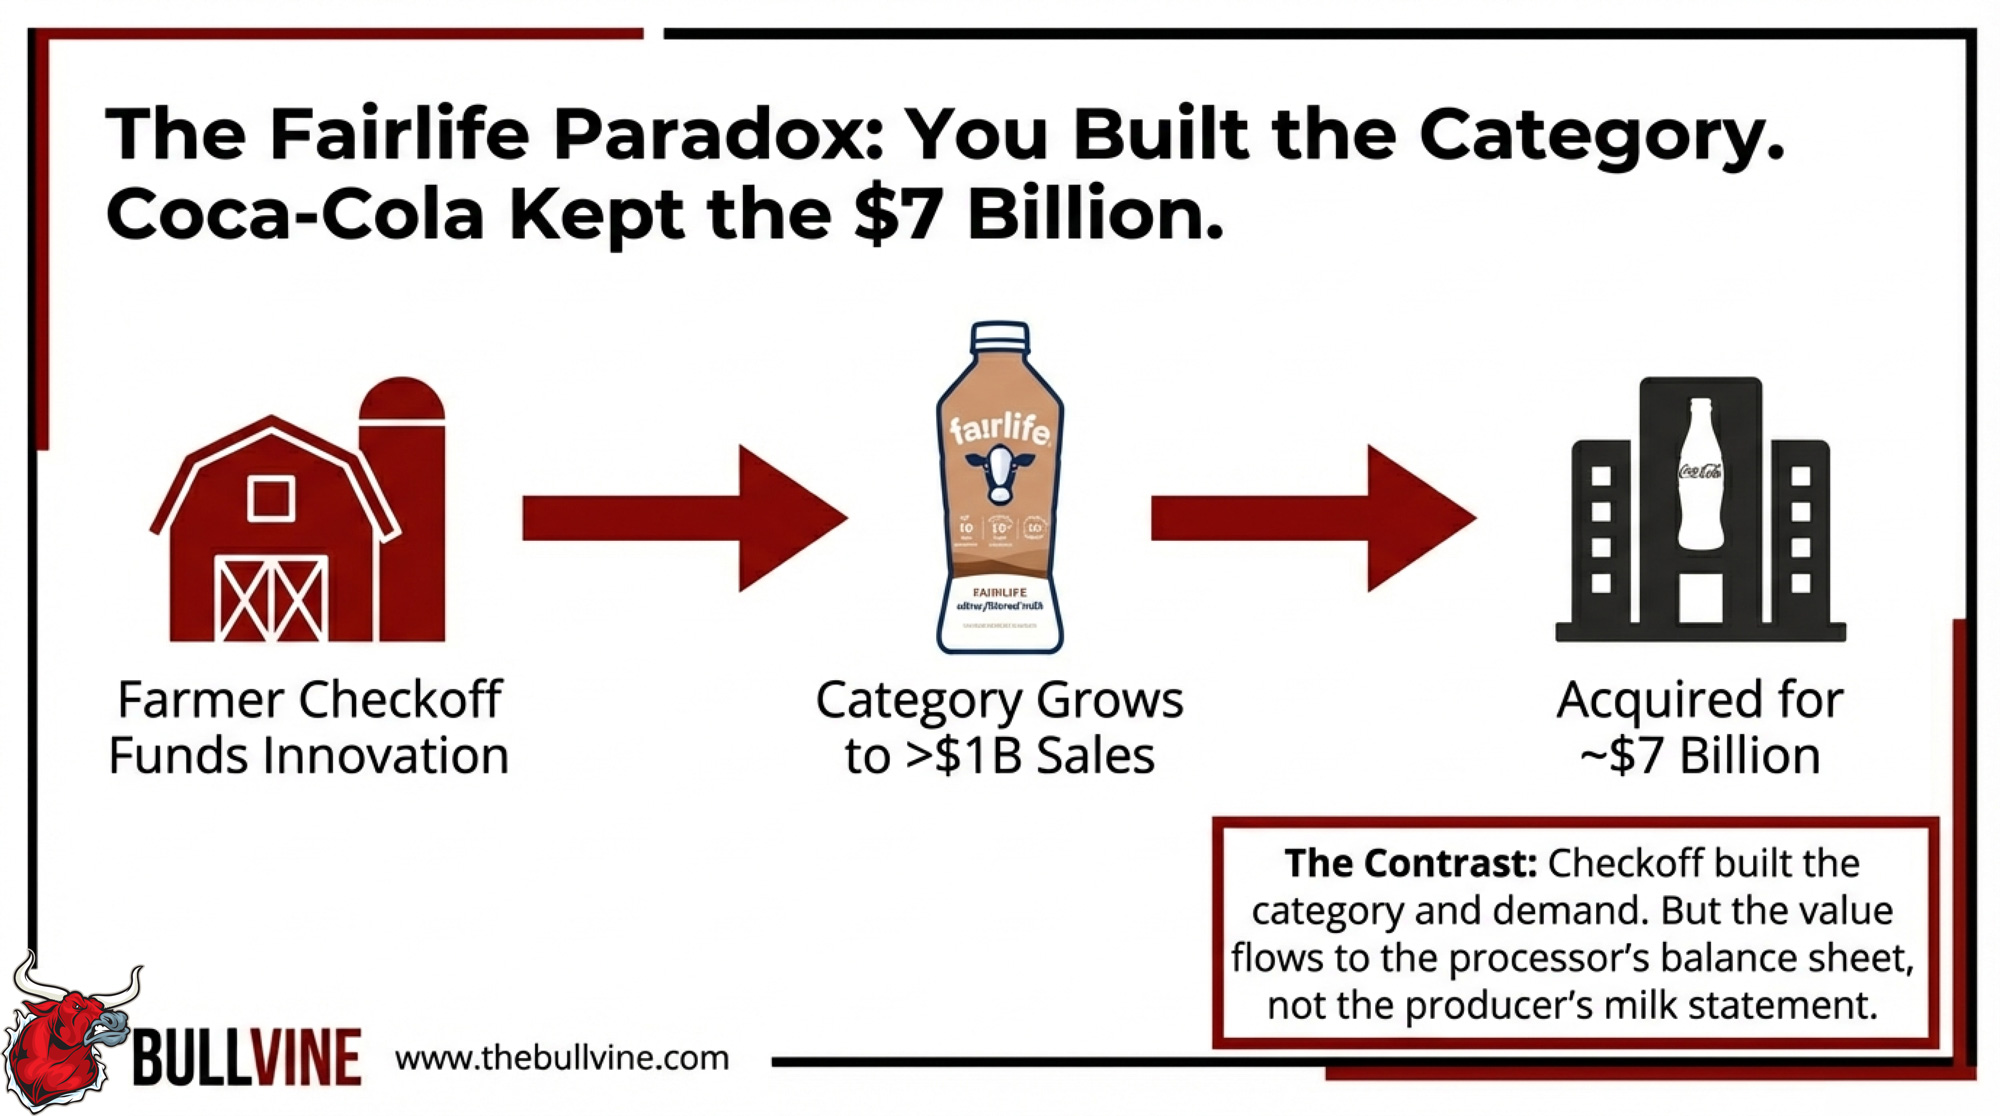
No brand illustrates the value-capture gap more clearly than fairlife. Mike and Sue McCloskey — dairy farmers who built Fair Oaks Farms in Indiana — co-developed ultrafiltration technology with Select Milk Producers in a joint venture with Coca-Cola. Launched nationally in 2014. Coca-Cola acquired full ownership in 2020. By early 2025, the total cost, including performance-based earnouts, reached approximately $7 billion. Fairlife surpassed $1 billion in annual retail sales by 2022.
The new $650 million fairlife plant in Webster, New York creates real volume demand for area producers. But the brand premium that makes fairlife a multi-billion-dollar asset flows to Coca-Cola shareholders—not back to the producers whose assessments helped build the fluid milk innovation category.
That’s by design. Commodity promotion builds the category. The market decides who captures margin. Understanding the difference isn’t cynicism — it’s information you need to make better decisions about where your own operation captures value.
Do Consumer Campaigns Actually Move Gallons?
The foodservice partnerships bypass consumer persuasion entirely — dairy gets engineered into products people already order. That mechanism has tight evidence behind it.
Consumer-facing campaigns are a different story. DMI’s Dairy Diaries Roku series reported 52% of viewers left with a “very favorable” opinion of dairy. No purchase behavior data published. Got Milk? achieved massive awareness over three decades, while per capita consumption declined each year. Views aren’t gallons.
DMI CEO Barbara O’Brien cited a 2025 back-to-school activation that “generated 1.5% sales growth in participating markets” (DMI, November 2025). If that comes with a published methodology and proves replicable, it’s genuinely meaningful. As of February 2026, DMI hasn’t released methodology, market definitions, or measurement periods for that claim.
Four Moves for Fluid-Dependent Operations
The checkoff ROI conversation matters. But you can’t wait for Washington or Rosemont to fix your milk check. Here are four things within your control.
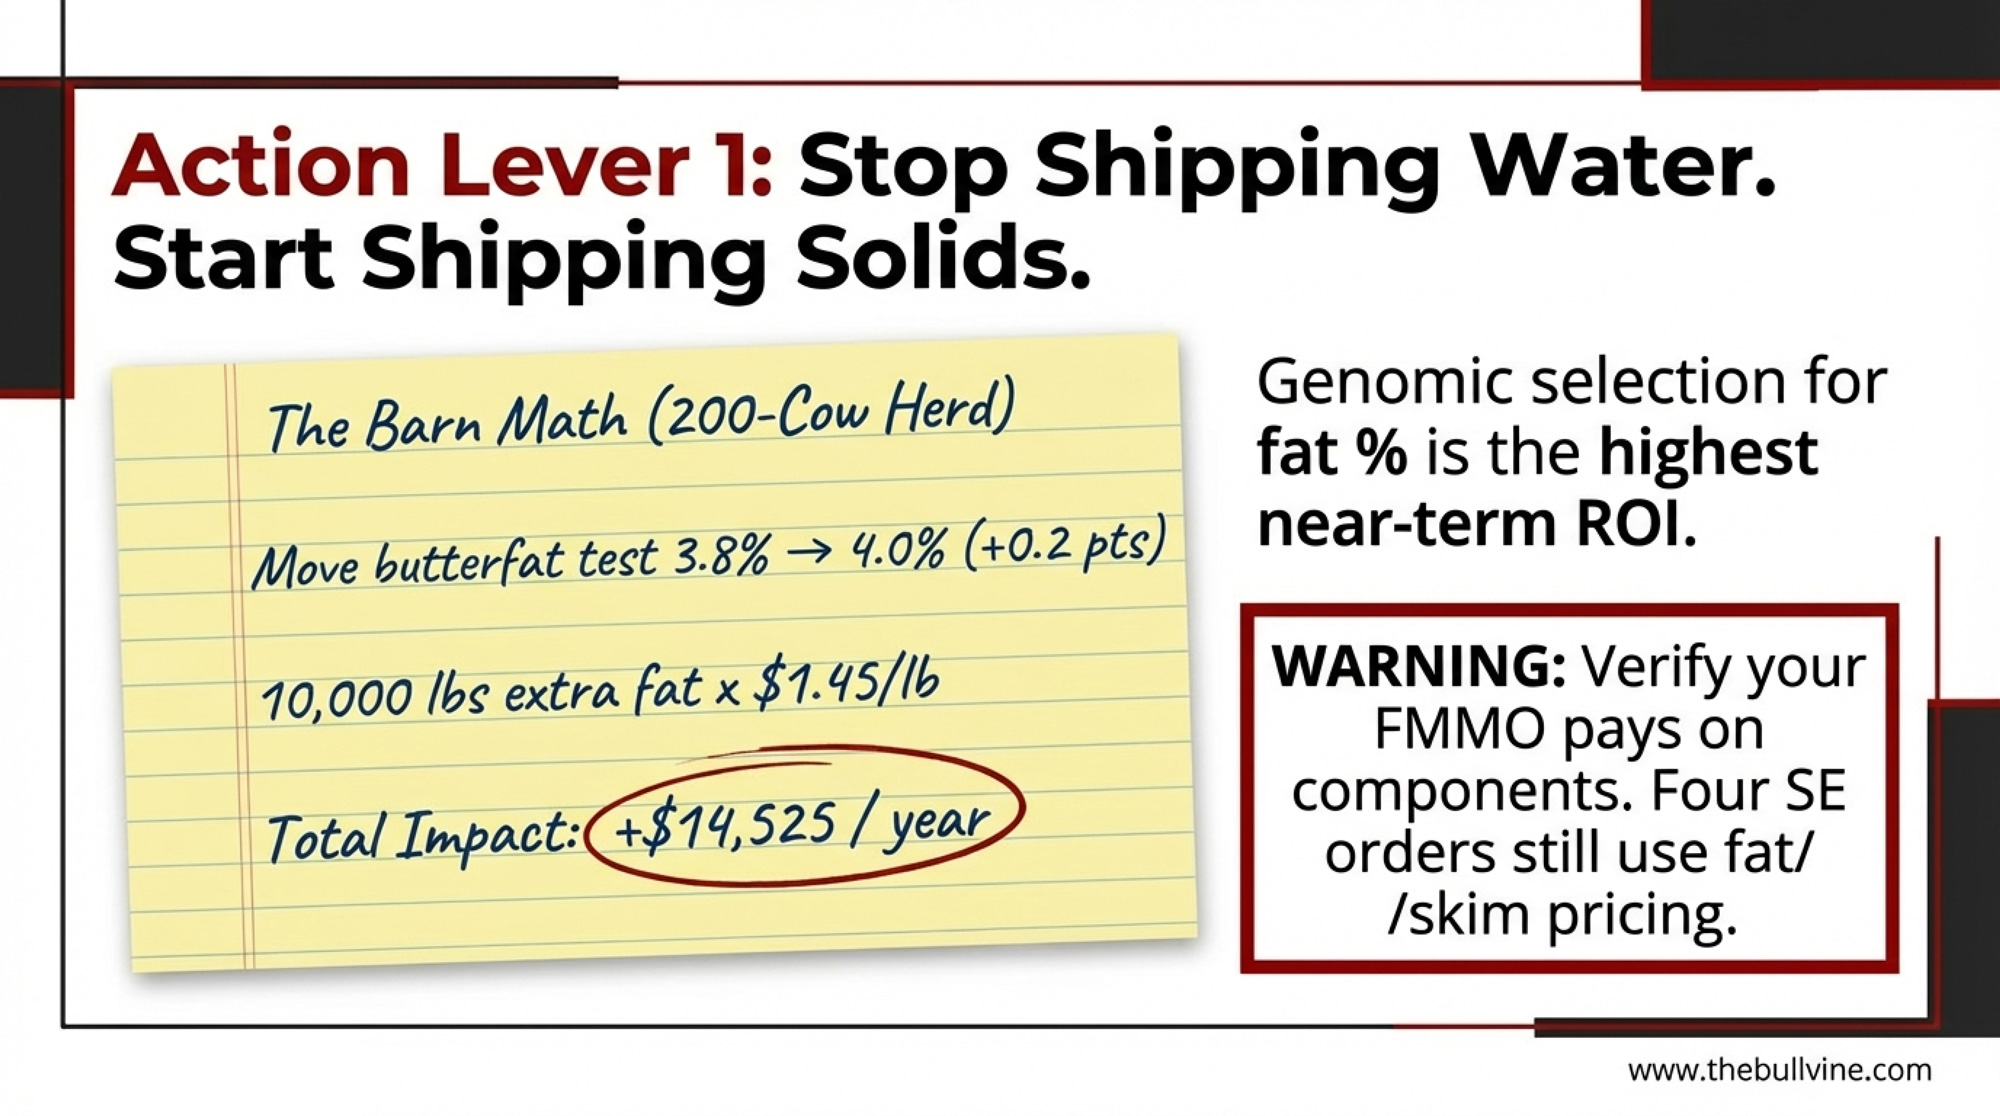
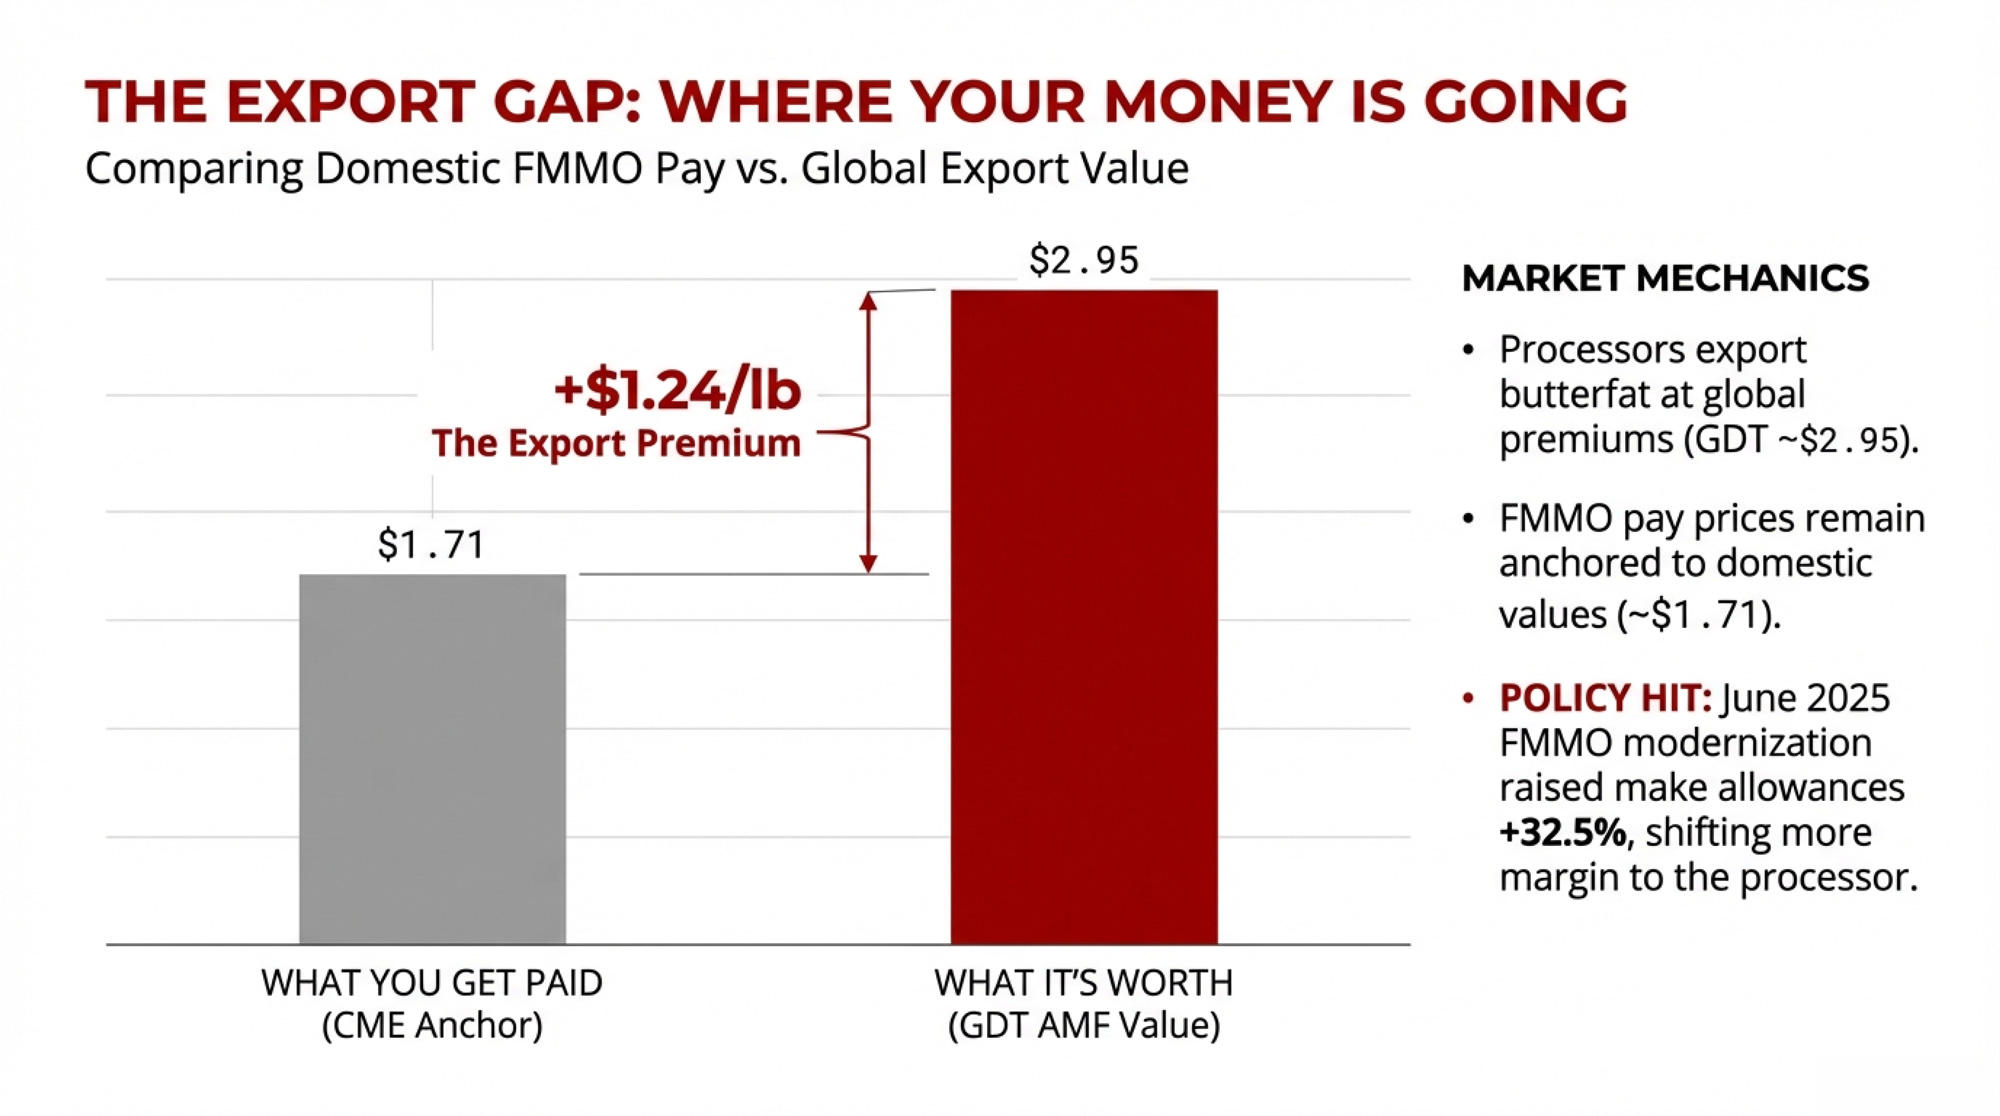
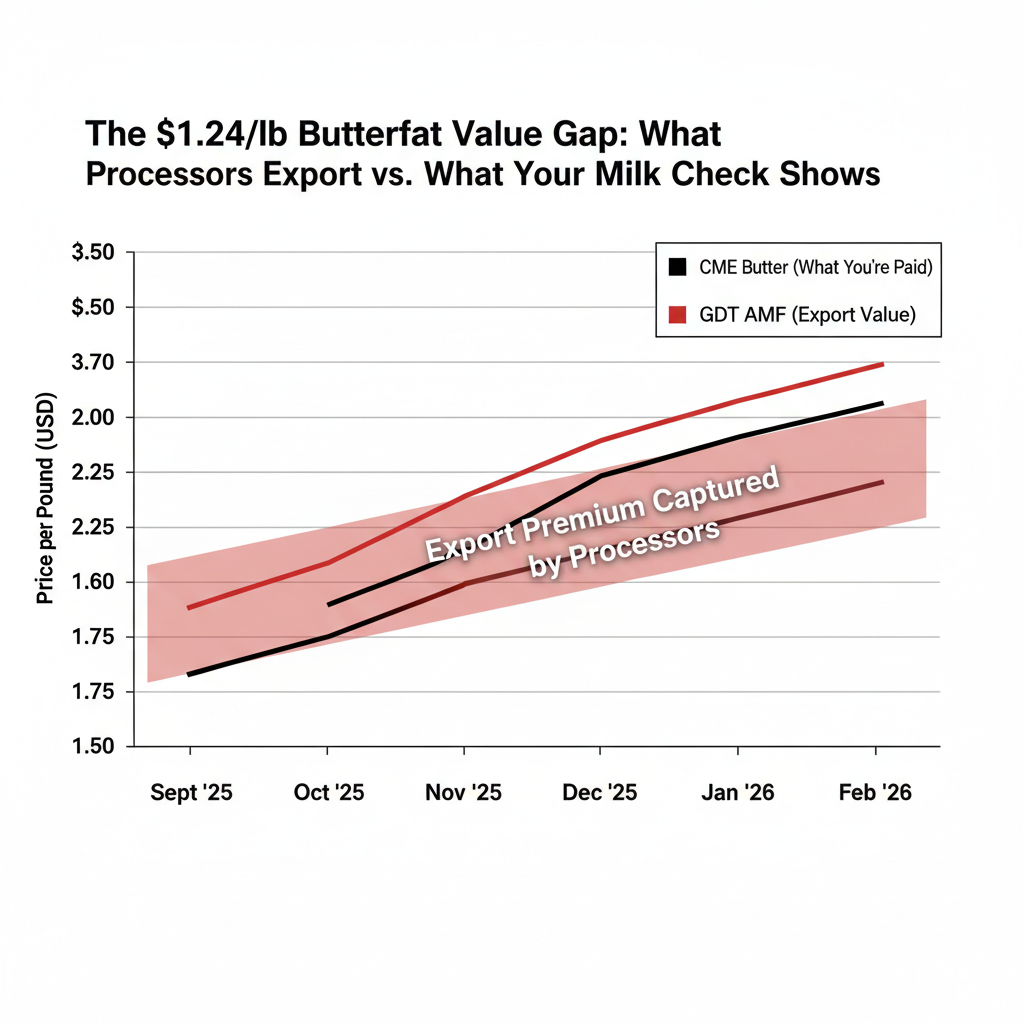
1. Push your components higher. The federal order butterfat price averaged $2.44/lb across 2025, though it dropped sharply from $2.95/lb in January to $1.58/lb by December (USDA AMS). Even at January 2026’s $1.4525/lb, the math on a 0.2-point test improvement is significant. Here’s the walkthrough for a 200-cow herd:
Added butterfat (lbs):Cows × lbs per cow × Butterfat test increase
At current prices:
200 cows × 24,000 lbs × 0.002 × $1.45
Annual value at 2025 average:Added butterfat lbs × $2.44
Plug in your own test numbers. National test climbed from 3.8% to 4.33% between 2015 and March 2025 across FMMO-pooled milk. The genetics are already moving — but the dollar value swings hard with the commodity market. Butterfat dropped 46% in 12 months.
| Scenario | Baseline Test | Improved Test | Annual Gain (200 cows) |
|---|---|---|---|
| Current BF Price ($1.45/lb) | 3.9% | 4.1% | $14,525 |
| 2025 Avg BF Price ($2.44/lb) | 3.9% | 4.1% | $24,400 |
| Annual Production | — | — | 5M lbs (25,000 lbs/cow) |
| BF Increase (lbs) | — | 10,000 lbs | +0.2 pts × 5M lbs |
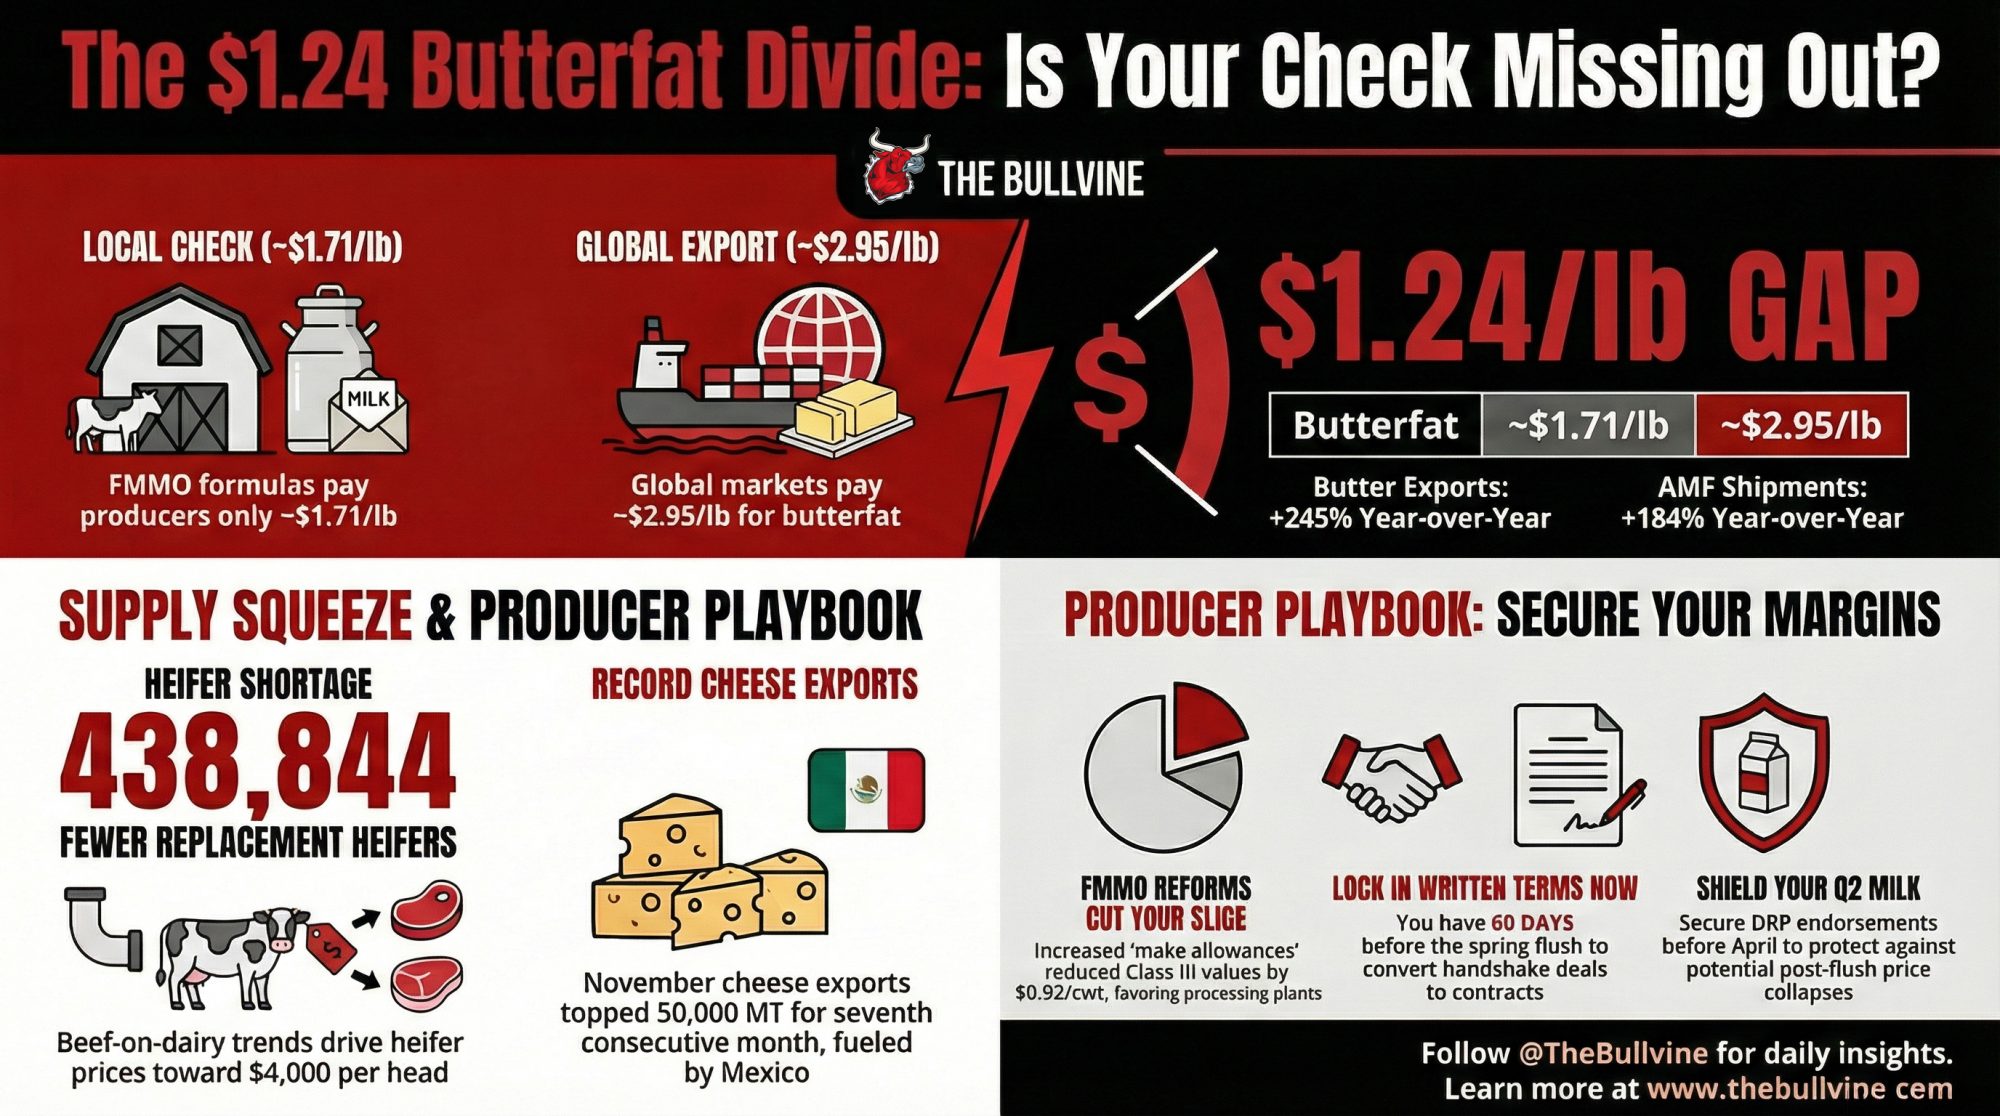
- Trade-off: Four FMMOs (Arizona, Florida, Southeast, Appalachian) still use fat/skim pricing rather than full MCP. Check your milk statement before investing in genomic shifts. Component premiums move with commodity markets, not just with your cows. (See The Bullvine’s analysis of why FMMO math pays $1.71/lb while global markets hit $2.95.)
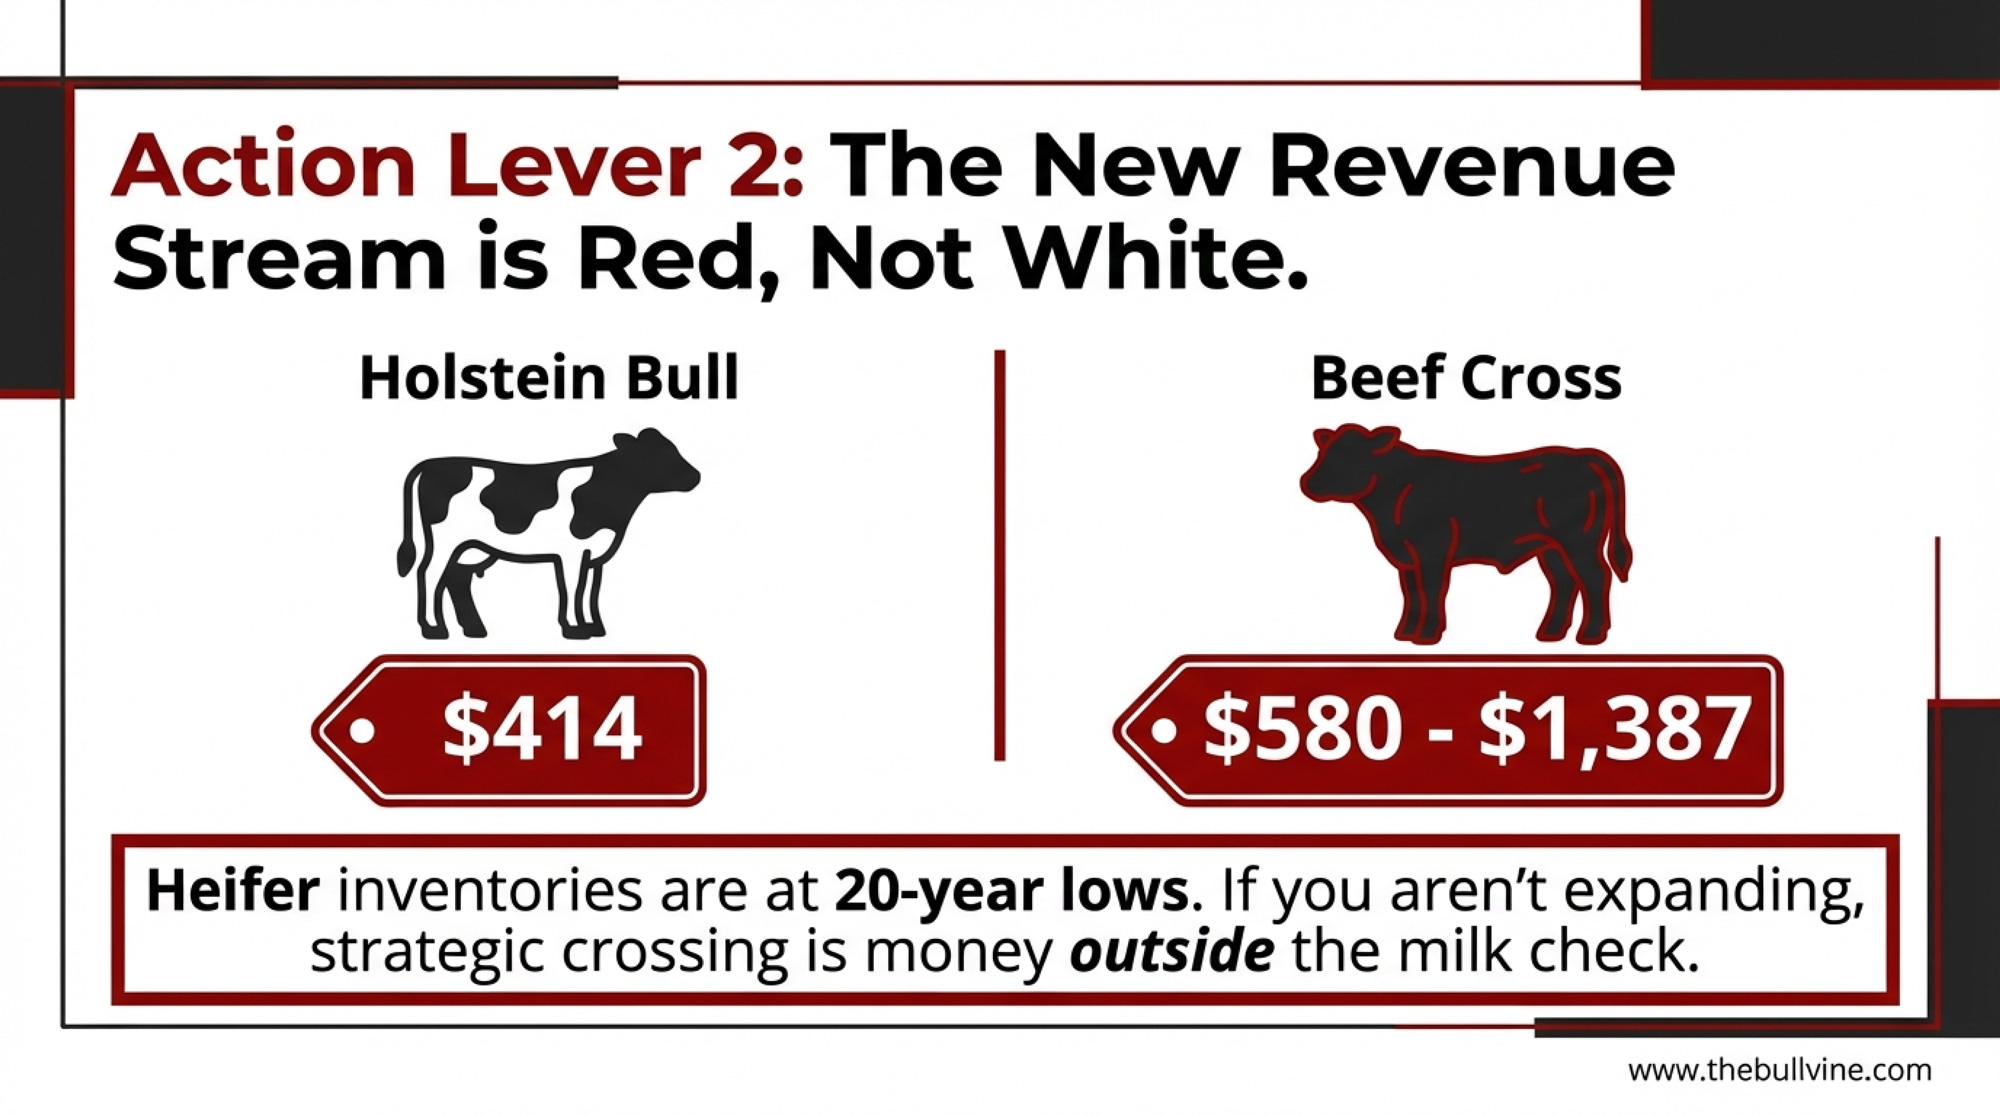
2. Run the beef-on-dairy math. Beef cow inventory has been down for six consecutive years since the 2019 peak (Hoard’s Dairyman, March 30, 2025). Dairy-beef crosses keep commanding wider premiums. New Holland in late January 2025: crosses at $675/head versus $414 for straight Holstein bulls — a $261 premium. By September average prices of $1,400. February 2026 auctions: crossbred bull calves at $7.75–$18.50/lb, meaning a 75-lb calf can clear $580–$1,387 (Edgewood Livestock, February 3, 2026).
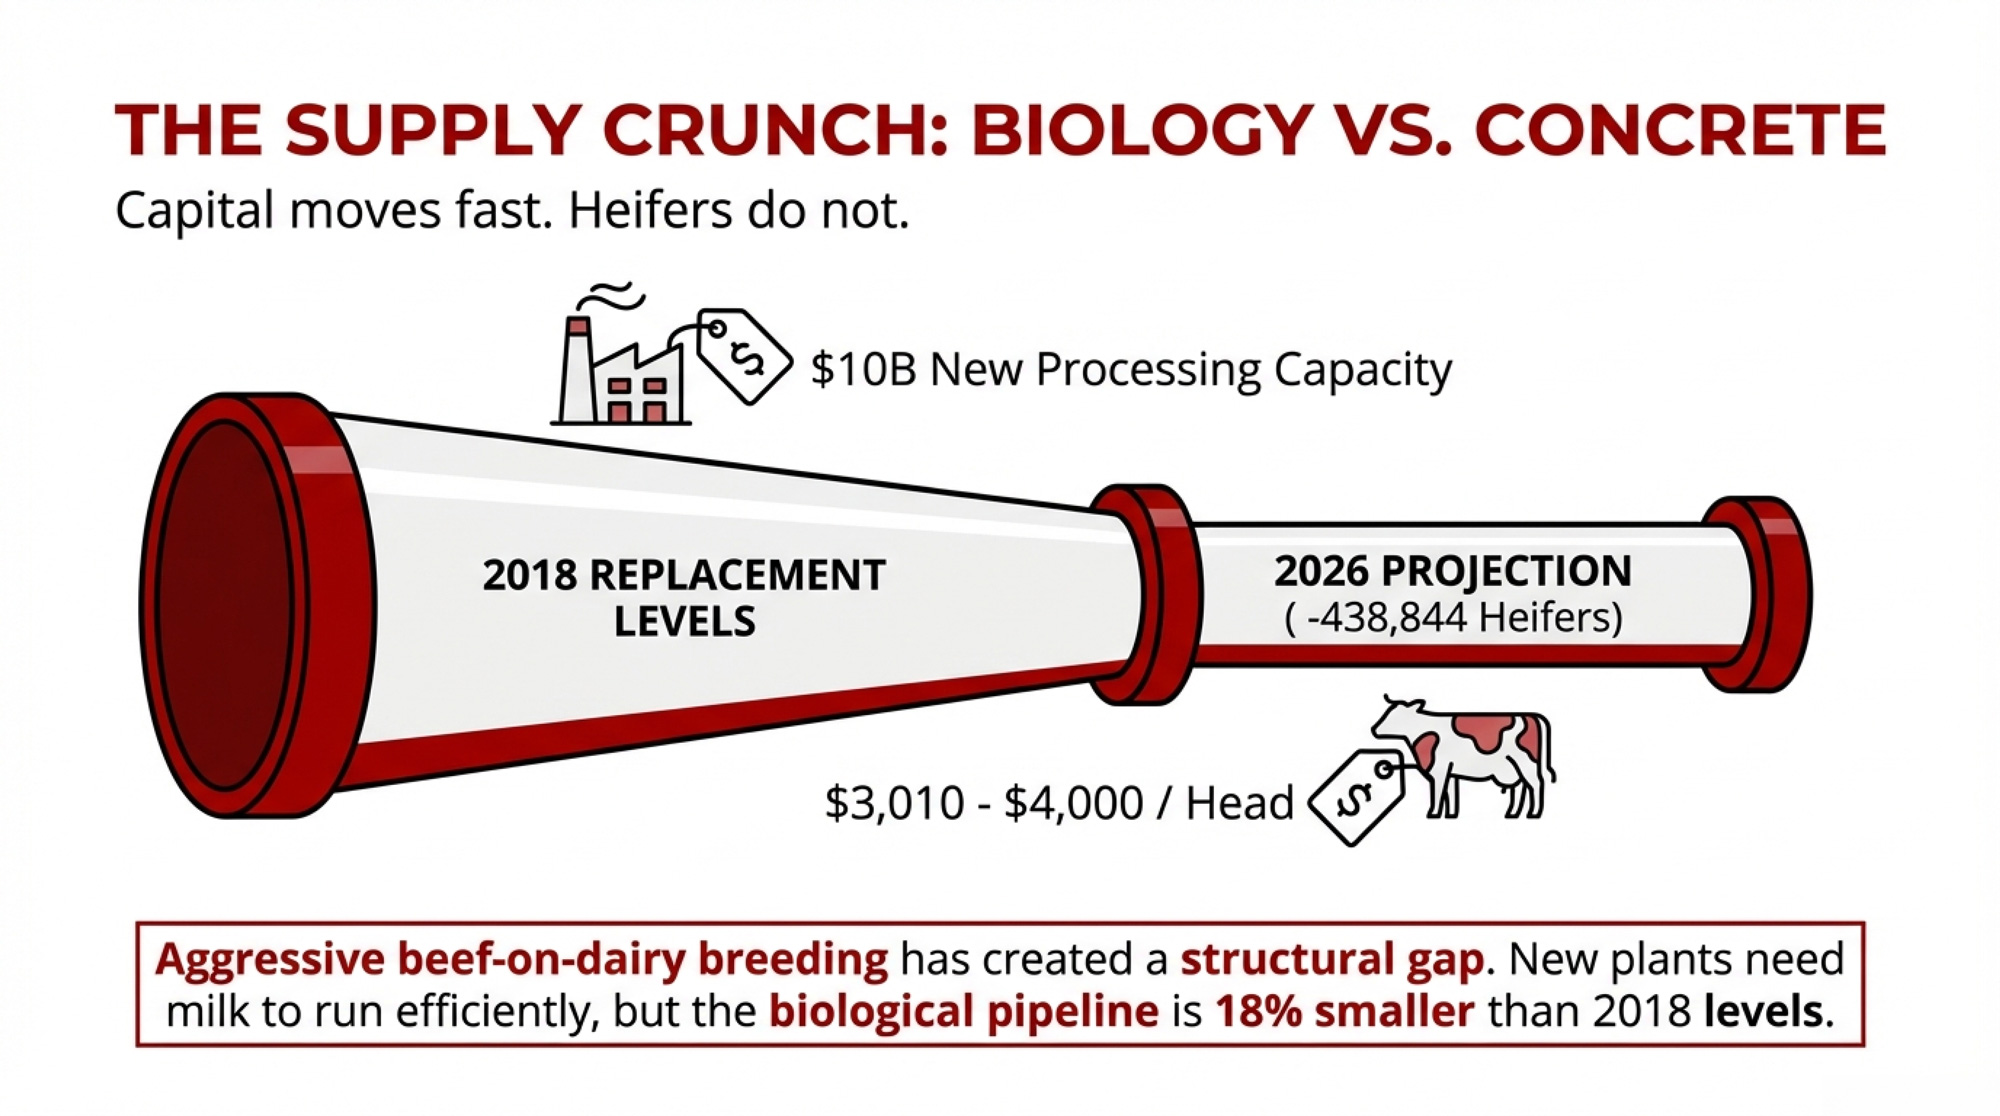
- Trade-off: Dairy heifer inventories have fallen for six consecutive years to their lowest in 20 years. The crossbreeding trend “suggests that the heifer shortage will continue for years”. Only makes sense if you’re not expanding.
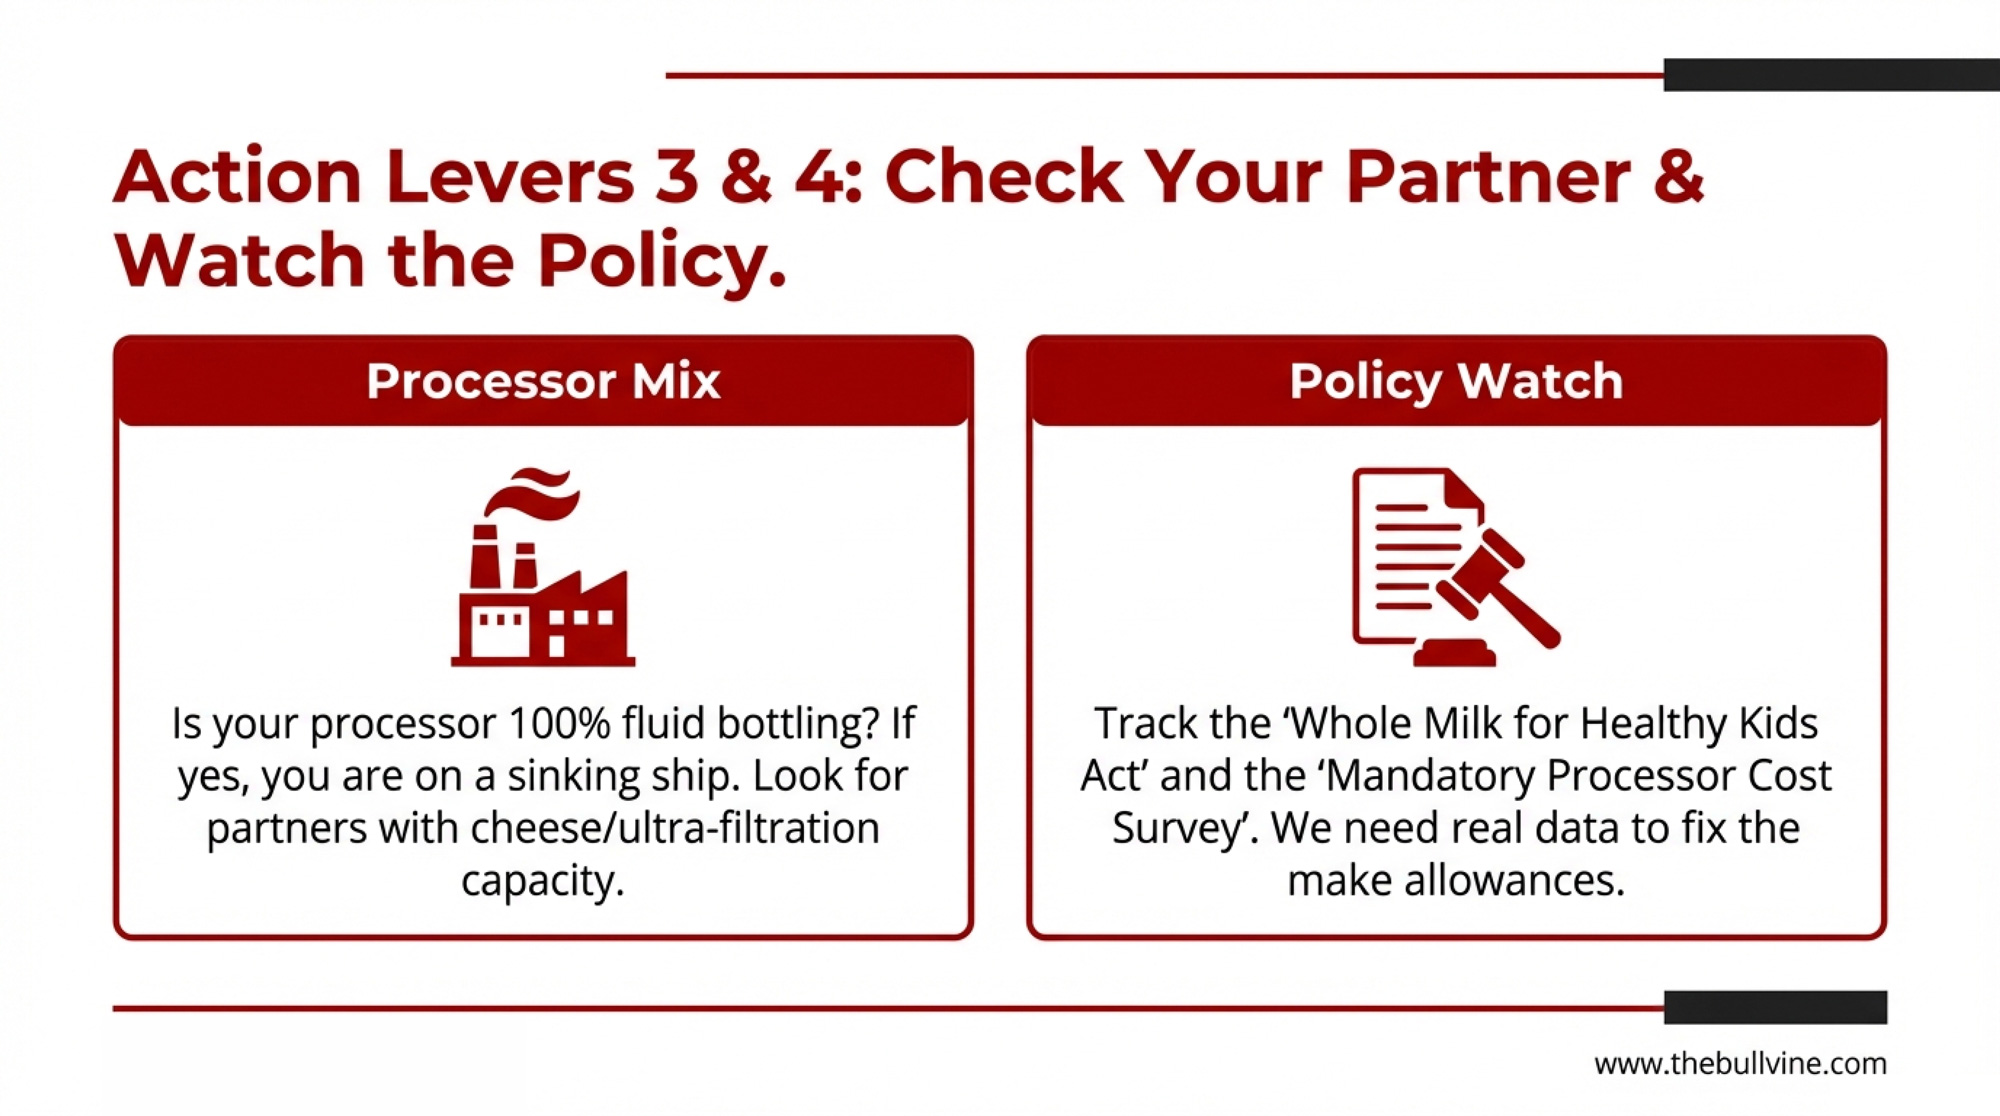
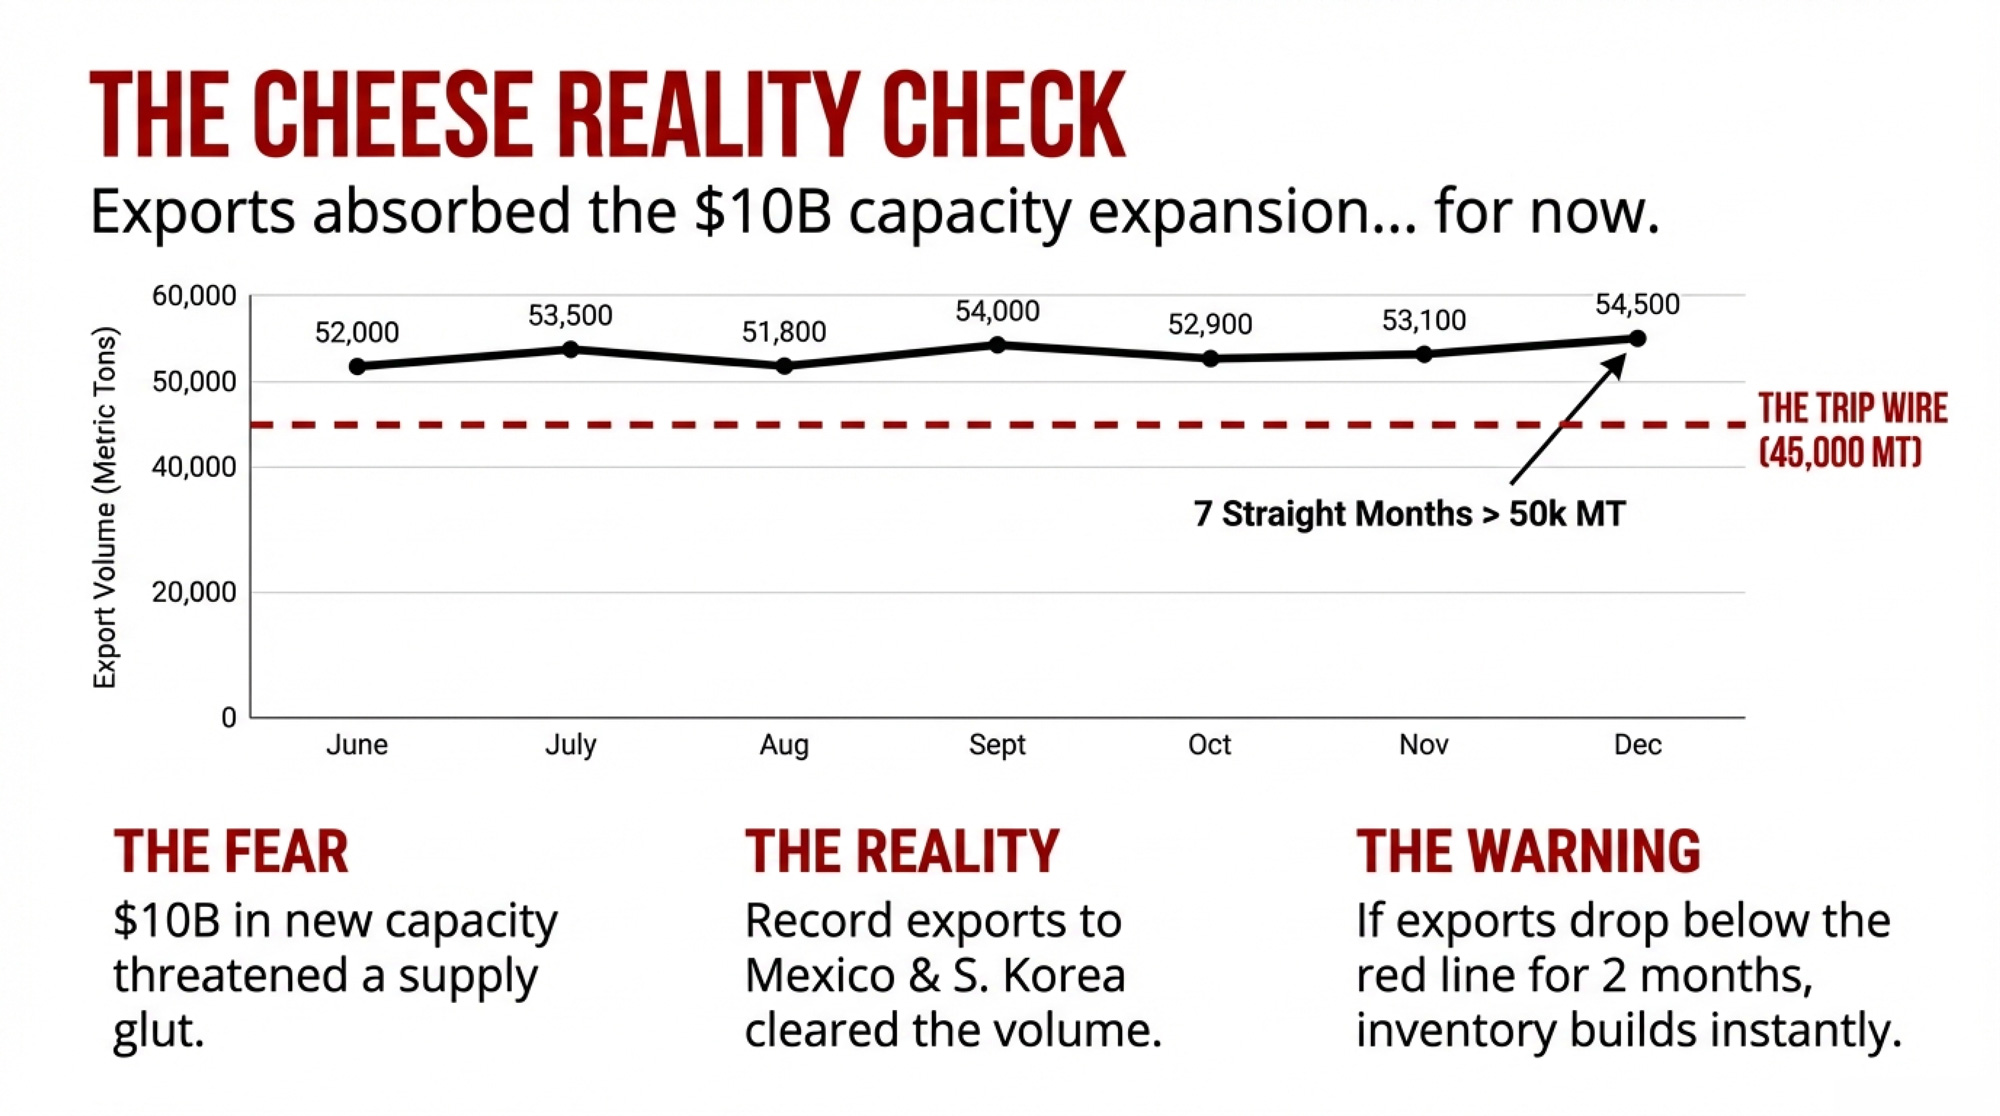
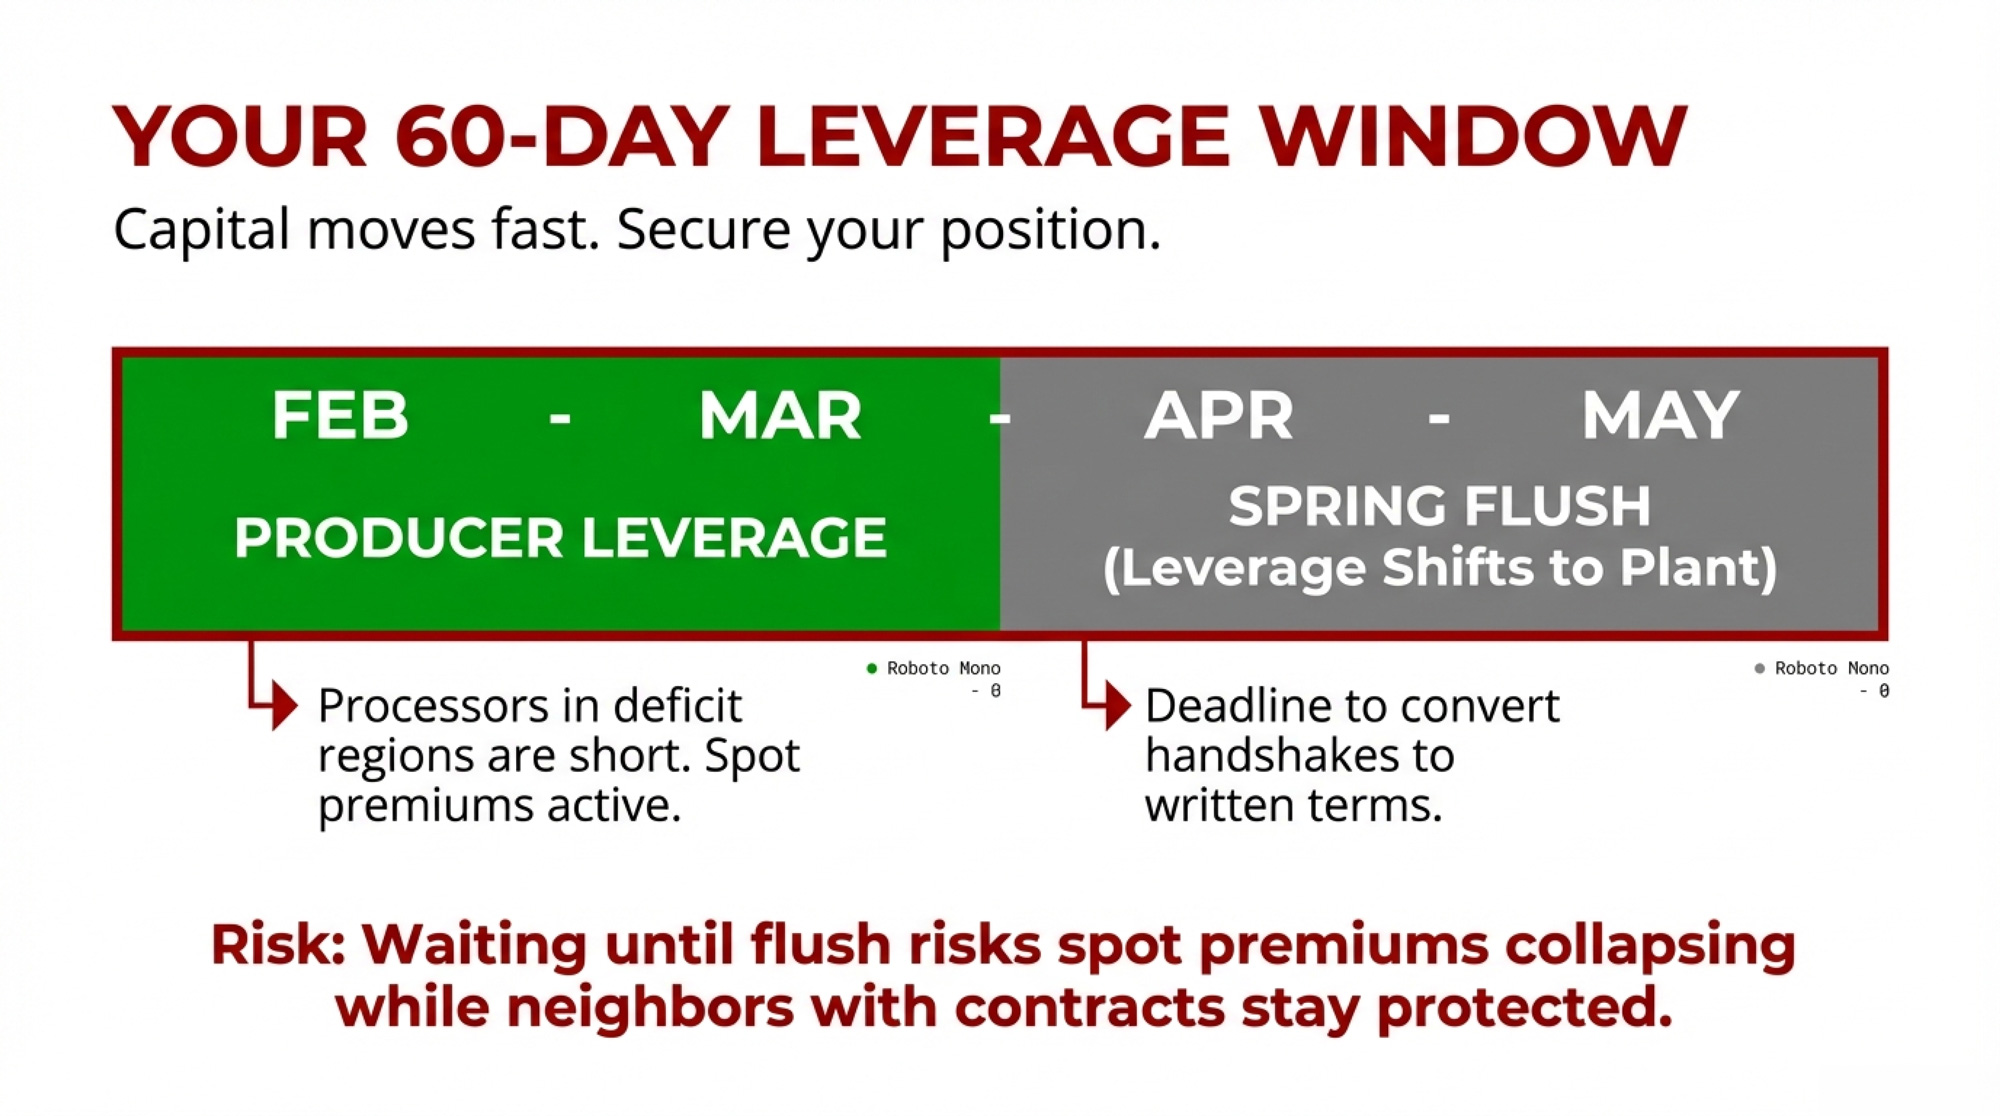
3. Know your processor’s product mix. New cheese and ultra-filtration capacity is expanding — Coca-Cola’s fairlife plant in Webster, plus investments by California Dairies Inc. and Darigold. The new make allowance structure “suggests that cheese production should pick up”. If your current processor is a fluid bottler with declining volumes, your milk market is shrinking regardless of what DMI does. Ask yourself: has your processor’s fluid volume declined for three consecutive years? Regardless of the percentage, that’s a trend, not a blip. Worth a conversation with your cooperative board.
- Trade-off: Switching cooperatives means potentially losing patronage dividends, equity credits, or hauling arrangements. Compare the full package — not just the base price on your stub.
4. Track the Whole Milk for Healthy Kids Act. Schools account for about 8% of U.S. fluid milk, amounting to roughly $1 billion per year (Dairy Reporter, April 2025). Real volume. But student consumption has been declining for years, and access alone doesn’t change habits. Watch the data as implementation rolls out.
What This Means for Your Operation
- If you ship more than 60% Class I and your cooperative’s utilization is declining, you’re on the wrong side of where checkoff value concentrates. The AFBF data shows the reform’s benefits are heavily skewed by region — California and the Upper Midwest gained just $6–$8 million in differentials, while $55–$64 million in make allowance losses were incurred. Run the net math for your order before assuming you came out ahead.
- If your herd butterfat averages below 3.9%, genomic selection for fat percentage likely offers the highest near-term ROI on this list. The walkthrough above shows a 200-cow herd gaining $14,525–$24,400 annually on just 0.2 points of test — but verify your cooperative pays component premiums. Four southeastern orders still don’t. And butterfat dropped from $2.95 to $1.45 in 12 months.
- If you’re evaluating organic, organic’s momentum stalled hard in 2025: after growing 7.2% in 2024, it edged up just 0.7% in the first half and, by November, was down 6.0% year-over-year. Run your three-year transition math against a stressed premium scenario, not just the current one.
- If you pay $7,500+ per year in checkoff, run Capps’ framework on your own herd: multiply your total hundredweights by $1.00 and compare to your annual assessment. That’s the best-case national model. Then ask what it looks like when Class I utilization drops another five points — because it’s heading that direction.
- If your cooperative votes on your behalf in FMMO proceedings, ask about the upcoming mandatory biennial processor cost survey required by the One Big Beautiful Bill Act. That survey could ground future make allowance decisions in verifiable data — the first structural fix to what AFBF called reliance on a self-selected sample of self-reported manufacturers’ cost data.
📊 Your Accountability Dashboard
| Metric | Source | Frequency | Something’s Working | Red Flag |
| Per-capita fluid decline rate | USDA ERS | Annually | Slows below 2% | Holds above 2.5% |
| Conventional fluid sales | USDA AMS | Monthly | Stabilizes within -0.5% | Keeps falling 1–3%+ |
| DMI campaign sales lift | DMI annual reports | Annually | 1.5%+ lift replicated with methodology | One-time claim, never verified |
| Class I utilization | FMMO market administrator | Monthly | Holds above 25% nationally | Drops below 22% |
| FMMO reform net impact | AFBF Market Intel | Quarterly | Composition + differentials exceed make allowance losses | Net pool decline continues into 2026 |
| Processor cost survey | USDA (per OBBBA mandate) | Biennial | Published with transparent methodology | Delayed or limited scope |
If four or more flash red two years from now, the collaboration built awareness and trust — both valuable — but didn’t bend the structural curve.
Key Takeaways
- An independent Texas A&M analysis verifies the checkoff’s $6 billion. But 76% is exports and foodservice — overwhelmingly cheese demand that lifts Class III. Fluid milk innovation returned .68 per dollar over six years. If your revenue depends on Class I, you’re funding a system that works better for someone else’s milk. The data exists for you to measure that gap.
- The 2024 fluid recovery was in the premium segments, pulling the total above zero. Conventional kept eroding. By November 2025, total fluid was down 1.8%, organic down 6.0%. Don’t plan around a trend that lasted 12 months.
- Your checkoff dollars helped build the landscape fairlife rides — a brand Coca-Cola values at $7 billion. Understanding that the value-capture gap isn’t a frustration. It’s the starting point for figuring out where your own operation captures margin.
- The June 2025 FMMO reform hit producers with a net $231.9 million decline in pool revenue over three months. Benefits skewed heavily by region — the Upper Midwest order, where Yager milks lost $64 million and recovered $7 million. Know your order’s net math. Don’t assume the national story is your story.
- Component optimization can add $14,525–$24,400/year for a 200-cow herd that moves 0.2 points of test. Beef-on-dairy crosses are clearing $580–$1,387 per calf at February 2026 auctions. Neither requires waiting on Washington or your checkoff board. You’ve got levers. Use them.
The Bottom Line
Pull up your 2024 and 2025 year-end milk statements side by side. What changed? Where did your 15 cents go? When Yager asked that question on Brownfield last November, he was milking 275 cows and looking for answers. So are you. And here’s the thing — you’ve got the framework now. The math, the dashboard, the four strategies. The question isn’t whether the checkoff works in aggregate. It does. The question is whether it works for you, in your order, at your scale, with your product mix if the answer isn’t specific enough — from DMI, from your cooperative, from your own milk statement — that tells you exactly where to push next.
Complete references and supporting documentation are available upon request by contacting the editorial team at editor@thebullvine.com.
Learn More
- GT Thompson’s 2026 Farm Bill Math: DMC Pays Your 200‑Cow Dairy $1,800, Make Allowances Cut $42,240 – a 23 to 1 Hit – Arm yourself with the precise math required to navigate the 2026 Farm Bill’s hidden traps. This breakdown reveals why nominal DMC gains won’t offset make allowance losses and delivers a 90-day checklist to protect your cash flow.
- 2025 Dairy Year in Review: Ten Forces That Redefined Who’s Positioned to Thrive Through 2028 – Capture a long-term advantage by mastering the ten structural forces reshaping the industry through 2028. This analysis identifies the “triple cushion trap” and provides the strategic blueprint needed to outpace regional market volatility and high-cost hurdles.
- 9.57 Million Cows, 3.9 Million Replacements: Genetics Built This Dairy Herd Paradox – and 2027 Ends It – This feature reveals the genetic paradox threatening your expansion plans and unlocks a “longevity dividend” worth $8,510 per cow. Claim a competitive edge by identifying specific sire traits that generate mature-cow milk premiums while slashing your replacement bill.
 The Sunday Read Dairy Professionals Don’t Skip.
 The Sunday Read Dairy Professionals Don’t Skip.
Every week, thousands of producers, breeders, and industry insiders open Bullvine Weekly for genetics insights, market shifts, and profit strategies they won’t find anywhere else. One email. Five minutes. Smarter decisions all week.