Archive for debt service coverage ratio

Cornell Says 0.36×. Your Banker Says No. Welcome to Dairy Lending at 7% Money.

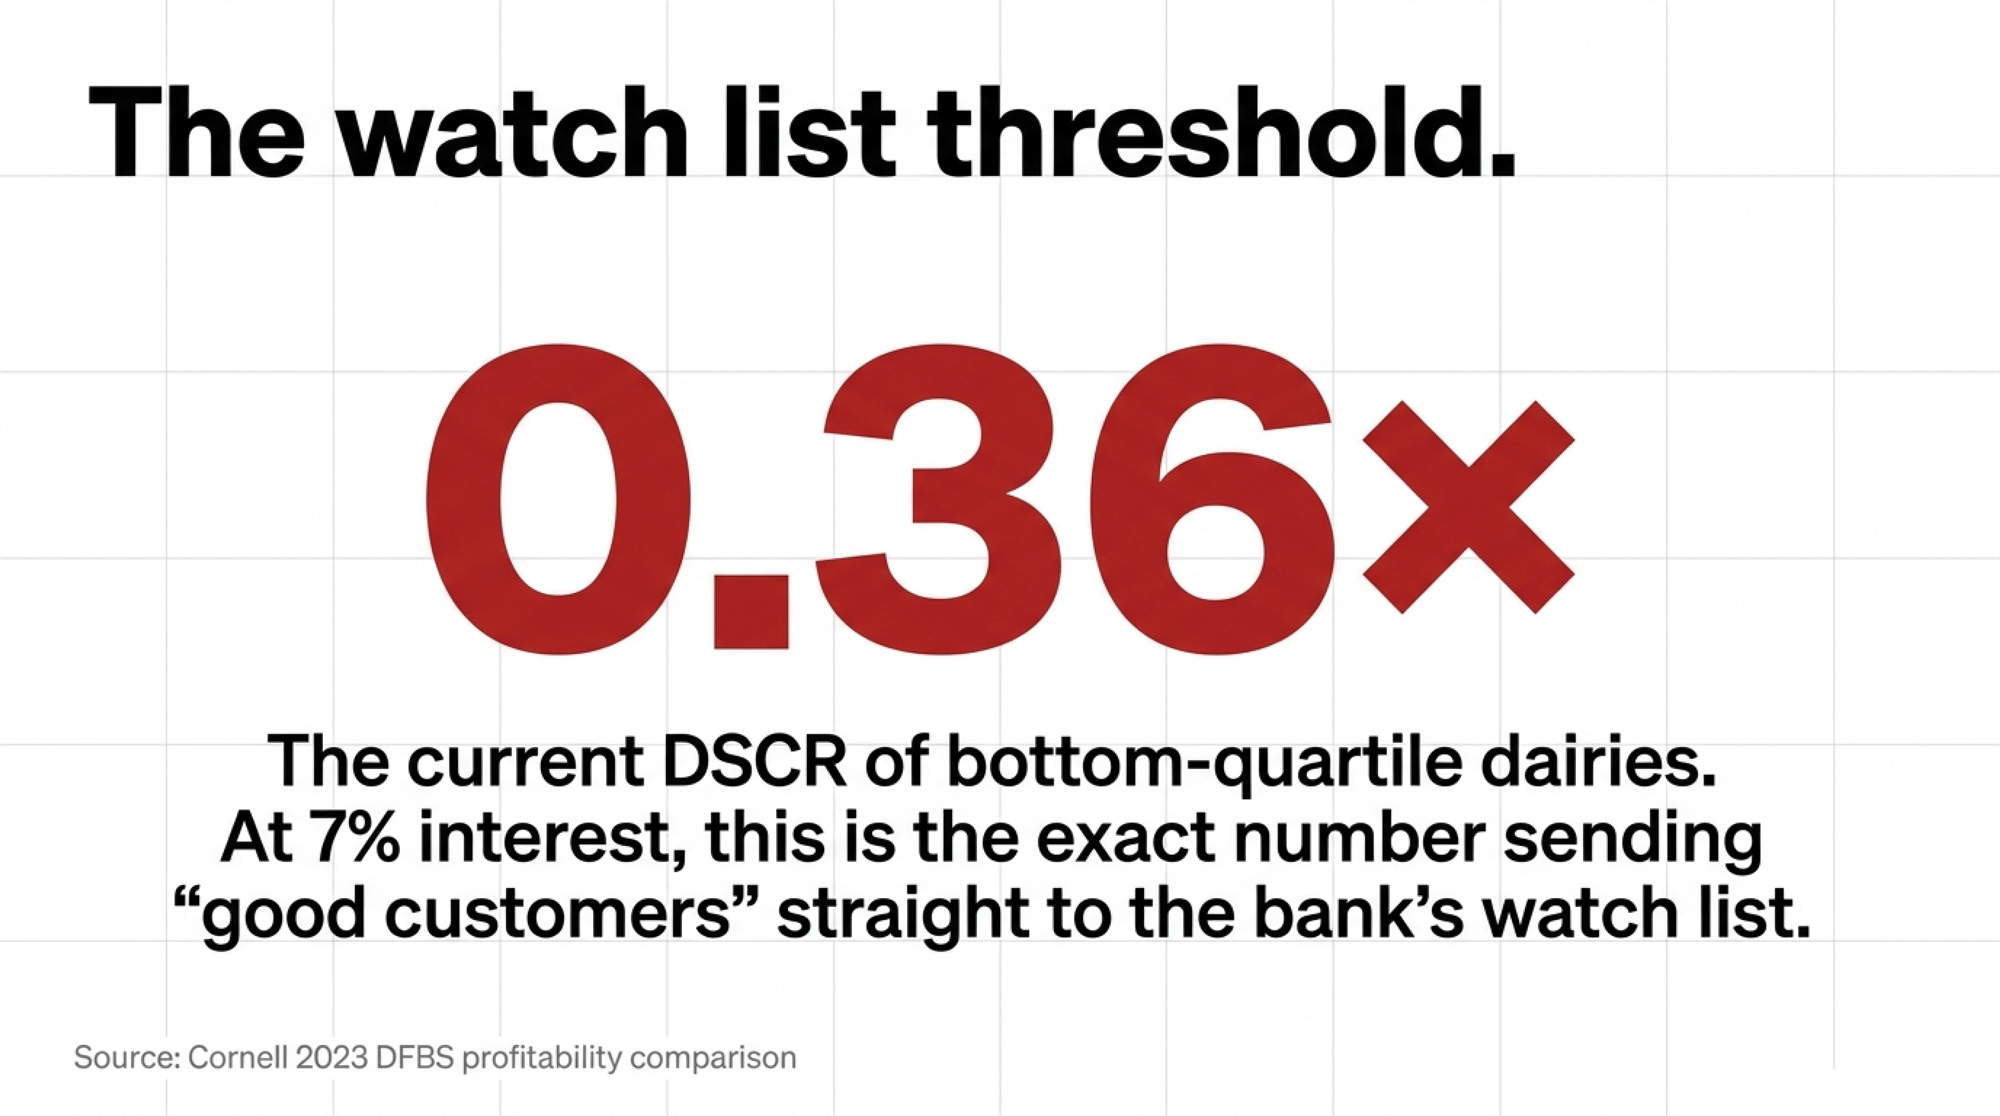
Cornell’s bottom‑quartile dairies sit at 0.36× DSCR. At 7% money on $4.5M of repriced debt, that’s about $118,000 more a year — and the reason your loan officer opened the laptop instead of the yellow pad.

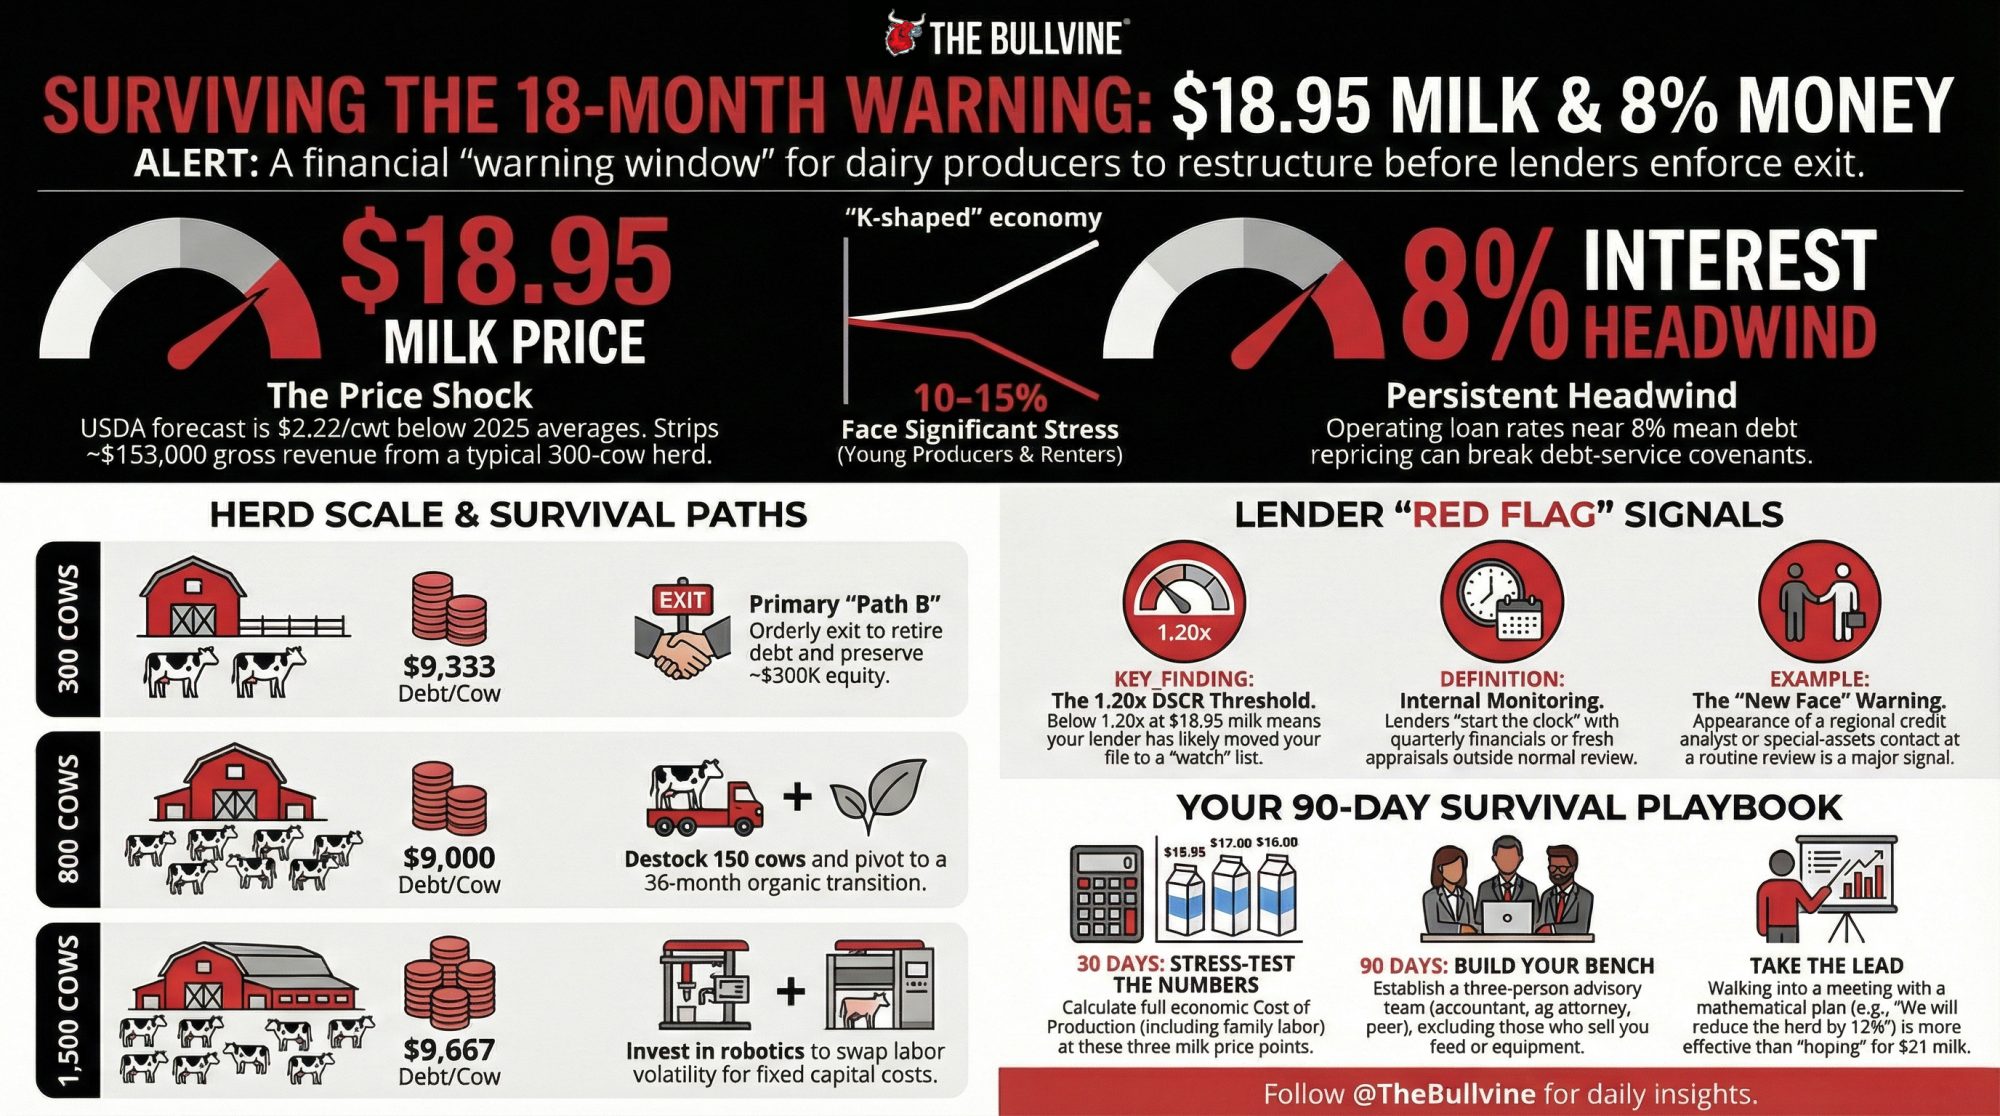
Executive Summary: Commercial ag operating rates sat in the mid‑7% range through late 2025 and early 2026, and Cornell’s 2023 DFBS shows the lowest‑profit quartile of New York dairies running a 0.36× DSCR — the exact number sending “good customer” files to the watch list. On $4.5M of repriced debt spread across real estate, equipment, and an operating line, the jump from 3.5–4% money to 7–8% adds roughly $118,000 a year in required payments, or about $1.07/cwt on a 400‑cow herd shipping 110,000 cwt. At USDA’s early‑2026 all‑milk forecast of $18.95/cwt, that same herd barely clears 1.0× DSCR; you need $20+ milk to breathe. Re‑amortizing a $1.8M parlor note from 14 to 25 years at 7.25% frees about $47,000 a year in cash flow — enough to pull a file out of the red, at the cost of more lifetime interest. Lenders aren’t firing bad customers; their models are. The farms getting flexibility walk in with a rolling 12‑month cost per cwt, their own DSCR math, a stress test at $17 milk, and at least one non‑correlated revenue line — beef‑on‑dairy, custom heifers, crop sales — that the dashboard can see. If your DSCR sits below 1.15× today and you can’t list every note and index on one page, your loan officer has more clarity on your risk than you do — and the next 30 days are when that changes.

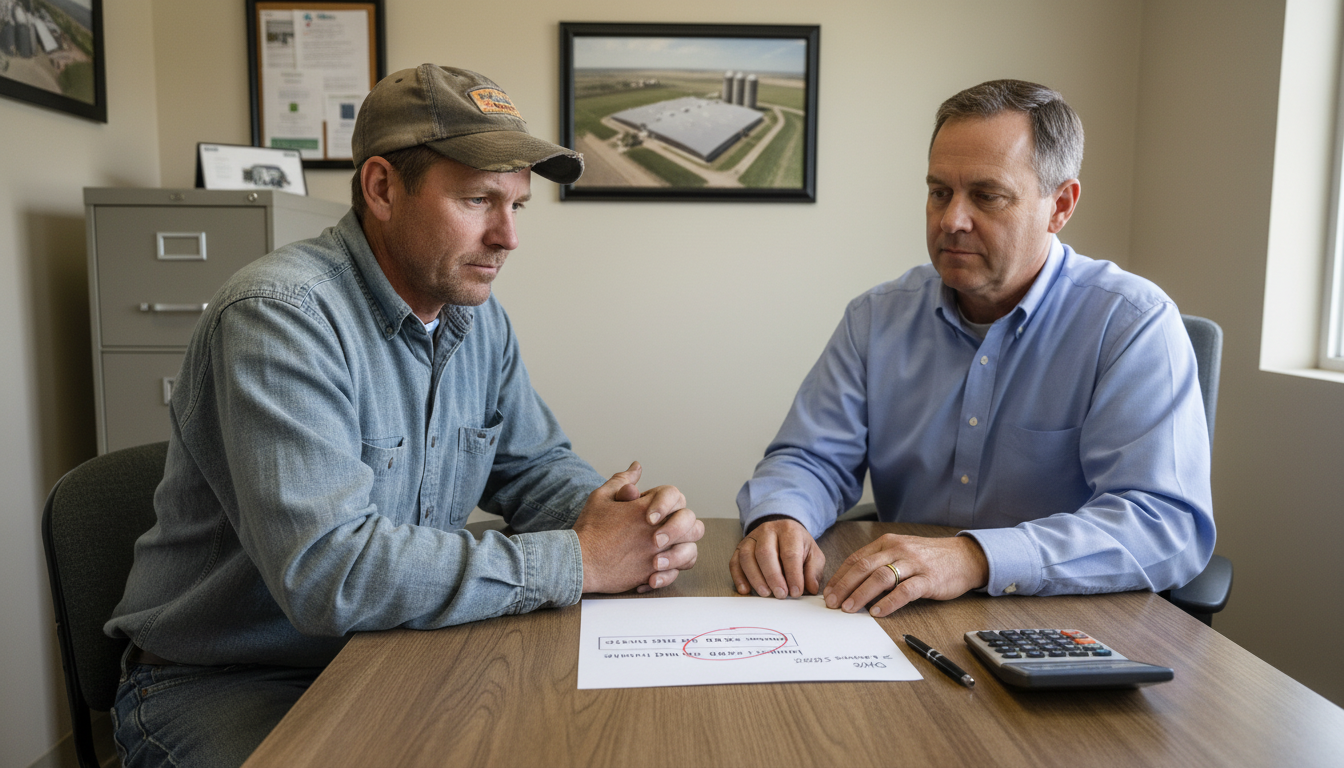
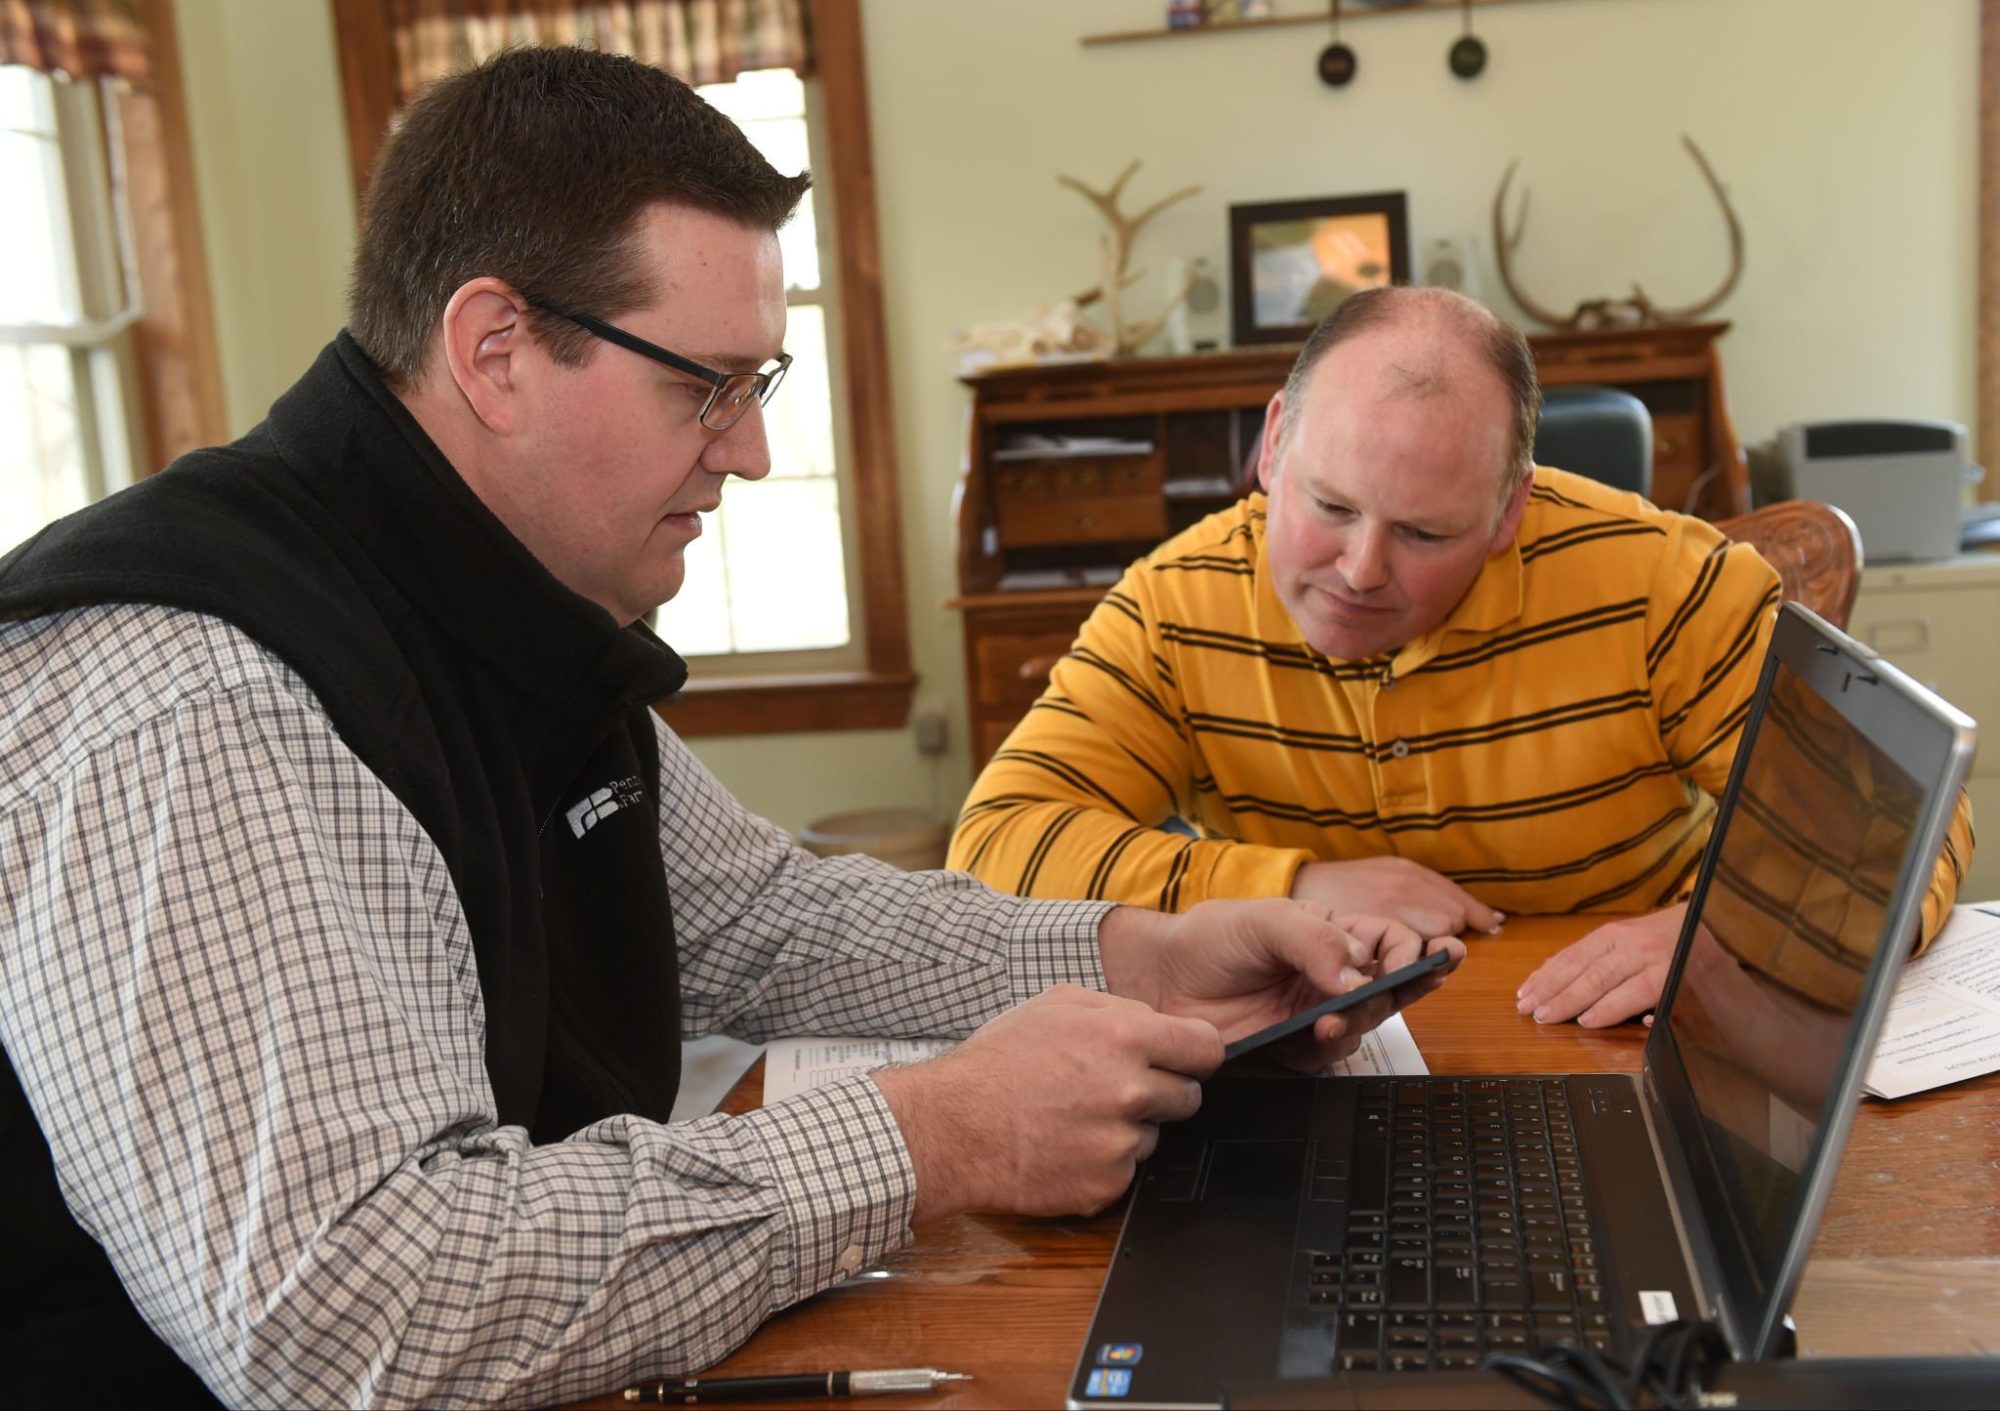
Picture a gray February morning in central Wisconsin. A third‑generation dairyman walks into his Farm Credit office carrying 30 years of loan statements and the quiet confidence of a guy who’s never missed a payment.

He’s expecting a handshake. A quick renewal. Maybe a short gripe about milk prices over bad coffee.

Instead, the loan officer — younger, laptop already open — pulls up a screen. The numbers don’t work the way they used to. Red on debt service coverage. Yellow on working capital. A projected breakeven that has jumped nearly two bucks a hundredweight after a batch of loans repriced. For a 380‑cow herd, that’s not an abstract “dairy lending 2026” headline. That’s the morning the computer says no — and a family decides whether to catch up to the bank’s math or let the bank decide their future.

A note on these stories: The three dairies described below are illustrative composites, not real operations. They’re built from 2023–2026 industry patterns in Cornell’s Dairy Farm Business Summary, Chicago and Kansas City Fed ag credit surveys, and Bullvine case work. The math and thresholds are real. The names, scenes, and dialogue are not attributed to any specific producer. Real named sources — Nathan Kauffman at the Kansas City Fed and David Oppedahl at the Chicago Fed — are quoted or paraphrased only from their own published commentary and reporting by outlets like Brownfield Ag News. If you’re a producer willing to share your DSCR restructure story on the record, reach out — future “Dairy Lender Files” installments will feature real named operations.

The Day the Screen Replaced the Yellow Pad

For a long time, your dairy loan ran on three things: reputation, collateral, and whether your lender thought you kept a tight ship. You’d sit across from someone who knew your family and your fields. They’d scribble on a yellow pad, ask how the year went, and if you’d always paid your bills, the renewal slid through.

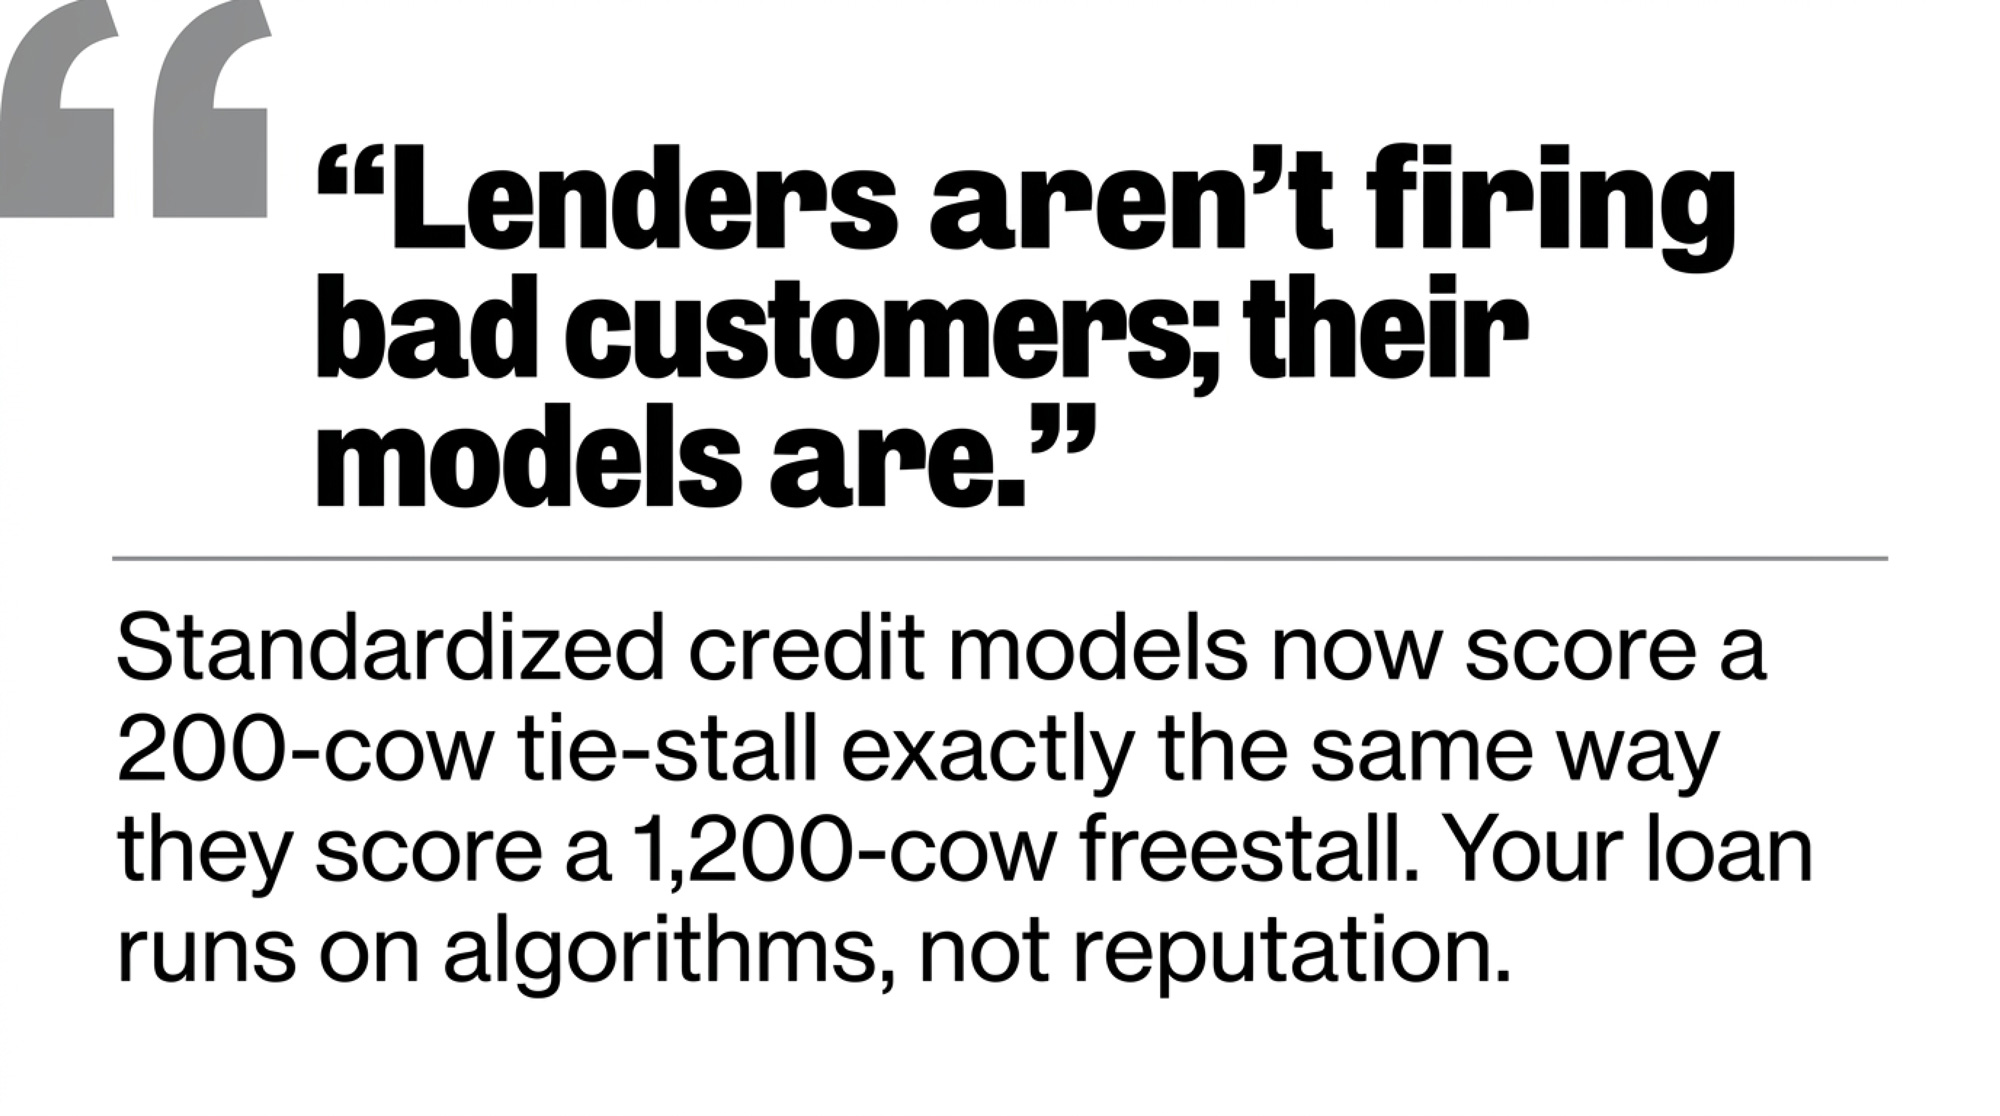
That world hasn’t vanished. It now sits underneath something colder — standardized credit models that score a 200‑cow tie‑stall in Minnesota the same way they score a 1,200‑cow freestall in New York.

Between 2015 and 2021, a lot of dairy debt went on the books at roughly 3.5–4.5% for conventional ag loans. Some FSA‑backed notes sat even lower. Then cheap money disappeared. The Chicago Fed’s 7th District AgLetter has pegged operating‑loan rates in the mid‑7% range and farm real‑estate loans in the high‑6% range through late 2025 and into early 2026 — still about double what many dairies locked in during their last expansion.

Those are effective rates on recently booked loans reported by participating banks — a blend of fixed and variable product. New paper is increasingly written as variable, typically priced as a spread over Prime or a term SOFR benchmark. Ask your lender which index your next renewal tracks. On a $3M loan, a 100‑basis‑point drift is roughly $30,000 a year in added interest; closer to $50,000 on $5M.

As of early 2026, USDA direct FSA operating loans sat in the mid‑4% range and ownership loans in the mid‑5% range — well below the commercial market, but only for borrowers who qualify. Check the current month’s FSA rate notice before you assume you’re priced in.

Kansas City Fed economist Nathan Kauffman told Brownfield Ag News in late 2025 that most producers can still service existing debt, helped by strong land values, but working capital is tight and some have already restructured heading into 2026. Chicago Fed policy advisor David Oppedahl has been more pointed in recent AgLetter commentary: repayment rates on non‑real‑estate loans are slipping, problem loans are creeping up, and roughly half of surveyed ag bankers expect more forced liquidations ahead.

At the system level, it’s “stress, not crisis.” At your kitchen table, sitting at 1.0× DSCR with repriced loans, that distinction feels academic.

What Your Lender’s Dashboard Actually Sees

When your lender opens your file, the model behind the screen scores you on ratios that sound cold but boil down to barn math once you cut the jargon. Every farm should be able to pull this snapshot in under five minutes.

The Dashboard Cheat Sheet
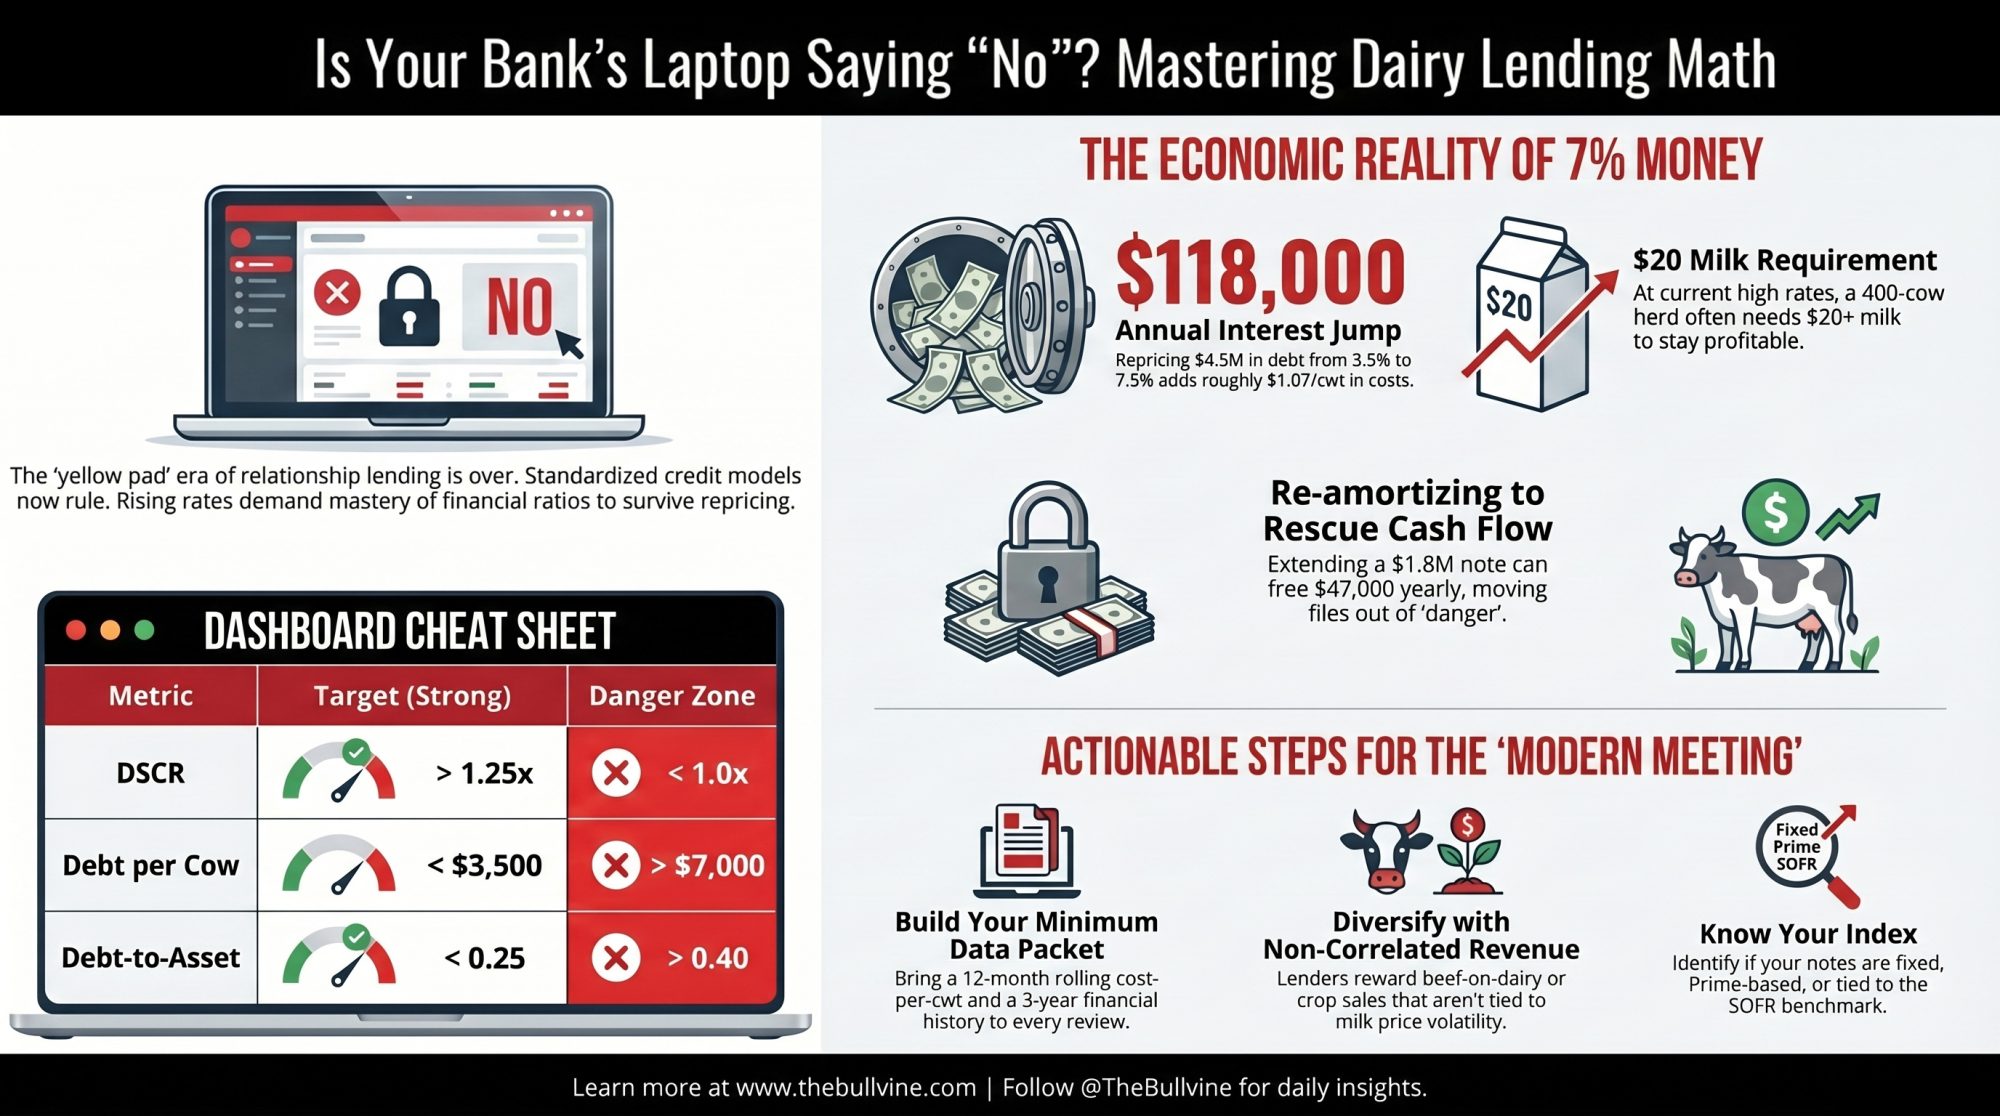
MetricTarget (Strong)Danger ZoneWhere the Numbers Come From
DSCR> 1.25×< 1.0×Cornell DFBS 2023: top group 2.95×, bottom 0.36×
Debt per Cow< $3,500> $7,000Progressive Dairy “Dairy Dozen” benchmarks
Working Capital> 25% of gross revenue< 10%OSU “15 Measures of Dairy Farm Competitiveness”
Debt‑to‑Asset< 0.25> 0.40DFBS 2023 average 0.29; top group 0.21

Now the barn‑math version of each.

Debt service coverage ratio (DSCR). Net cash available for debt service divided by total annual principal and interest. A lot of lenders quietly target at least 1.25× as a comfort line. Cornell’s 2023 DFBS profitability comparison across 129 New York herds makes the spread vivid: the lowest‑profit group averaged just 0.36×, mid‑low hit 1.14×, mid‑high reached 1.38×, and the most profitable group sat at 2.95×. Below 1.0×, you’re not generating enough cash to cover your own debt.
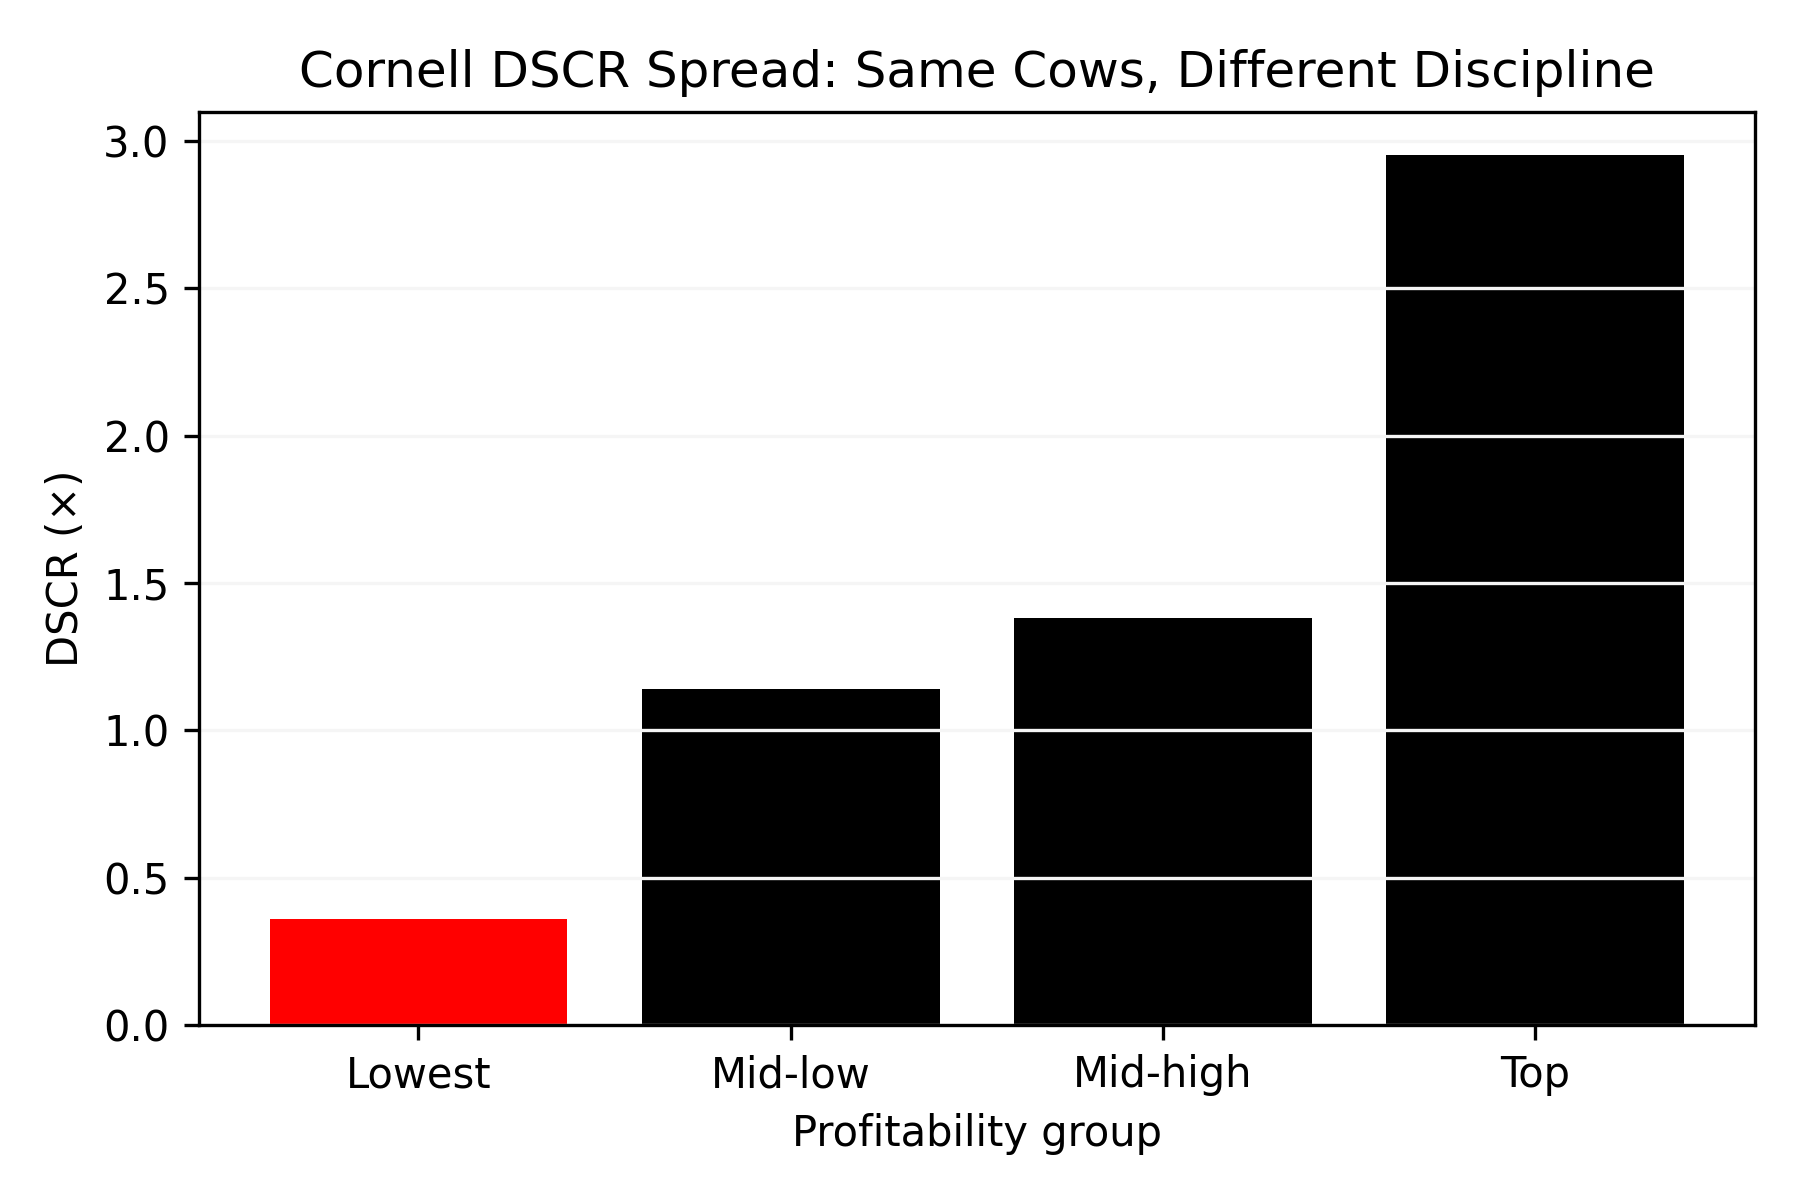
Profitability GroupDSCR (×)
Lowest0.36
Mid‑low1.14
Mid‑high1.38
Top2.95

Working capital. Current assets minus current liabilities. Ohio State’s “15 Measures of Dairy Farm Competitiveness” calls anything above 25% of gross revenue competitive. In Brownfield’s 2025 coverage, Kauffman flagged working capital as the metric lenders are watching closest heading into 2026.

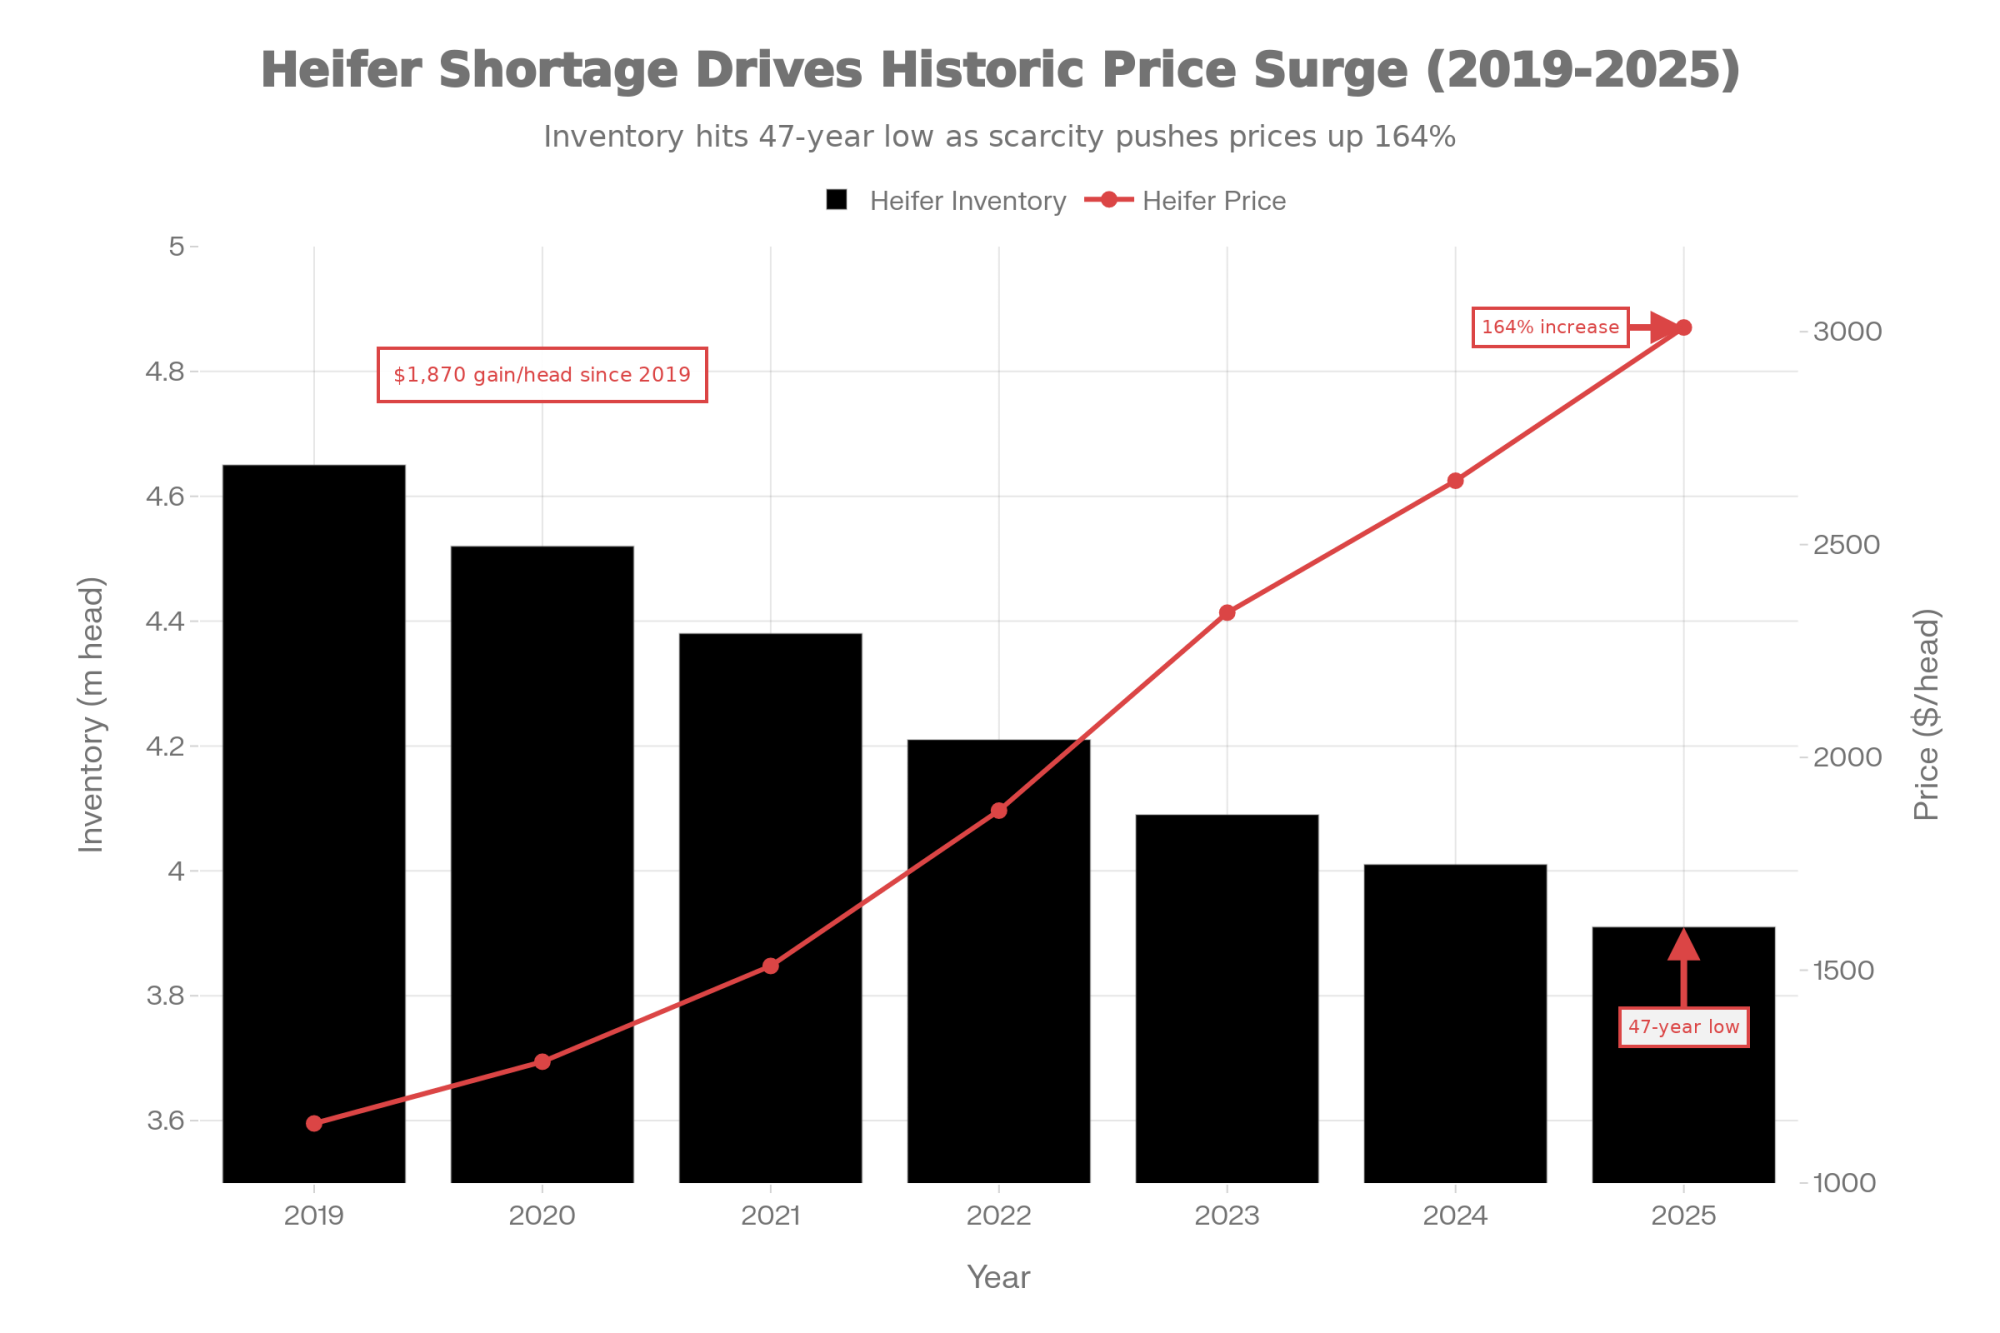
Debt per cow. Cornell’s lowest‑profit quartile carried about $5,007 of debt per cow versus roughly $3,097 for the top group — a gap of almost $1,900 per cow. Progressive Dairy’s “Dairy Dozen” benchmarks peg $3,000–$5,000 as manageable and flag $7,000 per cow as the point where servicing gets difficult.

Debt‑to‑asset ratio. The Cornell all‑farm DFBS average was 0.29 in 2023. Top‑profit farms ran about 0.21; the lowest‑profit group sat at 0.34. OSU flags anything above 0.30 as moving into higher‑risk territory.

Your grandfather knew these ratios. The difference? He had a year to fix them. You have a quarter.

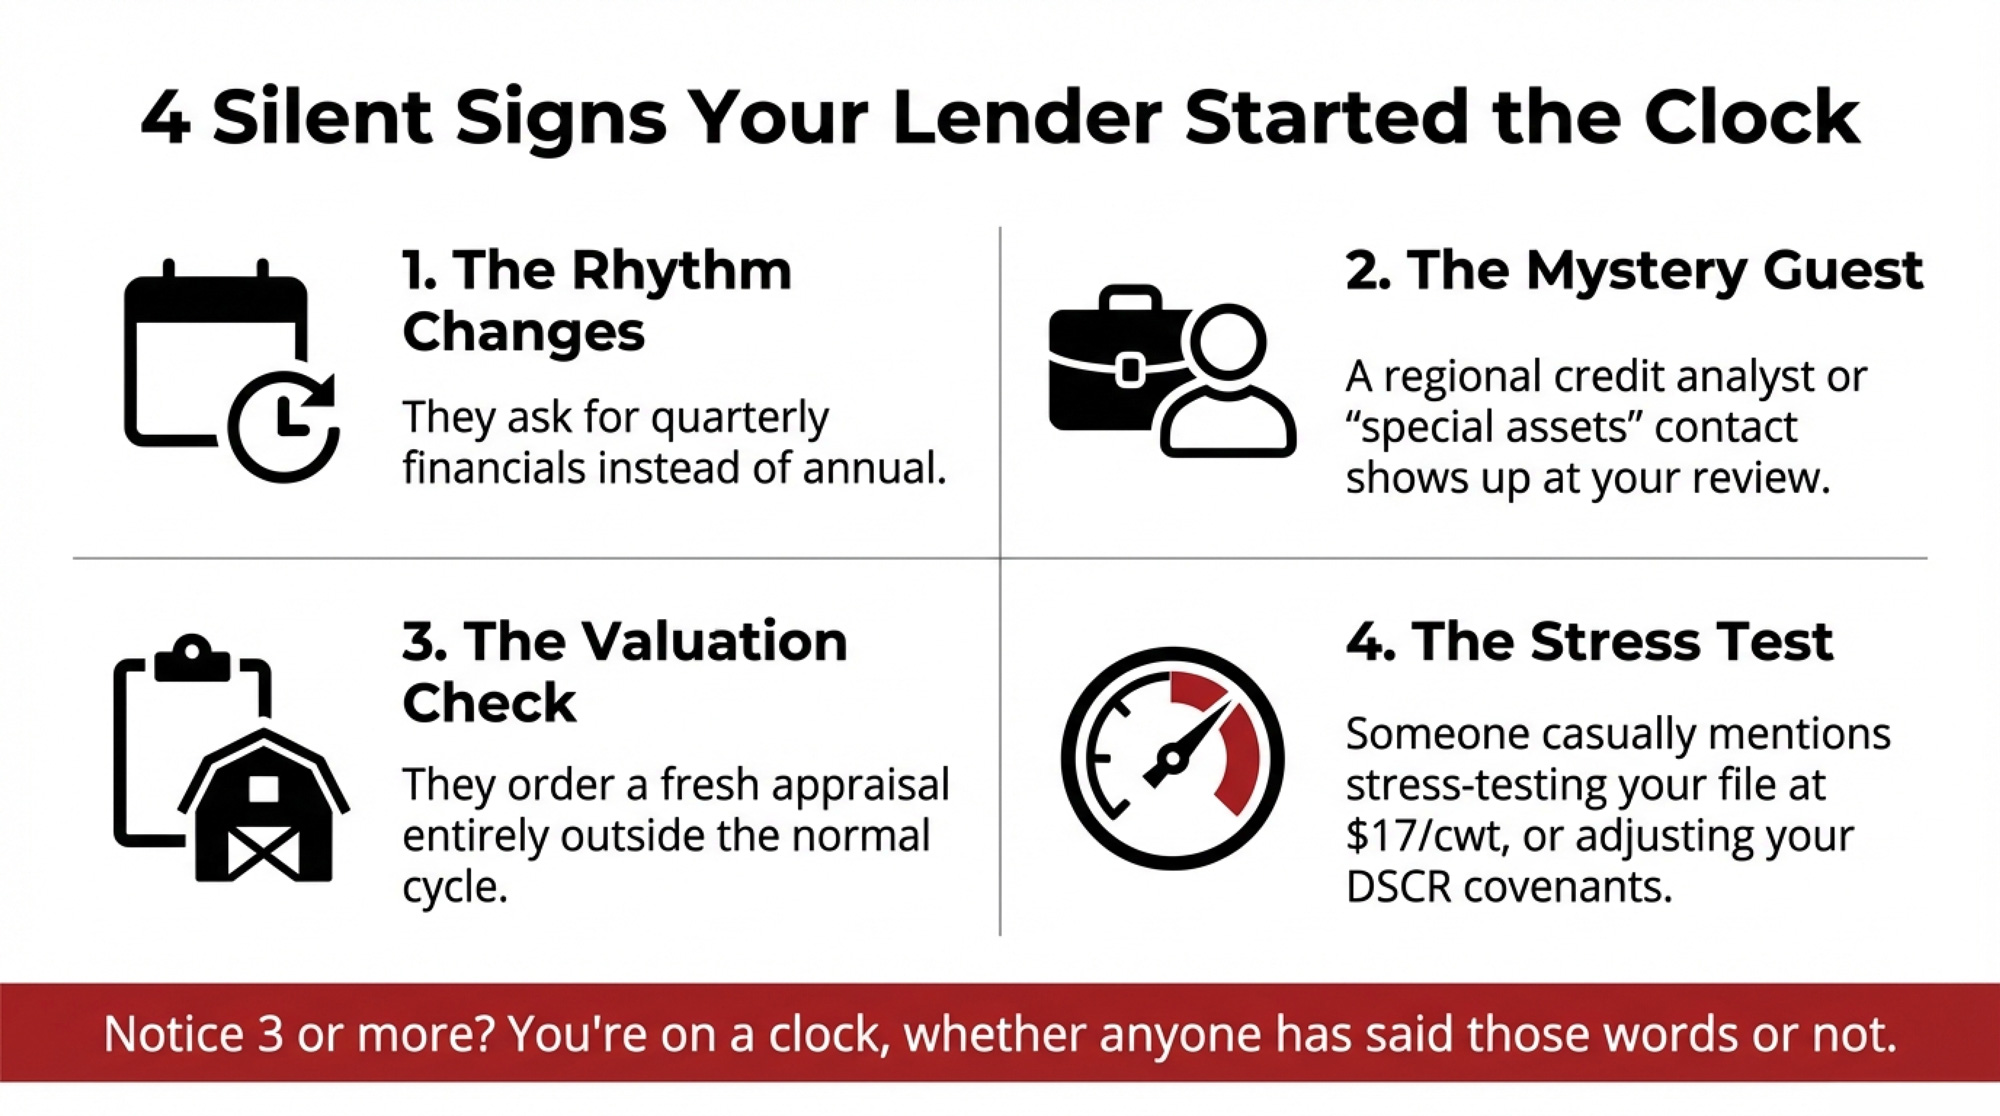
The model pulls your numbers quarterly — sometimes monthly — and benchmarks them against thousands of farms in the bank’s footprint. Chicago Fed surveys through 2025 showed a rising share of 7th District banks reporting tighter collateral demands. If you’re not running these ratios yourself, your lender still is. You’re just not seeing the same screen.

Three Composite Farms, Three Outcomes

What follows are three composite dairy families — patterns, not people — built from 2023–2026 data in Wisconsin, New York, and Minnesota. Same industry, same rate environment. Very different results, depending on how they showed up at the bank.

A 380‑Cow Wisconsin Dairy: “Good Customer” Meets New Math

Call this composite a 380‑cow Holstein herd in a sand‑bedded freestall in central Wisconsin. Rolling herd average in the high 70s. In 2019, a farm with this profile might have expanded the parlor and housing, taking on roughly $1.8 million in new term debt at around 3.75%. Payments fit fine at the time.

Those loans repriced in late 2025 to just over 7%, right in line with Chicago Fed survey rates. Bullvine’s own rate analysis suggests repricing typical mid‑size dairy debt from the mid‑3s to the mid‑7s can add more than $100,000 a year in debt service on $3–4M of repriced debt. For a 380‑cow herd on this trajectory, breakeven jumps from the high‑$17s into the low‑$19s per cwt.

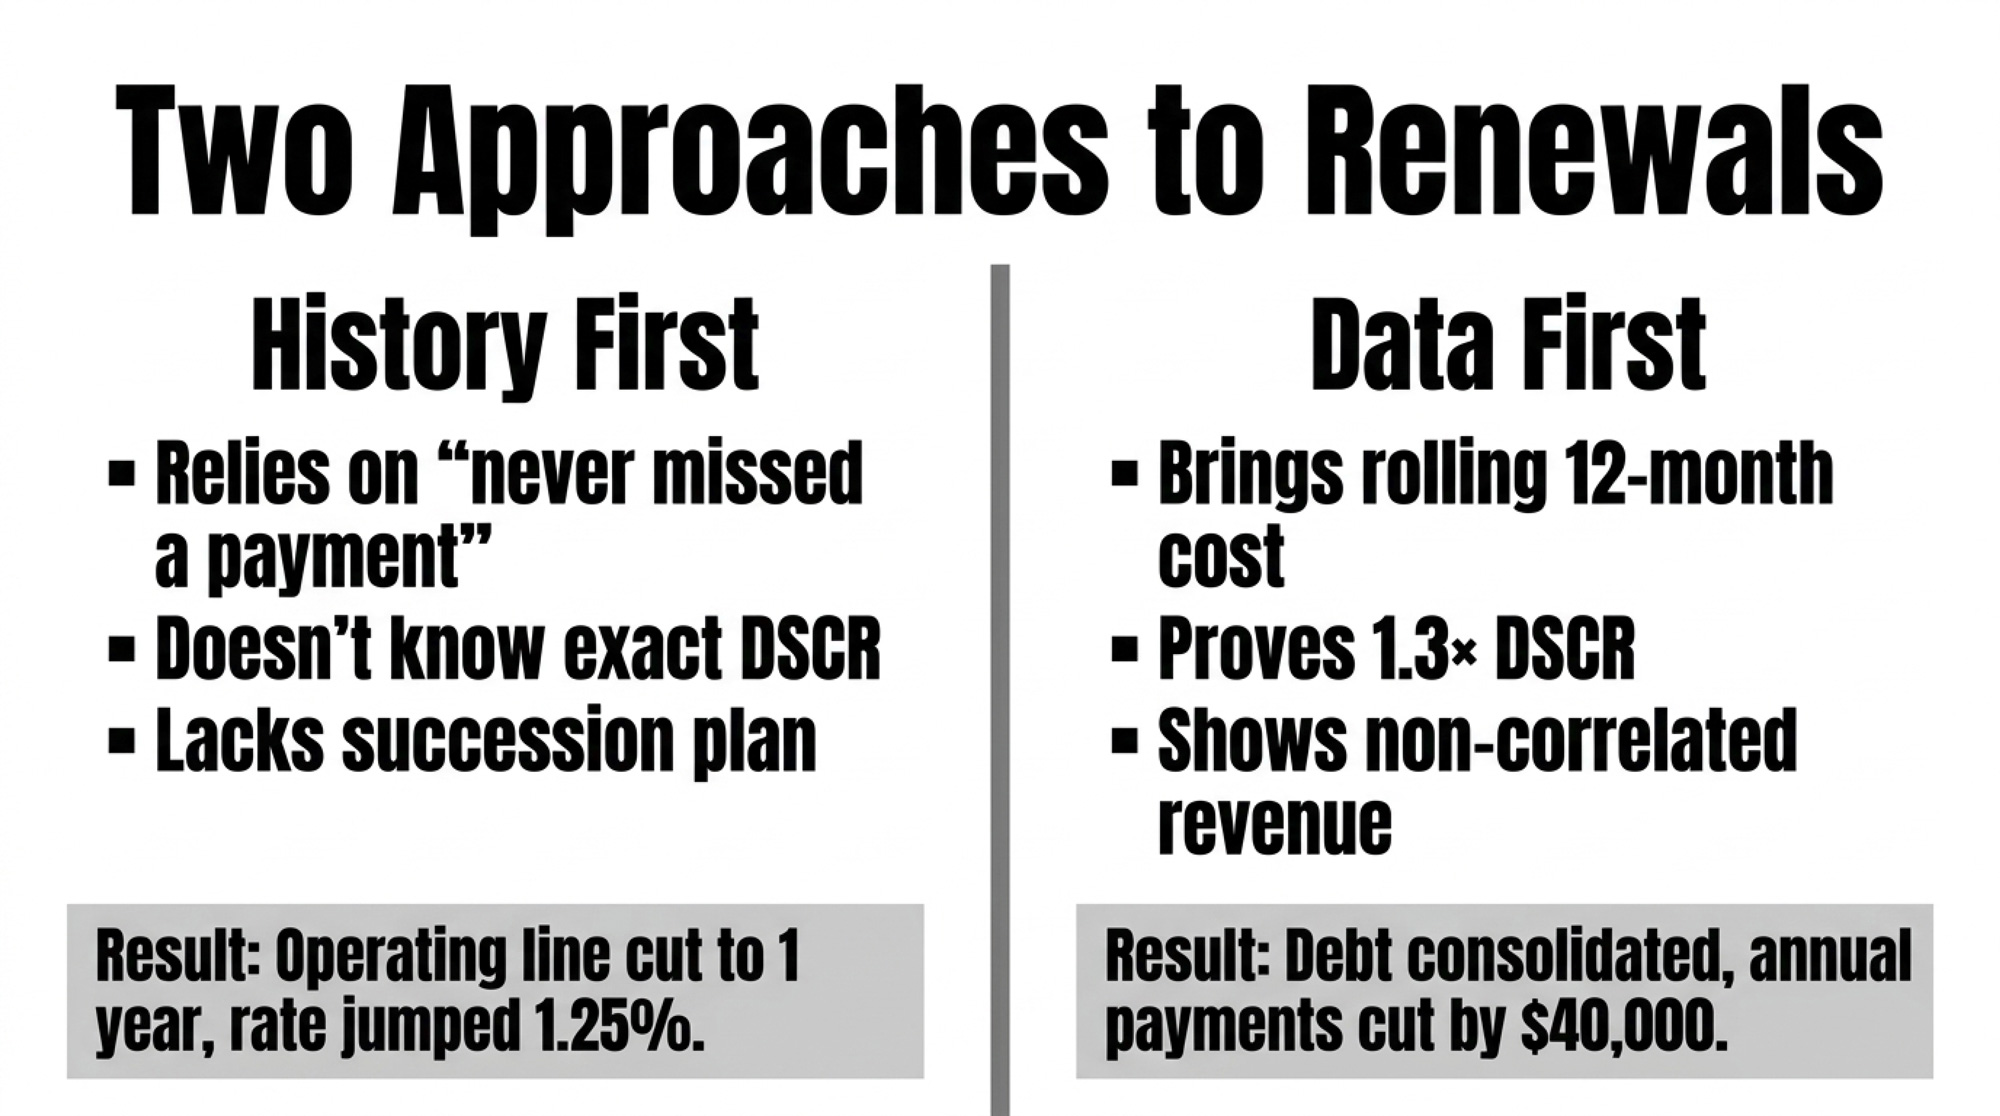
A herd like this often has never missed a payment. Land still pencils as strong collateral — Oppedahl has noted in the Chicago Fed AgLetter that rising 7th District land values give some stressed farmers the option to sell off a portion of land to support operations. Even so, this kind of file typically shows DSCR sliding from above 1.4× to around 1.1×. That moves it off autopilot and onto the watch list.

At annual review, instead of a quick signature, the conditions now look like this: monthly financials instead of quarterly, a cap on new capital spending, and a clear ask to show a path back to at least 1.25× DSCR inside 18 months.

The common turning point on farms like this: somebody — often a younger family member — pulls 12 months of milk checks and expense reports, sits down with an Extension farm business educator, and builds a cash‑flow projection with three paths. Hold steady and hope for $20+ milk. Trim tail‑enders and push extra cash into principal — exactly the kind of move Kauffman has pointed to as risk reduction. Or lean harder into components and beef‑on‑dairy genetics.

That last path matters more to the bank than many producers realize. Lenders reward revenue that isn’t tied to the Class III/IV roller coaster. Beef‑on‑dairy calves sell into the fed‑cattle market, not the milk market, so they’re effectively non‑correlated revenue — cash that keeps flowing when milk prices tank. On a working balance sheet, a pen of high‑value crossbred calves and short‑bred heifers carries more weight than straight Holstein bull calves, strengthening the working‑capital line the model pulls every quarter. That kind of balance‑sheet signal often translates into more flexibility at renewal.

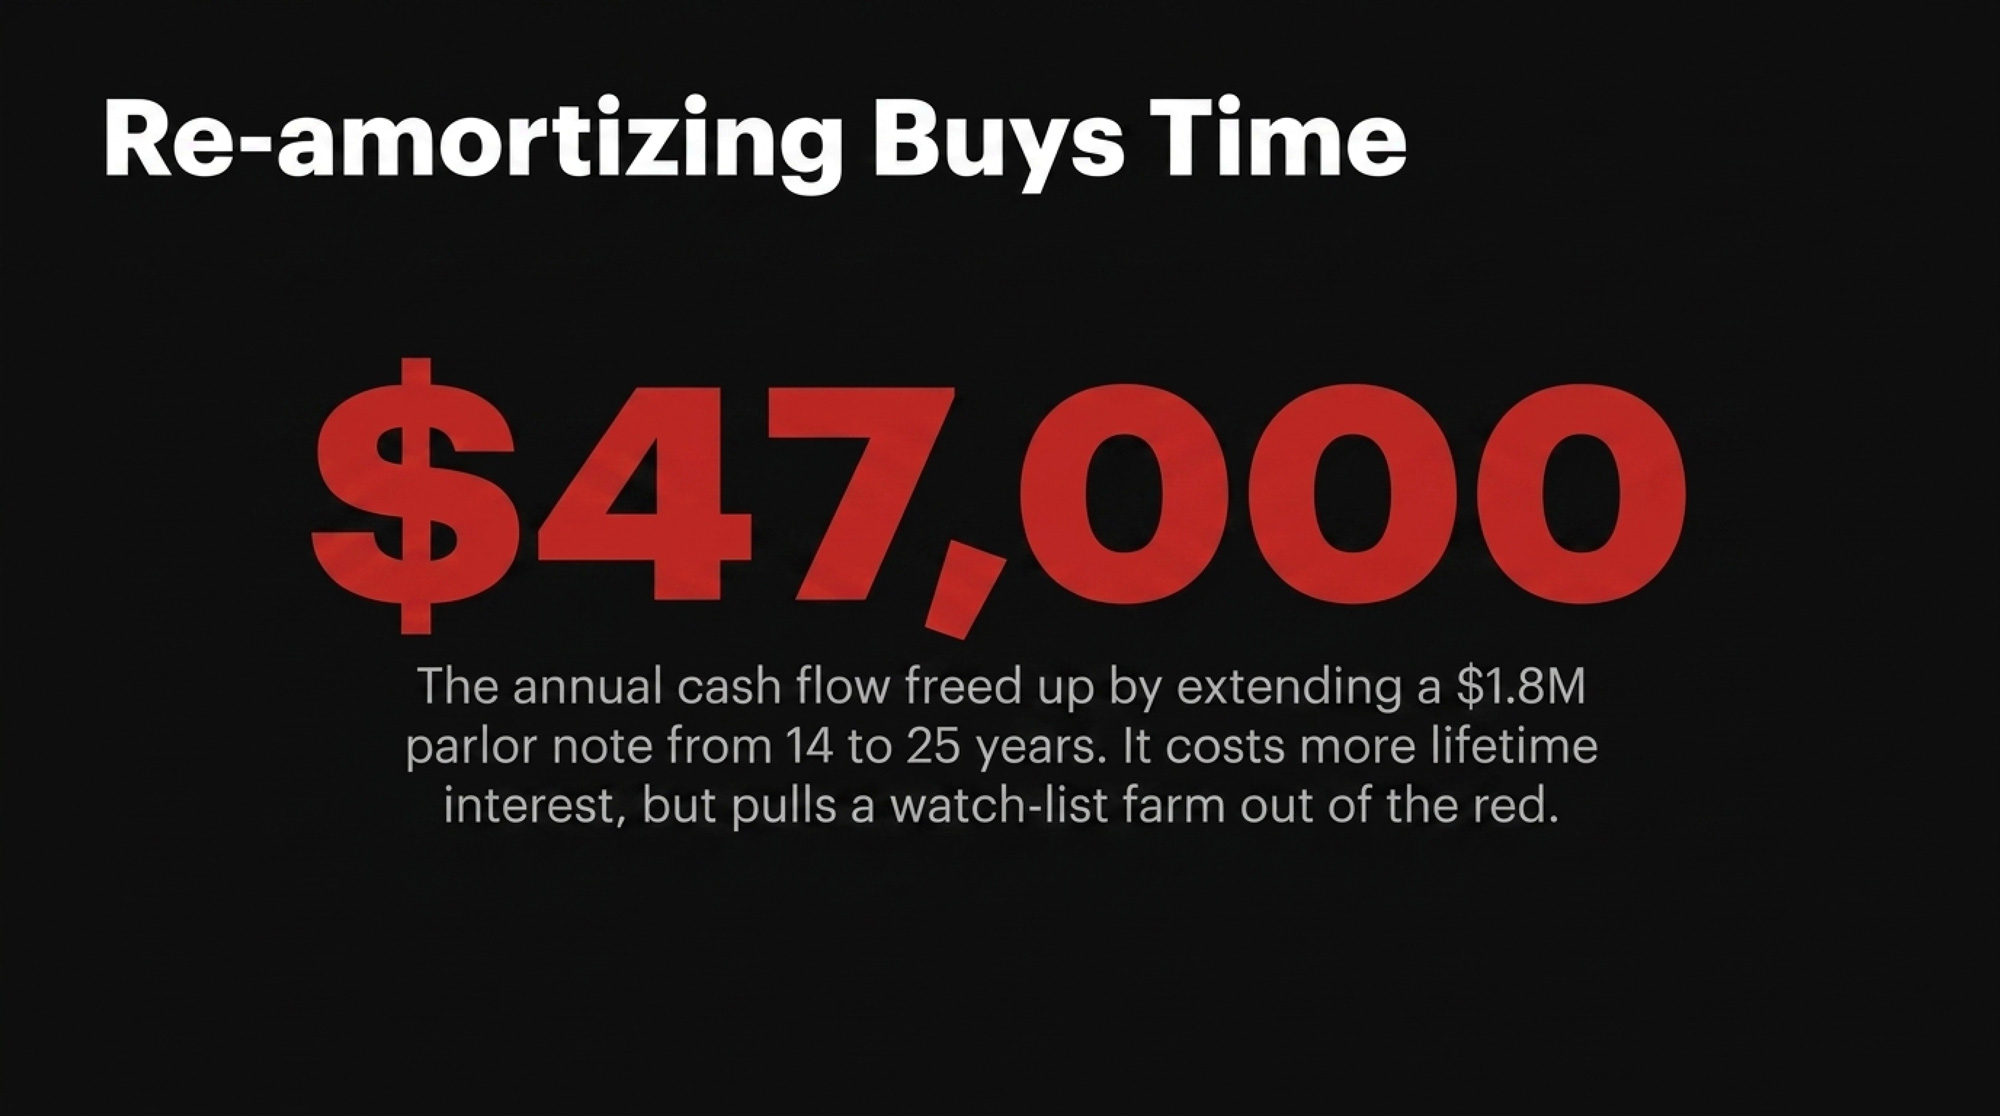
💡 The $47,000 Payment Gap On a $1.8M parlor note at ~7.25%, re‑amortizing from a 14‑year remaining term to a new 25‑year term drops annual P&I from roughly $203,000 to $156,000 — a gap of ~$47,000 per year. That’s the number in the headline. It’s also what often moves a watch‑list farm back into the “renewed” column. The trade‑off: more total interest over the life of the loan.

When a composite farm like this comes back to its lender with the same cows, same ground, same total debt, but a sharper story, the outcome typically shifts. A $47,000/yr payment drop nudges projected DSCR from about 1.14× into the low‑1.2× range. Not cushy. Out of the danger zone.

The relationship doesn’t carry farms like this. The data does.

Go deeper: “Profitable but Drowning: The Interest Rate Crisis Reshaping Mid‑Size Dairy” walks through the full repricing breakdown on herds in this exact position.

A 620‑Cow New York Dairy: Data Buys Better Terms

The second composite: a 620‑cow western New York dairy built from 200 over a decade by reinvesting profits and timing land buys around local retirements. Total debt near $6.8 million across a Farm Credit real‑estate package, a local bank equipment note, and an FSA‑guaranteed operating line. On paper, that leverage could make any lender twitch in a 7% rate world.

Files like this one earn the opposite reaction.

Operators on this trajectory track cost of production by month. Not just “feed, labor, other” — purchased feed per cow per day, hired labor per cwt, interest expense per cwt, repairs as a percent of gross. A rolling 12‑month cost around $16.80/cwt is plausible for a tightly run herd of this size. A 2023 Northeast Dairy Farm Summary reported a net cost of production of $22.64/cwt across member farms, so this composite would run well below the regional average. Cornell’s DFBS profitability comparison confirms the pattern from another angle: the highest‑profit group carried a debt coverage ratio of 2.95× versus 0.36× at the bottom.

A herd like this seeking $400,000 to upgrade manure storage under state rules would typically show DSCR holding in the high‑1.3× range even under a modeled $17 all‑milk year. Working capital comfortably positive. A simple written succession outline bringing a family member in over the next decade.

Rather than tightening terms, a lender looking for a reason to keep this file often goes the other direction — consolidating higher‑rate equipment debt into a longer real‑estate package. On the $1.2M chunk modeled here, stretching the term and picking up a better rate can cut annual debt service by roughly $40,000 (illustrative; exact savings depend on term and rate selected). That cash goes straight to working capital and strategic repairs.

The farm that walks in with a clear cost‑of‑production story gets the best tools when things get tight.

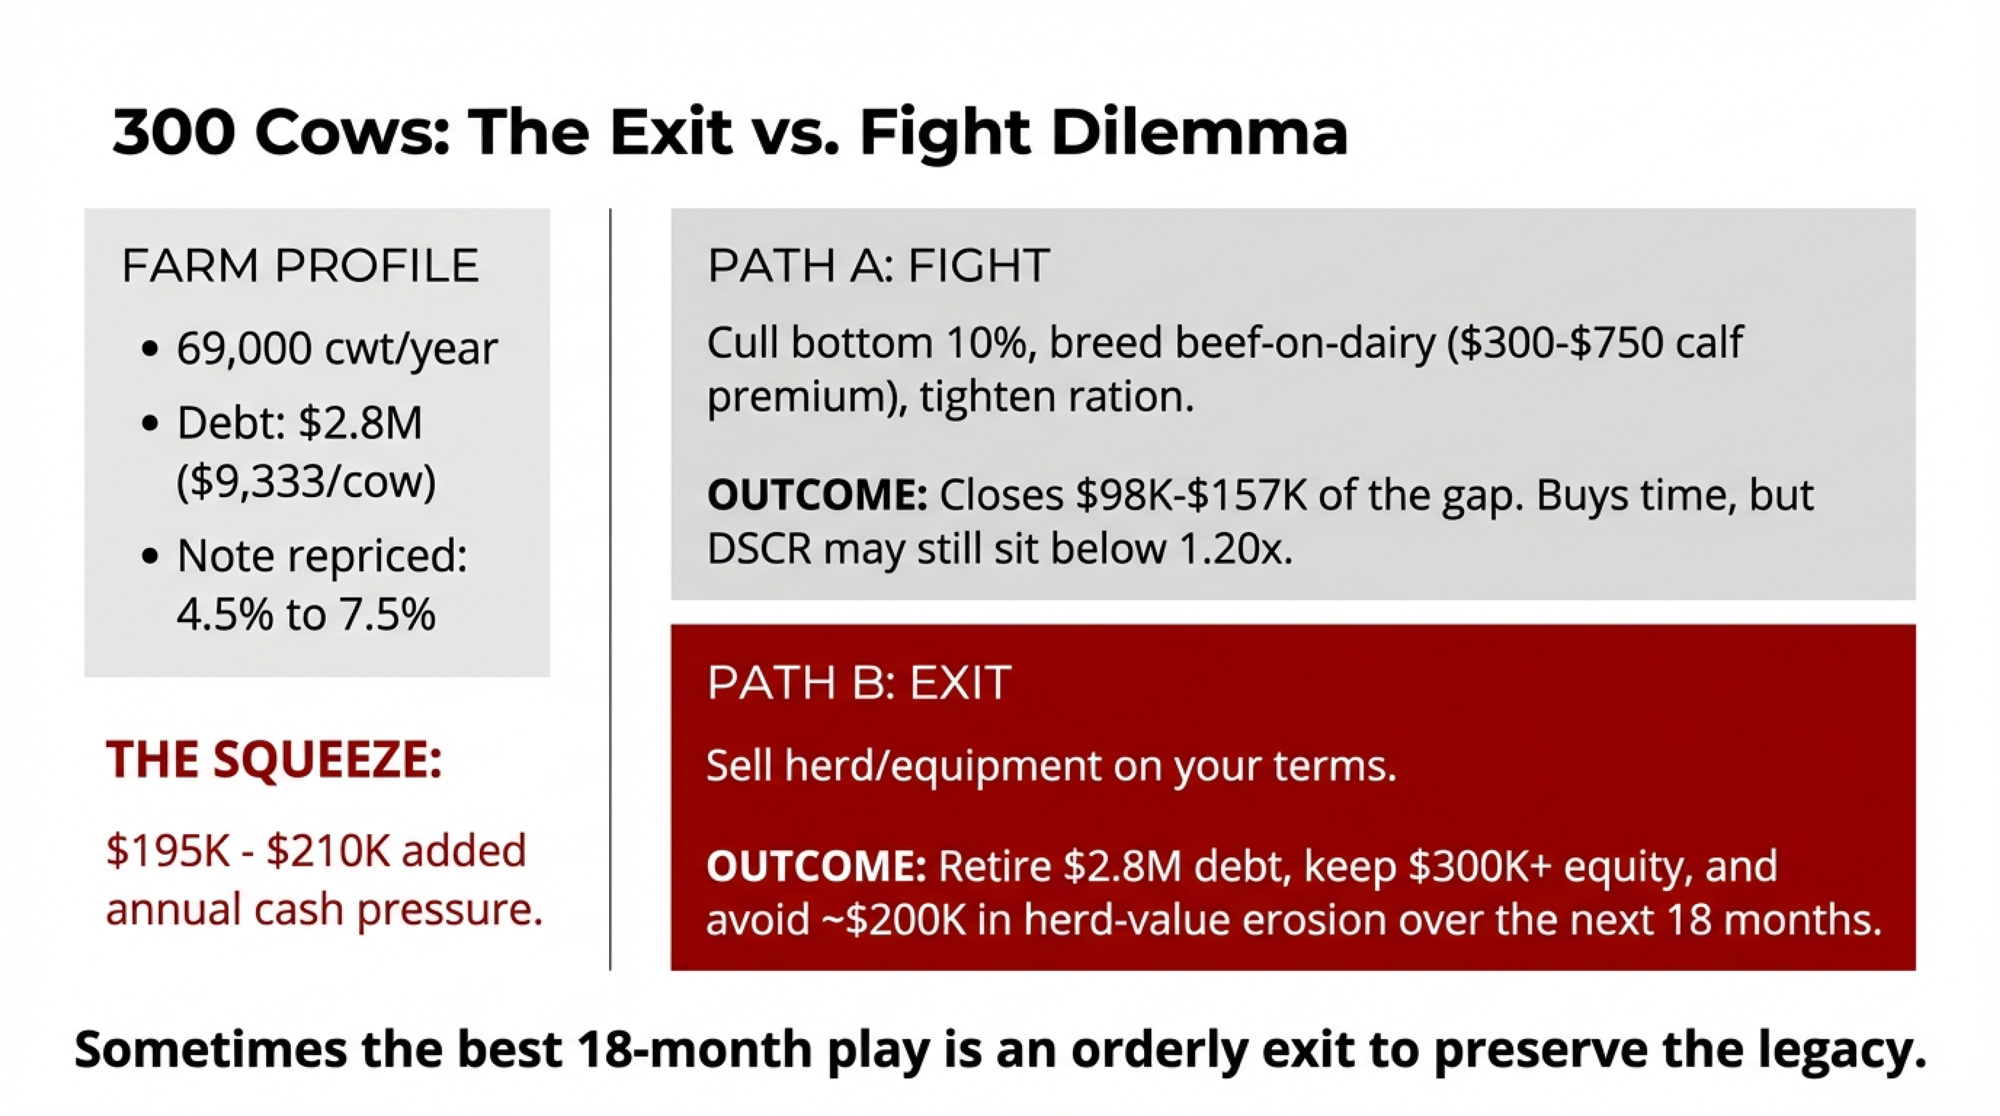
A 280‑Cow Minnesota Dairy: When “Good Customer” Isn’t Enough

The third composite: a 280‑cow tie‑stall in east‑central Minnesota. The cows do fine. The concrete, not so much.

No parlor, no robots, no big value‑added sideline. Total debt around $1.9 million, mostly land and building mortgages. A family farm like this often works with the same locally owned community bank for decades. The lender knows them by name and quietly rolls the operating line year after year.

Then, in 2024, that bank gets absorbed into a larger regional system — part of the wave of Midwest community‑bank consolidations over the last decade. When the file hits the new centralized risk model, three things flag: DSCR under 1.0× on recent tax returns (well below the Cornell all‑farm average of 1.84×), debt‑to‑asset ratio pushing 0.40 (versus the DFBS average of 0.29), and no documented succession plan. Kids with careers off‑farm.

That’s almost exactly the profile Kauffman has flagged in KC Fed commentary as most at risk — a producer who hasn’t built much land equity and carries heavier leverage on machinery or buildings.

Doors don’t slam on farms like this. The rules change. Operating line renewed for one year instead of three. Rate jumps about 1.25 percentage points, adding roughly $7,500 a year in added interest on a $600,000 line — on top of tighter covenants and a shorter renewal window. The bank asks for a formal transition or exit plan inside 12 months.

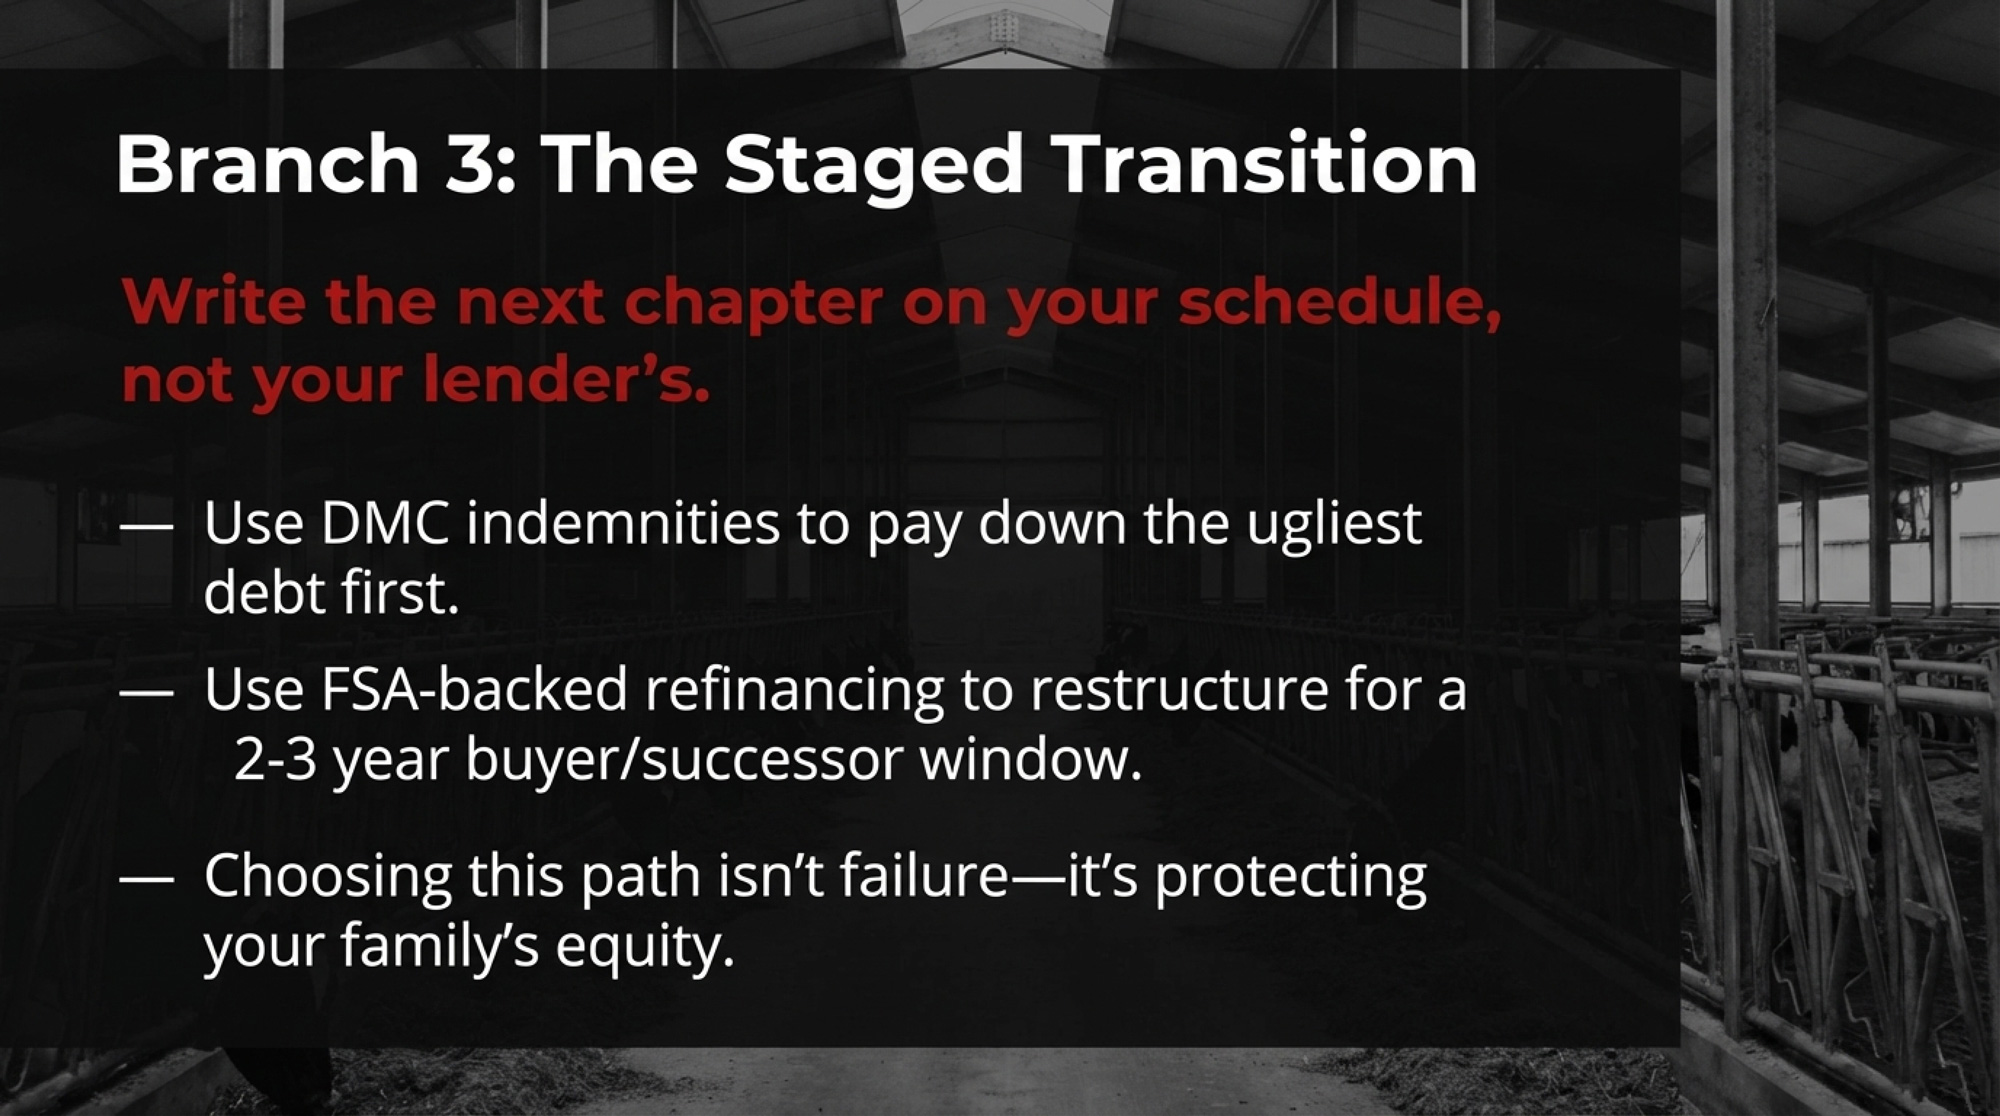
The typical next step on these files is a Minnesota Farm Business Management instructor — not to plan expansion, but to map an orderly wind‑down. A realistic three‑year exit: timing cow and equipment sales to avoid fire‑sale discounts, using Dairy Margin Coverage payouts and safety‑net checks to bridge cash flow, and listing land at current comparable values instead of waiting for a sheriff’s notice.

Bullvine’s own case work across several Midwest exits suggests families who planned 7–18 months ahead preserved roughly $400,000–$680,000 more equity than those pushed into forced liquidation. It isn’t the ending anyone dreams of. It beats letting the dashboard pick the date and the price.

▶ Next Step for Farms in This Position: Read “The 45‑Day Survival Guide for Mid‑Sized Dairy Operations” — the most logical playbook for operators whose DSCR is already under 1.0×.

What Happens to Your Milk Check When Your Interest Rate Jumps 1%?

Strip away the banker language and a big part of this shift is brutally simple: the same debt costs you a lot more than when you signed for it.

Take $2.5 million of term debt on a 20‑year amortization. At 6.5%, annual principal and interest runs about $223,700. Ship 100,000 cwt a year, and that’s roughly $2.24/cwt just to service that debt. At 7.5%, the payment climbs to about $241,700 — roughly $2.42/cwt. That’s about $18,000 more per year, or $1,500 less cash per month. (Standard amortization estimates; your exact number depends on payment structure and compounding.)

Interest RateAnnual P&I (US$)
6.5%223,700
7.5%241,700

Now look at how that moves DSCR:

  • Net cash for debt service at $300,000 and a 6.5% payment: DSCR ≈ 1.34×.
  • Same cash, 7.5% payment: DSCR drops to about 1.24×.
  • If milk slides and net cash falls to $200,000 at the higher rate: DSCR ≈ 0.83×.

One percentage point of interest. One dollar of milk price. That’s the gap between “renewed with conditions” and “we need to talk about restructuring.”

How Much Does a Full Repricing Really Move Your Breakeven?

If you’re sitting on around $4.5 million in total debt, here’s what the repricing wave looks like using realistic chunks drawn from Fed survey ranges (standard amortization math, rounded for presentation):
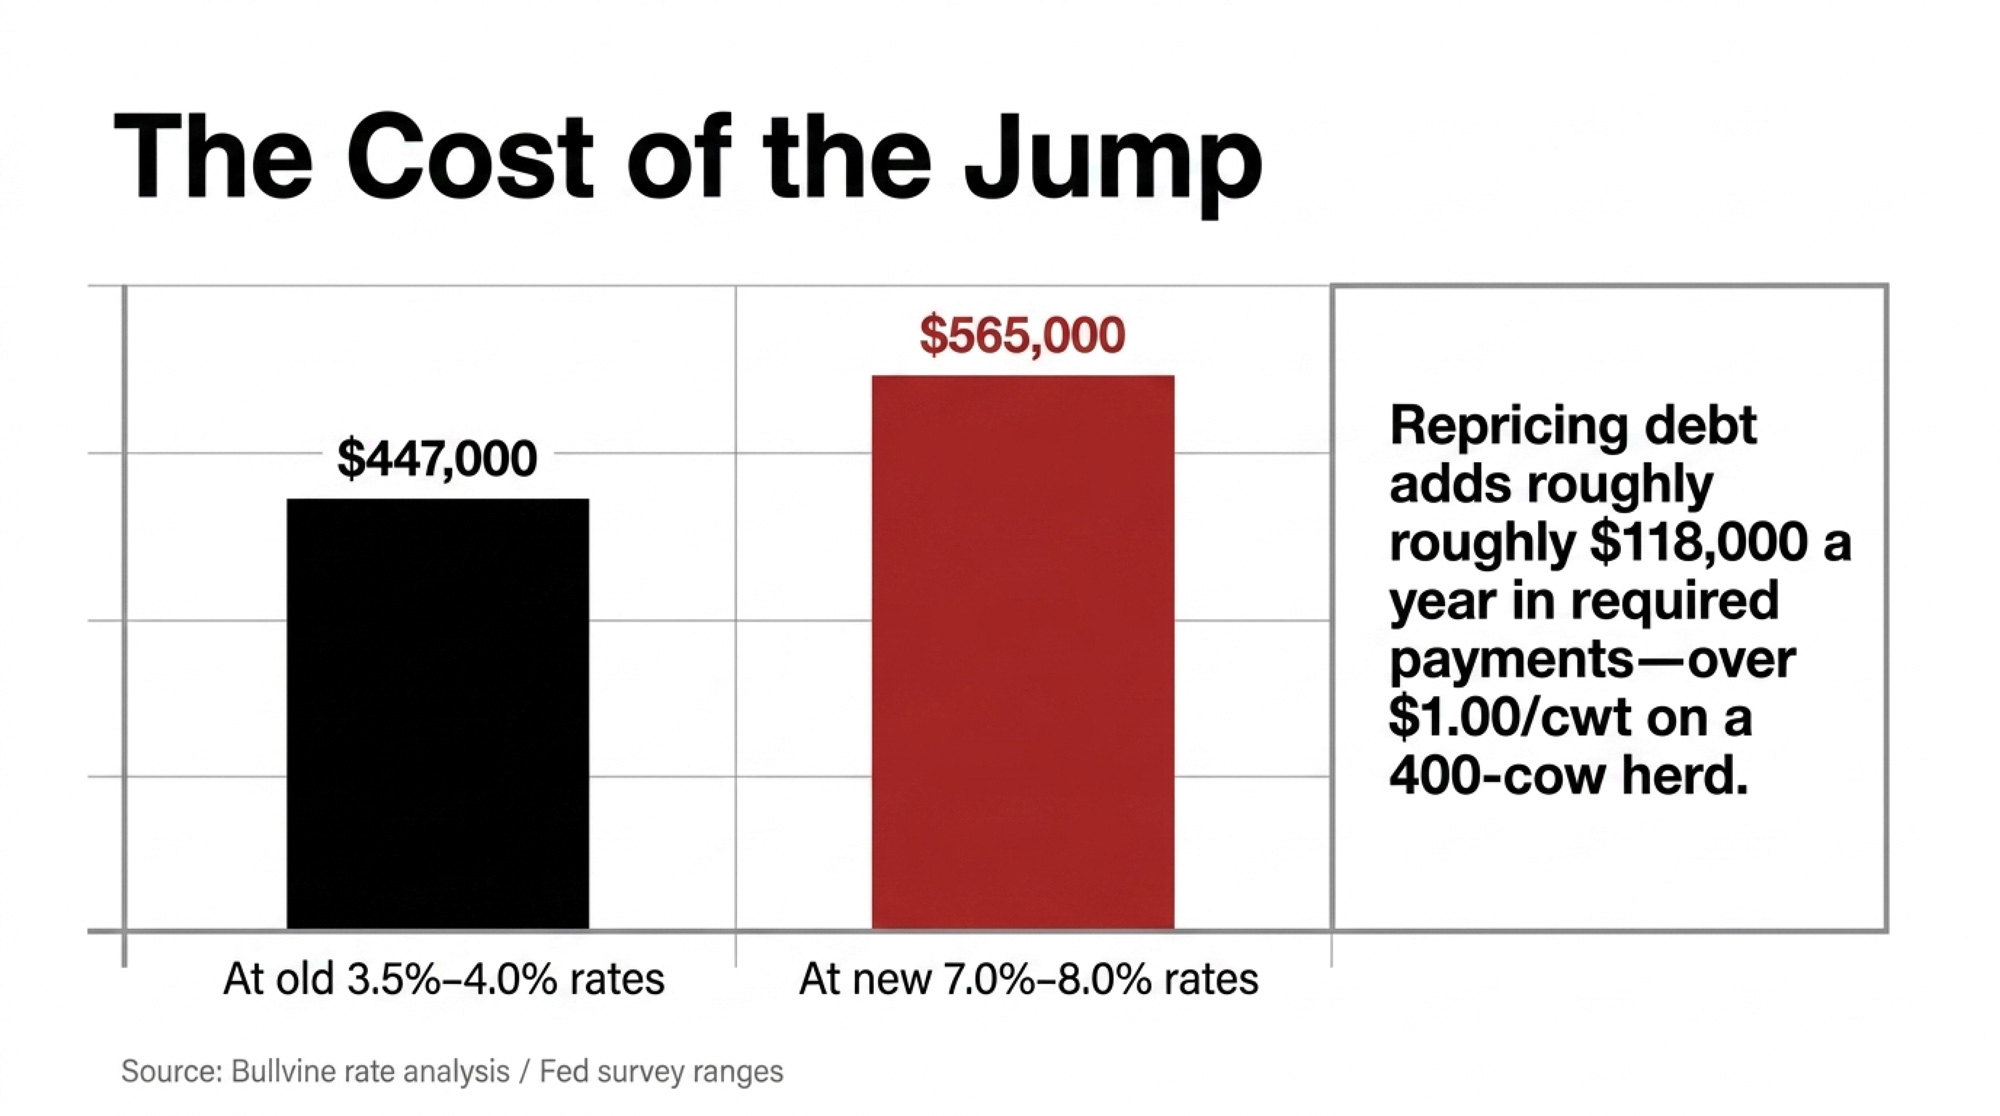
Debt TypeAmountOld RateNew RateOld Annual P&INew Annual P&I
Real estate (15‑yr)$2.7M3.5%7.5%~$232,000~$300,000
Equipment (7‑yr)$1.2M4.0%7.0%~$197,000~$217,000
Operating line (interest‑only)$600K3.0%8.0%$18,000$48,000
Total$4.5M ~$447,000~$565,000

That’s about $118,000 more per year in required payments.

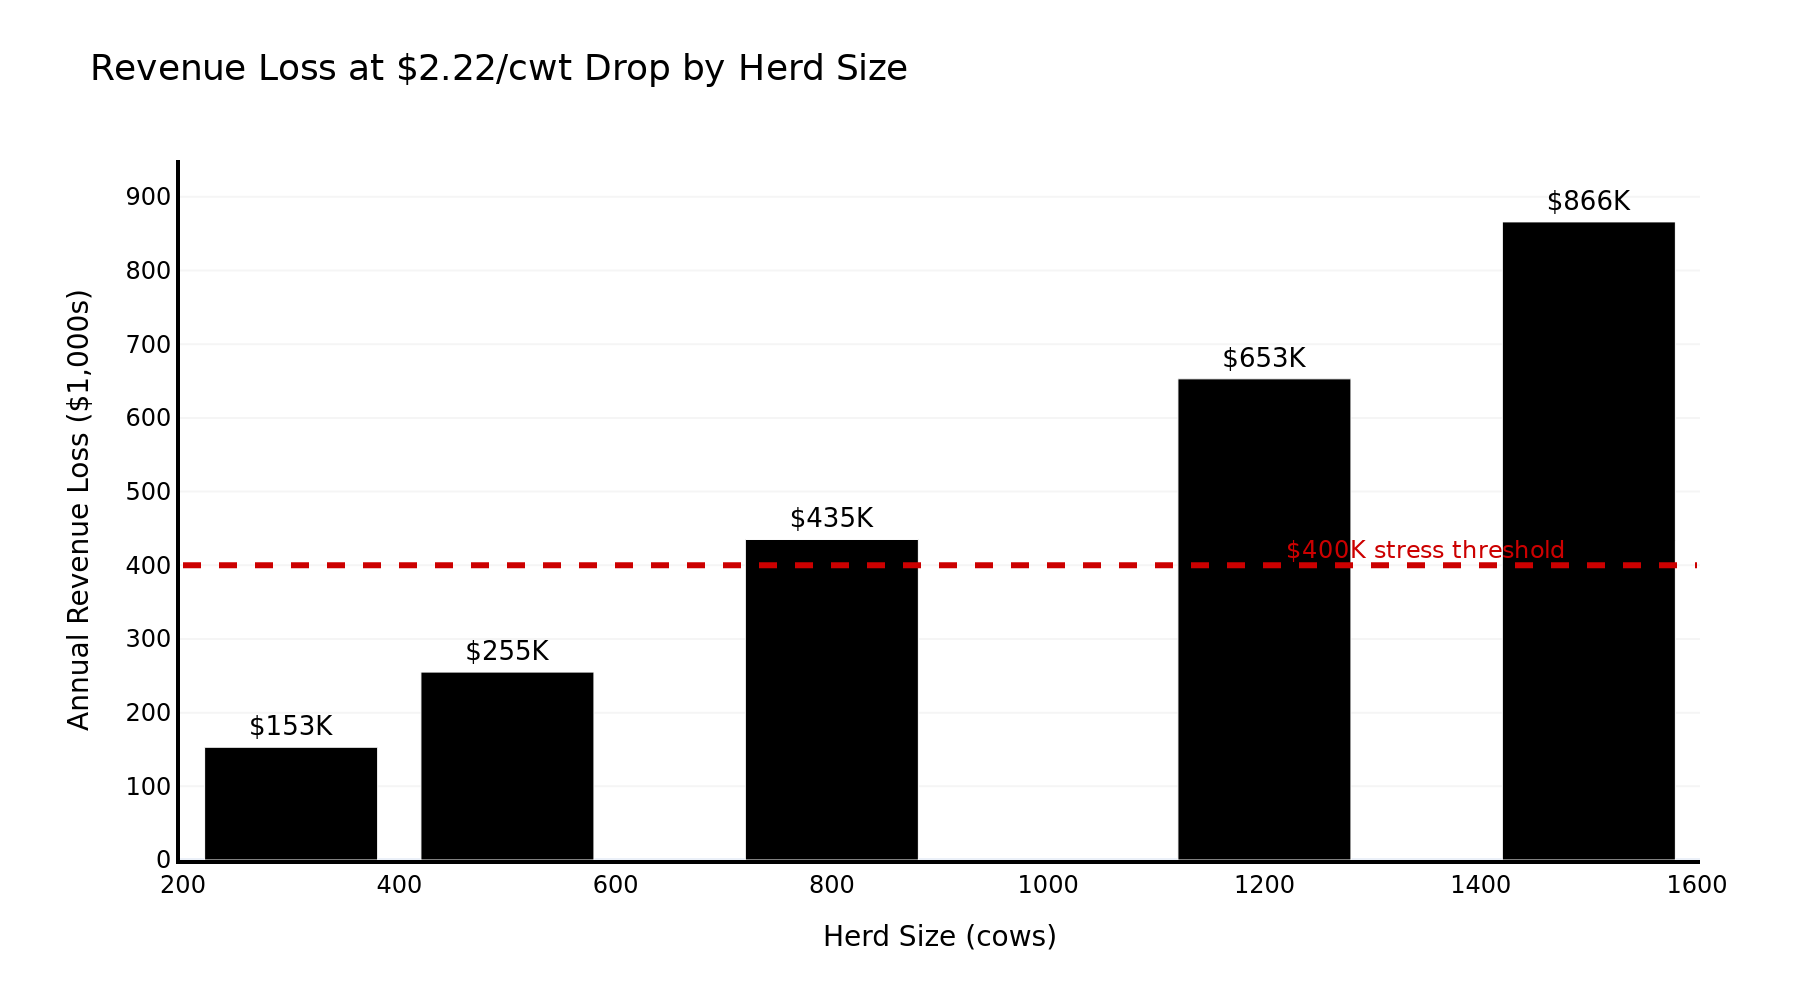
Spread across different herd sizes shipping milk:

Approximate Herd SizeCwt ShippedAdded Cost (US$/cwt)
200 cows55,0002.15
280 cows80,0001.48
400 cows110,0001.07

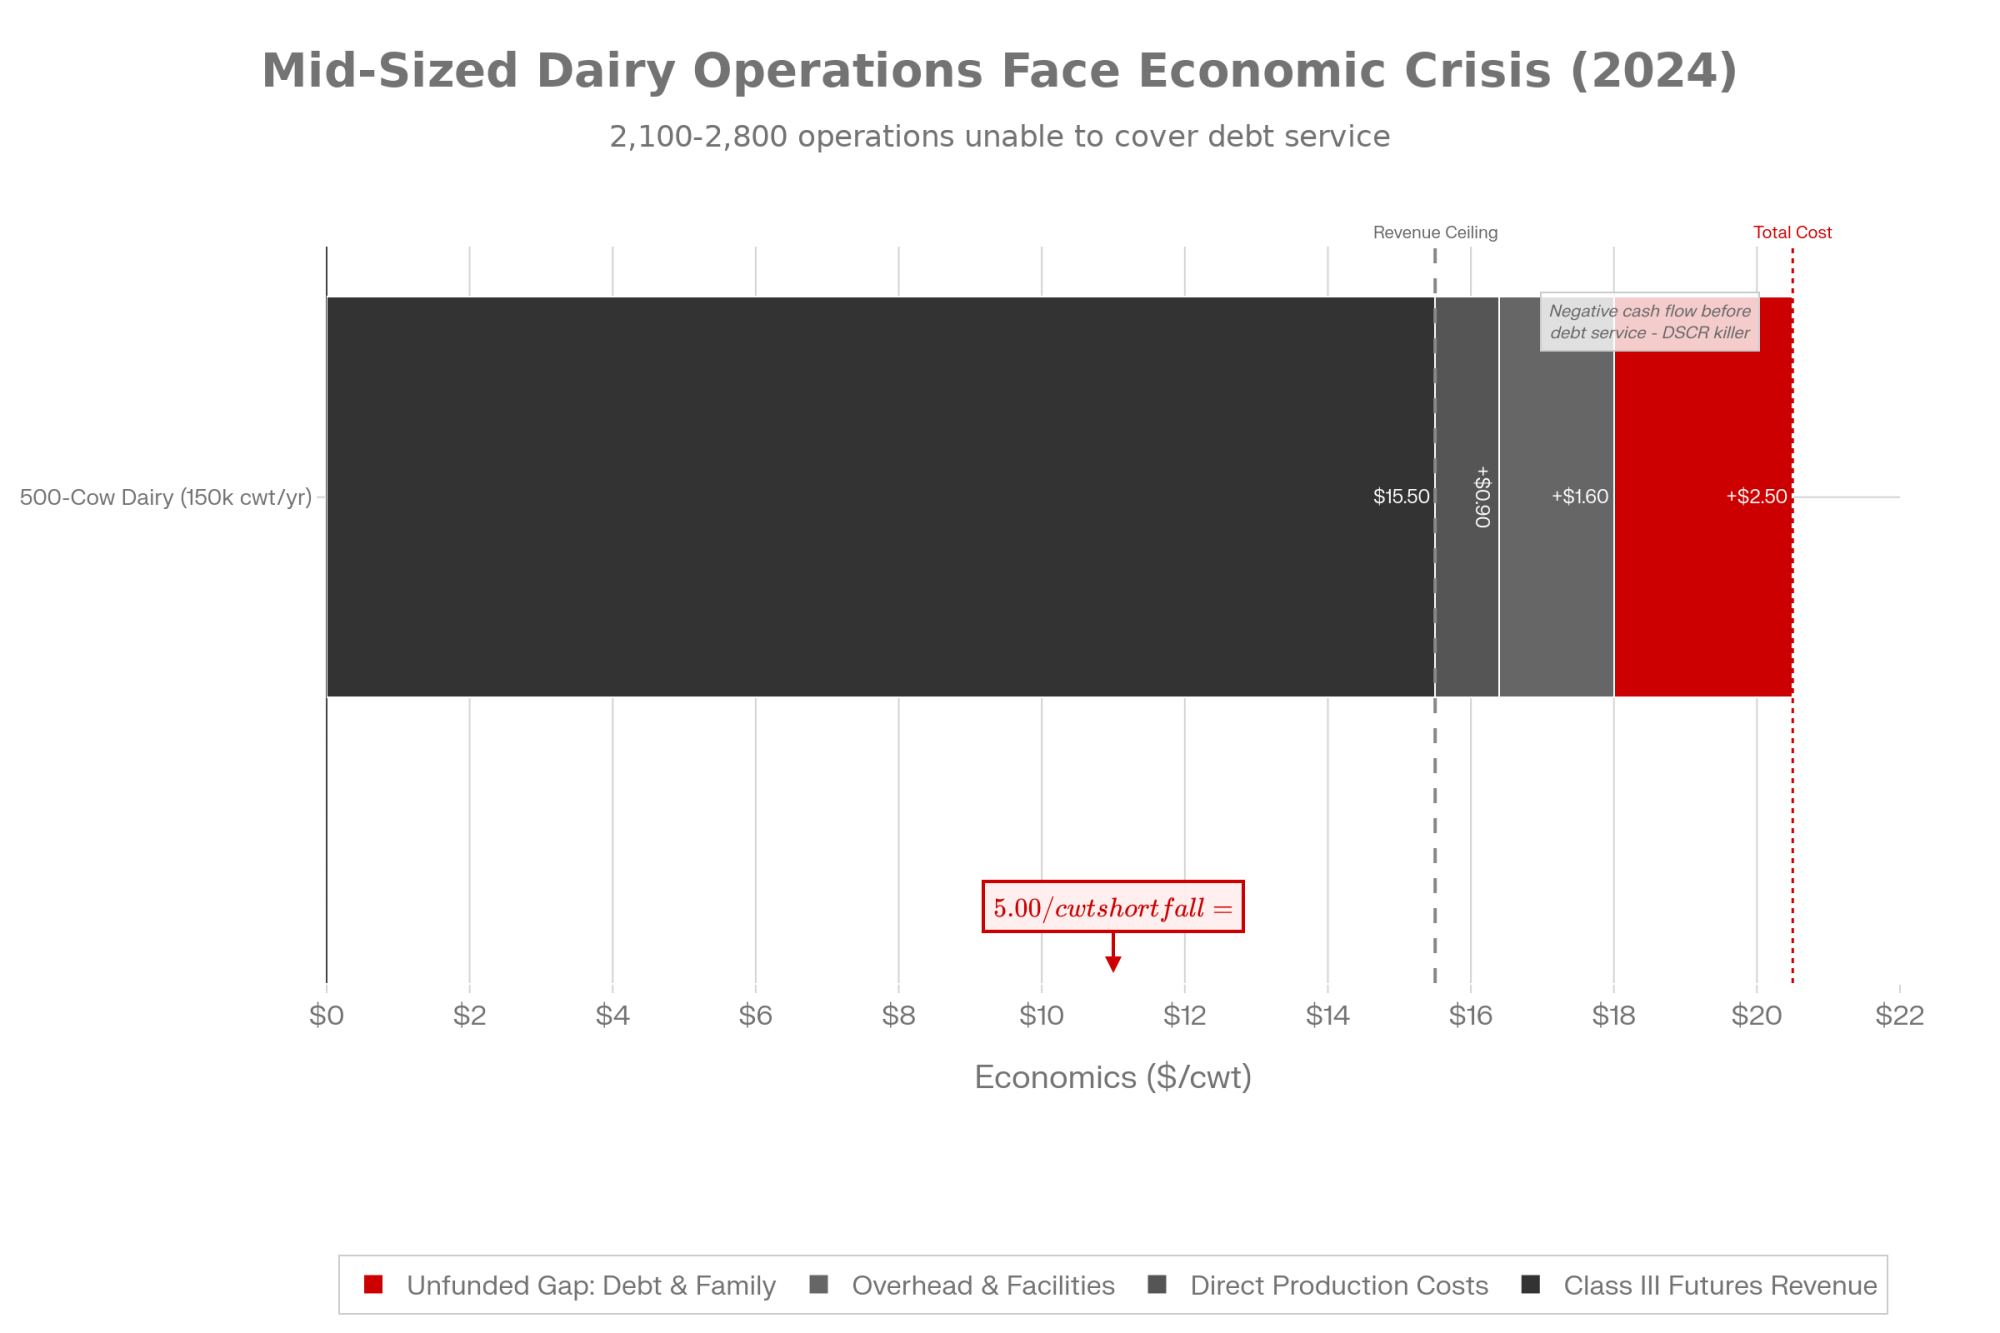
The smaller you are, the bigger the per‑unit hit. And if your margin was only $0.50–$1.00/cwt to start with, that’s the whole ballgame.

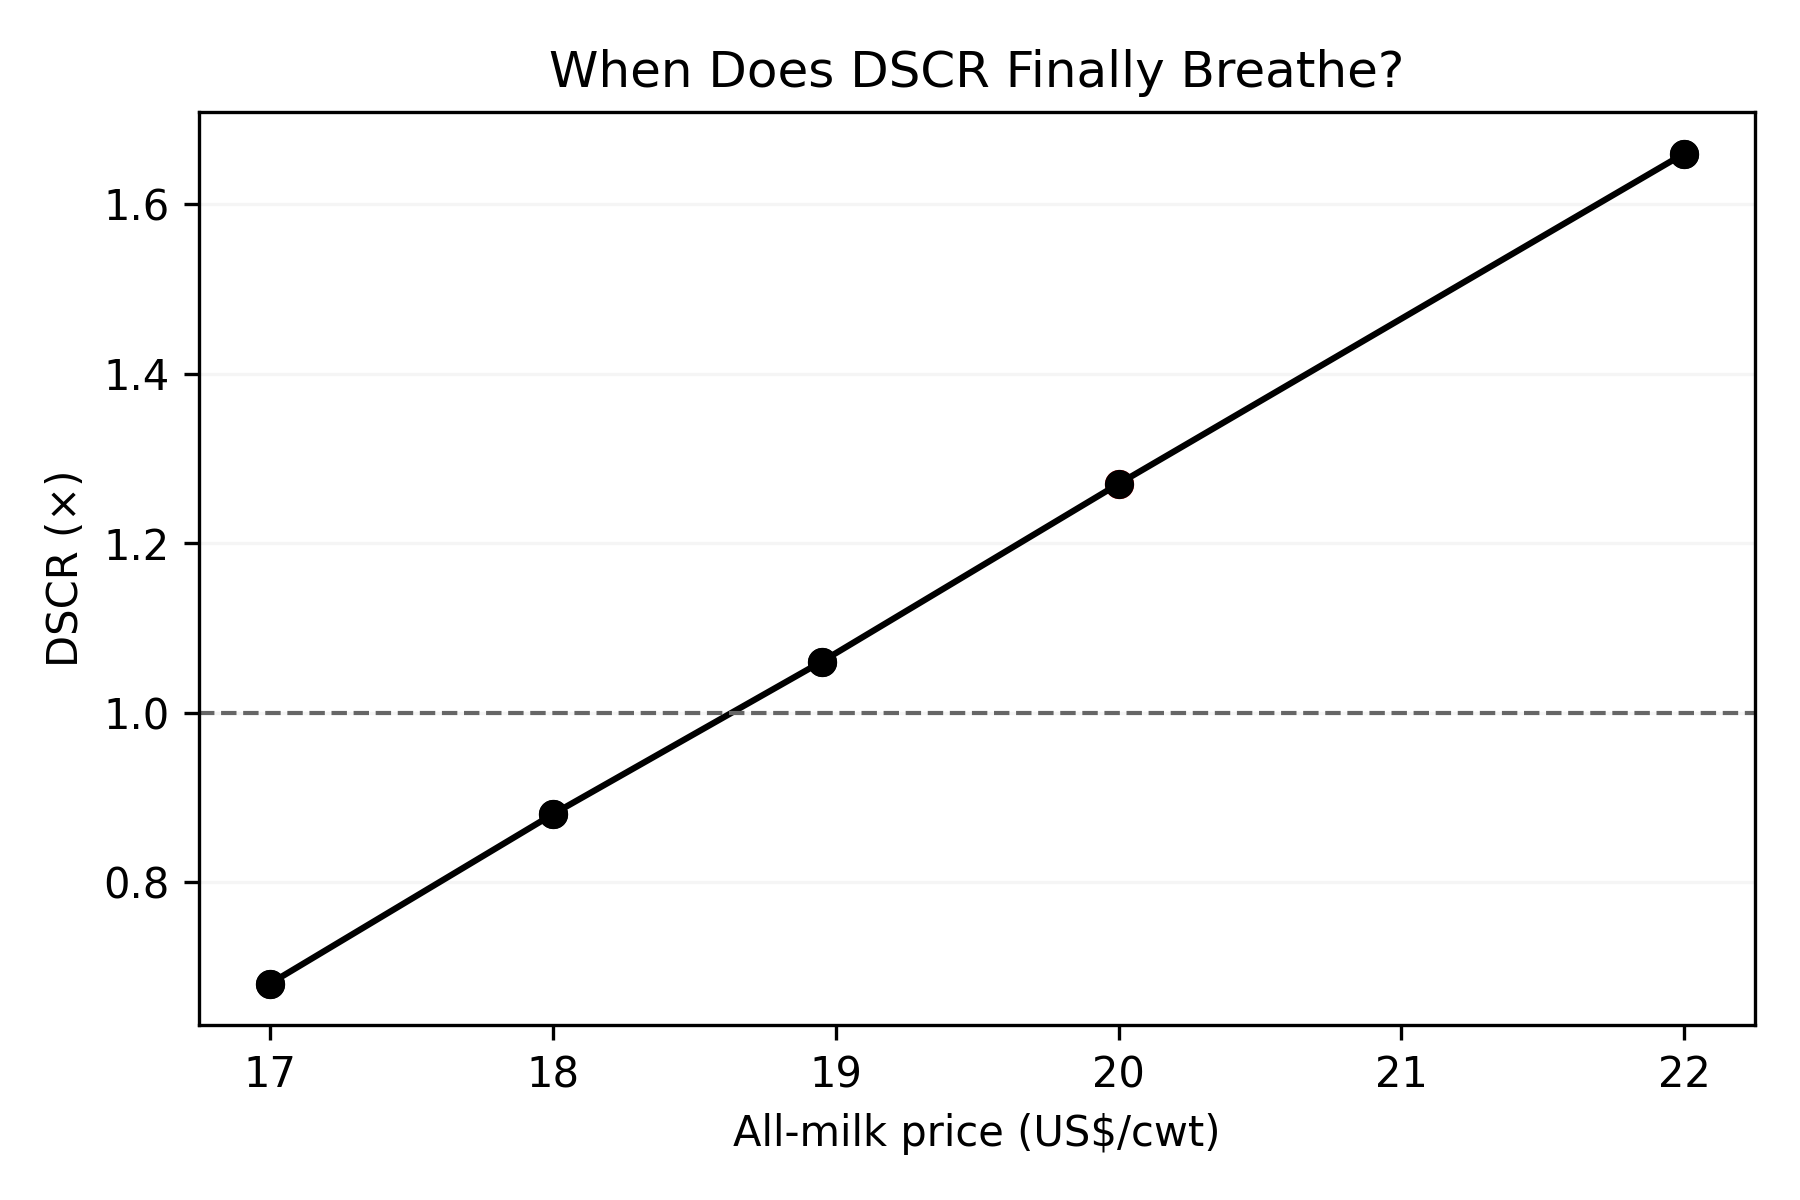
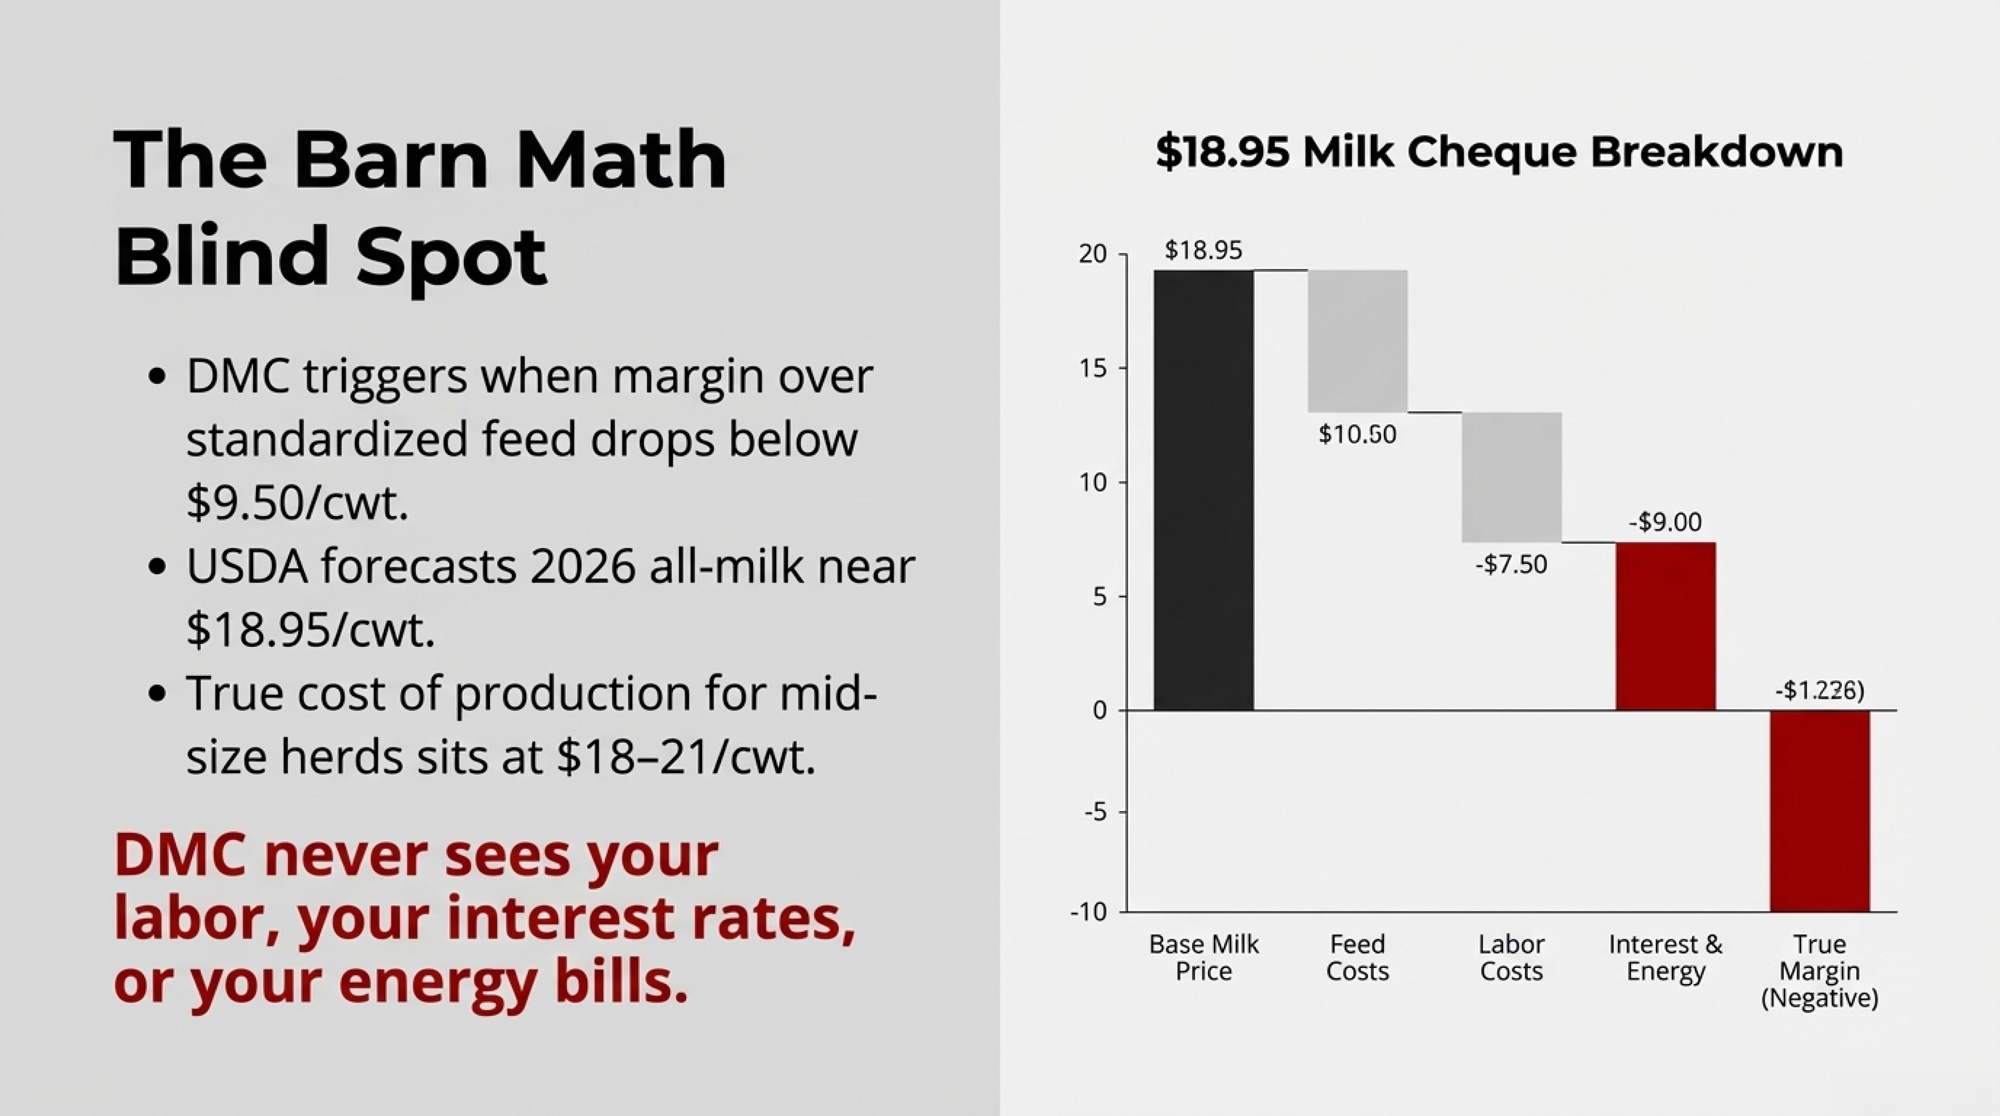
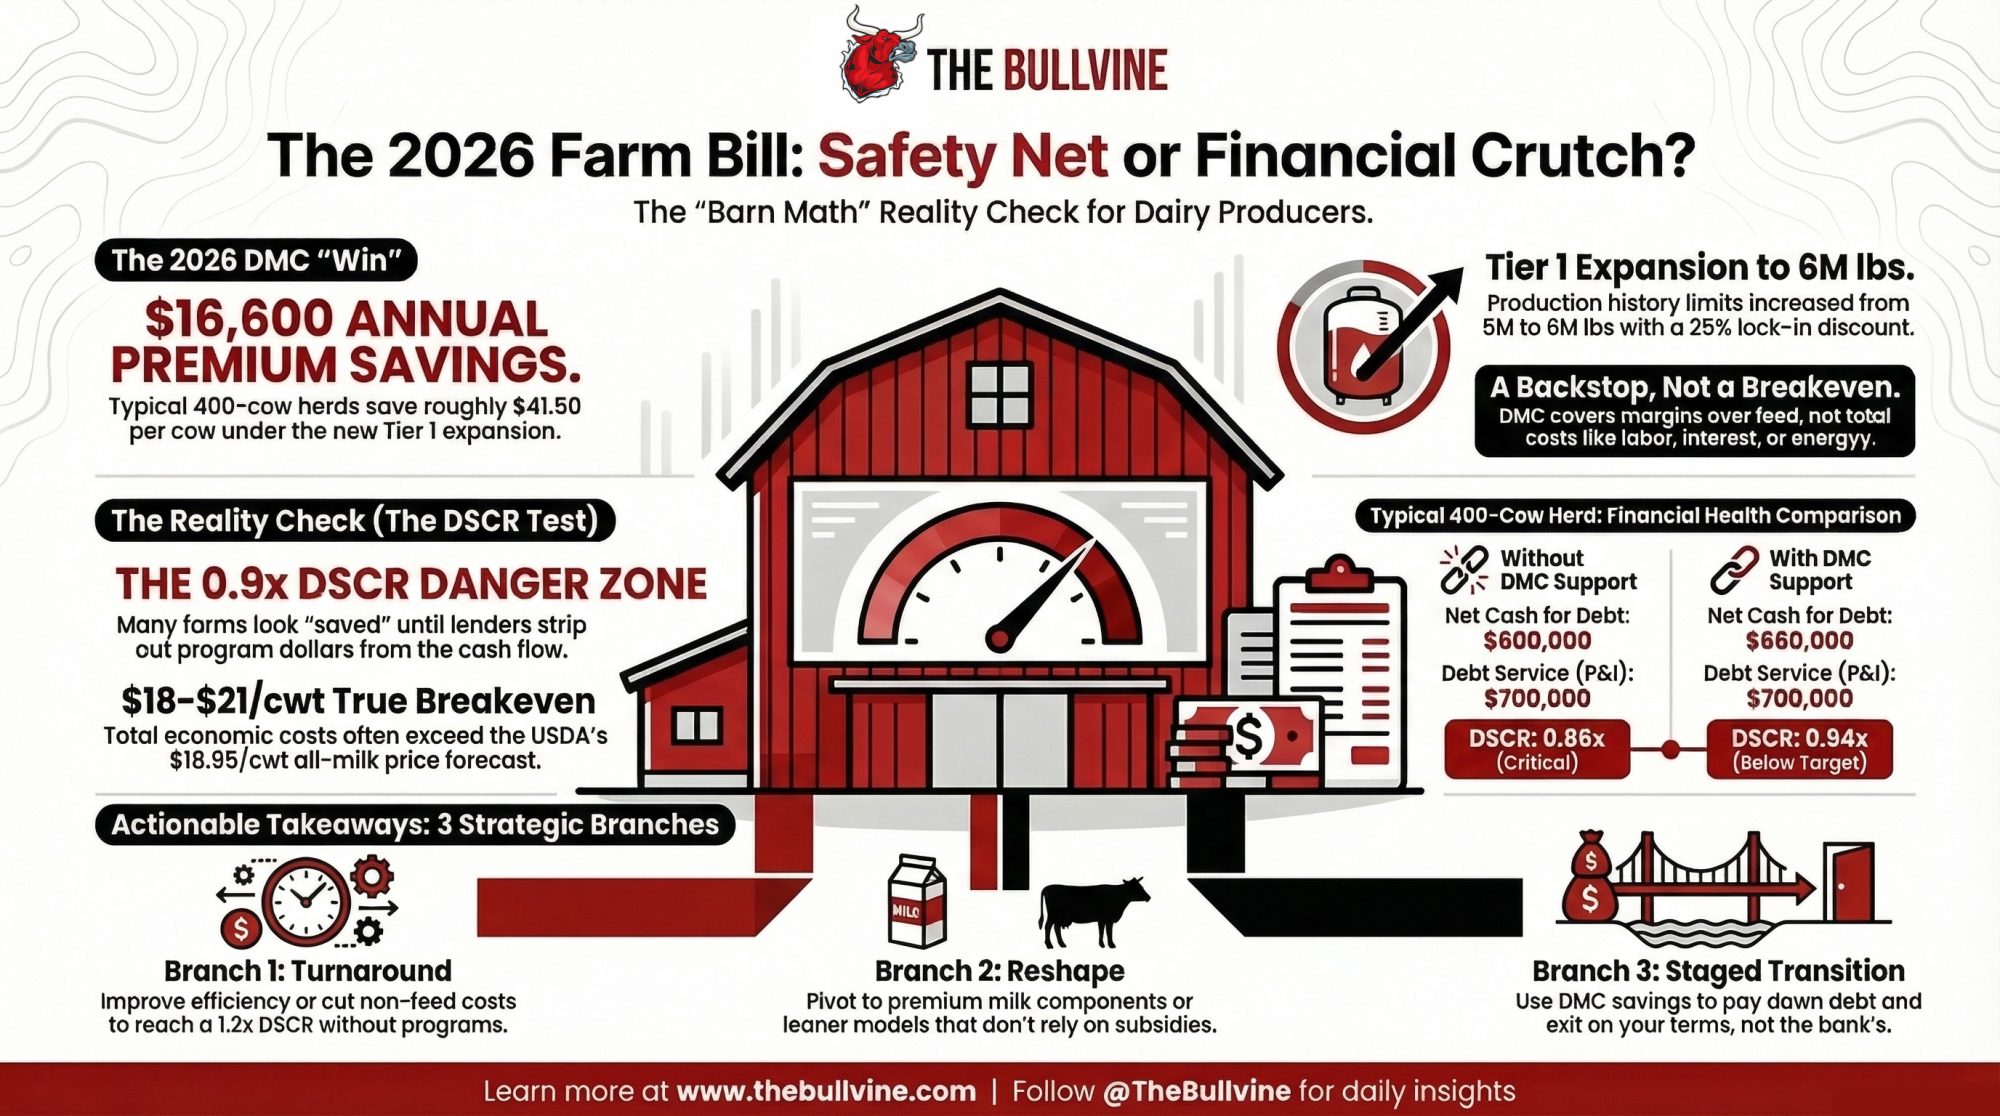
Now stress‑test DSCR for that 400‑cow, $4.5M‑debt scenario. Assume 110,000 cwt shipped and non‑debt cash operating costs around .50/cwt — efficient by Cornell’s standards, given that DFBS profitability data shows far higher averages across most farms. USDA’s early‑2026 WASDE pegged the all‑milk forecast at $18.95/cwt, down from a revised $21.17 for 2025.

WASDE updates monthly. If a newer report has landed between filing and publication, refresh both the all‑milk row and the DSCR column below.

All‑Milk PriceGross Revenue (110k cwt)Cash Costs (@ $13.50)Net Cash for DebtDSCR vs ~$565K P&IHow Your Lender Reads It
$17.00$1,870,000$1,485,000$385,000~0.68דWe have a problem.”
$18.00$1,980,000$1,485,000$495,000~0.88×Below 1.0× threshold
$18.95$2,084,500$1,485,000$599,500~1.06×Barely above water
$20.00$2,200,000$1,485,000$715,000~1.27×Comfort zone
$22.00$2,420,000$1,485,000$935,000~1.66×Strong

At $18.95 milk, you barely clear 1.0×. You need $20+ to breathe.

And that $13.50/cwt cost assumption is efficient. A 2023 Northeast summary reported a net cost of production of $22.64/cwt across member farms. If your cost base runs closer to $16–$17, the DSCR in this table deteriorates fast.

Go deeper: “$18.95 Milk, $19.14 Costs: USDA’s 2026 Milk Price ‘Upgrade’ Still Leaves Your Dairy in the Red” runs the full margin math band by band.

What DSCR Do Banks Really Want from Dairy Farms?

You can’t control your lender’s internal model. You can understand the target it’s aiming at.

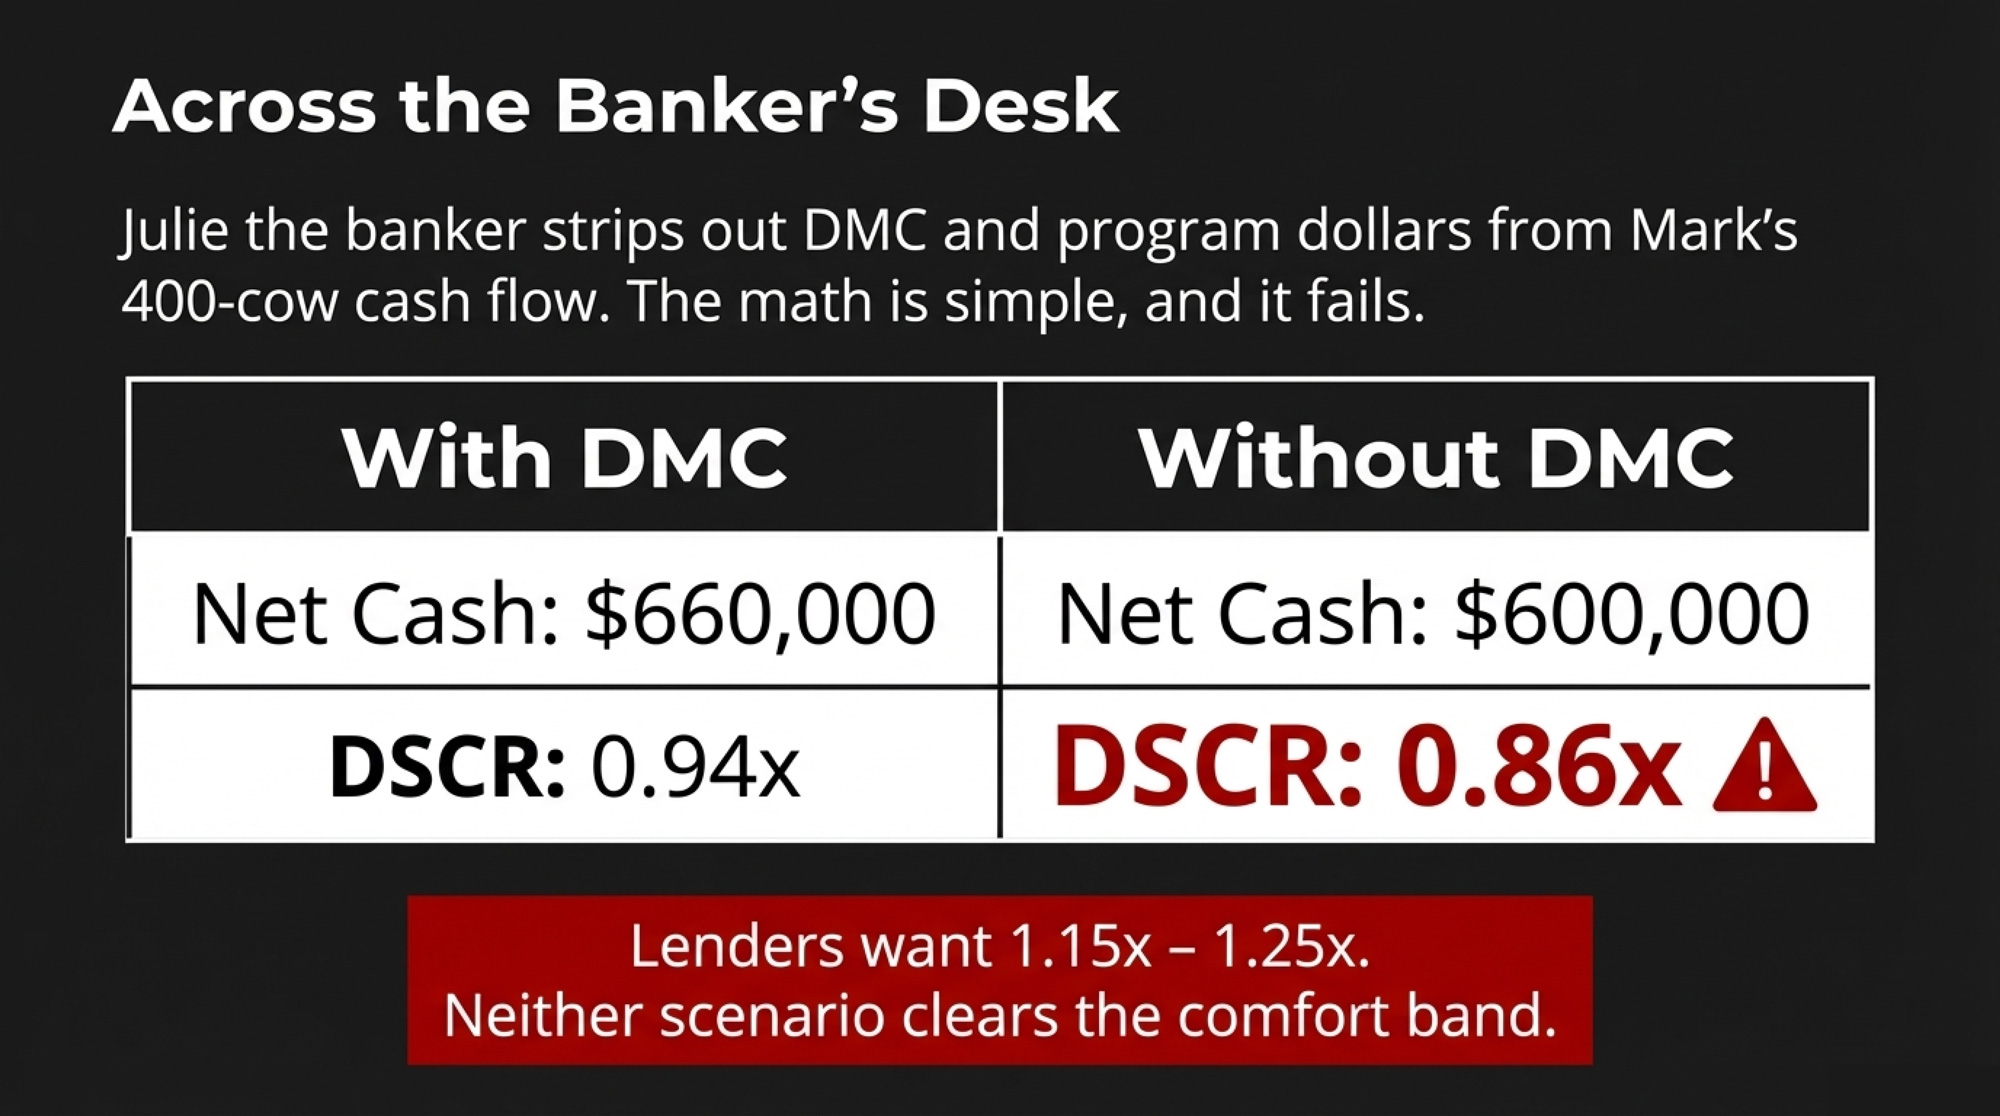
At its simplest: DSCR = net cash available for debt service ÷ total annual principal and interest. If your net cash is $400,000 and total payments are $320,000, your DSCR is 1.25× — the farm generates 25% more cash than it needs to make debt payments.
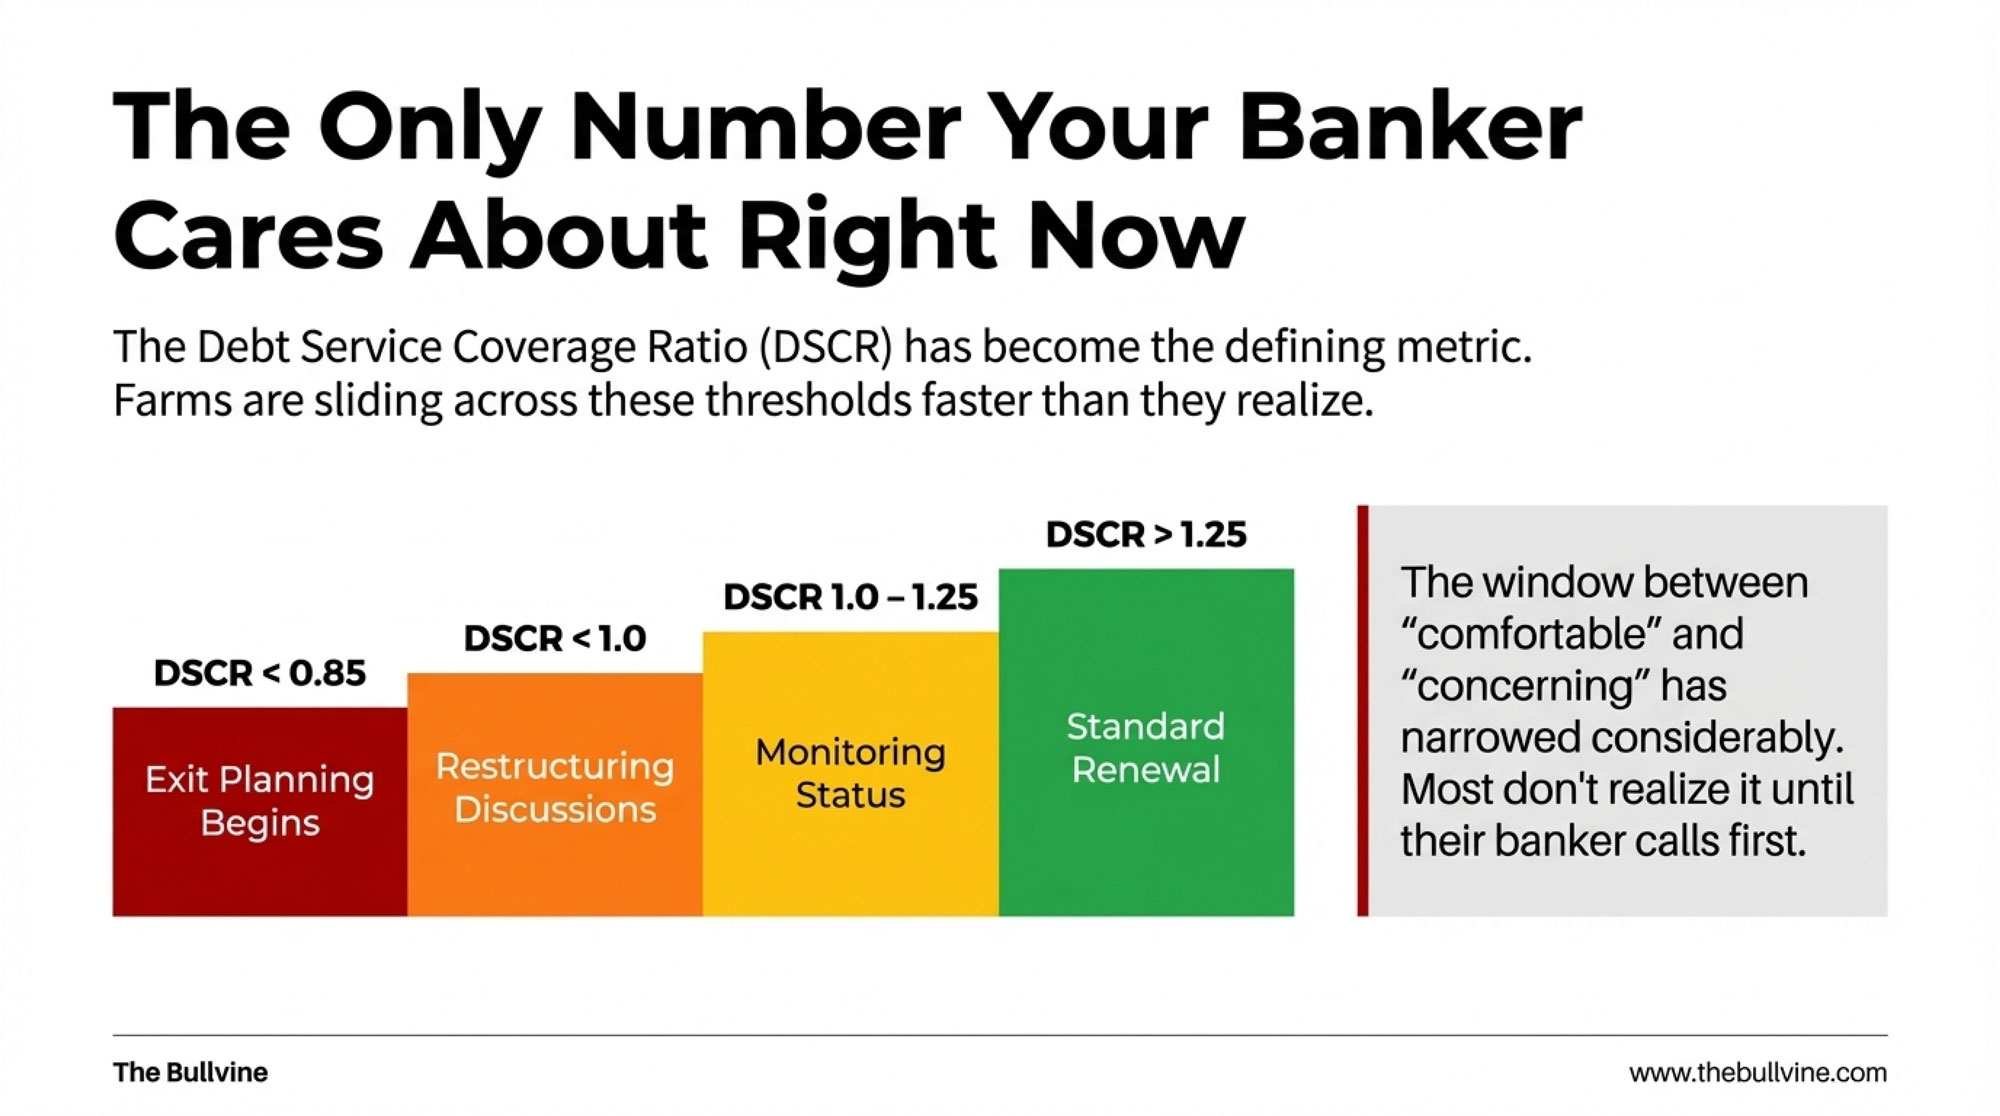
DSCR BandTypical Bank ViewWhat It Feels Like on FarmLender Response
Below 1.0×Not covering debt from cash flowScrambling to make payments, no bufferConditions, collateral pressure, restructure or exit talks
1.0–1.15×Thin, one bad month from troubleEvery breakdown or milk dip hurtsShort‑term tolerance only with a written plan
1.15–1.30דOkay, not great”Can sleep, but watch weather and milk priceFloor for flexible terms, new money around 1.25×
> 1.30×Strong performerCan invest and handle volatilityMore freedom on terms, structure, and covenants

Pulling from Cornell’s 2023 DFBS profitability comparison (129 New York herds):

  • Below 1.0×. Not generating enough cash to cover debt. The lowest‑profit group averaged 0.36×. Expect conditions, collateral calls, or hard conversations.
  • 1.0–1.15×. One bad month of milk, a feed mistake, or a breakdown can push you under. Some lenders will sit here short‑term, but only with a written plan to climb out.
  • 1.15–1.30×. Where a lot of mid‑size herds land when things are “okay, not great.” Many lenders treat 1.25× as the floor for new money or flexible terms. Cornell’s mid‑high profit group averaged 1.38×.
  • Above 1.3×. Strong. The top‑profit group ran at 2.95×. These farms tend to get more freedom on amortization schedules and covenant structures because the numbers back the story.

Here’s the catch. Your lender isn’t just running DSCR at today’s mailbox price. Chicago Fed data confirm that extensions and renewals on non‑real‑estate lending are increasing — a sign more borrowers are asking for extra time and banks are testing harder before granting it. If you walk in having only looked at your best‑case price, and the dashboard is staring at your worst‑case, you’re not even arguing over the same math.

Are You Giving Your Lender Enough Data to Fight for You?

A lot of good operators will quietly admit they’ve never walked into the bank with a real data packet. The lender knew them. The cows looked fine. Bills got paid.

In a dashboard world, being a good operator still matters — but mostly after the numbers clear the first screen. If you want your lender to push for you with a credit committee that’s never set foot in your parlor, you’ve got to hand them ammunition.

The Minimum Data Packet (200–1,500‑Cow Dairy)

For your next scheduled meeting — not an emergency — walk in with:

  • Last three years of financials. Tax returns (Schedule F), year‑end balance sheets, depreciation schedules.
  • Rolling 12‑month cost per cwt. At least broken into feed, labor, and “all other” operating costs.
  • Your current DSCR. Today’s loan balances, current interest rates, total annual payments.
  • Working capital snapshot. Current assets minus current liabilities — the metric Kauffman has specifically flagged as the one lenders are watching closest.
  • Leverage snapshot. Total debt divided by total assets. The DFBS average was 0.29 in 2023; know where you sit.

That alone puts you ahead of more farms than you’d guess.

What Actually Earns Better Terms

  • Three forward scenarios. Base case, a “$2/cwt lower milk” stress case, and a slightly better‑than‑today case.
  • A simple succession plan. Even a one‑page outline of who’s likely running the place in 5–10 years. Farm Credit and Extension communications increasingly treat succession as a formal credit factor, not just a family story.
  • Real‑time production data. Rolling herd average, butterfat/protein trends, voluntary cull rate — anything that shows you manage cows, not just cash.
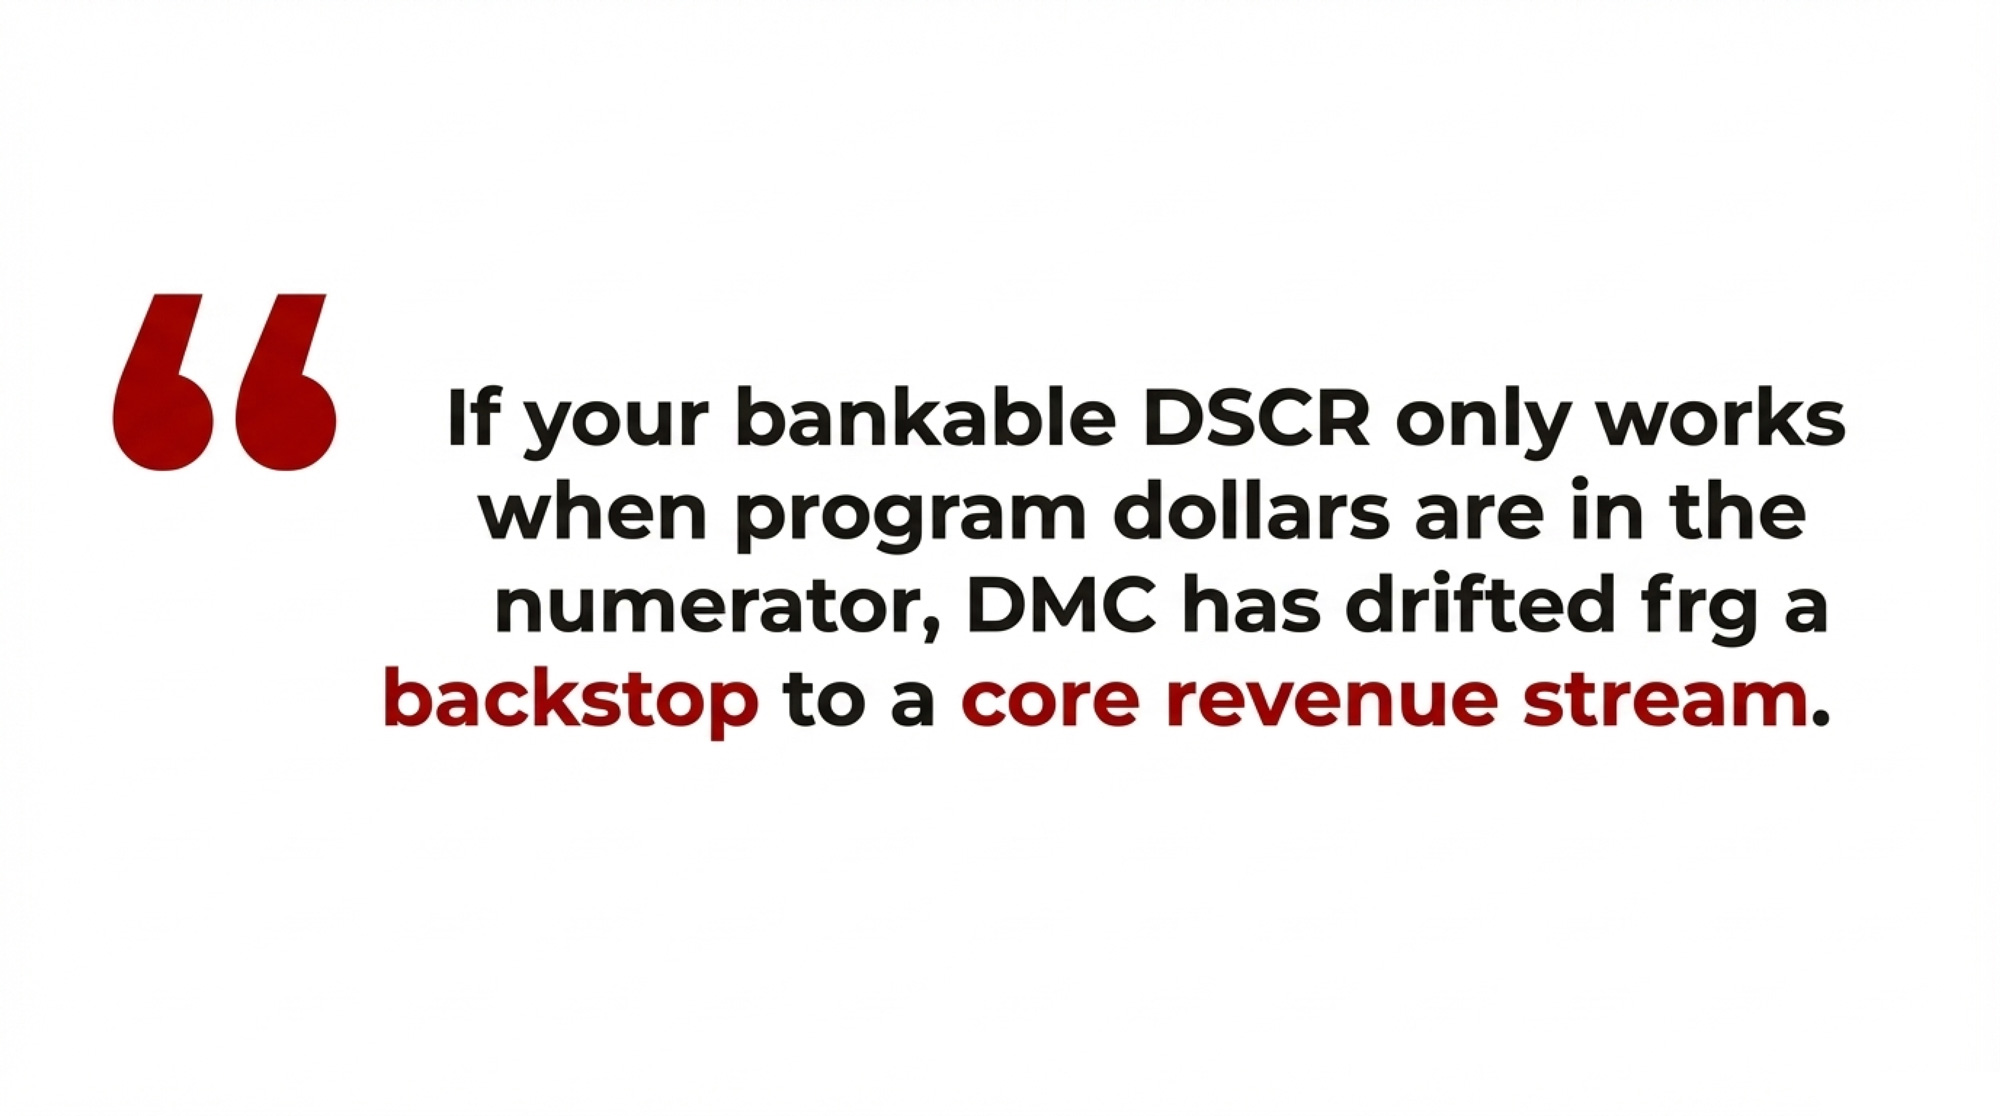
  • A non‑correlated revenue story. Beef‑on‑dairy receipts, custom heifer raising, crop sales, on‑farm processing. Anything not priced off the milk check strengthens your current‑asset picture in the bank’s model.
  • Rate‑index awareness. Know whether your current notes are fixed, variable over Prime, or tied to term SOFR. If you can’t tell the loan officer which index prices your operating line, you’re arguing blind.
  • FSA awareness. Know whether you qualify for USDA direct loans — well below commercial markets — and whether FSA‑guaranteed lending could improve terms with your current bank.

Red Flags That Trip Wires Fast

Patterns that, from lender and Extension farm‑management conversations, tend to push files straight into the risk bucket:

  • No updated personal financial statement after the lender asked for one.
  • No honest cost‑of‑production number.
  • No forward cash‑flow projection, even a simple one‑pager.
  • Farm and household expenses so tangled the lender can’t separate them.
  • A flat refusal to discuss succession.
  • No idea whether your rate is fixed or floating — or over what index.

When your dashboard numbers are already thin, any one of these pushes a lender toward higher rates, tighter covenants, or a quiet “no.”

Options and Trade‑Offs for Farmers

You don’t control interest rates. You control how you show up in front of the dashboard over the next 12 months.

1. Upgrade Your Data Game (30‑Day Action)

Start here if you plan to keep milking at least 3–5 years, you’re not insolvent, but you honestly don’t know your DSCR or cost per cwt.

This month: Pull 12 months of milk checks and main expense categories. Build a rolling 12‑month cost per cwt using a simple spreadsheet or FINPACK template from Extension. Calculate your DSCR. Then book a meeting with your lender specifically to review your data — not to ask for money.

You walk in knowing where you stand instead of hoping. Your lender sees someone running toward the problem, not hiding.

The risk: You may not like that first DSCR number. But you can’t fix a ratio you won’t look at.

2. Restructure Before You’re Forced To

Move here if your DSCR is hovering near or just below 1.0×, you still have land equity, and your next big renewal is 6–24 months out.

What it takes: Map every loan on one page — balance, rate, index (fixed, Prime‑based, SOFR‑based), remaining term, payment. Model what happens if milk averages $2/cwt less than last year. Be open to extending terms on some debt or selling a non‑core asset. Oppedahl has pointed out in recent AgLetter commentary that some farms will need to sell land to help fund operations — it goes better if you initiate that conversation.

What you gain: Breathing room. A lender looking for a reason to keep you often will stretch a major note from 14 to 25 years, saving about $47,000 a year in payments on $1.8M at roughly 7.25% — enough to move DSCR out of the red.

What you give up: More total interest over the life of the loan. You’re buying flexibility today with future dollars. Move early and you help design the restructure. Wait, and somebody else does it for you.

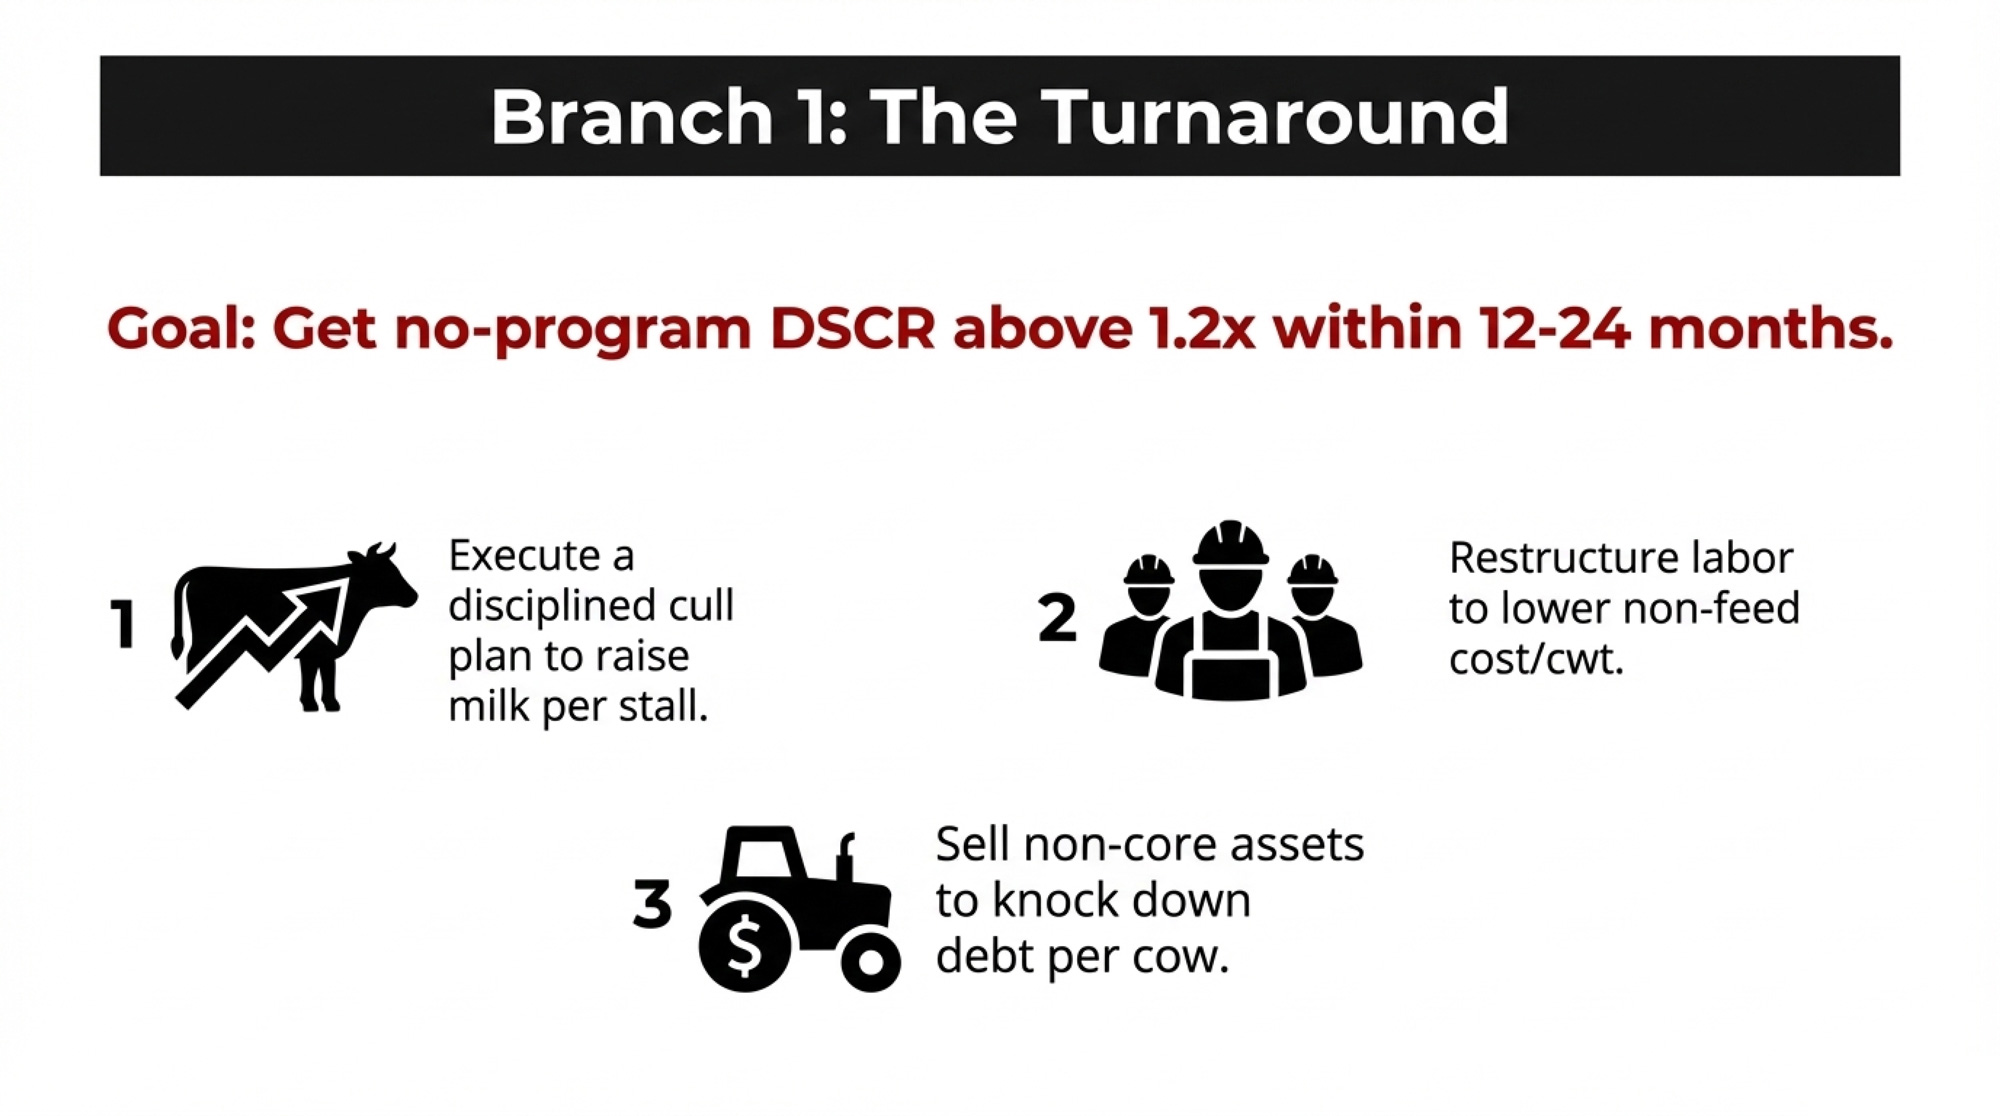
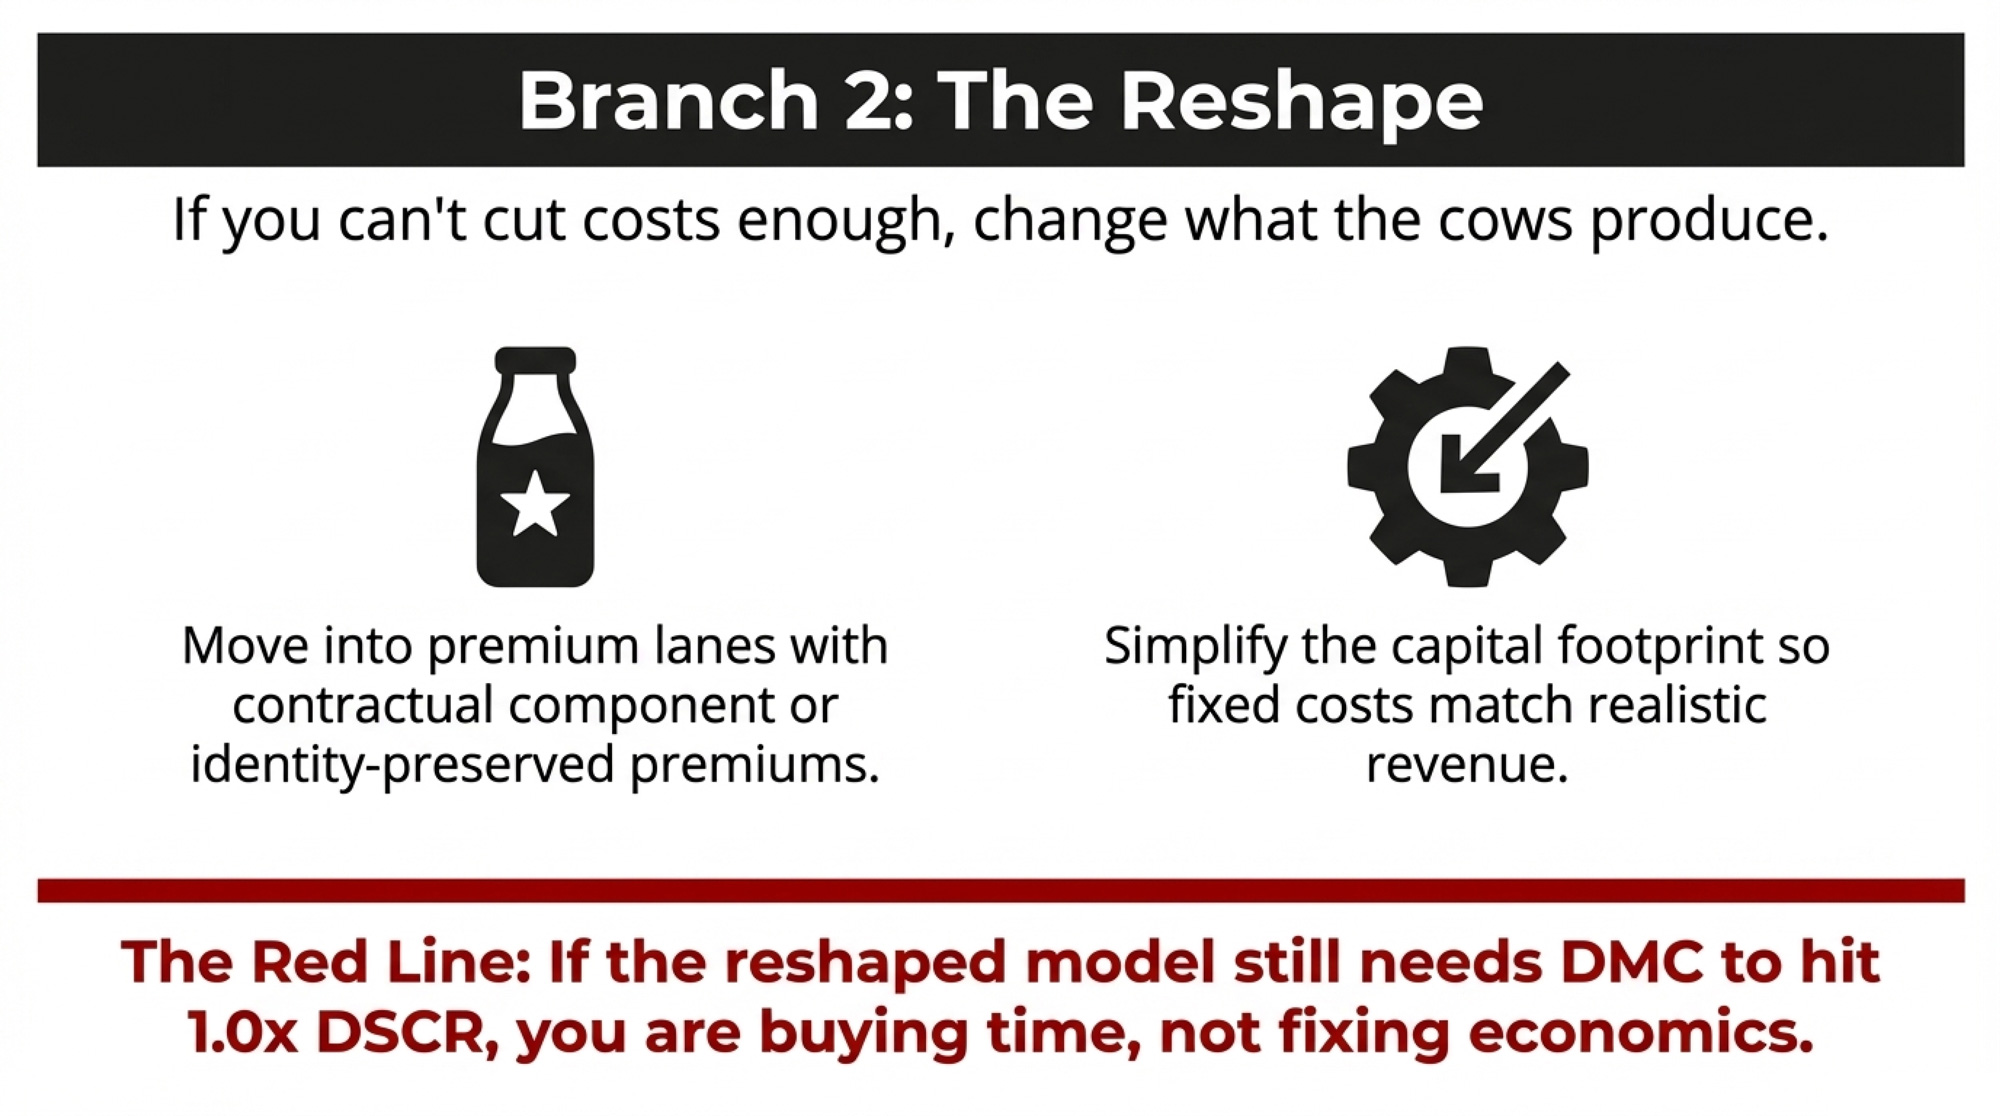
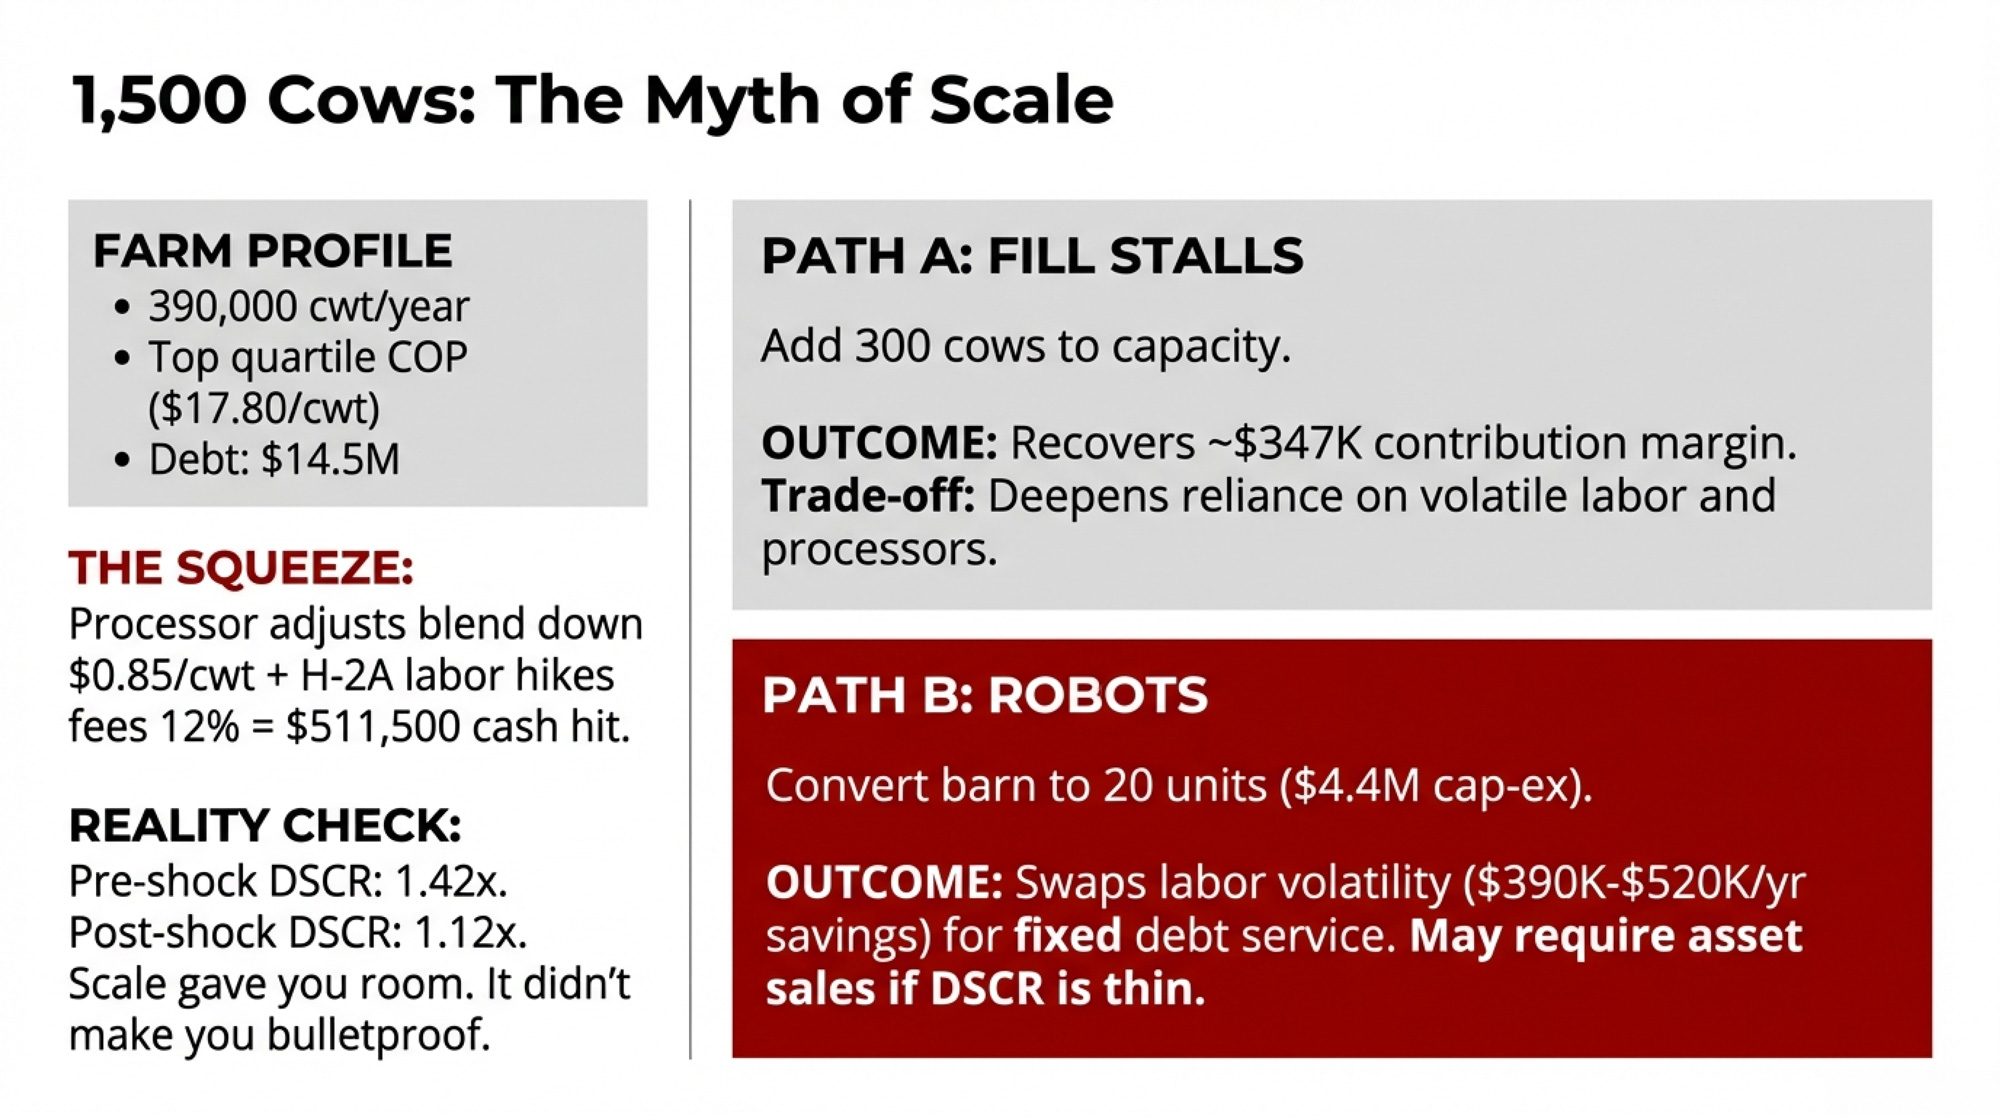
3. Double Down on Margin, Not Size

This is the right path when you’re not set up to add cows cheaply, but there’s room to improve component premiums, beef‑on‑dairy revenue, or trim operating costs.

What it takes: Honest benchmarking of feed, labor, and machinery cost per cwt against peers. A focused 12‑month plan to raise butterfat/protein, add beef‑cross value, or shave specific costs. Cornell’s DFBS tells the story bluntly: the spread in debt coverage between the lowest‑profit group (0.36×) and highest (2.95×) wasn’t mainly about herd size or premiums — it was about cost discipline that drops straight to the DSCR line.

On a 600‑cow herd shipping 170,000 cwt, a $1.00/cwt cost reduction is worth $170,000 a year. Premiums help. Cost discipline changes your DSCR. A solid beef‑on‑dairy program gives the bank a revenue line that isn’t riding the Class III roller coaster.

The risk: Chasing premiums with extra labor or purchased feed can backfire if costs rise faster than the bonus. Measure tightly.

4. Plan an Exit While You Still Have Leverage

Consider this one when you’re past 60, heirs aren’t coming back, DSCR is under 1.0×, and you’re tired of wondering which letter from the bank is “the one.”

What it takes: A farm transition specialist or attorney. Early, blunt conversations with your lender about what a cooperative exit looks like. The willingness to say, “We might be better off leaving on our own terms.”

Across several Midwest cases, Bullvine’s analysis suggests strategic exits with 7–18 months of planning preserve roughly $400,000–$680,000 more family equity than forced sales — a margin close to the $480,000 equity gap between strategic exit and forced sale we’ve documented in prior case work. The difference between “retire with options” and “start over in town.”

The risk: Emotionally brutal. Some relationships fray. But the math usually gets worse, not better, if you delay.

Go deeper: “Only 12% of Dairy Farms Make It to Generation Three — Here’s What’s Different About the Ones That Do” is the companion read for families wrestling with this path.

Key Takeaways

  • If your DSCR sits below 1.15× today, treat it as a yellow light. Cornell’s lowest‑profit group averaged 0.36× — they didn’t get there in one quarter. Run your own stress test at $17 milk and talk with your lender before you drift under 1.0×.
  • If you can’t list your total annual debt payments on one sheet of paper, your lender has more clarity on your risk than you do. Within 30 days: list every note and operating line, add up annual P&I, calculate your DSCR.
  • If your plan assumes rates “go back to normal,” it’s not a plan. Commercial operating rates sat in the mid‑7% range through late 2025 and early 2026, and new paper is increasingly variable over Prime or term SOFR. Model your next two years at today’s rates and one notch higher.
  • If more than 90% of your revenue comes off the milk check, your balance sheet is more fragile than your lender’s model likes. Beef‑on‑dairy, custom work, or crop sales aren’t just extra cash — they’re non‑correlated revenue that strengthens how the dashboard reads your farm.
  • If you want your lender to fight for you in the credit committee room, hand them a story their dashboard can tell. A real cost‑of‑production number, a forward cash‑flow, and at least a rough succession outline.

The next time you sit across from your loan officer, the screen between you will quietly shape how hard they can push on your behalf.

You don’t control that dashboard. You do control whether it shows a fuzzy picture or a sharp one. For the deeper math — DSCR across five milk‑price bands, how Dairy Margin Coverage and FMMO changes interact with lender risk scoring, and the full cost‑of‑production playbook — watch for the next “Dairy Lender Files” installments in The Bullvine Weekly.

If the numbers are weighing on you, don’t carry it alone. Call or text 988 for the Suicide & Crisis Lifeline. For dairy‑specific support, reach out to Farm Aid at 1‑800‑FARM‑AID, your state farm‑mediation service, or your Extension farm management program.

Do you know your DSCR today? If not, the computer does. It’s time to see the same screen.

Complete references and supporting documentation are available upon request by contacting the editorial team at editor@thebullvine.com.

Learn More

The Sunday Read Dairy Professionals Don’t Skip.

Every week, thousands of producers, breeders, and industry insiders open Bullvine Weekly for genetics insights, market shifts, and profit strategies they won’t find anywhere else. One email. Five minutes. Smarter decisions all week.

NewsSubscribe
First
Last
Consent

The $16,600 DMC Farm Bill “Win” vs a 0.9x DSCR: The 2026 Decision for 400‑Cow Herds

Your 400‑cow herd can “win” $16,600 on DMC in 2026 and still sit at 0.9x DSCR the minute your banker deletes those dollars from the cash‑flow.

Executive Summary: In 2026, a typical 400‑cow U.S. herd can save about $16,600 in DMC premiums on 6 million pounds — roughly $41.50 per cow — and still sit at 0.9x debt‑service coverage once the banker removes DMC and other program dollars from the cash‑flow. The piece shows the barn math step‑by‑step: $1.66/cwt DMC premium savings, $18.95/cwt all‑milk outlook, and $18–21/cwt true breakeven costs that leave many mid‑size herds below the 1.15–1.25x DSCR comfort band lenders want. It argues that when DSCR clears only 1.0–1.1x with DMC included, DMC has shifted from a safety net to a crutch for a business model that doesn’t pencil. From there, it outlines three realistic branches for 300–500‑cow herds: a turnaround to get “no‑program” DSCR above 1.2x, a reshape into a leaner or premium model, or a staged transition that uses DMC, FSA, and EQIP to protect equity and control timing instead of waiting for the bank to decide. The article also shows which farm‑bill tools actually move your cheque, showing where FSA loan limit increases, EQIP/methane funding, DNIP, and school milk changes genuinely move your milk cheque” or “your margins. It closes with a simple test every operator can run over the next 30 days: calculate DSCR with and without DMC, and ask whether your lender would continue financing the version that stands on its own.

2026 Farm Bill Trap

A lot of 400‑cow U.S. dairies look “saved” by the 2026 farm bill on paper. Strip out DMC and other program dollars, and some of those same farms are sitting at about 0.9x debt‑service coverage — not generating enough cash to cover principal and interest on their own.

That’s exactly where a composite 400‑cow freestall operator we’ll call ‘Mark’ lands in 2026. His freestall saves roughly $16,600 a year on Dairy Margin Coverage premiums thanks to the new Tier 1 expansion — about $41.50 per cow. Early‑2026 Extension analysis suggests several months of $1‑plus/cwt DMC indemnities on covered milk if margins track the 2019–2023 pattern at the kitchen table, that looks like protection.

Across the lender’s desk, once his banker, Julie, pulls DMC and other program dollars out of the cash flow, the number is simple: around 0.9x DSCR. Without government support, the cash flow doesn’t fully cover annual debt service.

All numbers and policy tools in this piece refer to U.S. non‑quota herds operating under federal programs (DMC, FSA, EQIP, DNIP).

Composite scenario built from producer and lender patterns, Extension data, and ag‑lending benchmarks — not a single real named farm.

“The Farm Bill Saved Us”… Or Did It?

Mark looks a lot like many mid‑size family dairies in 2026. He milks 400 cows, ships about 11 million lbs/year — roughly 110,000 cwt. Two capital projects sit behind him: a parlour upgrade and manure system work, both financed when rates were low and now reset to higher levels. His labour mix mirrors the broader industry — a 2015 Texas A&M/National Milk Producers Federation study estimated immigrant workers account for roughly 51% of U.S. dairy labour and produce close to 79% of the nation’s milk.

On the policy side, he’s done everything right in the new farm‑bill world:

  • Maxed Tier 1 DMC at $9.50/cwt on the expanded 6 million lbs production history limit, after USDA raised Tier 1 from 5 to 6 million pounds and allowed history updates to each farm’s highest year from 2021–2023.
  • Locked in the six‑year DMC commitment with a 25% premium discount on Tier 1 premiums from 2026 to 2031.
  • Layered revenue protection on part of his milk to catch the downside that the DMC formula doesn’t see.

On paper, that’s a safety‑net success story. The deeper math tells a different story.

DMC history between 2019 and 2023 shows the margin trigger paying indemnities in roughly half the months at $9.50 Tier 1 coverage, per Farm Bureau and Extension DMC analyses. But in months where the official DMC margin sat near $12/cwt, many farms were still unprofitable once non‑feed costs were layered in. USDA ERS 2021 ARMS data puts the full economic cost of production at roughly $20.54/cwt for 500–999‑cow U.S. herds and $19.14/cwt for herds of 1,000+. Multi‑state Extension work — including UW–Madison benchmarks for mid‑size Wisconsin dairies — lands full costs around –19/cwt.

For Mark, the picture snaps into focus:

  • A realistic, fully loaded breakeven in the high‑teens to low‑$20s/cwt.
  • A DMC margin trigger that calls the farm “covered” as long as income over standardized national feed costsstays above $9.50/cwt — with no view of labour, interest, energy, or family draw.

The comfortable story in a lot of 2026 farm‑bill coverage: “With the new DMC and FSA tools, mid‑size dairies are finally protected.”

The minute Mark’s scenario hits a DSCR calculator, that story flips.

What Does the 2026 DMC Expansion Really Do for a 400‑Cow Herd?

Four changes matter most for a herd like Mark’s:

  • Tier 1 coverage jumps to 6 million lbs of production history, up from 5 million.
  • Production history can be updated to the farm’s highest annual marketings from 2021, 2022, or 2023.
  • six‑year lock‑in offers a 25% discount on Tier 1 premiums if you enroll in the same coverage from 2026 to 2031.
  • Tier 1 premiums for $9.50 coverage: $0.15/cwt (before the lock‑in discount).

The Premium Math: Where $16,600 Comes From

Swap in your own production numbers:

  • Extra milk moving from Tier 2 to Tier 1: 1,000,000 lbs (the new 6M minus the old 5M cap).
  • Old Tier 2 premium at $8.00 coverage (comparable risk level): $1.81/cwt.
  • New Tier 1 premium at $9.50 coverage: $0.15/cwt.
  • Per‑cwt savings: $1.81 − $0.15 = $1.66/cwt.
  • Annual premium savings: 10,000 cwt × $1.66 = $16,600/year.
  • Per cow: $16,600 ÷ 400 = $41.50/cow/year.

That’s money you keep whether DMC pays a dime in indemnities. If 2026 margins track the 2019–2023 pattern, total indemnities could add tens of thousands more, depending on how long margins remain below the $9.50 trigger.

Real cash. The kind that catches up feed bills and keeps the operating line from going deep red.

But the catch is what DMC pays on. It’s the margin over the standardized feed, not the full cost of production. Farm Bureau’s March 2026 analysis calls it a “vital backstop showing its limits” for exactly this reason — it never sees the gap between a $9.50 margin and a $20‑plus all‑in cost on many farms.

So when Julie runs 2026 projections on Mark’s herd, she does it two ways:

  1. With DMC and other program income in the numerator.
  2. Without any program income at all.

That’s where the 0.9x shows up.

What Does a 0.9x DSCR Really Mean for a 400‑Cow Herd?

Here’s the barn math a lot of 400‑cow producers and their lenders are walking through right now.

Assumptions (national outlooks + farm‑level benchmarks):

  • Herd: 400 milking cows, ~27,500 lbs/cow/year → 11 million lbs, or 110,000 cwt.
  • Milk price scenario: USDA’s February 2026 WASDE puts the annual all‑milk forecast near $18.95/cwt. Once basis and component adjustments hit the cheque, the realized price can land several dollars lower.
  • Full cost of production: $18–21/cwt depending on herd size, efficiency, and region (USDA ERS 2021 ARMS; UW Extension mid‑size Wisconsin benchmarks).
  • Annual debt service: In this composite, Mark carries $600,000–900,000 in annual P&I — roughly $1,500–2,250 per cow. That’s not a national average; it’s a realistic range from lender examples and recent mid‑size capital projects.

For DSCR, lenders go back to basics:

(Milk and other income − cash expenses) ÷ annual principal and interest.

The Lender’s Circle

Julie slides the printout across the desk and circles two numbers:

MetricWithout DMC & ProgramsWith DMC & Programs
Annual Milk Sales (110,000 cwt @ $18.95/cwt)$2,084,500$2,084,500
DMC Premium Savings$0$16,600
Other Cash Expenses$1,484,500$1,484,500
Net Cash Available for Debt Service$600,000$660,000
Annual Debt Service (P&I)$700,000$700,000
DSCR0.86x0.94x
Lender Comfort Zone1.15–1.25x1.15–1.25x

Adjust a few assumptions — slightly higher net cash, slightly lower debt service — and you can push the “with DMC” number just north of 1.1x. Without DMC, it sags back toward 0.9x.

Most ag‑lenders treat a DSCR of roughly 1.15–1.25x as their comfort zone. Anything under 1.0x signals cash‑flow that can’t service its own debt without outside help.

Neither number in that table clears the band. One looks less alarming.

The Turn: Is DMC Your Backstop or Your Business Model?

That question is Mark’s turn, and for a lot of 300–500‑cow operations, reading the same headlines.

The comfortable narrative has sounded like this: DMC is stronger and cheaper. FSA operating and ownership loan limits are higher. Conservation and methane dollars are flowing. Farm Credit and the American Bankers Association have pushed for FSA to raise guaranteed operating loan limits toward $3 million, arguing lenders need those levels to keep financing modern farms.

For a dairy with a solid DSCR, that’s true — higher guaranteed limits unlock better terms and responsible restructures. For a 0.9x herd like Mark’s, the math goes another way:

If your bankable DSCR only works when program dollars are in the numerator, DMC has drifted from being a backstop to a core revenue stream.

Rolling the operating line for another year isn’t risk management at that point. It’s a timing decision on when — and how — the operation changes or exits.

Three Branches — None Start with “Hope DMC Keeps Paying”

Once the math is on paper, most 400‑cow herds in this band end up with three branches.

Branch 1: Turnaround — Get DSCR Above 1.2x Without Programs

Mark’s in this lane if “no‑program” DSCR can realistically climb to ≥1.2x within 12–24 months through specific moves: a disciplined cull plan that raises milk per stall; a concrete labour change that lowers non‑feed cost/cwt; selling non‑core assets to knock down debt per cow. In that world, DMC works as designed — a floor under feed‑margin risk, not a permanent revenue line.

Branch 2: Reshape — Change What the Cows Produce

If Mark can’t get there on cost cuts alone, he may still change the model: move into a premium lane with documented, contractual component or identity‑preserved premiums that actually show up on the cheque; simplify the capital footprint so fixed costs match realistic revenue.

The red line stays put: if the reshaped model still needs DMC to get DSCR to 1.0x, that usually looks more like buying time than fixing core economics.

Branch 3: Use the Tools to Stage a Stronger Exit

The hardest conclusion. For many families — Mark’s included — this isn’t spreadsheet math. It’s a barn your grandfather built, and it’s where your kids learned to drive a skid steer.

But the farm‑bill tools aren’t about keeping a struggling model alive indefinitely. They’re about choosing the timing, the terms, and the shape of what comes next on your schedule, not your lender’s:

  • Use DMC indemnities and premium savings to pay down the ugliest debt first.
  • Use FSA‑backed refinancing to restructure into a form that works for a buyer, successor, or landlord in a 2–3 year window.
  • Consider EQIP/energy projects only if they raise resale or lease value without adding obligations the next operator won’t want.

Choosing this path isn’t failure. It means you’re writing the next chapter, not waiting for the bank to write it for you.

What This Means for Your Operation

If you’re in the 300–500‑cow band and this feels uncomfortably close:

  • Within 30 days, run the “no‑program” DSCR test. Bring your last 12 months of milk cheques, a full cost‑of‑production breakdown (including labour at replacement cost), and your P&I schedule. Calculate DSCR with and without DMC. If it’s below 1.0x without programs, you’re looking at a business‑model question, not just a rough year.
  • Use the next 90 days to decide which branch you’re really on. If no combination of realistic cost cuts and genuine premiums gets DSCR to ≥1.2x without programs, you’re in “reshape or transition” territory. Better to name that now than let the bank name it in 18 months.
  • Treat DMC as protection, not entitlement. Max out Tier 1 and lock in the six‑year discount. Then ask: “Does this business stand on its own if DMC pays nothing for two years?”
  • Handle FSA like a scalpel, not a shovel. Model what happens to DSCR if you only restructure existing debtversus if you add new principal. If a new loan doesn’t improve your no‑program DSCR, it’s not expansion money — it’s extra risk.
  • Pick EQIP and energy projects that move cost per cwt. Plate coolers, VFDs, targeted manure improvements — cost‑share can cover 50–75% on smaller projects in some states. Full‑scale digesters mostly belong to herds with thousands of cows and corporate advisory teams. If a project doesn’t clearly lower $/cwt or raise asset value within three years, it’s probably not your project.
  • Build your risk plan around your own cheque. DNIP and school whole‑milk rules are demand‑side tailwinds. Most of those program dollars flow through retailers and processors first, touching your milk cheque only indirectly.
  • Make labour your first policy response. Immigration isn’t fixed in this farm bill, but it’ll decide more 400‑cow futures than any DMC tweak. Hang on to your core crew and keep compliance tight.
Farm Bill ToolDirect Impact on Your ChequeAction for 400-Cow Herds
DMC Tier 1 expansion$41.50/cow/year premium savingsMax out immediately. Lock in 6-year discount.
DMC indemnities (when triggered)$15–30/cow (varies by margin)Enroll at $9.50 coverage. Don’t count on it as income.
FSA operating loan limit increasesIndirect (better terms if DSCR ≥1.2x)⚠️ Use to restructure, not to add debt if sub-1.0x DSCR.
EQIP cost-share (plate coolers, VFDs)$5–15/cow (one-time savings on projects)Take it if project lowers $/cwt within 3 years.
DNIP & school milk programs$0 direct (flows through processors)Demand-side tailwind. Doesn’t change your cheque in 2026.
Full-scale anaerobic digesters$50–200/cow (only for 1,000+ cow herds)Skip. Needs corporate advisory team, not 400-cow scale.
Methane funding (small projects)$8–20/cow (manure improvements)⚠️ Consider if resale value increases. Not for survival cash.

Key Takeaways

  • If your DSCR sits below 1.0x without DMC, you’re past a rough‑year problem. You’re looking at a business‑model question the 2026 farm bill can’t fix on its own.
  • DMC’s ~$16,600 in premium savings ($41.50/cow) and likely 2026 indemnities are real — but they’re a backstop on margin over feed, not on total cost per cwt. Use them to buy time for decisions, not as a permanent source of income.
  • Higher FSA loan limits only win if they lower your no‑program DSCR or make a future sale/transfer cleaner. If they increase total debt on a sub‑1.0x operation, they accelerate an exit.
  • Choosing to transition isn’t choosing to fail. If no credible scenario gets your no‑program DSCR above 1.0x, the farm‑bill tools let you control timing, protect your family’s equity, and hand over something cleaner than a foreclosure.

The Bottom Line

At the end of a meeting like this, Julie slides the printout back across the desk and circles the two DSCR numbers. One with DMC, one without.

If DMC went away tomorrow and 2026 milk stayed near the USDA’s $18.95/cwt all‑milk forecast, what would your own DSCR be — and would your bank still lend into that model?

Complete references and supporting documentation are available upon request by contacting the editorial team at editor@thebullvine.com.

Learn More

The Sunday Read Dairy Professionals Don’t Skip.

Every week, thousands of producers, breeders, and industry insiders open Bullvine Weekly for genetics insights, market shifts, and profit strategies they won’t find anywhere else. One email. Five minutes. Smarter decisions all week.

NewsSubscribe
First
Last
Consent

$18.95 Milk, 8% Money: Nathan Kauffman’s 18‑Month Warning for the 10–15% of Dairies in Significant Stress

Is your dairy in the 10–15% Nathan Kauffman says are in ‘significant’ stress at $18.95 milk and 8% money, and would your bank tell you if it was?

Executive Summary: USDA’s February 2026 WASDE pegs all‑milk at $18.95/cwt, $2.22 below 2025, while USDA‑ERS full‑economic costs for large herds still sit around $19.14/cwt — meaning many dairies are already underwater on paper before interest and principal. Kansas City Fed data shows operating loan rates near 8% and a surge in operating loan volume, with economist Nathan Kauffman warning that 10–15% of producers are in “significant” financial stress even as 80% remain stable. Using three composite herds — 300, 800, and 1,500 cows — the article shows how $18.95 milk, repriced debt, and higher labour costs hit debt‑service coverage ratios and equity, and where fighting, scaling, or exiting pencils actually work. For a 300‑cow herd carrying about $9,300/cow in debt, realistic culling, beef‑on‑dairy premiums, and ration tweaks can close roughly half to three‑quarters of a $195K–$210K cash‑flow gap, while an orderly exit can still retire $2.8M in debt, keep $300K+ in equity, and avoid roughly $200K in herd‑value erosion over 18 months. At 800 and 1,500 cows, the piece walks through concrete “Path A vs Path B” options — components and longer notes vs. destocking and organic premiums, filling empty stalls vs. robots — and shows how each changes DSCR and risk, rather than pretending scale alone is a safety net. It closes with a step‑by‑step DSCR stress‑test at $18.95, $17, and $16 milk, a checklist of lender “red flag” signals, and a 30‑/90‑day playbook so owners can see whether they’re in Kauffman’s 10–15% band and decide how to use the 18‑month clock before their banker uses it for them.

dairy financial stress

Your lender ran the numbers before you did. While you’re watching Class III futures and tweaking rations, the credit analyst across the hall already stress‑tested your file at $18.95 all‑milk — USDA’s February 2026 WASDE forecast — and flagged the debt service coverage ratio that slipped below covenant. The operating line crept up. Working capital burned faster than revenue replaced it. Nobody said “watch list” out loud. But the file moved. 

That information gap is one of the most expensive blind spots in farm finance. WASDE has all‑milk down $2.22/cwtfrom a revised 2025 average of $21.17. On a 300‑cow herd shipping 69,000 cwt a year, that’s about $153,000 in gross revenue gone before you touch feed, labour, or interest. 

Kauffman’s K‑Shaped Warning

Nathan Kauffman — Senior Vice President and Omaha Branch Executive at the Kansas City Fed, and Executive Director of the Center for Agriculture and the Economy — told a University of Nebraska‑Lincoln webinar on February 12 that the headline credit picture still looks relatively stable. But not for everyone. 

“There’s a small increase in delinquencies, but it doesn’t compare with the situation before the pandemic,” he said. Bank debt portfolios show “significant” financial stress for around 10% to 15% of producers — “But that means 80% are still stable.” He described the ag economy as increasingly “K‑shaped”: some operations doing very well, others clearly in distress. 

Who’s on the wrong leg of that K? Kauffman pointed at younger producers who haven’t had years to build equity during the 2020–2023 “good years,” and renters without land as collateral. If that’s you, the aggregate averages won’t save your file. 

Why the Clock Is 18 Months, Not 12 or 24

Lenders re‑underwrite operating and term debt once a year based on your year‑end numbers. In practice, they’re watching you every month: milk check assignments, feed bills, how your operating line cycles — or doesn’t.

Once internal monitors start blinking — DSCR drifting under 1.25×, working capital down quarter over quarter, an operating line parked at 85%+ with no seasonal dip — your file can move from “performing” to “watch” without anyone saying the words.

Here’s how the 18‑month window plays out:

  • Year 1 review: Lender flags concerns, tweaks covenants, maybe orders an appraisal.
  • Year 2 review: Lender looks at whether you actually moved the ratios.
  • In between: One full production year to bend your numbers back toward safety.

Miss that window, and the conversation hardens. Accelerated repayment. Forced asset sales. Transfer to special assets.

The macro data matches the gut feeling. Kansas City Fed surveys show new farm operating loan volume jumped nearly 40% year‑over‑year in Q4 2025, with strong growth through the year. Farm production loan delinquencies at commercial banks sat around 1.02% in Q4 2025: still low, but trending up. 

USDA‑ERS puts the full economic cost for herds of 2,000+ cows at $19.14/cwt, based on the 2021 ARMS dairy survey — the most recent available. That includes family labour, owned land, and return on equity; operating costs run lower, but lenders look at the full economic row. 

And interest isn’t helping. KC Fed’s Survey of Terms of Lending shows operating loans averaging 8.12% in Q2 2025, down from 8.83% in Q2 2024. Kauffman called the decline “slight” and described interest costs as “a somewhat persistent headwind,” noting some long‑term rates “haven’t moved much, or at all.” 

What Cornell’s DFBS Tells You About the Bottom 25%

Before you look at your own books, it helps to know where you sit in the stack.

Cornell PRO‑DAIRY’s 2024 Dairy Farm Business Summary, covering 129 New York farms, shows a wide performance spread. Even in 2023 — a solid milk year feeding into that summary — the lowest‑earning farms struggled to cover debt service. Their debt coverage ratios ran close to or below 1.0× at net milk prices around $22–$23/cwt. 

For the long‑term panel group, EB 2024‑5 reports overall DCRs under 1.0× in the repayment analysis, with planned debt payments per cow in the mid‑$500s and farm debt per cow in the mid‑$4,000s. The composite herds below carry heavier debt — $9,000–$9,667/cow — on purpose. They represent the profile Kauffman warned about: expanded when money was cheap, now repricing with less land equity as a cushion. 

These composites aren’t real farms. They’re built off real cost structures, current prices, and actual loan‑rate trends. Your job is to plug your own numbers into the same math.

The 300‑Cow Herd: When the Window Is an Exit Question

The setup. Three hundred Holsteins at 23,000 lbs — 69,000 cwt shipped a year. Total debt: $2.8M ($1.6M real estate, $800K equipment, $400K operating line). That’s $9,333/cow — well above Cornell’s quartile averages. 

The real estate note repriced last fall from roughly 4.5% to around 7.5%, pushing annual debt service up an estimated $40,000–$55,000 before milk moved a penny.

The squeeze. The $2.22/cwt drop across 69,000 cwt strips out about $153,000 in gross revenue. Layer in the extra debt service, and you’re staring at $195,000–$210,000 in added annual pressure. DSCR can easily slide under 1.0×. That’s covenant‑breach territory. 

There’s also money that doesn’t show up in milk price charts. Beef‑on‑dairy calf premiums, cull checks, and government payments have been quietly cushioning margins. In strong Wisconsin markets, crossbred beef‑on‑dairy calves have cleared $1,000–$1,750/head versus $700–$1,000 for Holstein bulls — a $300–$750 per‑calf premium. Real cash. But not guaranteed. 

The fight math. Cull the bottom 10%: 30 cows at roughly $137/cwt blended (USDA‑AMS), 1,300 lbs live = $1,781/head → about $53,400 applied straight to the operating line. Breed beef‑on‑dairy on your bottom genetics: ~87 saleable calves → $26,000–$65,000 in premium revenue above Holstein bull calf values. Tighten the ration for $0.30–$0.50/cwt on 62,100 cwt → another $19,000–$31,000 in margin. 

300‑Cow Playbook

PathCore moveFinancial outcomeTrade‑off
FightCull 10% + beef‑on‑dairy + ration workClose $98K–$157K vs. $195K–$210K squeezeBuys time; may still leave DSCR below 1.20×
ExitSell herd, equipment, facilities on your termsRetire $2.8M debt, keep $300K+ equity, avoid ≈$200K herd‑value erosion over 18 monthsYou’re out of cows; legacy shifts

On a spreadsheet, that exit looks clean. In the kitchen, it doesn’t. For a lot of 300‑cow families, the 18‑month window isn’t just about DSCR — it’s about whether one more generation gets a shot at the home place, or whether you take the equity that’s left and protect your kids from carrying your debt into their forties.

What Does $18.95 Milk Mean for an 800‑Cow Expansion Herd?

If 300 cows is an exit question, the 800‑cow herd is a margin‑compression test — and it’s the profile Kauffman flagged most directly. hpj

The setup. Eight hundred cows at 24,500 lbs = 196,000 cwt a year. Expanded in 2019 with a new freestall and double‑18 parlour. Debt: $7.2M. Blended interest after repricing: ~7.1%. Debt service: roughly $820,000, up an estimated $150,000–$180,000 since rates moved. Full economic COP near $18.40/cwt.

The squeeze. Revenue loss: 196,000 cwt × $2.22 ≈ $435,000. Labour creep — USDA NASS pegged livestock worker wages around $18.15/hour nationally in April 2025, with average farm wages up roughly 3–4% year‑over‑year — adds another $35,000–$65,000 at this scale. Stack it all: $620,000–$680,000 in extra annual cash pressure. DSCR slides from the low 1.30s toward 1.0–1.05×. 

Meanwhile, that 2019 freestall, which cost $2.8M to build, might appraise at only $2.0–$2.2M today. Debt‑to‑asset ratio creeps past the 60% covenant. Technically offside without missing a payment.

800‑Cow Playbook

PathCore moveAnnual impactTrade‑off
A: Components + labour + longer notePush BF from 3.85% to 4.05% (+$115K); trim 3× milking on bottom cows (+$80K); stretch barn mortgage to 25‑yr amortization (+$92K)≈ $287K vs. $620K–$680KhitKeeps 800‑cow scale; demands tight execution on nutrition, labour, and lender cooperation
B: Destock + premium pivotSell 150 cows ($350K–$430K debt reduction); begin organic transition (36‑month cert)One‑time debt paydown; premium upside laterGives up volume now; organic benefits depend on processor contracts and a 3‑year timeline

On Path A, the butterfat math is straightforward: 19.6M lbs × 0.20 percentage points = 39,200 lbs more BF × $2.94/lb ≈ $115,000. That’s real money. But the breeding decisions behind that 0.20‑point shift matter as much as the ration, and as Dr. Kent Weigel has pointed out, nobody can reliably predict component prices five to seven years out. 

On Path B, organic pay in the Northeast has held well above conventional. Bullvine’s 2025 coverage of NODPA data showed Upstate Niagara’s 2025 program at $29.50/cwt base plus a $2.75/cwt organic market adjustment and $2/cwtseasonal incentive, and Horizon targeting up to $45/cwt for some larger herds. NODPA’s January 2026 “Pay and Feed Prices” update confirms that Upstate Niagara will move to a $32.50/cwt base, plus a $2.75/cwt regional adjustment and a $2/cwt seasonal incentive in 2026, and notes that other processors raised base pay by roughly $3/cwt going into 2026. Terms vary — contact processors directly for current details. 

Certification takes 36 months. You’re not patching this year’s DSCR with organic premiums. What you are doing is giving your lender a different story than “we’re stuck.”

When Scale Stops Being a Safety Net: 1,500 Cows

Two sites, 1,500 cows total, 26,000 lbs/cow — 390,000 cwt a year. Debt: $14.5M. COP sits in the top quartile at about $17.80/cwt, better than ERS’s $19.14 average for ≥2,000‑cow herds. Sounds comfortable. 

Then a regional processor adjusts its Class III allocation, and your blend drops $0.85/cwt — that’s $331,500. In the same quarter, your H‑2A contractor raises fees 12%, adding $180,000 to labour costs. You’ve eaten $511,500 in cash pressure while still technically “efficient.”

Pre‑shock DSCR: 1.42×. Post‑shock: 1.12×. Scale gave you room. It didn’t make you bulletproof.

1,500‑Cow Playbook

PathCore moveImpactTrade‑off
A: Fill empty stallsAdd 300 cows to 1,800‑head capacity (78,000 cwt × [$18.95 – $14.50 marginal COP] ≈ $347K contribution)Recovers about two‑thirds of a $511KshockDeepens processor and labour dependency
B: RobotsConvert one barn to 20 units ($4.4M); labour savings $390K–$520K/yr; extra milk $185K–$296KNet year‑one: –$41K to +$200K; improves as wages riseSwaps labour volatility for $4.4M in new capital; may need asset sales or guarantees if DSCR is already thin

ISU extension specialist Larry Tranel pegs the installed robot cost at $185,000–$230,000/unit, with some projects reaching $250,000. At $220,000 midpoint, 20 units = $4.4M — about $616,000/year in debt service over 10 years at current rates. The bet is that wages keep climbing while the robot payment stays fixed. 

Herd SizePath OptionsFinancial ImpactKey Trade-Off
300 cowsFight: Cull 10%, beef-on-dairy, ration tweakClose $98K–$157K of $195K–$210K gapBuys 6–12 months; may still breach covenants
300 cowsExit: Orderly liquidationRetire $2.8M debt, keep $300K+ equityOut of dairy; avoid $200K herd-value erosion over 18 months
800 cowsPath A: Push components 0.20%, trim labor, stretch noteRecover ~$287K of $620K–$680K hitDemands tight execution; lender cooperation required
800 cowsPath B: Destock 150 cows, begin organic transition$350K–$430K debt paydown now; premium upside at month 36Gives up volume immediately; 3-year wait for premiums
1,500 cowsPath A: Fill 300 empty stalls to 1,800-head capacityAdd $347K contribution marginDeepens processor and H-2A labor dependency
1,500 cowsPath B: Install 20 robotic units$390K–$520K labor savings + $185K–$296K milk = net +$200K year 1Swaps labor volatility for $4.4M new capital; DSCR impact if already thin

Ten Signals Your Lender Already Started the Clock

You’re likely on an 18‑month clock if:

  • Your lender asks for quarterly financials instead of annual.
  • There’s someone you’ve never met at your review — a regional credit analyst or special‑assets contact.
  • They order a fresh appraisal outside the normal cycle.
  • Covenant language gets “adjusted”—temporary waivers and revised DSCR targets.
  • The conversation shifts from “What are your plans?” to “Walk me through your cost of production.”
  • They start asking for milk per cow, SCC, and cull rates that weren’t part of prior reviews.
  • Your operating line renewal comes back with a lower limit or shorter term.
  • Someone mentions stress‑testing at $17/cwt.
  • They request personal financials from all guarantors, not just the main operator.
  • Capital‑expense conversations get met with “Let’s revisit after the next review.”

Three or more? You’re on a clock, whether anyone has said those words or not.

How to Stress‑Test Your Dairy at $18.95 Milk

In the next 30 days:

  • Pull your full economic COP. Not the rough number in your head. Family labour at $18–$22/hour, depreciation at replacement cost, return on equity included. ERS and Cornell DFBS data show total cost ranging from roughly $20/cwt into the high $20s/cwt depending on herd size and performance. Put that number next to $18.95 and see what you’re really asking your lender to finance. 
  • Run your DSCR at three price points. Use the formula:
    (Total cwt × milk price – operating expenses) ÷ annual debt service = DSCR.
    Plug in $18.95$17.00, and $16.00. Under 1.10× at $17? Red flag. Under 1.20× at $18.95? You’re in the band Kauffman’s data identifies as “significant” stress. 
  • Model your exit equity — today and at month 18. Herd, equipment, land. Subtract every dollar of debt. Then re‑run those values 18 months out with lower prices and more forced timing. On a 300‑cow herd, the cattle‑value spread alone can run around $200,000
Herd SizeDSCR @ $18.95/cwtDSCR @ $17.00/cwtDSCR @ $16.00/cwt
300 cows (23K lbs, $280K debt service)1.08×0.82×0.68×
800 cows (24.5K lbs, $820K debt service)1.28×1.05×0.92×
1,500 cows (26K lbs, $1.45M debt service)1.42×1.22×1.09×
Your herd: ______________________________________

In the next 90 days:

  • Pick your path and take it to your lender — with a number, not a hope. “We’ll reduce the herd by 12%, apply $X to the operating line, and target a DSCR of 1.22× by Q3. Here’s the math.” That’s a different meeting than “We’re hoping milk comes back.”
  • Build a three‑person advisory bench that doesn’t sell you anything. Your accountant. An ag attorney. One peer who’s been through financial stress and came out the other side. Not your feed rep. Not your equipment dealer.

By this time next year:

  • Hit the DSCR target you committed to — or have a planned, orderly exit underway before someone else decides for you.

If you’re in Canada, supply management, quota values, and provincial financing change the per‑cwt math. But lenders still watch DSCR and working capital. The 18‑month pressure window exists under quota, too — it just plays out against land and quota values, not Class III futures. 

Key Takeaways

  • If your DSCR sits below 1.20× at $18.95, you’re in the 10–15% band Kauffman’s data flags as “significant” financial stress. KC Fed work suggests 10–15% of producers are in that zone, even as 80% remain stable, and Cornell’s DFBS shows some farms couldn’t cover debt even in stronger milk years. 
  • At 300 cows with $9,000+/cow in debt, a disciplined exit may preserve more equity than fighting for 18 months. The herd‑value spread alone can run around $200,000 before equipment and real estate discounts. 
  • At 800 cows with 2019 expansion debt repricing from mid‑4s into the 7–8% range, you gave up $150,000+ in cash flow before milk moved a penny. Path A or Path B both beat drifting into the next review with no plan. 
  • At 1,500 cows, scale buys more ways to respond — not immunity. One processor adjustment and one H‑2A contract change can add roughly $500,000 in annual pressure, even in a top‑quartile COP herd. 

The Bottom Line

The producers who still have options 18 months from now won’t be the ones who hoped for $21 milk. They’ll be the ones who ran the DSCR math at $18.95, $17, and $16 before their lender did — and walked into that meeting with a decision, not just a problem.

Where does your DSCR actually sit today?

Complete references and supporting documentation are available upon request by contacting the editorial team at editor@thebullvine.com.

Learn More

The Sunday Read Dairy Professionals Don’t Skip.

Every week, thousands of producers, breeders, and industry insiders open Bullvine Weekly for genetics insights, market shifts, and profit strategies they won’t find anywhere else. One email. Five minutes. Smarter decisions all week.

NewsSubscribe
First
Last
Consent

Your Lender’s Already Doing the Math: The 45-Day Survival Guide for Mid-Sized Dairy Operations

With $11 billion in new processing capacity reshaping the industry and loan renewals looming, the decisions you make before February will echo for years

EXECUTIVE SUMMARY: Your lender is already running the numbers on your 2026 renewal—and if you haven’t done the same math, you’re starting from behind. With Class III futures stuck in the mid-$15s and real production costs running $19-21/cwt, the margins that looked workable 18 months ago have evaporated for many mid-sized operations. This isn’t a typical price cycle. It’s an industry restructuring: $11 billion in new processing capacity is creating a two-track system where large operations lock in premium contracts while mid-sized farms compete in tightening commodity markets. Heifer inventories have hit a 47-year low, genetic indexes have shifted hard toward components, and analysis suggests 2,100-2,800 dairies in the 200-700 cow range could exit by late 2026. But exit isn’t inevitable for those who move now. The producers who’ll still be milking in 2030 are making decisions this month: locking in risk protection, aligning genetics with where the premiums are heading, and walking into their banker’s office with a plan—not waiting to be handed one.

There’s a conversation happening in bank offices and kitchen tables across dairy country right now, and it deserves more attention than it’s getting. Drawing on exit-rate data and economic analysis from sources like UW-Madison’s Center for Dairy Profitability, the pattern suggests somewhere between 2,100 and 2,800 mid-sized dairy operations could leave the industry by the end of 2026. We’re talking farms running 200 to 700 cows—operations that, in many regions, still form the backbone of rural dairy communities.

What strikes me about this moment is how many of the farms facing pressure aren’t the ones you’d expect. I talked with a producer in central Wisconsin running 400 cows—solid genetics, modern parlor, experienced management team. On paper, everything looks right. Yet he’s facing the same margin squeeze as operations half his size. These aren’t dairies with obvious management problems or run-down facilities. Many are well-run operations with experienced owners who’ve weathered tough cycles before.

The difference this time feels structural. And understanding that distinction matters quite a bit for anyone figuring out their next move.

The Financial Conversations Already Underway

If you’re preparing for a January loan renewal, your lender’s probably already started their internal review. What’s particularly noteworthy is how the debt service coverage ratio has become the defining metric in these conversations.

Here’s what I’m generally seeing in terms of how lenders sort operations: A DSCR above 1.25 usually means straightforward renewal—your file moves through without much scrutiny. Between 1.0 and 1.25, you’re in monitoring territory. Renewal’s likely, but expect closer attention and perhaps some questions about your forward plan. Drop below 1.0, and restructuring discussions typically begin. Below 0.85? That’s when exit conversations often follow.

Quick Reference: DSCR Threshold Guide

Your DSCRWhat It Typically MeansYour Next Step
Above 1.25Standard renewal likelyDocument your forward plan anyway
1.0 – 1.25Monitoring status; closer scrutinyPrepare detailed 2026 projections
Below 1.0Restructuring discussions likelyInitiate conversation proactively
Below 0.85Exit planning often beginsExplore all options with the advisor

Why does this matter right now? Because the window between comfortable and concerning has narrowed considerably.

Tom Kriegl spent roughly 30 years with UW-Madison’s Center for Dairy Profitability, and he’s seen these cycles play out many times. The reality is that conversations change pretty quickly once you cross that 1.0 threshold. Lenders aren’t looking to push anyone out—that’s not the goal—but they have risk parameters they need to work within. The earlier a producer engages in that conversation, the more options tend to be available.

Here’s the uncomfortable truth: farms are sliding across these thresholds faster than anyone predicted—and most don’t realize it until their banker calls first. Mark Stephenson, who directs dairy policy analysis at UW-Madison, has observed that margins have compressed faster than many producers anticipated. Farms that looked comfortable 18 months ago are finding themselves in very different territory.

The math behind this is pretty unforgiving. With Class III futures for early 2026 trading in the mid-$15 range on the CME, and FINBIN data showing direct production costs around $16.25-16.43/cwt—with total costs including overhead running $19-21/cwt depending on operation size and efficiency—there’s essentially nothing left for debt service after covering basic costs for many mid-sized operations. While $19-21/cwt is the benchmark, your specific ‘lifestyle cost’ and ‘unpaid labor’ are the silent killers of your DSCR.

Checklist for Your Banker Meeting

Before you sit down for that loan renewal conversation, make sure you can answer these questions:

  • [ ] What’s your actual cost of production per hundredweight? (Include everything—labor, family living, depreciation)
  • [ ] What’s your current DSCR, and what was it 12 months ago?
  • [ ] What percentage of your 2026 production is forward-contracted or covered by DRP?
  • [ ] What are your bulk tank components, and how do they compare to premium thresholds?
  • [ ] What’s your breeding program producing—volume or components?
  • [ ] Do you have a written 12-month action plan addressing margin pressure?
  • [ ] What’s your heifer inventory worth at current replacement prices ($3,010/head)?

Walk in with these numbers ready. Your lender will respect the preparation—and you’ll have better leverage in the conversation.

Why Your DMC Margin Doesn’t Match Your Checkbook

One thing that keeps coming up in conversations with producers is the disconnect between what their Dairy Margin Coverage statements show and what their checkbooks tell them. This isn’t a knock on the program—DMC was designed as a baseline safety net, and it’s served that purpose well for many operations. But understanding its limitations matters right now.

Here’s the issue. The DMC formula calculates margin as milk price minus feed costs, with feed costs limited to corn, soybean meal, and alfalfa hay, based on USDA Agricultural Marketing Service prices. Penn State’s extension dairy team has analyzed how much this approach misses in terms of actual operating expenses.

Labor costs generally run $2.00-3.00/cwt, depending on herd size and region—that’s not in the DMC calculation at all. Neither are facility and equipment costs, which add another $1.50-2.00/cwt. Then you’ve got cooperative deductions running maybe fifty cents to a dollar per hundredweight, plus the accumulated weight of utilities, vet bills, breeding costs, supplies… it adds up fast.

Danny Munch, an economist with the American Farm Bureau Federation, put it plainly in a recent interview: when crop prices are low, the DMC formula using those low prices “makes the milk margin under the DMC program look really high, and none of the triggers over that $9.50 margin are triggered.”

So when recent DMC calculations show margins above $10.50/cwt, the actual farm-level margin after everything might be $3.50-4.50/cwt. That’s the number that determines whether you renew or restructure. And trust me—your banker’s already calculated it. The gap between those two figures explains much of the frustration I’m hearing from producers who feel the safety net isn’t quite reaching them.

The Two-Track Dairy Industry: Where Does Your Operation Fit?

Here’s something I think we need to talk about directly: we’re watching more of a two-track industry develop, and which track you end up on will largely be shaped by decisions made in the next 12-18 months.

The International Dairy Foods Association reported in October that processors have invested a record $11 billion in new and expanded manufacturing capacity across 19 states—more than 50 individual building projects between 2025 and early 2028. That’s an enormous bet on American dairy’s future, and it signals real confidence in the sector’s long-term prospects.

But here’s what I find myself thinking about: much of this new capacity is being tied directly to large, consistent milk suppliers. In many cases, those are very large dairies with direct supply relationships. Now, cooperatives remain major owners and partners in processing—that’s important to note—but the pattern many of us see emerging is one in which the largest operations have greater direct access to premium outlets.

On one track, you’ve got large operations, typically running 1,500 to 4,000-plus cows, positioning themselves with direct supply contracts to these new facilities. Chobani broke ground in April 2025 on a $1.2 billion, 1.4 million-square-foot plant in Rome, New York. Coca-Cola announced a $650 million Fairlife facility in Webster back in 2023. Saputo’s expansion in Barron, Wisconsin, continues to add capacity. These processors need consistent, high-component milk in large volumes, and they’re signing multi-year agreements with operations that can deliver it.

What do those contracts look like? Based on conversations with cooperative leaders and industry contacts, we’re often seeing locked pricing in the $17.50-18.50/cwt range, with component premiums of $0.75-1.50/cwt for elevated butterfat and protein, plus quality bonuses for meeting specifications. Three- to five-year terms that provide real planning certainty.

The second track is everyone else—and that’s where most cooperative members find themselves. The remaining operations selling through cooperatives or spot markets at whatever price commodity trading sets. For many of these farms, realized prices of $14.75-15.75/cwt after deductions fall below the total cost of production.

Contract FeatureTrack 1: Large Operations with Direct Processor SupplyTrack 2: Mid-Sized Operations via Cooperative Commodity Markets
Typical Herd Size1,500 – 4,000+ cows200 – 700 cows
Base Price ($/cwt)$17.50 – $18.50 (locked multi-year)$14.75 – $15.75 (commodity-linked, variable)
Component Premiums$0.75 – $1.50/cwt for >4.0% butterfat, >3.3% protein$0.15 – $0.40/cwt (varies widely by co-op)
Contract Term3 – 5 years with pricing certaintyMonth-to-month or annual; minimal forward visibility
Quality Bonuses$0.25 – $0.50/cwt for meeting specifications (SCC, bacteria)Included in base or minimal additional
Realized Price After Deductions$18.50 – $20.25/cwt$14.75 – $15.75/cwt
Processor RelationshipDirect supply agreements with Chobani, Fairlife, Saputo, etc.Cooperative pools with multiple commodity buyers
Volume RequirementHigh; consistent large volume requiredFlexible; but no guaranteed premium outlet access

Now, I’m not saying cooperatives are failing their members—many co-ops have invested heavily in component-focused processing and are building strong relationships with premium buyers. But I am saying that some cooperatives have been more aggressive than others in positioning for this new reality, and their members are starting to see different outcomes as a result.

We explored some of these dynamics in our recent piece on the Lactalis 270-farm cuts—and the pattern holds: the dairies surviving aren’t necessarily the biggest, but they’re the ones who positioned earliest

What Cooperative Members Should Be Asking

For the majority of mid-sized operations shipping through cooperatives, the important question is this: What is your cooperative doing to position members for premium markets?

The good news is that some cooperatives have made significant moves. Land O’Lakes has invested substantially in butter capacity and component-focused products. Dairy Farmers of America has expanded its cheese processing operations across multiple regions. Several regional cooperatives in the Upper Midwest have built relationships with specialty cheese manufacturers that pay meaningful component premiums to their members. These are real examples of cooperatives adapting to where value is heading.

But not every cooperative has moved at the same pace. Edge Dairy Farmer Cooperative has been vocal about the need for federal milk pricing reform, and NMPF continues working on federal order modernization. The debate about how cooperatives should adapt is very much alive in the industry right now.

Questions worth raising at your next meeting or in conversations with your field rep:

  • Component premiums: Does your cooperative offer meaningful premiums for high-component milk, or is pricing still primarily volume-based? What are the actual qualification thresholds, and how do they compare to what direct-supply operations are reportedly getting?
  • Processing investments: Has your cooperative invested in component-focused processing capacity, or is it primarily in fluid milk and commodity manufacturing?
  • Premium program access: What percentage of member milk is currently going to premium outlets versus commodity markets? Is that number increasing or decreasing?
  • Forward pricing options: What risk management tools does the cooperative offer, and how do they compare to Dairy Revenue Protection or other alternatives?
  • Equity timeline: For operations considering exit, what’s the realistic timeline and process for equity redemption—not just the official policy, but what’s actually happening?

The producers I’ve talked with who feel most confident about their cooperative relationship are the ones asking these questions in board meetings, not just accepting the quarterly newsletter. If your cooperative leadership can’t give you straight answers, that’s worth knowing.

47-Year Heifer Shortage: Hidden Leverage for Mid-Sized Dairies

Here’s something that doesn’t get enough attention in these financial discussions: we’re looking at replacement heifer numbers we haven’t seen in nearly half a century.

USDA’s January 2025 Cattle report puts dairy replacement heifers at 3.914 million head—the lowest level since 1978. That’s a 47-year low, and this matters quite a bit if you’re thinking about herd management decisions right now.

CoBank’s August 2025 analysis projects heifer inventories will shrink by an estimated 800,000 head over the next two years before beginning to rebound in 2027. The primary driver? Beef-on-dairy breeding trends that, you probably know this already, have fundamentally changed how many operations approach their breeding programs. The economics made sense when beef-cross calves were commanding substantial premiums—and for many operations, they still do. But the cumulative effect on replacement availability is now showing up in a meaningful way.

What this means for you: dairy replacement heifer prices have soared to historic levels, reaching $3,010 per head in July 2025—a 164% jump from the April 2019 figure of $1,140. I spoke with a Northeast producer last month who’s postponing an expansion specifically because heifer acquisition costs have thrown off his entire capital plan. For operations considering growth, that’s a significant barrier. For those considering exit strategies… well, your heifer inventory may be worth considerably more than you realize. Before you sell into this historic heifer market, consult your tax advisor; that ‘hidden leverage’ can quickly turn into a significant capital gains liability if not handled via a 1031 exchange or debt retirement strategy.

It’s worth noting that this heifer shortage creates a natural floor under herd liquidation decisions. Even if a producer decides to exit, the replacement economics make it attractive for other operations to absorb those animals rather than let them go to beef markets. That’s worth factoring into your decision.

The Genetics Game Has Changed—Are You Playing the Right One?

This is where I want to get specific, because genetics is where mid-sized operations can actually compete—if they’re making the right breeding decisions.

The Council on Dairy Cattle Breeding implemented major changes to the Net Merit index in April 2025, and the shifts tell you exactly where the industry is heading. According to USDA-ARS documentation on the 2025 revision, the emphasis on butterfat increased from 27% to nearly 32%, while protein emphasis dropped from about 20% to 13%. Feed efficiency emphasis jumped significantly, with Feed Saved moving from 12% to nearly 18% of the index.

Here’s what that means in plain language: bulls that looked like the right choice five years ago may not match where the money is today.

The demand side has shifted substantially. For roughly 30 years, breeders focused heavily on protein content. But now there’s strong demand for higher-fat cheese, Greek yogurt, and premium ice creams. Fat in milk isn’t considered a negative anymore—it’s where the premiums are.

The result? Holstein Association USA staff have noted in industry interviews that genetic trends for milk, fat, and protein production are extremely favorable, and that average herd butterfat has increased toward 4% as breeders respond to higher-value fat markets.

Trait CategoryNet Merit Emphasis (Pre-April 2025)Net Merit Emphasis (April 2025 Revision)ChangeWhy It Matters for Your Milk Check
Butterfat %27%32%+5 pointsGreek yogurt, premium ice cream, high-fat cheese demand; premiums now $0.75-1.50/cwt for >4.0% butterfat
Protein %20%13%-7 pointsStill valuable, but market shifted toward fat; protein premiums plateaued
Feed Saved (Efficiency)12%18%+6 pointsAt $16.25/cwt feed costs, efficiency directly impacts margin; most overlooked trait
Milk Volume (lbs)~24%~22%-2 pointsVolume without components = commodity pricing; less emphasis reflects market reality
Health & Fertility Traits~17%~15%-2 pointsStill important but slightly de-emphasized relative to production efficiency
Overall Base Change2020 baseline2025 baseline45-lb butterfat rollback, 30-lb protein rollbackLargest genetic base change in Holstein history; your “average” bulls are now above-average

If you’re still selecting bulls primarily based on TPI or NM$ without considering the component breakdown, you might be optimizing for yesterday’s market.

For operations selling into cheese markets—which is where most of the premium processor demand is heading—Cheese Merit (CM$) deserves serious consideration. It places more weight on protein yield and milk quality traits that affect cheese production. Fluid Merit (FM$) emphasizes volume and butterfat for fluid milk operations, while Grazing Merit (GM$) focuses on fertility and adaptability for pasture-based systems. 

The practical question: What’s your bulk tank butterfat running right now? If you’re at 3.7% and premium contracts require 4.0%, that’s not a gap you can close with feed changes alone. That’s a breeding program shift that takes 18-24 months to show up in the tank. Which means the decisions you make right now determine your position in the component in 2027.

A CoBank dairy economist noted that when CDCB reset its genetic base in April 2025, Holsteins experienced the largest base change in their history—a 45-pound rollback in butterfat and a 30-pound rollback in protein. That’s substantial genetic progress that’s already showing up in bulk tanks across the country for operations that positioned early.

Chad Dechow, who’s been studying dairy cattle genetics at Penn State for more than two decades, wrote in Hoard’s Dairyman that these component gains represent “unprecedented” genetic progress. The question isn’t whether genetic progress is real—it is. The question is whether your breeding program is capturing it, or whether you’re paying for yesterday’s genetics while your neighbors cash tomorrow’s premiums.

Regional Dynamics Worth Noting

One thing I should mention: these pressures don’t hit every region the same way, and the solutions vary accordingly.

In Wisconsin and Minnesota, you’ve got different cooperative structures and processor relationships than in the Southwest. Many Midwest producers report that their cooperative relationships—while perhaps not offering the premium pricing of direct processor contracts—provide stability and market access that shouldn’t be undervalued in uncertain times.

California’s regulatory environment and water costs create their own distinct challenges. I’ve talked with producers in the Central Valley who are navigating pressures that simply don’t exist in other regions—environmental compliance costs, groundwater restrictions, labor market dynamics. Their calculations look quite different.

The Northeast, with new processing capacity coming online in New York, presents both opportunity and competitive pressure. Operations positioned to supply these facilities may find themselves with options that didn’t exist two years ago. Others may feel squeezed by changing milk shed dynamics.

What works in one region may not translate directly to another. The fundamentals I’m describing apply broadly, but the specific options available to any individual operation depend heavily on local processor relationships, cooperative membership, and regional market access. That’s worth keeping in mind as you evaluate your own situation.

Global Market Headwinds

And then there’s what’s happening internationally—because global markets affect domestic prices more than many producers realize.

Rabobank’s analysis shows China’s whole milk powder imports have essentially collapsed—from a 2018-2022 average of 670,000 metric tons down to just 430,000 metric tons in 2023. While data for 2024 and 2025 are still developing, the USDA’s December World Agricultural Supply and Demand Estimates don’t offer much hope for a recovery in 2026.

Why is this significant? When major importers pull back, that surplus milk has to go somewhere—and it often ends up pressuring domestic commodity markets. The U.S. dairy industry has become increasingly export-dependent over the past decade, creating opportunities in good times and exposure when global demand softens.

This builds on what we’ve seen in previous cycles, though the scale of China’s domestic production growth adds a new dimension. Chinese dairy production has expanded significantly, reducing their import needs in ways that may prove structural rather than cyclical. That’s something worth watching as you think about longer-term market positioning.

What’s Working for Operations That Are Gaining Ground

Talking with producers and advisors who are navigating this successfully, a few common threads keep emerging. These aren’t silver bullets—every operation is different—but they’re worth considering.

Risk management positioning stands out. Operations that locked forward contracts on 40-60% of their 2026 milk production during the third and fourth quarters of this year—when prices were more favorable—have built meaningful protection. Tools such as Dairy Revenue Protection, cooperative forward contracting programs, and managed futures strategies are attracting serious attention from mid-sized operations that historically avoided them.

The arithmetic works out clearly: say you’ve got a 500-cow dairy producing around 15 million pounds annually—that’s roughly 150,000 cwt if you’re running good production. If you locked 50% of that at $17.50/cwt while spot prices drop to $15.50/cwt, your blended realized price comes out around $16.50/cwt. On that volume, you’re looking at roughly $150,000 in protected margin compared to selling everything at spot. Not enough to transform a struggling operation, but meaningful—and potentially the difference between a straightforward renewal conversation and a difficult one.

The Path Forward

So, where does this leave the mid-sized producer facing a January loan renewal? A few thoughts, offered with the recognition that every operation’s situation is unique.

  • Know your numbers cold. Not just your DMC margin, but your actual cost of production, including every line item—labor, repairs, depreciation, family living, debt service. Your banker certainly will. Walking into that conversation with a clear-eyed understanding of your breakeven and your path to profitability changes the dynamic considerably.
  • Explore risk management now. If you haven’t looked at forward contracting or Dairy Revenue Protection for 2026 production, the window is closing. Talk to your cooperative, your risk management advisor, or your extension specialist this week—not next month. Even partial coverage changes your risk profile in ways lenders recognize.
  • Get your genetics aligned. Pull your bull lineup and look at the component breakdown—not just TPI or NM$, but fat and protein PTAs specifically. If you’re selling into cheese markets, Cheese Merit deserves a hard look. If your bulk tank is running below 4.0% butterfat, you need to understand why and whether your breeding program is moving you in the right direction.
  • Engage your lender proactively. Don’t wait for your banker to start the conversation. If you’re anywhere near that 1.0 DSCR threshold, being proactive about discussing your situation—with documentation showing how you’re addressing challenges—puts you in a much stronger position than waiting to react. Lenders appreciate producers who demonstrate awareness and planning, even when the numbers are tight.

Resources for Further Planning

  • FINBIN benchmarking datafinbin.umn.edu — Compare your cost of production against regional benchmarks
  • DMC decision toolsfsa.usda.gov/dmc — Current margin calculations and program information
  • Dairy Revenue Protection: Contact your crop insurance agent or visit rma.usda.gov
  • CDCB genetic toolsuscdcb.com — Merit index details and trait information
  • Extension support: Your state’s land-grant university extension service offers one-on-one consultations with a dairy specialist. In Wisconsin, contact the Center for Dairy Profitability at UW-Madison. In Pennsylvania, reach out to Penn State Extension’s dairy team. In New York, Cornell PRO-DAIRY provides similar support. Most states have dedicated dairy extension specialists—a quick search for “[your state] dairy extension” will connect you with local expertise.

The Bottom Line

The producers who come through this transition in strong shape won’t be the ones who waited to see how things played out. They’ll be the ones who moved thoughtfully—but moved first. For those willing to adapt—to get serious about risk management, genetics, and understanding where your cooperative fits in this changing landscape—there’s a path through this. But it requires honest assessment, timely action, and a willingness to ask good questions of the people and organizations you’re working with.

KEY TAKEAWAYS

  • Your banker’s already running the numbers. If your DSCR is approaching 1.0, start the conversation now—waiting until they call means fewer options.
  • This isn’t a downturn—it’s a restructuring. $11 billion in new processing capacity is sorting the industry into two tracks: premium contracts for large suppliers, commodity pricing for everyone else. Know which track you’re on.
  • Your heifer inventory is hidden leverage. At $3,010/head and a 47-year supply low, replacement value changes the math on every scenario—expansion, contraction, or exit.
  • Genetics have pivoted to components. Has your program? Net Merit 2025 pushed butterfat emphasis to 32%. If your tank runs 3.7% while premiums start at 4.0%, you’re leaving money in the bulk tank.
  • The producers still milking in 2030 are making moves now. Lock in risk protection, realign your genetics, and walk into your lender’s office with a plan—not waiting to be handed one.

Complete references and supporting documentation are available upon request by contacting the editorial team at editor@thebullvine.com.

Learn More

The Sunday Read Dairy Professionals Don’t Skip.

Every week, thousands of producers, breeders, and industry insiders open Bullvine Weekly for genetics insights, market shifts, and profit strategies they won’t find anywhere else. One email. Five minutes. Smarter decisions all week.

NewsSubscribe
First
Last
Consent

Trump’s $12 Billion Missed Dairy: Your 30-Day Window Before Lenders Come Calling

Trump’s $12B went to grain farmers. Dairy’s much-needed big relief check isn’t coming. Your lender’s review is. You’ve got 30 days to get ahead.

Executive Summary: Trump just handed farmers $12 billion. Dairy didn’t make the cut. The Farmer Bridge Assistance Program announced on December 8 sends $11 billion to row crops—corn, soybeans, wheat—while dairy gets shuffled into a vague $1 billion reserve with no timeline and no check in the mail. After two years of Class III prices swinging $9 per hundredweight, that’s not the relief dairy families needed. With lender portfolio reviews hitting in February, producers have 30 days to get clear on their real numbers: true break-even, actual debt-service coverage, and competitive position. Three paths forward exist—expand, restructure, or exit strategically—and the farms still milking in 2030 won’t be the ones waiting for Washington to save them.

dairy farm financial strategy

December 8 came and went. Row crop farmers got a $12 billion lifeline. Dairy farmers got a press release mentioning a billion-dollar reserve “for other commodities”—no details, no timeline, no checks. Most producers will receive some bridge payments—often $70,000 to $90,000 for a 300-cow operation. But after this week’s announcement, we now know that this fall’s check is likely the last one you’ll see for a long time. That changes the math. You didn’t just get a bonus; you got a severance package. The question is: What are you doing with it?

Some folks deposited the check, caught up on the feed bill, and went back to managing their transition cows and monitoring bulk tank components. Others paused. They asked a harder question: What am I actually going to do differently with this breathing room?

Use of FundsShort-Term Relief (0-3 months)Long-Term Impact (12+ months)Best For (DSCR)Result
Pay down feed bill/operating debtHigh – immediate pressure reducedLow – resets cycle but doesn’t change trajectoryAbove 1.25 (temporary squeeze)Buys time, doesn’t change math
Catch up equipment paymentsHigh – stops late fees, preserves creditLow – unless part of turnaround planAbove 1.5 (isolated issue)Fine if part of bigger strategy
Invest in diagnostic analysis ($2-5K)Low – feels like spending during crisisVery High – clarity drives right decisionsALL levels (knowledge is power)BEST investment – $5K buys $450K saved
Bank it (emergency fund)Medium – no immediate benefitMedium – cushion for next volatility1.0-1.5 (need flexibility)Smart for uncertainty, boring but wise
Down payment on expansionLow – commits to larger expenseHigh or Catastrophic (depends on execution)Above 1.75 onlyOnly if you already had financing lined up
Premium market certification (organic transition)Low – costs continue during transitionHigh if markets materialize, costs recovered1.25+ with 3-year horizonRequires sustained commitment, not desperate pivot
Labor improvements (housing, wages)Medium – retention benefits take timeHigh – turnover reduction = $155K savings1.25+ with retention crisisRetention pays dividends, but takes 12-18 months

A fourth-generation Wisconsin dairyman put it simply: “That check bought me time. But time for what? That’s the part I hadn’t really thought through.”

Mark Stephenson at the University of Wisconsin–Madison, who has served as Director of Dairy Policy Analysis and Director of the Center for Dairy Profitability, has been tracking these financial dynamics for years. What the data consistently shows is sobering but won’t surprise most of us. For operations running tight margins, that kind of payment might cover a few months of cash-flow pressure—but it doesn’t fundamentally change the long-term trajectory.

The difference between how farmers use that breathing room may well determine which operations are still shipping milk in 2030.

The Financial Reality We’re Living With

You probably know this already, but it bears repeating: U.S. dairy has been facing structural profitability challenges since at least 2015. This isn’t just bad luck or one tough year strung after another.

USDA Economic Research Service cost-and-return data and farm business summaries from land-grant universities tell a consistent story. Many commercial dairies have operated with thin margins over the past decade—often leaving only a small cushion after covering operating expenses and debt service. Ag lenders generally consider a debt-service coverage ratio above 1.25 “adequate” and above 1.75 “strong,” according to Farm Credit lending materials. Many operations haven’t seen those stronger numbers consistently in years.

Why does this matter so much right now? Volatility.

USDA Agricultural Marketing Service Class III price data clearly tells the story. In 2023, prices ranged from a low of $13.77 in July to $19.43 later in the year. Then, in 2024, it swung even wider—from $15.17 to $23.34 in September. That’s the kind of $4-plus per hundredweight annual swing that’s become almost routine.

Class III milk prices swung $9.57 between July 2023’s crisis low ($13.77/cwt) and September 2024’s peak ($23.34/cwt)—representing $31,200 in annual revenue volatility for a typical 300-cow operation. This isn’t bad luck; it’s the new normal forcing strategic decisions you can’t avoid.

For a 300-cow herd shipping around 65,000 pounds monthly, a $4 swing represents roughly $30,000 in annual revenue. That’s the difference between upgrading your cooling system and wondering how you’ll make the equipment payment.

A $4/cwt price swing—routine in today’s market—costs a 300-cow operation $31,200 annually. That’s not margin erosion; that’s the difference between upgrading equipment and wondering how you’ll make the payment. Small operations can’t absorb this volatility without fundamental changes. Find your herd size. Feel the impact.

You can’t plan around that kind of volatility. You can only build systems—financial and operational—that survive it.

What Lenders Actually See

When your lender reviews your file, they’re looking at a handful of key ratios. Here’s what those numbers mean from their perspective, based on Farm Credit and Compeer Financial lending benchmarks:

Current Ratio (current assets ÷ current liabilities)

  • Above 2.0: Breathing room. You can handle surprises.
  • 1.2 to 1.5: Functional but vulnerable. One bulk tank rejection, one compressor failure, one key employee quitting—and you’re scrambling.
  • Below 1.0: Crisis. You can’t cover short-term bills without new borrowing.

Debt-to-Asset Ratio

  • Under 50-60%: Comfortable. You have options.
  • 60-70%: Refinancing gets harder. Lenders watch you closer.
  • Above 70%: Difficult territory. Conversations change.

Debt-Service Coverage Ratio (net income available ÷ total debt payments)

  • Above 1.25: Adequate coverage with cushion for bad months.
  • 1.0 to 1.15: Making payments, but zero margin for error.
  • Below 1.0: Farm income can’t cover debt. Something has to change.

When margins run this tight, a price drop or feed cost spike doesn’t just reduce profits. It triggers cascading stress that takes years to recover from. I’ve seen operations that looked solid on paper in January find themselves in workout discussions by August because one thing went sideways and there was no cushion.

Government support programs address immediate pressure. They don’t change the underlying cost structures or market dynamics that created the margin compression.

Getting Honest About Your Numbers

This is where things get practical—and where most farm families haven’t done the math as precisely as they probably should.

The Center for Dairy Excellence in Pennsylvania coordinates a Dairy Decisions Consultant program connecting dairies with experienced advisors. What their work consistently reveals is that many operators overestimate profitability because they don’t accurately capture all costs.

Cost CategoryTypical $/cwtOften Underestimated?Why It Matters
Feed (homegrown at market value)$9.50✓ YES (many use cost-of-production not market value)Homegrown hay worth $180/ton? That’s your cost, not $0
Labor (including family)$4.20✓✓ YES (family labor valued at zero or minimum wage)Your time has value – $45K/year minimum or you’re paying to work
Repairs & Maintenance$1.80✓ YES (deferred maintenance not counted)Deferred = future crisis. Include realistic annual average
Utilities (electric, water, fuel)$1.40No (usually accurate)Usually captured accurately in most analyses
Insurance & Property Taxes$1.20✓ YES (property tax increases forgotten)Increasing property values = rising taxes many forget to model
Interest on Debt$2.10No (debt service is visible)Interest is painful but at least it’s visible in statements
Equipment Depreciation$1.60✓✓ YES (many skip or undervalue)Equipment wears out. $500K parlor ÷ 15 years = $33K/year real cost
Family Living Draw (realistic)$2.50✓✓✓ MOST MISSED (survival wages vs actual need)Can your family ACTUALLY live on what you draw? Be honest.
Other Operating Expenses$1.70✓ YES (small categories add up)Vet, breeding, supplies, fuel – individually small, collectively $1.70/cwt
TOTAL True Break-Even$26.00Penn State studies: Most farmers underestimate by $3-5/cwt

Three numbers matter most:

  • Your true break-even milk price. This isn’t just operating expenses divided by production. It’s everything: feed, including homegrown forages valued at market rates; labor; utilities; repairs; interest; insurance; property taxes; a realistic family living draw—not survival wages, but what you’d actually need—and equipment depreciation. Penn State Extension cash-flow tools consistently show that once you include family living, full depreciation, and opportunity costs, many dairies discover their true cost of production runs noticeably higher than their mental estimates.
  • Your actual DSCR. Net farm income available for debt service is divided by total annual payments. This tells you whether profitability is genuine or depends on favorable price cycles. Here’s a useful exercise: model your DSCR using the 10-year average milk price instead of current levels. If it drops below 1.0, you’re more vulnerable than the good months suggest.
  • Your competitive position. How does your cost of production compare to similar operations? USDA’s Agricultural Resource Management Survey and state dairy business summaries group herds by cost percentile. There’s a clear top tier of low-cost producers, a large middle group, and a smaller segment of high-cost operations struggling at commodity prices regardless of market conditions.

What’s revealing—and this comes from conversations with consultants across the Upper Midwest—is how often farmers discover they’re in a different position than they assumed. Operations that undergo formal financial analysis often find that their actual situation differs materially from their intuitive sense of how things are going.

Three Paths Forward

Once you have accurate numbers, strategic options come into focus. Research from Iowa State’s Beginning Farmer Center and Wisconsin’s Center for Dairy Profitability points to three main directions. None is universally right. All require honest assessment.

The Expansion Path

For operations with strong debt-service coverage and genuine competitive advantages—exceptional genetics, reliable labor, favorable land costs, proximity to processing—expansion into the 1,000-plus cow range may offer scale economics needed to remain competitive.

But here’s the reality check. Recent lender case studies and construction bids suggest that taking a 300-cow dairy into that range can require several million dollars in new facilities, equipment, and working capital. At current commercial interest rates—often running 7-8% for expansion financing through private lenders according to Federal Reserve district surveys—payback periods approaching a decade aren’t unusual unless margins run consistently strong.

A Minnesota lender framed the key question this way: Can your operation achieve profitability at the 10th percentile milk price for your region? If expansion only pencils out when prices are above average, the risk profile may be too aggressive.

That said, for the right operation with strong management depth, disciplined financial oversight, and realistic timelines, expansion remains viable. The farms succeeding at scale typically share those characteristics—it’s not just about cow numbers.

The Restructure Path

For DSCR values between 1.0 and 1.25, there’s a middle path. Stay near the current scale while fundamentally improving profitability through efficiency gains or market repositioning.

What’s working for farms pursuing this approach?

  • Premium market access. Organic certification can add meaningful dollars per hundredweight according to USDA Agricultural Marketing Service organic price reports, though the three-year transition demands careful cash-flow planning. A2 programs and grass-fed premiums offer smaller but real improvements for operations with appropriate genetics and infrastructure.
  • Cost structure improvement. Feed efficiency typically offers the largest opportunity—improving pounds of milk per pound of dry matter intake flows to the bottom line across every cow, every day. Labor efficiency through better scheduling and reduced turnover comes next. Genetic selection emphasizing productive life and component yield rather than type traits rounds out the practical options. For herds averaging 4.0% butterfat versus 3.5%, component premiums can add $0.50 to $1.00 per hundredweight to your mailbox price—that’s real money across a full year of production.
  • Cooperative positioning. Farmer-owned cooperatives often provide better price transparency than commodity channels, though this varies by region. Edge Dairy Farmer Cooperative in the Upper Midwest has been active on contract transparency. For some operations, the right co-op relationship provides stability worth as much as a premium.

This path typically requires 3-5 years of focused execution. It works best when the next generation has a genuine interest and developing capability.

The Exit Path

Let’s be clear: Exiting isn’t quitting. It’s preserving equity.

Burning $450,000 of family wealth just to say you hung on for three more years isn’t pride—it’s poor management. And I’ve watched too many families learn that lesson the hard way.

For operations with DSCR persistently below 1.0 or structural losses that relief payments mask rather than resolve, a strategic exit often preserves more family wealth than continued operations.

Same farm. Same family. Same equity—until timing changed everything. Strategic exit at month 8-10 preserved $480K. Waiting for forced liquidation at month 18 left $100K. That $380,000 difference? It’s not theory. It’s a real Wisconsin dairy, documented by Cornell researchers. It’s the literal cost of hoping things will turn around when the math says they won’t. Courage isn’t staying—sometimes it’s knowing when to preserve what three generations built.

Farm transition research from Cornell’s Dyson School frames the arithmetic starkly: A farm losing $150,000 annually that delays exit by three years destroys $450,000 in equity—plus the psychological toll on everyone involved. An orderly exit preserves substantially more equity than forced liquidation, in which lenders set the timeline and distressed sales become unavoidable.

That’s not a small difference. That’s the difference between retiring with dignity and starting over with nothing.

Farm transition specialists across Wisconsin and Minnesota consistently report that families preserve substantial wealth—often $100,000 or more—by making decisions earlier and executing deliberately rather than waiting until a crisis removes options.

A retired dairyman in central Wisconsin shared something that stuck with me: “The hardest part was admitting it to myself. Once I did that, the actual process wasn’t that bad. And my kids thanked me for not making them watch it fall apart.”

Exit isn’t failure. For many families, it’s the decision that preserves generational wealth and allows the next generation to build lives that match their actual interests. Sometimes the bravest thing you can do is know when to stop.

FactorExpansion PathRestructure PathStrategic Exit
Minimum DSCRAbove 1.751.0-1.25Below 1.0
Capital Required$3-5M+$50-150KConsultant fees only
Timeline5-7 years to payback3-5 years8-10 months
Risk LevelVery HighModerateLow (preserves equity)
Success Rate<5% access financing30-40% achieve goals100% preserve wealth
Next Generation?Strongly committedInterested, developingFree to choose their path
Best Case Outcome1,000+ cows, economies of scaleProfitable niche, sustainablePreserve $400K-$680K equity
Worst Case OutcomeCrushing debt at 7-8% interestMargin improvement insufficientWait too long, lose $450K
Andrew’s Reality CheckOnly works for top-tier operations. Most can’t get financing.Requires discipline and premium market access. Not a miracle cure.Not failure—it’s strategy. Preserves generational wealth.

Different Stakeholders See This Differently

Farmers, processors, cooperatives, and lenders view consolidation through different lenses. Understanding those perspectives helps explain why solutions remain elusive.

From the processor perspective, consolidation creates efficiencies. The International Dairy Foods Association has noted that larger, more consistent milk supplies reduce collection costs and enable capital investment in specialized processing. The trend toward fewer, larger farms isn’t something most processors resist—their infrastructure investments often assume it continues.

Cooperatives occupy more complicated ground. Organizations like Dairy Farmers of America represent both large farms that benefit from consolidation and mid-sized operations that struggle against it. That tension surfaces in policy debates, pricing decisions, and governance questions.

Lenders are segmenting portfolios more deliberately. Operations with strong metrics receive competitive rates and expansion financing. Those in the middle face cautious credit and frequent reviews. Those showing deterioration get workout discussions—sometimes before the farm family has acknowledged the trajectory.

The Kitchen Table Conversation

Whatever path makes financial sense, research on farm transitions reveals something important: Most failed successions trace back to communication and expectations more than financial impossibility.

Farm transition educators at Manitoba Agriculture and Penn State Extension report this pattern consistently. Families carry different assumptions about what should happen—and unspoken expectations compound into problems that could have been addressed years earlier.

What seems to work:

  • Before the family meeting, each person answers hard questions individually. Senior generation: Can I genuinely step back and let the next generation make different choices? What income do I actually need in retirement? Is this operation viable for the next generation without ongoing relief?
    For the next generation: Do I actually want to farm, or am I carrying an obligation? Can I earn a reasonable living from this operation as structured?
  • During the meeting, a neutral third party presents actual financial data—an accountant, extension educator, or consultant without an emotional stake —presenting facts rather than perceptions.
  • After the meeting, document whatever’s decided. Not from distrust. Because written agreements prevent the “I thought you meant…” conversations that later fracture relationships.

The Labor Reality

For operations choosing to stay and optimize, labor management has become as critical as milk price management.

Texas A&M research confirms what many of us have seen firsthand: immigrant labor accounts for about 51% of all dairy workers nationally. And turnover remains a persistent challenge—the FARM Workforce Development program found average turnover approaching 40% across participating dairies. For a 300-cow operation needing three or four milkers, that means potentially replacing more than one person every year.

At 38.8% annual turnover, a typical 20-worker dairy operation loses nearly $155,200 every year to workforce churn. That’s not just an HR problem—it’s production poison. Studies show high turnover triggers 1.8% decrease in milk production, 1.7% increase in calf losses, and 1.6% spike in cow mortality. You’re literally losing cows and calves because you can’t keep people.

Michigan State University Extension research shows the total cost of losing and replacing a dairy employee can reach 100-150% of annual wages—accounting for recruiting, training, productivity loss, and learning-curve mistakes. For a full-time milker earning $38,000-$45,000, that’s potentially $40,000 or more every departure.

What are farms with strong retention doing?

  • Housing makes a real difference. University of Wisconsin and Cornell Extension case studies describe dairies that added on-farm housing, resulting in dramatic declines in turnover—some reporting waiting lists for positions.
  • Total compensation matters more than hourly rate. Consistent year-round hours often retain people better than higher wages with unpredictable schedules. Health insurance moves the needle on retention.
  • Career pathways change the equation. Paying for certifications, creating advancement from milker to lead to herd manager—these transform dairy work from a temporary job to a career worth building.

Robotic milking can make sense, but the investment is larger than sometimes expected. Industry benchmarks from Hoard’s Dairyman put individual robots at $150,000 to $275,000 before construction. Three or four units with barn modifications can climb well past a million dollars. The math works when operations are financially solid, and labor genuinely constrains options. It often doesn’t work when you’re already stressed—adding fixed costs to situations that need flexibility.

Regional Realities: Why Your Location Changes Everything

RegionTypical “”Mid-Size””Key AdvantageMajor ChallengeWhat Success Looks Like
Upper Midwest (WI, MN)300-500 cowsCheese market infrastructure, cooperative network, land costs moderateWinter feed costs, labor housing in rural areas, consolidation pressureDSCR 1.5+, feed efficiency >1.5, co-op loyalty for price stability
California / Southwest2,000+ cowsScale economies, year-round production, processing proximityWater costs ($50K+/year), regulatory compliance, manure management expenses2,500+ cows minimum, robotic milking, water rights secured
Northeast (NY, VT, PA)120-250 cowsFluid milk premiums, local market access, population densityLand cost 3-4X Midwest, fragmented processing, limited expansion roomOrganic or premium markets, direct-to-consumer options, 150+ cows profitable
Southeast (GA, FL, TN)200-400 cowsGrazing-based lower feed costs, heat-tolerant genetics availableHeat stress (May-Sept), forage quality in humidity, limited processingGrazing-based <$15/cwt cost, heat abatement investment, niche marketing

Everything discussed applies most directly to Upper Midwest operations—the Wisconsins and Minnesotas, where cheese-focused production dominates. The framework translates elsewhere, but the specifics shift considerably.

  • California and the Southwest operate at entirely different scales—a “mid-sized” Central Valley dairy might milk 2,000 cows. Water costs that barely register in Wisconsin can run $50,000-plus annually in California. Compliance with manure management adds layers of expense. I talked with a Tulare County producer last year who said his regulatory costs alone would bankrupt most Midwest operations his size.
  • The Northeast offers stronger local market access and premium opportunities—fluid milk still dominates, and proximity to population centers creates options. But land costs can run three to four times those in the Upper Midwest, and fragmented processing means fewer outlets. A Vermont organic producer told me his premium market access is the only reason he’s still viable at 120 cows.
  • The Southeast operates with grazing-based systems, creating fundamentally different cost structures. Heat-stress management and forage systems look nothing like those in Upper Midwest production. Fluid milk focus means different price exposure than cheese-market operations.

The framework—understand your numbers, choose a path, have family conversations, address labor strategically—applies everywhere. But the thresholds and viable options vary considerably. Your local extension dairy specialist can help translate.

What to Do in the Next 30 Days

For the producer who just received government support: Before allocating it all to operations, invest a small portion in understanding your actual position.

A diagnostic assessment from a qualified dairy consultant typically runs $2,000 to $5,000, depending on scope and region. What you receive: actual DSCR compared to benchmarks, true break-even determination, competitive position assessment, and honest conversation about realistic options.

Why January matters: Most lenders conduct annual portfolio reviews in late winter. Getting your analysis done now—before those reviews, before spring planting decisions lock in cash flow, and with time to implement changes before peak production season—gives you maximum flexibility. If your lender identifies concerns in their February review and you haven’t done your homework, you’re reactive. If you’ve already got a plan and the data to support it, you’re in a much stronger position. Wait until March, and you’ve lost two months of runway.

Where to start: County Extension offices often provide free initial consultations. In Wisconsin and the Upper Midwest, the Center for Dairy Profitability at UW-Madison offers farmer-focused analysis at cdp.wisc.edu. The Center for Dairy Excellence coordinates approved consultants across Pennsylvania and neighboring states at centerfordairyexcellence.org. Farm Credit associations offer analysis as part of lending relationships.

Questions worth asking: Where do I actually stand financially? How do I compare to similar operations in my region? What’s my true break-even? Based on these numbers, what options make sense?

Schedule it now. The farmer who gets clarity in January makes better decisions in March—and has time to act on them before the year gets away.

WeekAction ItemWho to ContactWhat You’ll LearnCost
Week 1 (Jan 6-12)Gather financial documentsYour accountant/bookkeeperActual liabilities, assets, cash flow$0
Week 1 (Jan 6-12)Calculate actual DSCRExtension office (free tools)Where you REALLY stand (not where you hope)$0-200
Week 2 (Jan 13-19)Contact dairy consultantCenter for Dairy Profitability / local consultantWhat diagnostic analysis costs ($2-5K)$0-500
Week 2 (Jan 13-19)Run break-even analysisConsultant + your actual production dataTrue cost per cwt including ALL costs$2,000-5,000
Week 3 (Jan 20-26)Schedule family meetingSpouse, next generation, key familyWhether expectations align across generations$0
Week 3 (Jan 20-26)Model 3-path scenariosConsultant or extension advisorWhich path makes financial sense for YOUR numbersIncluded
Week 4 (Jan 27-Feb 2)Meet with lender (proactive)Your ag lender (Farm Credit, etc)Their view of your operation BEFORE formal review$0
Week 4 (Jan 27-Feb 2)Decide & document planAttorney if exit, consultant if expand/restructureCommitment to action or need to pivot$500-2,000

Government support provides breathing room. What dairy families do with that breathing room—pursue honest assessment and deliberate decisions, or extend the status quo—will shape which operations remain viable.

The farms navigating this successfully share one trait: they got clear on their actual position early enough to still have options.

That’s not pessimism. That’s strategy.

Key Takeaways

  • Relief payments buy time—not a future. Use this cash to understand your true position, not just pay down the feed bill.
  • Below 1.25 DSCR? You have no cushion. Model your numbers at 10-year average milk prices. If it drops below 1.0, you’re exposed.
  • Three paths exist: expansion, restructuring, or strategic exit. All are valid. None work can be done without an honest financial assessment first.
  • Waiting costs more than deciding. Cornell research shows that delaying exit by three years destroys $450,000 in family equity. Exiting isn’t failure—it’s strategy.
  • January clarity beats March panic. Lenders review portfolios in late winter. A $2K-$5K diagnostic now gives you leverage before those conversations start.

Learn More:

Complete references and supporting documentation are available upon request by contacting the editorial team at editor@thebullvine.com.

Learn More:

The Sunday Read Dairy Professionals Don’t Skip.

Every week, thousands of producers, breeders, and industry insiders open Bullvine Weekly for genetics insights, market shifts, and profit strategies they won’t find anywhere else. One email. Five minutes. Smarter decisions all week.

NewsSubscribe
First
Last
Consent
Send this to a friend