Harrisburg dark Oct 6. 11 farms stranded, unpaid milk piling up. 19.70 $/cwt? $188k yearly bleed for 200‑cow herds. State scorecard + 30‑day paths inside.
When Harrisburg Dairies shut down for good on October 6, 2025, the trucks just stopped coming. At least 11 or 12 family farms and their haulers were suddenly sitting on weeks of shipped milk with no check and no clear backup buyer. That was one regional bottler, one weekend — and a preview of what 19–20 $/cwt milk looks like when the math and the processor power both turn against you.
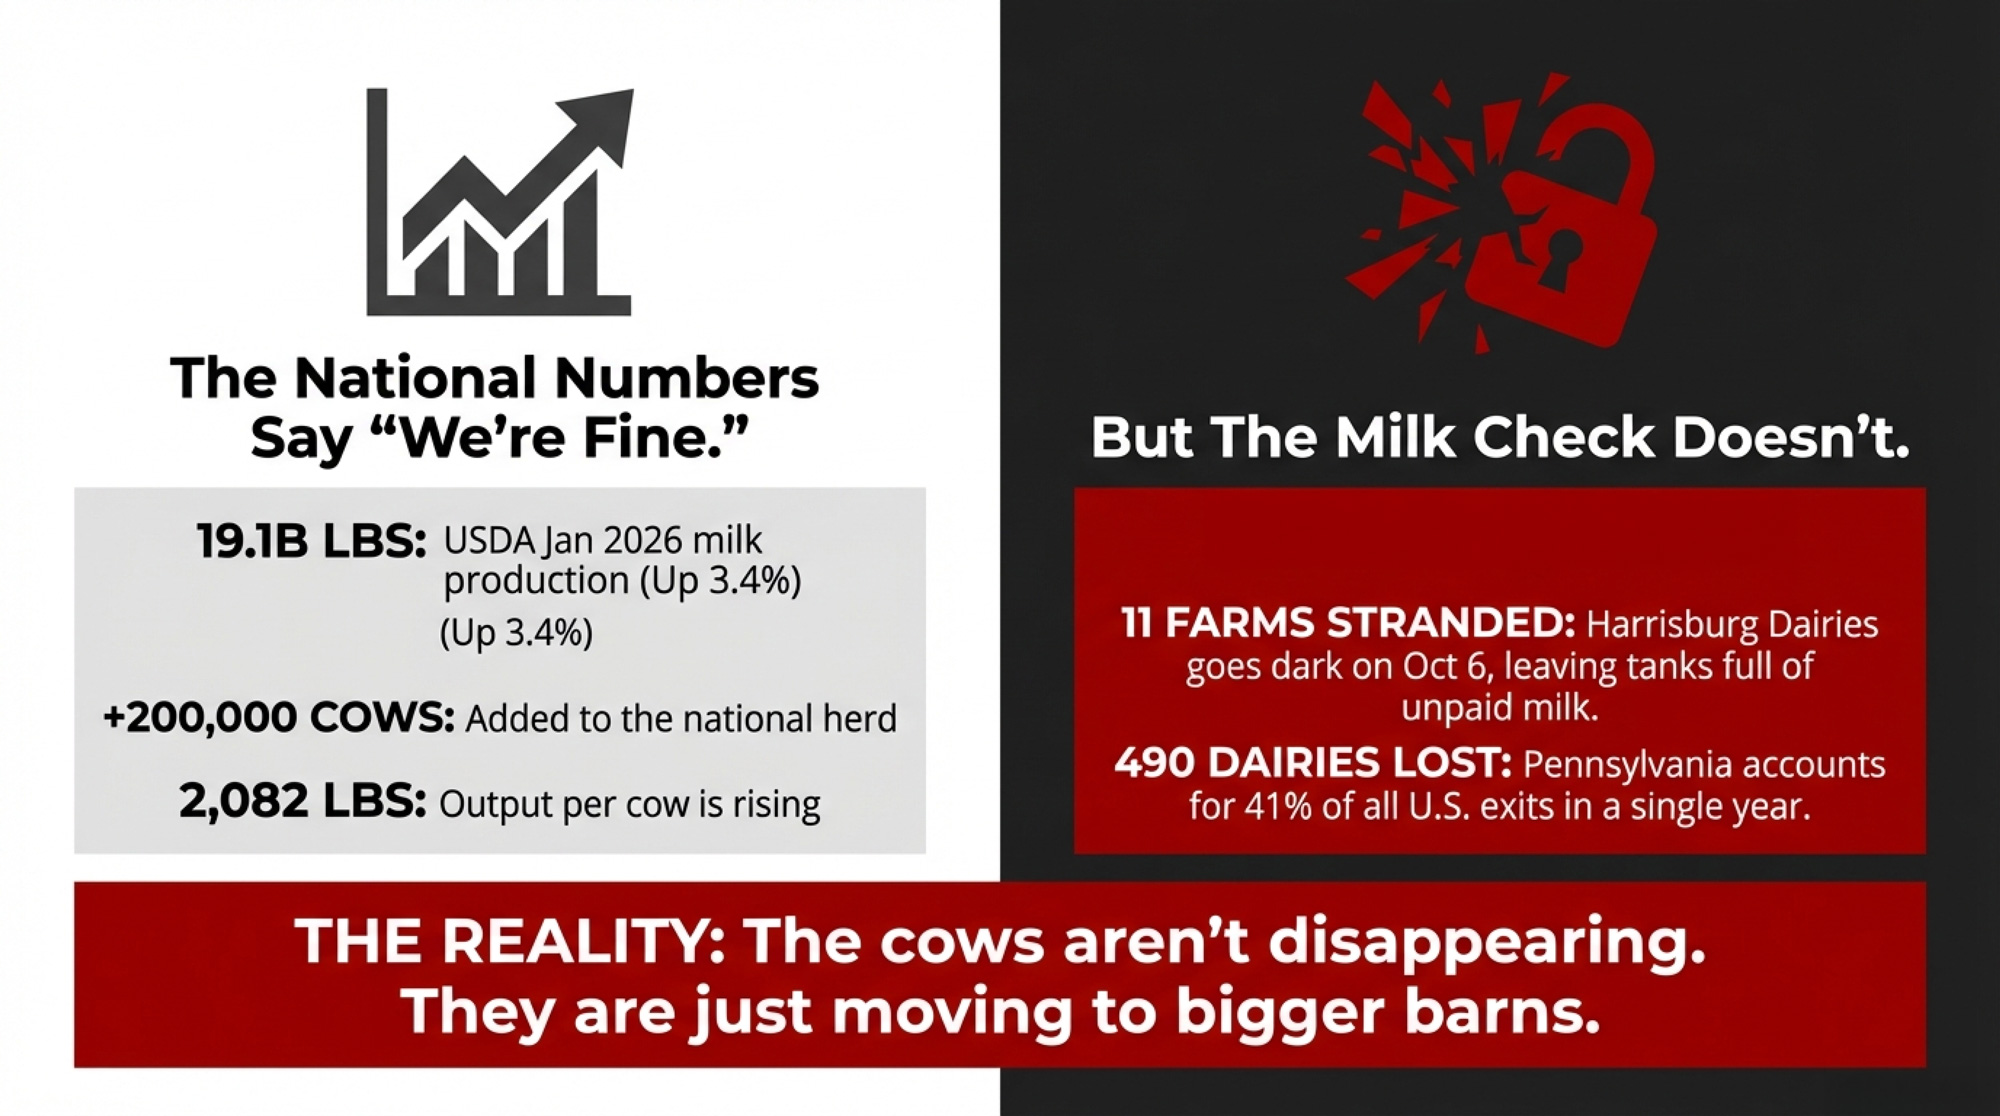
When the National Numbers Say “We’re Fine” — But Your Milk Check Doesn’t
In Canadian research led by the University of Guelph’s Dr. Andria Jones‑Bitton, roughly one in four farmers said they’d had thoughts of suicide in the previous 12 months, often during winter when stress, debt, and dark days all pile up. Now look at the U.S. scoreboard. USDA NASS says total farm numbers fell from 1,880,000 in 2024 to 1,865,000 in 2025 — that’s 15,000 farms gone in a single year across all sectors. At the same time, January 2026 milk production in the 24 major dairy states hit about 19.1 billion lb, up 3.4 % from a year earlier.
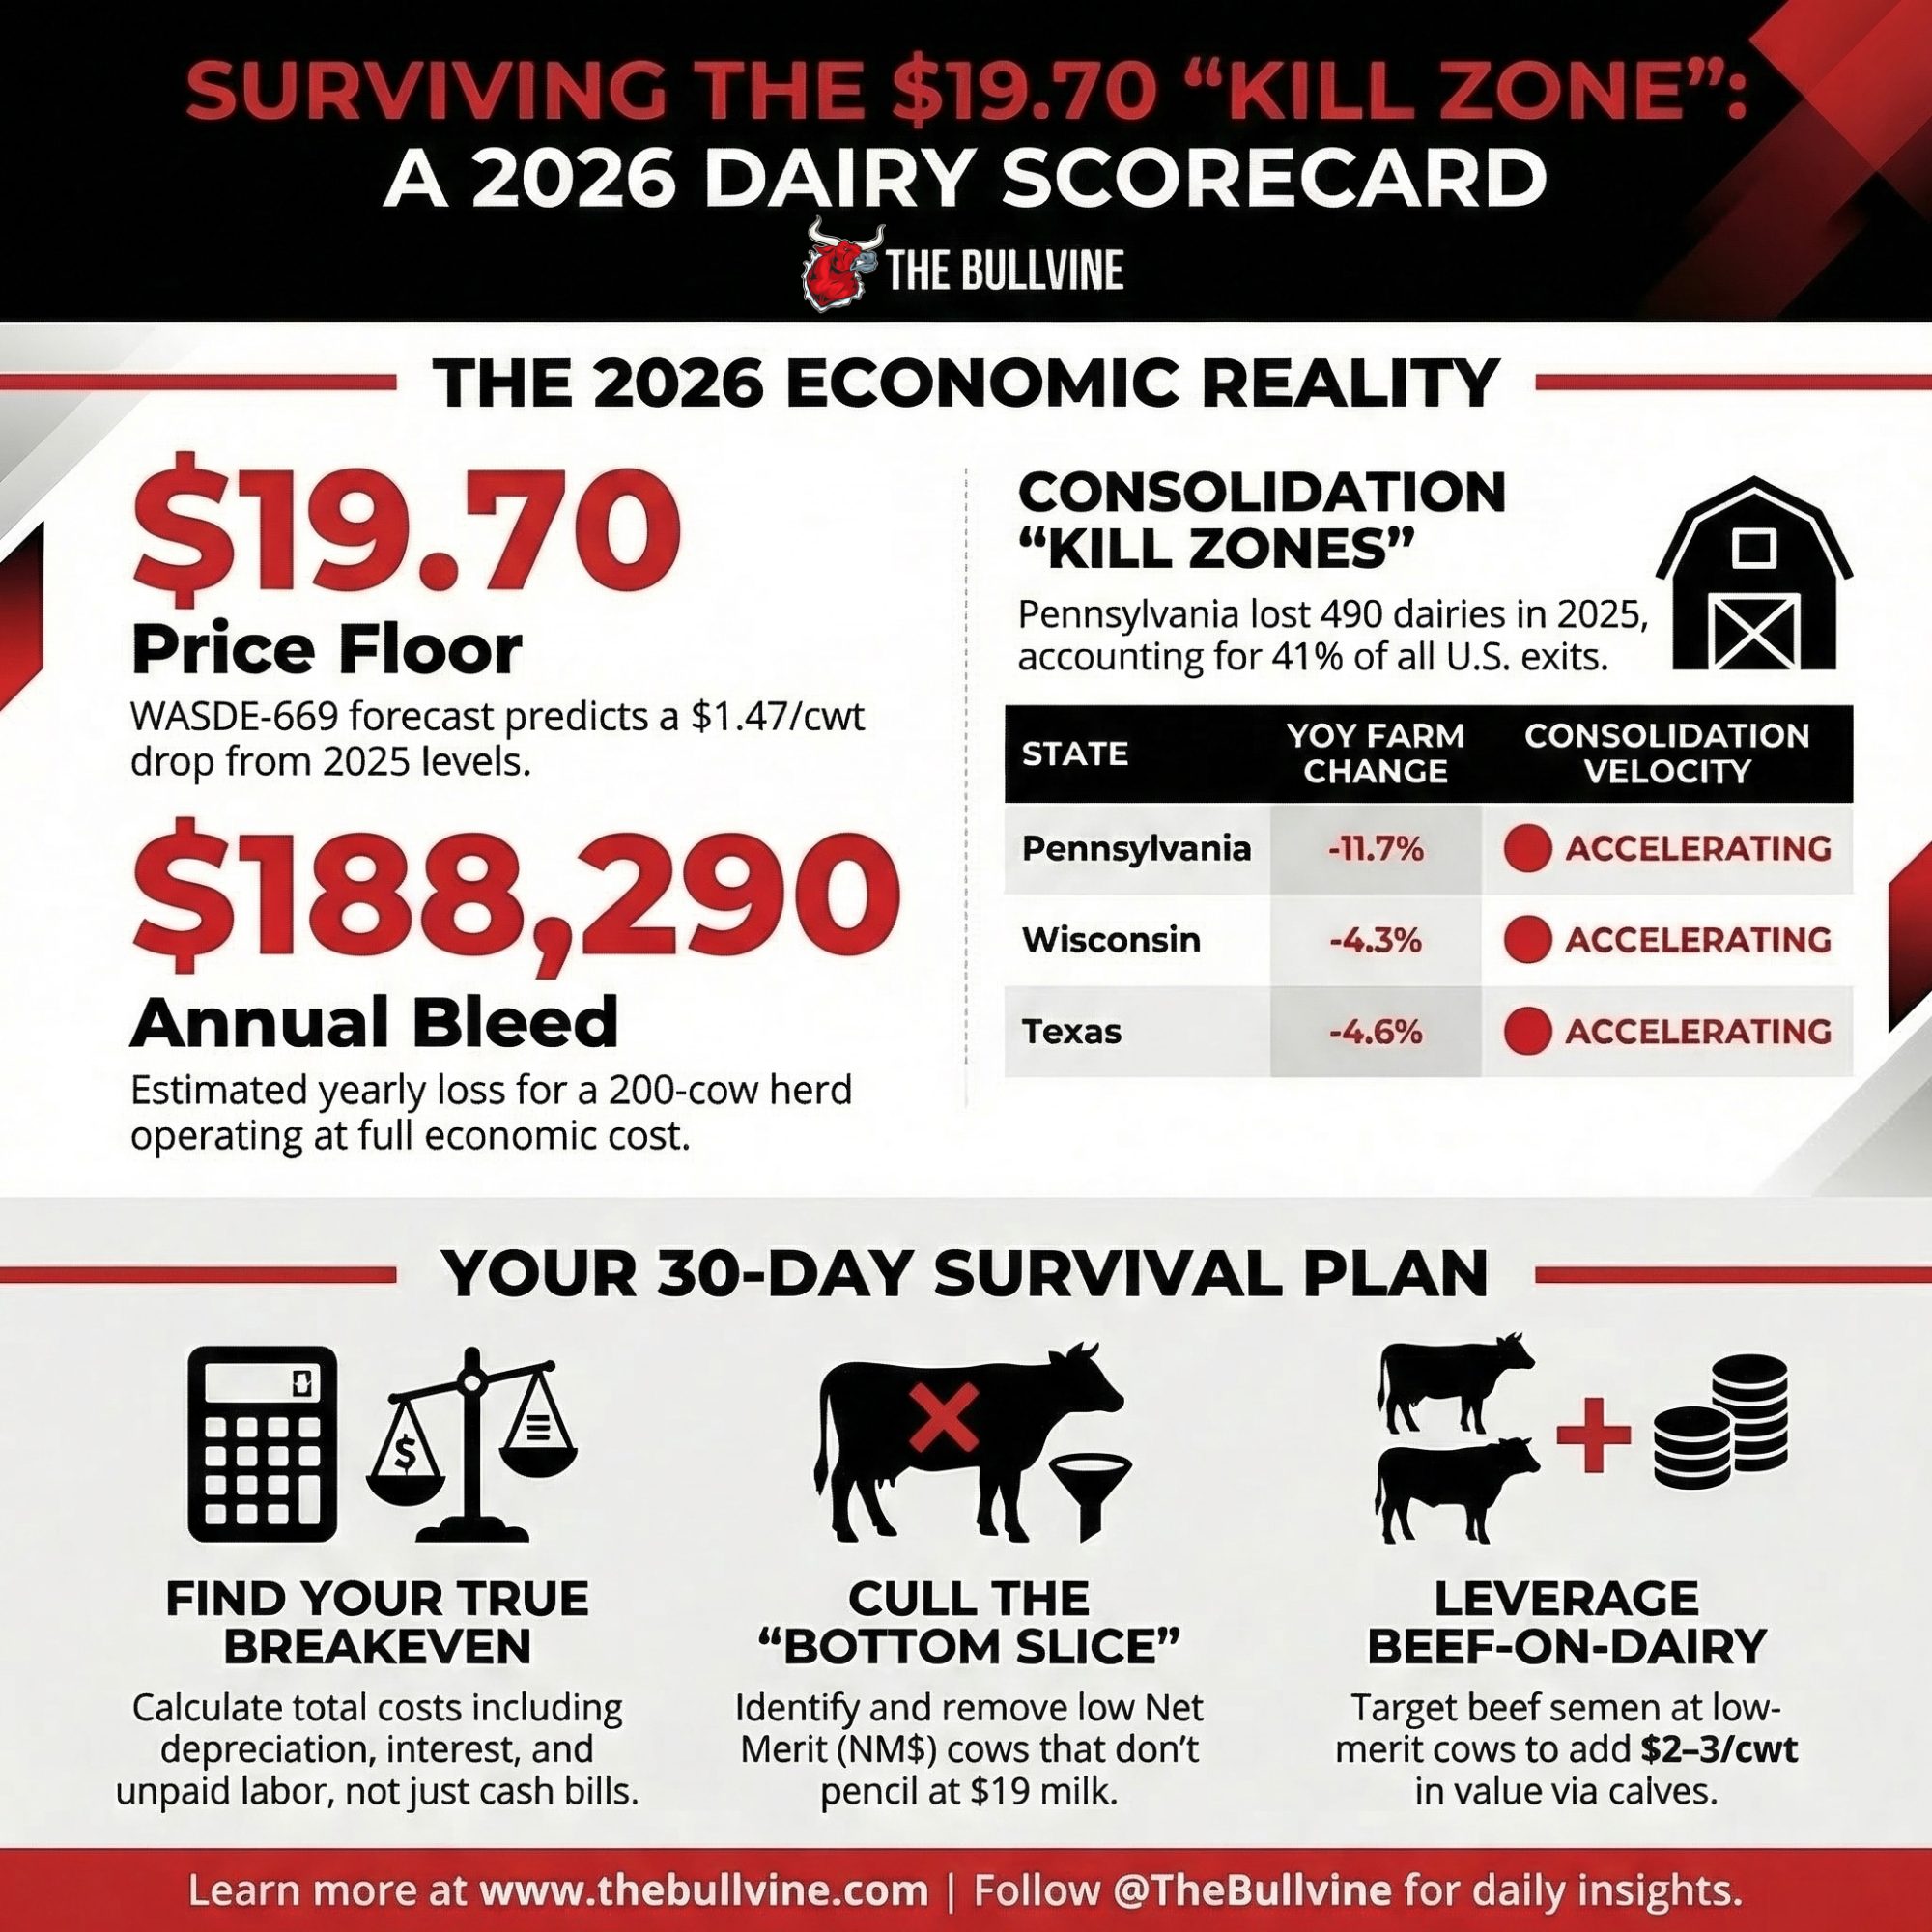
USDA ERS estimates 2025 U.S. milk production at around 231.5 billion lb, roughly 2.5% higher than 2024. WASDE‑669 then calls for a 2026 all‑milk price of 19.70 $/cwt, down from 21.17 $/cwt in 2025. On a 300‑cow herd shipping about 69,000 cwt/year, that 1.47 $/cwt drop alone carves roughly 101,000 $ out of your annual milk check before you do anything wrong. You feel that in every feed‑mill statement, every delayed repair, every time you tell yourself you’ll talk to the bank “after planting.”
Meanwhile, the cows keep coming. In January 2026, the 24 major milk states reported about 9.15 million cows, roughly 200,000 head more than a year earlier. Average output hit 2,082 lb/cow for the month, 24 lb higher than January 2025. NASS licensed‑herd time series show dairy operations have fallen by well over half in two decades, yet national milk production is still climbing. The cows aren’t disappearing — they’re moving into big barns that can afford to live on 19‑dollar milk by spreading fixed costs and risk over thousands of stalls.
Add to the balance sheet. USDA ERS projects farm sector debt of around $ 624.7 billion for 2026, with interest expenses of $33 billion . Every tiny rate bump siphons a few more cents per cwt off your milk check and hands it to the bank before you pay feed, fuel, or yourself. That’s the backdrop to Harrisburg Dairies going dark — and the bigger question hanging over your yard: are you already in the kill zone at 19.70 $/cwt?
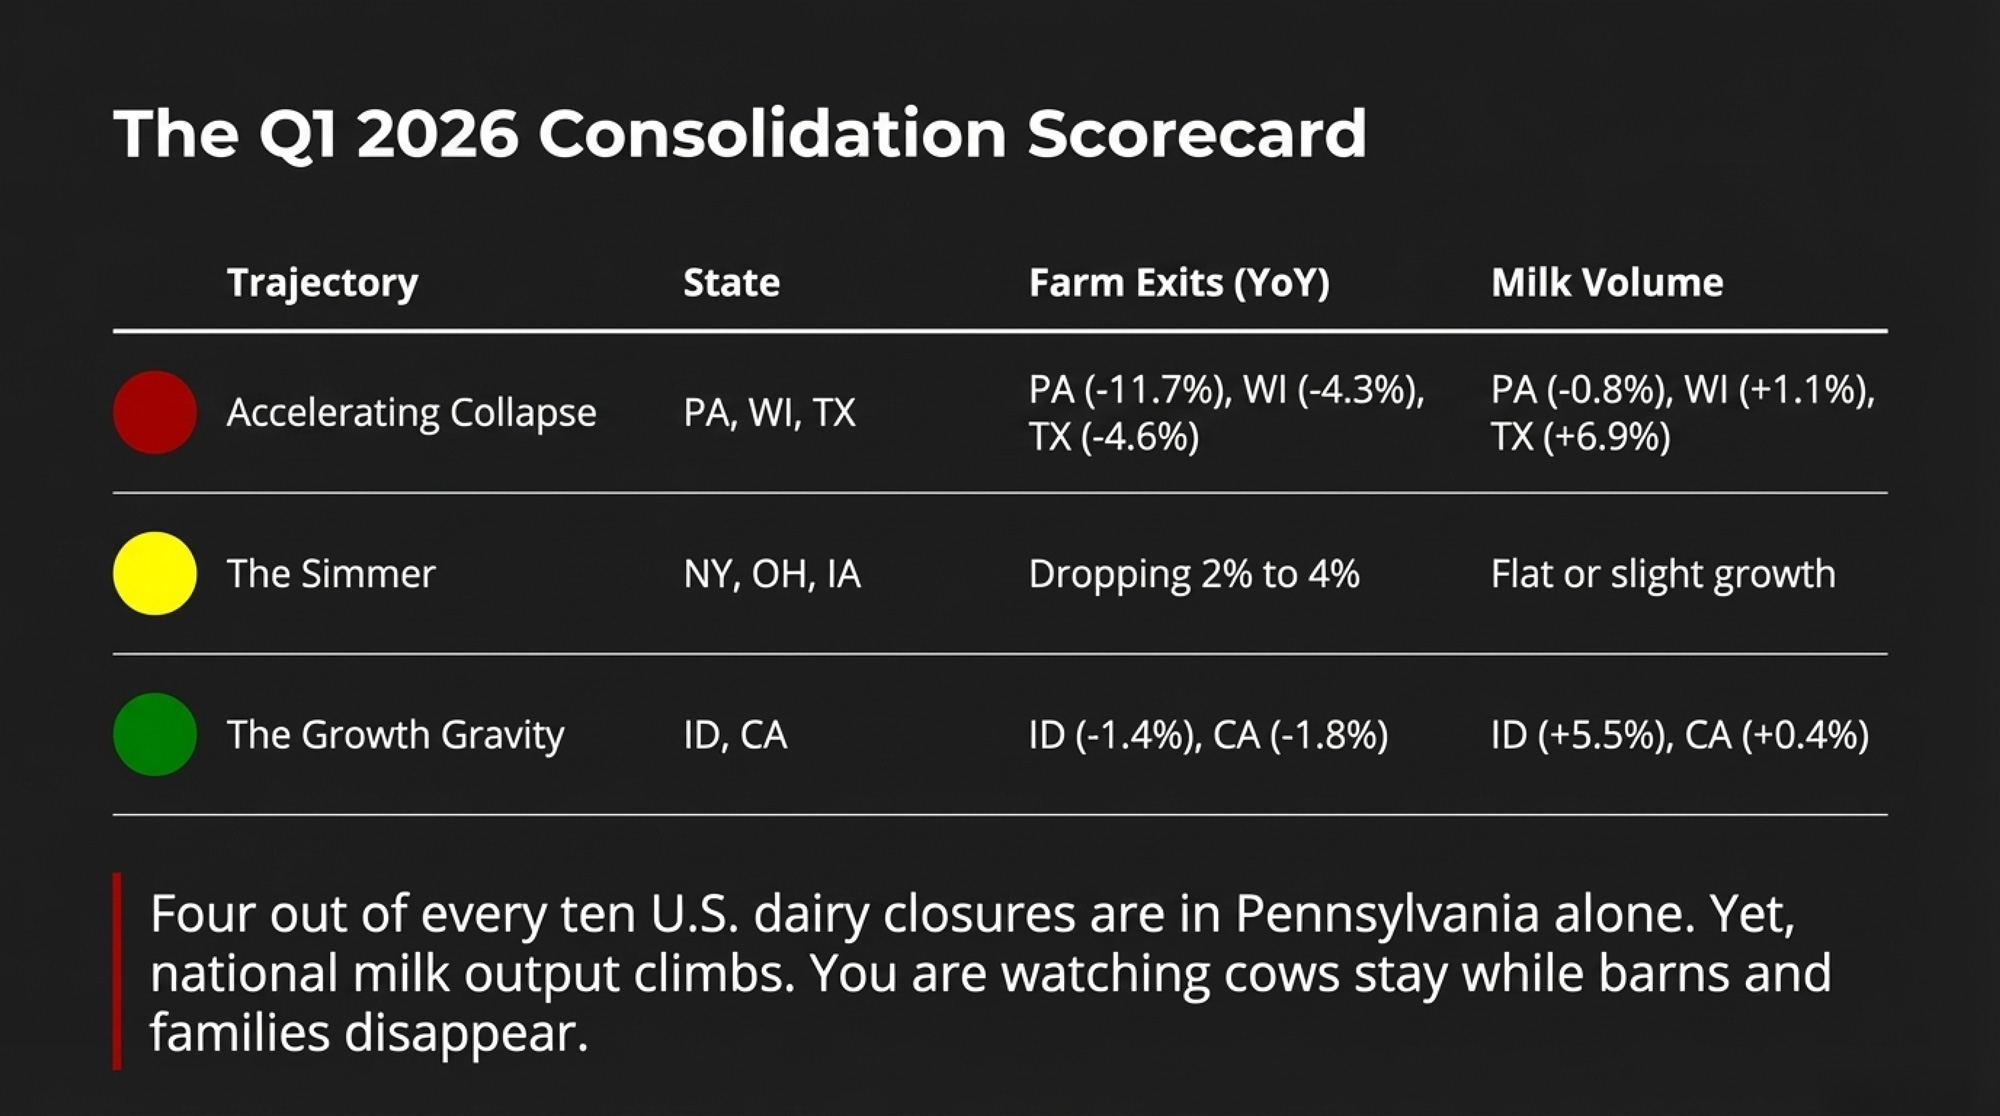
The Q1 2026 Dairy Consolidation Scorecard
The USDA’s 2025 “Farms and Land in Farms” summary provides total farm numbers by state. NASS Milk Production supplies state cow inventories and volumes. Put those together, and you can see where consolidation is running hot versus just simmering. Color codes here are based on annual dairy farm loss: RED = >4 %/year, YELLOW= 2–4 %/year, GREEN = <2 %/year. Farm counts are estimated from total farms and dairy cow numbers — directionally right, but not the same as the USDA’s licensed‑herd census.
| Color | State | Est. Farms (2025) | YoY Farm Change | Milk Prod (B lb) | YoY Prod Change | Avg Herd Size | Consolidation Velocity |
|---|---|---|---|---|---|---|---|
| 🟢 | California | 1,175 | -1.8% | 41.8 | +0.4% | 1,850 | STABLE |
| 🔴 | Wisconsin | 5,580 | -4.3% | 31.8 | +1.1% | 245 | ACCELERATING |
| 🟢 | Idaho | 345 | -1.4% | 18.2 | +5.5% | 1,680 | STABLE |
| 🔴 | Texas | 310 | -4.6% | 18.2 | +6.9% | 4,000 | ACCELERATING |
| 🟡 | New York | 2,390 | -3.9% | 15.8 | +1.2% | 260 | STABLE |
| 🔴 | Michigan | 970 | -4.5% | 12.4 | +3.4% | 550 | ACCELERATING |
| 🔴 | Minnesota | 1,810 | -5.2% | 11.2 | +1.0% | 240 | ACCELERATING |
| 🔴 | Pennsylvania | ~3,700 | -11.7% (41% of U.S. exits) | 10.1 | -0.8% | ~115 | ACCELERATING |
| 🟢 | New Mexico | 110 | -2.2% | 7.7 | -1.0% | 2,100 | DECELERATING |
| 🟡 | Washington | 275 | -2.6% | 6.8 | +1.1% | 920 | STABLE |
| 🟡 | Ohio | 1,320 | -3.4% | 5.8 | +2.1% | 195 | STABLE |
| 🟡 | Iowa | 790 | -2.5% | 5.7 | +0.7% | 275 | STABLE |
| 🟡 | Kansas | 180 | -3.8% | 4.8 | +17.2% | 1,250 | ACCELERATING |
| 🟡 | South Dakota | 140 | -2.9% | 4.5 | +9.5% | 1,300 | ACCELERATING |
| 🟢 | Colorado | 105 | -1.9% | 5.4 | +3.9% | 1,550 | STABLE |
Analysis of USDA’s licensed herd counts says the quiet part out loud: using USDA’s original 2024 baseline, the U.S. lost about 1,202 dairies in 2025, and 490 of them were in Pennsylvania — an 11.7 % drop that accounts for 41 % of all U.S. dairy exits. When four out of every ten closures are in one state and state milk still sits at near 10.1 billion lb, you’re not watching a gentle reshuffle. You’re watching cows stay while barns and families disappear.
Where Is the Processing Money Going — And What Does It Do to Your Milk Check?
If you want to know where your future mailbox price is set, follow the stainless steel, not just the blend price.
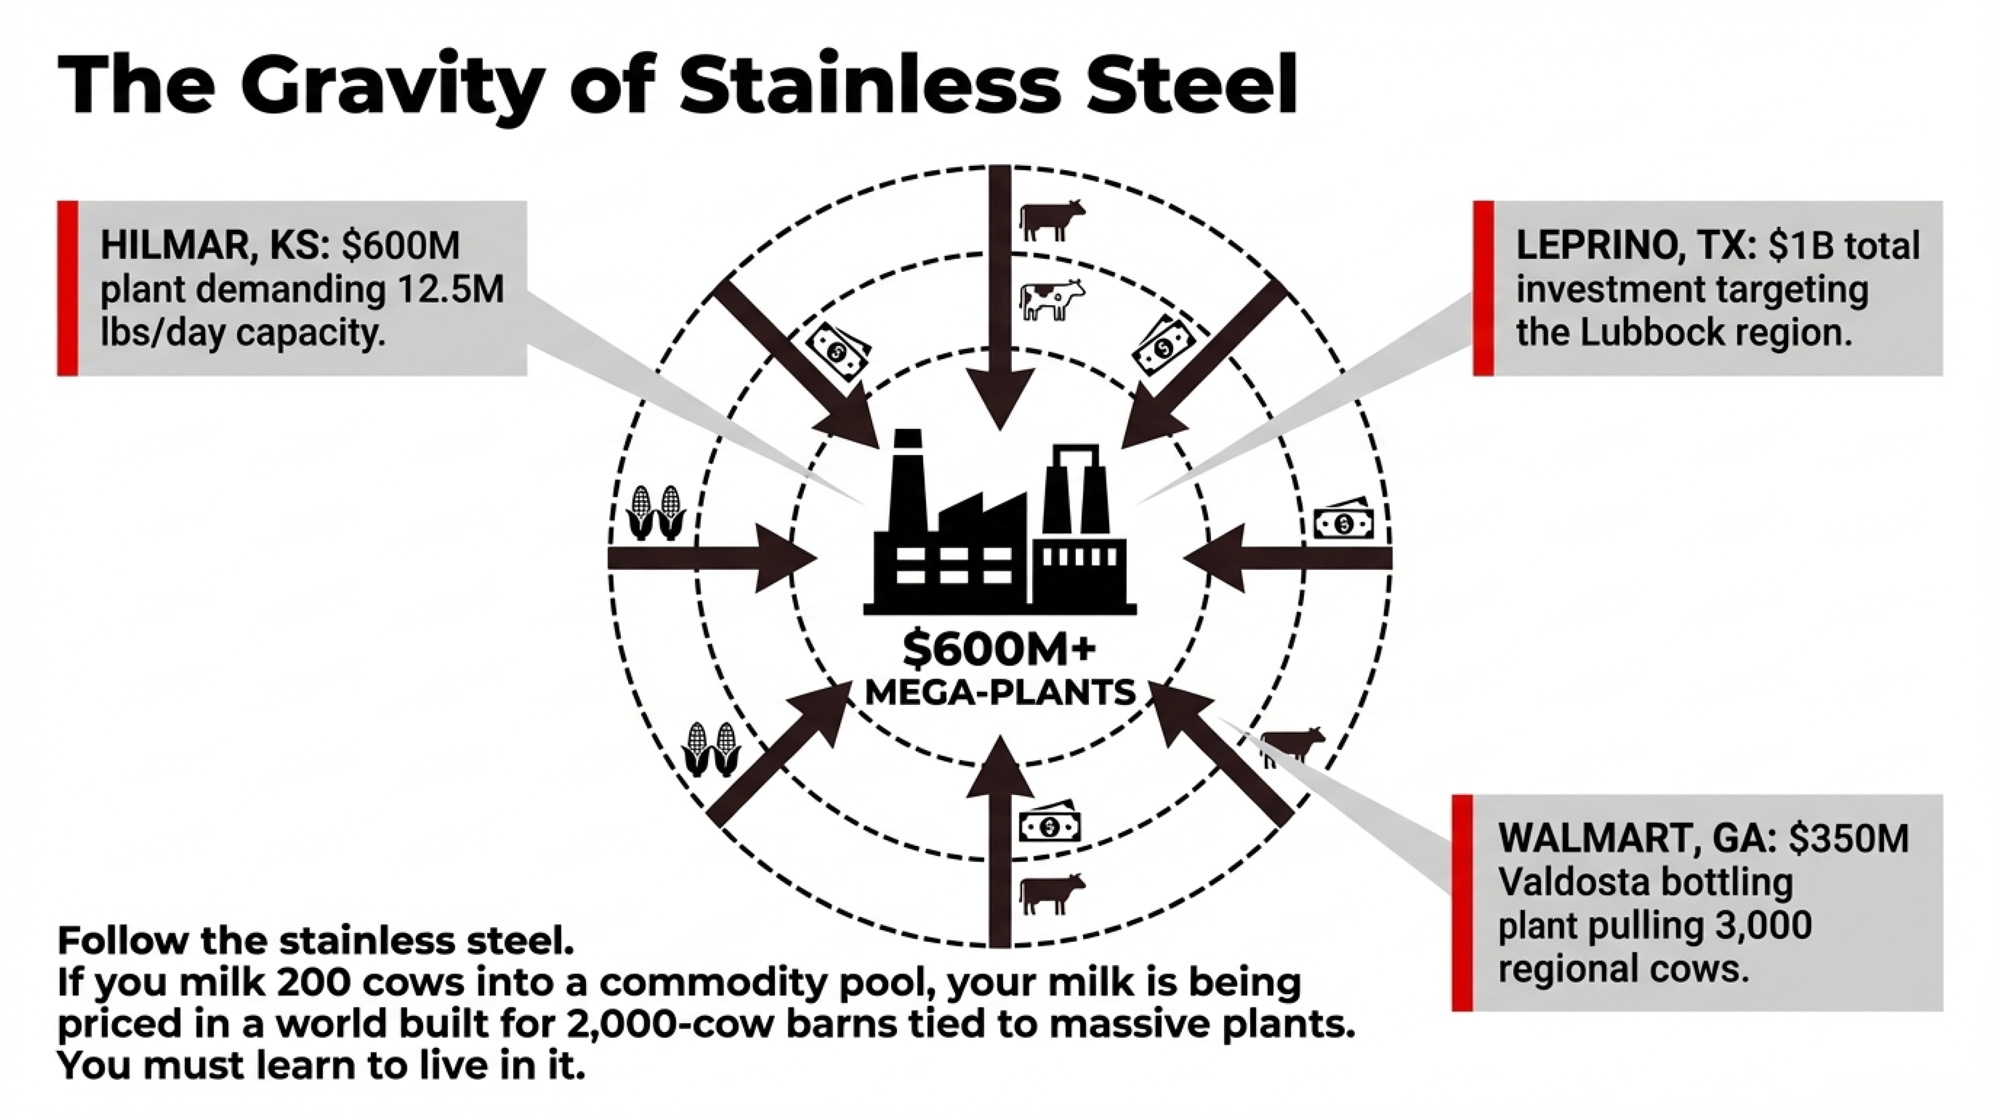
Kansas is the clearest example right now. NASS and ERS report Kansas milk output jumped roughly 17.2% in a single year, driven largely by Hilmar Cheese’s new plant in Dodge City. Hilmar has about $600 million sunk into that site, with a capacity of around 12.5 million lb/day when fully ramped, a level it essentially reached in early 2025. A plant like that doesn’t just “add capacity.” It creates gravity. Cows, corn silage, employees, and bankers all start orbiting Dodge City.
Texas and Idaho are locked in a fight for third place nationally. In 2025, Idaho’s roughly 350 dairies shipped about 18.26 billion lb, just ahead of Texas at 18.21 billion lb. But Texas has the bigger forward pipeline: Leprino’s Lubbock cheese complex — targeting roughly 1 billion $ in total investment — is phasing in through 2026, and Walmart’s fluid plant in Robinson, TX, is sourcing directly from regional farms for Great Value and Member’s Mark bottling. Those facilities want big, steady loads. That shapes what your co‑op can pay, even if your milk never hits their silos.
Up the I‑29 corridor, South Dakota shows how a single expansion can remake a region. State milk production is up around 9.5 %, tied heavily to Valley Queen’s expansion at Milbank, which doubled capacity to roughly 8 million lb/day and is expected to pull in another 25,000–30,000 cows over 2025–2026. Across the High Plains and mountain states, average herd sizes run from roughly 1,700 to more than 2,000 cows, with plenty of outfits milking 4,000 head in the Texas Panhandle.
If you’re milking 150–400 cows into a commodity pool, your milk is being priced in a world built for 2,000‑cow barns tied to 600‑million‑dollar plants. You may hate that. You still have to decide how you’re going to live in it.
Where Are Farms Bleeding Out Fastest — And Can Sub‑500‑Cow Herds Survive This Math?
While stainless steel moves west and south, the traditional milksheds are losing barns first and fastest.
NASS data for the Northeast/Mid‑Atlantic corridor (Maine through Maryland) show hundreds of dairy exits in 2025, and Farmshine’s breakdown of USDA-licensed herd numbers says that, using the original 2024 baseline, 41 % of all U.S. dairy exits were in Pennsylvania alone. That’s 490 dairies gone and an 11.7 % hit to the state’s dairy farm count in one year. State milk output only slipped about 0.8 % to roughly 10.1 billion lb, which tells you exactly what’s happening: cows are staying, they’re just changing barns and addresses.
ERS’s February 2026 cost‑of‑production work (ERR‑334) explains why this is hitting smaller herds first. For herds under 50 cows, full economic cost — cash expenses plus depreciation, unpaid labor, and opportunity cost — sits above 42.70 $/cwt. In the 100–499‑cow bracket, total economic costs cluster roughly between 19 and 21 $/cwt once you count everything, not just the checks you write. At a 19.70 $/cwt all‑milk forecast, any mid‑size herd with a true breakeven near 21.00 is losing about 1.30 $/cwt, even if there’s still something left after paying feed and fuel.
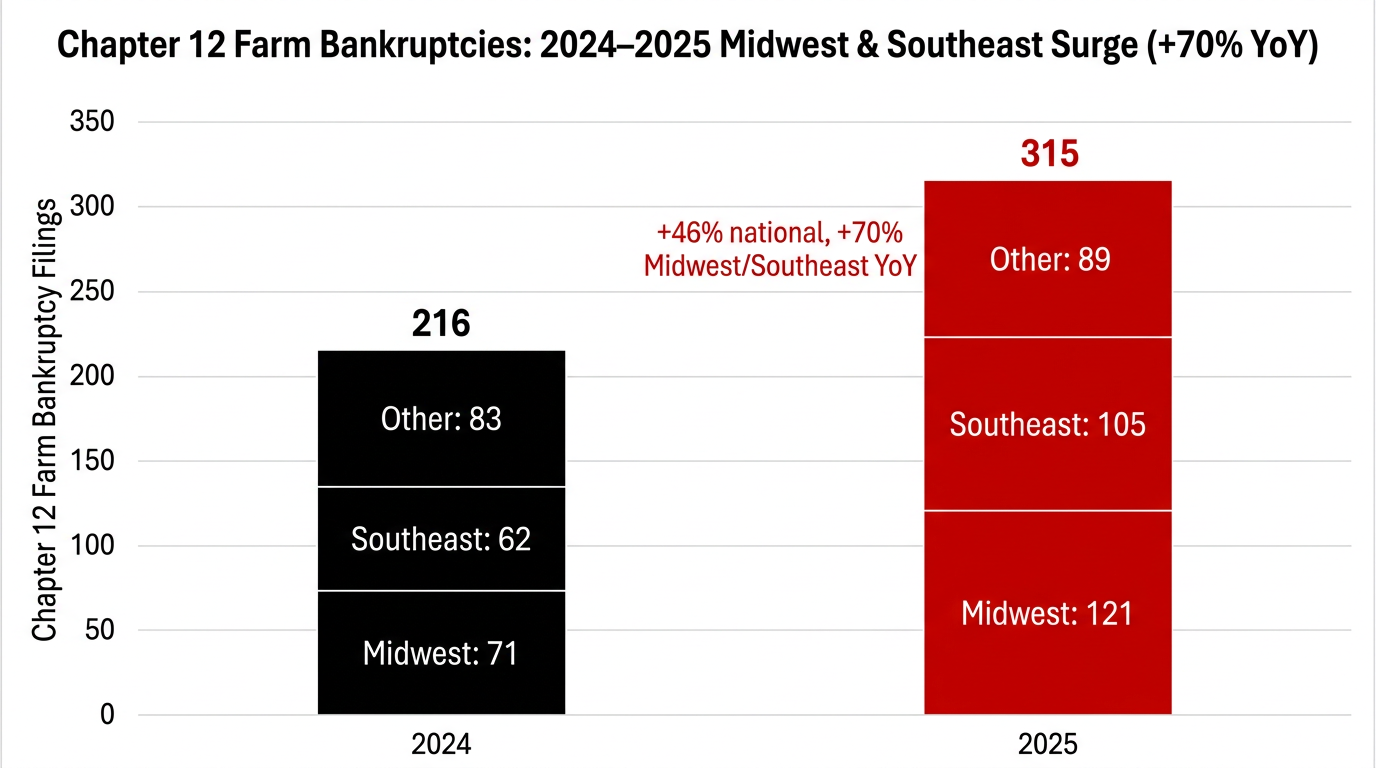
That pressure is showing up in the courts. According to U.S. Courts data summarized by the American Farm Bureau Federation and university analysts, 315 Chapter 12 farm bankruptcies were filed in 2025, up 46 % from 216 in 2024. The Midwest region logged 121 cases, while the Southeast recorded 105, and filings in both regions rose roughly 70 %year‑over‑year. When you hear neighbors say, “We just need one good year,” this is the backdrop — a lot of farms tried to wait that year out and met their lender and their lawyer instead.
| Region | 2024 Filings | 2025 Filings |
|---|---|---|
| Midwest | 71 | 121 |
| Southeast | 62 | 105 |
| Other Regions | 83 | 89 |
| Total | 216 | 315 |
The Hidden Story: Georgia’s Rise and New Mexico’s Floor
Not every growth story comes with sand and center‑pivots.
Georgia quietly led the Southeast in 2025. NASS numbers and extension analysis show the state adding around 3,000 cows and boosting milk output by about 7.8% to roughly 2.09 billion lb, while losing only five dairies. The anchor is Walmart’s 350‑million‑dollar bottling plant in Valdosta, which opened in December 2025 and now supplies more than 650 Walmart and Sam’s Club stores across the Southeast with private‑label milk sourced from regional farms. If you’re milking in Alabama or the Florida panhandle and telling yourself, “This region’s done for dairy,” Georgia is the counter‑example — the plant showed up, and the cows followed.
On the other side, New Mexico looks “stable” in the scorecard — small further farm loss, flat‑to‑slightly‑negative milk — but only because the hard part already happened. Years of contraction stripped out almost every sub‑1,000‑cow operation and left a landscape dominated by 2,000‑plus‑cow barns shipping into a handful of plants. If you’re a 200‑cow operator in Wisconsin or Pennsylvania, New Mexico isn’t an oddity. It’s a possible future — after your region has already done a lot of painful shrinking.
What Does 19.70 Milk Actually Look Like on Your Farm?
Let’s get out of the abstract and into numbers you can map onto your own herd.
Say you’re milking 200 cows in Wisconsin or Pennsylvania. USDA’s 2025 numbers say the average U.S. cow shipped about 24,390 lb — that’s 243.9 cwt per cow per year.
Barn Math: 200 Cows at 19.70 Milk
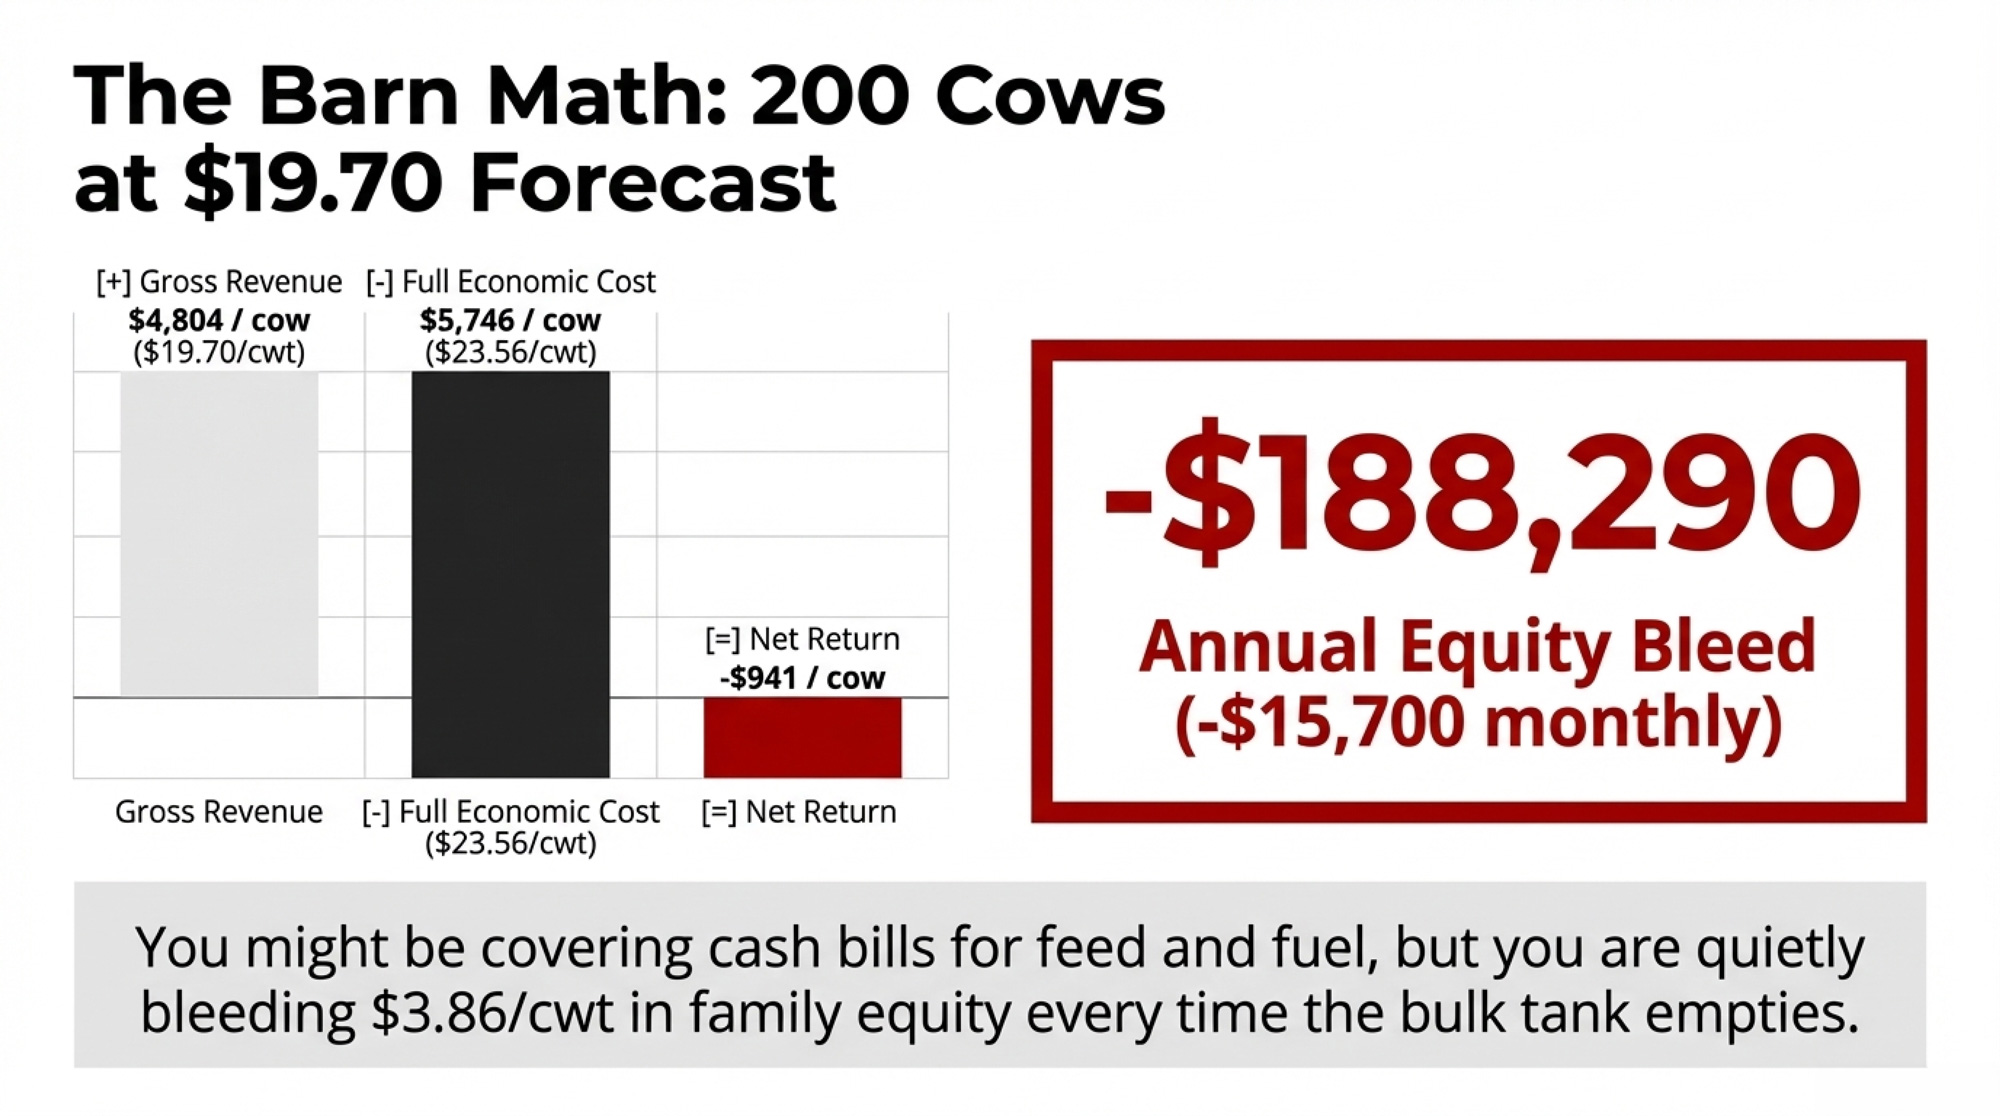
Revenue side (all‑milk forecast 19.70 $/cwt):
- Milk per cow: 243.9 cwt
- Gross revenue per cow: 243.9 × 19.70 = 4,804.83 $/cow
- Total herd revenue (200 cows): 960,966 $
Cost side (full economic cost, ERS/Illinois FBFM example):
- Total economic cost per cwt: 23.56 $/cwt
- Total cost per cow: 23.56 × 243.9 = 5,746.28 $/cow
- Total herd cost (200 cows): 1,149,257 $
Bottom line:
- Net return per cow: 4,804.83 − 5,746.28 = –941.45 $/cow
- Annual net loss: –188,290 $
- Monthly equity bleed: about –15,700 $/month
That’s at 19.70 $/cwt. You’re probably covering cash bills for feed, fuel, and vet — ERS benchmarks often put cash operating costs in the mid‑to‑high teens per cwt. The grain mill gets paid. The TMR still runs. Maybe you chip away at some old payables.
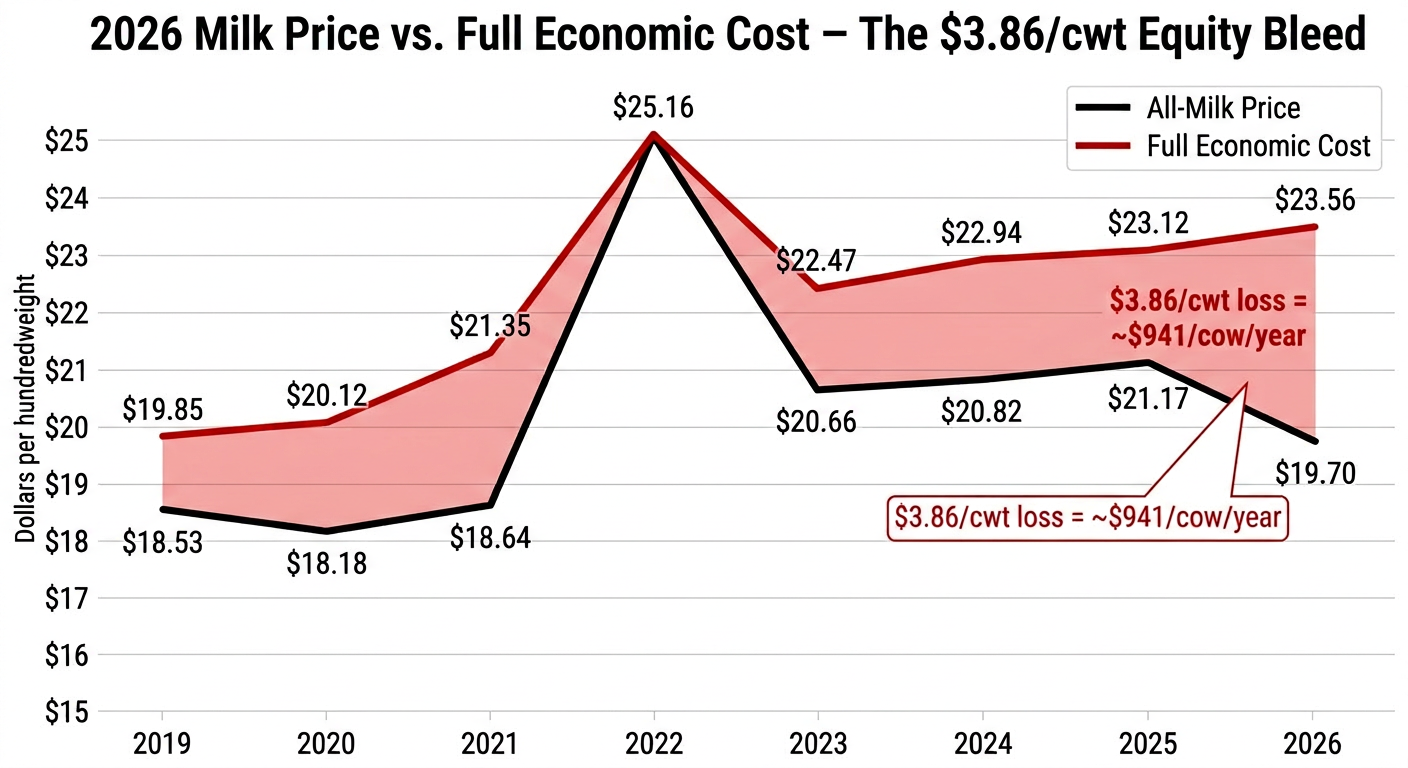
| Year | All-Milk Price ($/cwt) | Full Economic Cost ($/cwt) |
|---|---|---|
| 2019 | 18.53 | 19.85 |
| 2020 | 18.18 | 20.12 |
| 2021 | 18.64 | 21.35 |
| 2022 | 25.16 | 24.89 |
| 2023 | 20.66 | 22.47 |
| 2024 | 20.82 | 22.94 |
| 2025 | 21.17 | 23.12 |
| 2026 | 19.70 | 23.56 |
But you’re not paying yourself a fair wage. You’re not truly replacing equipment. You’re not paying for the capital already sunk into cows and concrete. And you’re quietly moving about 3.86 $/cwt of value — the gap between full economic cost (23.56) and forecast price (19.70) — out of your equity column every time you ship a hundredweight.
| Line Item | Per Cow ($/cow/year) | 200-Cow Herd ($/year) |
| REVENUE | ||
| Milk production (cwt/cow/year) | 243.9 cwt | 48,780 cwt |
| All-milk price ($/cwt) | $19.70 | $19.70 |
| Gross milk revenue | $4,804.83 | $960,966 |
| Cull cow & calf revenue | $285 | $57,000 |
| Total Revenue | $5,089.83 | $1,017,966 |
| COSTS (Full Economic) | ||
| Feed (purchased + homegrown) | $2,850 | $570,000 |
| Labor (paid + unpaid family) | $1,125 | $225,000 |
| Replacement heifers | $620 | $124,000 |
| Fuel, utilities, repairs | $485 | $97,000 |
| Vet, breeding, supplies | $310 | $62,000 |
| Interest & debt service | $245 | $49,000 |
| Depreciation (facilities, equipment) | $385 | $77,000 |
| Opportunity cost (equity, land) | $526 | $105,200 |
| Total Economic Cost | $6,546.28 | $1,309,257 |
| NET RETURN | -$1,456.45 | -$291,290 |
| Monthly equity bleed | -$121/cow/month | -$24,274/month |
If your basis is weak or your SCC premiums are off by 0.25–0.50 $/cwt, the hole gets deeper. That “one good heifer every 23 days” image isn’t an exaggeration — this example is roughly burning that value, whether you see it on a statement or not.
Question-Style Subhead #1 — Economic/Decision Angle
Where Does Your Real Breakeven Sit — and How Long Can You Live Below It?
This is the question everything else hangs on. You can’t decide whether to scale, specialize, or exit until you know what a hundredweight actually costs you.
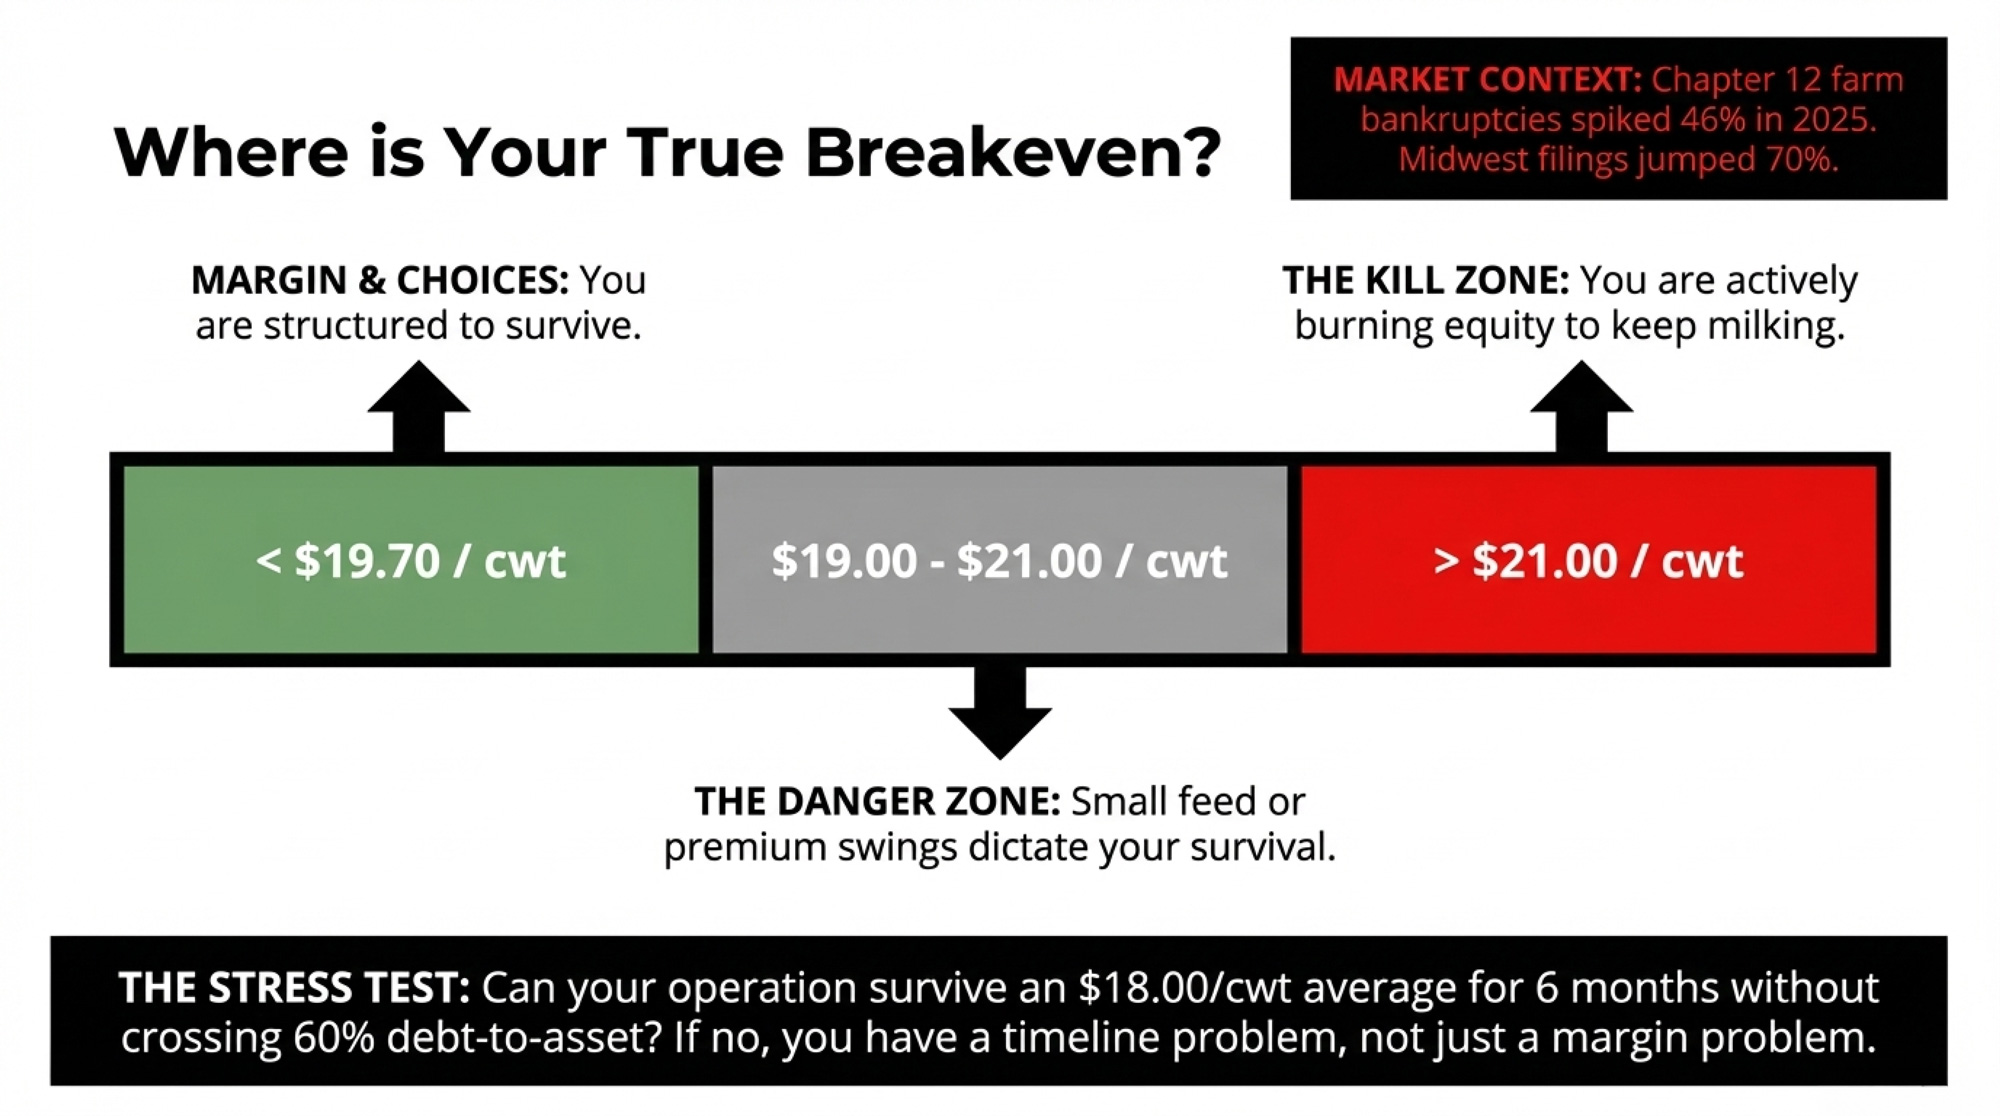
Pull the last 12 months of real numbers: feed (including home‑grown at market value), fuel, repairs, vet, breeding, interest, insurance, taxes, family living, and a realistic wage for your time. Divide by shipped cwt, not “produced” milk. If that all‑in number is:
- Under 19.70 $/cwt — you have margin and choices.
- Around 19–21 $/cwt — you’re in the gray zone where small changes in milk price or feed cost swing you from black to red.
- Above 21 $/cwt — you’re already in kill‑zone territory. The longer you run like this, the more equity quietly disappears.
Then stress‑test at 18.00 $/cwt for six months. That’s not a fantasy — January 2026 Class III printed at 14.59 $/cwt, February only improved to 14.94, before basis, hauling, and deductions. At an 18‑dollar average for half a year, can your operation stay under about 60 % debt‑to‑asset and avoid burning more than 15 % of your equity? If the honest answer is “no,” you’ve got a timeline problem, not just a margin problem.
Question-Style Subhead #2 — Operational/Management Angle
What Can You Realistically Change in the Next 30 Days?
You don’t rebuild a cost structure overnight. You can absolutely change its trajectory in a month.
In the next 30 days, you can:
- Sit down at the kitchen table for two hours with last year’s numbers and build your real cost per cwt on paper or with your advisor. That one session changes how you look at every other decision.
- Re‑draw your breeding plan so beef semen only hits cows you don’t want daughters out of, and your highest‑merit cows only see high‑profit dairy sires.
- Mark cull candidates using both production and genetics — cows sitting in the bottom slice of NM$ who are also lagging in components or fertility.
- Call your co‑op or plant rep and ask bluntly what basis, premiums, or volume commitments are likely to look like over the next 12–24 months in your exact area.
You don’t have to decide in 30 days whether to build a 500‑stall barn. You do have to decide whether you’re going to keep feeding cows that don’t pencil at 19‑dollar milk.
How Do You Use Beef‑on‑Dairy as a Tool, Not a Trap?
Beef‑on‑Dairy has been the hottest “extra margin” lever in a lot of parlors and robot rows. Trade and extension reports still talk about beef‑cross calves bringing up to around 1,400 $ a head in some programs when the genetics and weights are right. Spread across your total shipped cwt, that can effectively add 2–3 $/cwt worth of value if you’re consistent and disciplined.
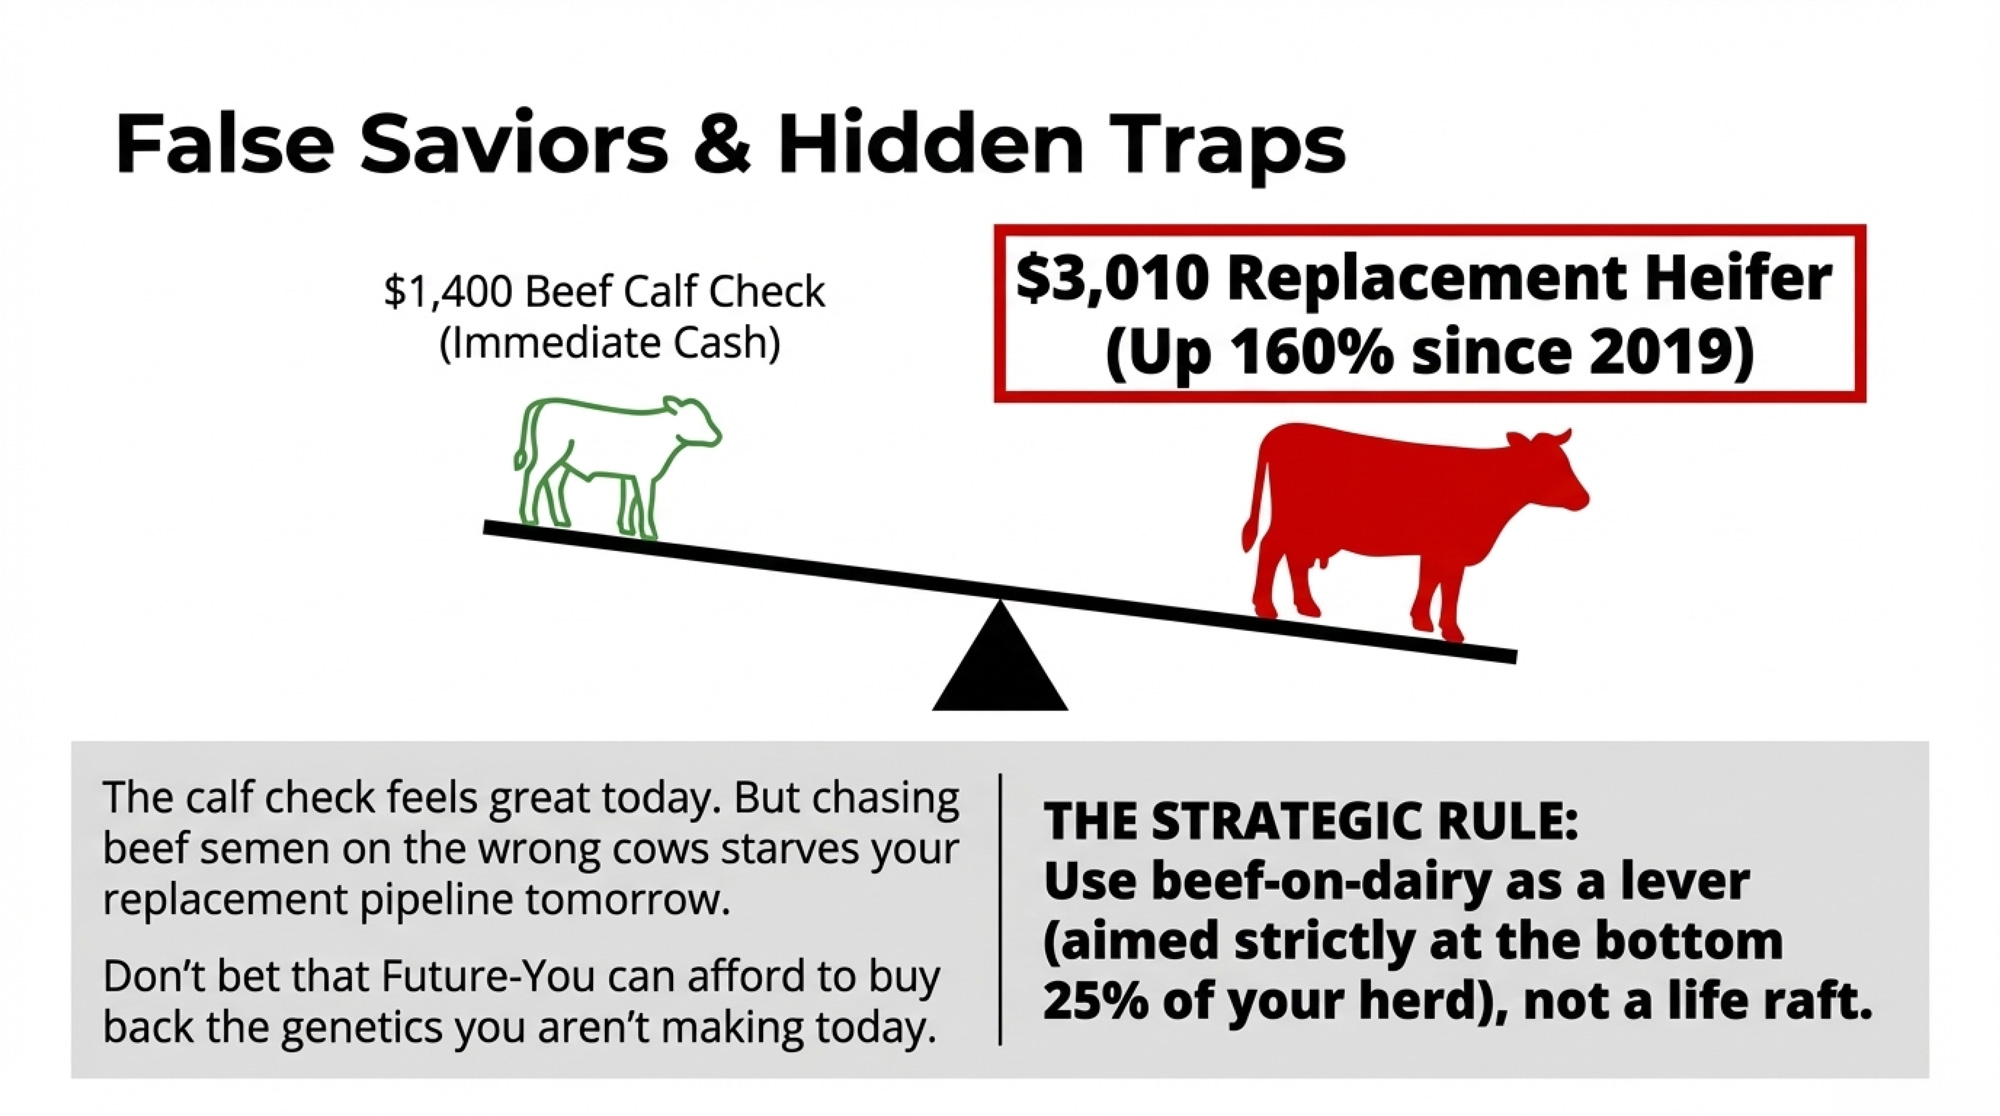
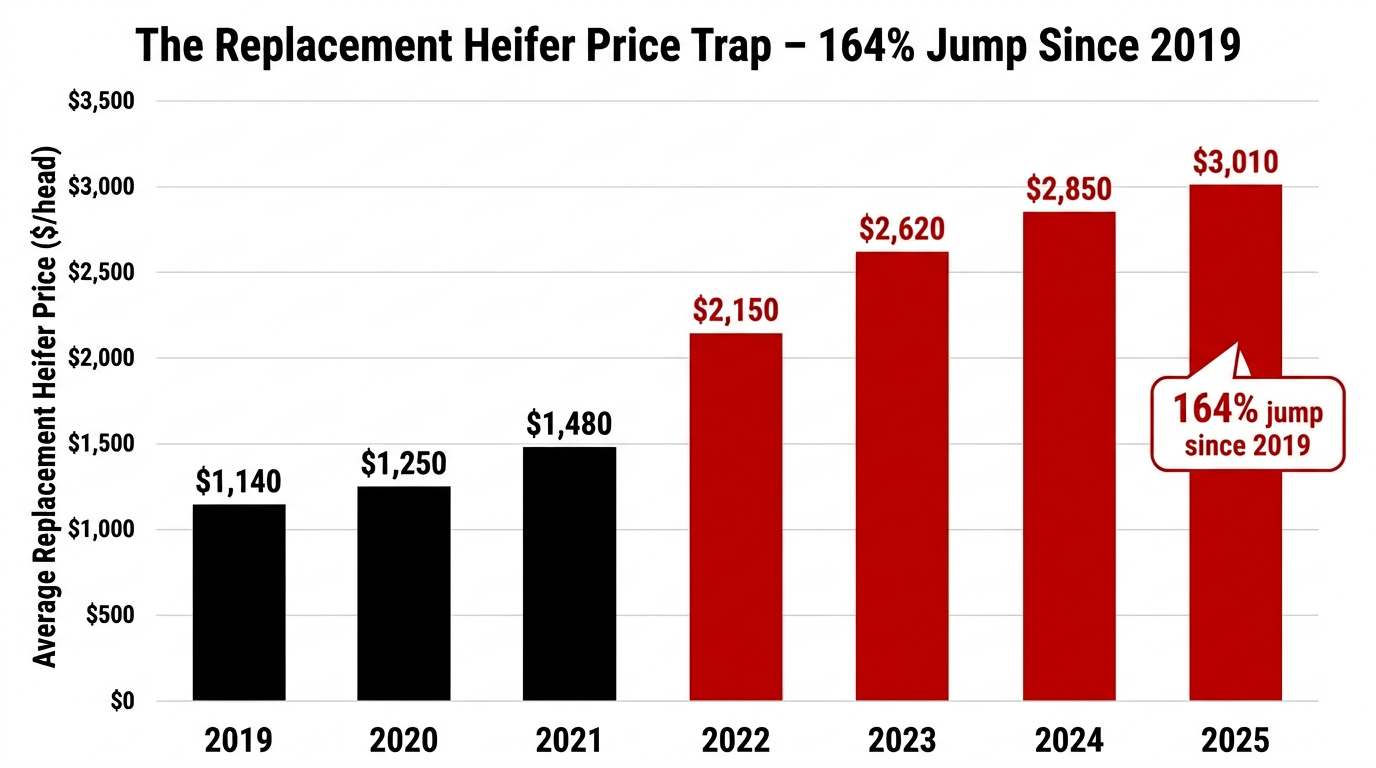
But there’s a hidden tax: replacements. USDA’s price series and industry coverage show dairy replacement heifers averaging around 3,010 $/head by mid‑2025, up from roughly 1,140 $ in 2019 — about a 160 % jump in six years. So every time you chase a high‑priced beef‑cross calf instead of a heifer, you’re betting that Future‑You can afford to buy back the genetics you’re not making today.
The smart way to play Beef‑on‑Dairy in a 19‑dollar world is as a lever, not a life raft:
- Aim beef semen at your low‑merit cows first, not your best.
- Keep beef to roughly a quarter to a third of your breedings so you don’t starve your replacement pipeline.
- Pair it with a genetics plan, not just a cash‑flow band‑aid.
The calf checks feel great. The real test is whether your replacement math still works 18–24 months from now when those heifers should be freshening.
Can Genetics Keep You Off the Auction Block?
Feed, bedding, and power hit every cow the same. Genetics is where you decide which cows deserve a spot on your TMR.
USDA‑ARS is blunt about Net Merit: NM$ is a measure of lifetime profit. It’s built to rank animals by net dollars they’re expected to return, not just yield. When you genomic test and line your cows and heifers up by NM$ or your co‑op’s profit index, you’re looking at who’s likely to pay their way — and who’s just eating.
At 19–20 $/cwt milk, you can’t afford to carry a long tail of passengers. Practical steps:
- Sort your cows and heifers by NM$ or your chosen index and print the list.
- Circle the bottom slice — whatever percentage your gut can handle — and ask, cow by cow, “Does she justify another lactation, another breeding, or another year’s feed?”
- Get especially honest about the heifers stuck in the bottom half of your genomic ranking. In this environment, raising a low‑merit heifer to calving is often worse than selling her and keeping the cash.
You don’t have to chase sky‑high GTPI or build a show string. You do have to stop feeding genetics that have no realistic shot at paying their way under the margins USDA is telling you to expect.
How Do You Use DMC and Risk Tools Without Fooling Yourself?
The 2026 Dairy Margin Coverage enrollment window ran from January 12 to February 26, 2026, so by now, you either locked it in or you didn’t. Under the updated rules, Tier I coverage now extends up to 6 million lb of production history per year — plenty to blanket a 200–500‑cow herd at realistic production levels.
ERS’s LDP‑M‑380 shows how quickly the DMC margin can move when feed and milk don’t play nice together. In late 2025, margins slid close to trigger levels as milk softened while feed costs remained stubbornly high. If you enrolled, those Tier I checks won’t magically turn a structurally unprofitable herd into a winner, but they can plug real holes when margins squeeze hard.
If you didn’t enroll, now’s the time to sit down with your lender and risk‑management advisor and talk about Dairy‑RP, forward contracts, or co‑op tools — not when your Class III mailbox price is already starting with a “1,” and your equity chart is pointed straight down.
What DMC and risk tools cannot do is change the basic fact that if your full cost sits above the price line, you’re selling equity every time the tank empties.
Options and Trade-Offs for Farmers
Here’s where the rubber meets the lane. There are only a few real paths. The math above is what each path is working against.
| Path | When It Makes Sense | Key Actions (Next 30–90 Days) | What You Gain | What You Give Up / Risk |
| 1. Fix Cost Structure | Full cost within 1–2 $/cwt of forecast price; solid facility; debt manageable; willing to cut ruthlessly | – Run true cost/cwt with advisor- List specific cuts (rent, machinery, low-merit cows)- Hunt SCC/component premiums- Stress-test at $18/cwt for 6 months | Survival without major capital; preserve equity; keep optionality for next move | Can cut into burnout if you don’t know when to stop; only works if gap is ≤2 $/cwt |
| 2. Scale or Align | In growth corridor (TX, KS, SD, ID, Southeast); processor adding capacity; willing to leverage up or commit volume long-term | – Contact plant/co-op for volume contracts- Model expansion to 500–1,000+ cows- Secure basis guarantees or premiums- Line up financing with lender | Better basis, stable premiums, lower fixed cost/cwt; processor wants your milk | Lose flexibility; high leverage = faster pain if Class III tanks; stuck in contract even if milk crashes |
| 3. Specialize & Strip Overhead | Region won’t support mega-scale; real niche demand (A2A2, grazing, on-farm bottling, local brand); you like marketing | – Match genetics/cow type to niche- Cut anything not serving the premium- Build direct customer pipeline- Get comfortable with people, not just cows | Swap FMMO risk for niche margin; can feel like 22–23 $/cwt effective price; differentiation protects you | Customer risk replaces market risk; lose a key buyer = scramble; requires marketing skills most don’t have |
| 4. Plan Strategic Exit | Full cost clearly >21 $/cwt; worn out; no clear successor; equity preservation matters more than legacy | – Price cows & heifers NOW (3,010 $ heifers, 1,800–2,000 $ cows vs. 1,400 $ distressed)- Model liquidation value vs. forced sale- Talk to family, lender, lawyer- Set timeline before bank sets it for you | Preserve 30–40% more equity than distressed sale; protect family balance sheet; exit with dignity | Emotional cost is brutal; end of generational identity; no second chance if you wait too long and values crash |
Path 1: Fix the Cost Structure (Start in the Next 30 Days)
When it makes sense
You’ve got a solid facility, decent cow flow, and debt that isn’t already crushing you. You’re willing to cut pet expenses and sacred cows — literal and figurative — if the numbers say they should go.
What it takes
You do a full, honest cost‑of‑production run — no “back of the napkin,” no ignoring family living. You list specific cuts or changes: maybe it’s dropping one rented parcel that never pays, changing TMR ingredients, or burning down non‑productive machinery. You hunt for easy nickels: better components, SCC premiums, co‑op quality bonuses.
The limits
You can cut your way into survival. You can also cut your way into burnout if you don’t know where to stop. This path works best when your full cost is within 1–2 $/cwt of the forecast price and the barn math says you can close that gap.
Path 2: Scale or Align — If Your Region Wants More Milk
When it makes sense
You’re in a growth corridor — Texas Panhandle, I‑29, Idaho, parts of the Southeast — where processors are actively adding capacity and courting new milk.
The play
You either add cows significantly or tie your existing string into a long‑term supply relationship. That might be a direct contract with a cheese plant, a guaranteed‑volume arrangement through your co‑op, or a barn expansion that moves your average cost per cwt down as you fill stalls.
The catch
You gain a better basis and potentially more stable premiums. You give up flexibility and take on more fixed costs. If Class III spends another year flirting with the mid‑teens, highly leveraged big herds feel that pain faster and harder than smaller, lightly leveraged ones.
Path 3: Specialize and Strip Overhead
When it makes sense
You’re in a region where you’ll never out‑scale the 4,000‑cow outfits, but there’s real demand for something different — higher components, grazing‑based milk, A2A2, on‑farm processing, or a branded local product.
What it requires
You match your genetics, cow type, and farm layout to that niche. You cut anything in your cost stack that doesn’t feed the niche premium. You get comfortable with marketing and people, not just cows.
The trade‑off
You swap FMMO risk for customer risk. Lose a key buyer, and you’re scrambling. But if the niche is real — and if you execute — you can turn a 19‑dollar commodity environment into something that feels more like 22–23 $/cwt on your milk check.
Path 4: Plan an Exit While Cows and Heifers Are Still Worth Real Money
When it makes sense
Your full‑cost number is clearly above 20 $/cwt, you’re worn out, and the successor plan is blurry or non‑existent.
What it looks like
You look straight at the current replacement and cull values. In 2025, replacement heifers averaged around 3,010 $, and many good cows would bring 1,800–2,000 $; in a forced or distressed liquidation, those numbers can slide toward 1,400 $ for cows. That’s a 450 $/head swing. Across 300 cows, that’s roughly 135,000 $ that either lands in your bank account or disappears if you wait too long.
The hard part
Emotionally, this is the toughest path. Practically, it can be the one that protects the most family equity and gives the next generation the best footing — whether they farm or not.
Key Takeaways
- If your full‑cost breakeven is above 21 $/cwt, 19.70 milk isn’t a rough patch — it’s a slow equity bleed. Either fix the cost, add a margin, or set a clear exit timeline before the bank or your health sets it for you.
- If you’re in a processing growth zone and your true cost per cwt is competitive, scaling or aligning with a plant can turn 19‑dollar milk into a workable long‑term play — but only if you respect the leverage and build a genetics pipeline that keeps replacements affordable.
- If your proof sheets show a long tail of low‑NM$ or low‑index cows and heifers, feeding them is a choice — culling the bottom slice and only raising replacements from the top half of your ranking is one of the cleanest ways to lift dollars per cwt without adding a single stall.
- If you can’t run your own barn math in the next 30 days, you’re flying blind — the biggest risk to your operation isn’t the market, it’s not knowing exactly where your kill zone starts in dollars per cwt.
The Bottom Line
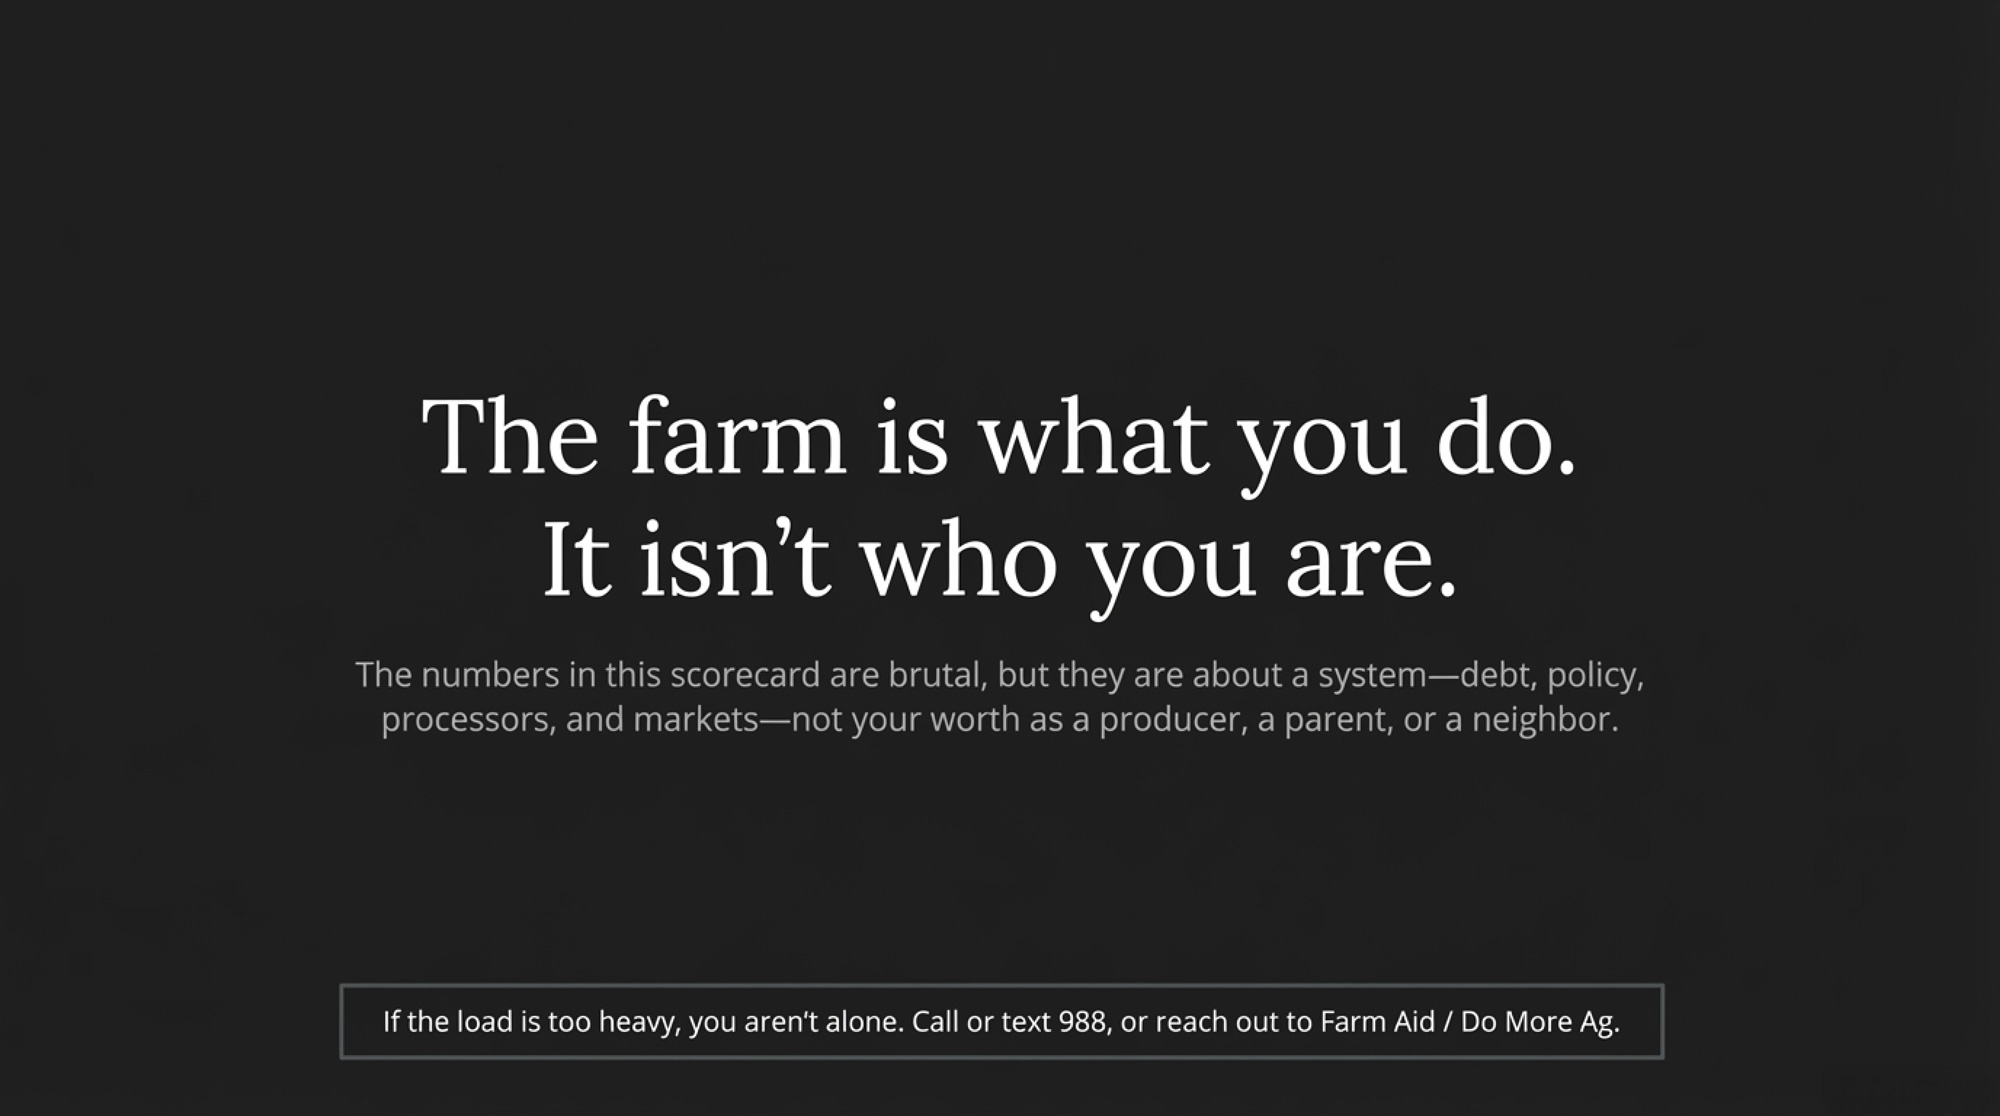
The farm is what you do; it isn’t who you are. The numbers in this scorecard are brutal, but they’re about a system — debt, policy, processors, and markets — not your worth as a producer, a parent, or a neighbor. If walking through this math makes your chest tight or your stomach knot up, that’s not weakness. That’s your body saying the load is heavy. Talk with someone you trust — spouse, vet, lender, neighbor. And if it feels like too much, you can call or text 988 in the U.S., or reach out to farm‑focused supports like Farm Aid or Do More Ag, and talk to someone who understands what you’re carrying.
Then, with your own cost per cwt and best‑guess 12‑month milk price written down in front of you, decide: are you going to fix, scale, specialize, or exit? And before six more milk checks hit the mailbox, what single move — cull list, genetics plan, risk‑management conversation, or succession step — are you willing to make so your herd doesn’t quietly slide deeper into the kill zone?
Complete references and supporting documentation are available upon request by contacting the editorial team at editor@thebullvine.com.
Learn More
- Maximizing Your Milk Check: The 2025 Guide to Component Pricing – Stop leaving money in the parlor. This guide exposes the specific component thresholds required to outrun rising input costs and delivers a tactical roadmap for adjusting rations to capture every possible premium on your next check.
- The Year of the Great Divide: Navigating Dairy Consolidation – Secure your operation’s future against aggressive structural shifts. This analysis breaks down the economic forces hollowing out the middle market, arming you with the long-term positioning strategies needed to survive the next five years.
- Precision Breeding: Using NM$ to Outrun the Commodity Trap – Outrun the commodity trap with data-driven selection. This deep dive reveals how leveraging Net Merit (NM$) and genomic testing creates a high-efficiency herd, giving you a decisive competitive advantage in a low-margin environment.
 The Sunday Read Dairy Professionals Don’t Skip.
 The Sunday Read Dairy Professionals Don’t Skip.
Every week, thousands of producers, breeders, and industry insiders open Bullvine Weekly for genetics insights, market shifts, and profit strategies they won’t find anywhere else. One email. Five minutes. Smarter decisions all week.