


A 550-cow Wisconsin dairy had 11 weeks of cash left at $18–$19 costs and didn’t know it. When you run a real COP, how much runway do you actually have?
Executive Summary: USDA’s 2026 all‑milk forecast of $18.95/cwt can knock a 400‑cow herd’s DSCR from 1.78x to 0.53x on paper — same cows, same debt, very different conversation with your lender. This piece walks you through that math, then shows how a 550‑cow Wisconsin dairy discovered an $18.75/cwt true cost of production and just 11 weeks of cash runway after a real COP review. It explains how bankers are already repositioning — from 30% tightening standards in the Chicago Fed’s district to Farm Credit more than doubling its loan‑loss provisions — and why that hits some regions harder than others. You see why Wisconsin and New York can add cows while Pennsylvania loses farms and processors, and what that geography shift means for your renewal odds. Most importantly, you get DSCR and breakeven thresholds you can plug into your own numbers, a three‑tier action plan by herd size, and a 30‑day checklist to run before you sit down with your lender. If you want one article to double-check whether you’re still comfortably bankable at $18.95 milk, this is it.
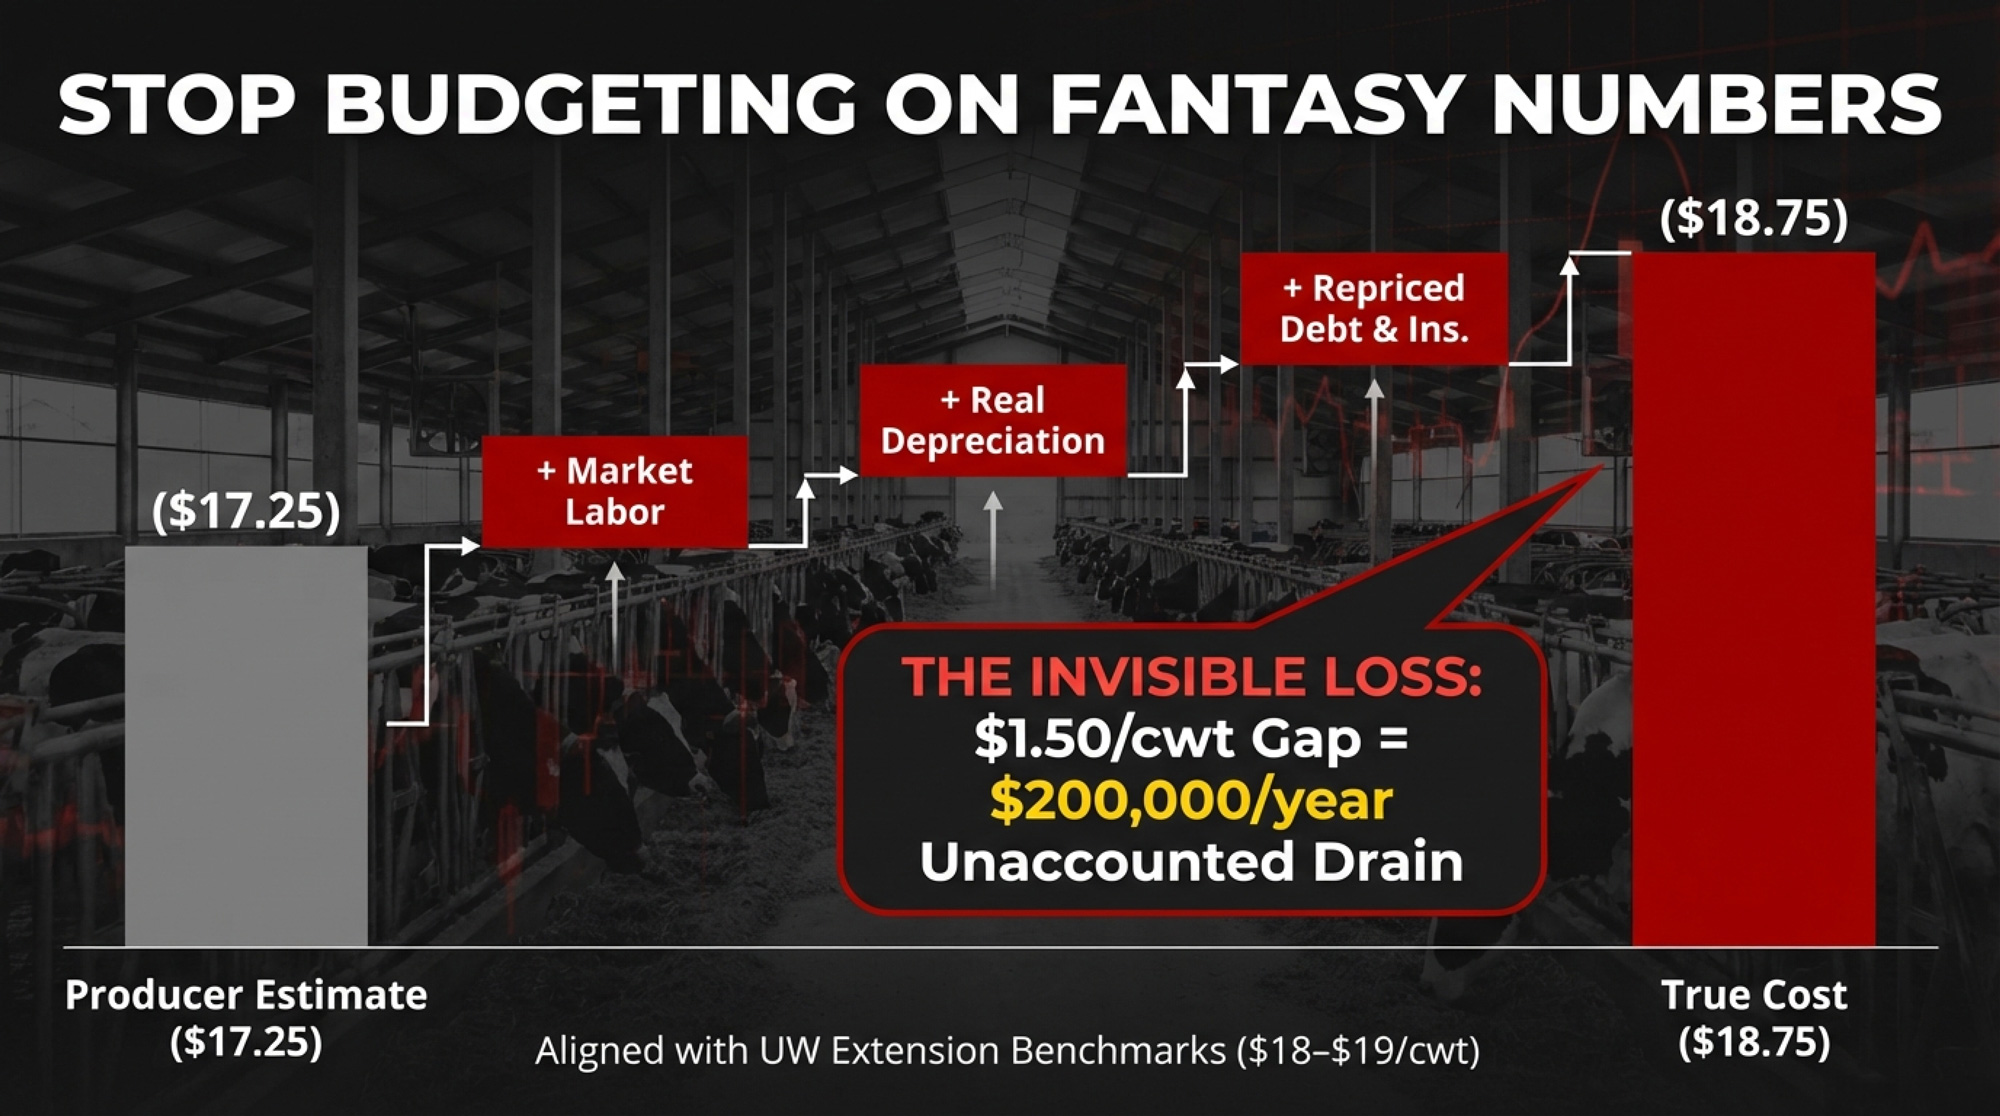
Earlier this year, a 550-cow Wisconsin dairy sat down with a farm financial counselor and pulled a full cost-of-production analysis. The details come from the farm financial counselor who conducted the engagement, as first reported in The Bullvine’s Calf-Check Paradox analysis (February 20, 2026), with the operation’s identity withheld at the counselor’s request. The producer had been budgeting around $17.25/cwt as his all-in cost. When the spreadsheet included market-rate family labor, real depreciation, repriced debt at current interest rates, and health insurance, the number came back to $18.75/cwt — right in line with UW Extension’s $18–$19/cwt benchmarks for mid-size Midwest herds.
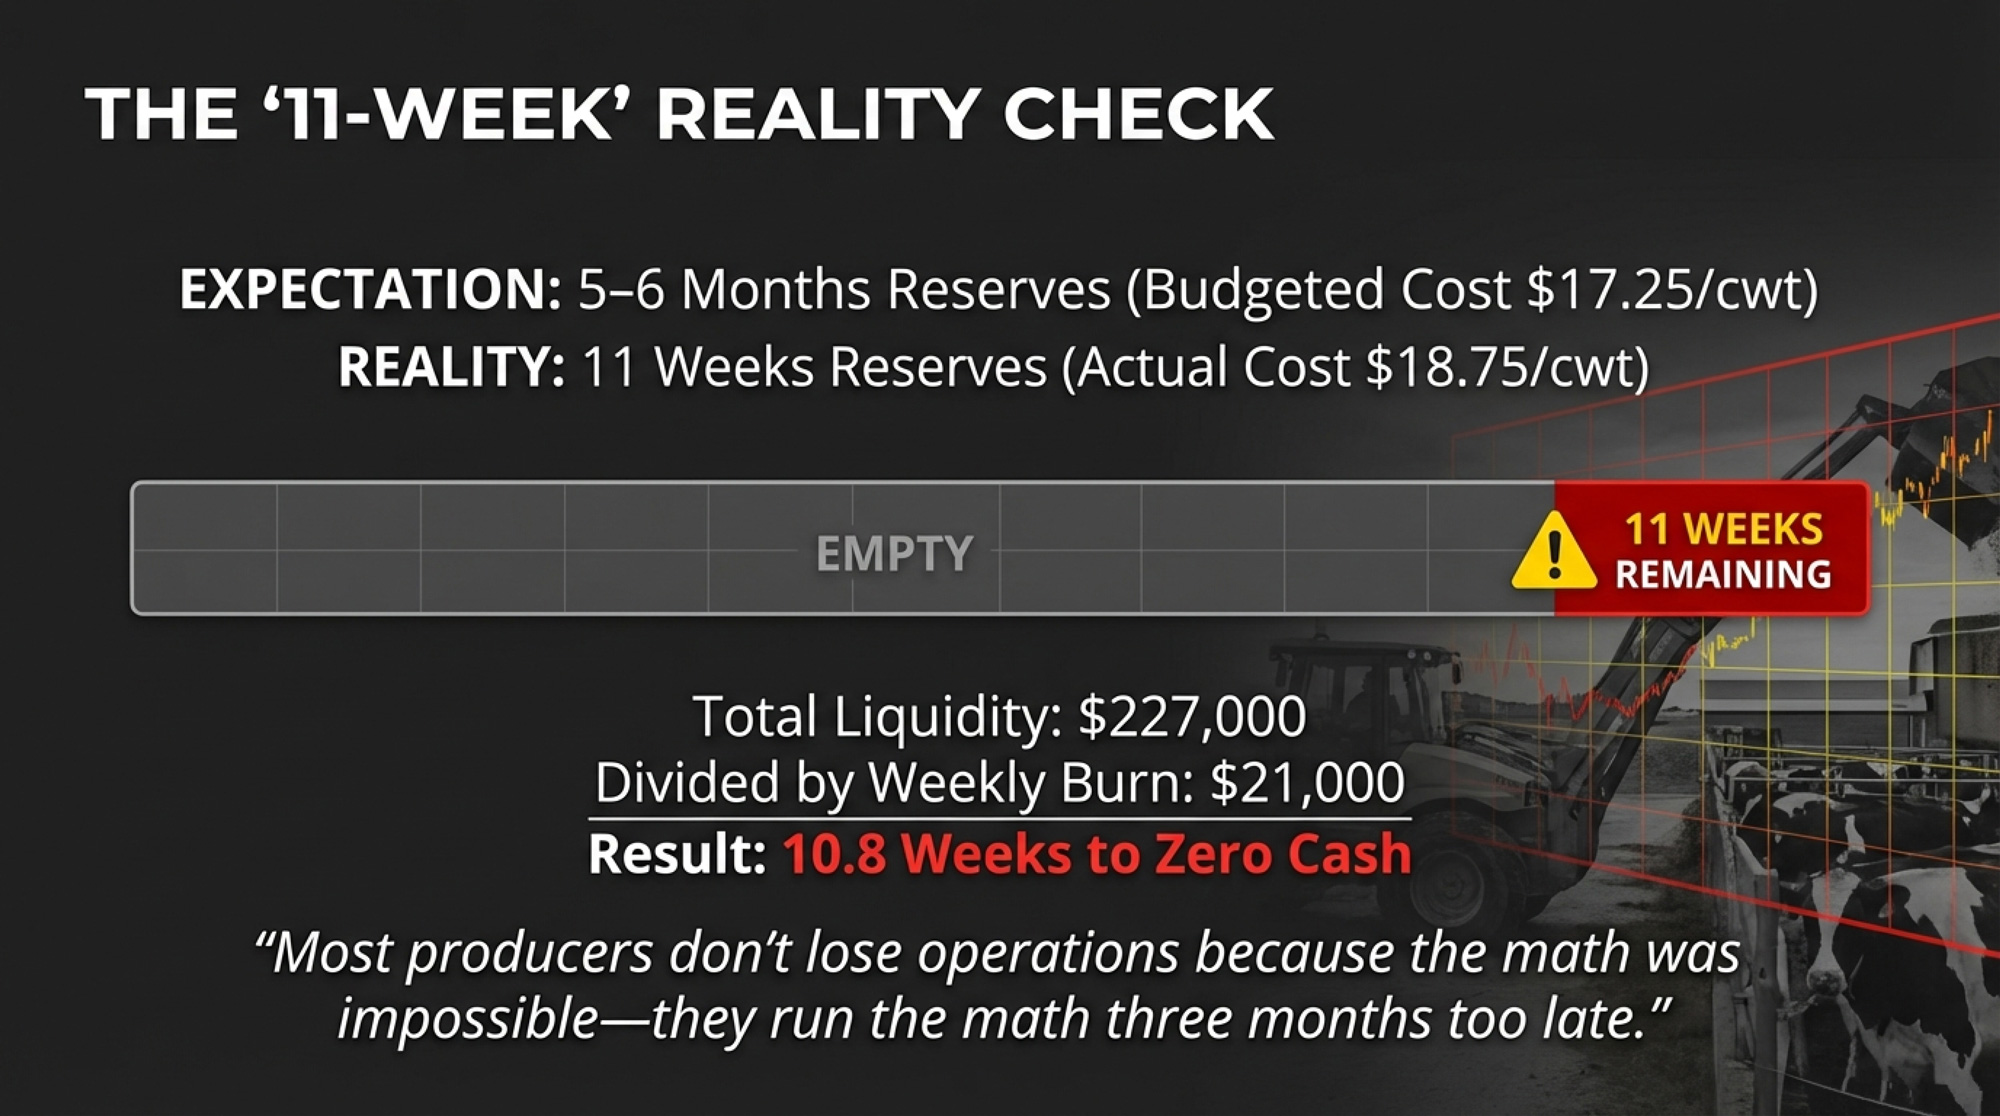
That $1.50 gap represented roughly $200,000 in annual losses that the operation hadn’t been accounting for. Total liquidity: $227,000. Net weekly cash drain: about $21,000. Eleven weeks of runway — not the five or six months he’d been carrying in his head.
How Many Weeks of Runway Do You Actually Have?
Multiply that math by every dairy operation in the country and drop the milk price from $21.17 to $18.95. That’s USDA’s February 2026 WASDE forecast for all-milk — a $2.22/cwt decline from the revised 2025 average. For a 400-cow herd shipping 96,000 cwt, that’s $213,120 in lost gross milk revenue. It turns a comfortable debt service coverage ratio into something your lender won’t ignore.
The Curve Accelerated — and the Geography Split Wide Open
The Wisconsin producer wasn’t the only one watching the numbers tighten. The structural consolidation trend that his counselor had flagged during their session was playing out nationally. The U.S. lost roughly half its dairy farms between the 2012 and 2022 USDA Censuses, while total production kept climbing. But the speed in 2025 — and where it concentrated — caught attention.
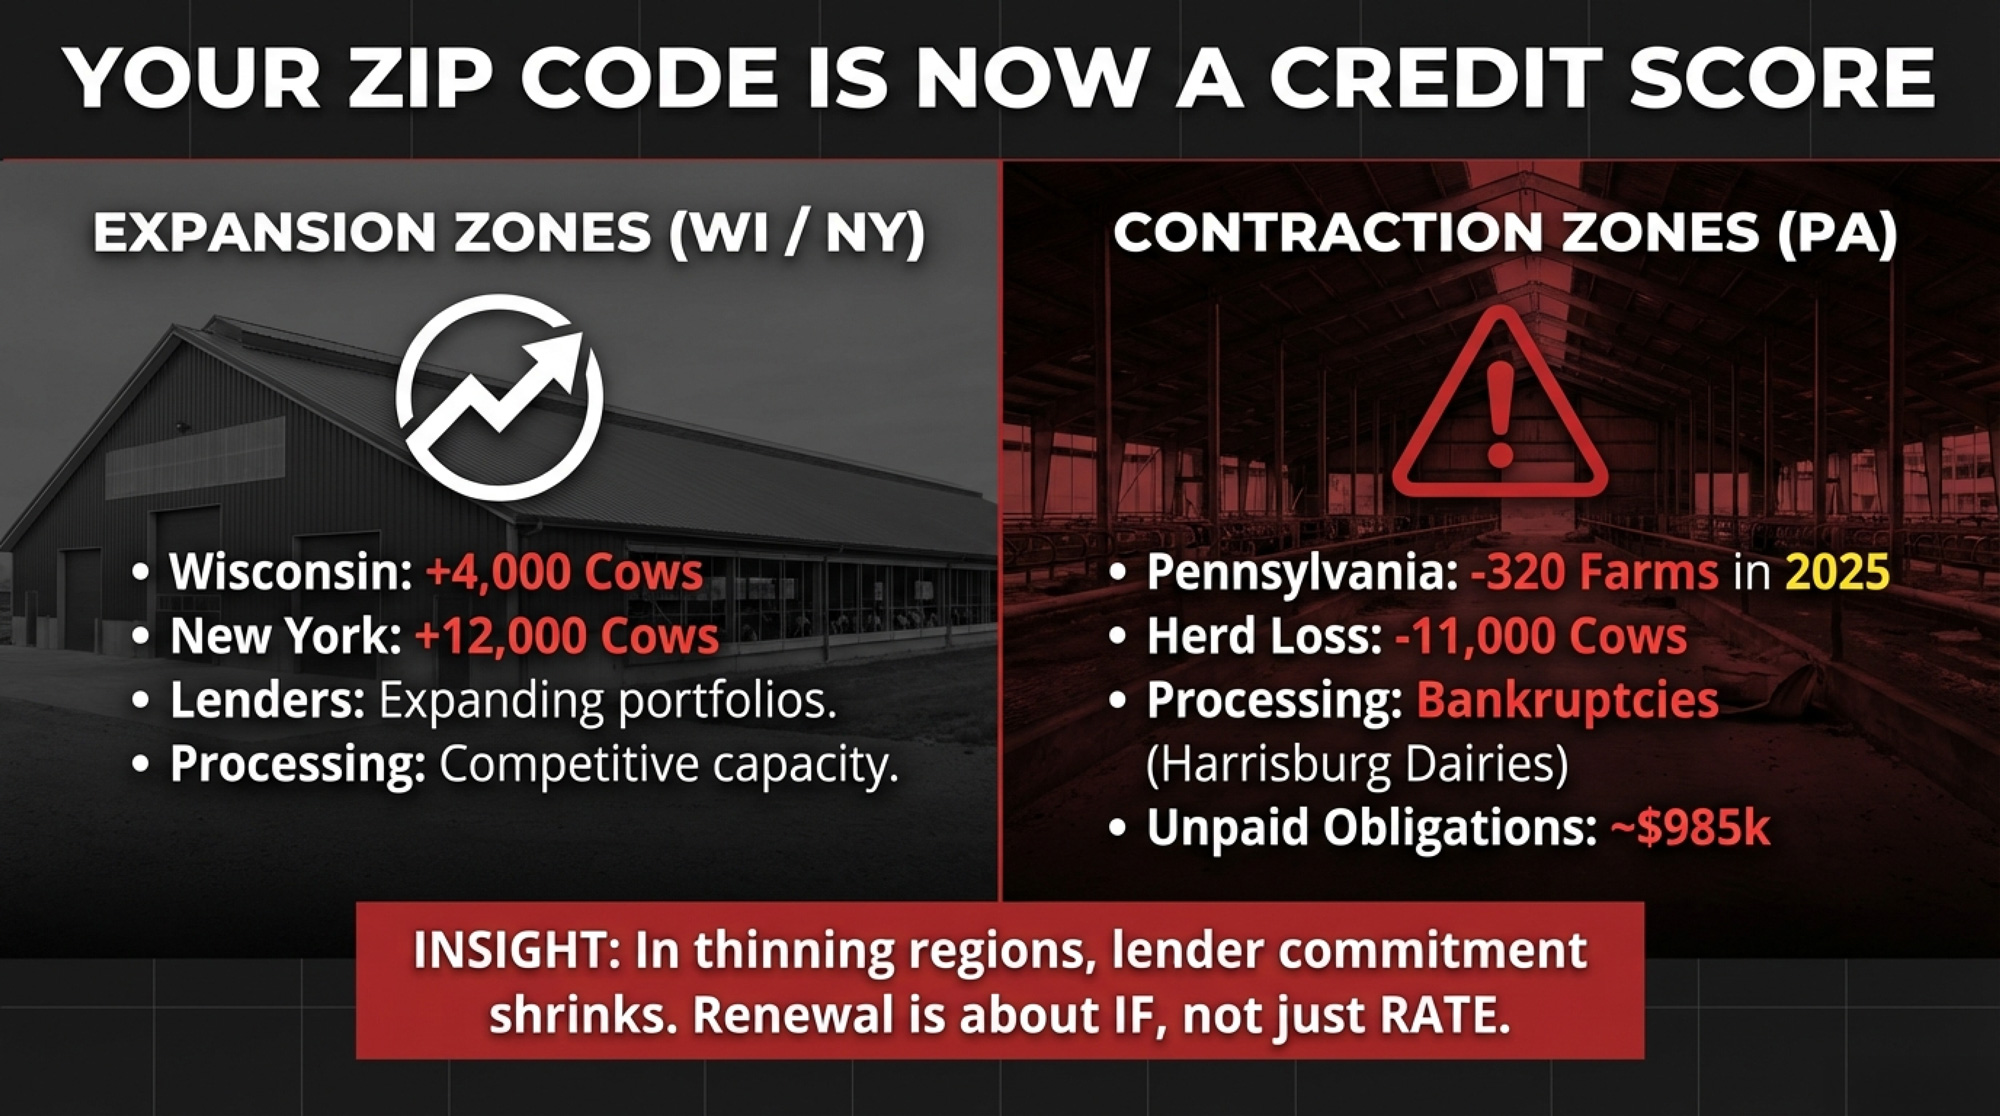
USDA reported 23,609 licensed dairies at year-end 2025, down 1,036. The top 10 states now produce about 74% of U.S. milk, per the NASS 2025 annual summary. Wisconsin added 4,000 cows and pushed output up 0.8% to 32.59 billion pounds — absorbing farm exits into fewer, larger operations. New York added 12,000 cows and boosted production 2.8% to 16.57 billion pounds, growth aligned with major new processing capacity in the state.
Pennsylvania went the other direction. Based on the originally published 2024 baseline, the state lost 490 farms—an 11.7% exit rate that accounts for nearly half of the 1,036 total U.S. dairy losses. This figure stems from a data discrepancy: the USDA revised Pennsylvania’s 2024 baseline downward by 166 farms without flagging the state-level change. Using the revised figure, PA’s 2025 loss was 320 farms. Both numbers tell the same story directionally. January 2026 deepened the gap: Pennsylvania milked 454,000 cows, down 11,000 from a year earlier, and produced 817 million pounds — 3.0% below January 2025, according to the NASS February 20, 2026 Milk Production report.
That divergence isn’t cyclical. It’s structural—and it’s reshaping how lenders view dairy portfolios.
30% of Bankers Tightened: The Lending Turn
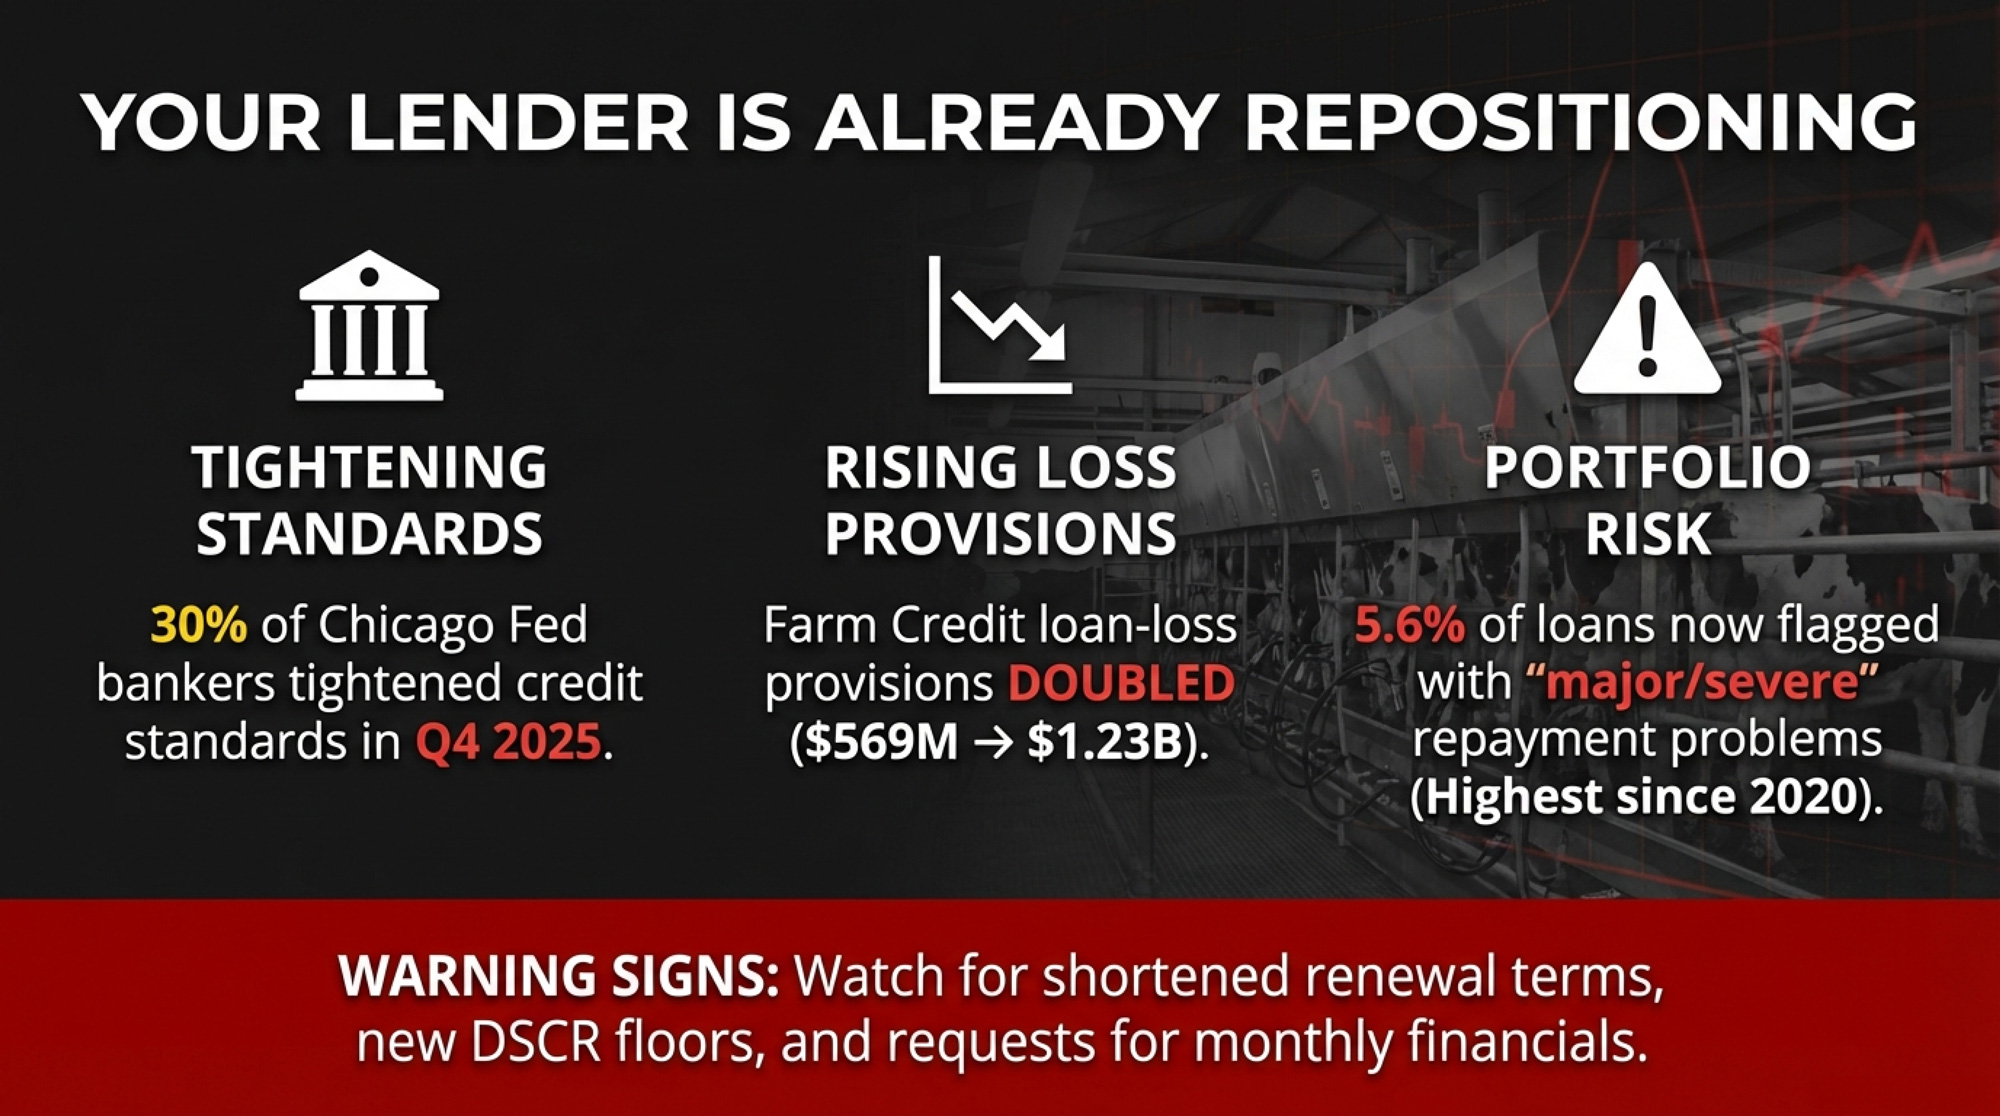
In Q4 2025, 30% of bankers in the Chicago Fed’s Seventh District reported tightening lending standards for farm loans. Renewals and extensions kept climbing — the trend now spans multiple consecutive quarters. Fund availability kept falling, extending what the AgLetter has tracked as a multi-year decline.
The share of the District’s farm loan portfolio with major or severe repayment problems hit 5.6% — the highest since mid-2020, per the AgLetter’s February 2026 issue. And 3.8% of borrowers with operating credit were deemed unlikely to qualify for new operating loans in 2026.
The Farm Credit System is feeling it too. Nonaccrual loans rose from 0.74% at year-end 2024 to 0.91% at Q3 2025. Provisions for credit losses more than doubled, from $569 million to $1.23 billion, per the Farm Credit Investor Presentation dated February 20, 2026. Farm Credit’s own commodities outlook projected 2026 milk at $18.30/cwt — below even the USDA’s $18.95.
As one Illinois banker told the Chicago Fed’s Q4 survey: “2026 is going to be a challenge for many producers with higher input prices.” That’s the lending environment the Wisconsin dairy’s counselor was reading when he ran the real numbers.
What Does $18.95 Milk Do to Your DSCR?
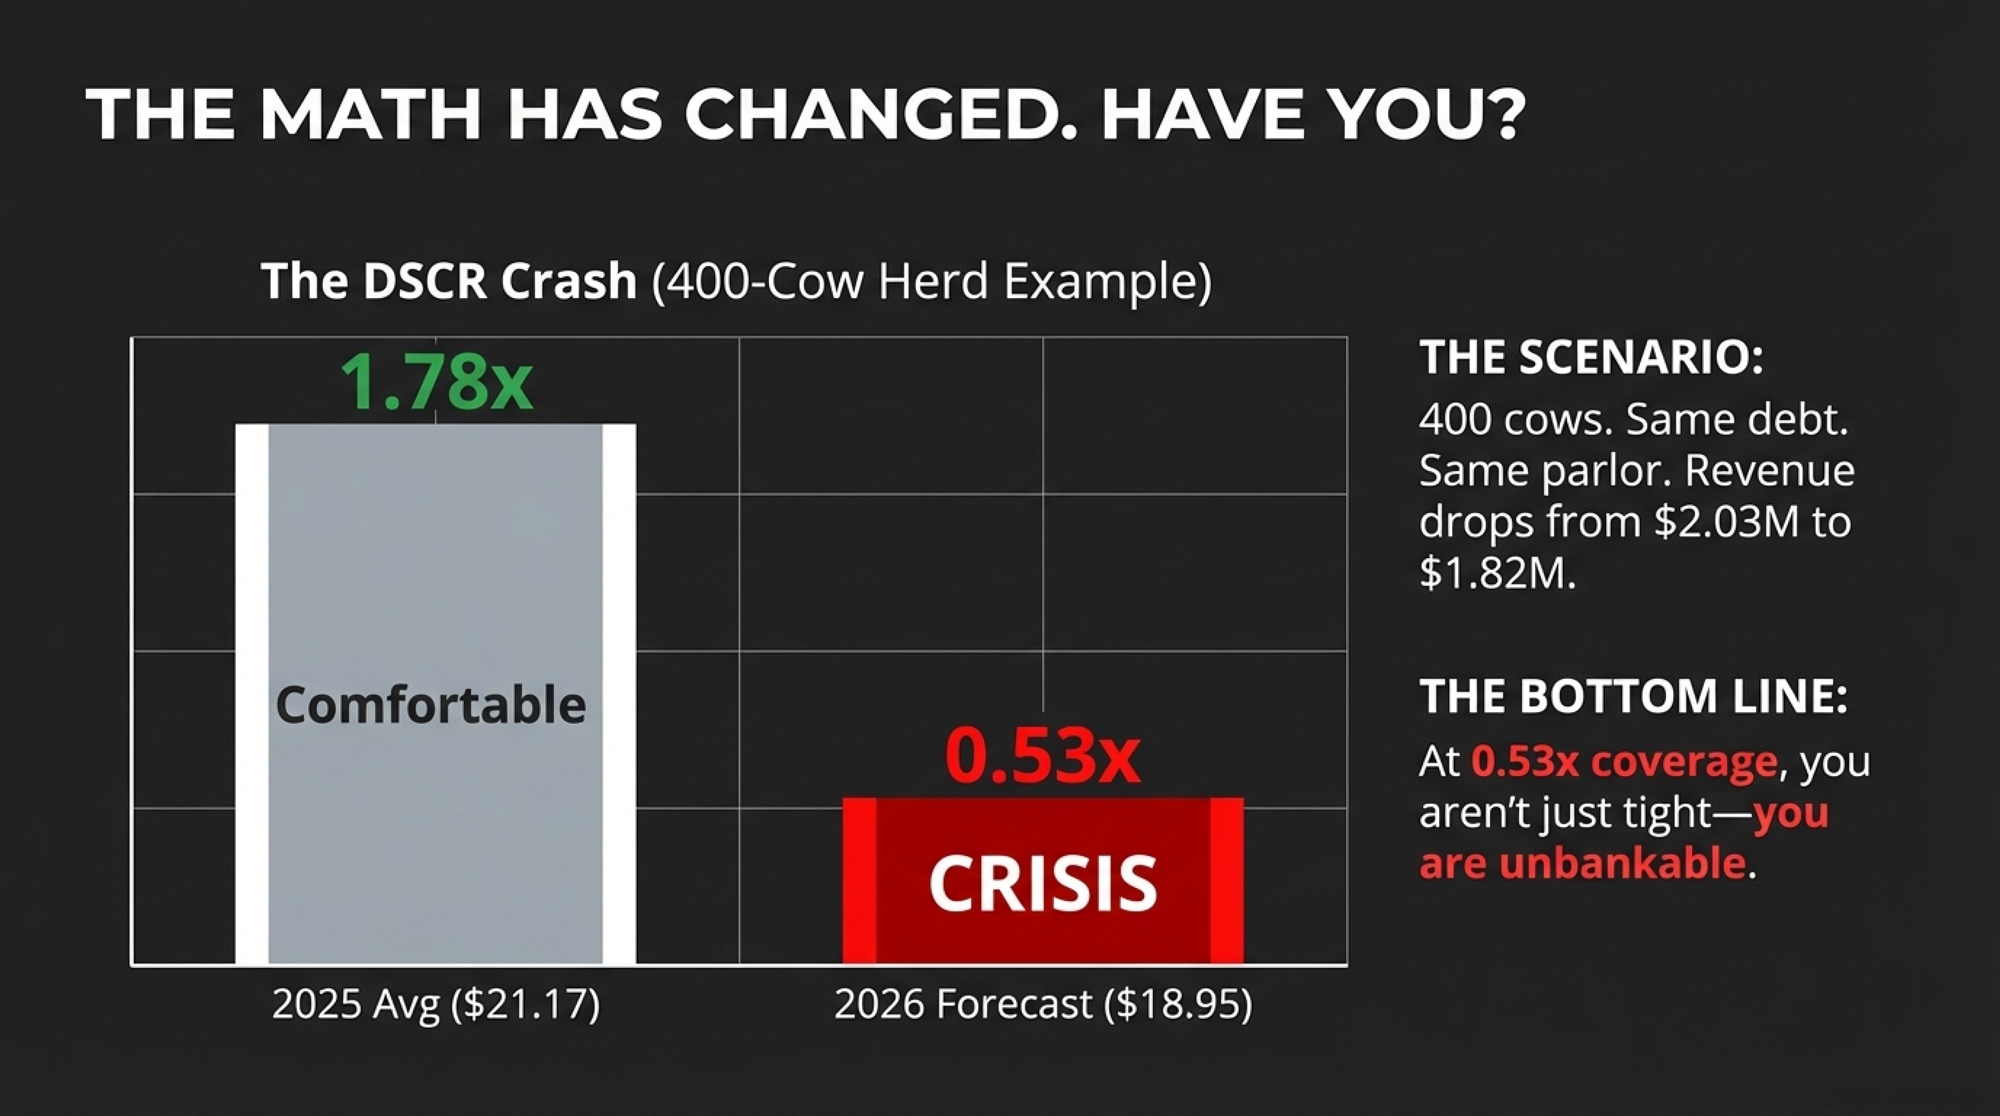
Take a 400-cow dairy producing 24,000 lbs/cow/year — 96,000 cwt annually — carrying $1.2 million in term debt on a 10-year note. The Chicago Fed reported Seventh District operating loans at 7.11% and real estate loans at 6.63% in Q4 2025, so a 7.5% blended rate brackets most dairy debt. At standard monthly amortization, annual debt service on $1.2M at that rate runs $170,931.
Debt Service Coverage Ratio — net cash income divided by annual debt service. Below 1.25x, lenders pay closer attention. Below 1.0x, the phone rings.
At $21.17/cwt (revised 2025 average, per USDA WASDE):
Revenue: $2,032,320. Cash costs at $18/cwt: $1,728,000. Net cash: $304,320.
DSCR: 1.78x — comfortable.
(That $18/cwt cost is illustrative — consistent with UW Extension benchmarks and close to the Wisconsin dairy’s actual $18.75. Plug in your real number.)
At $18.95/cwt (USDA’s 2026 forecast):
Revenue: $1,819,200. Same costs: $1,728,000. Net cash: $91,200.
DSCR: 0.53x.
From 1.78x to 0.53x. One price move. Same cows, same debt, same parlor.
And $18.95 might be optimistic. January 2026’s Class III posted at $14.59/cwt. December was $15.86. The back half needs to do heavy lifting to deliver USDA’s annual average — and your budget can’t wait for the second half to show up.
The math works in reverse, too. If milk recovers above $21 in the second half — driven by export demand, tighter supply, or both — these DSCRs snap back fast. But your lender isn’t budgeting on a recovery that hasn’t started.
Breakeven milk price for a 1.25x DSCR at these cost and debt levels: $20.23/cwt. USDA’s forecast is $1.28 below that floor.
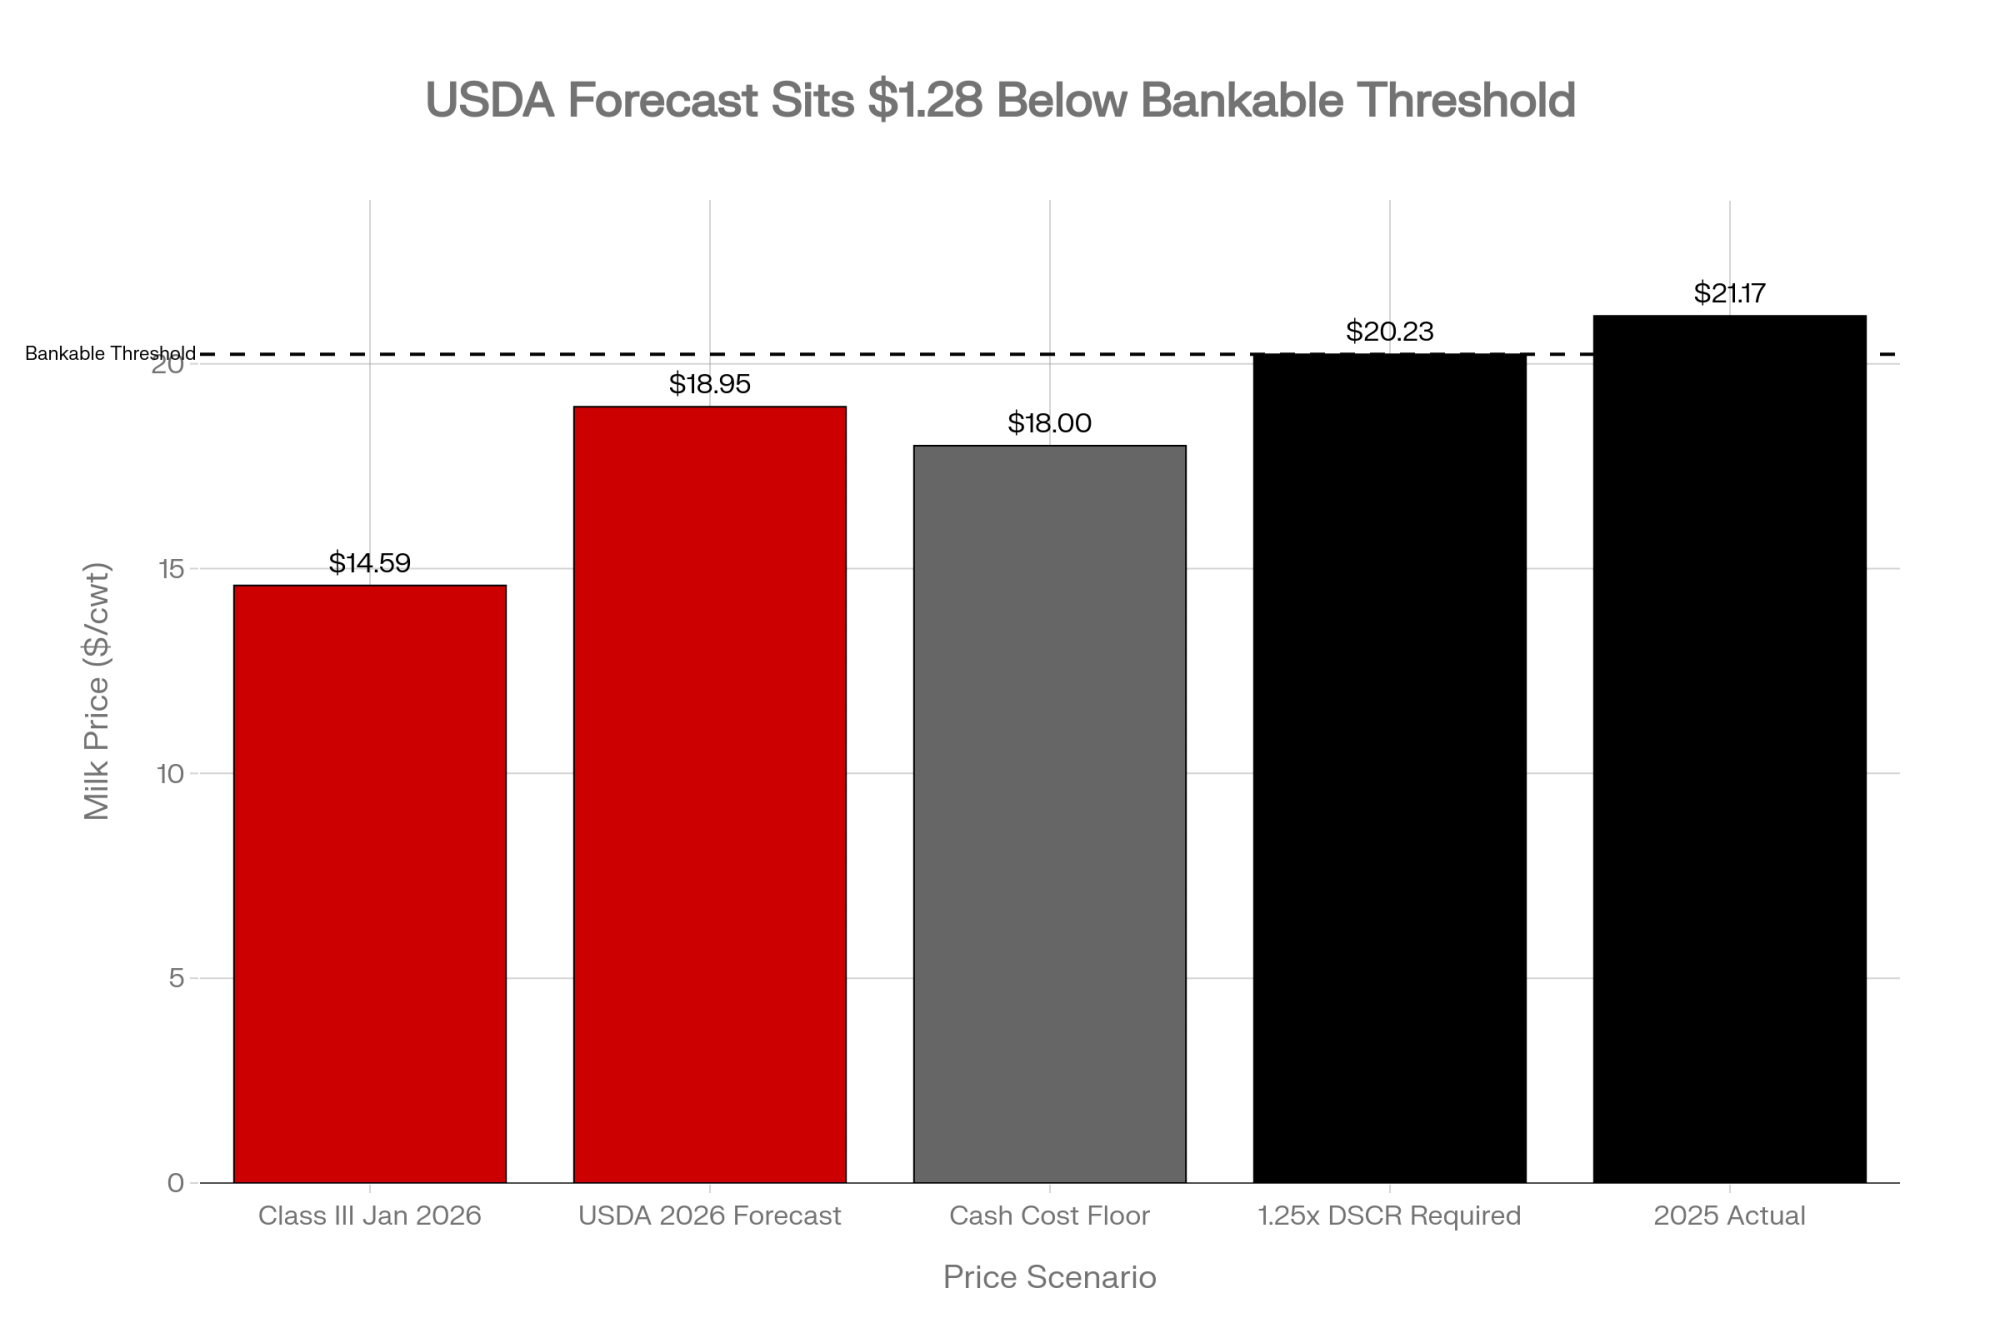
For context, USDA ERS puts the full economic cost of production at $19.14/cwt for herds with 2,000+ cows and $42.70/cwt for herds under 50 (2021 ARMS, updated August 2024). At $18.95, even the most efficient operations are near breakeven on a full-cost basis.
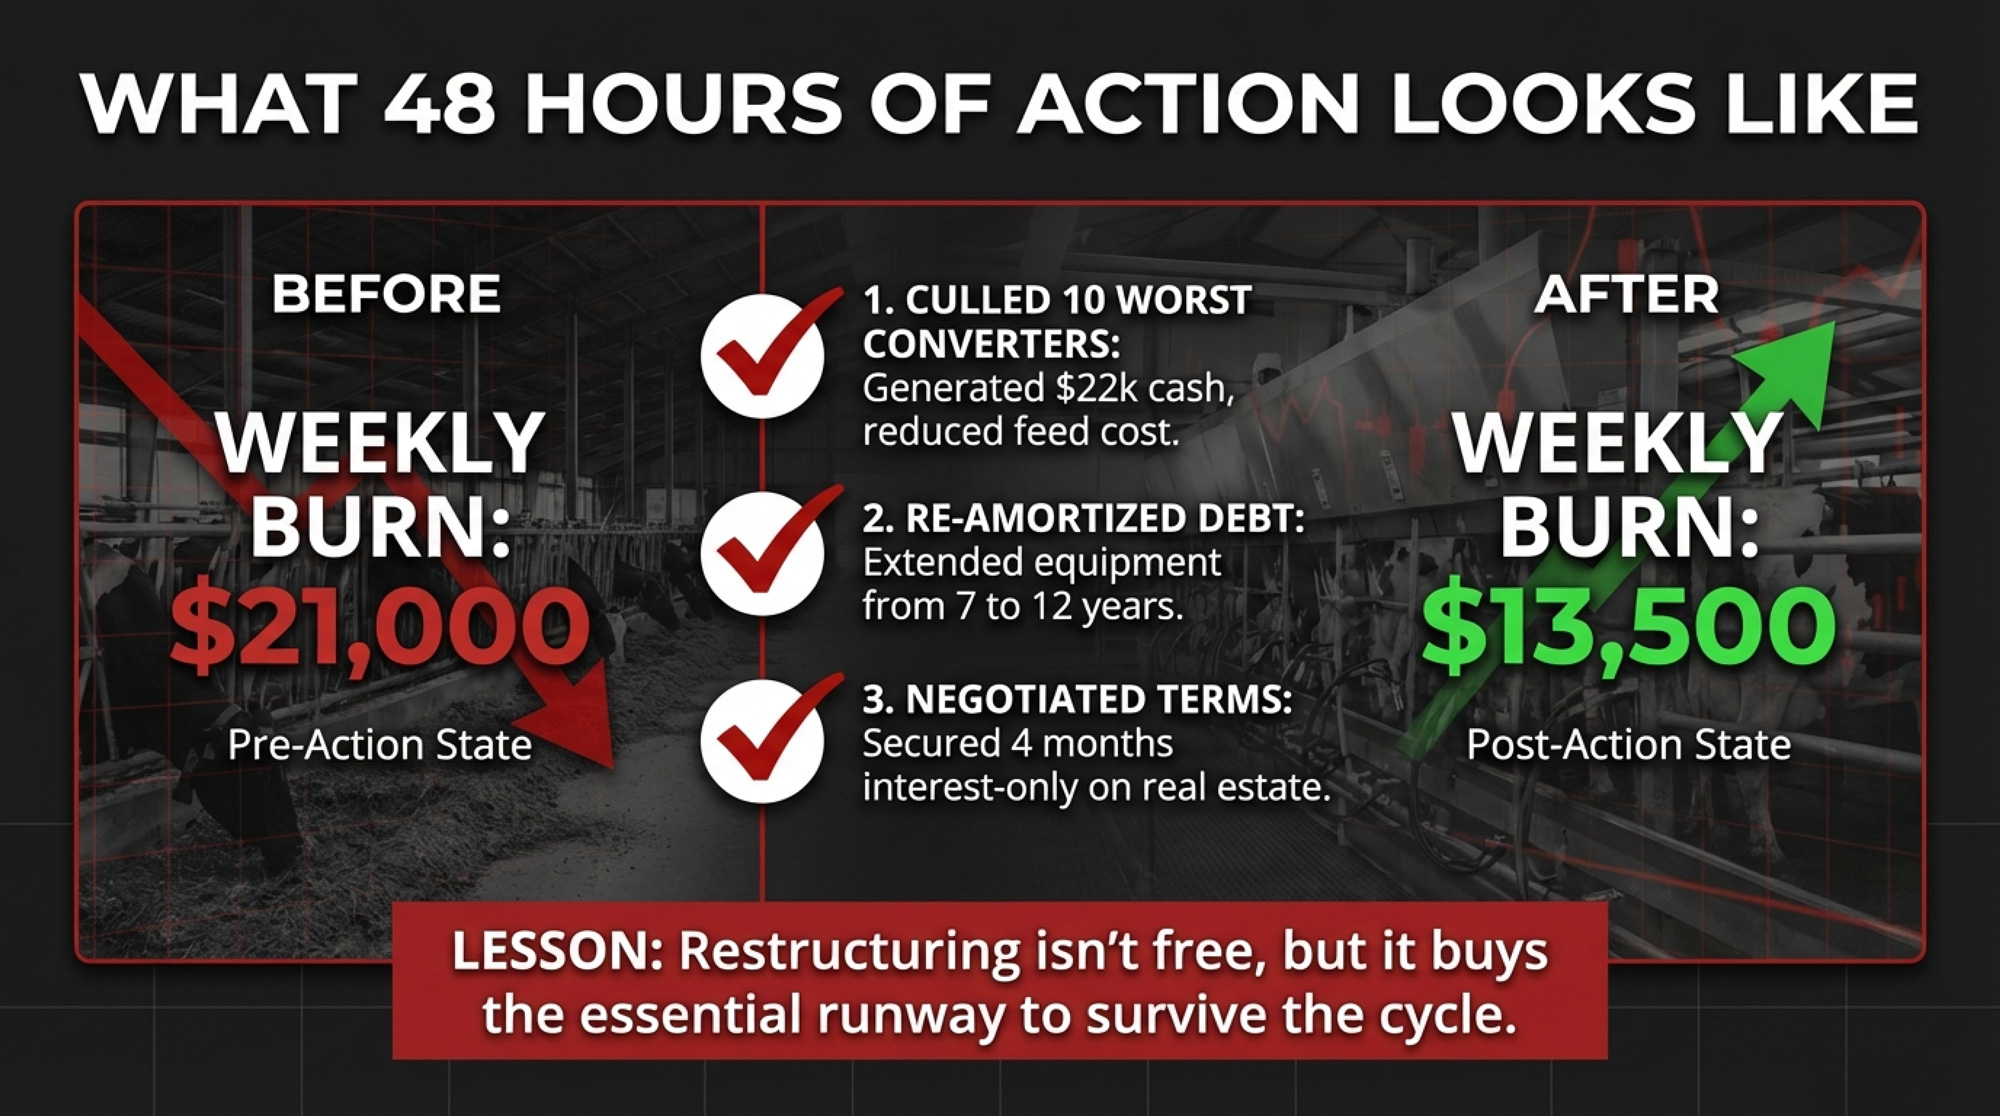
What the Wisconsin Dairy Did in 48 Hours
That 550-cow operation didn’t wait. According to the counselor’s account in The Bullvine’s Calf-Check Paradox reporting, within 48 hours of seeing the real numbers:
- The producer culled his 10 worst feed-to-milk converters, generating roughly $22,000 in cash and cutting daily feed cost by about $85.
- He walked into his lender’s office with a 12-month projection at $18/cwt milk and a real cost-of-production sheet — the one with market-rate labor and repriced debt.
- He negotiated a reamortization of equipment debt (from seven to twelve years) and four months of interest-only on real estate.
The reamortization buys monthly breathing room, but it isn’t free — extending the note means more total interest paid and collateral tied up longer. The restructuring was approved. Weekly burn dropped from $21,000 to roughly $13,500. Same cows. Same parlor. New math.
That’s the template. Not new genetics. Not a magic ration. Just running the real numbers and moving before the runway disappears. Most producers who lose operations in a down cycle don’t lose them because the math was impossible — they ran the math three months too late.
The Geography of Risk
Your farm’s zip code now affects its creditworthiness as much as its per-cow production.
Picture two 500-cow operations. The Wisconsin one milks into a state where the average herd was 237 cows as of NASS’s 2024 count — and likely higher now — with multiple processors competing and Farm Credit deep in dairy expertise. That renewal is about rate and terms, not about whether.
The Pennsylvania operation milks into a state with a 106-cow average and is shrinking fast. Harrisburg Dairies ceased operations in October 2025 and filed for Chapter 11 bankruptcy on February 20, 2026. According to the PA Milk Board’s November 2025 consent order, the company admitted to failing to pay producers promptly, with $900,070 documented as owed to 16 producers for August and September advance payments. The Bullvine’s own reporting put total unpaid obligations at $985,012 across 15 farms as additional October amounts were added.
Community banks in the region have seen a significant share of their dairy borrowers exit in recent years. For those that remain, the renewal conversation increasingly includes questions about succession, off-farm income, and the value of dairy infrastructure without cows.
Same 500 cows. One banker is talking in expansion terms. The other is weighing whether the regional dairy portfolio still justifies the exposure. This isn’t about Wisconsin being “good” and Pennsylvania being “bad.” It’s about the lending infrastructure around your operation — processor competition, lender expertise, peer density, and regional trajectory. If you’re in a state where the ecosystem is thinning, you need to know it before your renewal.
| Warning Sign | What It Looks Like | What It Really Means |
|---|---|---|
| Term Shortened | 5-year note renewed as 3-year | Lender buying more frequent exit ramps—your risk rating changed |
| New Covenants Added | DSCR thresholds, working capital floors, monthly reporting required | Portfolio committee wants tighter visibility into your cash position |
| Monthly Financials Requested | Previously annual, now monthly submission | Someone upstream flagged dairy sector exposure; you’re in enhanced monitoring |
| Relationship Banker Left | Dairy specialist replaced with generalist or role eliminated | Bank may be shifting resources away from dairy lending—your renewal leverage just dropped |
| Collateral Requirements Increased | Same loan amount, more collateral pledged | Your internal risk rating deteriorated; bank pricing for higher default probability |
Is Your Lender Already Repositioning?
The Wisconsin dairy’s playbook worked because the producer got ahead of the conversation. Here’s what to watch for if the conversation has started without you:
- Renewal term shortened. Five years became three? Your lender is buying more frequent exit ramps.
- New covenants appeared. DSCR thresholds, working capital floors, or monthly reporting that wasn’t in the prior agreement.
- Monthly financials requested. Someone upstream wants tighter visibility into your cash position.
- The relationship banker left and wasn’t replaced with a dairy specialist. That could be normal turnover — or it could signal your bank is shifting resources away from dairy lending. Either way, it changes your renewal dynamic.
- Collateral requirements increased for the same loan amount. Your internal risk rating changed.
Two or three stacked up means the conversation has shifted. The Wisconsin producer walked in before any materialized. That’s the difference between asking for restructuring and being told the terms.
What This Means for Your Operation
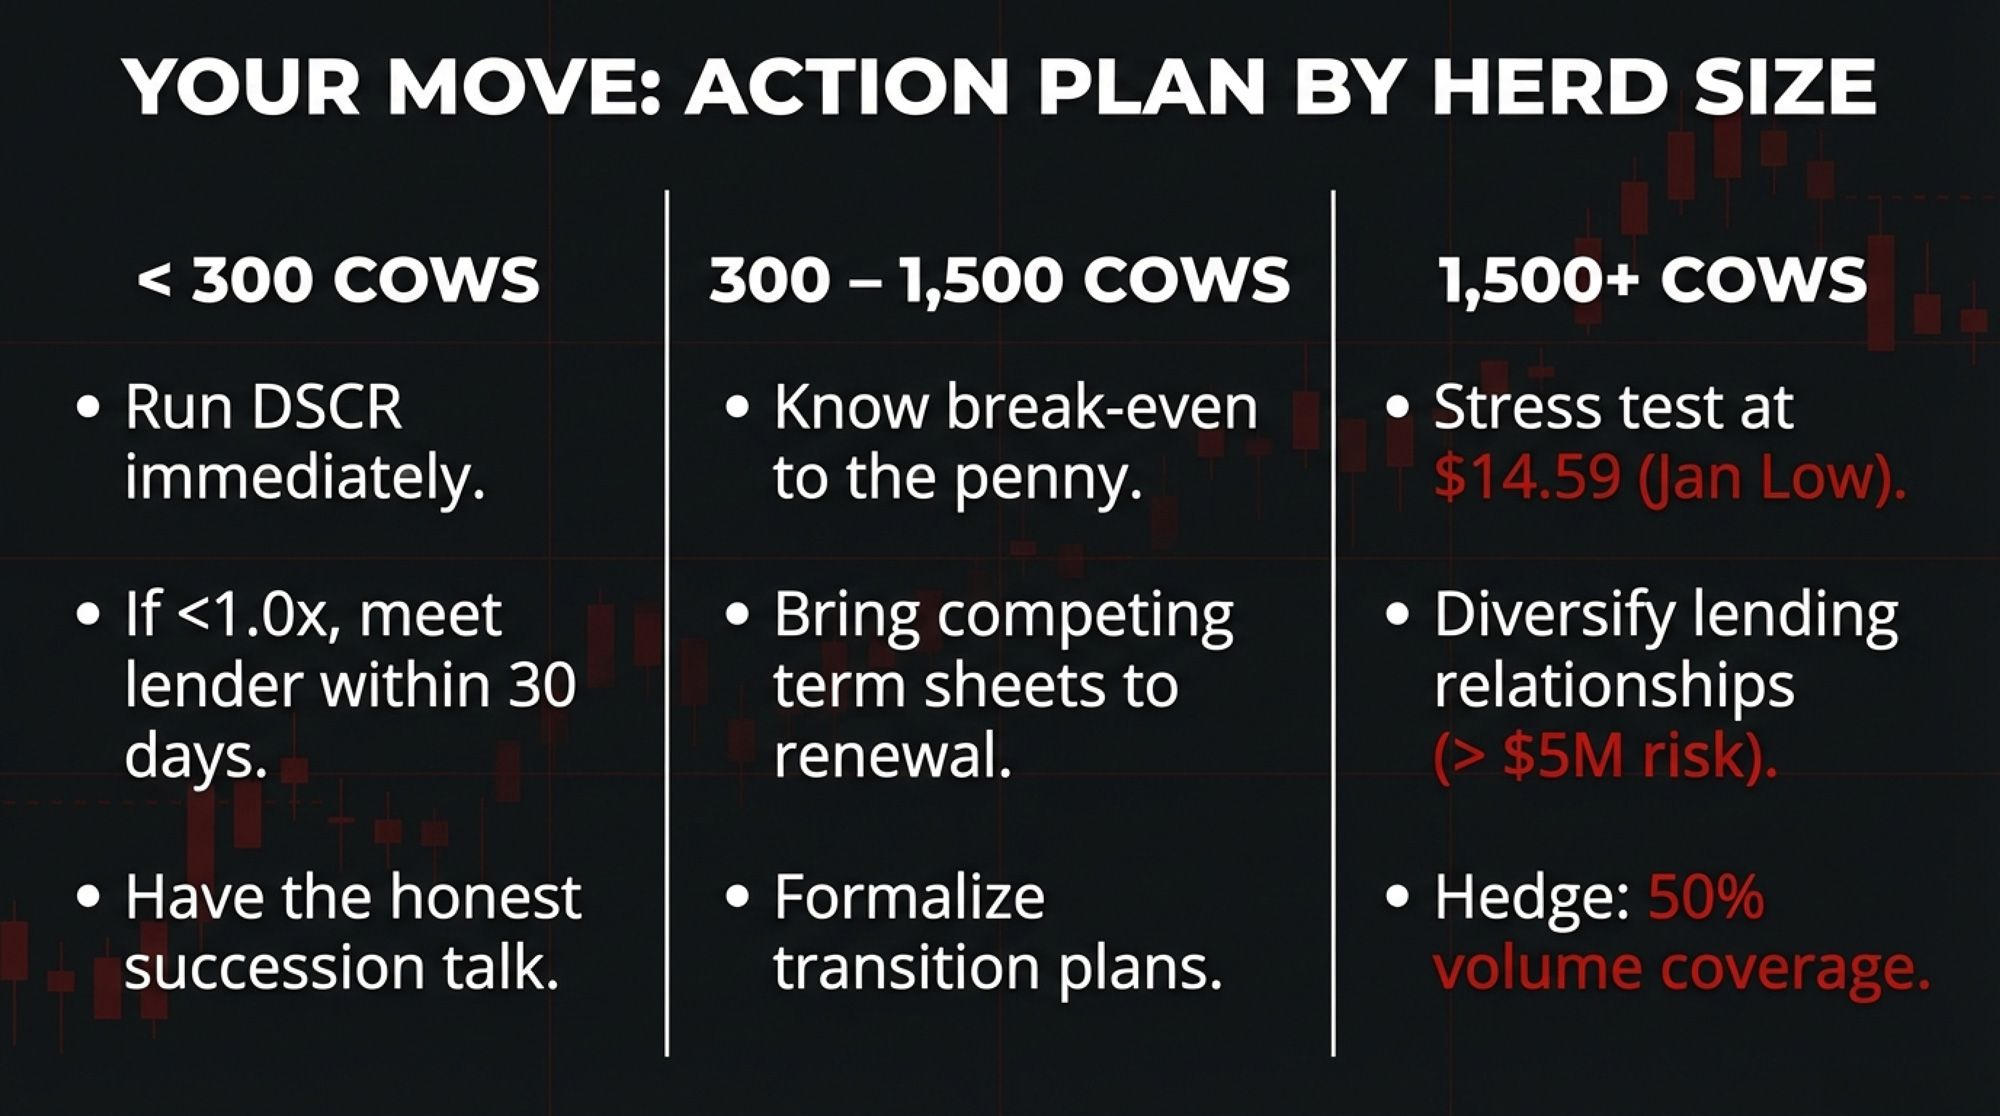
| Herd Size | Critical Actions (Next 30 Days) | DSCR Threshold Trigger | Survival Strategy |
|---|---|---|---|
| Under 300 Cows | Run DSCR at $18.95 milk; if below 1.25x, bring real COP sheet to lender within 30 days (not tax return); open exploratory talks with Farm Credit/FSA if community bank shows warning signs | Below 1.0x = immediate crisis; below 1.25x = enhanced monitoring | Succession clarity is your strongest lending signal—formalize timeline or lender assumes shorter horizon |
| 300–1,500 Cows | Calculate breakeven to penny; compare to $20.23/cwt floor; if renewal within 90 days, bring competing term sheets—leverage comes from options; stress-test feed bill volatility | Below 1.0x = restructure now; below 1.25x = bring 12-month projection showing path to 1.4x+ | Document succession plan with timelines; hedge 30-50% of milk at $19+ if available; diversify lender relationships |
| 1,500+ Cows | Stress-test at both $18.95 and $14.59 (January Class III); on 360k cwt, hedge 50% volume = $360k protected revenue annually; diversify beyond single lender—counterparty risk is real at $5M+ debt | Below 1.25x = immediate board-level discussion; below 1.5x = pricing/hedging review | Forward-contract feed and milk simultaneously; maintain 2+ lender relationships; formalize export market strategy if processing for specialty buyers |
Under 300 cows:
Run your DSCR at $18.95 this week. Below 1.25x, your lender is watching. Below 1.0x, be in your lender’s office within 30 days with a real COP sheet, not last year’s tax return. Open exploratory conversations with Farm Credit or FSA if your community bank shows warning signs. Get honest about succession — a lender who sees no plan on a sub-300 dairy is pricing for a shorter horizon, and the data on generational transfer is sobering.
300–1,500 cows:
Know your breakeven to the penny. Compare it to the $20.23/cwt threshold calculated in this article. If renewal is within 90 days, bring competing term sheets — leverage comes from options, not hoping. Formalize succession if you’re transitioning; a documented plan with timelines is one of the strongest lending signals you can send.
1,500+ cows:
Stress-test at $18.95 — and at $14.59. Diversify lending relationships — counterparty risk is real at $5M+. On 1,500 cows producing 360,000 cwt, a $2/cwt hedge on half your volume protects $360,000 in annual revenue and directly improves your risk rating.
Your 30-Day Checklist
- Run your actual DSCR at $18.95 milk using this year’s feed bill and current debt service. Below 1.25x = the zone this article describes.
- Pull your loan covenants. Check for DSCR thresholds, working capital floors, or reporting requirements you may have overlooked.
- Request your processor agreement. Confirm component premiums, volume commitments, and termination terms. Your lender will ask.
- If your DSCR is below 1.0x at $18.95, schedule a lender meeting this month — before renewal, not during it. Bring a 12-month projection at $18/cwt. The Wisconsin dairy showed what happens when you lead that conversation.
Key Takeaways
- If your debt-service coverage ratio drops below 1.25x at $18.95 milk, you’re in the danger band this article describes — that’s your cue to sit down with your numbers and your lender before renewal, not after.
- If your breakeven sits more than $1/cwt above USDA’s $18.95 forecast, you’re burning equity every week you don’t adjust — culling, cost cuts, or refinancing are on the table, but each comes with trade-offs in flexibility and total interest cost.
- If you’re milking in a thinning dairy region like Pennsylvania, your lender’s view of regional risk now matters as much as your cow performance — processor stability and peer density are part of your credit story, whether you like it or not.
- If your current hedging or risk management plan doesn’t even model a $14–$16 Class III stretch, you’re effectively betting the farm on a second-half recovery your lender isn’t banking on.
The Bottom Line
- The real question isn’t whether $18.95 milk is fair — it’s where your breakeven actually sits against that number, and how many weeks of runway you really have if Class III spends more time in the $14s than USDA’s annual average implies. The Wisconsin dairy that ran the real numbers bought itself time. Those who wait won’t get the same terms.
Complete references and supporting documentation are available upon request by contacting the editorial team at editor@thebullvine.com.
Learn More
- The 90-Day Reckoning: What Your Milk Check Is Really Saying About 2026 – Reveals a brutal 90-day window to preserve equity and arms you with the exact “Liquidity Runway” formula needed to survive mid-teens Class III prices. It bridges the gap between headline forecasts and the survival math required for your Monday morning.
- More Milk, Fewer Farms, $250K at Risk: The 2026 Numbers Every Dairy Needs to Run – Exposes the $250,000 annual margin gap looming for mid-size herds and delivers a strategic roadmap for regional positioning. Use this to stress-test your 3-year plan against global supply surges and narrowing processor exit ramps.
- Your Cheese Plant’s New Bacteria Can Run 56% Faster – Why This Technology Decides Which Processors (and Farms) Survive 2030 – Breaks down how CRISPR-optimized cultures are fundamentally reshaping processing economics and farm-level viability. It reveals the hidden efficiency race that will determine which producers secure premium contracts in an increasingly automated, data-driven supply chain.
 The Sunday Read Dairy Professionals Don’t Skip.
 The Sunday Read Dairy Professionals Don’t Skip.
Every week, thousands of producers, breeders, and industry insiders open Bullvine Weekly for genetics insights, market shifts, and profit strategies they won’t find anywhere else. One email. Five minutes. Smarter decisions all week.


 Join the Revolution!


