Archive for dairy breeding strategy

$9,000 in Feed Savings, $100,000 Out the Cull Gate — Read the Right Number

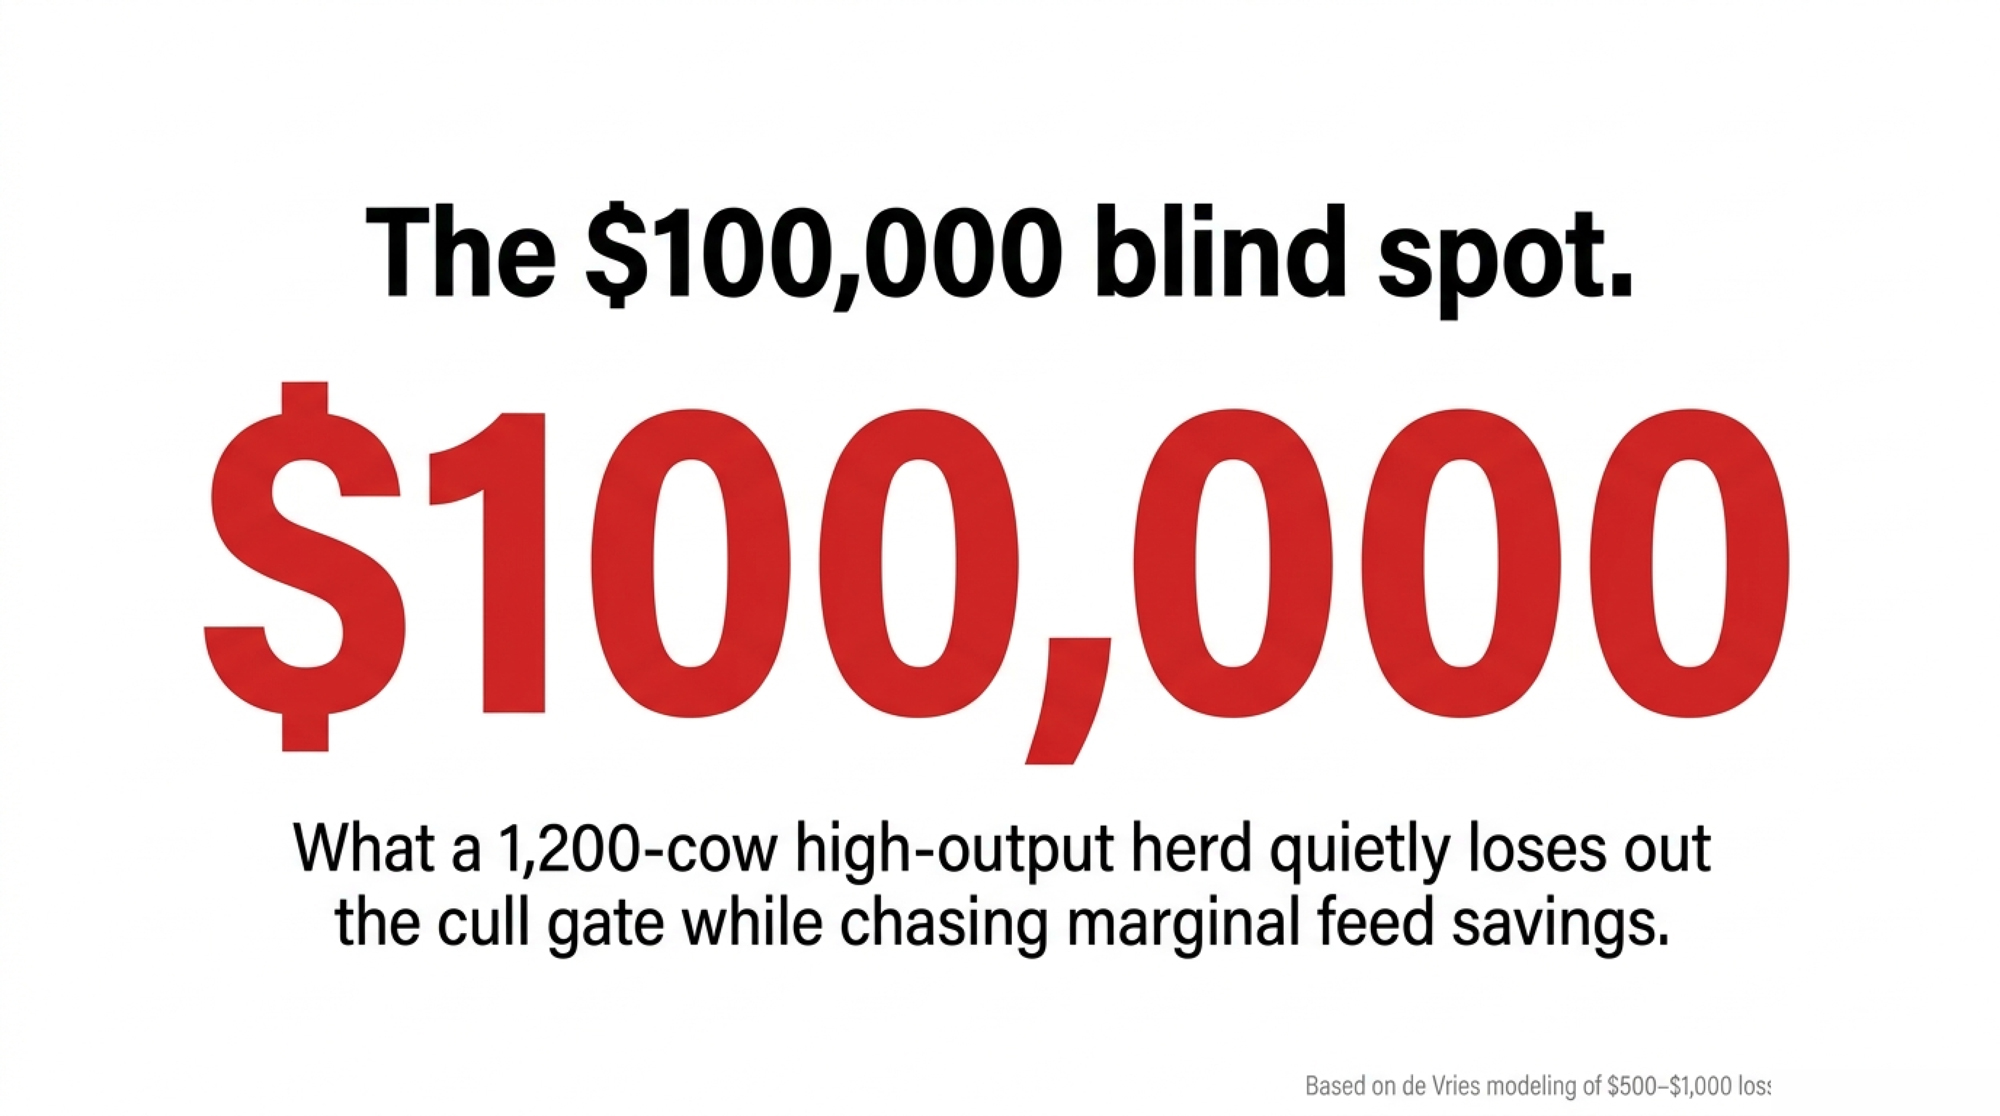
One barn chases $9,000 a year in feed efficiency the index rewards — and loses up to $100,000 out the cull gate it barely scores. Net Merit sees one number. Guess which.

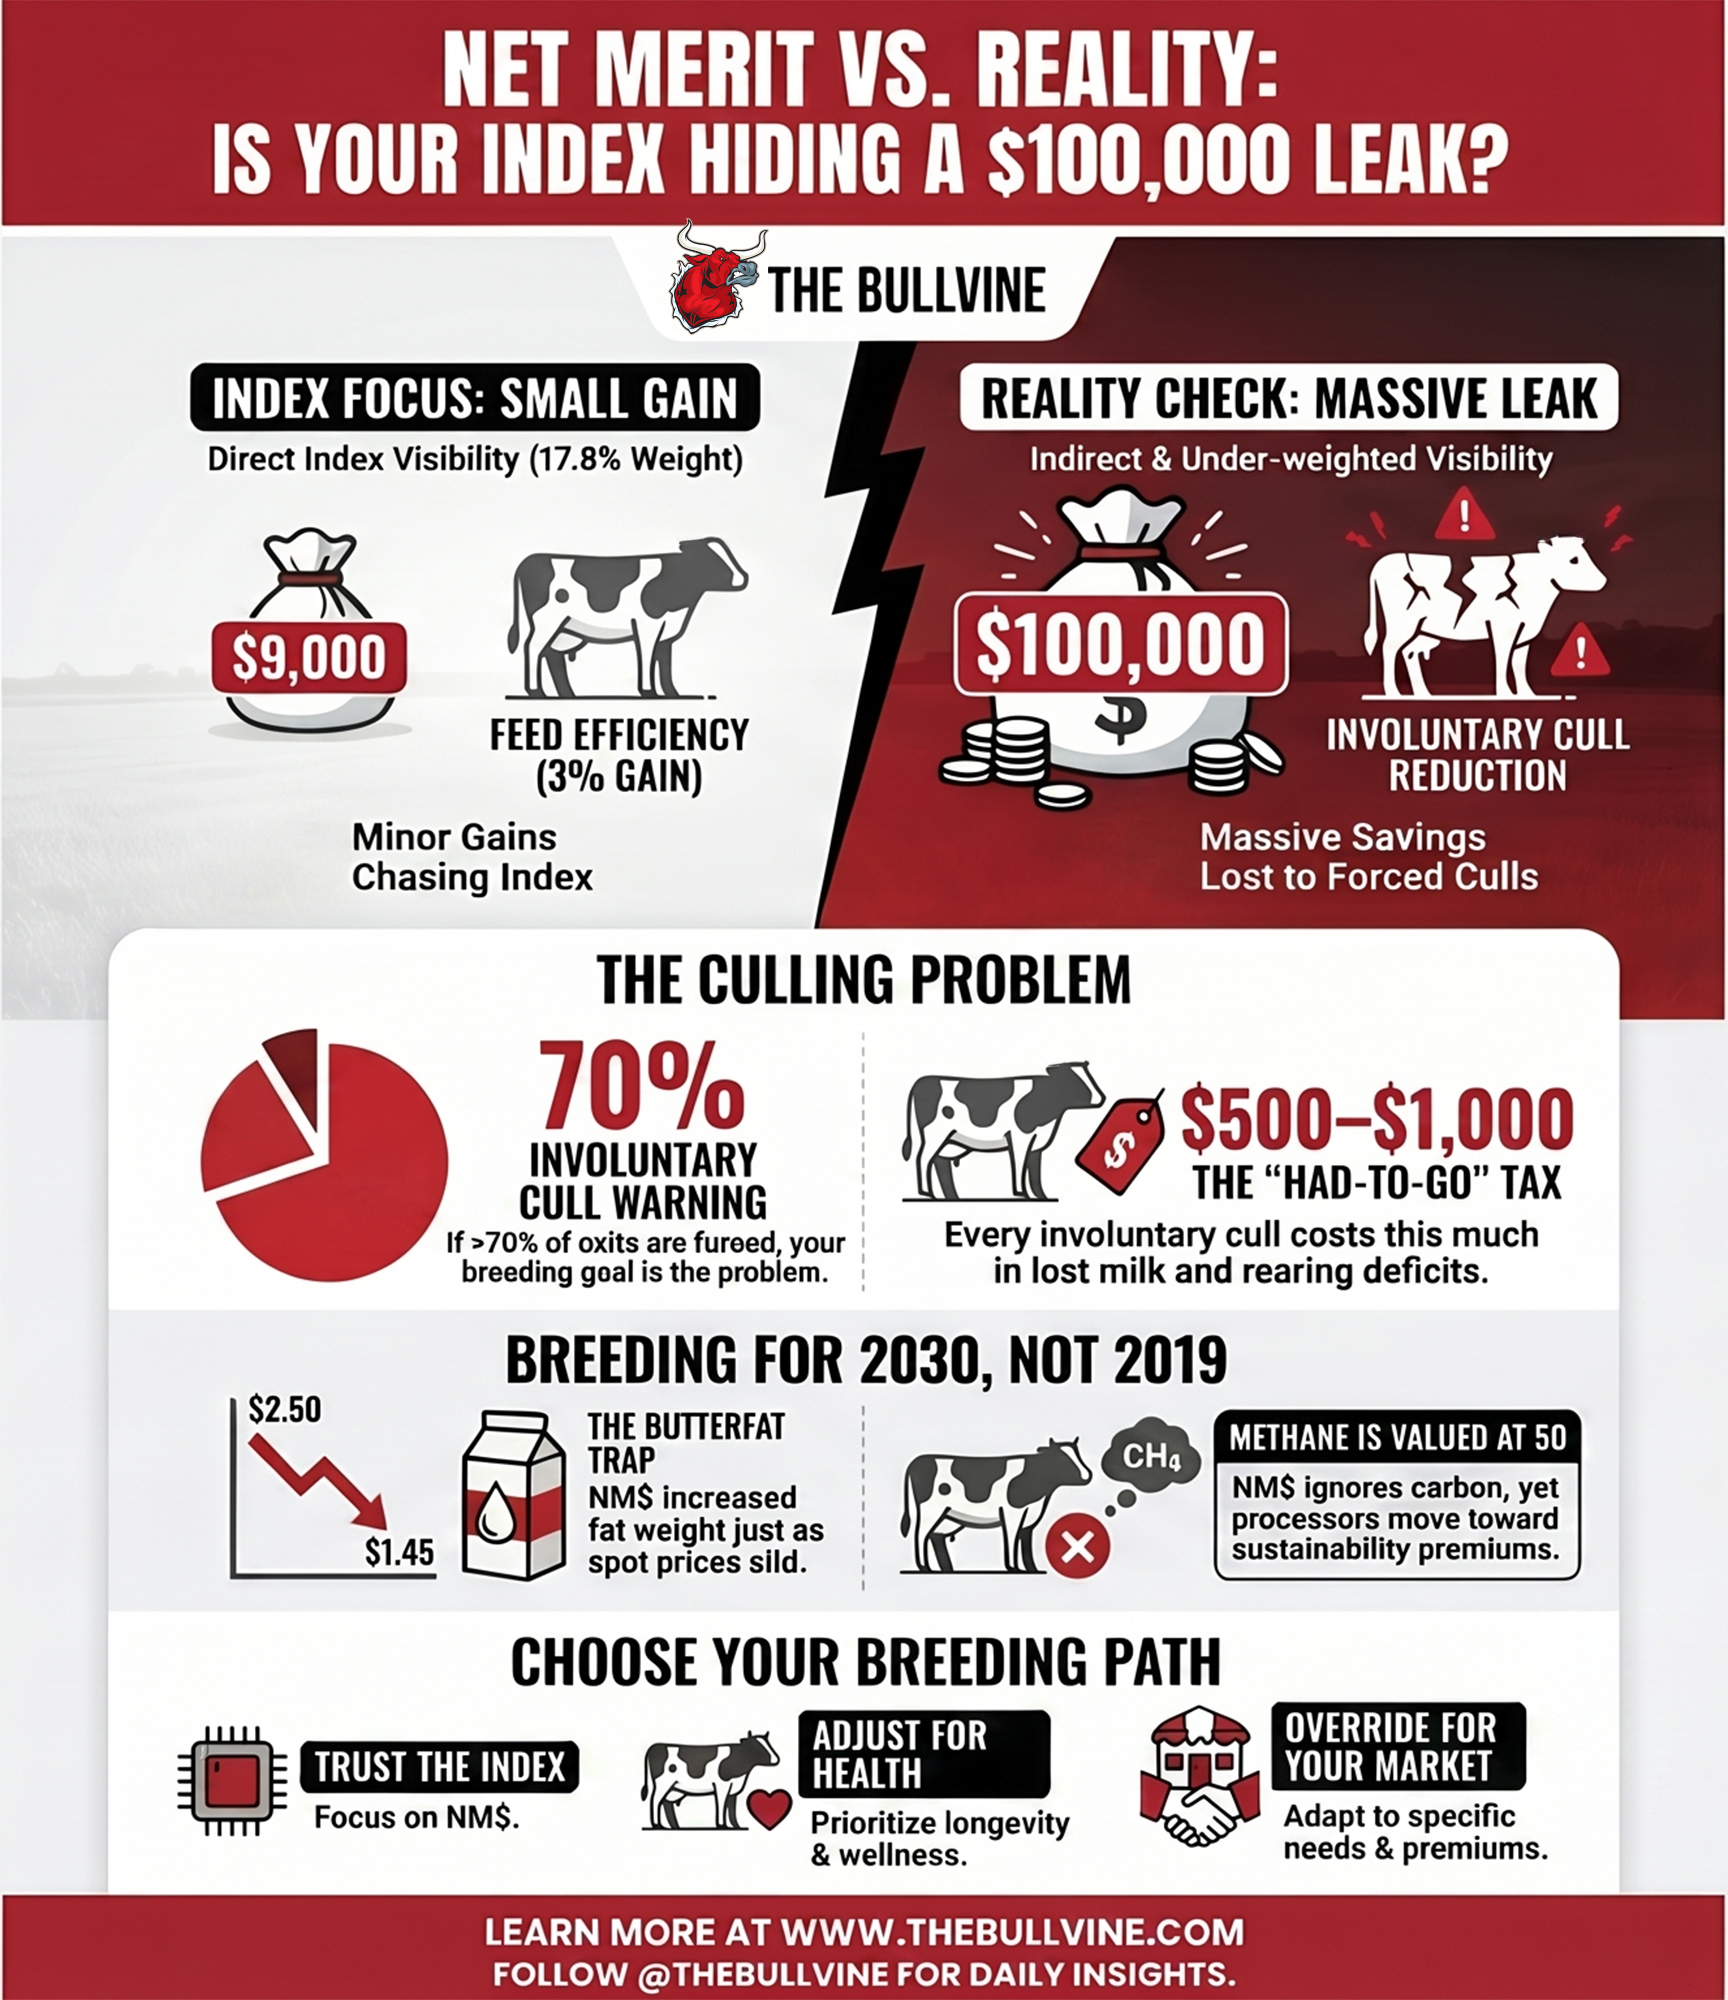
Executive Summary: When CDCB updated Net Merit in April 2025, it effectively priced butterfat near $2.90/lb and methane at $0, pushed the fat weight to 31.8% while cutting protein to 13.0%, and bumped Feed Saved to 17.8% — but the formula re-ranked almost nothing, correlating 0.992 with the old weights for young Holstein bulls. That stability is the trap: it leans on a high-butterfat window that the market already gutted, with CME spot butter sliding from about $2.50/lb in early 2025 to roughly $1.45 by December. For a 1,200-cow, high-output Holstein herd, the bigger blind spot isn’t components — it’s culling. Chasing a genuine 3% feed-efficiency gain is worth maybe $9,000 a year, while 70–100 fewer forced culls is worth $35,000–$100,000 using de Vries-style $500–$1,000/cow modeling, and NM$ only touches that leak indirectly through PL, LIV, DPR, and SCS. Meanwhile, methane sits at $0 even as DFA, Saputo, and FrieslandCampina (already paying €2.63/100kg in sustainability premiums) move toward carbon-graded milk, and the heifers you breed today on a $0 methane value won’t hit the string until 2028–2029. The piece lays out three honest roads — trust the index, adjust it around your own cull and fertility data, or override it with Cheese Merit, EBI, or custom weights — plus a 30-day move: pull your last 12 months of culls, and if more than 70% are involuntary, your breeding goal, not just your transition pen, is the problem.

Net Merit 2025

Editor’s Note: The 1,200-cow western New York Holstein operation in this story is a composite scenario modeled on multiple high-output herds that The Bullvine has reviewed since the April 2025 Net Merit update. The barn math, cull patterns, and adviser conversations are illustrative — drawn from realistic ranges in herd records and published research, not a single farm. All program names, trait weights, researcher names, and economic figures are real and sourced.

Picture the kitchen-table breeding meeting at a 1,200-cow Holstein operation in western New York, late March. Two open laptops. A pot of coffee gone cold an hour ago. A stack of breeding sheets that keeps growing as the herdsman pulls more sire proofs off the printer. This farm is a composite — but the numbers on those sheets are real. For more than a decade, the rule here has been simple: sort by Net Merit, take the top 10 bulls, don’t overthink it.

The vet truck is now a regular fixture at the fresh pen. The hoof trimmer spends most of his day in the high groups. And the cull report shows a rate in the high-30s to low-40s, with most exits starting as a health or fertility problem in the first 60 days.

Sooner or later, somebody at the table asks the question that matters on any operation like this: what is this index actually breeding the herd for in 2030, and does that still match the cows they can keep, and the milk their buyer will want to pay for?

The April 2025 Shift: High-Fat Illusion vs. Genetic Reality

Nobody at this table thinks Net Merit is ‘bad.’ NM$ remains one of the best tools for ranking bulls on expected lifetime profit under typical U.S. conditions. The problem is the gap between the conditions Net Merit assumes and the conditions a herd like this is actually facing now — and will face when today’s calves are in their third lactation.

When the Council on Dairy Cattle Breeding rolled out the updated Net Merit weights in April 2025, the headline changes were clear:

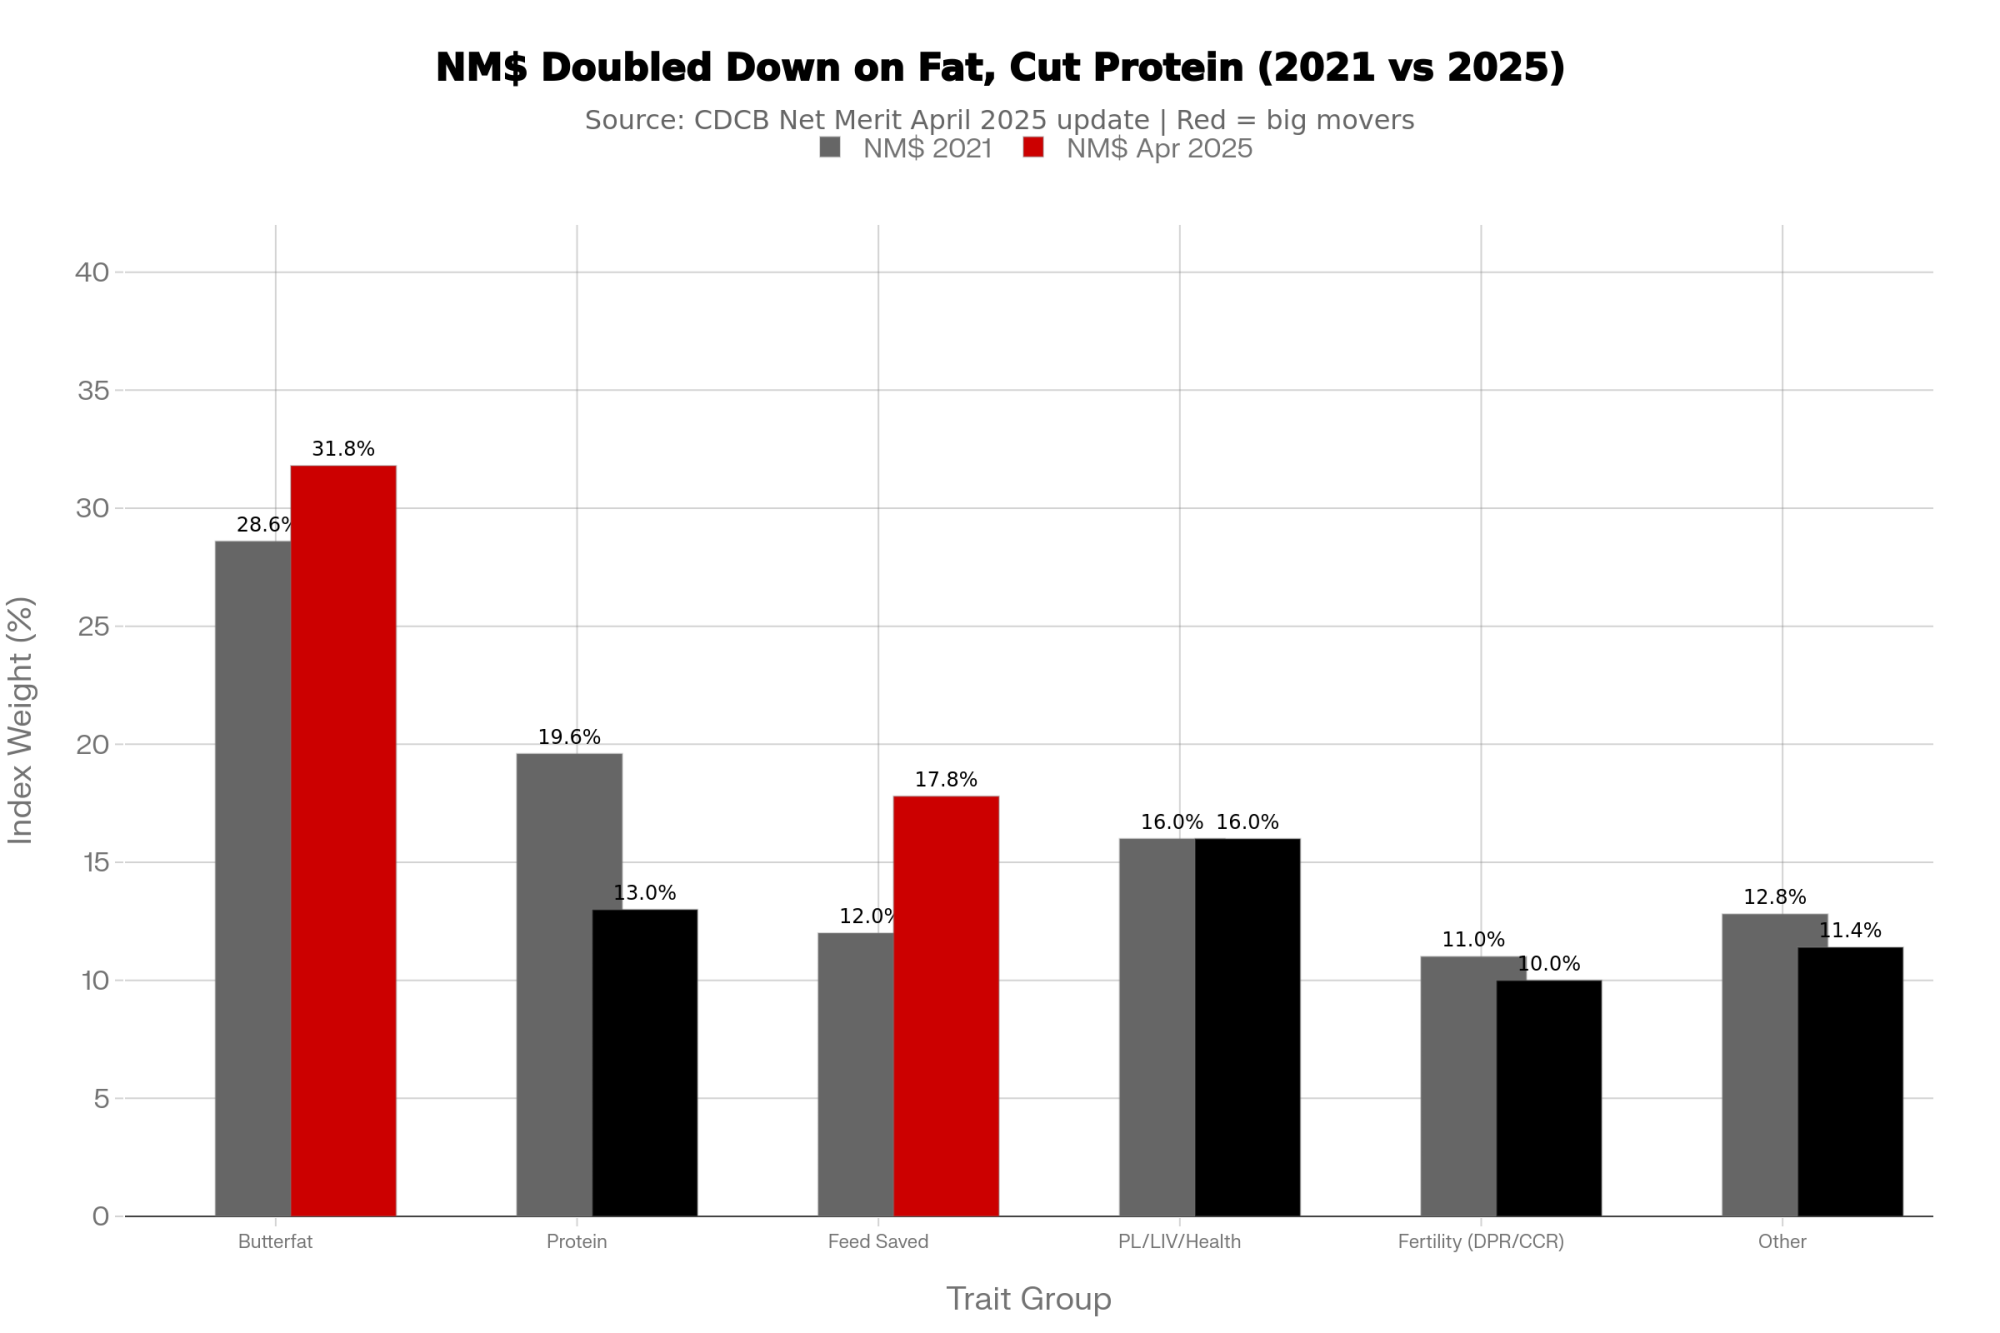
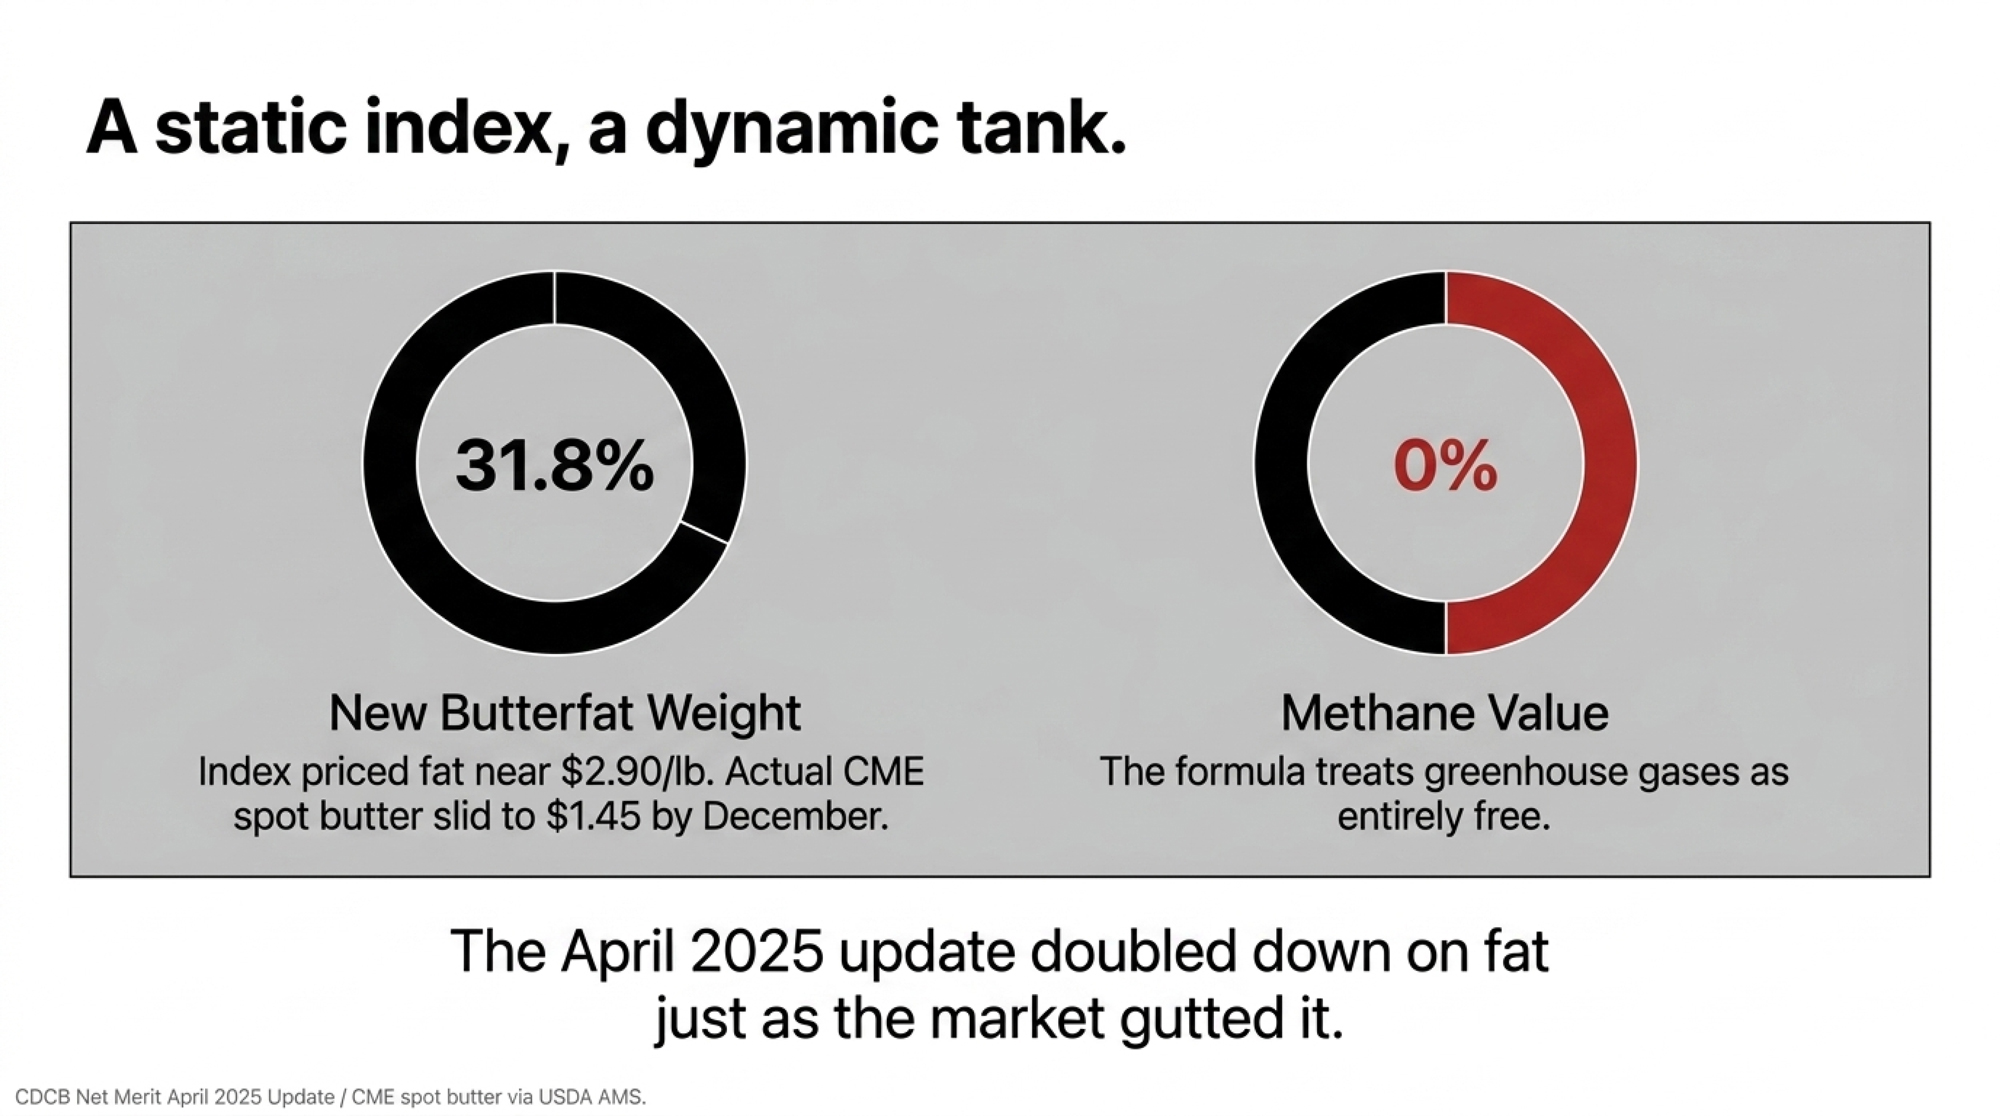
  • The butterfat weight rose from 28.6% to 31.8%.
  • The protein weight dropped from 19.6% to 13.0%.
  • Feed Saved jumped from 12.0% to 17.8%.

Here’s what that fat-heavy tilt means for your actual milk check. The index is telling your breeding program to chase butterfat hard and ease off protein — but it’s pricing those components off lagging multi-year averages, not what your tank is worth this week. Component values swing, Class prices jump, and a fat-to-protein ratio that looked right when CDCB built the formula can flip before the semen you ordered off it ever produces a milking daughter. A static index will always lag a dynamic tank. So the question isn’t just ‘is butterfat valuable?’ — it’s ‘will it still be priced this way when these matings hit the bulk tank in 2028?’

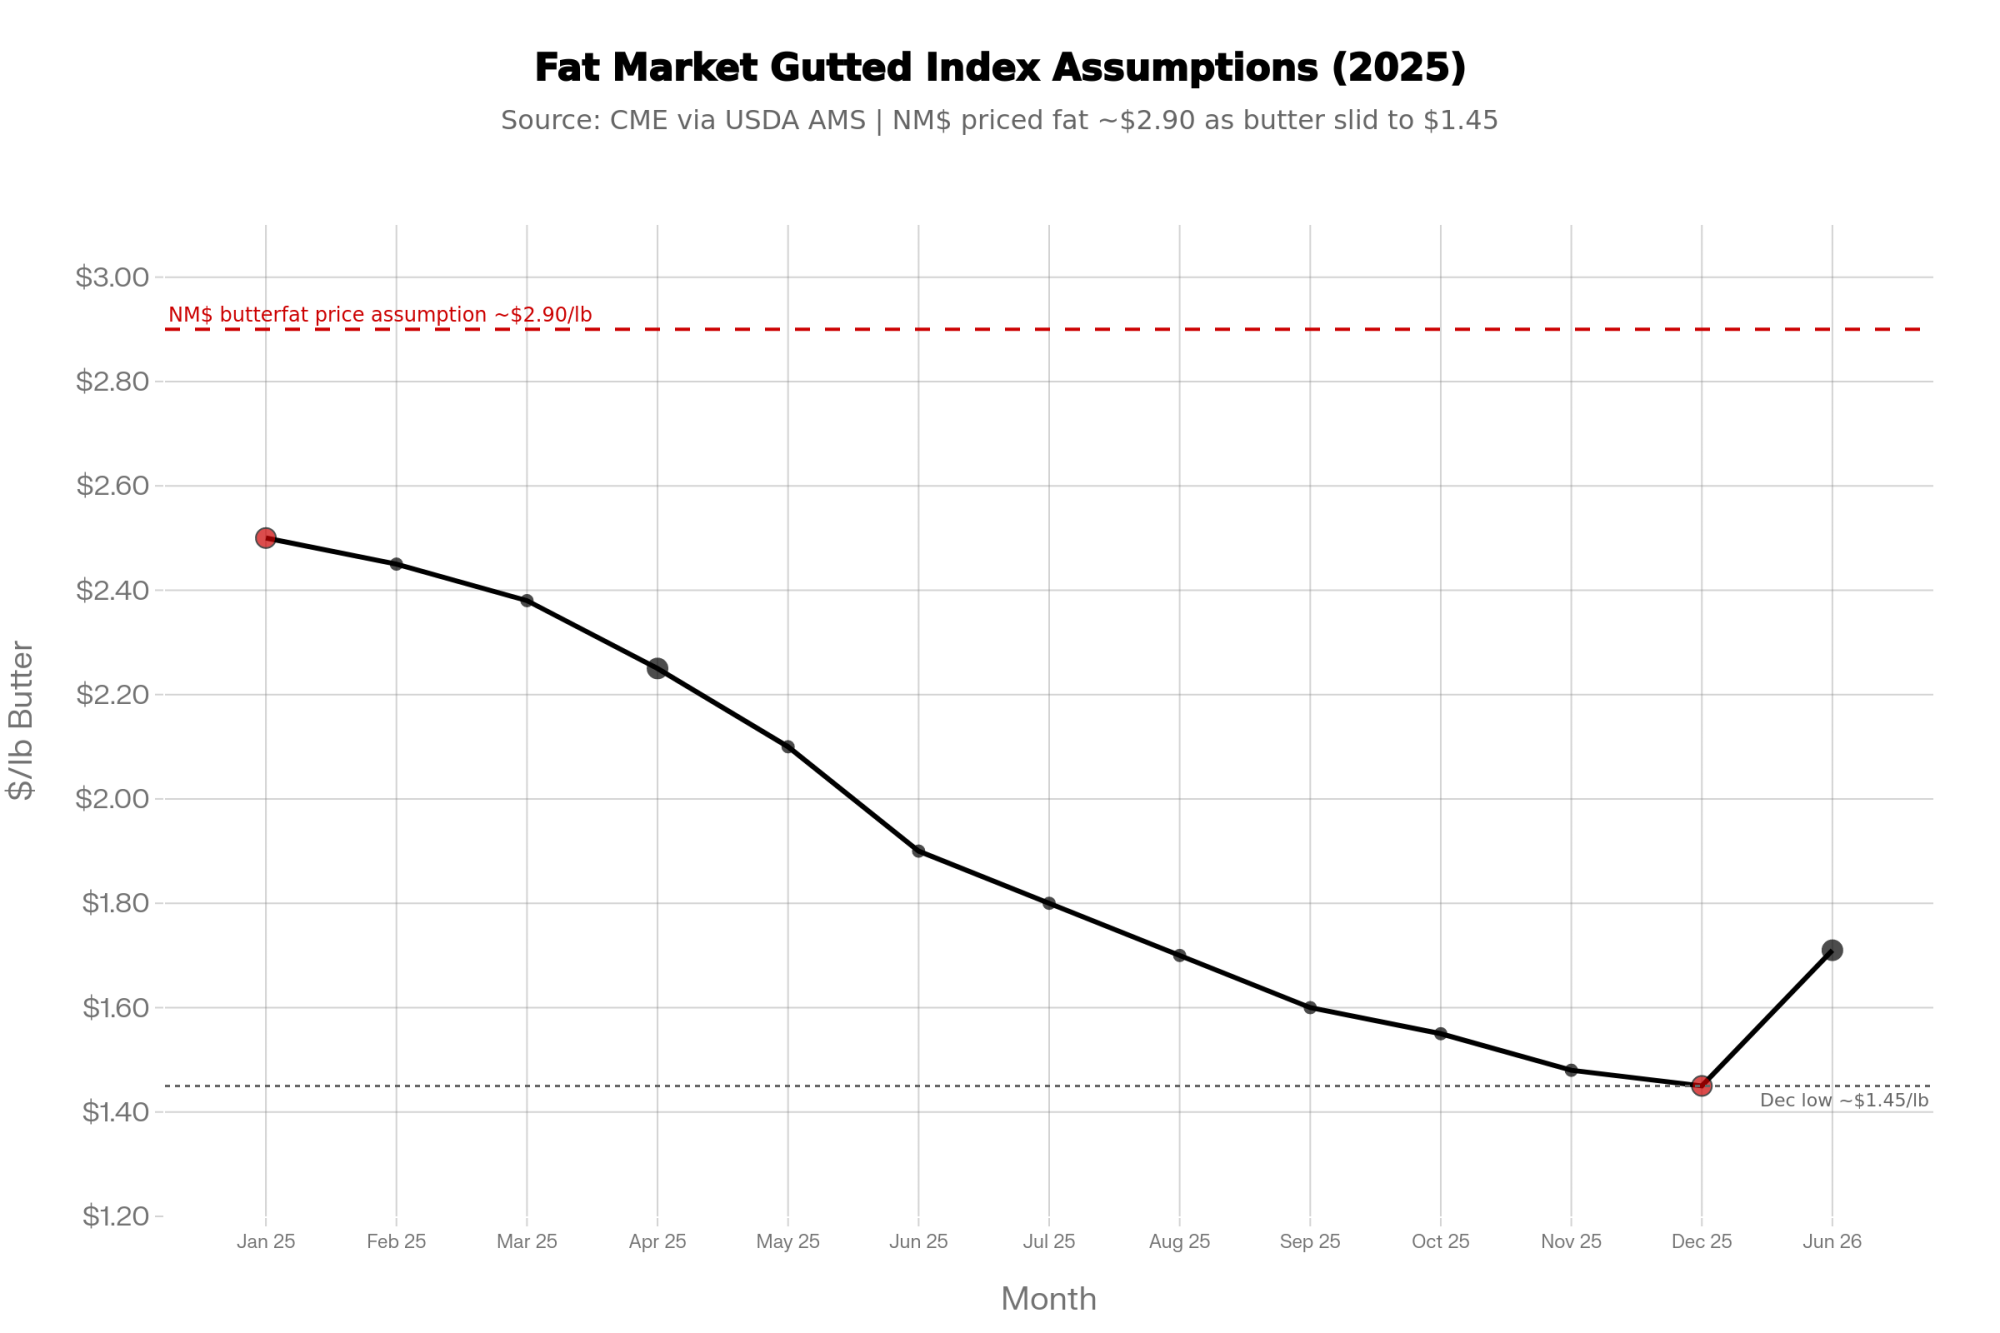
That’s not a hypothetical. CME spot butter traded near $2.50 per pound at the start of 2025 — right in the window CDCB used to reset those weights — then slid to roughly $1.45 by December and hovered near $1.71 by June 2026 (CME via USDA AMS and trade reporting). The index doubled down on fat just as the market spent a year taking the air out of it. That’s the lag in one commodity within a single year.

Translated into pricing, the update effectively values butterfat at about $2.90 per pound and feed at roughly $0.13 per pound of dry matter, while assigning methane a value of exactly $0 in the index math. CDCB and USDA-ARS used recent rolling averages of milk prices and feed margins — drawn from the years leading into the launch — to reset those economics. Butterfat had been the star during that window, trading near the high-$2-per-pound range in many orders, while protein prices sagged. Feed costs spiked, so Feed Saved was worth more.

Methane, heat tolerance, and welfare penalties weren’t in the equation at all. The official Net Merit documentation is explicit: only traits with a direct, currently measurable impact on farm profit are priced into the index, and greenhouse-gas traits are not yet included. CDCB has stated that traits are added to NM$ only when reliable national evaluations and clear economic values exist, and that greenhouse-gas evaluations are ongoing.

One number from CDCB’s own rollout really lands: the 2021 and April 2025 NM$ indexes correlate at 0.992 for young Holstein bulls and 0.981 for recent progeny-tested bulls. In plain language, almost nothing re-ranked. The same bulls a herd would have picked three years ago still float to the top of the list today — even though the butterfat, protein, and feed markets that drove the new formula look different from when most “top 10 NM$ only” rules began.

A growing number of U.S. processors are publicly discussing scope 3 emissions and sustainability reporting, and several have signaled that future producer payments may be linked to greenhouse gas performance. Nothing on the milk cheque yet. But the direction of travel is obvious.

The Bullvine walked through how the updated formula was built in its coverage of the CDCB Net Merit update.

When the Fresh Pen Says “Enough”

The cull report from a herd like this looks a lot like what you see in many high-output Holstein freestall operations. Overall, culling has crept into the high-30s. Sort culls into two piles — voluntary (older, low-producing cows with planned exits) and involuntary (health, fertility, injury, chronic problems) — and most exits are “had to” cows, not “chose to” cows.

There’s no single “official” cost of an involuntary cull, but economic modeling summarized by Albert de Vries and others puts the loss in the $500–$1,000 per cow range when you fold in lost future milk, replacement rearing cost, and health costs. And here’s why the timing hurts so much. Lose a second-lactation cow at 45 days in milk, and you’re not losing an average cow — you’re losing her at the exact moment she’s climbing toward peak yield, the most productive stretch of her life. She never gets the chance to milk back the rearing deficit she ran up as a heifer. You ate two years of feed, labor, and opportunity cost raising her; she’s three weeks from paying it back, and she leaves on the cull trailer instead. Do that 70 to 100 times a year, and the leak isn’t a rounding error — it’s much of the problem.

Cull PatternInvoluntary ShareEstimated Annual LeakLikely Genetic SignalRecommended Action
Mostly older, low-producing cows<30% involuntaryMinimal ($5k–$15k)Program working; monitor components trendStay Path 1; re-check butterfat vs. protein pricing quarterly
Mix of health + low production40–60% involuntaryModerate ($20k–$45k)Fertility and health traits under-weightedMove to Path 2; add DPR/CCR and SCS floors
Dominated by fresh-cow disease, lameness, infertility>70% involuntaryHigh ($50k–$100k+)Breeding goal misaligned with system pressurePath 2 or 3 immediately; audit sire stack for PL, LIV, hoof health
High culls concentrated in first 60 DIM>65% involuntaryHigh + rearing cost unrecoveredTransition risk baked in geneticallyFull genetic audit; consider Nordic/EBI sires for robustness

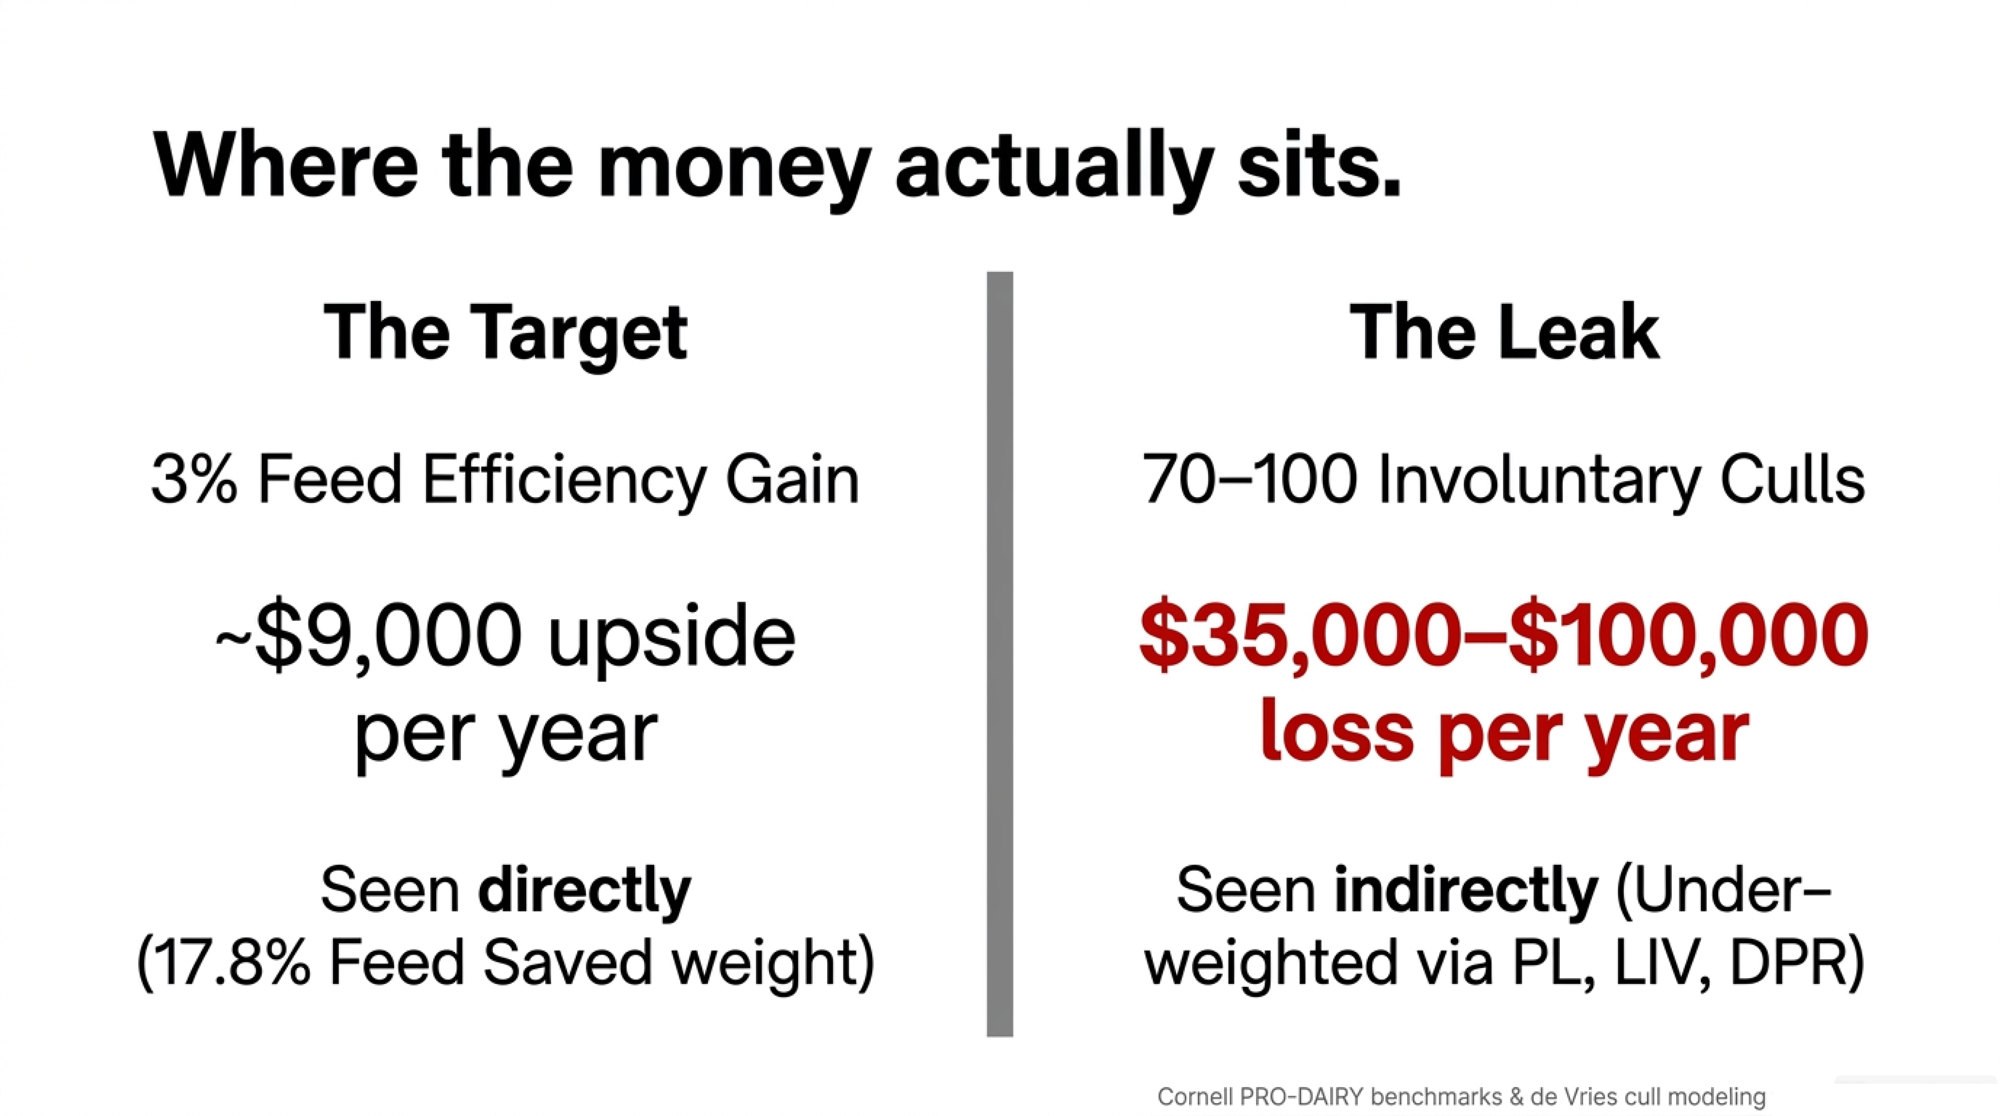
For 1,200 cows with a cull rate near 40%, even modest improvements in involuntary culling add up fast — and they add up to a number that dwarfs anything achievable by chasing feed efficiency alone.

Where the Money Actually Sits

 Involuntary Cull LeakageFeed-Efficiency Upside
What’s being modeled1,200 cows × 40% cull rate = 480 culls/yr; 15–20% reduction in forced exits = 70–100 fewer “had to” cowsA genuine 3% improvement in feed use (genetics + management together) on 30,000 cwt shipped, at a Northeast purchased-feed cost around ~$10/cwt, consistent with recent Cornell PRO-DAIRY / Northeast Dairy Farm Summary benchmarks
Per-unit economics$500–$1,000 per involuntary cull saved (de Vries-style modeling)3% of ~$300,000 annual feed cost
Annual impact$35,000–$100,000/yr~$9,000/yr (more if your landed feed cost runs higher)
Source of the gainCows staying in the herd long enough to pay off rearing costSmaller cow size + intake efficiency in the Feed Saved PTA
Visible in the index?Indirectly via PL, LIV, DPR, SCS — all under-weighted relative to this leakDirectly via Feed Saved (17.8% weight)

🔴 The P&L Blind Spot

High-output herds are chasing roughly $9,000 a year in marginal feed-efficiency gains the index explicitly rewards — while quietly leaking up to $100,000 a year through transition wrecks and forced culls the index barely sees. One number sits on the spreadsheet your breeding program optimizes for. The other walks out on the cull trailer.

So why is a breeding goal still leaning as hard on production and Feed Saved as the national average?

“We Bred Exactly What We Asked For”

A decade of sire choices on a farm like this tells an ordinary story. The team chased high NM$ and TPI, especially big milk and components. Less weight on body condition and “middle,” more on tall and angular. They eventually bolted on Productive Life and SCS filters once the cost of mastitis and early exits became impossible to ignore.

The cows walking the freestall alleys in 2025 are the predictable result. Powerful milkers, especially in first and second lactation. But many fresh cows dive into a deep negative energy balance — the window Cornell and PRO-DAIRY transition research has long flagged as the highest-risk stretch for high-output Holsteins — that drops them right on the edge between “profitable” and “problem.”

In our reporting on transition cow disease across high-output Holstein herds, one pattern keeps surfacing: genetics now produce cows that can out-milk the ability of an operation to keep them healthy through the first 60 days. Good transition management still helps. But genetics quietly loads the dice against you before the calf is even born.

Cornell’s NYSCHAP transition-cow benchmarks draw the alarm lines in hard numbers: displaced abomasum at or above 6% (target under 3%), milk fever at or above 5% (target under 2%), retained placenta at or above 10% (target under 8%). Herds that have selected hard on production for years tend to flirt with those lines unless genetics and transition management are pulling in the same direction.

Lay health and culling patterns next to a genetic trend, and what shows up isn’t a “transition program” problem. It’s a breeding-goal problem that’s been compounding across multiple sire generations.

If you want the mechanics, The Bullvine breaks down how feed efficiency is actually measured in its primer on residual feed intake.

Net Merit: Where It Still Helps and Where It’s Blind

This isn’t “abandon NM$.” It’s knowing what Net Merit is genuinely good at for a herd like this — and where it’s blind.

Where NM$ still shines:

  • Ranks bulls for lifetime profit under average U.S. confinement herd economics, assuming FMMO-style component pricing and no carbon price.
  • Keeps obviously risky sires — very poor somatic cell, extremely low fertility, weak livability — out of the tank.
  • Provides a consistent national yardstick to compare bulls, cow families, and herds.

Where NM$ goes blind for this kind of herd:

  • Feed efficiency. The Feed Saved trait combines actual feed intake data, where available, with the body weight composite. A big slice of that PTA still comes from smaller cows, not necessarily cows that convert feed more efficiently at the same size. For a herd already pushing milk per stall hard, smaller isn’t automatically better if it means less “middle” to handle higher output.
  • Environment. Methane and other environmental externalities are valued at $0 in the NM$ formula. Any future carbon premium or deduction from a processor is invisible to the index, which leaves any herd thinking about methane efficiency or low-carbon dairy genetics working off-index.
  • How it plays in robots. Udder and teat composites that work fine in a parlor can be a headache in AMS barns. Robot herds have learned the hard way that rear teats too close together are one of the quickest ways to make a robot hate your cow. National udder composites weren’t originally built around AMS needs.
  • Responsiveness. The April 2025 update didn’t add any new traits and barely moved bull rankings overall, despite real changes in butterfat prices and feed costs. That’s a deliberate trade-off CDCB makes to keep the national index stable: changes that re-rank too many bulls or invalidate years of breeding decisions are, by design, hard to push through quickly.

For a herd with a full fresh pen, a high share of involuntary culls, and a processor warming up for sustainability scoring, NM$ is still useful — but more as a minimum standard than the steering wheel.

Trust the Index, Adjust It, or Override It?

Here’s where the kitchen-table conversation gets honest. Three roads forward. And which one you take isn’t a personality test — it’s dictated by how far your herd has drifted from the “average U.S. parlor herd” the index assumes.

Start at Path 1. The further your reality sits from that national average, the further down the line you move. Cull report still looks normal, and your processor’s quiet on carbon? Trust works. Watching involuntary culls climb, and fresh-pen disease creep toward those NYSCHAP alarm lines? You’re already past Path 1, whether you’ve admitted it or not. Running robots, grazing, or staring down a processor sustainability contract? You’re at Path 3. Find the road that matches what you’re actually living — then decide whether it still fits the next decade.

Selection PathPrimary Sort ToolKey AssumptionWhat You Give UpRed Flag Trigger
Path 1 — Trust NM$NM$ top 10–20 bullsAvg U.S. confinement economics, FMMO pricing, no carbon priceDirect control over methane, AMS udder fit, index lagInvoluntary culls >70%; fresh-pen disease at NYSCHAP alarm lines
Path 2 — Adjust Around Your DataNM$ as gatekeeper + custom minimumsYour DPR, CCR, mastitis, and hoof floors override top-end rankingSome NM$ points at top of listHigh forced-cull rate + processor starting carbon conversation
Path 3 — Override the IndexCheese Merit / EBI / NTM / custom weightsYour system (robots, grazing, OAD) differs materially from national averageSingle national ranking; smaller reference populationsRobots, grazing, processor sustainability contract, OAD milking
Methane Value in Each Path$0 (NM$)$0 (NM$)€2.63/100kg already paid in NLU.S. processor carbon premiums ~2028–2030 window

Path 1 — Trust the Index

You are here if: Your primary sire-selection rule is “sort by NM$, take the top 10–20 bulls, move on.”

What it assumes: Average U.S. confinement herd economics, FMMO-style component pricing, no carbon price, and a herd structure close to the national mean.

What you give up: Direct emphasis on the traits NM$ doesn’t price — methane, heat tolerance, AMS-specific udder design — plus any responsiveness to the gap between your milk cheque and the index’s pricing assumptions.

Honest tell: If your involuntary cull share is climbing and your fresh-pen disease rates are flirting with NYSCHAP alarm levels, “trust” is quietly costing you the leakage in the table above.

Path 2 — Adjust Around Your Own Data

You are here if: You use NM$ as a gatekeeper but layer your own minimums on top.

What it looks like in practice: A hard floor on Daughter Pregnancy Rate and Cow Conception Rate. More weight on mastitis resistance and hoof health, where credible proofs exist. A preference for bulls with real feed-intake data behind their Feed Saved PTAs, not just a smaller body weight composite. Acceptance that you’ll give up some top-end NM$ points to get cows that stay in the herd longer.

What you give up: Some short-term genetic merit on the top-line index number.

Honest tell: If your composite herd looks like the New York one in this story — full fresh pen, high involuntary culls, processor talking carbon — this is usually the right starting road.

Path 3 — Override the Index

You are here if your future system looks materially different from the “average U.S. parlor herd.”

What it looks like in practice: Cheese Merit or Grazing Merit as your primary sort instead of NM$. Irish or Nordic sires were brought in because EBI and NTM placed greater weight on fertility, pasture performance, and emissions. Or rough custom economic weights built off your own numbers — your feed costs, your culling pattern, your labor situation, and the language in your processor’s contract.

What you give up: The simplicity of a single national ranking, and reference populations that may be smaller for some traits.

Honest tell: Robots, grazing, OAD, processor sustainability scoring, or a strong components-only payment structure are all signs the override path is worth a serious look.

A composite herd like this New York operation usually lands between Path 2 and Path 3. Keep an NM$ threshold but stop insisting on only top-10 bulls. Weight health, fertility, livability, and moderate stature harder when picking sires. Hunt for bulls with credible feed-efficiency stories. And look at EBI-bred and Nordic sires with curiosity instead of writing them off as “pasture bulls from somewhere else.”

The agreement that emerges around the table is usually the same: cows that stay in the herd and pay off their rearing cost deserve more weight in the breeding goal than cows that leave after one or two rocky lactations.

What Does a Case of Ketosis Really Mean for Your Genetics?

Most of us talk about genetics and picture proofs before pens. The health patterns in your fresh pen are exactly where your index choices show up.

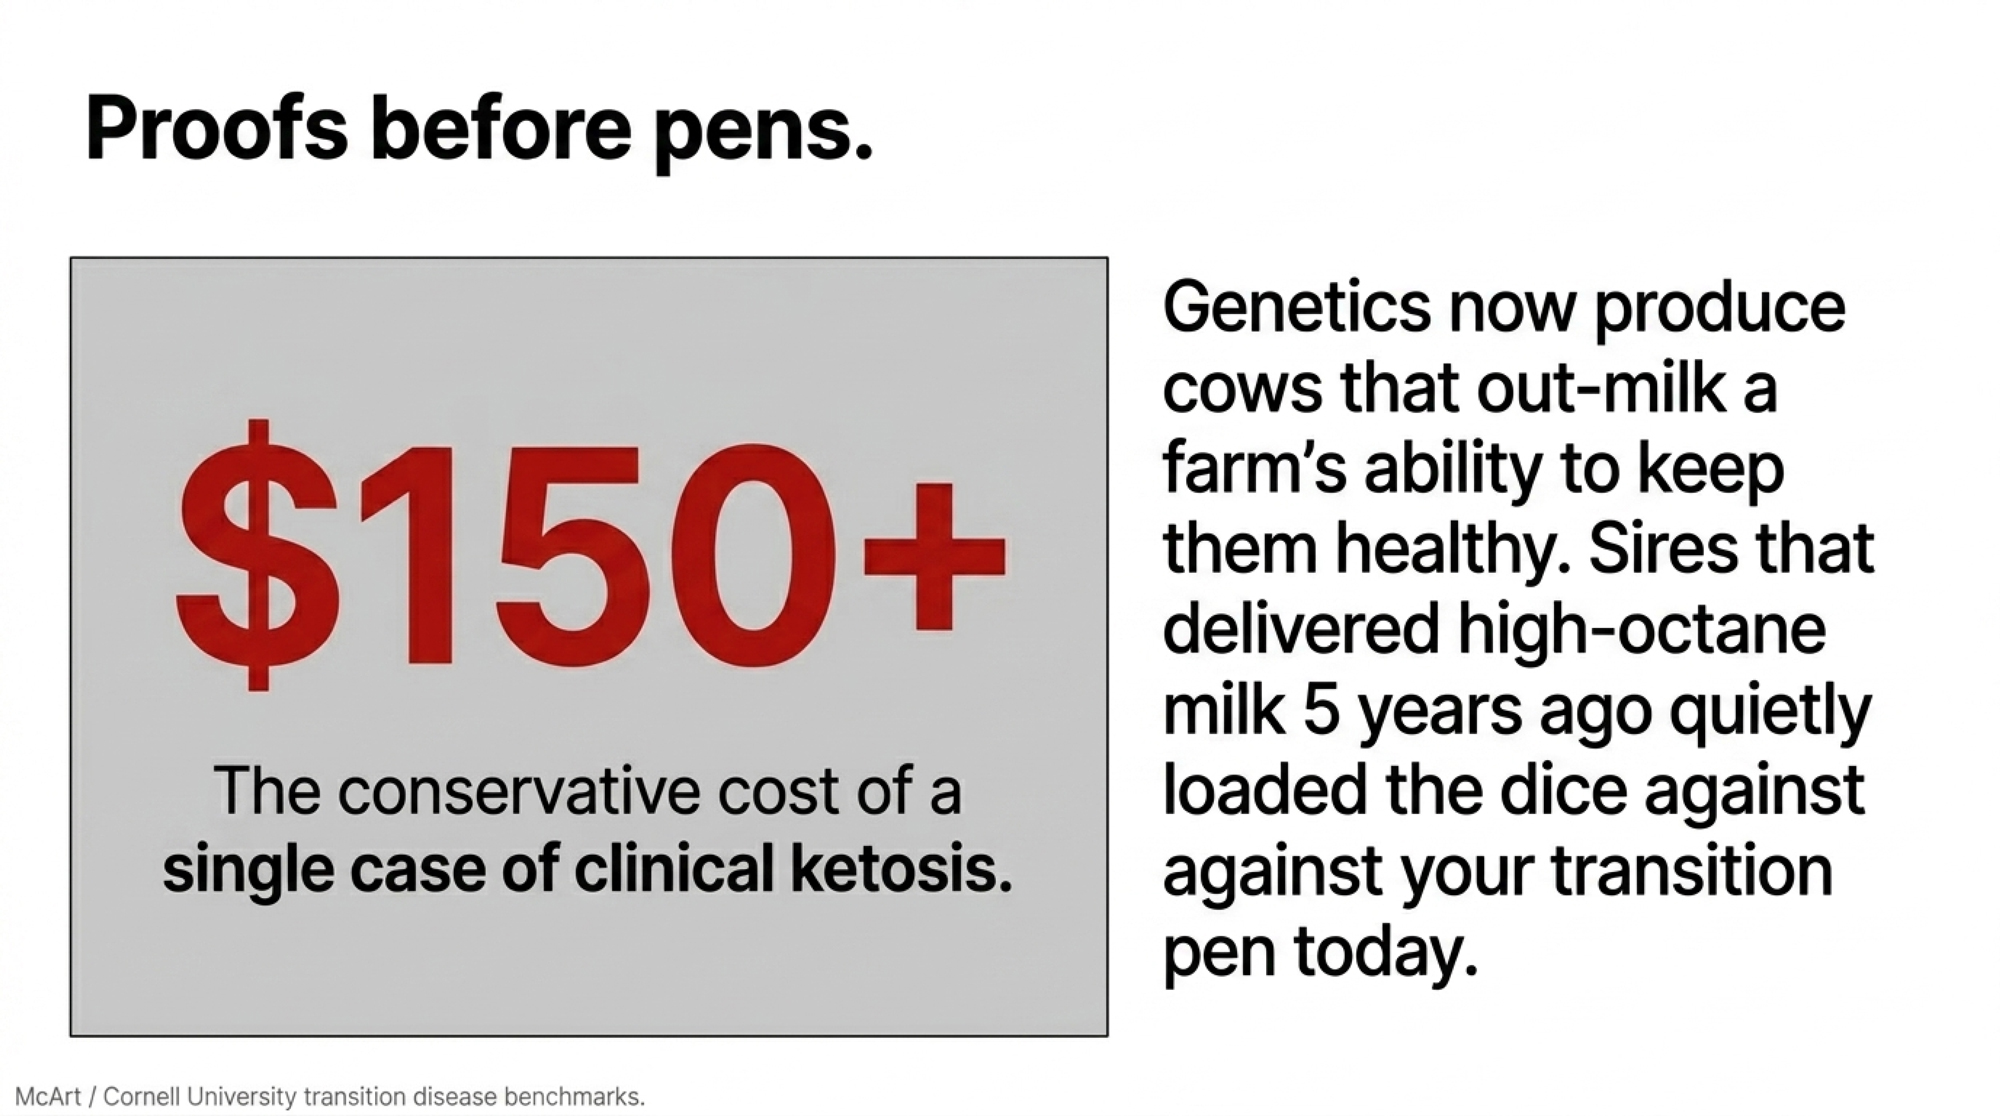
Take ketosis. Cornell research led by Jessica McArt and recent extension summaries put a single case of clinical ketosis in the low hundreds of dollars per cow — published estimates range from roughly $117 to over $230 per case once treatment, lost milk, reproduction delays, and added culling risk are factored in. The exact number depends on the system and prices, but it’s not trivial.

Run the example off this herd’s scale:

  • 1,200 cows, with 10% hitting some form of ketosis in early lactation. That’s 120 cases.
  • If better genetics and management together trimmed that by 20%, that’s 24 fewer cases.
  • Use a conservative blended estimate of around $150 per case to stay on the low end of published ranges, and you’re looking at about $3,600 a year back in your pocket.

You’re not retiring on that number. But stack it with fewer DAs, fewer down cows, better fertility, and a few more cows making it into third and fourth lactation, and now you’re talking real money.

Changing trait weights doesn’t magically fix everything. But the cows getting sick now are partly the product of mating decisions made 5–10 years ago. The same proofs that gave you high-octane milk can quietly raise the odds that cows tip over in a high-pressure transition program. And if the cows that stay in your herd don’t look like the cows your index rewards, your genetic goal and your business have stopped agreeing with each other.

This isn’t a “transition program” problem that showed up in 2025. It’s a long-running genetic strategy that never got updated as the economics and farm realities shifted around it.

Is Your Index Already Behind Your Processor?

The other source of tension at the table isn’t the vet bill. It’s the milk buyer.

Several large U.S. processors — Dairy Farmers of America among them, with its publicly committed net-zero greenhouse-gas goal by 2050 and ongoing scope-3 reporting, and Saputo with its publicly stated commitment to reduce absolute scope 1 and 2 emissions and to engage suppliers on scope-3 emissions by 2030 — have lined up sustainability targets that put farm-level emissions on the table. Nobody knows exactly what the premium and deduction structure will eventually look like. But at some point, a kilogram of milk from a low-footprint herd won’t be treated the same as a kilogram from a higher-footprint one.

International examples are the warning shot. In November 2022, Ireland’s Economic Breeding Index added a dedicated carbon sub-index, which ICBF and Teagasc set at a 10% weighting of the total EBI — putting a monetary value on emissions at €80 per tonne of carbon dioxide. Teagasc and ICBF data show cows bred under EBI have become measurably more carbon-efficient per kilogram of milk solids, mostly through higher fertility, better solids, and tighter calving patterns, diluting emissions per unit of output.

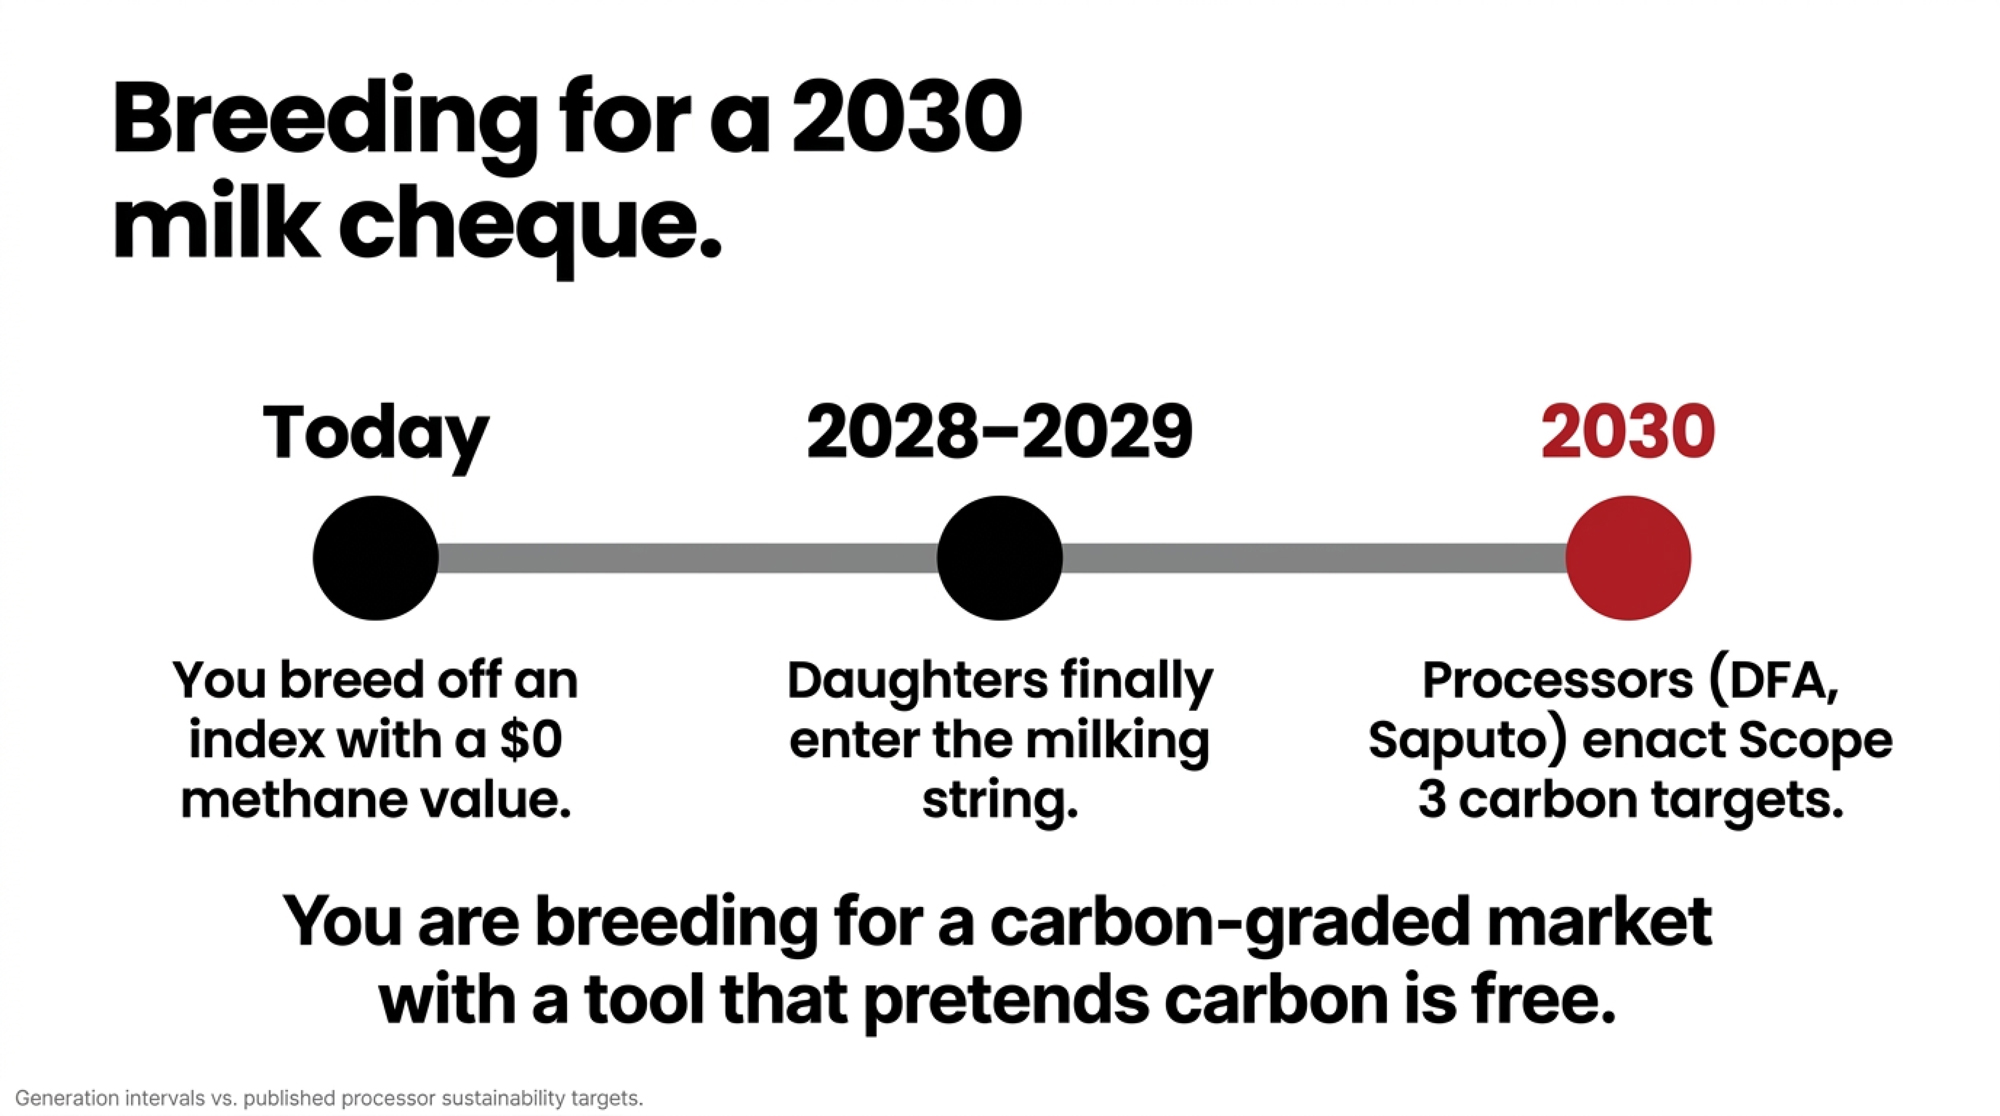
Now factor in the clock that makes this urgent: a dairy animal’s generation interval runs roughly 3 to 4 years. Breed off a “$0 methane value” index today, and the heifers you’re creating won’t even enter the milking string until 2028 or 2029 — and they’ll be in your herd for years after that. So if a U.S. processor lands a carbon premium or deduction by the turn of the decade, the cows facing that penalty are being conceived right now, off an index that prices their emissions at nothing. You’re not breeding for today’s milk cheque. You’re breeding for a milk cheque you can’t see yet, with a tool that pretends carbon is free.

Dutch dairy co-op FrieslandCampina already runs the real-world version of this on the milk cheque. The co-op paid out more than €245 million in sustainability premiums to member farms for 2023 — averaging €2.63 per 100 kg of farm milk — with about €190 million of that flowing through the Foqus planet sustainable-development incentive system, and the remaining €55 million-plus tied to special milk flows such as organic and PlanetProof. The exact split shifts year to year, but the principle is fixed: greenhouse-gas and sustainability performance is already cash on a Dutch milk cheque.

Index / ProgramCountryMethane / Carbon ValueFertility WeightSustainability on Milk Cheque?
Net Merit (NM$) Apr 2025USA$0~10% (DPR/CCR)No
Economic Breeding Index (EBI)Ireland€80/tonne CO₂ (10% sub-index)~38% (fertility)Indirect via EBI-linked premiums
Nordic Total Merit (NTM)Sweden/Finland/DenmarkIncluded in health/longevity cluster~15–20%Partial (national programs)
Grazing MeritUSA (alt)$0Higher DPR floorNo
FrieslandCampina FoqusNetherlandsPriced into farm sustainability scoreStandard NLYes — avg €2.63/100kg paid in 2023

The Bullvine broke down exactly how that bonus lands — and why it doesn’t always show on the cheque — inFrieslandCampina Pays €2.63/100kg Sustainability Bonus.

Net Merit still values methane at $0, even after the April 2025 update. For a herd that sells embryos or bulls, or supplies a processor already thinking in carbon accounting, that mismatch matters. If your index assumes greenhouse gases cost nothing and your buyer’s long-term plan treats them as a real liability, you’re breeding into a gap that shows up somewhere — on your milk cheque, in your access to certain programs, or in how marketable your genetics are to buyers further down the sustainability path.

For a herd like this, that’s the final nudge. Nobody wants to discover in 2030 that their genetics were perfect for a 2023 milk cheque and badly misaligned with a carbon-graded market.

For the bigger picture on the 2025 base changes, see The Bullvine’s full breakdown of CDCB’s 2025 genetic base and merit indices update.

What This Means for Your Operation

  • Pull your last 12 months of cull records and sort them into “voluntary” and “involuntary.” If more than 70% of your culls are involuntary, and infertility, lameness, mastitis, and transition disease top the list, that’s a strong sign you need more genetic emphasis on health, fertility, and robustness — not just better management.
  • Ask your genetics adviser one specific question about Feed Saved. For the bulls you’re using, how much of their Feed Saved PTA is attributable to true feed intake data versus just smaller body size? If the answer leans heavily on body weight composite, you’re mainly selecting for smaller cows, not necessarily cows that convert feed better at the same size.
  • Compare your milk cheque to the index’s pricing assumptions. Net Merit’s updated weights lean toward butterfat and protein values that reflect recent U.S. component prices, with a heavier emphasis on fat than on protein. If your market pays more aggressively for protein, or your fat price has already slid from those highs — and it slid hard through 2025 — give Cheese Merit or a custom trait profile more weight alongside NM$.
  • Look at your 5-year system plan, not just this proof run. Are robots, grazing, or alternative housing in the pipeline? Start filtering now for the traits that matter in those systems — teat placement and udder depth for robots, fertility and feet for grazing — instead of assuming the national composite will automatically produce the right cows.
  • Do one “override the index” exercise in the next 30 days. For your next semen order, deliberately pick two or three bulls that aren’t in your usual top-10 NM$ list but rank strongly for the traits your own numbers say matter most. Track their daughters separately. See whether they match the kind of herd you actually want to milk.
  • Use your own numbers to set genetic red lines. If your records show that DAs, metritis, or down cows at certain levels destroy your margin, work with your adviser to set minimum thresholds for relevant traits — not just maximum NM$ points — and stick to them.

Key Takeaways

  • If your cull report is dominated by cows you “had to” ship, that’s not just a transition management story — it’s feedback on your breeding goal. Genetics and management pull on the same rope. Adjust only one end, and the herd won’t move very far.
  • Net Merit’s updated weights make it a solid national index, but it’s built on 2021–2024 economics with zero value on methane and limited direct emphasis on the traits that keep cows in a high-pressure system. Use it as a baseline, not a blind autopilot.
  • Your own data is the best starting point for adjusting or overriding the index. The three biggest leaks in your P&L — usually involuntary culls, fresh-cow disease, and labor around “problem cows” — should drive more of your trait emphasis than they probably do today.
  • If your processor, lender, or genetics customers are already talking about sustainability and 2030 targets, your breeding program is in the sustainability business whether you like it or not. The genetics you choose now will decide whether your herd fits those programs or constantly fights them.

A herd like this, the New York composite, still looks at NM$ every proof run. The difference, once the conversation goes honestly, is that it becomes one lens, not the whole picture. The sire list bends toward cows you can keep, and toward a milk cheque your buyer is likely to be writing in 2030, not 2019.

If you laid your last ten years of sire choices next to your last 12 months of cull reasons and vet bills, would those two stories look like they came from the same farm — or is it time to redraw your genetic target?

Run Your Numbers

Herd Health ROI Calculator — This article puts the cull-gate leak at up to $100,000 a year. Plug in your own culling rate, replacement heifer cost, and mastitis incidence to see what slowing those forced exits is actually worth on your herd — before you blame the breeding goal or the transition pen.

Complete references and supporting documentation are available upon request by contacting the editorial team at editor@thebullvine.com.

Learn More

The Sunday Read Dairy Professionals Don’t Skip.

Every week, thousands of producers, breeders, and industry insiders open Bullvine Weekly for genetics insights, market shifts, and profit strategies they won’t find anywhere else. One email. Five minutes. Smarter decisions all week.

NewsSubscribe
First
Last
Consent

A $45 Heifer Test Now Decides Who Qualifies for Gene-Edited Milk

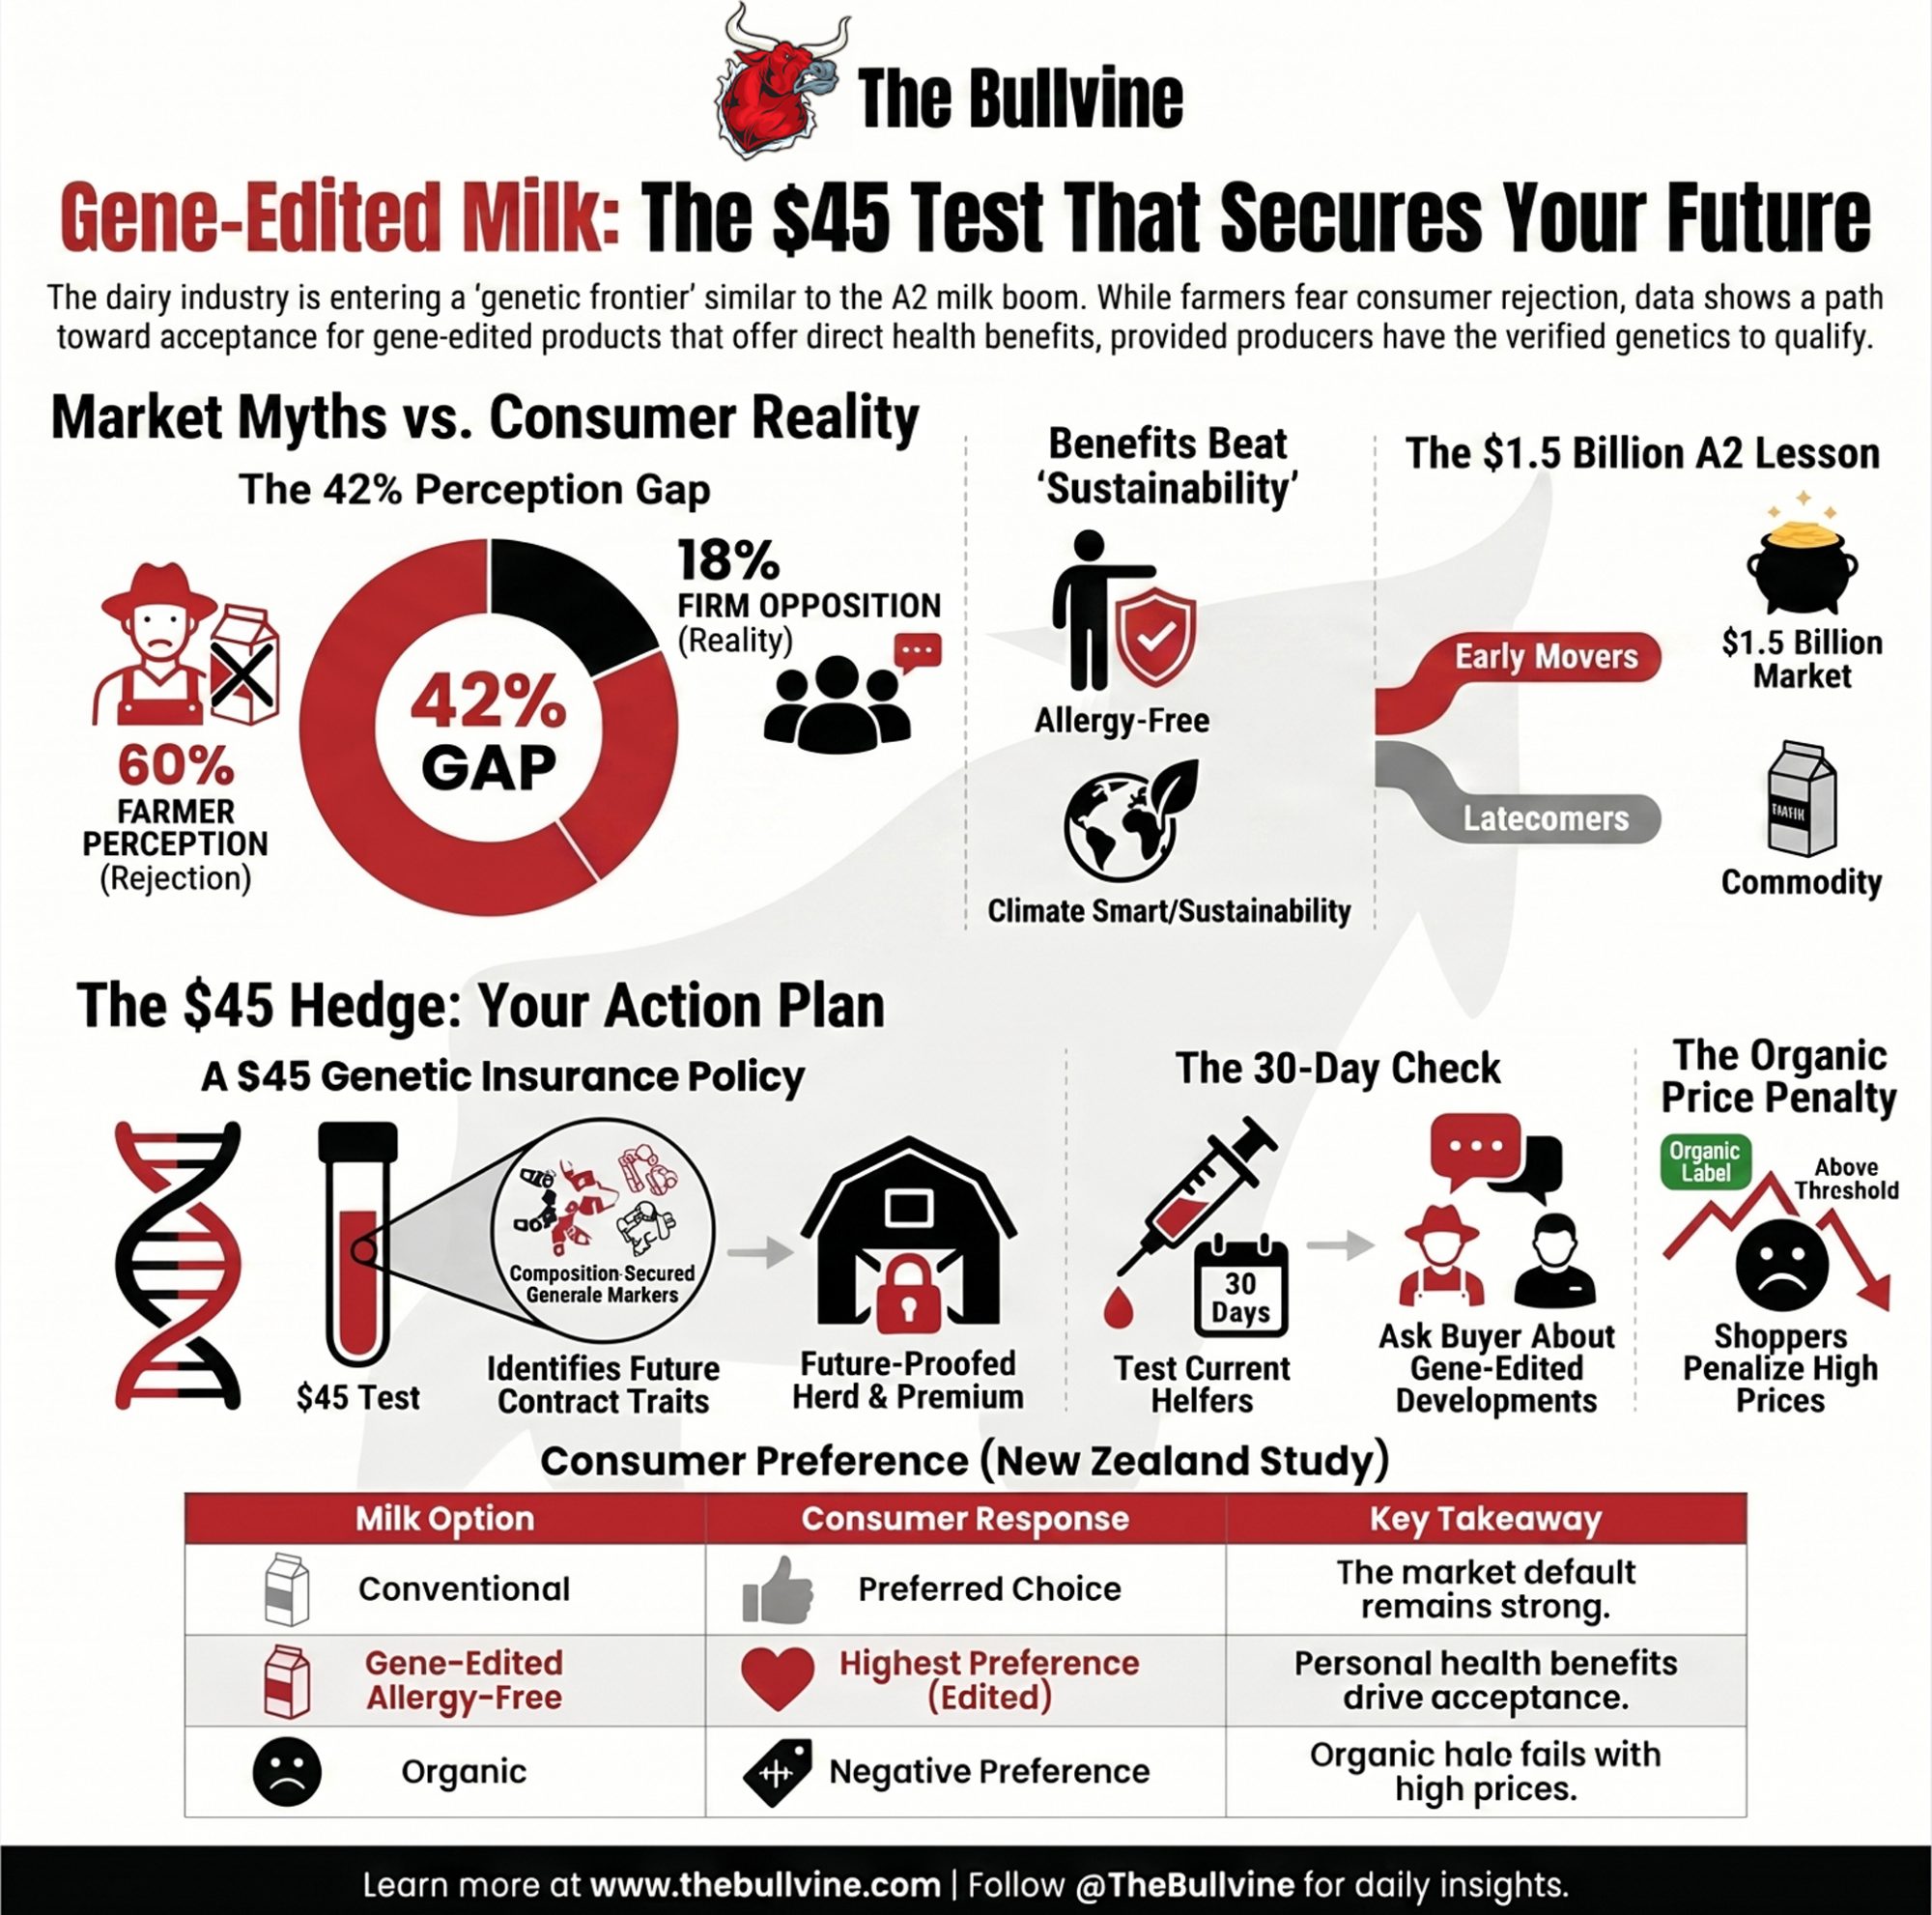
Farmers guess 60% of shoppers reject gene-edited milk. It’s 18%. And a $35–$45 genomic panel on this year’s heifers may decide whether you ever qualify to ship it.

Executive Summary: A University of Otago study put gene-edited milk in front of 1,096 shoppers, and the headline number flips a common assumption: firm opposition runs near 18%, not the 60% farmers tend to guess. The allergy-free version pulled hardest of any edited milk, while organic drew negative preference once the price climbed — a warning for anyone whose premium is the whole business case. On a 200-cow herd at 75 lbs/day, the spread between a $50/cwt grass-fed organic price and an $18.70/cwt mailbox price is roughly $1.64 million a year in gross revenue riding on how durable that premium stays. At the same time, Zoetis is buying Neogen’s GeneSeek labs for $160 million, pulling the testing pipes, the DWP$ index, and the processor relationships under one roof — the exact plumbing a gene-edited supply chain would run through. The A2 playbook still holds: early movers caught the margin, latecomers caught a commodity. Your cheapest hedge is a $35–$45 composition-focused genomic panel on this year’s heifers, so you actually know your casein and beta-lactoglobulin profile before a processor sets a spec. Read the full piece if you’ve got a breeding or contract call this season — it lays out four honest roads and a 30-day checklist.

gene-edited milk

Editor’s Note: The dairy operators in the opening are a composite scenario modeled on the documented experiences of producers who weighed early A2 adoption against staying conventional. It is not a single named individual. All companies, studies, prices, and dates below are real and sourced.

Back in 2012, plenty of sharp dairy operators looked at A2 milk and shrugged. The science was contested. The “easier on your stomach” claim sounded like health-food shelf talk, and serious producers had real work to do. By 2024, A2 had grown into a global category valued at roughly $1.5 billion, by one industry estimate, with some trackers putting it higher. The a2 Milk Company built that on controlled supply and verified genetics, rewarding producers who’d made the transition early, since qualifying milk required herds with the right A2 genetics. 

Nobody mailed the latecomers a notice explaining what they’d missed. They eventually noticed that certain buyers were paying certain suppliers more, and the door to qualify had already swung shut. That same setup is forming again around gene-edited milk — and this time there’s fresh, hard data telling you which way it breaks. Researchers in New Zealand just put gene-edited milk in front of nearly 1,100 consumers, and the results land squarely on a breeding decision you’re making this season. 

How a Skeptical Crop Became a Billion-Dollar Carton

The A2 story is worth a beat, because it’s the closest map we have to what’s coming. The a2 Milk Company started as a contrarian bet that a single protein variant — A2 beta-casein instead of A1 — would matter to shoppers. For years, it was a curiosity in the dairy case. Then it wasn’t.

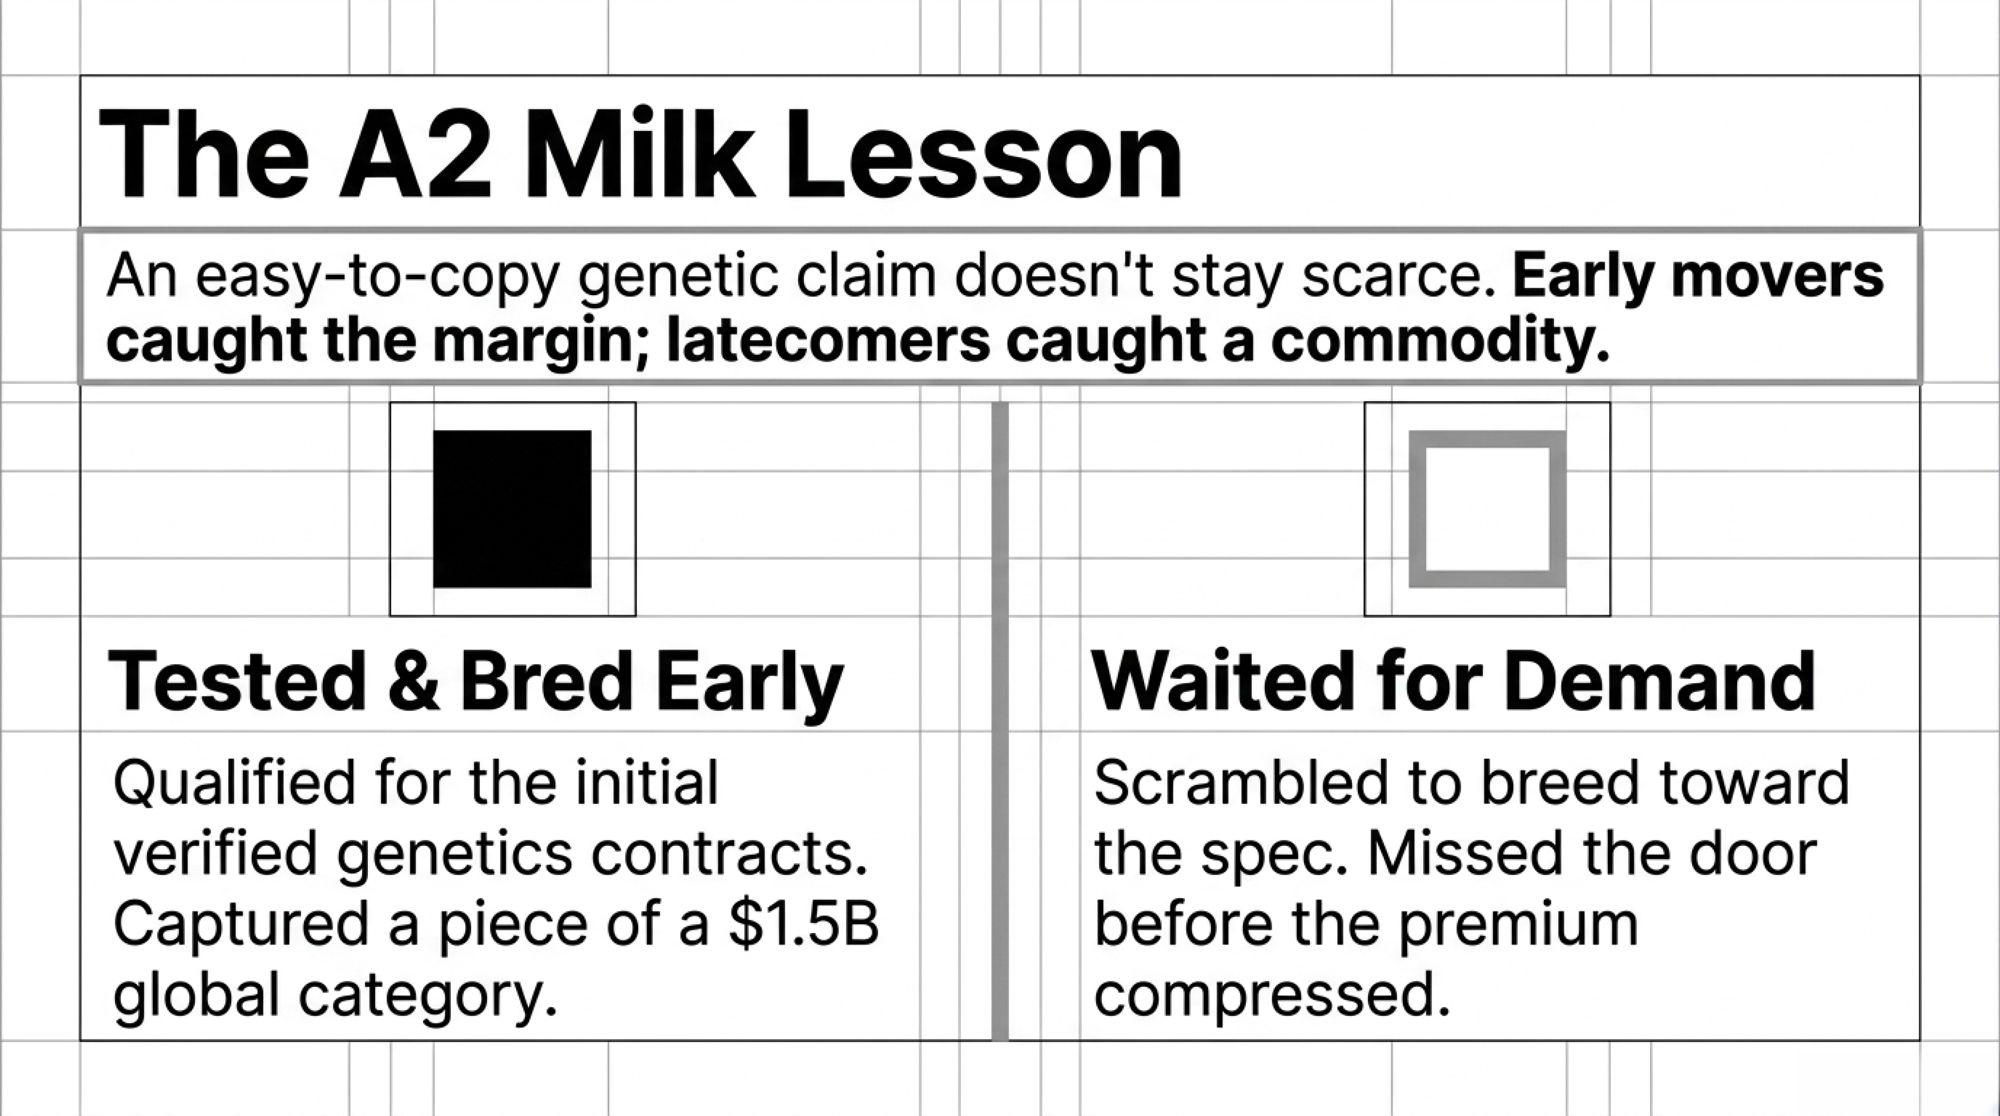
By 2024, the category cleared roughly $1.5 billion globally, and the supply model that got it there mattered as much as the marketing. Qualifying milk required herds with verified genetics. The farms that tested and bred early were the ones holding the contracts when demand arrived. 

But here’s the catch the A2 run also taught — and it’s the part worth carrying forward: an easy-to-copy genetic claim doesn’t stay scarce. As The Bullvine has noted, once the major studs started selecting for A2, “the ‘A2 advantage’ was never a sustainable moat” — any farm could test and qualify, and as more piled in, the premium compressed. So the lesson cuts both ways. Early movers caught the margin; latecomers caught a commodity. That’s the pattern to keep in your head as you read the rest of this — not because gene-edited milk is guaranteed to follow it, but because the plumbing being built right now looks awfully familiar. 

What the New Zealand Study Actually Found

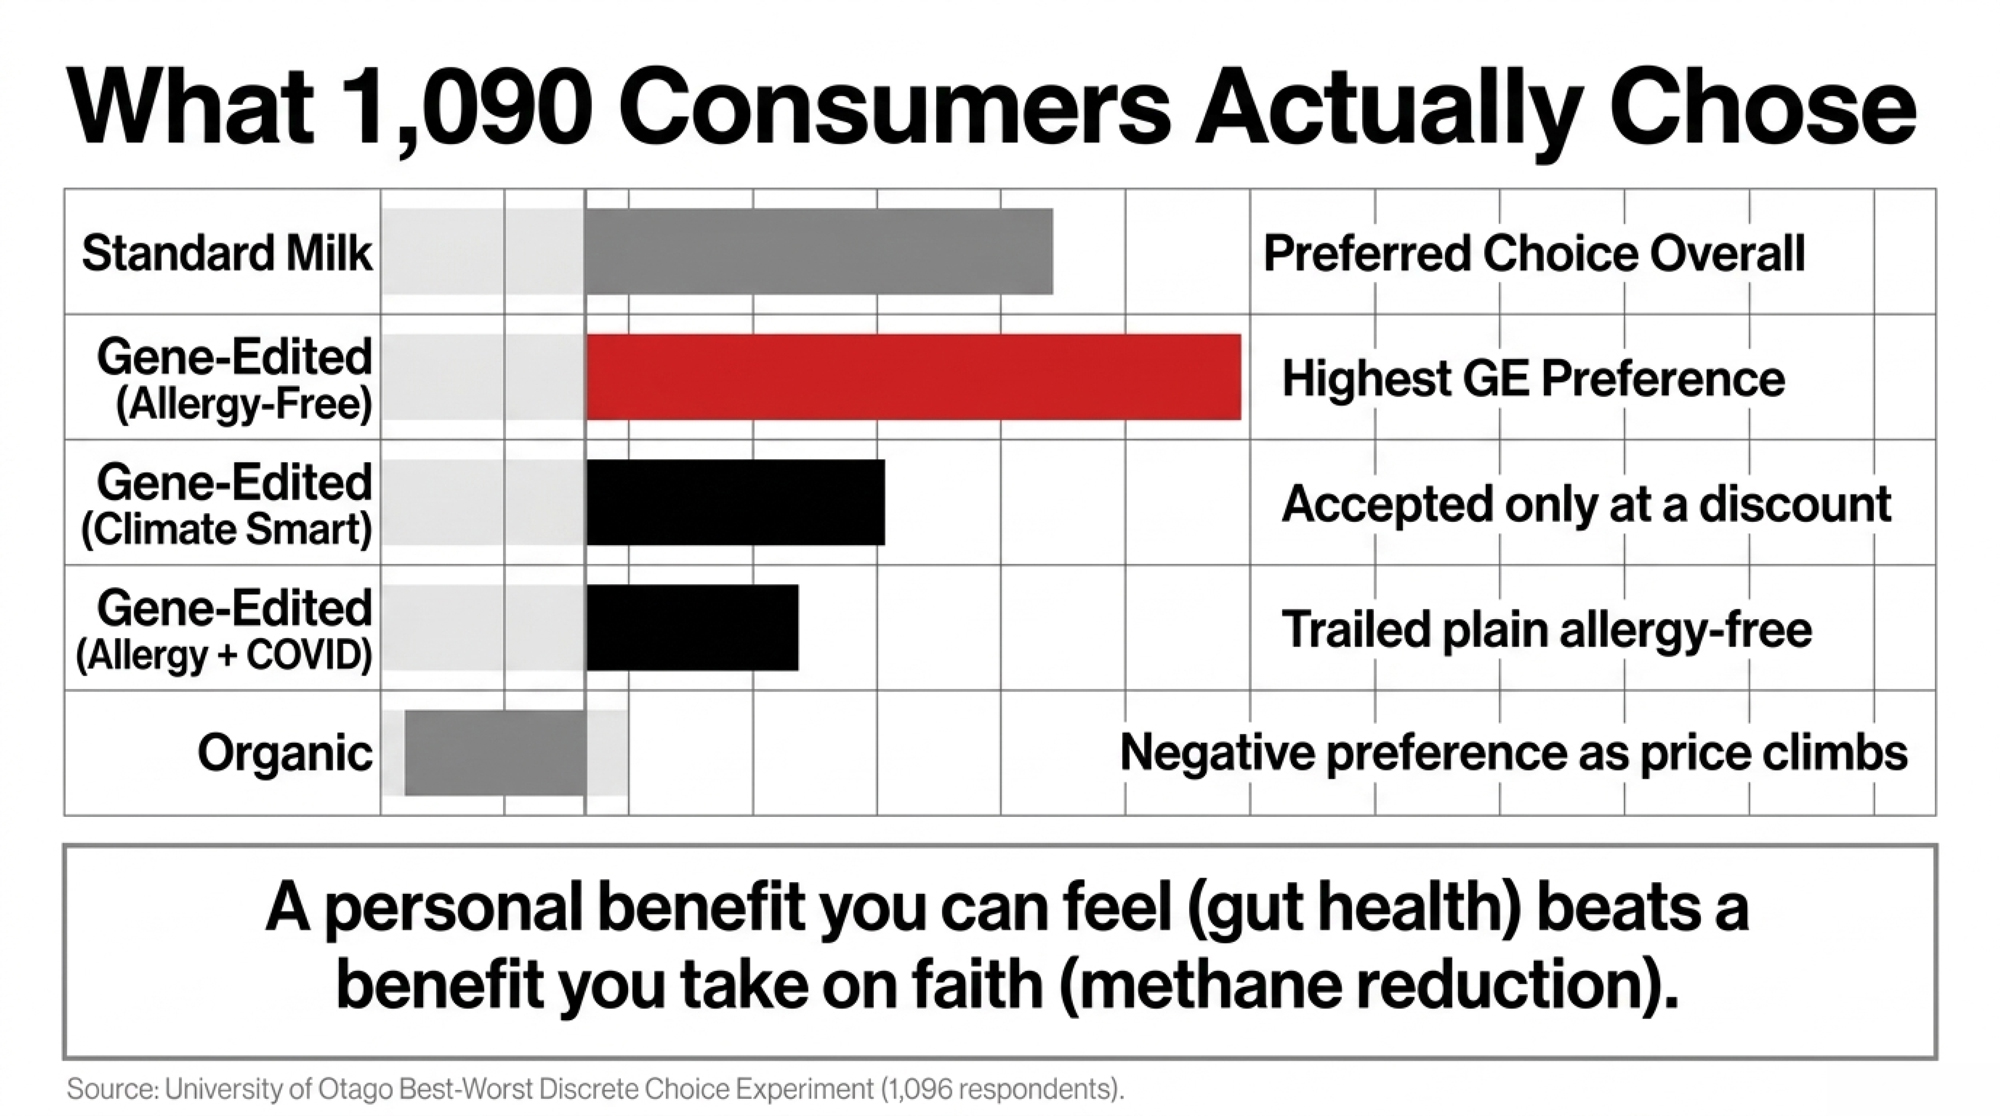
This wasn’t an opinion poll asking whether people “support” gene editing in the abstract. The study — a University of Otago Best–Worst Discrete Choice Experiment with 1,096 respondents — simulated a shopping trip in which people chose among standard milk, organic milk, and three gene-edited “Climate Smart” versions at varying prices. 

Here’s how the five options sorted out:

Milk optionHow shoppers respondedWhat it tells you
Conventional (standard)Preferred choice overall The default is still the default
Gene-edited, allergy-freeHighest preference of the three edited versions A personal benefit you can feel moves people
Gene-edited, standard “Climate Smart”Accepted only at a price advantage Sustainability alone won’t carry a premium
Gene-edited, allergy-free + COVID protectionTrailed the plain allergy-free version Stacking a second novel claim didn’t help
OrganicNegative preference at every price point, steepest at average and above-average pricesThe halo isn’t bulletproof once price climbs

Standard milk won the overall vote. No shock there. But two findings crack the story open. Consumers treated Climate Smart milk as a real option only when it offered a price advantage, and among the three edited versions, the allergy-free one drew the highest preference. The authors didn’t hedge on what drives that. Writing in The Conversation, they concluded there’s “a potential pathway towards greater consumer acceptance, particularly when innovations provide direct and significant benefits instead of vague promises of future sustainability”. In plain terms, “this milk won’t wreck your gut” beats “this milk lowers methane” because one benefit you can feel, and the other you take on faith. 

That organic line in the table should make any organic producer sit up. Shoppers in this experiment didn’t reward the label — they penalized it once the price climbed. That’s one survey in one market, not gospel. But it cuts hard against the assumption that the organic halo is bulletproof. 

There’s real science under that allergy-free claim. CRISPR knockout of the beta-lactoglobulin gene — a protein implicated in many milk allergies — can produce milk far less likely to trigger a reaction. Keep one thing straight when you size that market, though: milk allergy and lactose intolerance aren’t the same condition, and this edit targets the protein that drives the allergic response, not the lactose that troubles a much larger group. Cow’s milk protein allergy is the most common food allergy in infants, but affects a relatively small share of the general population — developed-country prevalence studies range from roughly 0.5% to 3.8%. So the addressable market is real, but it’s a defined clinical group, not “everyone who feels bloated.” 

FactorCow’s Milk Protein Allergy (CMPA)Lactose Intolerance
MechanismImmune response to proteins (casein, beta-lactoglobulin)Enzyme deficiency (lactase); can’t digest lactose sugar
Population affected0.5%–3.8% (developed countries); most common in infants~65–70% of adults globally have some degree of reduction
GE intervention target✅ Yes — BLG knockout addresses protein trigger❌ No — protein edit doesn’t affect lactose content
Addressable market sizeDefined clinical group; real but smallerMuch larger; already served by lactose-free products
Premium pricing logicJustifiable for a clinical need; niche but defensibleCrowded market; commodity pricing pressure
Shopper confusion riskHigh — “allergy-free” easily misread as lactose-friendlyMessaging must be precise or it creates backlash

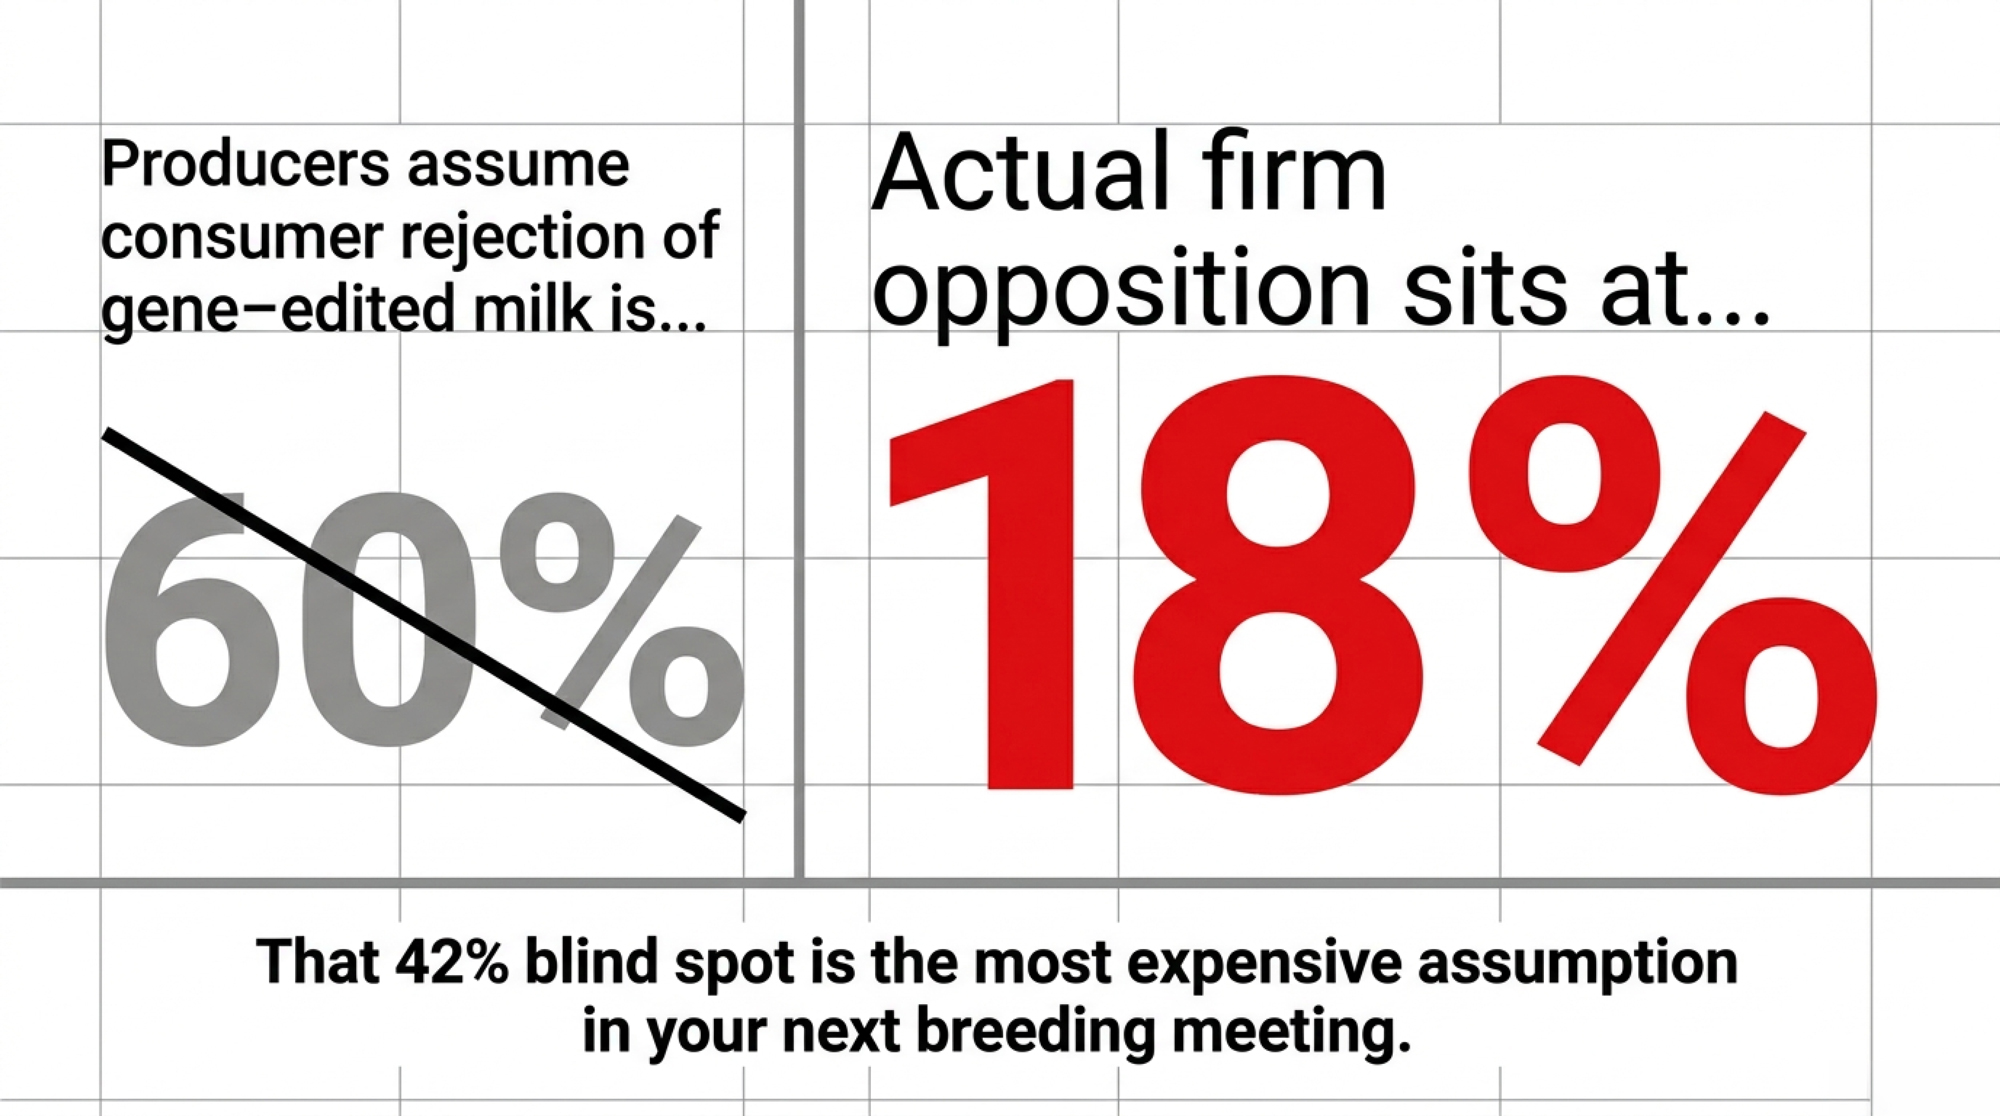
One gap is worth sitting with. Dairy farmers tend to estimate that around 60% of consumers reject gene-edited products. The research puts firm opposition closer to 18%. That spread — between what producers assume and what shoppers actually feel — might be the most expensive blind spot in your next breeding meeting. 

Who’s Actually Exposed Here — and Who Isn’t

The farms most at risk from this shift aren’t the obvious ones. The values-driven organic producer — the one whose customers buy organic because it’s part of who they are — is largely insulated. That buyer isn’t switching for a molecular benefit claim, no matter how slick the marketing.

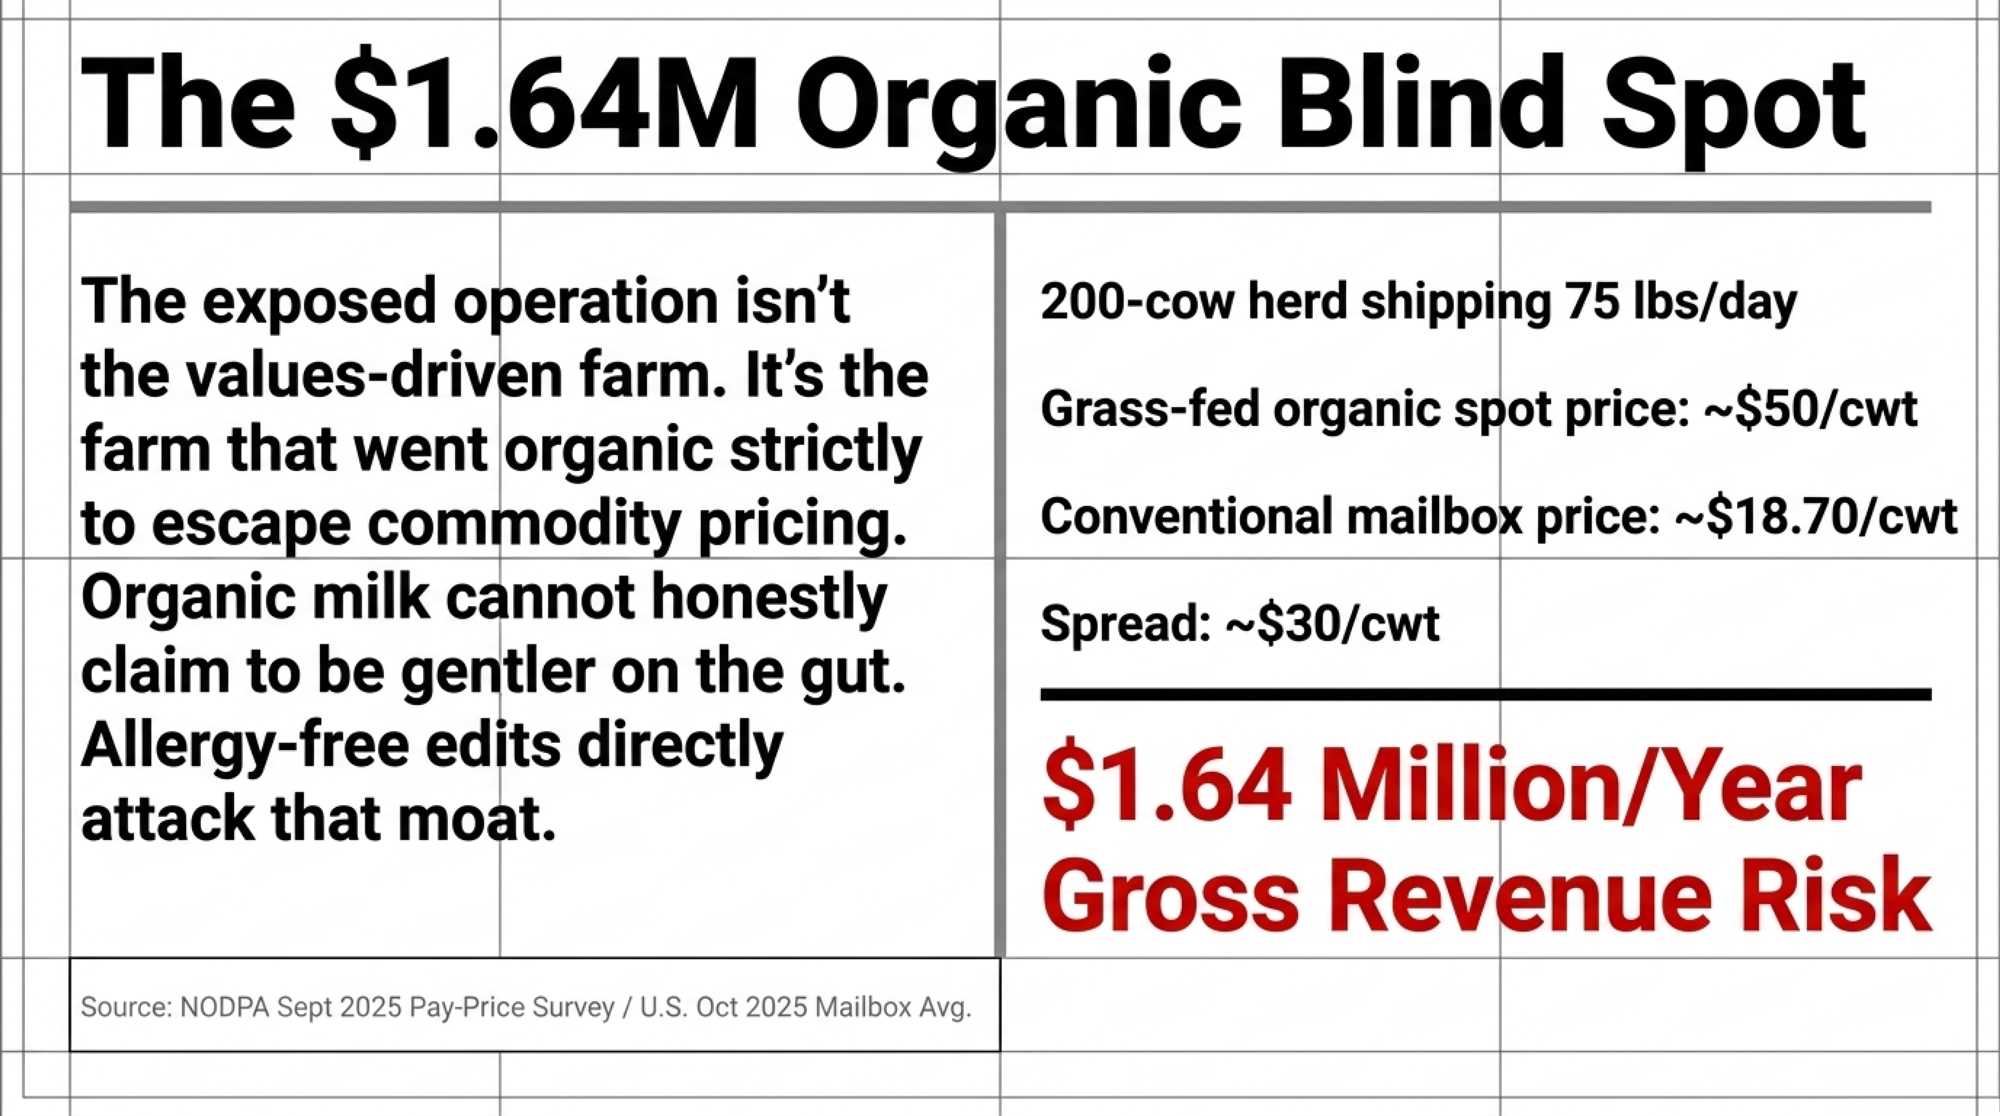
The exposed operation is the one that went organic mainly to escape commodity pricing. That farmer chased a premium, and the premium is real. As of NODPA’s September 2025 pay-price survey, grass-fed organic premiums ran from about $36/cwt to $52/cwt depending on the buyer, with spot organic milk in the short Northeast market topping $50/cwt. That premium is the whole business case. And it rests on a consumer perception that gene-edited allergy-free milk can quietly chip away at — because organic has never been able to honestly tell a lactose-sensitive shopper it’s gentler on their gut. 

Run rough barn math on the size of that bet. Take a 200-cow herd shipping 75 lbs/day — that’s about 54,750 cwt a year. The gap between a strong grass-fed organic price near $50/cwt and an October 2025 U.S. average mailbox price of $18.70/cwt runs north of $30/cwt. At a $30/cwt spread, that’s roughly $1.64 million a year in gross milk revenue riding on how durable the organic premium stays. That’s not a number to panic over. It’s a number to stress-test before your next contract renewal. 

How Much Does Sitting Still Actually Cost You?

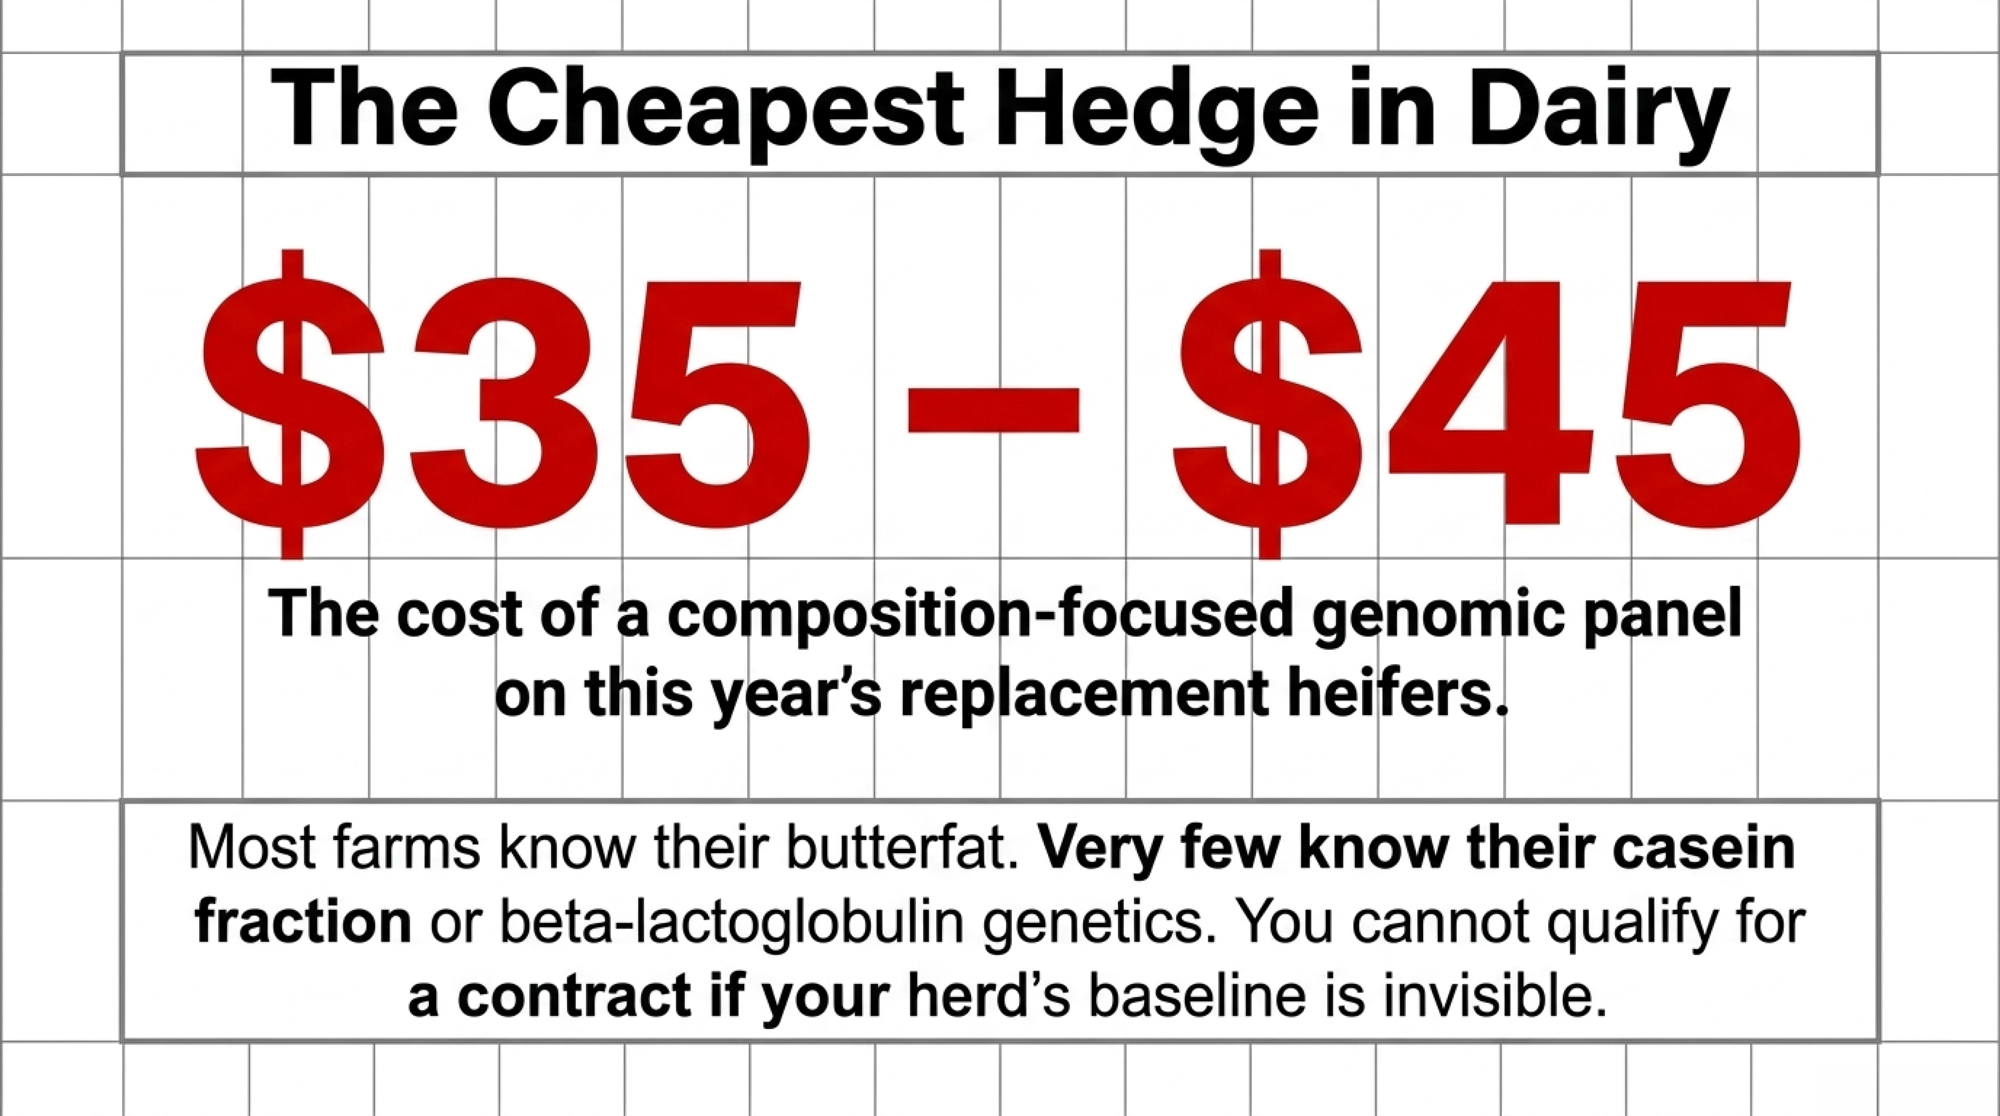
Almost nothing to start moving — and that’s the point. The first real action here runs about $35 to $45 per head: a genomic panel on this year’s replacement heifers that covers milk-composition traits, not just standard production indices. Most farmers can rattle off their herd’s butterfat and protein percentages. Far fewer can name their casein fraction profile or their beta-lactoglobulin genetics — the exact traits a differentiated supply chain would screen for. 

Compare that few-dollars-per-head test to the cost of being invisible when a processor shows up with a verified genetic spec and a qualification threshold, the way A2 contracts did. Those deals don’t ask whether you’d like to join. They sign with the farms that already qualify. The operation scrambling to test and breed toward the spec after the contract’s announced is already a breeding cycle — call it 18 months — behind the farms that saw it coming. 

The Overlooked Layer: Where the Supply Chain Actually Gets Built

The piece almost nobody’s talking about out loud is where this supply chain is getting built — down at the genomics layer, where most farmers never look.

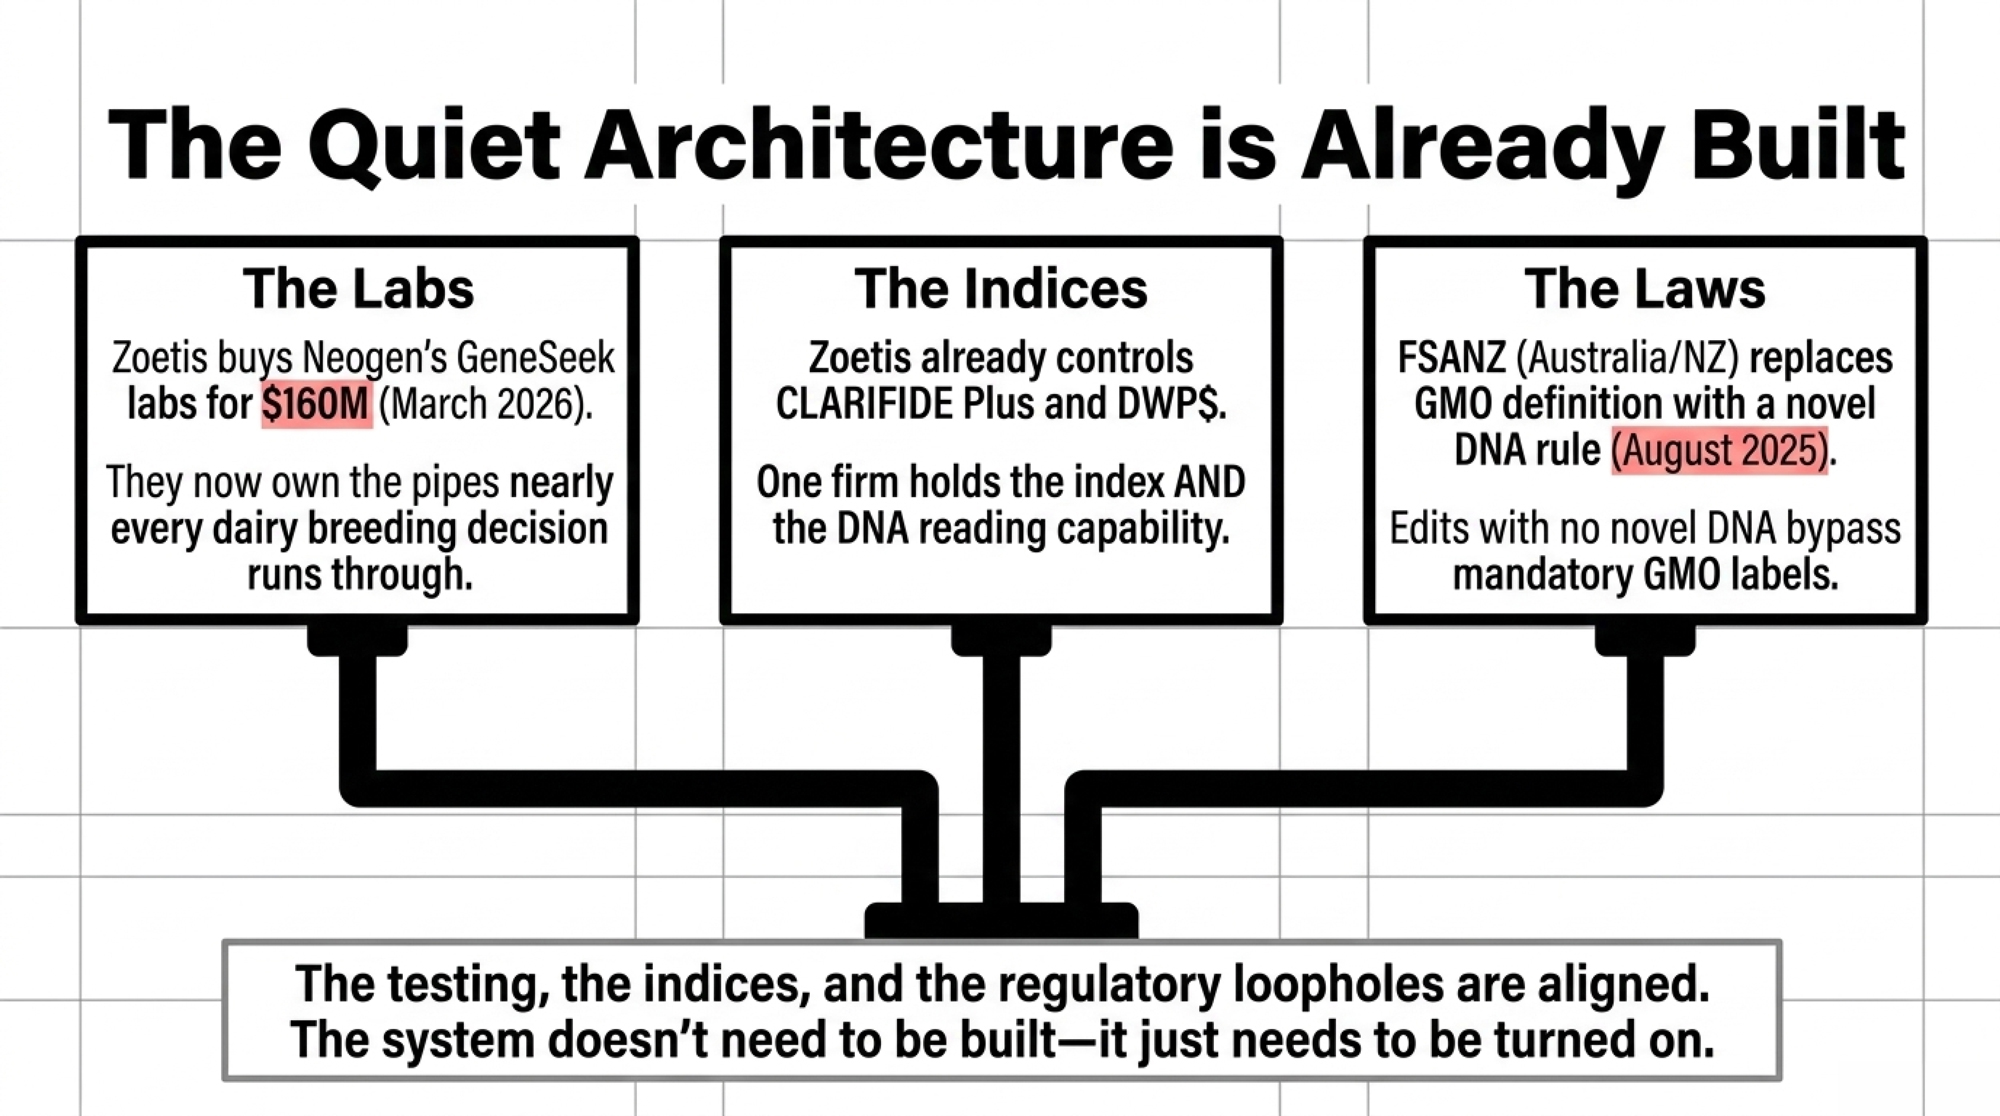
On March 2, 2026, Zoetis announced a definitive agreement to buy Neogen’s animal genomics business, including its GeneSeek laboratories, for $160 million, with the deal expected to close in the second half of 2026. That’s not a company buying a testing service. It’s a company buying the pipes nearly every breeding decision in dairy runs through — five labs across the U.S., Brazil, Australia, China, and the U.K., and, per prior reporting on the deal, roughly $90 million in annual genomics revenue. Zoetis already runs CLARIFIDE Plus and the Dairy Wellness Profit Index (DWP$), which it expanded in April 2026 with new traits. So one firm increasingly holds both the index that shapes how animals get selected and the labs that read the DNA underneath.

Here’s why that matters. A company holding the testing, the index, and the processor relationships wouldn’t need a gene-edited dairy program today to be positioned for one tomorrow — though Zoetis has announced no such plans. Whether any single firm intends to go there or not, that combination of assets is what a future gene-edited supply chain would likely run through. Semex and Recombinetics have been partnering on polled gene editing since 2018 — that work didn’t die when the headlines faded. It went quiet and waited for the rules to catch up. 

And the rules are catching up fast. New Zealand’s effective gene-tech ban lifted at the end of 2025. The UK’s Precision Breeding Act is now in force, and the EU moved toward a more permissive framework in 2025. The one most farmers haven’t clocked: in 2025, Food Standards Australia New Zealand replaced its old process-based GM definition with an outcome-based one built around “novel DNA” — the board approved the change in June, and food ministers gave final approval in August 2025. Under that rule, a gene-edited food that introduces no novel DNA isn’t classified as GM — and doesn’t carry a mandatory “genetically modified” label. That’s the regulatory hinge the whole consumer-acceptance question swings on, because a beta-lactoglobulin knockout could reach the shelf without the label baggage that sank first-generation GMOs. 

Options and Trade-Offs for Your Operation

StrategyBest FitUpfront CostBreeding Lag RiskPremium Capture PotentialKey Dependency
Early MoverAlready genomic testing; chasing component premiums$35–$45/head panel nowLow — 0 cycles behindHigh — catches first-wave contractsRegulatory timeline; retail uptake speed
Fast FollowerSolid balance sheet; risk-averse$35–$45/head + higher sire cost laterHigh — 18+ months behindModerate — pays margin to early moversSpeed of decision when signal arrives
Niche / DirectSmaller ops with artisan or local marketsLow genomic investmentMinimal — not competing on specVariable — relationship-dependentChannel loyalty; scale ceiling
Deliberate WaitWeighed the options; decided to holdNone todayGrows with each cycleLow near-term; could re-enter at costHonest reassessment at each contract renewal

There’s no single right answer here. There are a few honest roads, and each costs you something. Find the one that matches how you actually run your operation.
Option 1 — Position early as a potential supplier

Best fit: You already genomic-test and chase component or differentiated premiums. What it requires: Knowing your herd’s protein genetics, not just its butterfat. The risk: You invest in readiness for a market whose commercial timeline is still a few years out, and the regulatory or retail picture could shift under you. The FSANZ “novel DNA” reframing makes this less of a gamble than it looked a year ago — but it’s not a sure thing yet. 
Option 2 — Wait deliberately as a fast-follower

Best fit: Your balance sheet can’t carry timing risk, and you’d rather let others prove the category. What it requires:Accepting that you’ll likely pay someone else’s margin to get in later. The risk: Breeding lead times mean “later” can land you 18 months or more behind by the time you decide to move. 

Option 3 — Carve out a niche the genomics giants can’t reach

Best fit: Smaller operations with local, direct, or artisanal channels. What it requires: A relationship-based market instead of a commodity one. The risk: You give up scale — but you also shed the exposure to the consolidation game entirely. 

Option 4 — Do nothing, but choose it on purpose

Best fit: Anyone who’s genuinely weighed the above and decided to hold. What it requires: An honest look, not an avoided one. The risk: The danger was never the farmer who weighed this and decided to wait. It’s the one who never looked at all.

The one move worth making in the next 30 days costs the least: book that composition-focused genomic panel on this cycle’s heifers at $35–$45 a head, and ask your milk buyer one flat question — “Are you watching gene-edited dairy product development, and who do you call first when it goes commercial?” The answer costs you nothing and tells you whether your relationship with the processor is an asset or a liability in this shift. 

Is Your Herd’s Genetic Strategy Already a Cycle Behind?

Maybe. The honest answer depends on data that most farms haven’t bothered to pull, because it hasn’t mattered commercially until recently. If you can’t name your herd’s casein and beta-lactoglobulin profile right now, you’re not positioned — you’re hoping. 

The breeding moves that build a real position aren’t exotic. Select for milk-protein composition. Prioritize health traits. Keep detailed genomic records, and build an actual relationship with a processor who’s watching this space. None of that requires a single gene-edited animal today. All of it builds the foundation to qualify when clearance lands — and it keeps your options open if you’d rather wait and watch. There’s a quieter cost worth checking, too: read the data-ownership terms in your genomic-testing agreement and your co-op membership before you assume your herd data is yours to direct. That data feeds the proprietary indices — and eventually the product specs — being built right now. 

Your Next 30 Days: A Working Checklist

Before this drops off your radar, here’s the sequence — none of it commits you to a gene-edited animal, and all of it keeps your options open:

  1. This week — pull your numbers. Find out whether you already have casein and beta-lactoglobulin data for your herd, or if you’re starting from scratch. 
  2. Within 30 days — book the panel. Order a composition-focused genomic panel for this cycle’s replacement heifers, at roughly $35–$45 per head. 
  3. Within 30 days — ask your buyer the question. “Are you watching gene-edited dairy product development, and who do you call first when it goes commercial?” The answer tells you where you stand.
  4. Before your next contract renewal — read the fine print. Pull your genomic testing agreement and co-op data terms to know who actually controls your herd data. 
  5. Then decide on purpose. Pick your road from the four options above — early mover, fast-follower, niche, or deliberate wait — and write down why.

Key Takeaways

  • If your organic premium is the whole business case rather than a loyal values-driven base, stress-test it before your next contract renewal — the study shows shoppers penalized organic once the price climbed. 
  • A $35–$45 genomic panel on this cycle’s heifers is the cheapest hedge there is. Run it now so you know your casein and beta-lactoglobulin profile before a processor ever sets an allergy-free spec. 
  • Stop budgeting for 60% consumer rejection of gene-edited milk when firm opposition sits closer to 18% — that gap could be the costliest wrong assumption in your breeding plan. 
  • Remember the A2 timing lesson: the margin went to farms that qualified early, not the ones who waited for the contract to be announced. 

So where does your herd actually sit — not philosophically, but genetically? If a processor walked onto your operation next year with a verified allergy-free milk spec and a qualification threshold, would your animals make the cut, or would you be starting the transition from zero?

That’s the question worth carrying into your next breeding meeting. We’re building out the full supplier-positioning model — the real cost-per-cwt of moving early versus following late, broken down by herd size — in an upcoming Bullvine deep dive. That’s where the numbers that fit your balance sheet actually live.

Run Your Numbers

Genomic Testing ROI Calculator — That $35–$45-per-head panel is the article’s whole argument. Run it through the Genomic Testing ROI Calculator to pressure-test whether testing this cycle’s heifers actually pencils on your replacement costs, your value spread, and your beef-on-dairy market — before a processor ever sets a spec.

Complete references and supporting documentation are available upon request by contacting the editorial team at editor@thebullvine.com.

Learn More

The Sunday Read Dairy Professionals Don’t Skip.

Every week, thousands of producers, breeders, and industry insiders open Bullvine Weekly for genetics insights, market shifts, and profit strategies they won’t find anywhere else. One email. Five minutes. Smarter decisions all week.

NewsSubscribe
First
Last
Consent

Kooima Called Beef-on-Dairy a Packer’s Dream. Your 2027 Heifer Pen Just Sent the $117,000 Bill.

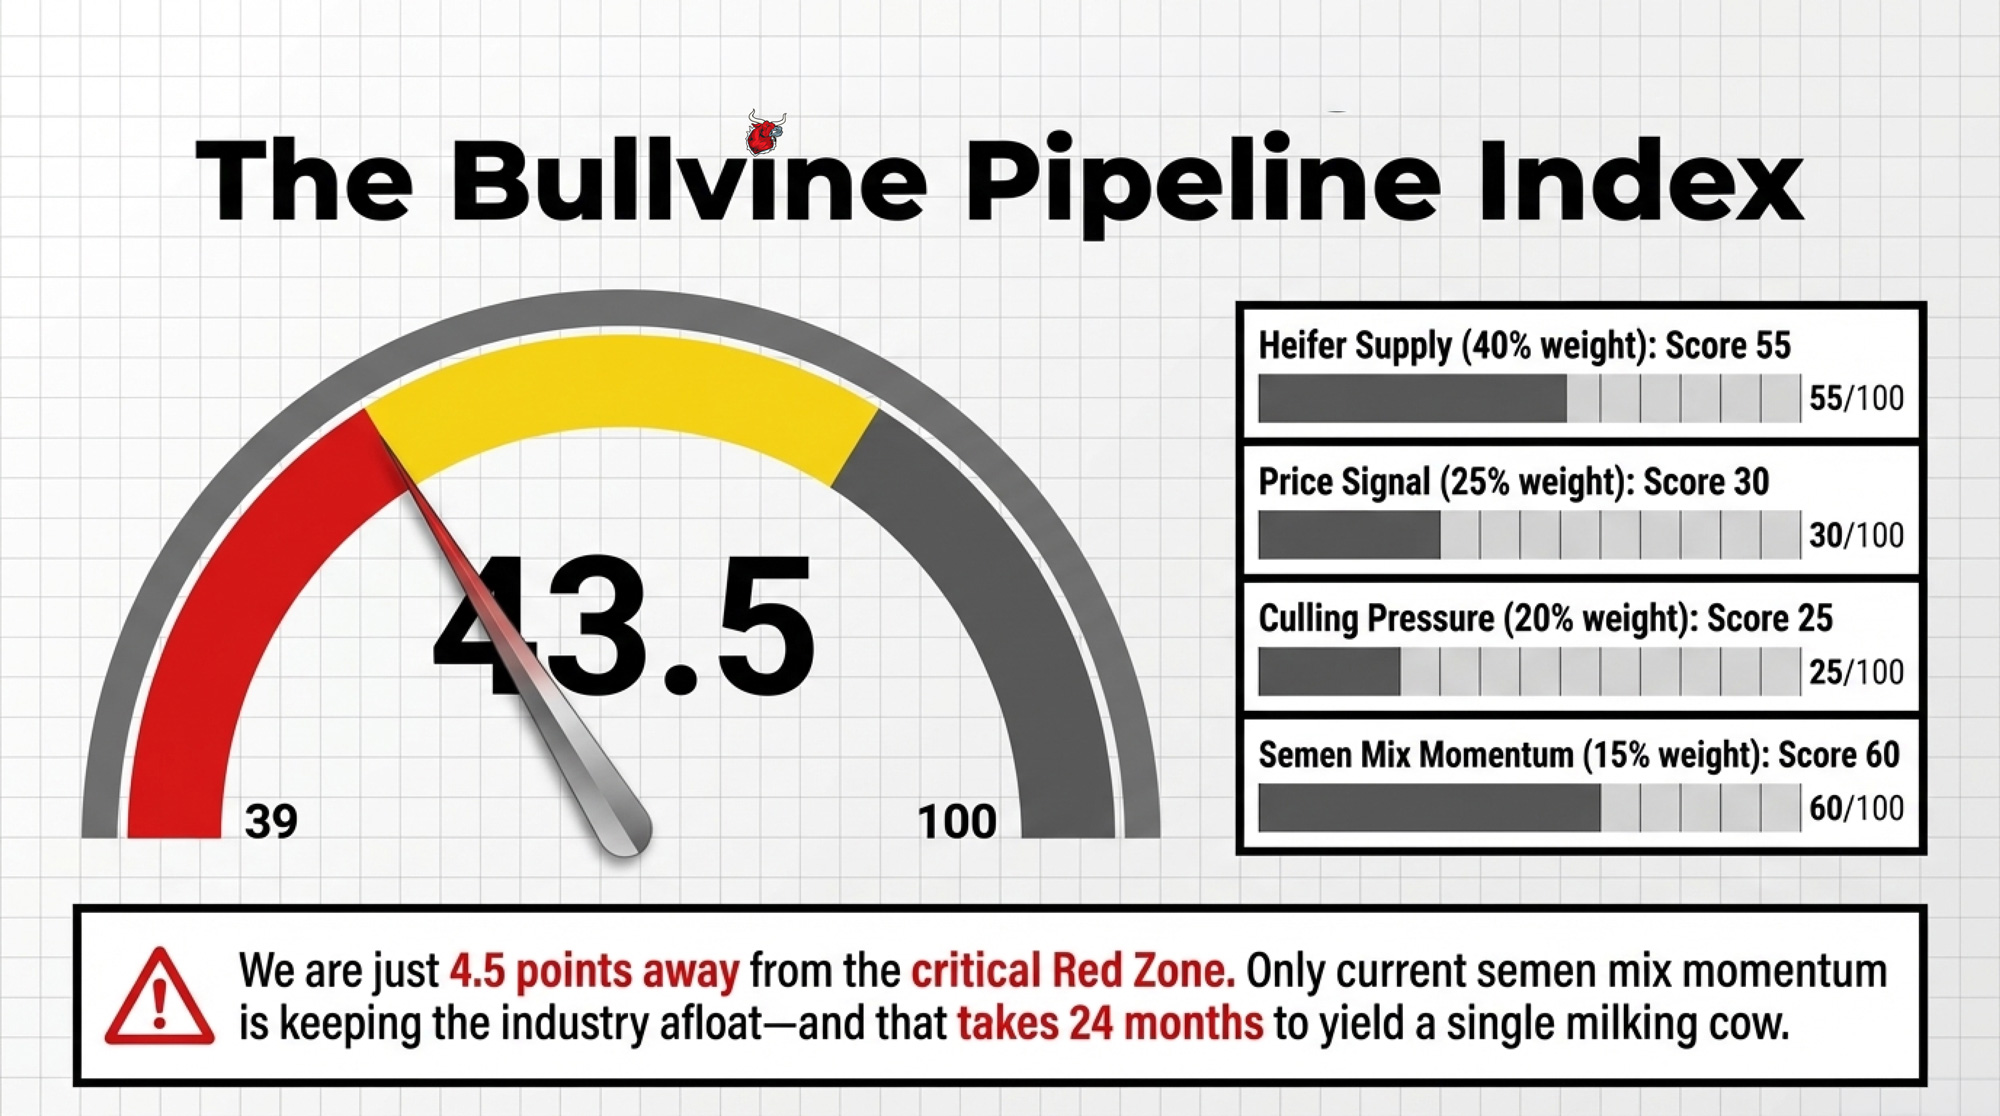
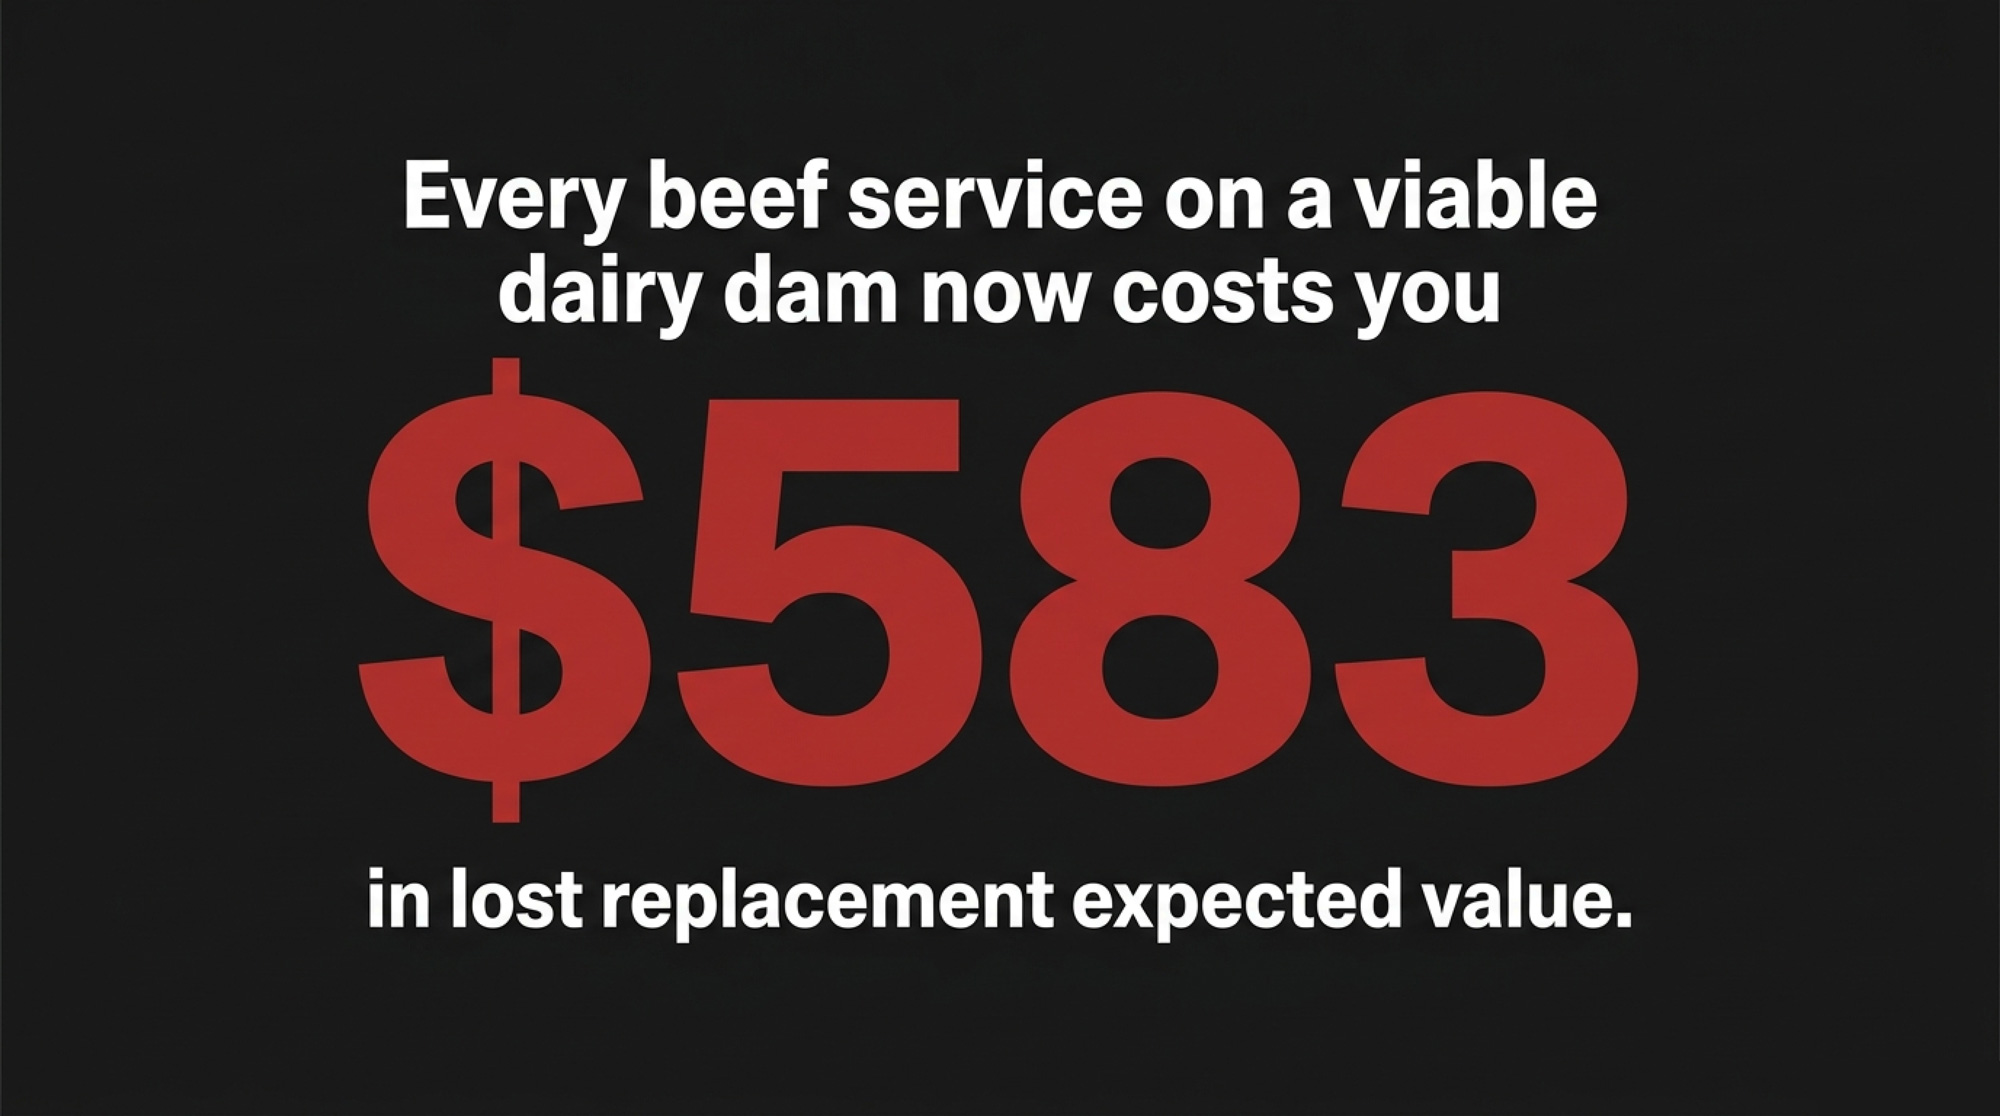
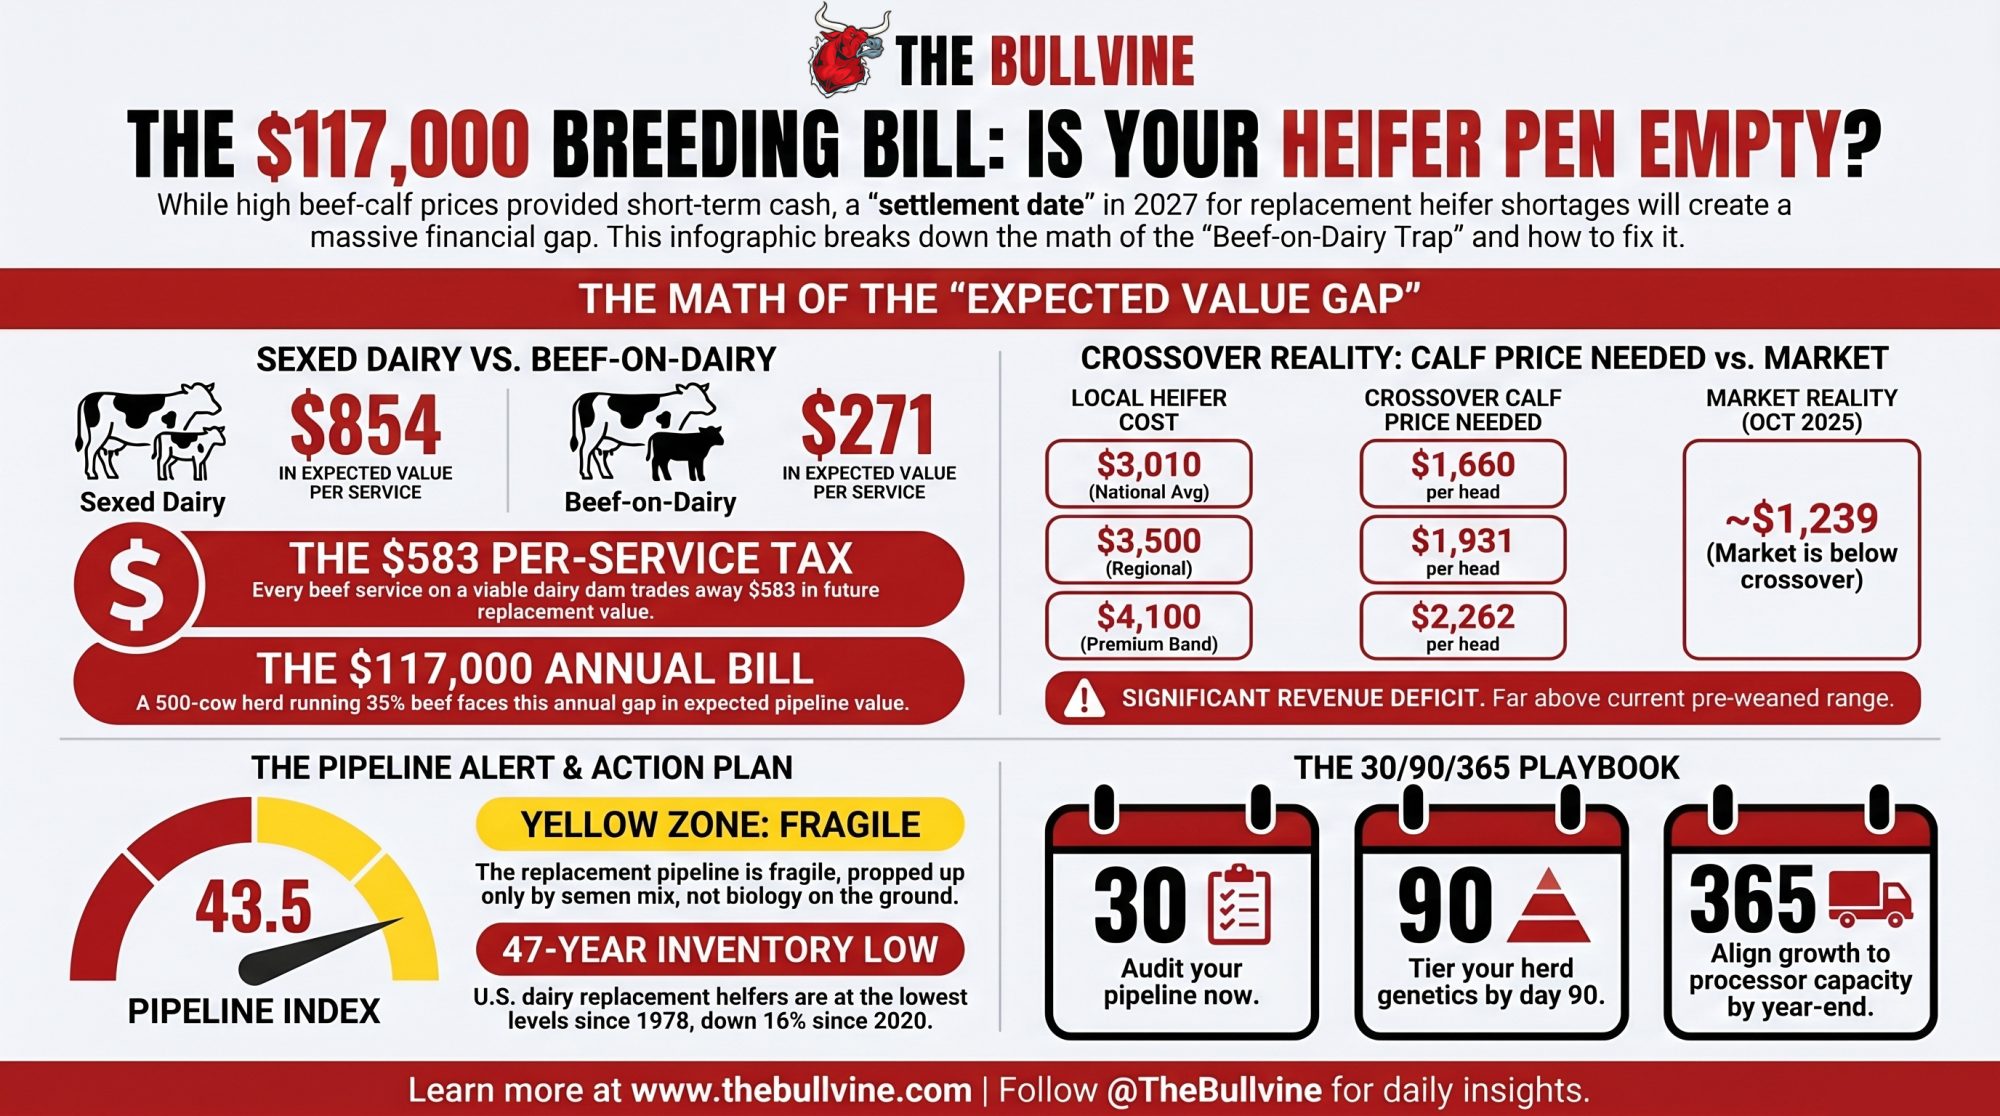
500-cow Panhandle herd, 35% beef through 2023–24. At a $3,010 replacement and a $500 calf, every beef service on a viable dairy dam now costs $583. Pipeline Index: 43.5. Yellow Zone.

Executive Summary: A 500-cow Panhandle dairy that ran 35% beef-on-dairy through 2023 and 2024 is staring at a $117,000-a-year expected-value gap on its 2026 breeding sheet, with every beef service on a viable dairy dam now costing $583 against a $3,010 national replacement heifer (USDA NASS, July 2025) and a $500 crossbred calf. The Bullvine Replacement Pipeline Index just printed 43.5 — Yellow Zone, 4.5 points from Red — carried almost entirely by semen-mix momentum, not biology on the ground. The math is blunt: sexed dairy delivers $854 per service in expected value, beef-on-dairy delivers $271, and crossbred calves don’t pencil against sexed dairy until they clear $1,660/head at a $3,010 heifer. Settlement date is Q1 2027, when a 27%-turnover herd projects 87 heifers to first calving against 135 needed — 48 head short at spot prices that already ran ,110 in October 2025. The October 2025 correction (/cwt off CME December live cattle in twelve business days, calves from ~,400 to ,239) proved calf revenue and Class III aren’t independent streams — same operation, overlapping signals, correlated downside. Lenders are starting to model this; producer balance sheets generally haven’t caught up. If you ran 30%+ beef the last two cycles, the 30/90/365 playbook inside (plus the LRP Unborn Calves window and the $1,660/$1,931/$2,262 crossover prices) is the math before the heifer pen comes up short.

beef-on-dairy 2026

An archetypal 500-cow Panhandle dairy that ran 35% beef-on-dairy through 2023 and 2024 is looking at a 7,000-a-year expected-value gap on its 2026 beef-on-dairy breeding sheet — math anchored on a late-October 2025 crossbred calf trough near ,239/head reported across regional auction channels and USDA NASS’s July 2025 national replacement milk-cow price of ,010/head. Brad Kooima of KKV Trading has characterized beef-on-dairy, in effect, as a packer’s dream in recent industry commentary: known genetics, predictable gain, a schedulable 341-day pipeline from calf to kill. The Bullvine Replacement Pipeline Index just named the other side of that trade.

43.5 on the Index as of April 2026. Yellow Zone, 4.5 points from Red. Roughly 4.29 million dairy heifers projected by Bullvine’s model to enter the 2027 milking string from 2025 breedings, against a U.S. dairy cow herd near 9.35 millionhead per USDA’s January 1, 2025 Cattle Inventory, and more than billion in new processing steel rising across 19 states per industry build-out tracking.

Both reads are true. For herds that ran 35%+ beef the last two years, leg two of that trade hasn’t settled.

This is a beef-on-dairy 2026 breeding story. It reads like a credit memo.

Why the Packer’s Dream Is Only Half the Trade

Kooima’s framing points at a real structural gain. Known genetics. Predictable gain. A 341-day pipeline is something native beef never offered the packer-feeder complex at this volume.

CoBank Knowledge Exchange analysis of USDA AMS slaughter-cattle auction data covering March 2024 through February 2025 pegged beef-on-dairy animals at $2,485 at slaughter, native beef at $2,385, and pure dairy at $2,210. Feeder-to-fat value retention ran 81.3% for beef-on-dairy on a $/cwt basis, 72.1% for pure dairy, 69.6% for native beef. Ohio State and Michigan State feedlot trials have documented lower cost of gain on beef-on-dairy steers versus Holsteins, with the spread varying by ration and finishing system.

That efficiency is real. It’s not a packer profit story either. Drovers’ Sterling Marketing Beef Cutout and Packer Margin Tracker has shown deeply negative packer margins through most of 2025 and into spring 2026. Tyson Foods has disclosed materially elevated cattle procurement costs across fiscal 2025 in public filings and announced the closure of its Lexington, Nebraska beef plant.

So where did the supply-chain value come from? NAAB’s 2025 Year-End Report, released March 2026, puts domestic beef-on-dairy semen at 8.1 million units, on top of 10.6 million sexed dairy and 6.0 million conventional. Every beef service on a cow that could carry a viable dairy pregnancy is a dairy heifer that won’t walk into a milking string in 2027.

Related: Bullvine’s April 22 Panhandle Springer Tax feature.

What Does a $3,010 Replacement Heifer Mean for a 500-Cow Panhandle Herd in 2026?

National numbers turn into a breeding sheet fast. An archetypal 500-cow Panhandle dairy shipping to one of the new plants outside Amarillo needs about 135 replacement heifers a year at a 27% turnover rate. At USDA NASS’s July 2025 Agricultural Prices national average of $3,010/head, that’s a $406,350 annual replacement line. In Texas and California premium bands where springers cleared $4,000–$4,500 in late 2025 per regional auction reporting, the number climbs toward $500,000. USDA NASS’s October 2025 reading was already $3,110 — up $100 in three months, up $510 year-over-year.

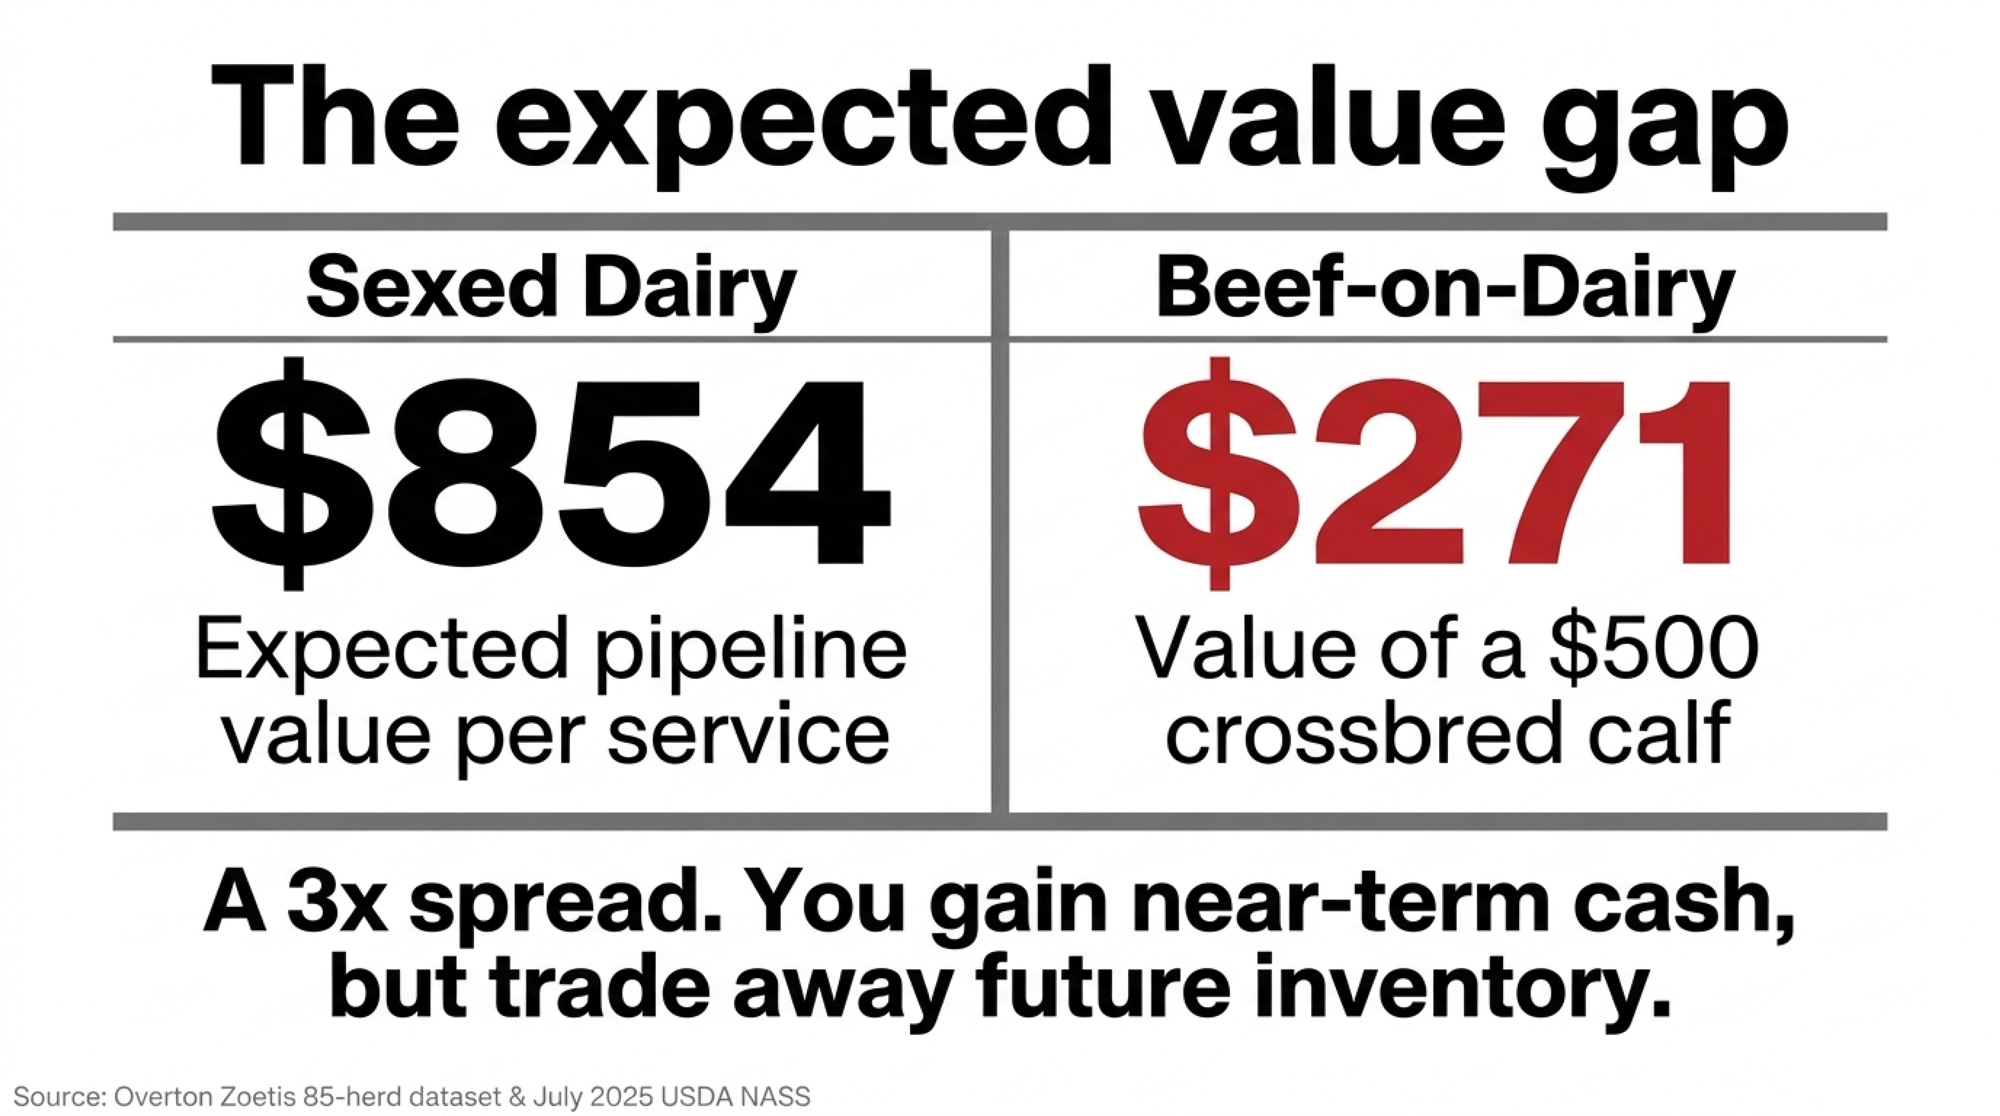
Run 35% beef on that herd and you’re putting roughly 200 beef services a year on cows that could carry a viable dairy pregnancy. Using Dr. Michael Overton’s Zoetis field dataset from 85 commercial Holstein herds — 42% sexed conception, 57% conventional, 90% and 50% heifer ratios, 95% pregnancy survival, 79% born-to-first-calving — every one of those 200 services trades away roughly $583 in expected replacement value at a $3,010 heifer and a $500 pre-weaned beef calf.

Running the Numbers — The Spread at a Glance

Based on $3,010 national heifer average vs. $500 crossbred calf. Sources: USDA NASS July 2025 Agricultural Prices; Overton Zoetis 85-herd dataset.

Breeding ChoiceExpected Value per ServiceWhy
Sexed Dairy$854(0.42 conception × 0.95 preg survival × 0.90 heifer ratio × 0.79 born-to-first-calving) × $3,010
Beef-on-Dairy$271$500 calf × 0.57 conception × 0.95 pregnancy survival; no replacement value
The Gap($583)Cost of every beef service used on a viable dairy dam

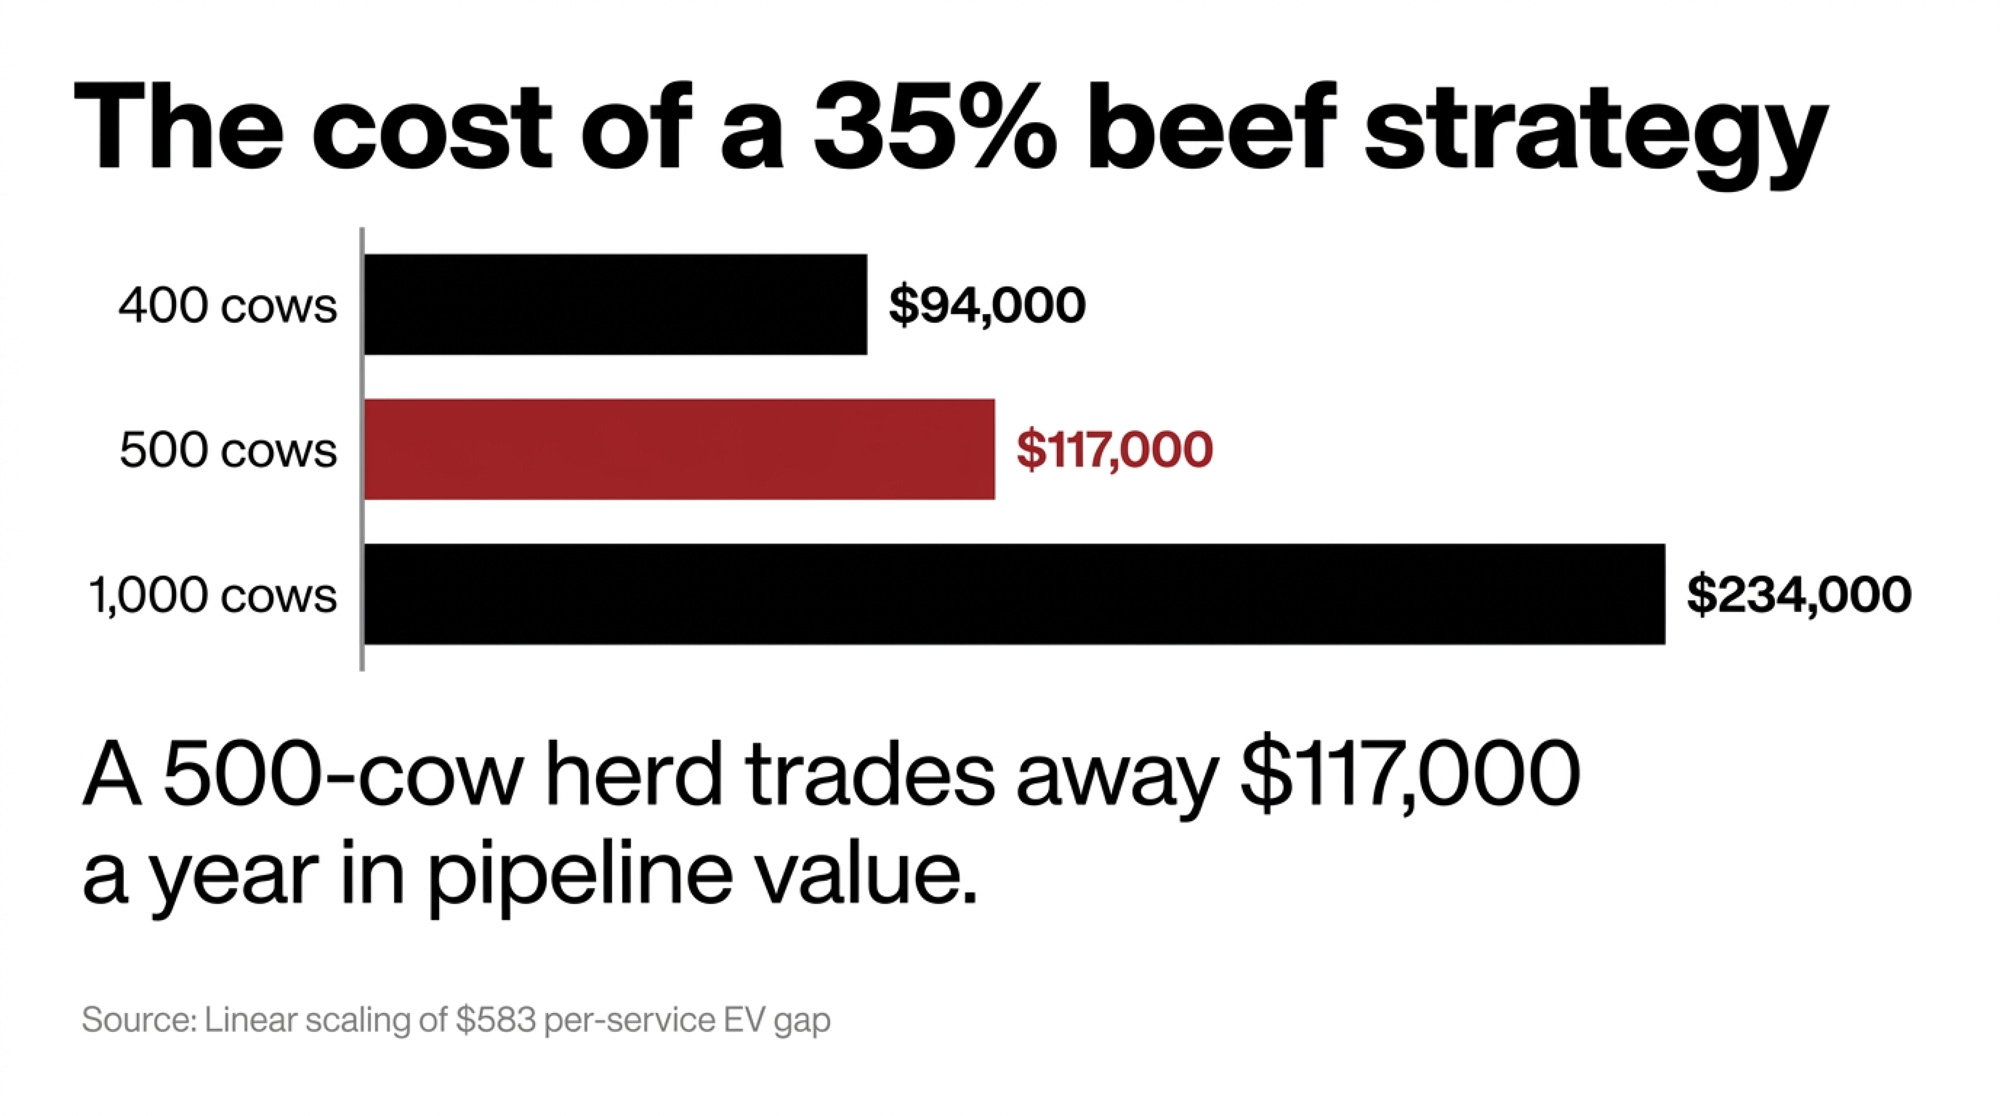
200 × $583 ≈ $117,000 a year in expected pipeline value, gone.

Scaling the Gap to Your Herd

Annual EV traded away at three beef ratios across three herd sizes. Linear scaling of the $583 per-service gap.

Herd Size25% Beef35% Beef50% Beef
400 cows~$67,000/yr~$94,000/yr~$134,000/yr
500 cows~$83,400/yr~$117,000/yr~$167,000/yr
1,000 cows~$167,000/yr~$234,000/yr~$334,000/yr

The Crossover — Where Beef-Cross Calves Match Sexed Dairy on EV

Solving beef calf × (0.57 × 0.95) = heifer × (0.42 × 0.95 × 0.90 × 0.79). Crossover calf price ≈ heifer cost × 0.5516.

Local Heifer CostCrossover Calf PriceLate-Oct 2025 TroughStatus vs Trough
$3,010 (USDA NASS, Jul 2025)$1,660/head$1,239/headBelow — beef pencils only above $1,660
$3,500 (regional avg)$1,931/head$1,239/headBelow — pipeline drawdown
$4,100 (TX/CA premium)$2,262/head$1,239/headFar below — every beef service trades EV away
$3,110 (USDA NASS, Oct 2025)$1,716/head$1,239/headBelow — gap widening with heifer price

Units note: The October 2025 CME December live cattle move is $/cwt on fat cattle. The ~$1,400 → $1,239 per-head calf move is a different instrument. Both tracked the same signal down.

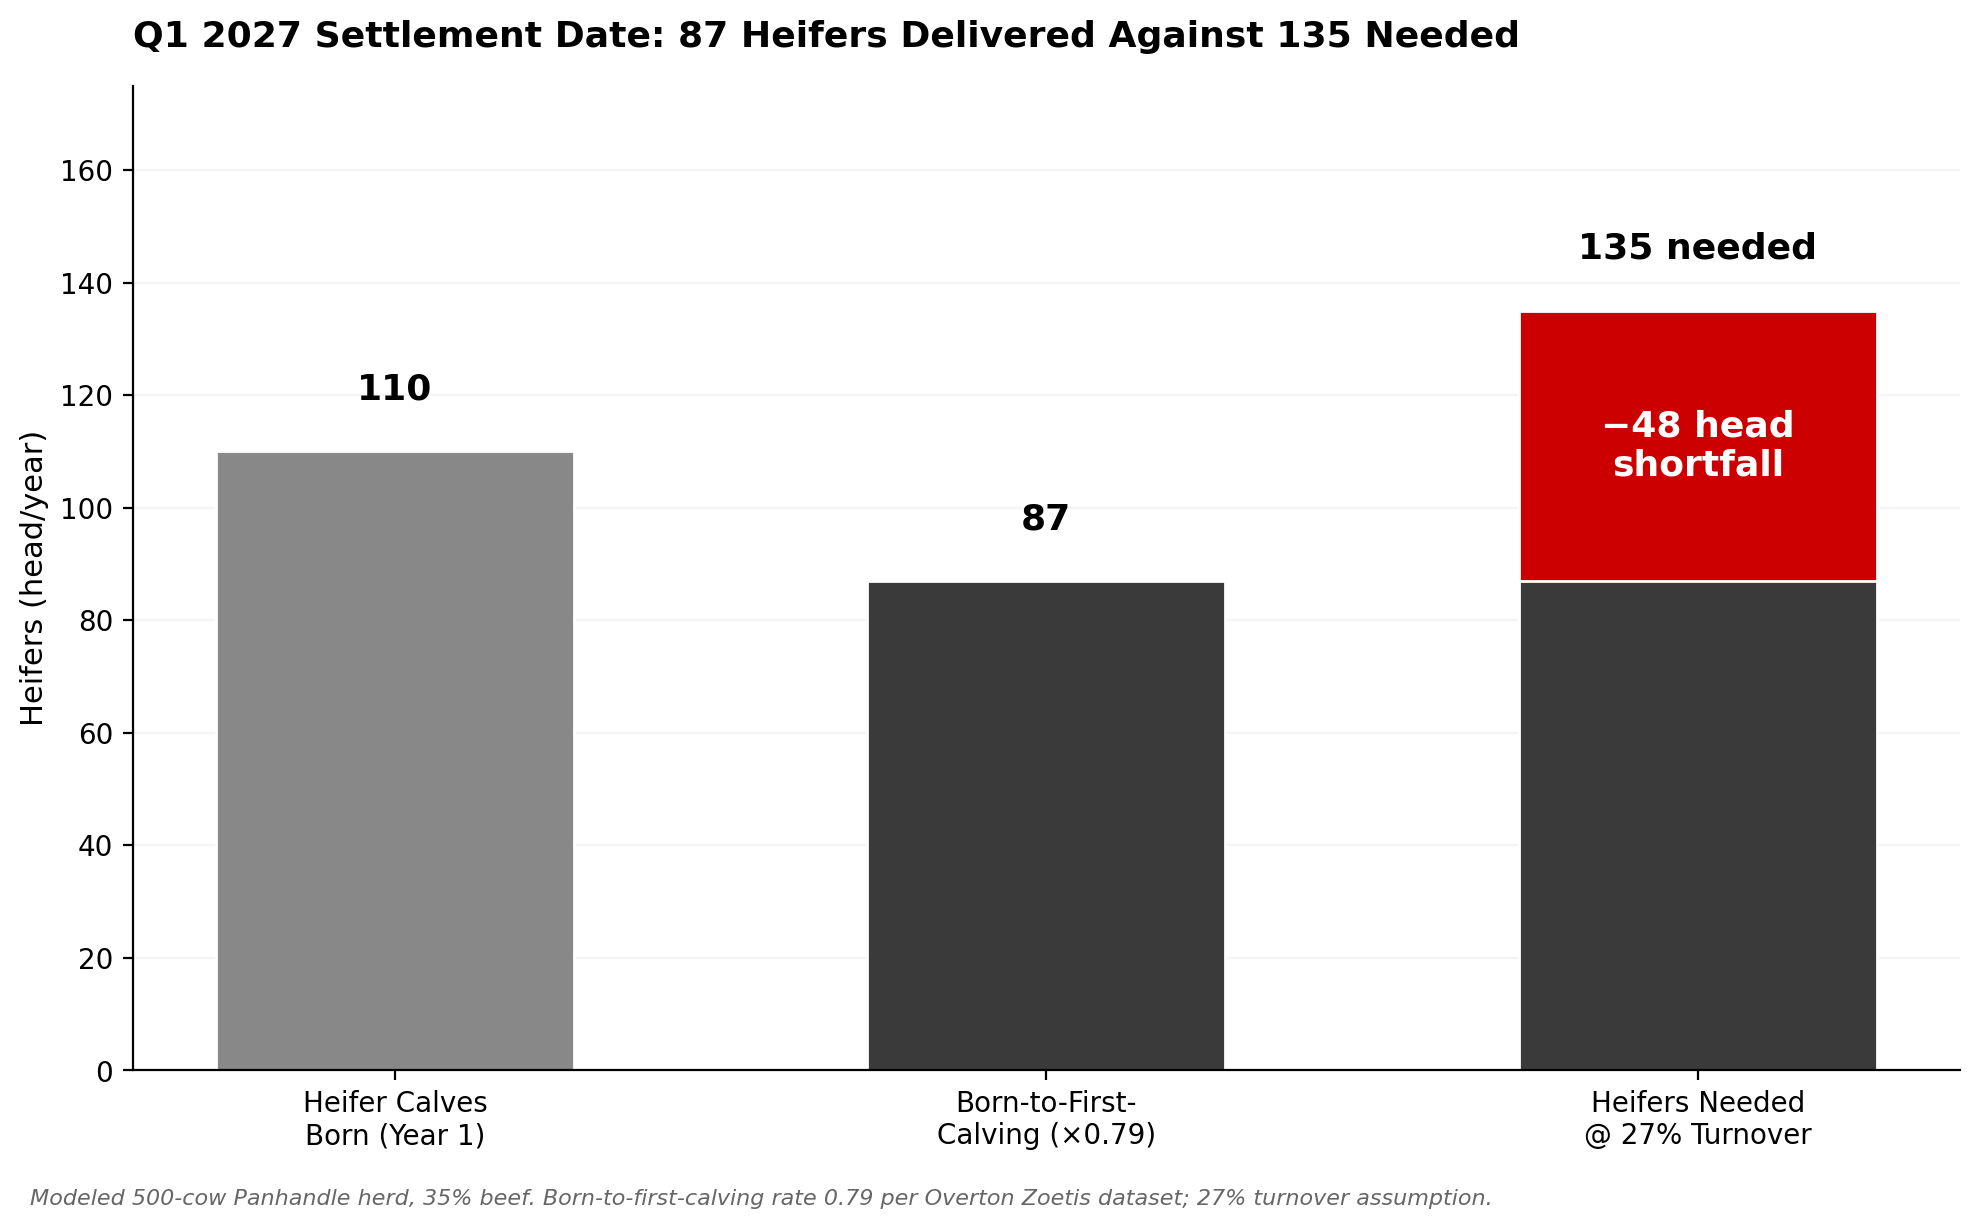
Heifer-calf baseline: At 35% beef on a 500-cow herd, about 65% of pregnancies are dairy. Against Overton’s conception and heifer-ratio rates, that produces roughly 110 heifer calves/yr. Multiply by 0.79 born-to-first-calving and the herd delivers ~87 heifers to first lactation against 135 needed. That’s the 48-head shortfall the 2027 pipeline has to cover at spot prices.

“$854 per sexed-dairy service. $271 per beef-on-dairy service at today’s $500 calf. The spread is 3x — and the settlement date is 2027.”

What Does the October Correction Actually Say About Calf Price Risk?

Most of the industry filed October 2025 as a blip. It wasn’t.

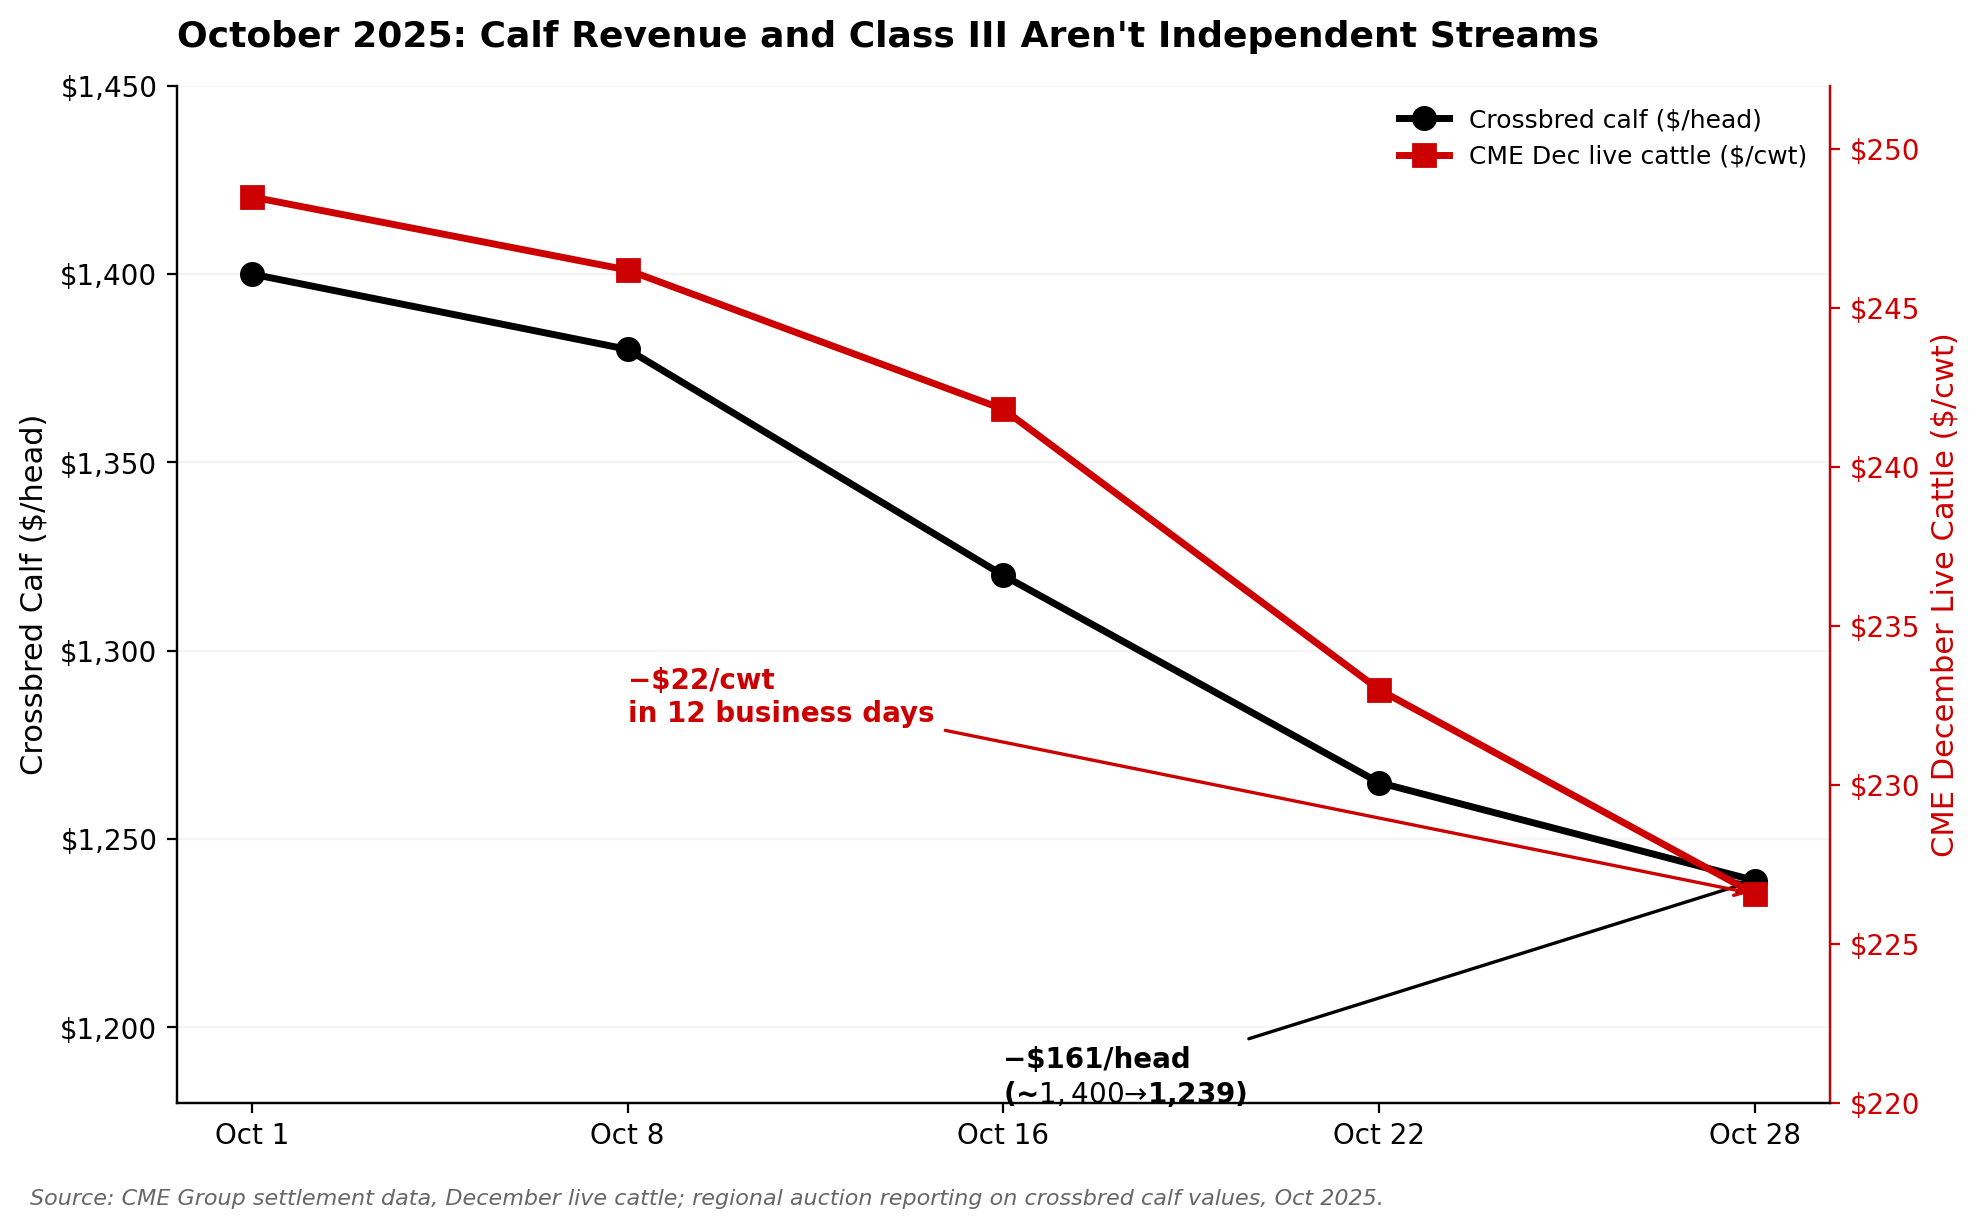
Per CME Group settlement data, December live cattle futures fell from the mid-$248 range in early October to $241.82on October 16 — a single-session $6.05/cwt drop — and bled to $226.57 by October 28. Roughly $22/cwt in twelve business days. Market analysts linked the move to public presidential commentary that week pressing ranchers on beef prices, and crossbred calf values fell with the futures from roughly $1,400 to near $1,239. Bullvine’s prior modeling on a 1,000-cow / 40%-beef archetype put the annualized revenue impact near $196,000.

The assumption most coverage leaned on: beef-on-dairy is diversification against milk-price weakness. The data says otherwise. USDA AMS Class III printed $14.59/cwt in January 2026 — the lowest since July 2023 — and recovered to $16.16 in March 2026. Thin milk margins, volatile calf revenue, same operation. Both streams moved on overlapping signals, not independent fundamentals.

That’s correlation, not diversification. A different risk structure than the one the 2023 breeding decision was made against.

Related: Bullvine’s prior Tier 3 on McCarty’s 341-Day Pipeline and the DSCR Trap.

The Bullvine Pipeline Index — April 2026 Reading

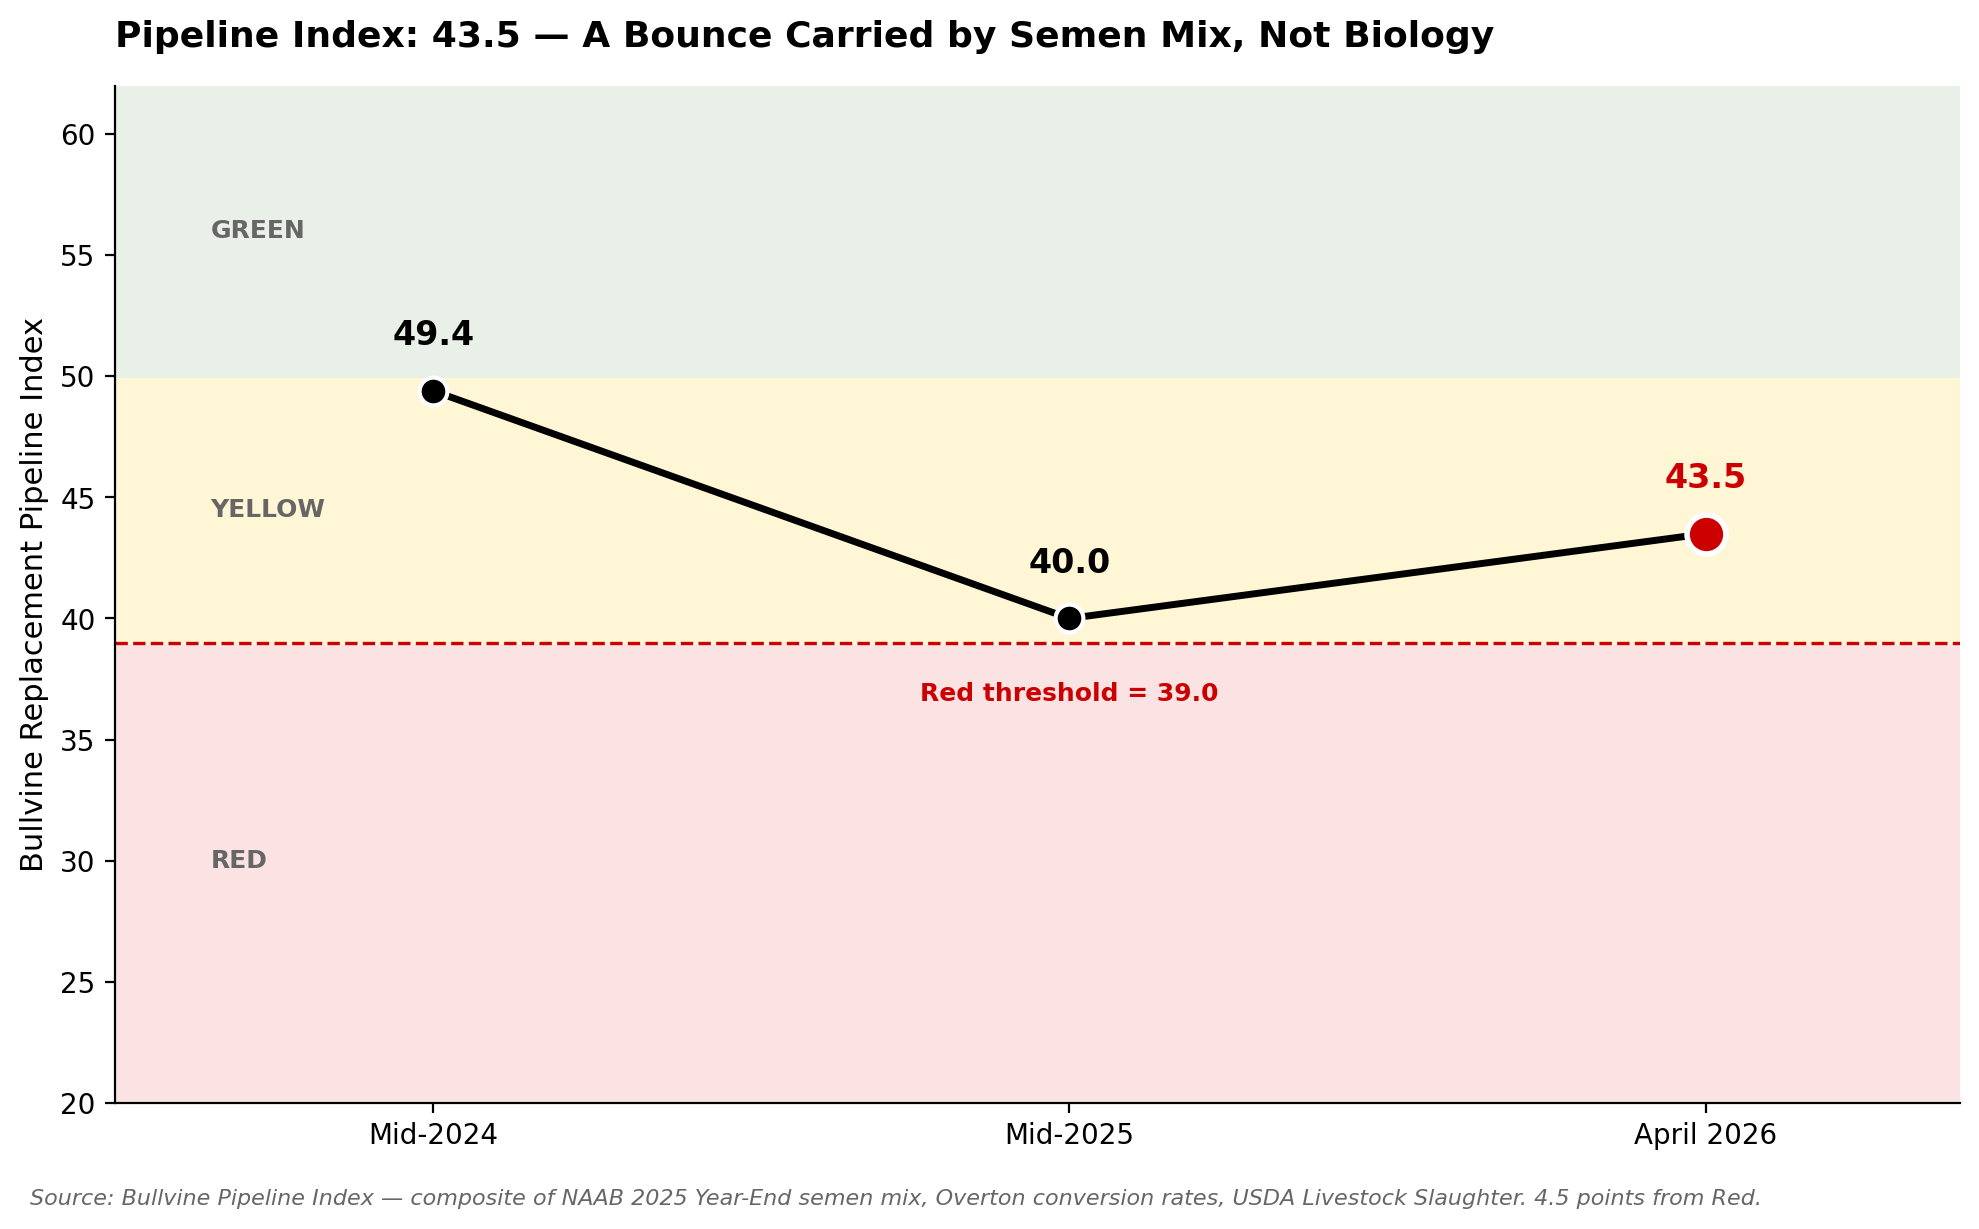
🟡 Pipeline Index: 43.5 — Yellow Zone

Red threshold: 39.0 · Distance from Red: 4.5 points

What it is: Bullvine’s proprietary replacement-pipeline health score. It combines NAAB’s domestic semen-sales mix, Overton’s biological conversion rates, and USDA’s weekly Livestock Slaughter data into a single weighted reading (Heifer Supply 40%, Price Signal 25%, Culling Pressure 20%, Semen Mix Momentum 15%). Refreshes quarterly as USDA and NAAB data update.

Trajectory: Mid-2024 → 49.4 · Mid-2025 → 40.0 · April 2026 → 43.5

Read: Fragile recovery. The bounce is carried almost entirely by semen-mix shift, not by biology on the ground. Settlement-date risk for 2027–2028 replacements remains elevated.

The Four Components

  • Heifer Supply — 55 (weight: 40%). Marginal. Replacement ratio runs near 27 per 100 cows. Why it matters:direct line from current inventory to 2027 milking cows.
  • Price Signal — 30 (weight: 25%). Red-Zone range, driven by the $3,010 national heifer price. Why it matters:price is the market’s vote on scarcity, and the vote is already in.
  • Culling Pressure — 25 (weight: 20%). Red-Zone range; retained-cow overhang is keeping today’s milk on. Why it matters: retained cows mask supply tightness now and widen the 2028 gap.
  • Semen Mix Momentum — 60 (weight: 15%). The one component propping the score up. Sexed dairy climbed to 64% of domestic dairy units used in 2025 per NAAB’s 2025 Year-End Report. Why it matters: the pipeline’s only tailwind — and it won’t produce a milking cow for 24 months.

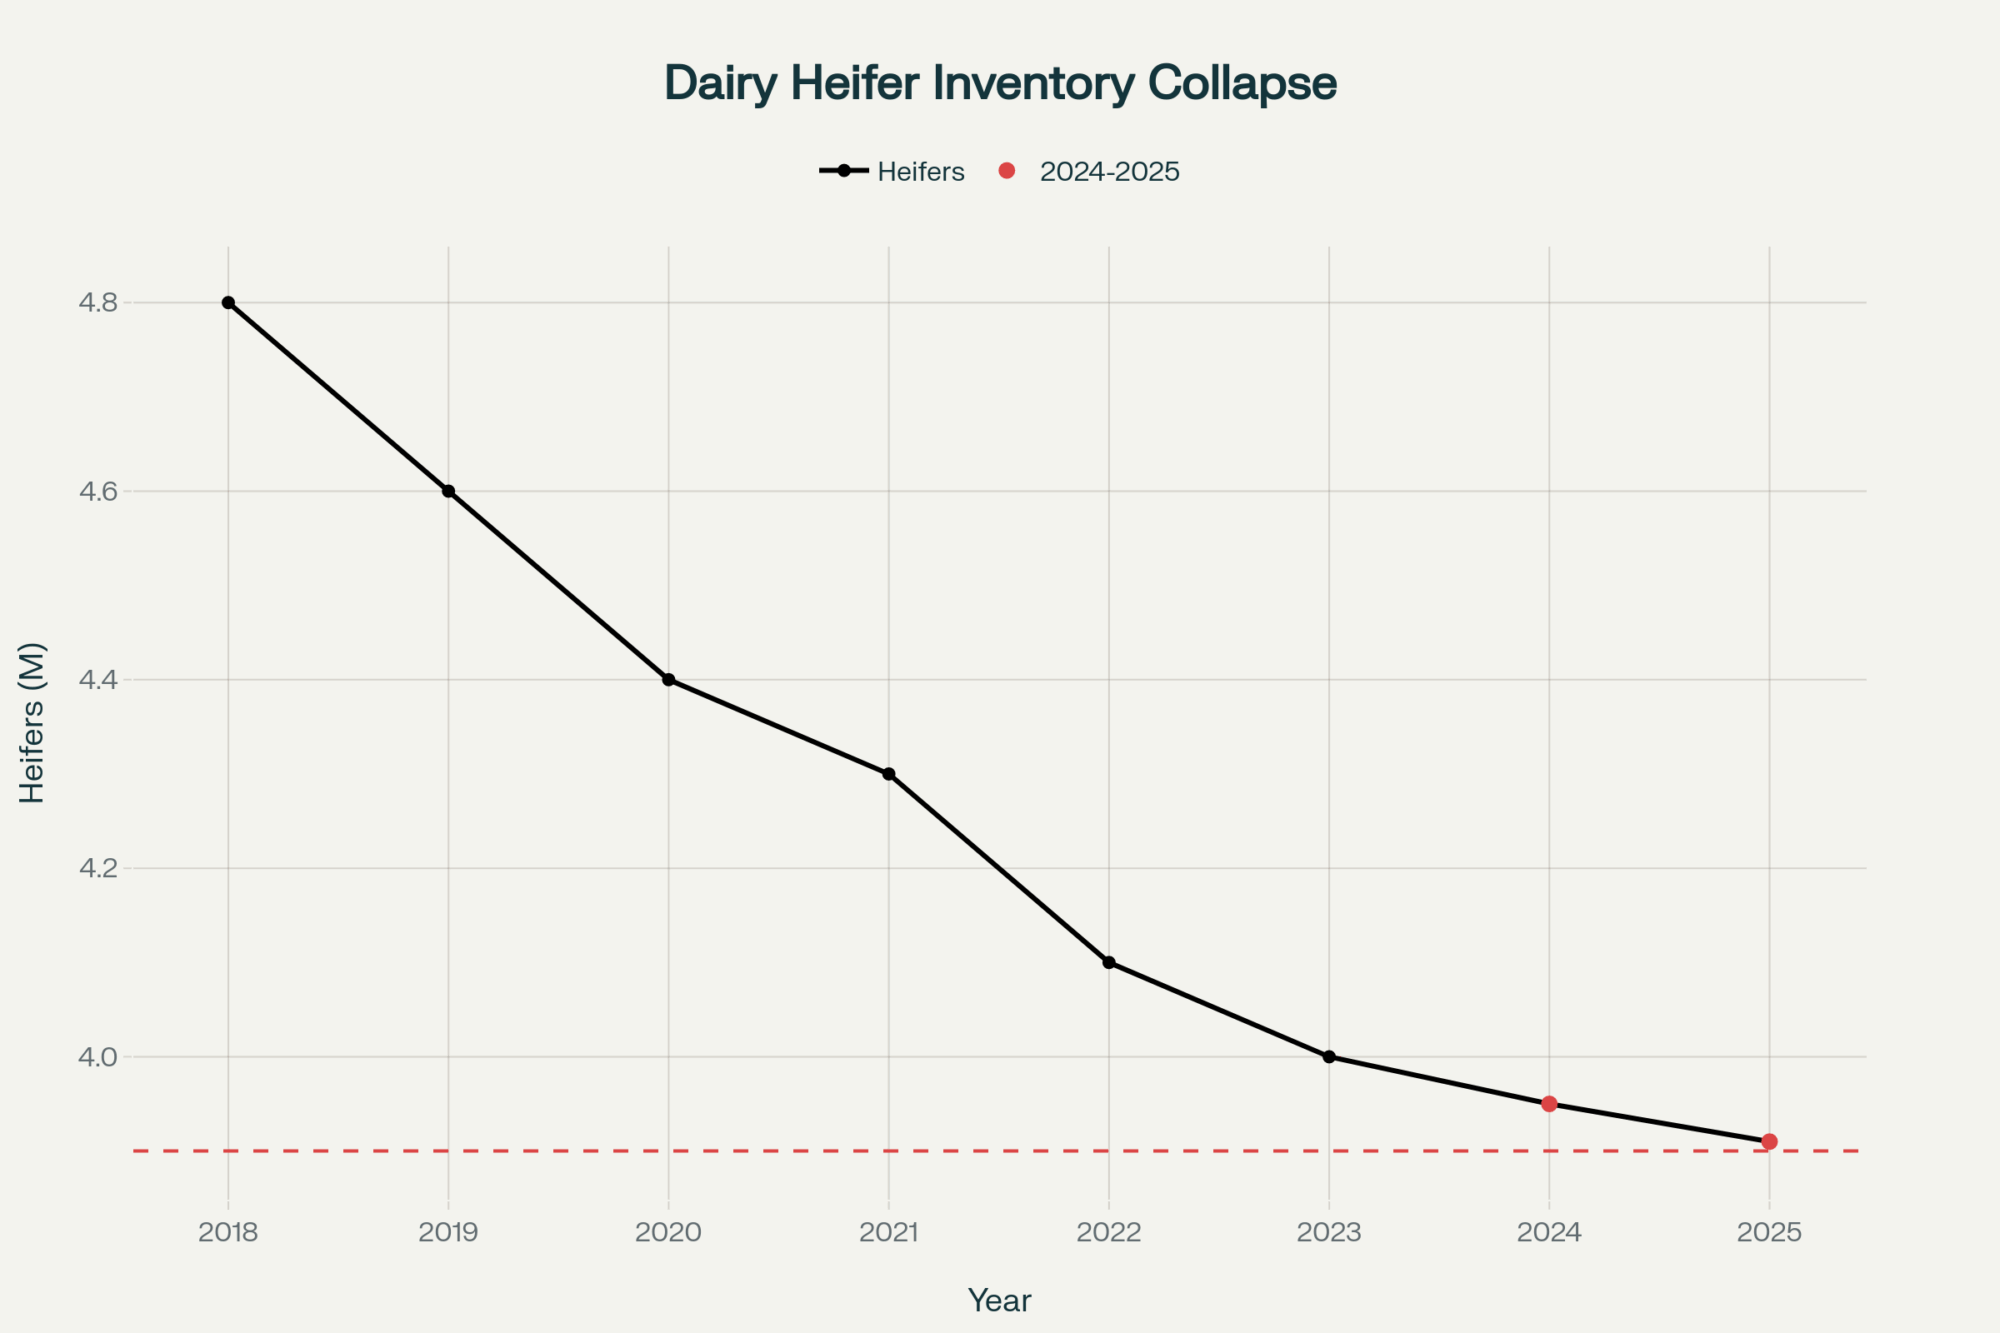
USDA’s January 2025 Cattle Inventory counted just 3.91 million dairy replacement heifers on U.S. farms — the smallest reading in 47 years, down 16% from 4.61 million on January 1, 2020. Iowa State Extension’s NW Iowa Dairy Outlook (Lee Schulz) has tracked weekly dairy cow slaughter running behind year-earlier across most of the period since September 2023. Bullvine’s modeling pegs cumulative “extra cows kept” at 600,000–611,600 head versus normal culling pace — an extrapolation from the ISU weekly deficit, not a USDA number.

Those retained cows carry milk volume today. They won’t carry a new plant in 2028. The $11 billion in new processing capacity was sized against herd-growth assumptions from 2022–23 that no longer hold.

Related: Bullvine’s Beef-on-Dairy’s $500,000 Swing, January 5.

Why the Operator Who Got the Calf Market Right Got the Settlement Date Wrong

The Panhandle operator who made good money on beef calves through 2023 and 2024 didn’t miscalculate. They executed leg one of a two-leg trade well. What most haven’t done is look up leg two’s price.

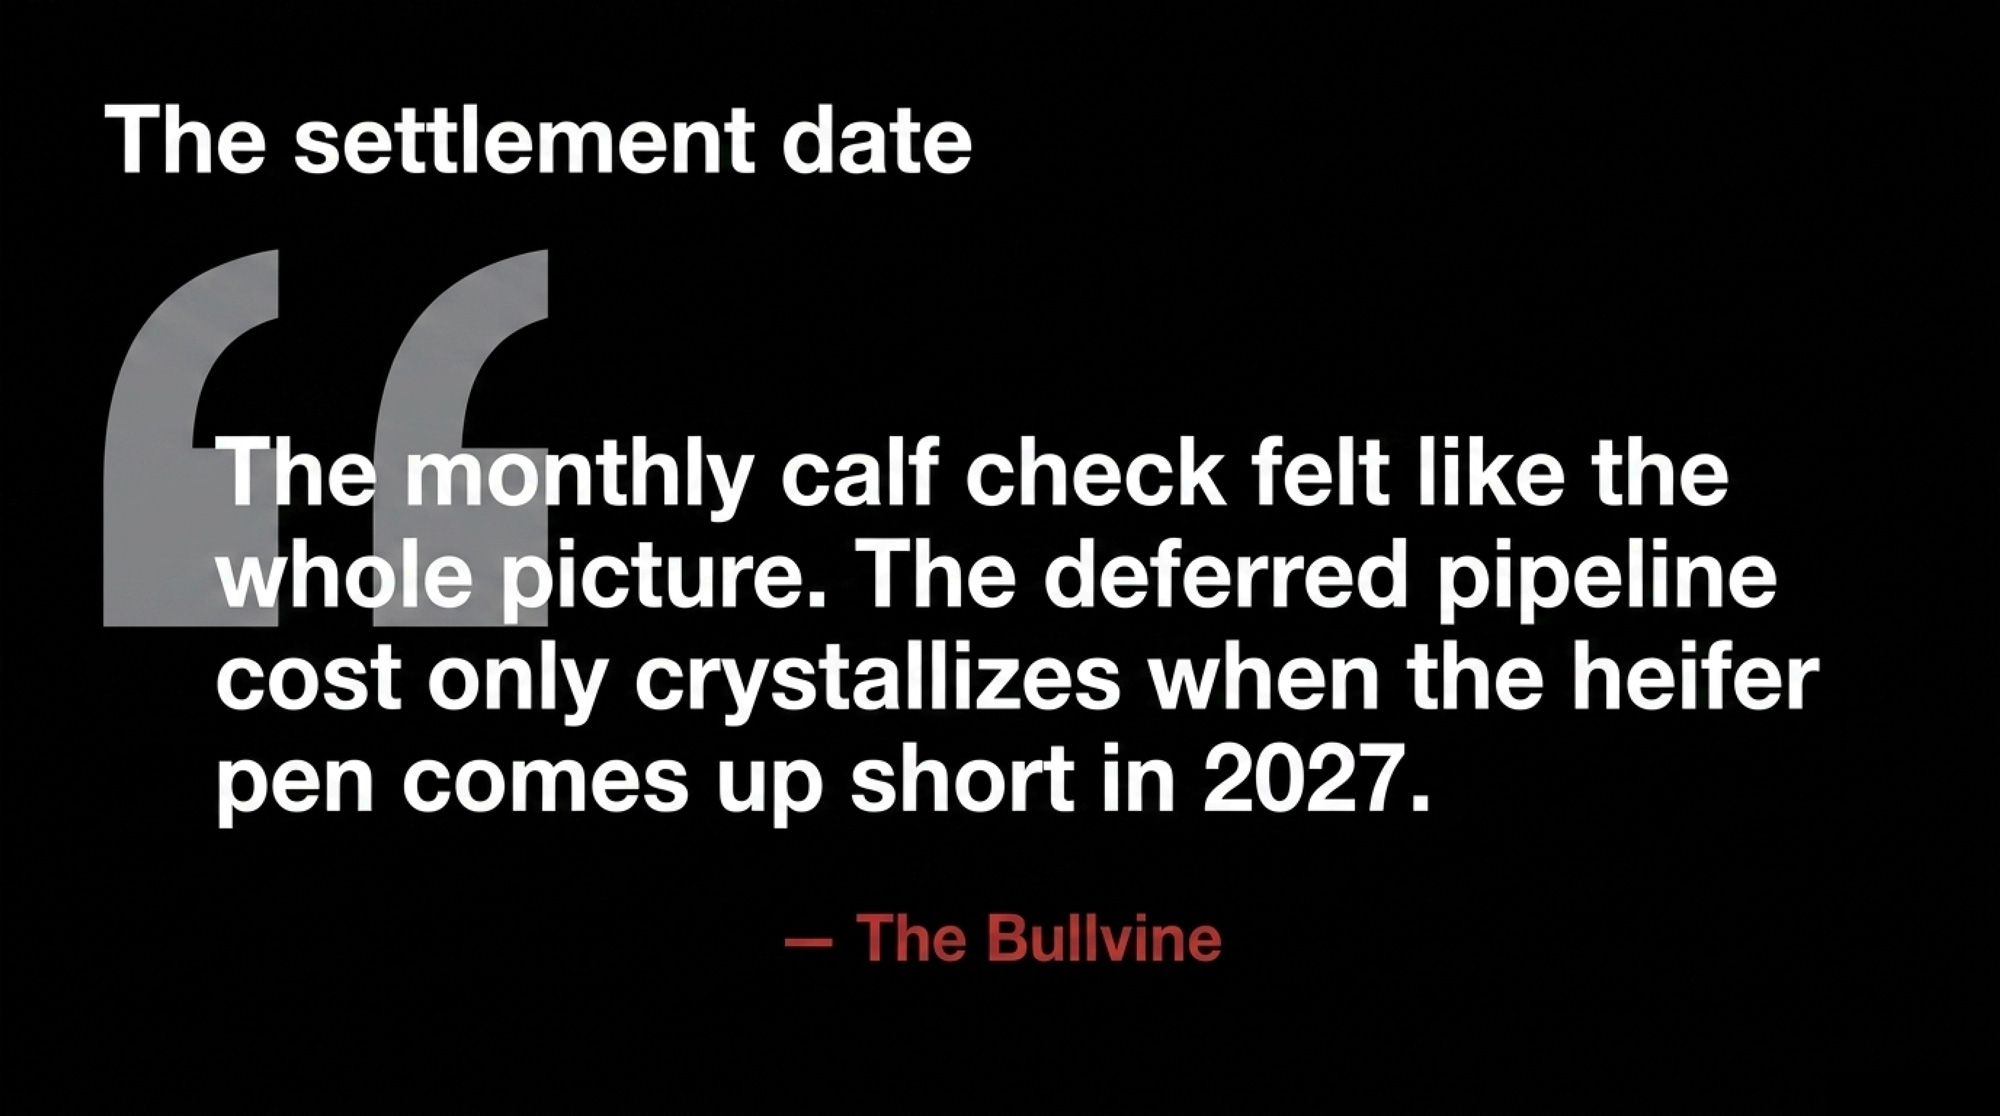
That’s not on the operator. It’s on how the trade got sold. One leg at a time. The $900–$1,400 calf checks landed every month through that run. The pipeline cost was deferred, off balance sheet, and only crystallizes when the heifer pen comes up short in Q1 2027.

Some operators ran the full math and took the trade eyes-open. For others, the settlement-date cost didn’t get modeled because the monthly calf check felt like the whole picture. Both positions exist in the data. What’s changed is the spread at the service level: sexed dairy at $854 against beef-on-dairy at $271. More than three times. The crossover doesn’t arrive until beef-cross calves clear $1,660 at a $3,010 heifer. Most markets aren’t in the same zip code.

Will Babler of Atten Babler Risk Management has publicly argued that premium U.S. beef will increasingly be held by dairy producers because of the extra benefits these animals bring to market. He’s right about the premium. The question is whether your animals qualify — traced genetics, breed-society enrollment, direct feedyard relationship — or whether they’re anonymous crossbreds moving through the sale barn at $200–$500 and carrying all the pipeline risk for a fraction of the revenue.

Gregg Doud has framed the reclassification plainly in recent NMPF communications, telling dairy audiences they may be in the beef business more than the dairy business. Lenders have started modeling it that way. Producer balance sheets generally haven’t caught up.

Related: Bullvine’s $585-Per-Service Beef-on-Dairy Trap.

Where Does This Leave Ontario and Supply-Managed Herds?

Different mechanism, same breeding-sheet question. Supply management protects the Canadian milk check in a way the U.S. spot market does not, which blunts the milk-price-weakness argument for riding beef-on-dairy hard. Quota carrying costs and genetic replacement economics still drive the service-by-service EV decision. Beef-cross calves from Ontario herds still move into a North American feedyard market that cleared near $1,239 at the October 2025 trough. The crossover math above holds; the variables that change are your local heifer cost and your calf-sale channel.

The 30/90/365-Day Playbook for Herds That Ran 35%+ Beef in 2023 and 2024

30-Day Actions — Before Your Next Breeding Round

  • Run your pipeline math. Pull 12 months of heifer-calf births. Multiply by 0.79 for completion to first calving. Compare to herd size × your replacement rate. A 500-cow operation needing 135 heifers/yr but projecting 110 heifer calves × 0.79 ≈ 87 to first calving is roughly 48 head short for 2027–2028. Threshold: any shortfall above 10% of annual demand is a planning problem, not a shopping problem. Where it backfires: if your actual born-to-first-calving rate runs below 79%, the shortfall is bigger than your spreadsheet shows.
  • Audit beef-on-dairy EV at your own calf price and local heifer cost. EV_beef = your calf price × 0.57 × 0.95. EV_dairy = your heifer cost × 0.42 × 0.95 × 0.90 × 0.79. If the dairy advantage lands near $583/service, decide how many beef services you keep on viable dairy dams. You gain near-term cash. You give up future replacement inventory.
  • Call your heifer suppliers this week. Ask how far they’re booked and whether they’ll lock numbers 12–18 months forward. If “I’ll just buy later” is the plan, find out whether the supply actually supports that.

💡 Pro Tip — The LRP Window Opens Before the Calf Is Born

Per Farm Credit East’s October 2025 guidance, the USDA RMA’s LRP Unborn Calves program (launched July 1, 2025) lets you floor the price on beef-on-dairy crossbred calves before they hit the ground. Farm Credit East’s worked example shows coverage up to roughly $1,200/head at a post-subsidy premium near $26.20/head, based on a 95-lb target weight and a 395% price adjustment factor. Parameters vary by endorsement length, coverage level, and sale date — confirm current rates with your crop insurance agent.

Most producers miss the window because they don’t realize the coverage is available at breeding-decision time, not at weaning. If you’re making the beef-service call this month, the LRP decision is the same conversation — not a separate one six months later.

Red-flag trigger: If beef revenue runs above 10–12% of gross income (thresholds vary by lender; confirm with yours) and you aren’t carrying LRP on unborn calves, this moves to the top of the 30-day list. LRP is a U.S. RMA program; Canadian producers should consult provincial risk-management options separately. Where it backfires: LRP floors price risk, not local basis risk.

90-Day Actions — Structural Adjustments

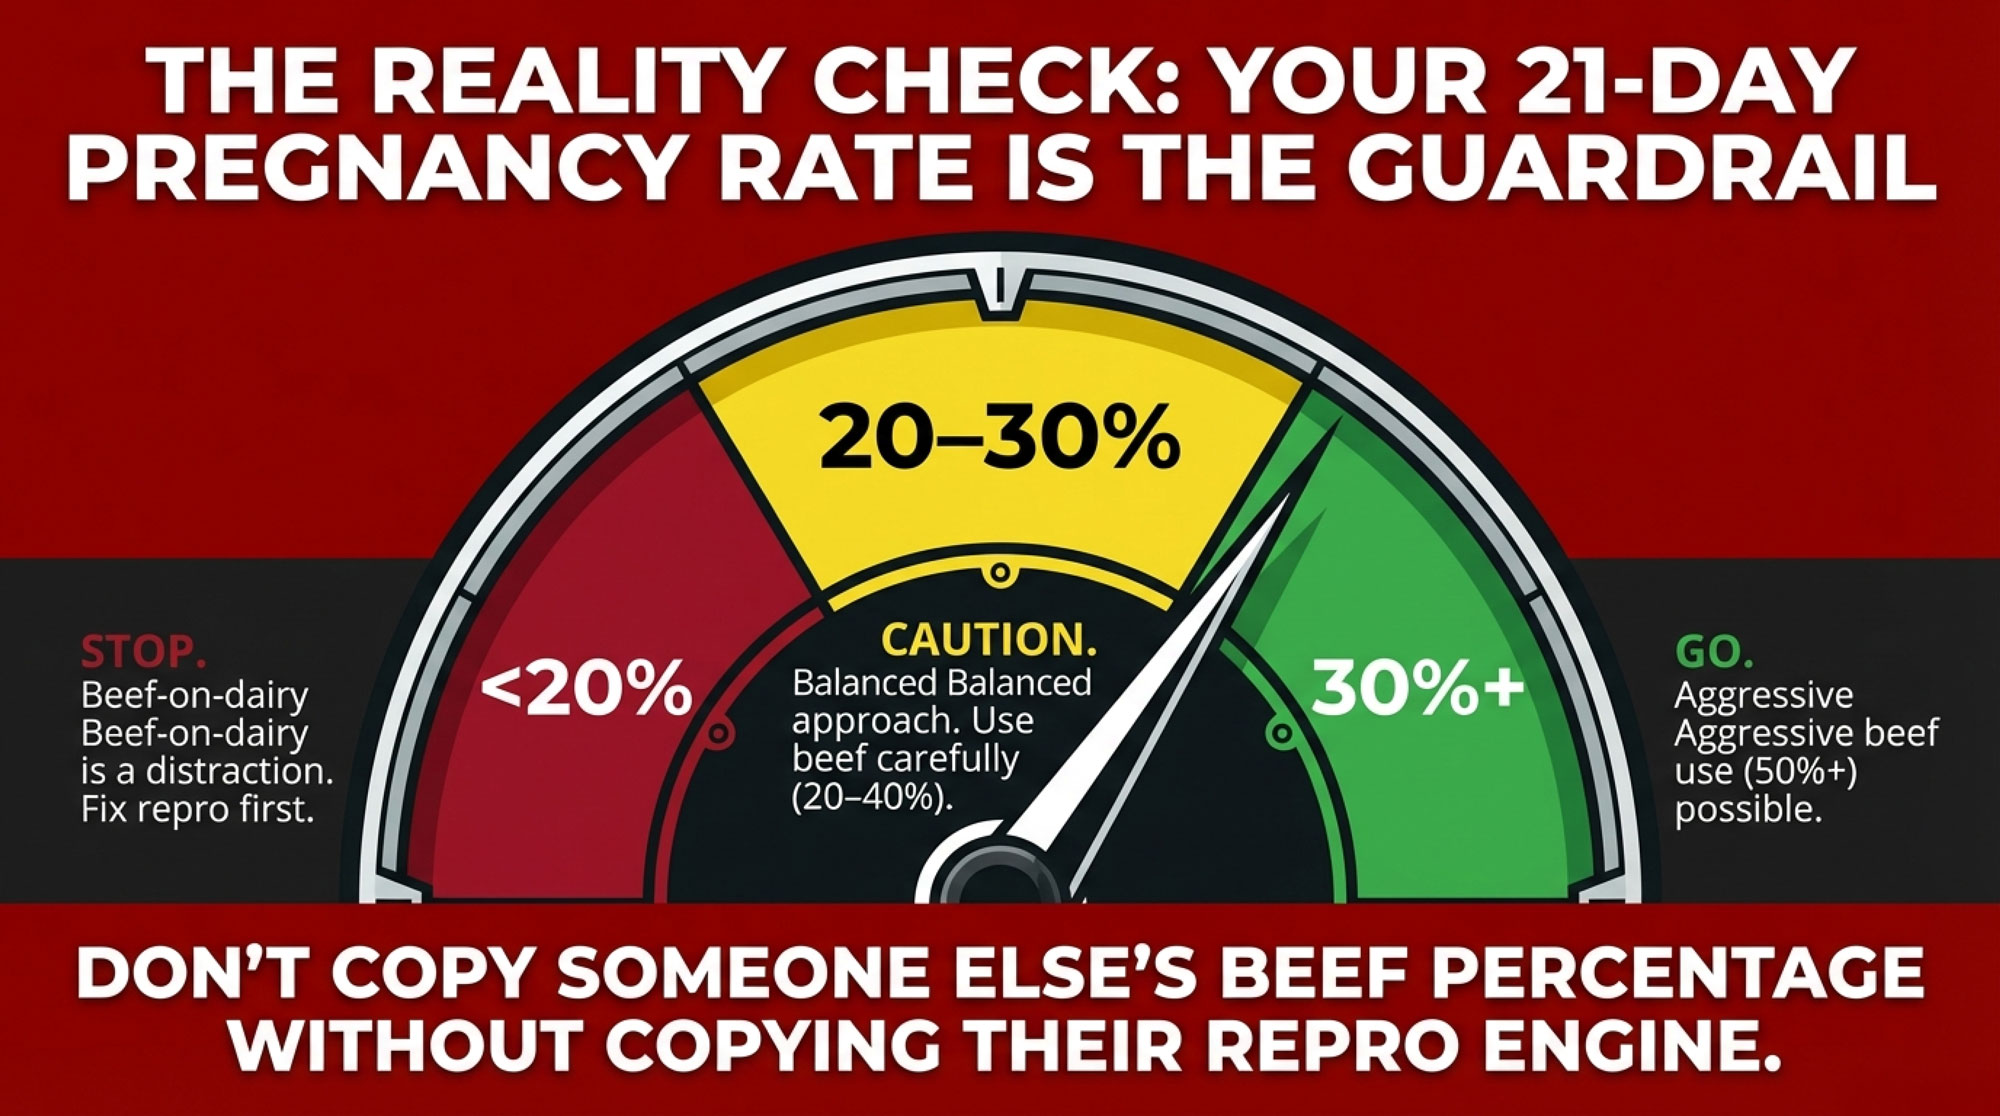
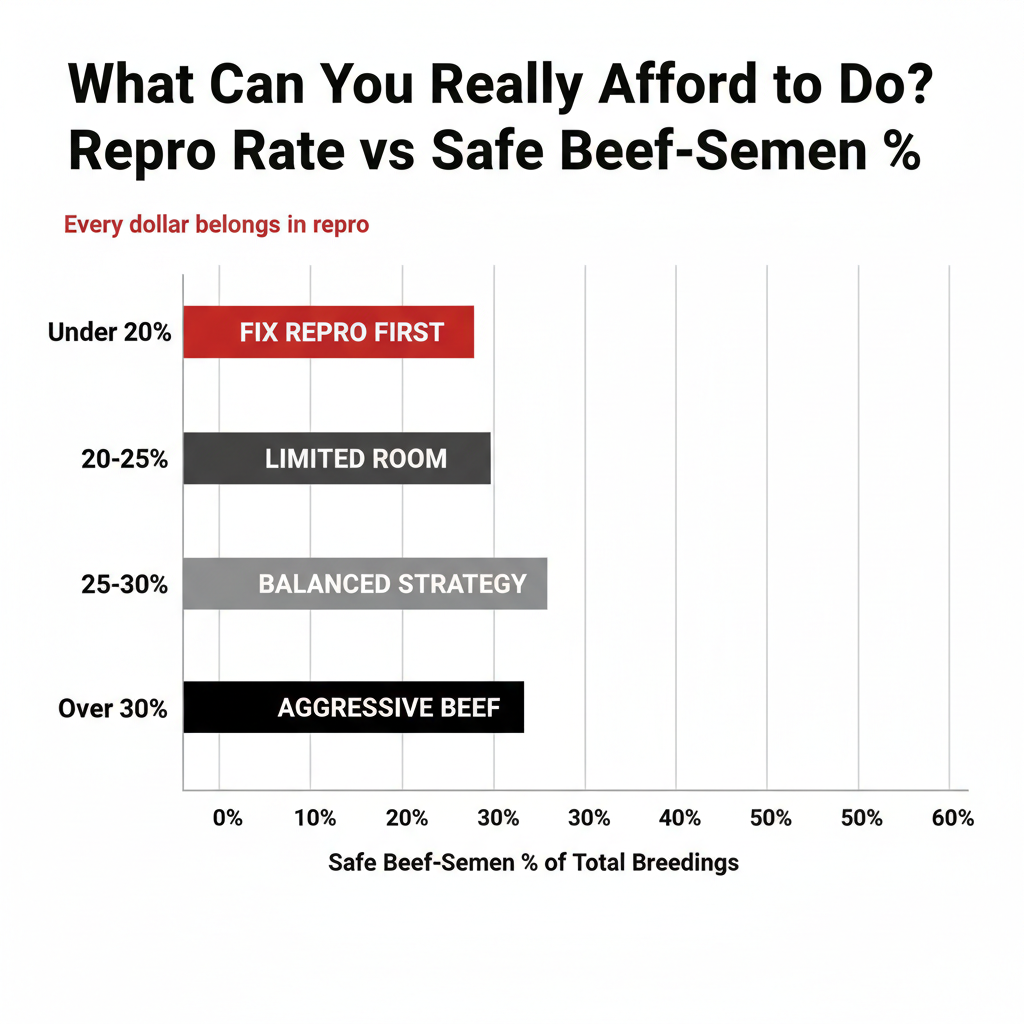
  • Tier your herd and write it into SOPs. Top genetics on sexed dairy. Middle tier mixed. True terminal cows only get beef. Requires: current genomic evaluation, AI technician cooperation, a small conception-rate give-back on sexed services. Where it backfires: aggressive sexed use on a herd running below 20% 21-day preg rate can widen, not close, your pipeline gap.
  • Forward-book 30–40 springers for Q1 2027 delivery. Heifer developers contacted by Bullvine report contracting 12–18 months forward at typical premiums of $100–$200/head over spot, with 10–20% deposits. Converts a forced peak-market purchase into a known commitment. Where it backfires: if heifer markets soften faster than calf markets, you’re carrying an above-market forward against tighter cash flow.
  • Cull on profit, not habit. Keep productive older cows if SCC and repro allow. Ship chronic mastitis, repeat breeders, and low-index animals. A retained cow buys you time. She doesn’t buy you margin.

365-Day Moves — Positioning for the Next Cycle

  • Align your herd plan to your plant. If you’re shipping to new processing steel, decide whether you’re growing, holding, or shrinking. Pipeline, beef percentage, and culling strategy need to match that call — and the processor’s volume expectation. Opportunity signal: if your genetics and repro numbers support program qualification and your local heifer basis is tracking the $3,010 national average rather than the $4,100 peak, 30–40% beef inside a direct-feedyard program can still pencil.
  • Set hard floors and ceilings. Floor: the minimum beef-calf price where beef services still pencil. Ceiling: the maximum percentage of breedings you’ll put to beef on viable dairy dams. $1,660 at a $3,010 heifer is your north star; $1,931 at $3,500; $2,262 at $4,100.
  • Recalculate quarterly, not annually. Sexed semen, beef semen, replacement heifers, and calf markets have all moved enough in 24 months that a 2024 analysis won’t hold up in a 2026 credit file. The Pipeline Index refreshes quarterly.

The Trade-Off, Stated Plainly

Every beef service on a viable dairy dam is a near-term calf check bought with a 24-month pipeline drawdown. At a $3,010 heifer and a $500 beef calf, that trade costs roughly $583 in expected replacement value per service. At 200 services on a modeled 500-cow Panhandle herd, it’s $117,000 a year. At 4.29 million projected pipeline entries against a 9.35 million U.S. dairy cow herd and billion in new plants, it’s a national structural question. Neither number moves itself. Both settle on a specific date — when the heifer pen is supposed to be full and isn’t.

The crossover prices are the line in the dirt: $1,660 at a $3,010 heifer, $1,931 at $3,500, $2,262 at $4,100. Everything below those prices is a pipeline drawdown with a monthly calf check attached.

The 500-cow Panhandle dairy referenced throughout is an illustrative archetype, not a specific operation. The Bullvine Pipeline Index just put beef calves and replacement heifers on the same invoice — 43.5, Yellow Zone, 4.5 points from Red.

The $117,000 bill is already in the mail. The only question is whether you have the heifers to pay it in 2027, or whether you’ll be writing that check to a neighbor who saw the Yellow Zone coming.

What does your last 12 months of heifer-calf births × 0.79 actually produce — and at what beef-calf price does your own breeding sheet stop building revenue and start building a 2027 liability?

Complete references and supporting documentation are available upon request by contacting the editorial team at editor@thebullvine.com.

Learn More

The Sunday Read Dairy Professionals Don’t Skip.

Every week, thousands of producers, breeders, and industry insiders open Bullvine Weekly for genetics insights, market shifts, and profit strategies they won’t find anywhere else. One email. Five minutes. Smarter decisions all week.

NewsSubscribe
First
Last
Consent

The $1,750 Calf: Is Your 2026 Breeding Plan Leaving $800 a Head on the Table?

Holstein bulls at $800. Beefondairy at $1,750. Same cow, same calving—double the cheque. Why are you still breeding everything Holstein?

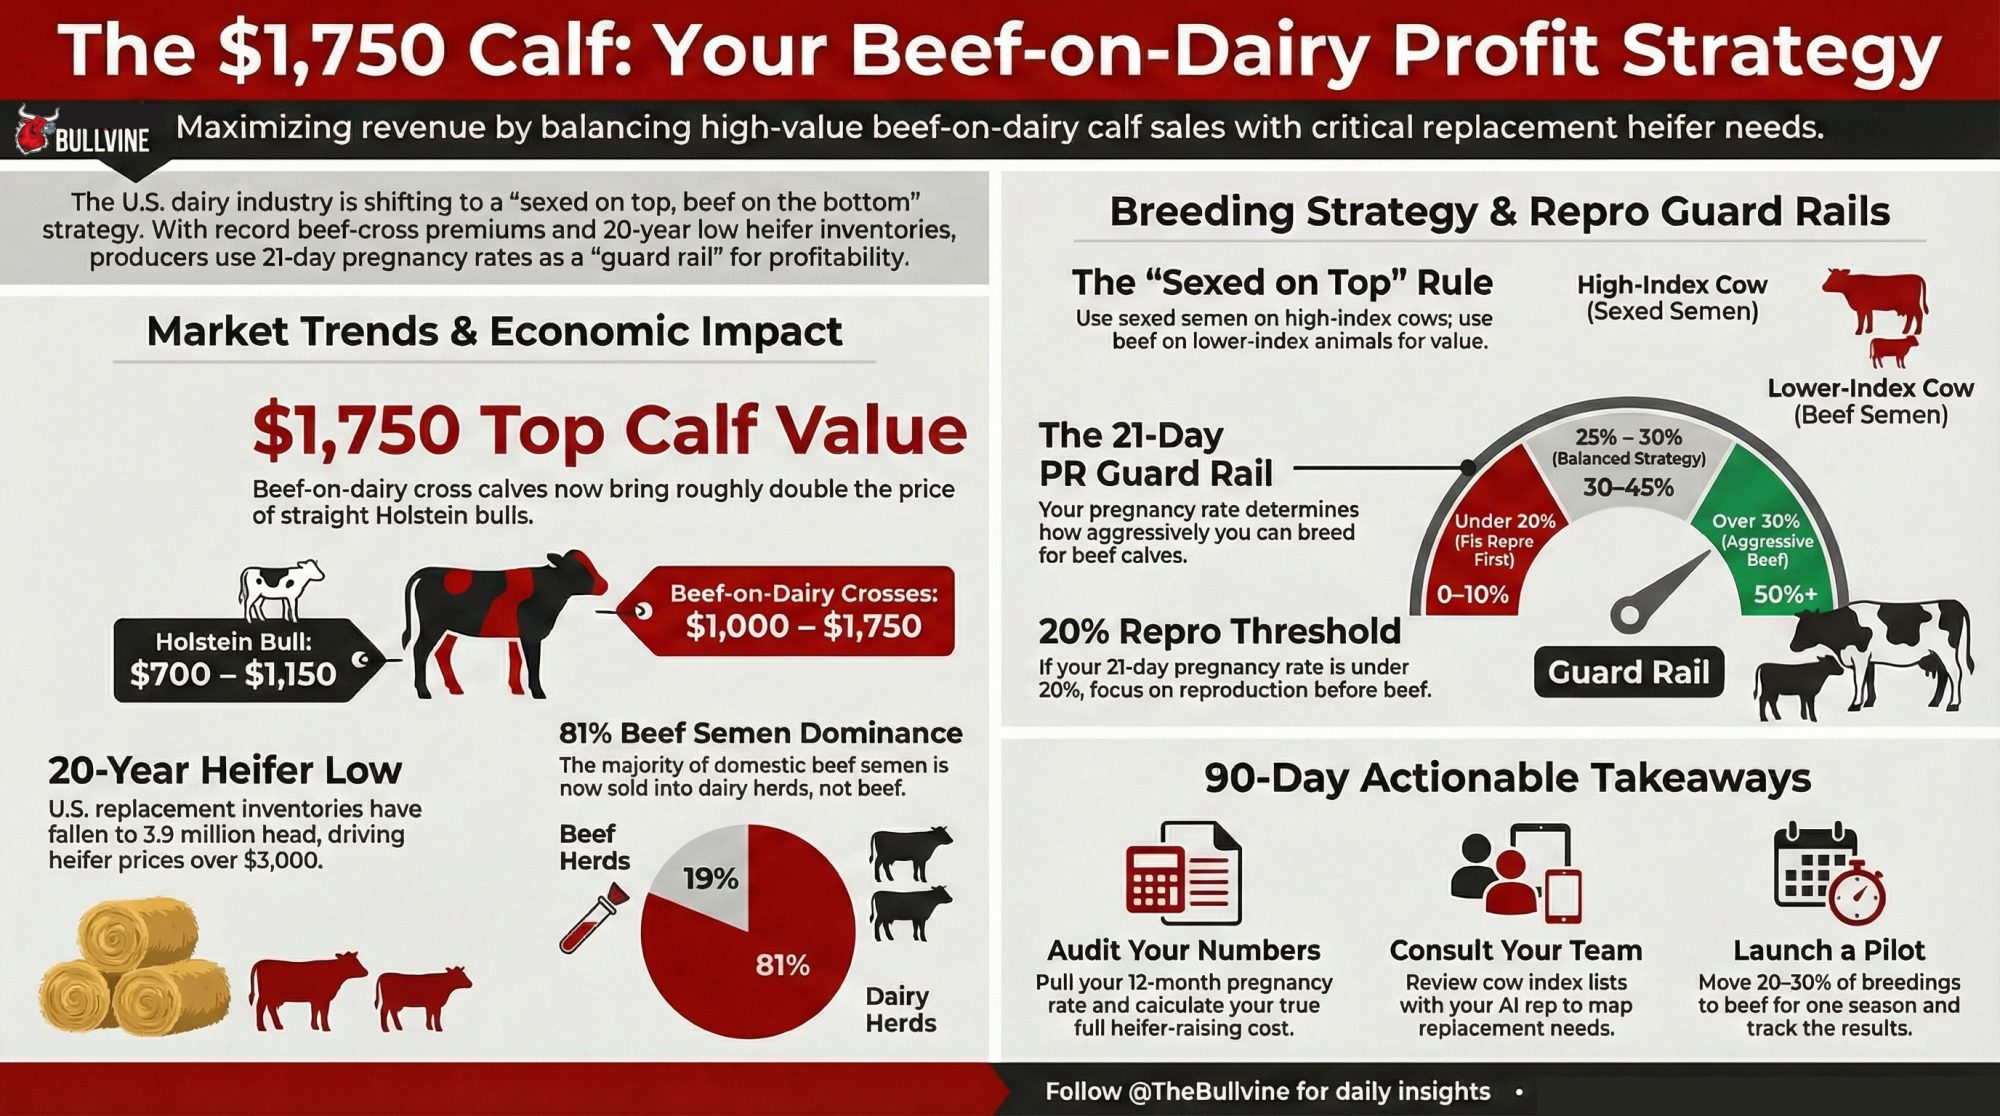
EXECUTIVE SUMMARY: In many U.S. sale barns today, Holstein bull calves that once brought $300–$450 are now commonly in the $700–$1,000 range in stronger markets, while well‑bred beef‑on‑dairy calves are cashing cheques up to about $1,750 in some auctions. At the same time, U.S. replacement heifer inventories have fallen to a 20‑year low near 3.9 million head as processors invest roughly $10 billion in new and expanded plants that will need milk to run. That combination has pushed 81% of domestic beef semen sales into dairy herds and made the “sexed on top, beef on the bottom” strategy hard to ignore. The catch is that it only pays long‑term if your 21‑day pregnancy rate stays above about 20% and you have heifers to spare, with herds in the 30–40% band able to run 50% or more of their breedings to beef while herds under 25% are usually better off fixing repro first. Three Wisconsin families—Hillview, Hiemstra, and Dornacker—show how registered Holsteins, a soil‑driven 170‑cow system, and a ProCROSS robot herd are all turning those same numbers into very different but profitable plans. By the end, you’ll know which of three breeding “paths” your own numbers put you in and what to do over the next 90 days to match sexed and beef semen to your repro, heifer, and calf markets.

beef-on-dairy breeding strategy

In strong Wisconsin markets, beef‑on‑dairy calves are bringing up to about $1,750 a head and Holstein bull calves are often in the $800–$1,000 range, with top sales in other regions breaking the $1,000 mark as well. U.S. milk replacement heifer inventories are down to roughly 3.9 million head as of January 1, 2026—a 20‑year low—with CoBank warning they could shrink another 800,000 head before 2027. At the same time, 81% of domestic beef semen now goes into dairy cows, not beef herds. If you’re breeding cows, managing heifers, or signing milk and cattle contracts in 2026, that mix isn’t background noise. It’s the math that decides whether your breeding program keeps you ahead of the curve or leaves you short of replacements when the processor wants more milk. 

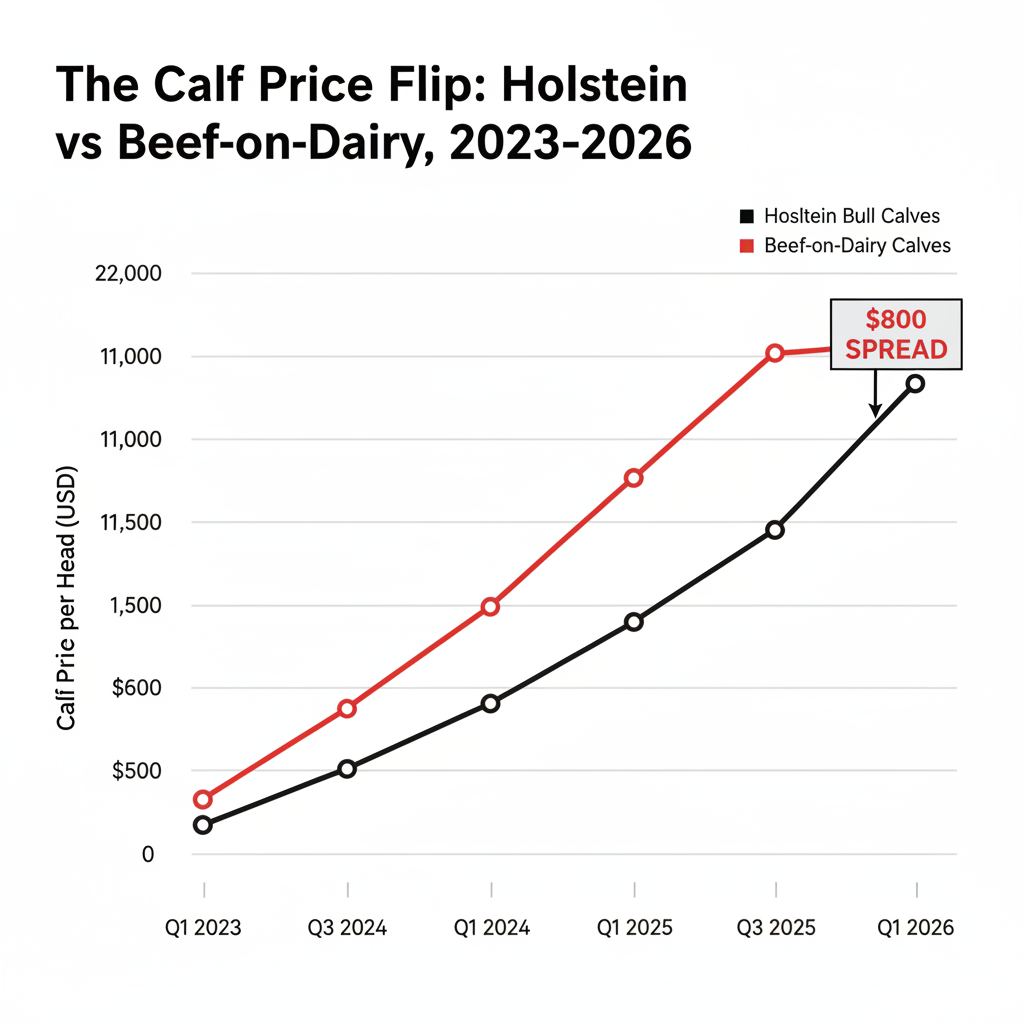
QuarterHolstein Bull Calf Price (USD)Beef-on-Dairy Calf Price (USD)Spread (USD)
Q1 2023$350$800$450
Q3 2023$450$1,100$650
Q1 2024$600$1,350$750
Q3 2024$750$1,500$750
Q1 2025$850$1,600$750
Q3 2025$900$1,700$800
Q1 2026$950$1,750$800

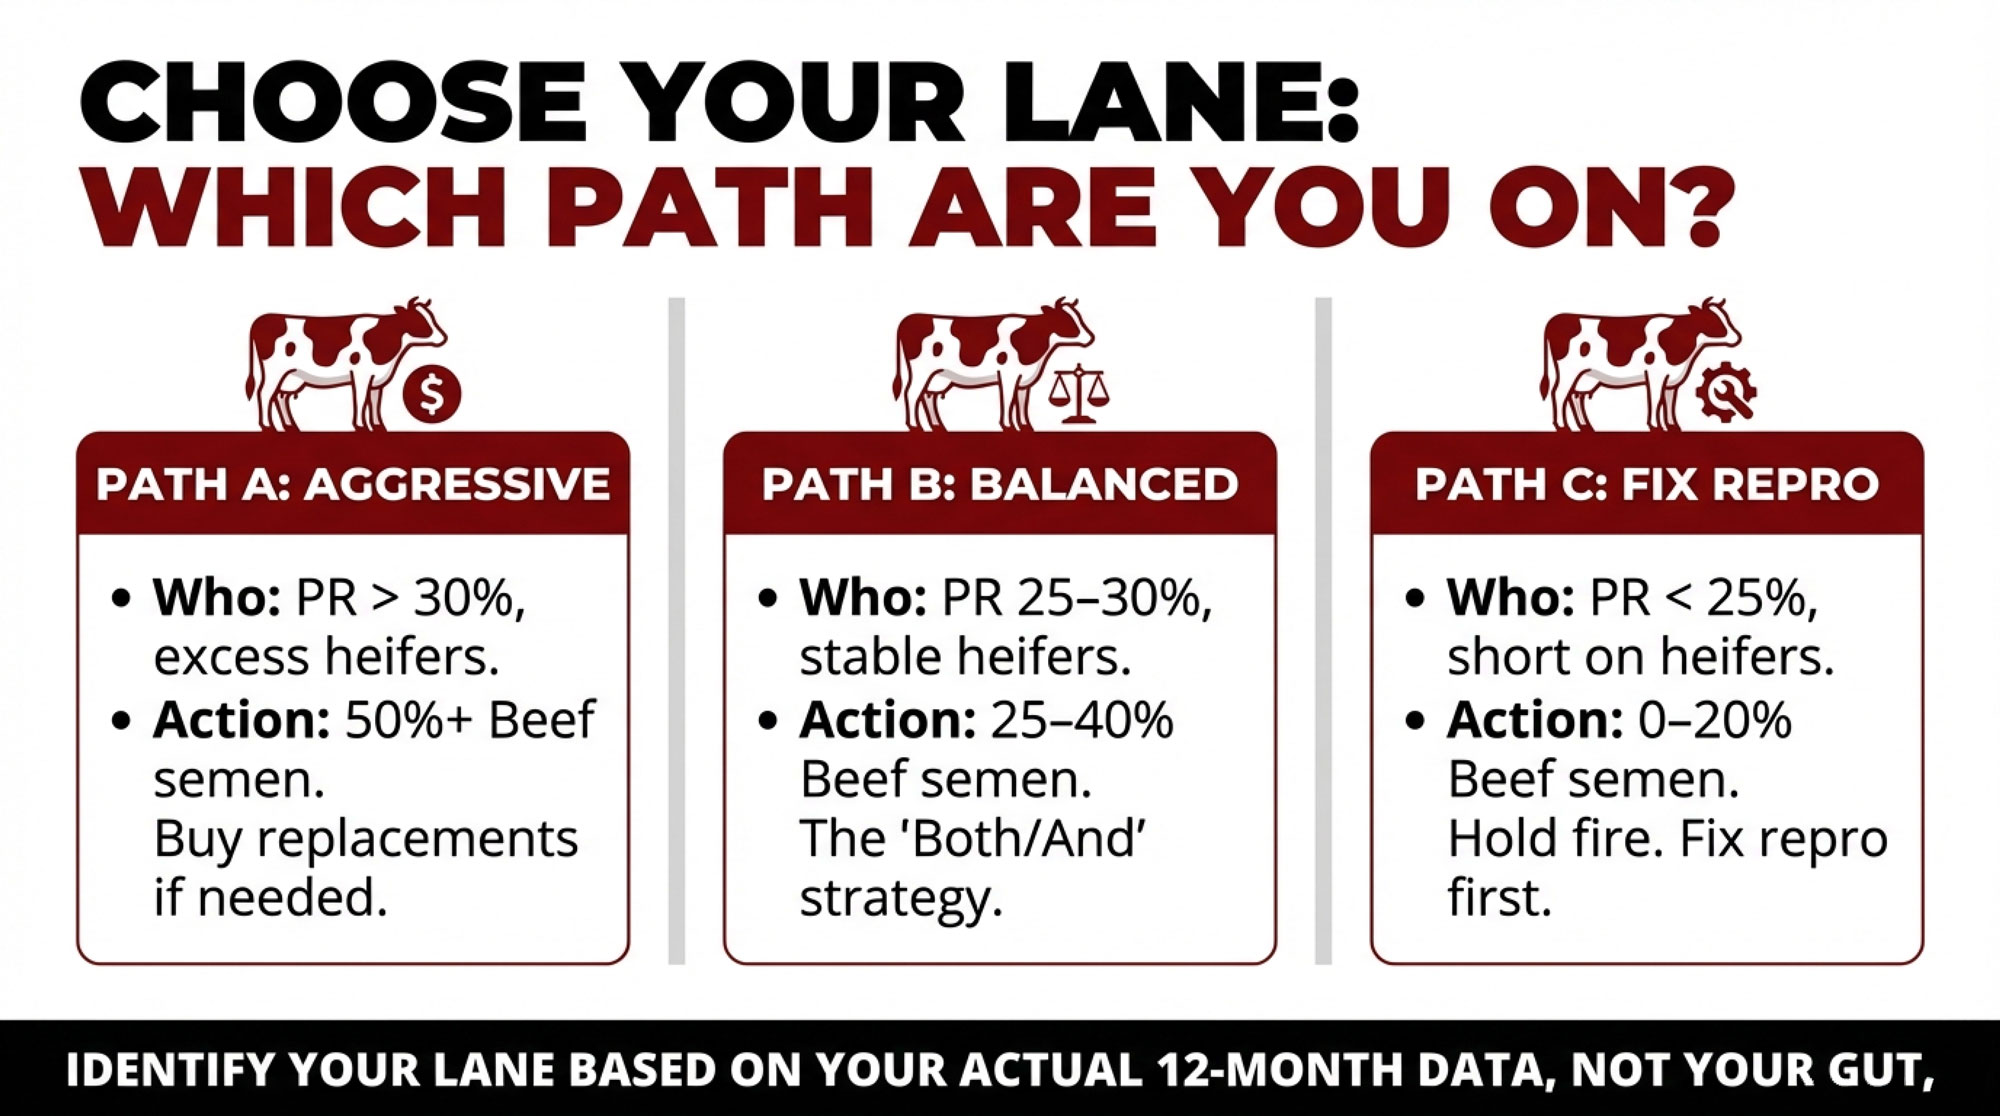
If you’re already selling calves, buying semen, and watching heifer checks climb, this is aimed squarely at you. The question isn’t “Should I try beef‑on‑dairy?” anymore. It’s: given your repro numbers and heifer pipeline, how hard can you lean into beef‑on‑dairy without blowing a hole in your future fresh pen?

The Beef‑on‑Dairy Premium You Can Actually See

For years, bull calves were the side hustle. They helped pay a bill or two but didn’t change your year.

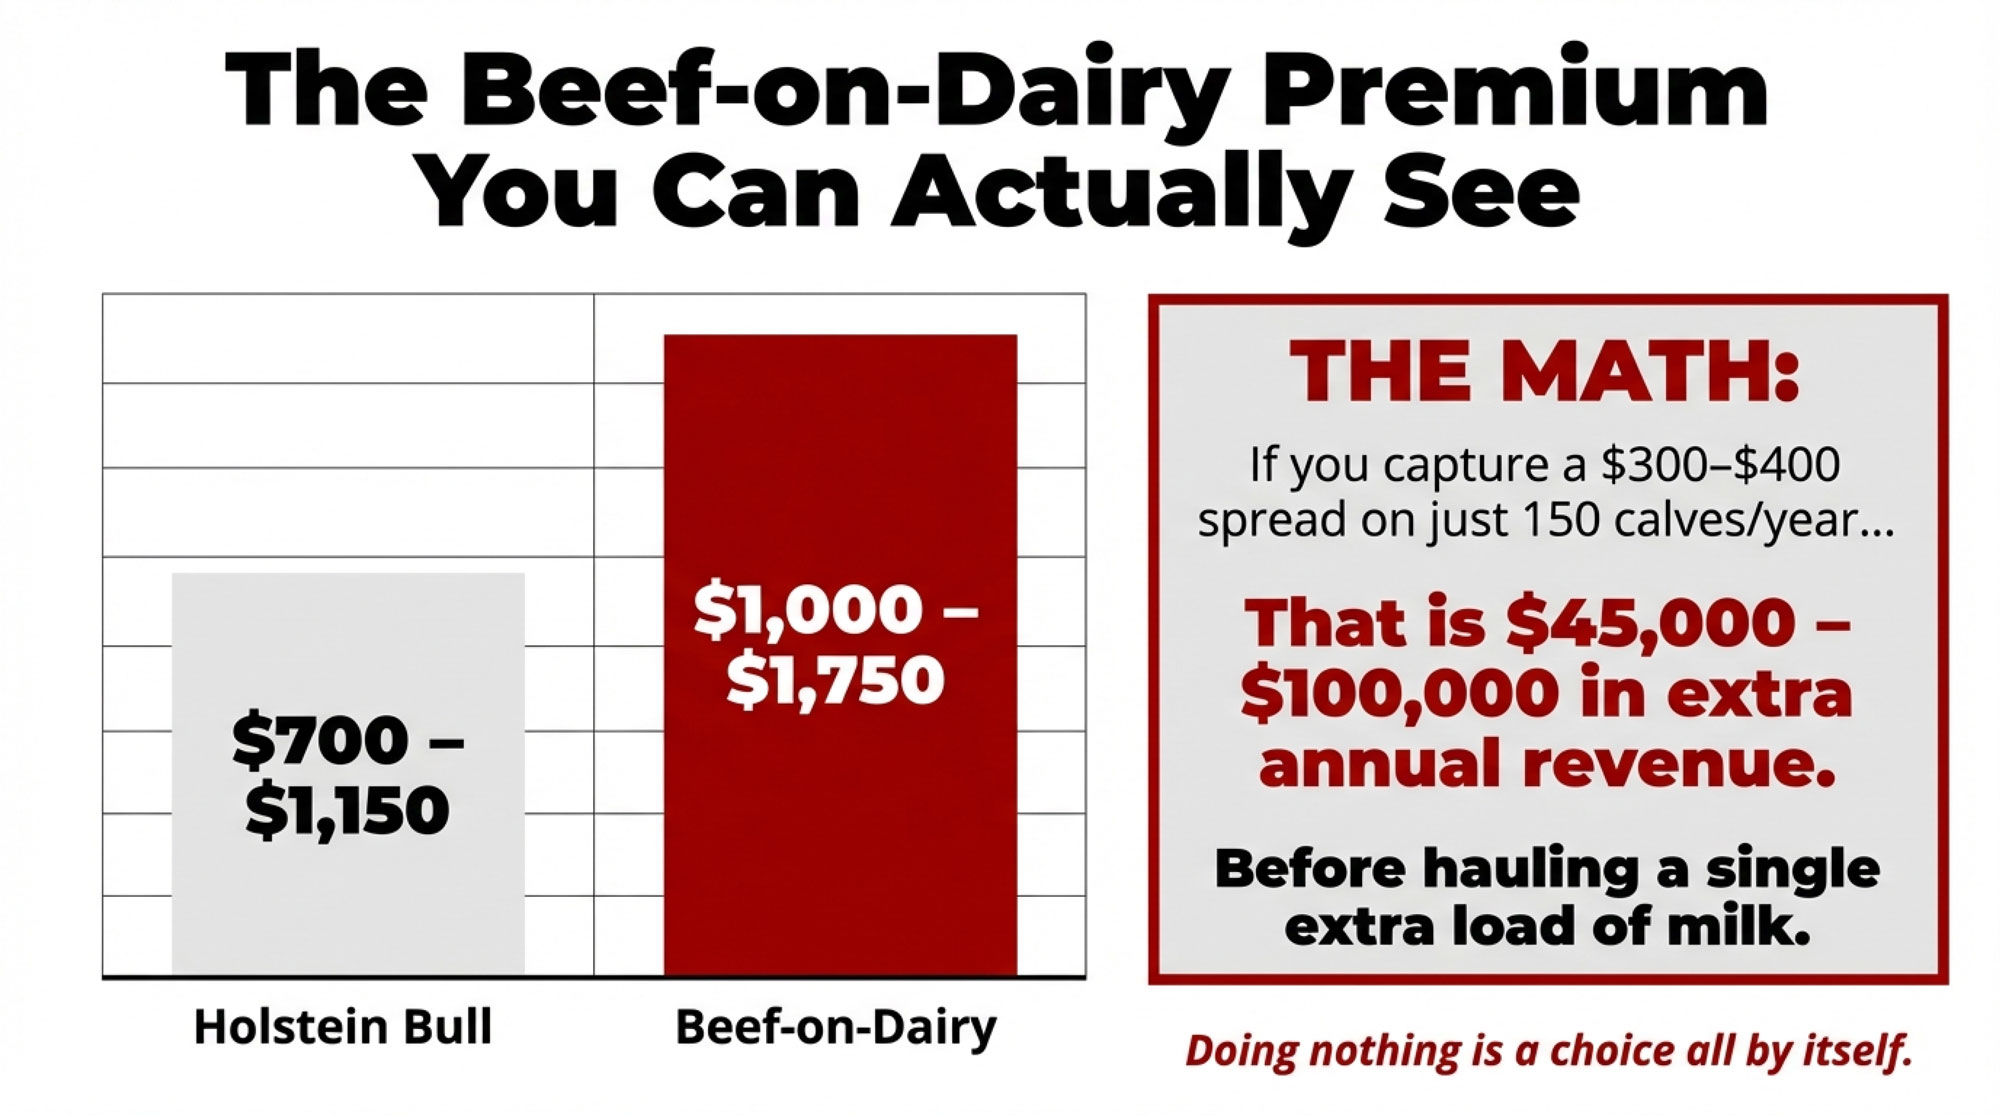
That flipped in late 2023 and into 2024. In sale barns across Wisconsin and Pennsylvania, newborn Holstein steer calves were bringing about $300–$450 per head, while beef‑cross calves hit as high as $1,750. Since then, a string of 2024–2025 market reports has pushed both numbers higher, with 2025 coverage noting newborn beef‑cross calves topping $1,500–$1,600 in Wisconsin and Premier’s January 2026 report listing beef‑dairy cross calves at $1,000–$1,750 and most Holstein bulls at $700–$1,150. 

Sale reports from central U.S. barns tell a similar story. At South Central Livestock Exchange in 2024, “baby calf” reports—a mix of dairy and dairy‑beef—showed ranges like $175–$875 and $200–$780 per head depending on quality and condition. You don’t even need a breed column to see the pattern: the top calves bring several hundred dollars more than the bottom tier. 

Since those 2023–2024 reports, national summaries from CattleFax‑linked analyses have pegged average day‑old beef‑on‑dairy calves around $1,400 in some U.S. markets, more than double levels from just a few years ago, while Holstein bull calves have also climbed. Exact numbers depend on your barn, your buyer, and this week’s market. The important part is the spread between plain Holsteins and well‑sired beef‑on‑dairy calves—and that spread has stayed real. 

Run that against your own numbers. If you can consistently capture even a $300–$400 per‑head spread on 150–250 calves a year by shifting from commodity Holstein bulls to well‑managed beef‑on‑dairy crosses, you’re talking roughly $45,000–$100,000 in extra annual revenue before you haul one extra load of milk. Your math will be different, but the dollars are big enough that “doing nothing” is a choice all by itself. 

How Hillview Turned Beef‑on‑Dairy Into a Revenue Engine

Jauquet’s Hillview Dairy in Luxemburg, Wisconsin, is the kind of place semen companies like to put on a brochure. They milk about 650 registered Holsteins in a cross‑ventilated freestall and have already been profiled for comfort, repro, and genetics. 

Herds like Hillview didn’t jump into beef‑on‑dairy for the novelty. They moved because the economics said they could get more per pregnancy. Their breeding pattern now looks a lot like what the economists have been running in their models: 

  • Sexed Holstein semen on the top of the herd—your highest‑index cows and heifers—to generate just the replacements you actually need. 
  • Beef semen on lower‑index cows and groups where making another heifer mostly adds cost, not value. 
  • A structured repro program (timed AI, close fresh‑cow work, and consistent heat detection) so expensive straws aren’t wasted on sloppy timing. 

An October 2021 paper in JDS Communications (“Economics of using beef semen on dairy herds”) found that once your 21‑day pregnancy rate hits roughly 20% or better, and once beef‑on‑dairy calves bring at least about 2x the price of straight Holstein bull calves, this “sexed on top, beef on the bottom” approach maximizes income from calves over semen cost—even when sexed semen is more than twice the price of conventional or beef semen. 

If your current repro and local calf markets look anything like that, you’re playing in the same lane as Hillview, whether you’ve admitted it yet or not.

Josh Hiemstra: Beef‑on‑Dairy as a Whole‑Farm System

Not every story here is about a big registered Holstein herd. Some are about getting every acre to pull its weight.

Hiemstra Dairy in Brandon, Wisconsin, milks about 170 cows and farms roughly 790 acres of owned and rented land in western Fond du Lac County. Josh Hiemstra farms with his family and has been profiled for his cover crops and soil‑health focus; he thinks in rotations and roots as much as in pounds and litres. 

In a 2024 Farm Progress feature, Josh laid out how beef‑on‑dairy fits his plan. He’d just sold a load of beef‑on‑dairy steers and heifers that averaged 1,400 pounds and brought $1.75 per pound—about $2,450 per head. Then came the line that stuck with a lot of dairymen: 

“I could have been smart and sold them as baby calves,” he admits. 

He didn’t, because on his farm:

  • He can push more corn through finishing cattle than through the milking herd. 
  • Older infrastructure—tower silos, a conventional parlor—fits a mixed dairy‑plus‑beef setup just fine. 
  • Cover crops and “odd” forages that don’t slot neatly into a high‑producing TMR fit nicely into beef rations. 

For Hiemstra, beef‑on‑dairy isn’t a side hustle bolted onto a dairy. It’s part of a whole‑farm plan to make soil, feed, facilities, and cattle all pull in the same direction.

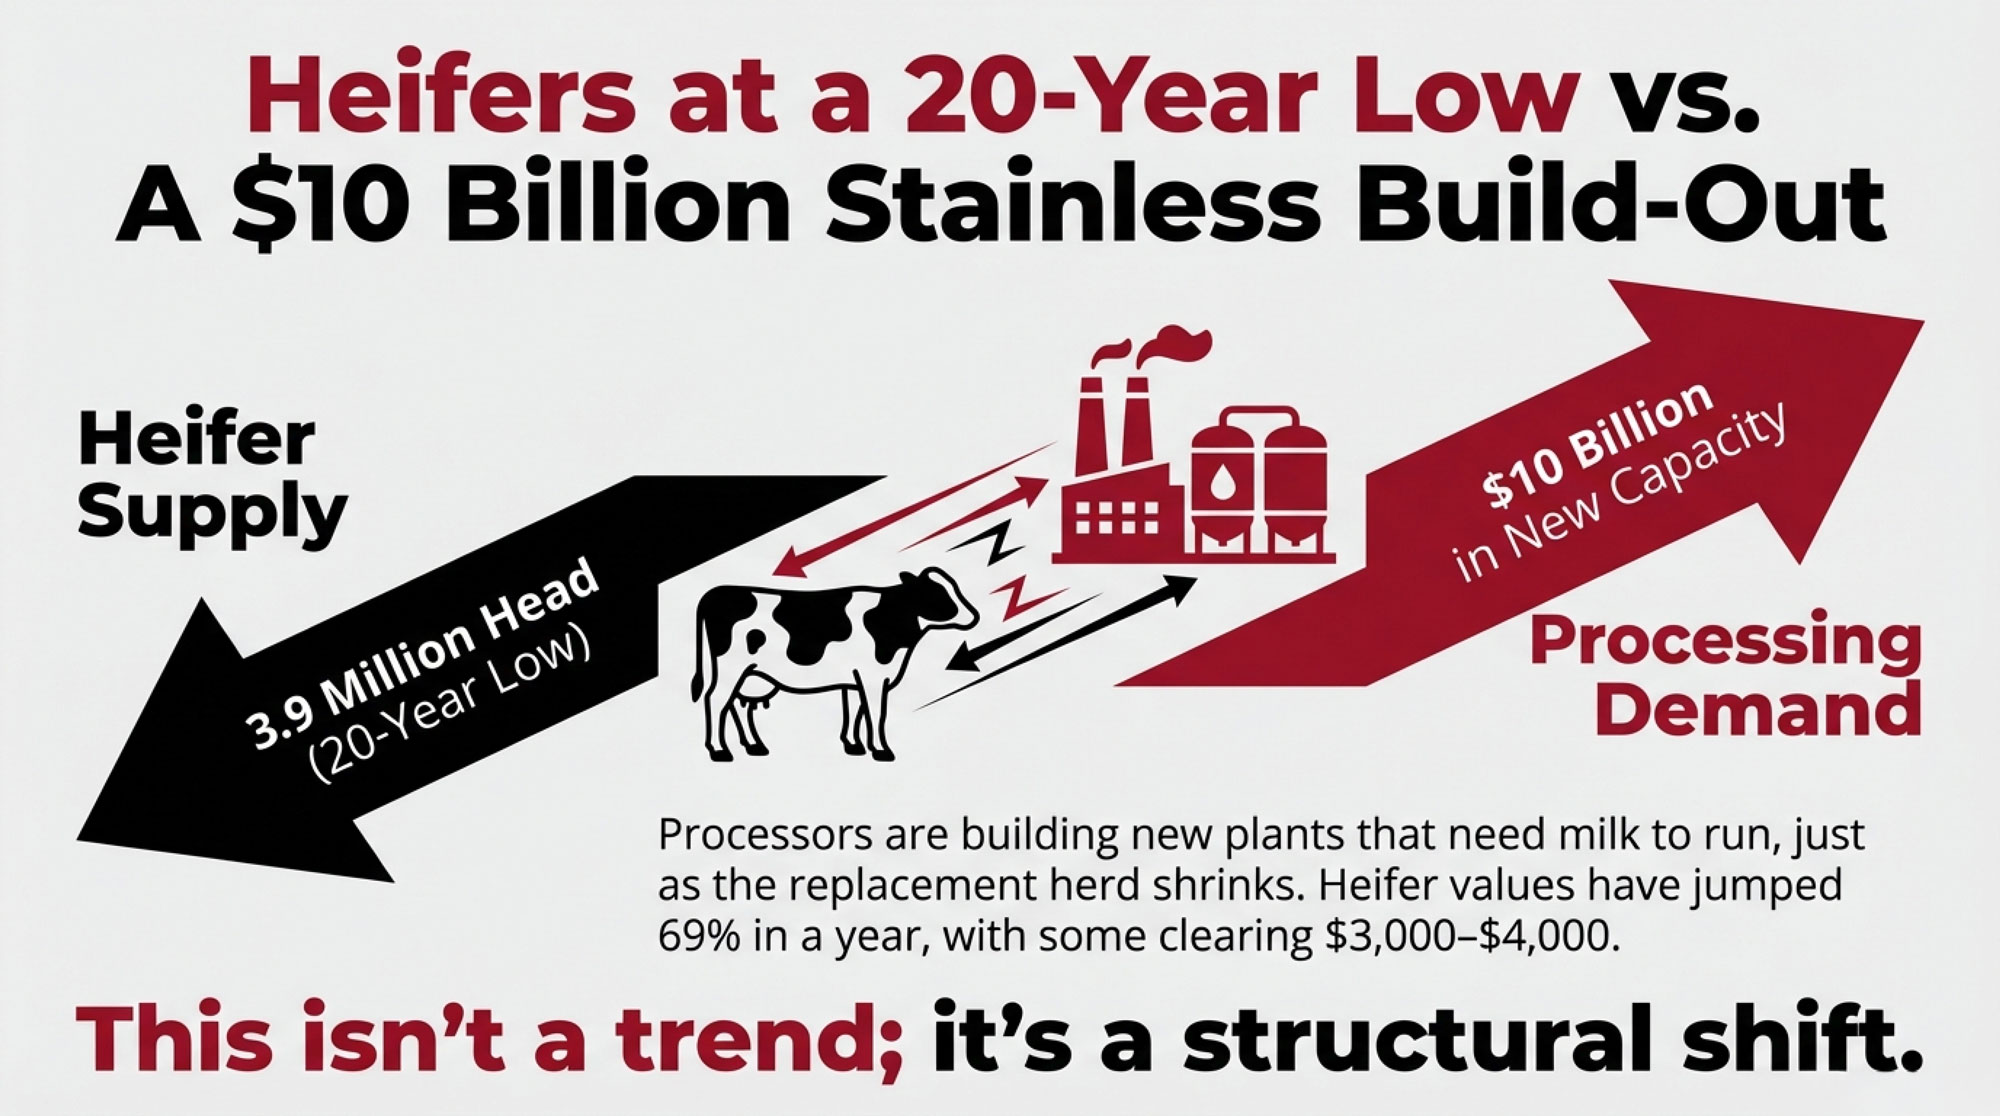
Heifers at a 20‑Year Low and a $10 Billion Stainless Build‑Out

Calf cheques feel good. Realizing you’ve starved your heifer pipeline does not.

CoBank’s August 2025 report “Dairy Heifer Inventories to Shrink Further Before Rebounding in 2027” pegs U.S. dairy replacement heifer inventories at a 20‑year low and projects they’ll shrink by another 800,000 head before they regain ground in 2027. USDA’s January 1, 2026, cattle report backs that up, putting milk replacement heifers at about 3.9 million head

YearReplacement Heifer Inventory (million head)Cumulative Processing Capacity Investment ($ billion)
20204.8$0.5
20214.6$1.2
20224.4$2.5
20234.2$4.0
20244.0$6.5
20253.9$8.5
2026*3.7$10.0
2027*3.5$10.5

At the same time, CoBank highlights a “historic $10 billion” wave of new and expanded dairy processing capacity—cheese plants, ingredient plants, and value‑added facilities—set to come online through 2027. That’s a lot of new stainless chasing milk from a smaller pool of replacements.

On prices, CoBank’s Corey Geiger notes that heifer values “have reached record highs and could climb well above $3,000 per head.” Brownfield’s read on Wisconsin data shows replacement dairy animals jumping 69% in a year—from $1,990 in October 2023 to $2,850 in October 2024—with some Northwest sales “north of $4,000 per head.” Other 2025 coverage points to bred dairy heifers in many U.S. markets trading north of $3,000, with top strings clearing $4,000

Every heifer you raise—or decide not to—now drags a much bigger number behind her than she did just a few years ago.

What Heifers Really Cost You

None of that means the right answer is to quit raising heifers. It does mean you should know, cold, what yours cost.

A 2019 economic analysis of pre‑weaning strategies found that:

  • Feed typically accounts for about 46% of heifer‑raising costs. 
  • Pre‑weaning costs alone can range from roughly $259 to $583 per calf, depending on housing, milk program, and labour. 

Once that calf gets to freshening, many 2024–2025 North American budgets put full heifer‑raising costs in the low‑to‑mid $2,000s per head, once you count feed, labour, interest, facilities, and death loss. 

On the market side, CoBank and regional reports point to bred heifers trading around and above $3,000 per head, with special sales and select strings in some regions bringing over $4,000

If your true cost to raise a heifer is running $2,300–$2,600, and local bred heifers are selling for $2,800–$3,200 or more, it’s perfectly rational to question the old “raise everything” reflex. 

A simple rule of thumb: if your full heifer cost is consistently more than about 10–15% above the going price for solid bred heifers in your region, it’s time to pressure‑test a buy‑vs‑raise strategy with your adviser or lender instead of assuming raising is always the cheaper, safer play. 

81% of Beef Semen Now Goes Into Dairy Cows

If you still think beef‑on‑dairy is a niche play for a few “progressive” herds, the semen market disagrees.

NAAB’s 2024 data shows 81% of all domestic beef semen sales now go onto dairy cows and heifers. Sexed dairy units keep climbing. Conventional dairy semen is getting squeezed from both sides. 

The 2021 JDS Communications economics work predicts exactly that pattern. In its most profitable scenarios, herds: 

  • Use sexed Holstein semen on the top‑ranked cows and heifers to generate replacements with the genetics they want.
  • Use beef semen on lower‑ranked or surplus animals, assuming beef‑on‑dairy calves bring at least about 2x the price of straight Holstein bull calves. 

In other words, the semen sales chart already looks a lot like the recommended playbook: sexed for replacements, beef for value‑added calves, and conventional dairy semen steadily losing ground.

Your 21‑Day Pregnancy Rate Is the Guard Rail

Here’s where good herds quietly get themselves into trouble: copying someone else’s beef‑semen percentage without copying their repro engine.

UW–Extension work and the JDS Communications paper both land on the same idea: beef‑on‑dairy is a “spare pregnancy” business. You use pregnancies you don’t need for replacements to make higher‑value beef‑on‑dairy calves. If you’re short on pregnancies or short on heifers, chasing beef premiums can saw through your replacement pipeline fast. 

High‑performing herds recognized by the Dairy Cattle Reproduction Council (DCRC) often run 21‑day pregnancy rates in the mid‑30s to low‑40s. Those herds have room to be aggressive with beef semen and still sleep at night about replacements. 

If your 21‑day pregnancy rate is in the teens or low‑20s, you’re running a different race.

Here’s a simple frame based on the modelling and what the top repro herds actually do—not a law, but a practical starting point: 

21‑Day Pregnancy RateSuggested Beef % of BreedingsWhat That Really Means
Under 20%0–10%Beef‑on‑dairy is a distraction; every dollar belongs in repro first.
20–25%20–30%Limited room; focus on sexed semen on top cows; use beef carefully.
25–30%30–45%A balanced “both/and” beef‑plus‑sexed strategy is realistic.
Over 30%50%+Aggressive beef use can work if you tightly manage the heifer inventory.

Those ranges line up with what the JDS Communications paper found and what DCRC‑type herds live every day. They’re guard rails, not commandments—but if your 21‑day PR is in the teens, cranking beef semen to 60% isn’t a bold strategy. It’s rolling the dice on your own replacement line. 

Sexed Semen: The Old Knock vs the New Data

A lot of producers formed their opinions about sexed semen back when the technology was taking a 20‑point hit on conception. 2010 called. It wants those assumptions back.

A 2023 review in Animals pulled together results from multiple European and Irish studies on beef‑on‑dairy strategies. It found that modern sexed semen often hits 80–90% of conventional semen’s conception rates under good management, especially in heifers, not the steep penalty many people still quote from memory. 

Both that review and the 2021 JDS Communications economics paper land on the same play: 

  • Use sexed semen on higher‑index animals so more of your replacements come from the top of the herd.
  • Use beef semen on lower‑index animals to turn surplus pregnancies into calves with a better paycheque.

You may still see a few points lower conception with sexed vs conventional, depending on your handling and cow group. But if sexed semen lets you trim your heifer pipeline back to what you truly need—and frees up more pregnancies for beef‑on‑dairy calves that bring roughly double the Holstein price—the total calf‑plus‑semen line on your P&L can still climb. 

So the real question isn’t “Is sexed semen good or bad?” It’s: what’s your actual cost per pregnancy with sexed, conventional, and beef semen, using your own conception rates and prices?

The Dornacker Plan: Crossbreeding, Robots, and Beef‑Ready Cows

Not every future‑proof herd is pure Holstein or built around banners.

Dornacker Prairies in Wisconsin is a fifth‑generation dairy with about 360 cows on roughly 1,000 acres, and about 90% of those acres are used to feed their own herd. Allen and Nancy Dornacker farm alongside Allen’s parents, Ralph and Arlene, and their four kids. They’ve been profiled internationally for blending robots, crossbreeding, and composting into a single system that works for their land and family. 

Over the last decade, they’ve: 

  • Installed Lely A5 robots starting in 2018, expanding from three units to six, with room for nine.
  • Adopted ProCROSS crossbreeding (Holstein × VikingRed × Montbéliarde) beginning in 2016 to improve fertility, health, and longevity.
  • Implemented composting that’s cut fertilizer purchases by about 80%.

Their crossbred herd averages around 9,200 kg of milk per cow per year (about 20,000 lb), with components near 4.6% fat and 3.6% protein—numbers that stack up nicely on a component‑based paycheque. 

In a herd like that, beef‑on‑dairy is one more lever, not the whole story. Crossbred cows with stronger fertility give you more room to decide which lactations get beef vs sexed dairy semen. Moderate‑sized, robot‑friendly cows fit tighter breeding programs. Beef‑on‑dairy calf revenue stacks on top of genetics and facilities built around long‑term family ownership, not just next month’s cash flow. 

If your focus is banners and purebred marketing, this path comes with trade‑offs. If your focus is a resilient commercial herd your kids might actually want to run, it’s worth a serious look.

AttributeHillview Dairy (Luxemburg, WI)Hiemstra Dairy(Brandon, WI)Dornacker Prairies(Wisconsin)
Herd Size & Type~650 registered Holsteins~170 cows, mixed dairy-beef finishing~360 cows, 90% crossbred (ProCROSS)
Key InfrastructureCross-ventilated freestall, high-comfort housingTower silos, conventional parlor, 790 acres cropland6 Lely A5 robots (room for 9), on-farm composting
Breeding ApproachSexed Holstein on top 30% of herd + high-index heifers; beef on lower-index cowsBeef-on-dairy for finishing on-farm; corn pushed through cattle, not just milkProCROSS (Holstein × VikingRed × Montbéliarde) base; beef on select lactations
Beef-on-Dairy StrategyStructured AI program; calving-ease beef sires; sell calves at premiumFinish beef-cross steers/heifers to ~1,400 lb at $1.75/lb(~$2,450/head)Crossbred fertility gives “spare pregnancies”; beef semen on lower-value lactations
Why It Works for Them21-day PR 30%+(estimated); consistent heifer surplus; registered genetics pay premiumCover crops + “odd” forages fit beef rations; old infrastructure = low overheadRobot-friendly moderate-frame cows; strong fertility (crossbreeding); family succession plan
Main Constraint They ManageHeifer inventory—must keep sexed-semen conception highLand base & feed logistics (790 acres, finishing cattle on-site)Balancing milk components (4.6% fat, 3.6% protein) with beef-calf revenue

The Beef‑on‑Dairy Gold Rush Has a Downside

It’s easy to get starry‑eyed about $1,400 calf stories. Here’s the part that keeps you out of trouble.

The same 2023 Animals review that highlights beef‑on‑dairy’s upside also flags real risks when beef sires get sprayed across dairy cows without enough planning: 

  • Longer gestation with some beef breeds, stretching calving intervals, and tying up stalls. 
  • Higher dystocia and stillbirth rates in certain beef × Holstein crosses when calving ease isn’t prioritized. 
  • Welfare and marketing problems occur when calves don’t meet buyer expectations on growth, muscling, or carcass traits. 

On the fed‑cattle side, Kansas State’s grid‑pricing work shows that cattle outside packer specs on weight, yield, or quality take meaningful discounts. Poorly planned beef‑on‑dairy crosses—wrong frame, wrong fat cover, wrong muscling—are more likely to land in those discounted buckets. 

If you:

  • Chase beef‑on‑dairy premiums with sires that add too much birthweight or gestation,
  • Ignore calving‑ease and carcass traits when picking beef bulls for dairy cows, and
  • Don’t align your calves with what your buyer, feedlot, or packer actually wants,

you can watch the “gold rush” vanish into dead calves, extra days open, and grid deductions. 

The herds that will still be glad they leaned into beef‑on‑dairy five years from now are already:

  • Using calving‑ease beef sires validated on dairy crosses. 
  • Matching sires to specific buyer or grid specs, not just grabbing “any Angus” off the sheet. 
  • Tracking calf health, growth, and sale prices in their own records instead of assuming every beef‑cross calf lands at the top of the market. 

What This Means for Your Operation

Beef‑on‑dairy is not a yes‑or‑no question. It’s a strategy that has to fit your repro, heifers, feed base, and markets.

Most herds will land in one of three lanes.

Path A: Aggressive Beef (50%+ of Breedings)

You’re here if:

  • Your 21‑day pregnancy rate runs around 30% or higher
  • You’ve consistently had more heifers than you truly need. 
  • You have reliable outlets for beef‑on‑dairy calves or your own finishing capacity. 

What it looks like:

  • The top 20–30% of cows and most heifers get sexed Holstein semen, selected on Net Merit, DWP$, or your index of choice. 
  • The bottom 50–70% of cows receive beef semen from calving‑ease, dairy‑tested sires that meet buyer specs. 
  • You’re willing to buy replacements when the heifer market says that beats raising every last one yourself. 

Path B: Balanced Strategy (25–40% Beef)

You’re here if:

  • Your 21‑day pregnancy rate sits in the 25–30% band. 
  • You’re mostly okay on heifers—short in some years, long in others.
  • You have decent calf markets but no locked‑in premium contract. 

What it looks like:

  • The top 30–40% of cows and heifers get sexed dairy semen.
  • The bottom 25–40% of cows go to beef.
  • Conventional dairy semen still has a role where it wins on cost per pregnancy. 

A lot of 300–800‑cow herds are going to live here for a while as they keep nudging repro higher.

Path C: Fix Repro First (0–20% Beef)

You’re here if:

  • Your 21‑day pregnancy rate is under about 25%.
  • You’re short on heifers and stretching days‑in‑milk. 
  • Your risk budget feels pretty thin.

What it looks like:

  • Beef semen is used sparingly—older cows, obvious genetic culls, maybe a small test group.
  • Most of your cash goes into repro and cow performance: transition, heat detection, cow comfort, and vet work. 

If you’re in Path C, the smartest beef‑on‑dairy move may be to hold your fire. Get your repro into the mid‑20s or 30s first. The beef premiums will still be there when you’ve actually got pregnancies to spare.

Your 90‑Day Action Plan

Here’s how you turn this from a good read into a working plan on your farm.

Next 30 days

  1. Pull your 12‑month 21‑day pregnancy rate.
    Use your herd software or DHI reports, not a guess. That number tells you if Path A, B, or C is even on the table. 
  2. Calculate your full heifer cost.
    Use your 2024 books—feed, labour, interest, bedding, facilities, and death loss. If you need a framework, start from a university heifer‑raising budget or sit down with your lender and walk through your numbers line by line. 

Next 60 days

  • Get real local calf price ranges.
    Talk directly to your sale barn or calf buyer. Ask what they’ve actually been paying for Holstein bull calves vs beef‑on‑dairy calves in your weight bands over the last 60–90 days. Use that spread—not coffee‑shop talk—as your baseline. 
  • Sit down with your AI and genetics rep.
    Bring cow and heifer index lists, cull data, and heifer counts. Map how many replacements you truly need, and which animals can shift to beef semen without starving your fresh pen 18–24 months from now. 

Next 90 days

  • Run a pilot, not a revolution.
    If your repro supports it, move 20–30% of breedings to carefully chosen beef semen for one breeding season. Track breedings, conceptions, calvings, calf weights, and sale prices. Let your own numbers, not somebody else’s story, tell you whether to ramp up or back off. 
  • Check your risk tools.
    USDA’s Livestock Risk Protection (LRP) program has expanded coverage options in recent years, including coverage tied to feeder cattle and calf prices in general. Talk with your insurance agent or extension specialist about whether any current LRP products fit the kind of calves you’re producing and how you market them. 

While you’re at it, read your milk cheque and the fine print of your contract. If your processor is paying for components, animal care, or specific beef‑on‑dairy traits, those lines belong in the same spreadsheet as semen prices and calf bids. 

TimelineAction StepWhat to Calculate or AskWhy It Matters
Next 30 Days(Step 1)Pull your 21-day pregnancy rateUse herd software or DHI—12-month rolling average, not a guessTells you if Path A, B, or C is even on the table; this number is your beef-semen budget
Next 30 Days(Step 2)Calculate your full heifer costFeed + labor + interest + facilities + death loss from 2024 booksIf your cost is >10–15% above local bred-heifer prices, raising every heifer is leaving money on the table
Next 60 Days(Step 3)Get real local calf pricesCall sale barn or buyer: What did Holstein bulls vs beef-cross calves actually bring in last 60–90 days?Use that spread—not coffee-shop gossip—as your baseline; if spread is <$300/head, beef-on-dairy math gets harder
Next 60 Days(Step 4)Sit down with AI/genetics repBring cow index lists, cull data, heifer counts; map how many replacements you truly needPrevents the classic mistake: copying someone else’s beef-% when their repro and heifer pipeline are 20 points stronger than yours
Next 90 Days(Step 5)Run a pilot, not a revolutionMove 20–30% of breedings to beef semen for one breeding season; track breedings, conceptions, calvings, calf weights, sale pricesLet your numbers tell you whether to ramp up or back off—not somebody else’s story at the sale barn
Next 90 Days(Step 6)Check your risk toolsTalk to insurance agent about USDA Livestock Risk Protection (LRP) for feeder cattle/calf price coverage; read milk contract fine print for component or beef-calf incentivesIf your processor pays for specific traits or your calf market swings hard, these lines belong in the same spreadsheet as semen prices

Key Takeaways

  • Beef‑on‑dairy calves are bringing several hundred dollars more per head than Holsteins in many U.S. markets—Holstein calves that used to bring $300–$450 are now commonly $700–$1,000 in strong markets, while beef‑cross calves are topping $1,500–$1,750 in parts of Wisconsin and over $1,000 in Pennsylvania and other key regions. 
  • Heifer economics have flipped fast. CoBank says inventories could shrink by another 800,000 head before 2027, while Wisconsin replacement values jumped 69% in a year, and many U.S.-bred heifers now sell north of $3,000, with some lots over $4,000
  • Beef‑on‑dairy works best long‑term when repro and heifer numbers are strong. Modelling shows the math starts to work above roughly 20% 21‑day PR and 2x calf price, with herds in the 30–40% band having the most flexibility. 
  • There’s a real downside if you pick the wrong beef sires or ignore carcass specs. Longer gestations, harder calvings, and packer grid discounts can erase calf‑price gains very quickly. 
  • The herds that will still be happy with beef‑on‑dairy in five years are matching sexed and beef semen to their own numbers—pregnancy rate, heifer needs, feed base, and actual buyers—not to the latest rumour at the sale barn. 

The Bottom Line

You don’t have to milk 650 cows in Luxemburg or farm 790 acres in Fond du Lac County to make this work. But, like those families, you do have to pick a lane and live with the math that comes with it. 

So when you look back on 2026, a year from now, do you want to say, “We finally lined up our breeding plan with our numbers,” or still be loading $700 Holstein bull calves while your buyer’s paying a lot more for the right beef‑on‑dairy cross?

Complete references and supporting documentation are available upon request by contacting the editorial team at editor@thebullvine.com.

Learn More

The Sunday Read Dairy Professionals Don’t Skip.

Every week, thousands of producers, breeders, and industry insiders open Bullvine Weekly for genetics insights, market shifts, and profit strategies they won’t find anywhere else. One email. Five minutes. Smarter decisions all week.

NewsSubscribe
First
Last
Consent

878 Herds. 108.3% Average. 116.4% at the Top. Where Does Your BAA Rank on Holstein USA’s 2025 Lists?

878 herds. 108.3% average. 116.4% at the top. If you’re classifying Holsteins, you should know exactly where your BAA lands on that scale.

Executive Summary: Holstein Association USA’s 2025 BAA lists recognize 878 Registered Holstein herds that averaged 108.3% BAA on about 66 classified cows per herd, capped by a 116.4% herd at the very top. Breed Age Average values compare your cows and herd average to the breed average while adjusting for age and stage of lactation, so one number tells you how your herd’s type really stacks up. The article breaks down the Overall Top 200 herds, the Top 25 by herd-size bracket, and the leading college and university herds to show what high-BAA programs look like from 10‑cow show strings to 500‑cow-plus operations. It then gives you a four-step playbook: benchmark your BAA against the 108.3% group, use individual classification and linear traits to find which cows are pulling your score up or down, align matings with Holstein’s TPI index, and decide how hard to lean on your BAA in marketing. Holstein is explicit that classification data help identify the most profitable and valuable animals and add “definite marketability” to Registered Holsteins, and that breeding under the updated TPI formula is designed to deliver greater profit, efficiency, and fertility over time. Together, BAA, classification reports, and TPI give you a consistent, numbers-driven way to see whether your type program belongs with herds now averaging above 108% BAA—or whether your next round of matings needs to push type harder to get there.

Holstein Association USA’s latest Breed Age Average (BAA%) rankings put hard numbers on herd-level type in 2025: 878 herds, an average BAA of 108.3%, and an elite group pushing up to 116.4%. In a Registered Holstein market where classification data are used to identify the most profitable and valuable animals and to add “definite marketability” to your cows, your BAA is one of the clearest summary numbers other people can use to see how your herd stacks up inside the same classification framework Holstein Association USA uses across its membership. 

What BAA Really Measures

The Holstein Breed Age Average (BAA%) value provides a way to compare an animal’s score and the herd average with the breed average, taking into account the animal’s age and stage of lactation.  This calculation puts cows of all ages on a more level playing field and turns a barn full of individual scores into a single number that reflects herd-level type. 

BAA is based on results from Holstein Association USA’s linear classification program, where classifiers evaluate 17 individual traits in five major breakdowns to help breeders “breed, develop and market higher producing, more durable cows.”  All animals receive an individual BAA value on the herd classification report, and members utilizing the Classic or Standard options of the Holstein classification program receive an overall BAA for their herd, which can be used to see how their classified cows compare to the broader Registered Holstein population. 

For the 2025 high-ranking BAA lists, Holstein Association USA specifies that if a herd was classified twice between January 1 and December 31, 2025, and received an official herd BAA both times, only the most recent official BAA was used, and herds needed at least 10 cows included in the BAA calculation to appear on the lists.  Holstein’s herd classification policies also specify how cows canceled on the day of classification are treated in the herd inventory and when they may be excluded from the official herd BAA, including provisions related to cows in the lowest ten percent of the herd by BAA. 

2025 By the Numbers

Holstein Association USA reports that in 2025, 878 herds had a BAA value eligible for inclusion on the high-ranking lists.  Across those herds, an average of 66 cows per herd were included in the BAA calculations, so the numbers represent whole breeding programs, not just a few standout cows.  For this group, the average BAA was 108.3%, indicating these herds are scoring well above the breed average as expressed in BAA. 

The 2025 high-ranking BAA release is organized into three main list types:

  • Overall Top 200 BAA Herds
  • Top 25 BAA Herds by Herd Size
  • Top BAA Herds for Colleges and Universities

Holstein Association USA has used a similar format in earlier high-ranking BAA lists, which also recognized top herds overall, by herd-size bracket, and at colleges and universities. 

A quick snapshot of the 2025 top BAA levels by herd-size bracket shows how far above that 108.3% average the very top herds are:

Herd-size bracketTop BAA 2025Example herd (prefix)Cows scored
1–45 cows116.4ROCKY-TOP (TN)12
46–70 cows115.5CURR-VALE (NY)46
71–107 cows114.8CONANT-ACRES (ME)85
108–249 cows112.8RIDGEDALE (NY)108
Over 250 cows110.8KAMPY (WI)294

All values in this table come directly from Holstein Association USA’s high-ranking BAA lists. 

The 200 Elite: Who’s Pushing 115+ BAA

At the top of the 2025 Overall Top 200 BAA Herds list is ROCKY-TOP (Matthew T. Mitchell, TN) with a 116.4 BAA on 12 cows, the highest BAA reported on the 2025 lists.  Just behind are several other well-known Registered Holstein herds: 

  • BUTLERVIEW (Jeffrey Jet Butler, IL) – 115.9 BAA on 32 cows
  • JUNIPER (Juniper Farm Inc, ME) – 115.6 BAA on 22 cows
  • T-TRIPLE-T (Triple-T Holsteins, OH) – 115.5 BAA on 23 cows
  • MILKSOURCE (Milk Source LLC, WI) – 115.5 BAA on 32 cows
  • CURR-VALE (Currie Holsteins, NY) – 115.5 BAA on 46 cows
  • DUCKETT (Michael & Julie Duckett, WI) – 115.4 BAA on 37 cows 

The rest of the Top 200 is filled with prefixes that Registered Holstein breeders will recognize—TOPP-VIEW, CONANT-ACRES, LADY-LUCK, BUDJON, SPRINGHILL-OH, HUMDINGER, MILK&HONEY, RETSO, LIDDLEHOLME, ROCK-N-HILL-II, and many others—holding BAAs from the mid‑110s down into the high‑100s on herd sizes ranging from 10 cows to over 100.  Several of these prefixes also appear in earlier high-ranking BAA lists and in news coverage, indicating a sustained focus on herd-level type in those breeding programs. 

Holstein Association USA notes that classification and the resulting type information can be used “to make mating decisions,” to identify “the most profitable and valuable animals in your herd,” and to “add definite marketability to your Registered Holsteins,” which helps explain why breeders pay attention to where they stand on this kind of list.

Top 25 BAA Herds by Herd Size

To ensure both smaller and larger herds are recognized, Holstein Association USA ranks high BAA herds in herd-size brackets, a format that matches how earlier high-ranking lists have been presented. 

1 to 45 Cows

In the smallest bracket—often tie-stall or show-focused herds—every cow has to be there on purpose:

  • ROCKY-TOP (TN) – 116.4 BAA on 12 cows
  • BUTLERVIEW (IL) – 115.9 BAA on 32 cows
  • JUNIPER (ME) – 115.6 BAA on 22 cows
  • T-TRIPLE-T (OH) – 115.5 BAA on 23 cows
  • MILKSOURCE (WI) – 115.5 BAA on 32 cows
  • DUCKETT (WI) – 115.4 BAA on 37 cows 

Other high-ranking herds in this bracket include TOPP-VIEW (Eric A. Topp, OH), LADY-LUCK (OH), SPRINGHILL-OH (OH), SHADOW-W (OH), JW-AGHAMORA (NY), SUNROSE (IN), MILK&HONEY (NJ), EXCELERANT (WI), NISE-N-FANCY (IN), LOOKWELL (IN), and several more, all above 113 BAA on 10–45 cows. 

46 to 70 Cows

In mid-sized herds, more cows need to hit the mark to keep BAA high consistently:

  • CURR-VALE (NY) – 115.5 BAA on 46 cows
  • BUDJON (WI) – 114.7 BAA on 48 cows
  • HUMDINGER (NY) – 114.5 BAA on 51 cows
  • SWEET-PEAS (PA) – 113.8 BAA on 57 cows
  • RETSO (NY) – 113.7 BAA on 51 cows 

Also in this bracket are LIDDLEHOLME, ROCK-N-HILL-II, WHITTIER-FARMS, DAN-J-LAN, CRISDHOME, HEADWATER, MCWILLIAMS, LONDONDALE, CARPSDALE-J, PLUM-LINE, SONNEN, MOONDALE, UNIQUE-VIEW, C-COVE, INTRIGUE, HENKESEEN, STAR-SUMMIT, KEYSTONE, SHEEKNOLL, GREAT-HERITAGE, and WILONNA, with BAAs in the low‑112s to mid‑111s on roughly 50–72 cows. 

71 to 107 Cows

Once you reach 71–107 cows, herd BAA reflects type across a sizeable milking string:

  • CONANT-ACRES (ME) – 114.8 BAA on 85 cows
  • SCARLET-SUMMER (PA) – 114.0 BAA on 89 cows
  • JEFFREY-WAY (WI) – 113.5 BAA on 100 cows 

The rest of this bracket includes ETGEN-WAY, ROEDALE, LYN-VALE, PLAINFIELD, GARDEN-STATE, ELMLO, CRYSTAL-OAK, SHORESBROOK, ACK-LEE, POSTHAVEN, NOR-RICH-ACRES, WALK-ERA, PENN-DELL, POTTSDALE, EVANS-H, FLANNERY-VU, MILGENE, CASTLEMONT, WALHOWDON, and ELM-SPRING, all running from the low‑112s down into the high‑110s on 72–107 cows. 

108 to 249 Cows

At 108–249 cows, the top BAA herds show that herd size and type can scale together:

  • RIDGEDALE (NY) – 112.8 BAA on 108 cows
  • COCALICO (PA) – 111.9 BAA on 115 cows
  • LANTLAND (NY) – 111.0 BAA on 127 cows
  • JOLEANNA (NY) – 110.8 BAA on 124 cows
  • OLMAR (MN) – 110.4 BAA on 126 cows
  • MILEY (OH) – 110.3 BAA on 178 cows 

Other herds in this group include SCHWOEPPES, MORRILL, GROVES-VU, SILVER-SHEA, J-KIKO, S-PINE-LAWN, BRYERSQUART, JMK, WIEBER, MONANFRAN, CAPSTONE, MAYPAR, WOODEDGE, BUCKS-PRIDE, DONRU, COUNTRY-HEART, MELL-WOOD, RE-MARKEL, MID-KNIGHTONEEDA, and WISCIT (University of Wisconsin–Platteville), with BAAs from 110.0 down into the upper‑107s and herd sizes between about 108 and 249. 

Over 250 Cows

The largest bracket shows that very big herds can still rank well above average on type:

  • KAMPY (Kamphuis Farms LLC, WI) – 110.8 BAA on 294 cows
  • ARB-FLO-SPR (MD) – 110.3 BAA on 342 cows
  • ESKDALE (UT) – 109.8 BAA on 301 cows
  • ROYAL-VISTA (WI) – 109.3 BAA on 330 cows
  • TRENT-WAY (WI) – 109.2 BAA on 429 cows 

Rounding out the Top 25 in this size class are K-HURST, BRIGEEN, HORNLAND, WARGO-ACRES, SRNKA, SUGAR-C, JENNY-LOU, L&N, JER-LENE, JUNLYN, HERON-RUN, KELLERCREST, VIADUCT, H-C-H, ARIWAMI, URSA-GRASS, MEADO-BROO, WIRTLAND, HYLIGHT, and HILL-LINE, all with BAAs between the high‑108s and mid‑104s on 250–564 cows. 

Taken together, these brackets show that high-ranking BAA herds are producing a type that stands out compared to the broader Registered Holstein population, whether they milk 20 cows or several hundred. 

Colleges, Universities, and the Future of Type

Holstein Association USA’s Top College & University Herds list highlights where future dairy professionals are learning how classification and herd-level type look in real teaching and research settings.

For 2025, the top college and university herds by BAA are:

  • C-OF-O (College of the Ozarks, MO) – 109.9 BAA on 42 cows
  • UTAG (Utah State University, UT) – 109.7 BAA on 64 cows
  • POLY (Cal Poly Corporation, CA) – 108.2 BAA on 86 cows
  • UCONN (University of Connecticut, CT) – 108.0 BAA on 50 cows
  • UVM-CREAM (VT) – 107.7 BAA on 63 cows
  • WISCIT (University of Wisconsin–Platteville, WI) – 107.4 BAA on 161 cows
  • OK-STATE (Oklahoma State University, OK) – 107.2 BAA on 21 cows
  • CSUF (California State University, Fresno, CA) – 107.1 BAA on 61 cows
  • LSU-SERS (Southeast Research Station, LA) – 106.4 BAA on 81 cows
  • NCSU (North Carolina State University, NC) – 106.1 BAA on 61 cows 

These herds expose students and young professionals to the type programs that appear on national BAA lists, and that exposure can shape how they think about herd-level conformation in their future careers. 

How to Use Your BAA in 2026

Holstein Association USA is clear about what classification and the resulting type information are for: helping breeders make mating decisions, identify “the most profitable and valuable animals” in the herd, and “add definite marketability” to Registered Holsteins.  The BAA number is one of the simplest herd-level summaries of that type of information.

Here’s a practical way to put your BAA to work alongside classification reports and genetic indexes:

  • 1. Benchmark your herd against 2025 results.
    • Compare your current herd BAA to the 108.3% average reported for the 878 herds on the 2025 high-ranking lists. 
    • Then look at the 2025 herd-size bracket that matches your operation and see where your BAA sits relative to the herds in that group. If your herd BAA has been relatively flat over several classification rounds while the 2025 high-ranking group averages 108.3%, that can be a useful signal that your type program is tracking differently than the herds highlighted on these lists. 
  • 2. Use individual scores to see what’s helping or hurting.
    • Review individual cow classification and linear traits to see which cows and cow families are consistently above or below where you want them to be on feet and legs, udder, dairy strength, and other key traits.
    • Use that information to identify animals that are raising your herd’s type profile versus those that may be limiting your BAA, keeping Holstein’s herd-classification policies in mind when deciding which cows stay in the classification pool.
  • 3. Align your breeding plan with your type goals.
    • Holstein Association USA’s TPI index combines production, type, and health traits into a single selection index, and breeding cows based on the updated TPI formula is designed to result in more profit, efficiency, and fertility. 
    • Where your herd is weaker on type, consider placing greater emphasis on bulls with strong conformation indexes and linear traits that address those specific weaknesses, while still maintaining production and health targets that align with your market and breeding goals. 
  • 4. Decide how visible your BAA should be in marketing.
    • Holstein notes that classification and type information can add marketability to Registered Holsteins, and a strong herd BAA is one way to demonstrate that your herd’s conformation stands above the average of the breed on a BAA basis. 
    • If your BAA is competitive within your herd-size bracket or approaches the levels seen on the 2025 Top 200 list, consider including it alongside production and classification highlights in your advertising, website, and sale catalogs so buyers can see that herd-level type benchmark. 

Holstein Association USA does not publish a fixed dollar value for each BAA point, and this article does not assign one. What the 2025 high-ranking lists make clear is where herd-level type stands across 878 Registered Holstein herds—and which operations are consistently building cows that classifiers see as structurally stronger than the overall breed average reflected in BAA. 

  • Using your own BAA as a benchmark, together with the detailed classification data behind it and indexes like TPI, gives you a grounded way to decide whether your breeding program is already in that conversation—or whether your next round of matings needs to push type more aggressively to get there. 

Key Takeaways

  • 878 herds averaged 108.3% BAA in 2025; the top hit 116.4%. If you classify Holsteins, that’s the scale you’re measured against. ​
  • BAA adjusts for age and stage of lactation, so your herd’s number is a direct comparison to the entire Registered Holstein population.
  • High-BAA herds exist at every size—from 12-cow show strings to 500+ cow operations. Herd size isn’t the barrier; your breeding decisions are. ​
  • Holstein USA is explicit: classification data help identify the most profitable and valuable animals and add “definite marketability” to your genetics.
  • Use your BAA alongside classification reports and TPI to answer one question: is your type program running with the 108.3% pack, or do your next matings need to push harder?

Learn More

The Sunday Read Dairy Professionals Don’t Skip.

Every week, thousands of producers, breeders, and industry insiders open Bullvine Weekly for genetics insights, market shifts, and profit strategies they won’t find anywhere else. One email. Five minutes. Smarter decisions all week.

NewsSubscribe
First
Last
Consent

The December Genetic Reckoning: Former Champions Fall, New Kings Rise – and Your 2026 Strategy Just Changed

December didn’t just reshuffle the rankings—it exposed who was betting on hype. Top bulls cratered overnight. New kings emerged. Your 2026 matings need a rewrite.

The December 2025 genetic evaluations weren’t just another routine update. They were a full-scale reset of global Holstein rankings—the kind that happens once every decade or so. From the powerhouses of North America to the diverse breeding programs of Europe and Scandinavia, the genetic pecking order has been violently reshuffled. Former leaders have been dethroned. Unexpected champions have been crowned. And for dairy breeders planning their 2026 mating programs, the message is stark: the genetic playbook from August is now obsolete.

This isn’t hyperbole. It’s a hard reality backed by the data. And if you’re still making breeding decisions based on last summer’s rankings, you’re leaving money on the table.

Three Seismic Shifts Defining the New Genetic Reality

The December evaluations revealed three interconnected forces reshaping global Holstein genetics:

  1. Unprecedented Volatility in Genomic Rankings
    Several high-profile sires—bulls that were industry darlings just weeks ago—have experienced dramatic, overnight index drops. In Switzerland, the former #1 sire, Sous-Moron Boston, suffered a stunning 52-point ISET collapse. In Italy, the polled star KNO Ecuador P plummeted an incredible 98 gPFT points. These aren’t statistical blips; they’re textbook examples of genomic risk materializing in real time.
  2. Genetic Concentration Consolidating Around Specific Bloodlines
    Genosource now controls 22 of the top 30 Net Merit positions in the US—a remarkable 73% market share. The Gameday maternal line underpins three of Switzerland’s top five ISET sires. The Altazazzle bloodline claims four of the top ten proven sire positions in the Netherlands. This concentration delivers elite, consistent results—but it also creates a ticking time bomb for inbreeding and genetic diversity.
  3. Components Are No Longer Optional
    From Canada’s BEYOND HI-LEVEL-ET (165 kg Fat) to Germany’s Saturn RDC (+0.88% Fat), the message is universal: with processor payments increasingly tied to milk solids, selecting for high fat and protein is now a direct path to a higher milk check. The days of overlooking component specialists are over.

North America: Where Profit and Components Rule

The North American market continues to set the global pace for Holstein genetics. But the December evaluations revealed two distinct narratives unfolding on opposite sides of the border.

Canada: The Component King Has Arrived

OCD MILAN-ET held his ground as the #1 LPI sire with a solid 19-point gain to 4137 LPI, but the real story belongs to his challengers—three newcomers who have rewritten the options for breeders.

BEYOND HI-LEVEL-ET made the most explosive leap, jumping 11 spots to #4 LPI. His profile reads like a case study in modern profitability: 165 kg Fat on a high-volume base that proves elite milk volume and exceptional component density aren’t mutually exclusive. For breeders paid on component density, he’s become the gold standard.

Then there’s BEYOND HOORAY-ET, who debuted at #3 LPI and immediately established himself as the “percentage specialist.” With +1.10% Fat and +0.52% Protein, his profile is tailor-made for herds targeting premium milk quality.

Perhaps most significant: PROGENESIS SHEAMUS-P shattered the ceiling for polled genetics, debuting at #2 LPI. He’s the highest-ranking polled genomic sire in Canadian history—proof that breeders no longer have to sacrifice elite index performance to access the valuable polled trait.

Read more: 165 kg Fat, 11-Spot Jump, New #1 Type Bull: December 2025’s Canadian Proof Run Rewrites Your Breeding Plan

USA: The Genosource Era Begins

If Canada’s story is about newcomer diversity, the US narrative is about unprecedented consolidation.

Genosource has achieved a historic sweep, capturing 22 of the top 30 Net Merit positions. For context: this represents a 73% market share in the industry’s primary profitability index. That level of concentration is a double-edged sword. On one hand, it offers a clear path to proven, high-profit genetics backed by a program that has cracked the code on profitability. On the other hand, it severely narrows the available gene pool—and that’s a serious concern for long-term herd resilience.

GENOSOURCE RETROSPECT-ET continues his reign as the #1 NM bull at 1296, demonstrating the program’s mastery of the total economic merit formula. But the most explosive newcomer was SAN-DAN ON CALL-ET, who debuted at #3 GTPI with a production profile that demands attention: 1845 Milk and 151 Fat. The fact that he also earned a #9 NM ranking tells you his balanced genetics appeal across multiple profit drivers.

And confirming the component trend: BEYOND HI-LEVEL-ET claimed the #1 GTPI position in the US at 3612, underscoring his international elite status.

Read more: 22 of 30: Genosource’s Historic Sweep of the December 2025 US Holstein Genetic Evaluations

Europe: Bloodlines, Balance, and the Rise of Functional Genetics

Europe’s evaluations revealed a shared philosophy: rewarding balanced, functional cattle designed to thrive in real-world commercial systems. While each country maintains its own index, a common theme emerged in the dominance of bloodlines that consistently deliver both profitability and longevity.

United Kingdom: Sheepster’s Legacy Reshapes the Breed

The new #1 genomic sire is DENOVO COYOTE P, with a PLI of £871. His profile is textbook modern British dairy: exceptional +0.30% fat, commercially valuable A2A2 status, and polled genetics.

But the more significant story belongs to OCD TROOPER SHEEPSTER, who graduated to #1 on the daughter-proven side with a £783 PLI. His true significance extends far beyond his own rank—he’s become a breed-shaping sire of sons. Multiple Sheepster offspring, including BADGER SIEMERS DAY TRIP (#2 genomic) and PROGENESIS PRESTON (#3 genomic), now dominate the young sire lists. This is the kind of bloodline dominance that builds lasting competitive advantage.

Read more: December 2025 UK Holstein Genetic Evaluations: Sheepster Claims Proven Crown, Homegrown Coyote P Debuts at Genomic #1

Netherlands: Shattering the +400 Barrier

Genosource Moti rewrote the Dutch record books, becoming the first sire to lead the genomic rankings at a remarkable +420 NVI. This isn’t just a personal achievement—it signals that the ceiling for genetic progress continues to rise.

What’s truly revealing, however, is the absolute conquest of the Altazazzle bloodline in the proven rankings. This line claims four of the top ten positions—a clear market vote for what commercial dairies crave: the “invisible cow.” Moderate. Functional. Invisible until you look at the milk check. Their dominance validates a breeding philosophy that prioritizes trouble-free performance over extreme individual traits.

Read more: Genosource Moti Cracks +420 NVI: Inside the December 2025 Dutch Sire Shakeup

Germany: New Champions in Both Populations

For Black & White genomic sires, newcomer Saturn RDC tied for the top with the former leader, Veterano, at 164 RZG. Saturn RDC immediately distinguished himself with a massive +0.88% Fat—the component specialist phenotype that the market is rewarding globally.

The new Red & White genomic leader is Bueno Red at 161 RZG. He offers a rare combination: extreme milk production (+2,159 kg) paired with excellent type (121 RZE). This kind of balanced profile is increasingly valuable as European breeders recognize that extremes in single traits often create hidden costs elsewhere.

Read more: New King of NTM: VH Sheriff Debuts at +51 as Top Genomic Bulls Reshuffle -November 2025 German Sire Proof Central

The Volatility Report: When Genomic Promise Meets Reality

While some markets celebrated steady progress, Switzerland, Italy, and Scandinavia delivered a masterclass in genomic risk. In these countries, several reigning #1 sires experienced dramatic overnight index drops—a powerful reminder of why risk management matters in breeding programs.

Switzerland & Italy: The Reckoning for Unproven Genetics

In Switzerland, Sous-Moron Boston’s 52-point ISET drop (from +1645 to +1593) wasn’t an anomaly—it was the statistical consequence of reliability risk. Here’s the hard truth: a 75% reliable genomic proof means there’s a 25% chance the bull’s true genetic merit will differ significantly from his initial ranking. For Boston, that risk materialized in index drops that erased millions in projected genetic value overnight.

Read more: Swiss Shakeup: Monset (+1603) Claims ISET Crown as Boston Plummets 52 Points

Italy’s story was even more dramatic. The high-profile polled star KNO Ecuador P plummeted 98 gPFT points as more daughter data recalibrated his initial genomic promise. This is what happens when market enthusiasm outpaces actual proof of reliability.

With the deck reshuffled, Italy’s new international genomic leader is DENOVO LOCUST-ET, with a formidable gPFT of 5450.

Read more: Genosource Moti Cracks +420 NVI: Inside the December 2025 Dutch Sire Shakeup

Scandinavia: The Nordic Shakeup

The Nordic Total Merit (NTM) index experienced its own dramatic power struggle. The former genomic leader, Fly P, experienced a precipitous 8-point drop from +49 NTM to +41 NTM—one of the sharpest single-round declines on record for a top bull.

His fall coincided with the spectacular debut of VH Sheriff, who entered the rankings at an exceptional +51 NTM. This contrast illustrates a critical principle: high-potential genomic projections and high-certainty proven results often tell different stories. On the proven sire list, PEAK RAINOW-ET held his position as the reliable leader at +42 NTM, providing a crucial stability anchor.

Read more: New King of NTM: VH Sheriff Debuts at +51 as Top Genomic Bulls Reshuffle -November 2025 German Sire Proof Central

Four Strategic Imperatives for Your 2026 Breeding Program

The December 2025 proofs delivered clear signals. Here’s how to act on them:

1. Embrace Volatility—and Manage It

The dramatic index drops of bulls like Boston, Ecuador P, and Fly P are the most important risk management lesson of this evaluation cycle. A chart-topping genomic proof is a powerful indicator of potential, but it’s not a guarantee of performance.

Action: Diversify your sire portfolio ruthlessly. Don’t concentrate more than 15-20% of your herd’s matings on any single unproven genomic bull, no matter how impressive his initial ranking. A team of high-quality young sires will always outperform a single superstar who fails to deliver.

2. Follow the Money: Components Drive the Milk Check

From Canada’s component specialists to Germany’s fat-specialists and Switzerland’s balanced bulls, the message is universal. Processor payments increasingly tie to milk solids. Component selection isn’t a nice-to-have anymore—it’s the direct path to higher revenue.

Action: Prioritize sires transmitting high kilograms AND high percentages of fat and protein. These specialists are your best tool for maximizing revenue per hundredweight.

3. Mind the Inbreeding Gap

The genetic concentration around Genosource in the US, the Gameday line in Switzerland, and the Altazazzle line in the Netherlands is a double-edged sword. Yes, these lines deliver elite results. But their dominance increases inbreeding risk in the broader population.

Action: Use mating programs to monitor and manage inbreeding coefficients. Protecting genetic diversity isn’t peripheral—it’s foundational for maintaining fertility, calf vigor, and long-term herd resilience. Be aware of the popular bloodlines and actively seek outcross options to balance your portfolio.

4. Proven Sires Remain Your Foundation

In an era of genomic volatility, the stability of high-reliability, daughter-proven sires is more valuable than ever. Leaders like OCD TROOPER SHEEPSTER in the UK and PEAK RAINOW-ET in Scandinavia provide the kind of anchor every breeding program needs.

Action: Allocate a meaningful portion of your matings to elite proven sires. Use them as a dependable risk-management tool to balance the high potential—but higher risk—of your genomic sire team. They’re not old news; they’re insurance against genomic volatility.

The Bottom Line

The December 2025 evaluations proved that Holstein genetics continues to evolve at a breathtaking pace. The ceiling for genetic progress keeps rising. New champions emerge. Old certainties crumble.

But here’s what shouldn’t change in your breeding strategy: disciplined risk management, relentless focus on the traits that drive profitability, and a balanced portfolio that combines proven reliability with genomic potential. The breeders who master this balance in 2026 will be the ones posting the highest milk checks and building the most resilient herds.

The genetic landscape has been reset. Now it’s time to update your playbook.

KEY TAKEAWAYS: 

  • Genomic promises just met reality: Switzerland’s #1 cratered 52 points. Italy’s polled star dropped 98. December proved that a 75% reliable proof carries 25% real risk—and millions in value can vanish overnight.
  • Components drive the milk check now: Fat and protein specialists dominated from Canada to Germany. Breeders ignoring solids aren’t just behind—they’re bleeding revenue.
  • Genosource owns 73% of America’s profit elite: Unprecedented consolidation delivers proven results, but shrinks the gene pool. Opportunity and inbreeding risk now travel together.
  • Diversify or pay the price: Cap any unproven genomic sire at 15-20% of matings. A balanced sire team always beats a single superstar who crashes.
  • Proven sires are your volatility hedge: Daughter-proven leaders like Sheepster and Peak Rainow deliver what genomic projections can’t—certainty.

EXECUTIVE SUMMARY: 

December’s reckoning separated the breeders who understand genomic risk from those who were chasing leaderboard hype. The bulls that cratered aren’t coming back. The bloodlines consolidating power aren’t slowing down. And the component premiums reshaping milk checks aren’t temporary. The question isn’t whether the genetic landscape has changed—it’s whether your breeding program has changed with it. August’s playbook is dead. What’s your 2026 strategy?

The Sunday Read Dairy Professionals Don’t Skip.

Every week, thousands of producers, breeders, and industry insiders open Bullvine Weekly for genetics insights, market shifts, and profit strategies they won’t find anywhere else. One email. Five minutes. Smarter decisions all week.

NewsSubscribe
First
Last
Consent

When Red × Red = Black: A Holstein Breeder’s Guide to Variant Red (COPA Gene)

Red × Red should equal Red. But half your calves came out black. The COPA gene is the override switch you didn’t know existed.

For decades, Holstein breeders operated on a simple truth: Black dominates Red. It was a comfortable, binary rule—and one that served us well for generations. But here’s the thing: it was incomplete as well.

The emergence of Variant Red (COPA) hasn’t just added a new color pattern to our toolbox; it’s also changed the way we think about color. It’s exposed a blind spot in how we think about genetic pathways. And if you’re making mating decisions without accounting for this “override” switch, you’re working with incomplete information. That costs money.

The Mechanic: Two Systems, One Outcome

You probably already know the old model. The MC1R gene—what geneticists call the Extension locus—controls coat color through a clear dominance hierarchy: E^D (dominant black) > E^BR (Telstar) > E^+ (wild-type) > e (recessive red). Two copies of e gives you a red calf. Simple enough.

Then in 2015, researcher Ben Dorshorst and an international team published findings in PLOS ONE that changed everything. They identified a second switch: a mutation in the COPA gene that produces what we now call Variant Red. The critical discovery? COPA overrides MC1R entirely. An animal can be genetically programmed to be black at MC1R, but if it carries the COPA variant, it still expresses red. A decade of breeding experience and subsequent genetic research has validated this finding—the mechanism holds up.

This is epistasis in action—one genetic pathway superseding another. Practically, it means that phenotype alone tells you nothing about what’s actually happening under the hood.

The good news? We now have reliable tests for both systems. UC Davis Veterinary Genetics Laboratory offers both COPA and MC1R panels, and Holstein Association USA includes both in their standard genomic testing. Once you know both pieces, you can actually plan your color outcomes instead of guessing.

The Cheat Sheet: Mating Outcomes at a Glance

Let me walk you through the scenarios breeders ask about most. This is the section you’ll probably want to bookmark.

Scenario A: Variant Red Sire (N/DR) × Black Dam (E^D/E^D)

  • Outcome: ~50% Red / ~50% Black
  • What’s happening: Red calves inherit the dominant DR allele, which overrides their black MC1R genetics. Black calves inherit the N allele and express normally.

Scenario B: Variant Red Sire (N/DR) × Recessive Red Dam (e/e)

  • Outcome: ~50% Red / ~50% Black (if sire carries E^D at MC1R)
  • What’s happening: This scenario assumes your Variant Red bull is carrying the Dominant Black gene (E^D) “underneath” his red coat—which many do, since the COPA mutation originated in black Holsteins. Red calves inherit DR (Variant Red) and express red regardless of MC1R. But calves inheriting N from the sire are now N/N at the COPA locus (no override present). If they also inherit E^D from the sire and e from the dam, they genotype as E^D/e at MC1R—which results in a black phenotype. Important note: If your Variant Red bull happens to be e/e (recessive red) at MC1R, he won’t throw black calves even when passing N—but this is less common.

Scenario C: Homozygous Variant Red Sire (DR/DR) × Any Dam

  • Outcome: 100% Red
  • What’s happening: Every calf inherits at least one DR allele. The override is guaranteed. This is your cleanest path to predictable red outcomes.

Scenario D: Telstar (E^BR) Animals

  • Outcome: Born red, turn black within 2-6 months
  • What’s happening: Completely different mechanism—MC1R timing, not COPA override. Don’t confuse these in your records.

The Trap: When Red × Red = Black

This scenario deserves special attention because it’s the one that burns breeders most often.

You have a nice Variant Red bull (N/DR). You breed him to your recessive red cows (e/e). You’re expecting all-red calves—makes sense, right? Red bull, red cow, red calves.

Except that about half those calves come out black. What gives?

Here’s what’s happening genetically: Your N/DR bull passes either N or DR to each calf (50/50 chance). The calves that get DR are red—the override kicks in, and they express Variant Red. But the calves that get N are now N/N at the COPA locus (no override present), assuming your dam is N/N like most Holsteins. If those calves also inherit E^D from the sire and e from the dam, they genotype as E^D/e at MC1R—and since Dominant Black is dominant over recessive red, you get a black calf.

The key detail here: this trap only springs if your Variant Red bull carries E^D at MC1R. Many do—the COPA mutation originated in black Holstein lines, so most Variant Red animals are “hiding” black genetics underneath that red coat. But if your bull happens to be e/e at MC1R (homozygous recessive red), he can’t pass E^D, and you won’t see black calves even when he passes the N allele.

This is exactly why UC Davis VGL’s documentation is explicit: phenotype cannot distinguish between color mechanisms. You need to test both COPA and MC1R to know what you’re actually working with.

Select Sires addresses this directly in their bull catalogs. Their DR1 code indicates heterozygous Variant Red status, and their technical materials—using LUCKY SEVEN-RED as an example—walk through exactly these scenarios. That’s the kind of transparency the whole industry should be moving toward.

The Money: Testing Costs vs. Breeding Errors

Let’s talk economics, because this is where the rubber meets the road.

Testing costs are pretty reasonable. UC Davis VGL lists coat color testing at $30 for the first test and $10 for each additional test on the same animal (pricing as of October 2023—worth verifying current rates at vgl.ucdavis.edu/pricing/cattle before you budget).

The cost of NOT testing? That’s where it gets expensive.

The Telstar Trap: You sell a red heifer as breeding stock. Buyer’s excited, pays a premium for red genetics. Six months later, she’s turned black. Now you’ve got an angry customer and reputation damage that’s hard to quantify but very real.

The Registration Error: You register a Variant Red calf as recessive red because it looks the same as a red calf at birth. Now every mating decision based on that animal’s record is built on false assumptions. Future buyers make breeding plans expecting recessive red transmission—and get results that don’t make sense. These errors compound across generations.

The Donor Disaster: You flush a valuable cow expecting specific color outcomes based on her phenotype. Wrong assumptions about her COPA/MC1R status mean the resulting embryos don’t deliver what you promised buyers. Cost: the flush investment, recipient management, and potentially refunds or re-dos.

The Clean-Up Bull Chaos: You turn a Variant Red bull out with a mixed color group during summer breeding. Come calving season, you can’t tell by looking which calves are carrying what. Now you need to genomically test the whole crop to sort replacements from sale animals—that’s $30-40 per head across your calf crop.

A $30 test looks pretty reasonable compared to any of those scenarios.

Where the Industry Is Heading

Here’s my read on where this is going: mandatory COPA/MC1R testing at registration isn’t a question of “if” for the elite tier—it’s a question of “when.” The economics and technology make it inevitable.

The AI studs are already there. Select Sires publishes DR codes in their catalogs and provides detailed mating guidance. Other major organizations are following suit with color genetics in their genomic offerings. The competitive pressure is real—if one stud provides complete color transparency and another doesn’t, breeders making premium decisions will choose clarity every time.

A note on codes: If you’re working across borders, be aware that the US and Canada use different labeling systems. In the US, Holstein Association USA and CDCB use DR0 (tested free), DR1 (heterozygous carrier), and DR2(homozygous Dominant Red). Holstein Canada uses VRF (free of Variant Red), VRC (carrier of Variant Red), and VRS (homozygous Variant Red). Same genetics, different shorthand—just make sure you’re reading the codes correctly for whichever system you’re working in.

The breed associations have built the infrastructure. WHFF registration guidelines already require member organizations to record coat color transmission and carrier status using standardized codes. Holstein Canada’s genetic trait coding system is in place. Holstein USA includes both recessive red and Dominant Red in their genomic panels. The recording framework exists—it’s just not universally enforced yet.

The holdouts make sense. For a 500-cow commercial dairy, shipping bull calves at a week old and selecting replacements purely on production and health? Color genetics are irrelevant. That’s a perfectly rational business decision, and mandatory testing across all registrations would be unnecessary friction for these operations.

But for seedstock operations, show herds, and anyone marketing genetics where color affects value? Testing both COPA and MC1R isn’t optional anymore. It’s table stakes.

The Verdict: Manage the Complexity You Create

So where does this leave you? Here’s my thinking:

If color affects your revenue, test every animal you plan to market as breeding stock. Document the COPA and MC1R status in your sale materials. Use breed-standard codes so the information travels cleanly when animals change hands.

If you’re breeding for red: Understand that N/DR sires will throw ~50% black calves even on red cows—provided the sire carries E^D at MC1R. If you need guaranteed red outcomes, use DR/DR sires. Plan accordingly.

If you’re managing clean-up bulls: Don’t use Variant Red bulls on mixed-color groups unless you’re prepared to test the resulting calves. The sorting headache isn’t worth it.

If you’re registering animals: Get the mechanism right. Variant Red, recessive red, and Telstar are three different things with different inheritance patterns. Mislabeling creates downstream problems for everyone.

If you think phenotype tells you enough: It doesn’t. A red calf at birth could be Variant Red (stays red, might darken slightly), recessive red (stays red), or Telstar (turns black in months). Only testing tells you which—and that distinction matters for every breeding decision that follows.

“Understand the genetics, test what matters for your operation, communicate clearly with buyers, and manage the complexity you’re creating.”

The COPA discovery didn’t complicate Holstein color genetics—it revealed the complexity that had always been there. We just couldn’t see it before. The breeders who adapt their programs to account for genetic networks, not just single-gene thinking, are the ones who’ll avoid expensive surprises.

And honestly, color is just the beginning. The same epistatic interactions—one pathway overriding another—show up in fertility, health, and efficiency traits. The mental model you build managing Variant Red is the same model you’ll need for the next layer of genetic complexity headed for your breeding program.

Test what matters. Document what you find. Plan accordingly. That approach will serve you well regardless of what genetic curveball comes next. 

Key Takeaways

  • COPA is the override switch. An animal can carry black genetics at MC1R but still express red if COPA is present—traditional color rules don’t apply.
  • Red × Red can equal Black. Variant Red bulls throw ~50% black calves on red cows if they carry hidden black genetics underneath their red coat.
  • A $30 test prevents expensive mistakes. UC Davis VGL tests both COPA and MC1R; Holstein USA includes both in standard genomic panels.
  • Codes vary by country. The US uses DR0/DR1/DR2; Canada uses VRF/VRC/VRS. Same genetics, different shorthand—read them correctly.
  • Skip the test, accept the gamble. Registration errors, mislabeled sale animals, and buyer disputes cost far more than $30.

Executive Summary: 

Red bull × red cow should equal red calf—except when it doesn’t. The COPA gene, discovered in 2015, acts as a genetic ‘override switch’ that supersedes traditional color inheritance. A Variant Red bull can throw 50% black calves even on red cows if he carries hidden black genetics underneath his red coat. That surprise leads to angry buyers, botched registrations, and breeding decisions built on wrong assumptions. The fix is simple: test both COPA and MC1R status. It runs about $30 through UC Davis VGL and comes standard with Holstein USA genomic panels. For seedstock operations and anyone marketing genetics where color affects value, skipping this test is a gamble you don’t need to take.

Complete references and supporting documentation are available upon request by contacting the editorial team at editor@thebullvine.com.

Learn More:

The Sunday Read Dairy Professionals Don’t Skip.

Every week, thousands of producers, breeders, and industry insiders open Bullvine Weekly for genetics insights, market shifts, and profit strategies they won’t find anywhere else. One email. Five minutes. Smarter decisions all week.

NewsSubscribe
First
Last
Consent

The $3,800 Heifer Problem: How Smart Dairies Are Adapting When Beef Premiums Don’t Cover Replacement Costs

What if the beef-on-dairy strategy that made sense at $2,200 heifers is now costing you $280K yearly?

EXECUTIVE SUMMARY: What farmers are discovering about today’s replacement market fundamentally challenges the beef-on-dairy strategies that seemed bulletproof just two years ago. With springer heifers commanding $3,800 to $4,000 across most regions — a 73% jump from 2023’s $2,200 average — while actual beef-cross premiums hover around $20-30 after all costs, the economics have completely inverted. Research from Penn State’s dairy team and Wisconsin’s Center for Dairy Profitability confirms what producers are experiencing firsthand: operations that shifted to aggressive 65% beef breeding are now facing an additional $200,000 to $280,000 annually in replacement costs. Here’s what this means for your operation — the traditional 70/30 dairy-to-beef ratio is making a comeback, but with strategic twists like genomic testing every animal and tiered breeding programs that maximize both genetic progress and cash flow. Forward-thinking producers are already locking in 2026-2027 heifer contracts at today’s prices, essentially buying insurance against further market volatility. The path forward isn’t about abandoning beef-on-dairy entirely… it’s about finding the sweet spot where replacement security meets revenue opportunity, and that calculation looks different for every farm.

 dairy breeding strategy

Let me share what’s been on my mind lately. You know something’s fundamentally different when processing plants appear to have capacity while replacement heifers are commanding historically high prices across the country. It’s not following the patterns we’ve come to expect, is it? And if you’re trying to figure out when to ship cull cows or whether that beef-on-dairy program is actually paying for itself… well, these dynamics matter more than most of us initially realized.

What’s particularly noteworthy is how these patterns are playing out differently across regions. Industry reports suggest California’s vertically integrated systems are seeing different market signals than what’s emerging in Wisconsin’s co-op model or the grazing-based operations down South. This builds on what we’ve been observing since spring 2024 — a fundamental shift in how breeding strategies and replacement economics interact.

As we head into winter feeding season, these decisions become even more critical.

What Current Market Observations Are Telling Us

So here’s what’s interesting about the conditions we’re seeing. The beef processing industry generally runs facilities at high utilization rates when everything’s functioning properly — that’s basic industrial economics. In normal times, we’d expect to see something around 95% capacity utilization. But recent industry observations suggest we’re nowhere near that level.

Kevin Grier, that Canadian economist who’s been tracking North American beef markets for decades through his Market Analysis and Consulting firm, has been documenting this fascinating disconnect between available processing capacity and actual cattle throughput. Why is this significant? The economics suggest patterns that go beyond simple supply and demand.

Producers across Wisconsin and other dairy states are reporting similar experiences — cattle ready to ship, processing capacity theoretically available, yet prices that don’t reflect what we’d expect from those conditions. The math doesn’t seem to add up.

This pattern — and this is what’s really caught the attention of many observers — isn’t isolated to one region. Whether you’re looking at traditional dairy states like Wisconsin and New York with their smaller family operations, the larger feedlot-integrated systems in Texas and New Mexico, or even California with its unique market dynamics… similar patterns keep emerging. Dr. Derrell Peel from Oklahoma State’s agricultural economics department, one of the respected voices in livestock market analysis, suggests in his recent Extension publications that these patterns indicate something beyond typical market cycles.

The Beef-on-Dairy Reality Check

Geography determines survival: Minnesota premiums hit $3,850 while Texas stays ‘only’ $2,900 – but even the cheapest market doubled in two years, proving Andrew’s point that this is a structural, not cyclical, shift.

Remember those genetic company presentations from 2022 and 2023? The promise of significant premiums for beef-cross calves seemed like a genuine opportunity to diversify revenue streams. And conceptually, it made perfect sense — capture premium markets, reduce exposure to volatile dairy calf prices, improve cash flow.

But here’s where reality has diverged from projection. Industry reports and producer feedback across multiple states suggest that actual returns often fall significantly short of initial projections. After accounting for transportation costs (and with diesel prices where they’ve been), shrink at sale barns, and various marketing fees, many operations are finding net premiums considerably lower than anticipated.

What Extension services across Pennsylvania, Wisconsin, Minnesota and other states have been observing reveals that real-world returns can differ dramatically from those PowerPoint projections we all saw. Penn State’s dairy team, Wisconsin’s Center for Dairy Profitability, and Minnesota’s Extension dairy program all report similar findings — the gap between projected and actual returns is substantial.

I’ve noticed operations that are making beef-on-dairy work really well tend to have specific advantages — direct marketing relationships with particular buyers, consistent quality that commands loyalty, or local markets that value certain attributes. Success often comes down to matching your operation’s strengths with specific market opportunities.

And then there’s the replacement heifer situation…

Multiple market sources, including reports from the National Association of Animal Breeders and various regional heifer grower associations, confirm what producers across the country are experiencing — springer heifer prices have reached levels that fundamentally alter breeding economics. Custom heifer growers in traditional dairy regions report being booked solid through mid-2026, with waiting lists growing.

Consider what this means for a typical 500-cow operation that shifted from a traditional 70-30 breeding strategy (70% dairy, 30% beef) to a more aggressive 35-65 approach. You’re potentially purchasing significantly more replacements at these elevated prices. The financial implications can run into hundreds of thousands of dollars annually in additional replacement costs. One Wisconsin producer recently calculated his operation’s additional replacement cost at nearly $280,000 annually — enough to make anyone reconsider their breeding strategy.

Understanding the Replacement Market Dynamics

So what’s driving these unprecedented heifer prices? It’s really a convergence of factors, and while market data is still developing on some aspects, the pattern is becoming clearer.

There’s the supply situation — when the industry collectively shifted breeding strategies over a relatively short period, it created replacement availability challenges. Dr. Jeffrey Bewley at Holstein Association USA, who analyzes breeding data extensively, points out in his industry presentations that different breeding strategies have compounding effects over time. Research published in the Journal of Dairy Science consistently shows beef semen generally has lower conception rates than conventional dairy semen — often running 8-12 percentage points lower depending on management and season — and those differences accumulate in ways that weren’t immediately obvious.

Then consider milk price dynamics. When Class III futures trade at relatively attractive levels, as they have periodically through 2025, producers naturally want to maintain or expand cow numbers. But when replacement availability is constrained… well, basic economics takes over.

What’s particularly interesting is the regional variation we’re observing. Larger operations in the West sometimes have different market dynamics than smaller farms in traditional dairy areas. California’s integrated systems might negotiate directly with heifer growers, while Midwest operations often compete on the open market. They might have scale advantages in negotiating, but they’re also competing with each other for limited replacements.

Industry economists, including those at agricultural lenders like CoBank and Farm Credit who track these markets closely in their quarterly dairy outlooks, suggest these inventory dynamics aren’t likely to shift dramatically in the near term. This appears to be more structural than cyclical — a distinction that matters for long-term planning.

Strategies Emerging Across the Industry

What’s encouraging is observing how different operations are adapting. There are some genuinely innovative approaches emerging across various regions.

Many operations are restructuring their breeding programs entirely. Some are using genomic testing more strategically — and the economics are interesting here. With genomic tests running around $35-45 per animal through major breed associations, operations are testing their entire herd to make targeted breeding decisions. Bottom-tier genetics might receive beef semen, solid performers get conventional dairy semen, and top genetics receive sexed semen (which typically runs $15-30 premium per unit over conventional). Yes, it costs more upfront, but it helps maintain that replacement pipeline while still capturing some beef revenue.

This development suggests producers are thinking more strategically about genetic progress and cash flow simultaneously. It’s not just about maximizing one or the other anymore.

What’s also emerging is renewed interest in contract heifer growing arrangements. Some operations are securing replacements eighteen to twenty-four months in advance. The prices might include a premium for certainty — think of it like buying insurance — but as many producers note, you can plan around known costs. It’s the unknowns that create problems.

The Contract Market Many Don’t Consider

Here’s something worth noting — custom heifer growers, particularly in traditional dairy regions like eastern Wisconsin, Minnesota, and upstate New York, are often interested in longer-term commitments. These arrangements typically involve predetermined pricing and delivery schedules over multiple years.

Both parties can benefit from these arrangements. Growers get predictable cash flow (which lenders appreciate when it comes to operating loans), and dairy operations get cost certainty. The challenge, naturally, is that many producers hope for price improvements. But what if prices don’t drop? Or what if they actually increase? That’s the risk-reward calculation each operation needs to make.

New Processing Capacity — Context Matters

The vanishing herd: 900,000 heifers disappeared as the industry chased short-term beef profits and ignored long-term replacement needs.

You’ve probably heard about new processing facilities being developed. Recent industry reports, including those from Rabobank’s North American beef quarterly and CattleFax market updates, indicate several major projects underway, each with different capacity targets and business models.

What distinguishes many of these new operations is their structure. Unlike traditional commodity plants that buy on the spot market, many feature integrated supply chains or specific retail partnerships. Their procurement models often involve contracting cattle well in advance with specific quality parameters — think Certified Angus Beef specifications or natural program requirements.

The question worth considering is why new capacity is being built when existing facilities aren’t maximizing utilization. Various theories exist among market analysts, but it suggests these new plants might be operating under fundamentally different business assumptions than traditional facilities. Are they positioning for future supply? Creating regional competition? Building branded programs? The answer probably varies by project.

Global Factors Adding Complexity

International beef markets increasingly influence our domestic situation. USDA’s Foreign Agricultural Service October 2025 Livestock and Poultry report tracks significant production shifts in countries like Brazil and Australia. When Brazilian exports increase substantially (up 15% year-over-year according to their latest data) or Australia recovers from drought-induced liquidation, it affects global beef flows.

Major processors operate internationally, and their strategies reflect global opportunities. Companies like JBS, Tyson, and Cargill balance operations across continents. When operations in different regions show varying profitability patterns, it influences domestic investment and operational decisions.

For U.S. dairy producers, these international factors contribute to price volatility in ways that weren’t as pronounced even five years ago. Global beef trade essentially influences domestic price ceilings — when imported product can fill demand at certain price points, our cull cow values face pressure.

Canadian producers, despite their different regulatory framework providing some buffer through supply management, are experiencing similar dynamics with beef-on-dairy economics. The fundamentals transcend borders, as recent reports from the Canadian Cattlemen’s Association indicate.

Practical Considerations for Current Conditions

After observing various operational approaches this season, here are some considerations worth discussing:

It’s crucial to track actual returns versus projections. Many land-grant universities have developed tools for this purpose — Wisconsin’s Center for Dairy Profitability has spreadsheets, Penn State offers decision tools, Cornell’s PRO-DAIRY program provides calculators. These resources can reveal important gaps between expectations and reality. Success metrics vary, but operations reporting improved cash flow often see 15-20% better performance when they track actual versus projected returns closely.

When calculating replacement costs, remember it extends beyond purchase price. There’s financing (and with interest rates where they are, that matters), transportation (fuel costs add up quickly), and that transition period when fresh heifers adjust to your system — different water, new TMR, group dynamics. University research, including work from Michigan State and Cornell, suggests these additional costs can add 10-15% to the sticker price.

If you’re committed to a particular breeding strategy, explore risk management tools. The Livestock Risk Protection for Dairy (LRP-Dairy) program offers price floor protection. Forward contracting through organizations like DFA or your local co-op might provide stability. Various hedging products exist through the CME — they all have costs, certainly, but weigh those against the risks you’re managing.

The optimal breeding strategy varies by operation. Your conception rates (which vary seasonally and by management), voluntary culling patterns, facilities (tie-stall versus freestall versus robotic), available labor — they all factor in. What works for a 2,000-cow operation with its own feed mill won’t necessarily translate to a 200-cow grazing operation. And that’s okay — diversity has always been one of dairy’s strengths.

Market timing has become increasingly complex. Those traditional seasonal patterns we relied on for decades — shipping cull cows before grass cattle hit the market, buying replacements in spring — they’re less predictable now. Price swings within monthly periods can be substantial. Local and regional market intelligence has become more valuable than ever.

Maintaining Perspective in Uncertain Times

Markets evolve — sometimes gradually, sometimes surprisingly quickly. What functions in one region might not translate to another. What makes sense for a large, integrated operation might not pencil out for a traditional family farm. And that’s the diversity that’s always characterized our industry.

Before implementing significant changes, consultation with your advisory team becomes crucial. Your nutritionist sees things from the feed efficiency and production angle. Your veterinarian considers herd health and reproduction implications. Your lender evaluates cash flow and debt service coverage. Each perspective contributes to better decision-making.

And let’s acknowledge — some operations are finding genuine success with various strategies. Direct marketing relationships with specific buyers who value consistency. Genetic programs that command buyer loyalty. Local markets that pay premiums for specific attributes. These successes remind us that opportunities exist even in challenging markets. Success often comes down to matching your operation’s strengths with market opportunities.

Looking Forward Together

This market environment certainly isn’t what any of us anticipated back in 2023 when beef-on-dairy really took off. The interaction between processing capacity, replacement availability, and breeding economics has created unprecedented challenges.

But what’s encouraging is how producers are adapting. Whether through adjusted breeding strategies, innovative contracting arrangements, or collaborative marketing efforts (like the producer groups forming in several states to pool beef-cross calves for better marketing leverage), paths forward exist. The dairy industry has weathered significant challenges over the decades — the 1980s farm crisis, the 2009 collapse, the 2020 pandemic disruptions. This situation, while unique in certain aspects, represents another test of our collective resilience.

The fundamentals remain constant: understand your actual costs (not what you hope they are or what someone projected they’d be), know your markets (both what you’re selling into and buying from), and base decisions on real data rather than projections. Every farm faces unique circumstances — facilities, labor availability, local markets, financial position. But understanding broader patterns helps inform better individual decisions.

We really are navigating this together. The conversations at co-op meetings, information shared at winter dairy conferences, neighbor-to-neighbor discussions over fence lines or at the feed store — that’s how our industry has always moved forward. Whether you’re milking 50 cows or 5,000, whether you’re in Vermont or California, we all face these markets together.

These are certainly interesting times. But with solid information, realistic planning, and thoughtful adaptation, operations will find their way through. That’s what we do, isn’t it? We observe, we adapt, we support each other, and we keep moving forward.

Always have. Always will.

KEY TAKEAWAYS:

  • Contract heifer growing arrangements can reduce replacement uncertainty by 100% while typically costing 20-25% less than panic buying on spot markets — Wisconsin and Minnesota growers report strong interest in 18-24 month contracts at $2,800-$3,200 delivered, providing both parties predictable cash flow
  • Strategic genomic testing at $35-45 per animal enables precision breeding that maintains genetic progress while capturing beef revenue — bottom 20% get beef semen, middle 50% conventional dairy, top 30% sexed semen, optimizing both cash flow and herd improvement
  • Regional market variations create opportunities smart operators are exploiting — California’s integrated systems negotiate direct contracts while Midwest co-ops pool beef-cross calves for 15-20% better premiums than individual marketing
  • Risk management tools like LRP-Dairy provide price floor protection that costs $15-25 per head but prevents catastrophic losses when replacement markets spike or cull values crash — essentially disaster insurance for volatile times
  • The optimal breeding ratio depends on your conception rates, culling patterns, and local markets — 60/40 might work with excellent reproduction, but operations with challenges find 70/30 provides essential cushion against today’s $3,800 replacement reality

Complete references and supporting documentation are available upon request by contacting the editorial team at editor@thebullvine.com.

Learn More:

The Sunday Read Dairy Professionals Don’t Skip.

Every week, thousands of producers, breeders, and industry insiders open Bullvine Weekly for genetics insights, market shifts, and profit strategies they won’t find anywhere else. One email. Five minutes. Smarter decisions all week.

NewsSubscribe
First
Last
Consent

DOC Just Made History: The First Showcase Bull to Hit a Million Units

Everyone said you can’t breed for both the show ring AND the milk tank. DOC just proved them all wrong.

EXECUTIVE SUMMARY: We’ve been tracking DOC for years, but what he just accomplished changes everything we thought we knew about elite genetics. This Showcase™ bull proved that exceptional type and massive commercial success aren’t mutually exclusive – something most of us figured was impossible. Here’s what matters to your operation: DOC’s daughters delivered +982 lbs Milk with 99% reliability across 54,563 daughters in 10,067 herds worldwide, while simultaneously dominating major shows from Japan to Denmark. One daughter sold for $1.925 million, validating that crossover genetics aren’t just marketing hype—they’re profit drivers. The global trend we’re seeing suggests that farmers won’t accept the old trade-offs anymore; they want cattle that perform well in both the parlor and the show ring. DOC’s million-unit milestone as the first Showcase sire to reach this level tells us the market is ready for genetics that deliver comprehensive excellence, not just single-trait optimization.

KEY TAKEAWAYS

  • Market Validation at Scale: DOC’s million-unit sales prove that elite type genetics can drive massive commercial demand – his sustained popularity across 10+ years shows these genetics work in real farming conditions, not just perfect environments
  • Crossover Economics Work: When daughters consistently deliver both production (+982 lbs Milk) and type excellence (purple banners globally), you’re looking at cattle that maximize both milk checks and genetic value – start evaluating bulls for comprehensive performance, not either/or scenarios
  • Global Adaptability Matters: DOC’s success from Japan to Denmark to progressive U.S. dairies demonstrates that truly elite genetics translate across diverse management systems – look for sires with proven international performance when making breeding decisions
  • Health Traits Drive Longevity: DOC’s genetics included improved mastitis resistance and productive life, contributing to his sustained demand – prioritize bulls offering robust health packages alongside production and type in your 2025 breeding program
  • Strategic Breeding Investment: With daughter S-S-I Doc Have Not 8784-ET selling for $1.925 million, DOC proved that superior genetics create exponential value – focus on sires with proven transmission ability rather than chasing the latest genomic predictions
 elite dairy genetics, dairy breeding strategy, increasing milk yield, sire selection criteria, crossover genetics profit

Look, we’ve seen some incredible bulls over the years, but what DOC just pulled off? This changes everything about how we think about elite genetics.

So here’s what happened. Woodcrest King DOC (EX-90) just became the first Select Sires Showcase™ sire to sell over 1,000,000 units of semen. Yeah, you read that right – a million units. And he did it while carrying that Showcase designation, which, honestly, most of us thought would never happen.

The thing about DOC is… well, he broke all the rules we thought existed in this business.

From Day One, This Bull Was Different

DOC came from solid genetics – 7HO12198 KINGBOY out of WCD-ZBW Mack Daddy (VG-88-VG-MS) at Woodcrest Dairy up in Lisbon, New York. The Cruikshank family knew they had something special when his dam was putting up impressive milk numbers and became a barn favorite. But honestly? Nobody predicted this level of success.

What made DOC stand out wasn’t just one trait – it was everything. Most bulls offer either production or type. You pick your lane and live with it. DOC said “forget that” and delivered both. We’re talking +982 lbs Milk with 99% reliability from 54,563 daughters across 10,067 herds. Those aren’t theoretical numbers from a computer model… that’s real milk in real tanks from real farms.

The Crossover Revolution

Here’s where it gets interesting. DOC’s daughters became the poster children for what we call “crossover cows” – cattle that absolutely crush it in progressive dairies while also claiming purple banners at major shows. This used to be impossible. You either bred for the parlor or the show ring, never both.

DOC’s daughters didn’t just participate in shows; they dominated them. From Japan and Korea to Spain, Italy, Great Britain, Belgium, the Netherlands, Germany, Denmark, Australia, Canada, and across the U.S., his genetics proved they could adapt to any system. That’s the mark of truly elite genetics – when they work everywhere, not just in perfect conditions.

What’s fascinating is how Select Sires positioned him as a patriarch of their Showcase™ program. This wasn’t honorary… DOC earned it by consistently delivering daughters that mattered to real dairy operations.

The $1.925 Million Proof

Nothing validates genetics quite like someone writing a massive check. DOC’s daughter S-S-I Doc Have Not 8784-ET (EX-96-EX-MS-DOM) sold for $1.925 million. That’s not just expensive – that’s the market screaming “these genetics matter.”

This cow exemplified everything DOC transmitted: elite type, impressive genomics with a +2742 GTPI, and proven transmission ability with three offspring already exceeding +3035 GTPI. She traced back 10 generations to Snow-N Denises Dellia EX-95, connecting modern genetics to historical greatness. When you see lineage like that performing at this level, you know it’s not luck.

Breaking the Showcase Barrier

The Showcase™ program recognizes sires with outstanding breed-leading type or show-winning pedigrees. It represents decades of strategic matings to create influential, breed-altering sires from impressive maternal lines. DOC becoming the first bull in this category to reach millionaire status? That’s huge.

Previous Select Sires millionaires typically achieved their status through broad commercial appeal – think workhorse bulls that every farm could use. DOC proved that elite-type transmission could drive equivalent demand. That changes how we evaluate genetics going forward.

The Million-Unit Club Context

Since Fisher-Place Mandingo first hit a million units back in 1994, only 42 other Holstein bulls had joined this club by 2010. The U.S. leads with 20 millionaire bulls, Canada has 12. Select Sires has consistently contributed to this group with bulls like PLANET-ET, MILLION-ET, and SHOT Laser-ET.

But DOC’s achievement stands apart. He reached millionaire status while maintaining his Showcase™ designation, proving that exceptional type and massive commercial success aren’t mutually exclusive.

Global Impact That Actually Matters

The numbers tell DOC’s story better than any marketing campaign. Over 673,000 doses sold globally, ranking among Select Sires’ bestsellers throughout his career. Scott Ruby from World Wide Sires noted that “Doc is a bull that has expanded his popularity every year of his life,” – which is unusual since most sires peak early and then fade.

What’s particularly noteworthy is DOC’s sustained demand. His genetics addressed the complex needs of modern dairy operations, including elite production, superior type, and robust health traits such as improved mastitis resistance and a productive life. That’s what keeps the bulls relevant year after year.

What This Means for Breeding Decisions

DOC’s success offers a blueprint for evaluating future elite sires. The most valuable genetics aren’t always the most extreme – they’re the ones delivering consistent, profitable performance across diverse environments and management systems.

Here’s the thing, though… DOC proved that show ring champions and commercial superstars can come from the same genetic foundation. His daughters dominated major shows while driving profits in progressive dairies, shattering the false choice between type and production that had limited breeding decisions for decades.

The Legacy Continues

DOC passed away in June 2025, just months before reaching his millionaire milestone. But his influence on Holstein genetics keeps expanding. His daughters worldwide prove his genetic worth daily, each lactation adding evidence that comprehensive excellence is achievable in dairy breeding.

Rick VerBeek, senior Holstein sire analyst at Select Sires, captured DOC’s significance: “Today’s A.I. industry is fast-paced. The speed of genetic advancement is unprecedented. Much of this advancement is driven by young sires, and while our GForce™ program continues to grow, influential daughter-proven genetics will always be our goal. It’s both exciting and gratifying to see DOC achieve this monumental milestone”.

Kevin Jorgensen, senior Holstein sire analyst, emphasized DOC’s unique contribution: “Within the Showcase program, DOC defined crossover for the past decade. He expertly transmits yield, components, type, and udder conformation to his offspring. His daughters continue to top the charts, and they’re extremely competitive in the show ring”.

Where We Go from Here

DOC’s millionaire achievement signals a shift in the industry. His ability to generate massive commercial demand while maintaining elite-type credentials proves that modern dairy breeding can deliver both profitability and phenotypic excellence simultaneously.

The success of DOC’s genetics validates Select Sires’ Showcase™ program approach and suggests that future breeding strategies should focus on comprehensive genetic packages rather than single-trait optimization. His legacy demonstrates that elite genetics can achieve both immediate commercial success and long-term breed improvement.

What strikes me about this whole story is how DOC changed the conversation. We’re not debating type versus production anymore – we’re looking for genetics that deliver both. That’s a fundamental shift in how we approach breeding decisions.

As the dairy industry continues evolving, DOC’s achievement stands as proof that exceptional genetics, strategic marketing, and consistent performance can create breeding legends that influence the industry for generations. The King’s millionaire status isn’t just a sales milestone – it’s validation that excellence in dairy breeding truly knows no limits.

Learn More:

  • The Ultimate Guide to Sire Selection – This guide offers a tactical framework for applying the lessons from DOC’s success. It provides practical strategies for balancing production, type, and health traits in your own herd to maximize genetic gain and long-term profitability.
  • Does Type Still Pay? The Financial Realities of Breeding for the Show Ring – This article dives into the market economics behind DOC’s crossover appeal. It analyzes the financial ROI of elite type, helping you understand how to leverage show-winning genetics to drive higher returns from both milk sales and genetic marketing.
  • Genomics: The Great Promoter or the Great Pretender? – DOC’s story champions daughter-proven reliability. This piece explores how to strategically use genomic data without getting lost in the hype, revealing methods for blending the best of proven sires with the potential of high-genomic young stock.

The Sunday Read Dairy Professionals Don’t Skip.

Every week, thousands of producers, breeders, and industry insiders open Bullvine Weekly for genetics insights, market shifts, and profit strategies they won’t find anywhere else. One email. Five minutes. Smarter decisions all week.

NewsSubscribe
First
Last
Consent

The UK’s Sexed Semen Playbook: How UK Dairies Hit 84% While You’re Still Stuck at 50/50

UK dairies hit 84% sexed semen adoption—while most of us are still playing 50/50 roulette with calf gender.

UK sexed semen adoption has grown dramatically from 12.3% in 2012 to 84% in 2024, with accelerated growth particularly notable after 2018

I’ve been watching this trend for three years now, and what the Brits pulled off isn’t just impressive tech adoption—it’s a complete system overhaul that makes other leading dairy nations look years behind.

You know what hits you when you walk through a modern UK dairy operation? It’s not the robotic milkers or fancy feed systems. It’s the breeding charts. Where most of us around the world still play 50/50 roulette on calf gender, these operations consistently show 89-91% female calves.

That’s not luck. That’s 84% sexed semen adoption across UK dairy herds in 2024, and honestly, it makes the rest of us look like we’re still figuring out the basics. The Americans? Sitting at 61%. New Zealand? About 47%. Most of Europe? Still having meetings about it.

So what did the Brits crack that everyone else missed?

When Carbon Talk Started Writing Real Checks

Here’s what really shifted everything—carbon footprint moved from environmental reports straight into milk pricing contracts. I was chatting with a producer near Exeter last month—he runs 380 Holsteins on grass—and he nailed it: “Five years back, methane was something we discussed at NFU meetings. Now it’s affecting my milk price every month.”

Processors like Arla aren’t messing around. They’re paying actual premiums—2 to 4p per liter depending on targets—for farms hitting verified emission reductions. Tesco’s writing carbon requirements directly into supply contracts.

Here’s the brilliant part: those bull calves that used just to eat feed and take up space? Now they’re actively costing you money twice—feed costs and lost carbon premiums. Using sexed semen to cut those numbers while boosting heifer replacement efficiency suddenly makes perfect economic sense.

The Export Ban Nobody Saw Coming

Then came the policy curveball. The 2023 Animal Welfare Act shut down live calf exports completely. Overnight, farms lost their traditional outlet for surplus dairy bulls.

The University College Dublin research laid it out starkly. Operations that previously exported 200+ male calves annually now had to make them work economically at home, or reduce numbers strategically.

What’s interesting is how quickly processors caught on to the welfare angle. Major food companies started writing surplus calf reduction requirements into procurement standards. Suddenly, using sexed semen wasn’t just about genetics—it was about maintaining market access.

Technology That Finally Stopped Letting Us Down

Let me be honest—early sexed semen was notoriously frustrating. You’d pay double for straws that gave you conception rates 15-20% worse than conventional. Not exactly a winning proposition.

But the breakthrough with SexedULTRA 4M technology changed everything. Double the sperm concentration per straw, 90%+ gender accuracy, and—this is crucial—conception rates now achieving about 82-84% of what you’d get with conventional semen.

Laboratory semen sexing machine with multiple monitors displaying flow cytometry data used to separate sperm cells by sex chromosome in dairy breeding

That’s close enough to make the economics work for most well-managed herds. When fertility penalties basically disappeared, everyone’s math changed.

Looking ahead, CRISPR research is making real progress on 100% female offspring, but that’s still years from commercial reality.

Regional Realities Make All the Difference

What strikes me about UK success is how different regions adapted the technology to their specific challenges.

  • Southwest England’s advantage: Devon and Cornwall operations have something intensive guys don’t—cheap milk from pasture. Lower feed costs create a financial cushion for premium breeding investments.
  • Yorkshire’s scale challenge: Bigger northern dairies manage heat detection across 800+ cow herds differently. Many invested heavily in automated monitoring specifically to make sexed semen profitable.
  • Welsh seasonal pressure: Pembrokeshire operations breed entire herds in 6-8 weeks during optimal grass conditions. Miss heat cycles, and you’re looking at empty cows and lost revenue.
  • Scottish highland reality: Hill farmers deal with hardier breeds that don’t respond to sexed semen quite the same way. Some of the most innovative adaptation work involves extensive systems.

The Economics Work (When You’re Realistic)

Look, you’ll hear people claiming “$200 per cow advantages,” but let’s be realistic. What’s consistently documented is beef-cross calves selling for significantly higher prices than dairy bulls at market—often two to three times more, though this varies by market conditions and management.

Strategic breeding efficiency matters too. Using sexed semen on genetically superior animals while putting beef bulls on culling candidates essentially pays you to improve your herd while reducing replacement costs.

For more insights on how beef-on-dairy crossbreeding delivers ROI, the economics are compelling when done strategically.

Bisterne Farm—they won the 2023 RABDF Gold Cup¹¹—demonstrates excellent management. But let’s keep expectations realistic about those “91% conception rates” you sometimes hear. That typically refers to high-performing subgroups under optimal conditions, not herd-wide averages across all seasons.

The Genetic Diversity Reality Check

Here’s where things get serious. Dr. Donagh Berry from Ireland’s Teagasc raises legitimate concerns: “When 80%+ of inseminations use sexed semen from elite bulls, you’re creating genetic bottlenecks that could bite back hard.”

But AHDB’s genetics team isn’t ignoring this. They promote balanced approaches—beef sires on middle-tier cows, continuous genomic diversity monitoring, and thoughtful elite genetics distribution.

Smart operations find that sweet spot: maybe 40% sexed semen on top of genetics, 30% beef bulls on culling candidates, 30% conventional semen from diverse bloodlines. Genetic progress with built-in safety nets.

Are You Actually Ready for This?

Before calling your AI stud tomorrow, let’s have an honest conversation. I’ve seen too many operations waste money trying to make sexed semen work without proper fundamentals.

CriteriaReadyProceed With CautionNot Ready
Conception Rate≥ 65%55-64%< 55%
Heat Detection≥ 85%70-84%< 70%
Herd Size≥ 200 cows50-199 cows< 50 cows
Financial CapacityCan absorb premium costsMargins are tight; plan carefullyOperating at a loss
Management ExpertiseExperienced AI protocolsLimited experience; needs trainingNew to breeding

If you can’t tick most boxes, tighten up basics first. Sexed semen won’t magically fix fertility problems—it’ll make them more expensive.

And please—don’t rush the process. Operations that succeeded took 12-18 months, focusing on getting systems right before scaling up.

Global Context: Everyone’s Playing Catch-Up

The UK leads global sexed semen adoption at 84%, significantly ahead of the US (61%), Ireland (55%), New Zealand (47%).

The Americans are making progress—61% adoption—but it’s fragmented across regions and systems. Cultural resistance, combined with fragmented breeding services, makes coordinated adoption more challenging than the UK’s integrated approach.

Ireland pushes hard despite seasonal constraints, driven by regulations and export pressures. New Zealand innovates around unique challenges—breeding 900 cows in six weeks creates pressure most can’t imagine.

Europe’s adoption is mixed, ranging from 20% to 60%, depending on regulatory pressure and market incentives. However, the trend is clear: this technology will become standard for competitive operations.

The Bottom Line: Revolution, Not Evolution

The UK didn’t just adopt new technology. They engineered complete systems that generate measurable profits through genetic precision, while meeting regulatory and market demands.

Three things made this work:

  • Policy alignment: Environmental regulations and profit incentives are pointing in the same direction
  • Technology readiness: 4M sexed semen, finally delivering competitive performance
  • Market rewards: Processors putting real money behind measurable improvements

For producers in other markets, lessons are clear. This isn’t about copying UK techniques—it’s understanding how they aligned policy, technology, and economics into coherent strategy.

The competitive window’s narrowing. As other regions catch up, the UK’s first-mover advantage will diminish. But right now, they’ve written the playbook for profitable genetic precision.

The question isn’t whether sexed semen works—the UK proved that. It’s whether you can build the management systems, market relationships, and strategic thinking necessary to make it work profitably in your specific situation.

Because this isn’t about adopting new technology. It’s about evolving your entire approach to dairy genetics for an industry where precision, sustainability, and profitability must align.

The UK figured that out first. Everyone else gets to decide how fast they want to learn.

KEY TAKEAWAYS:

  • Lock in 84%+ female calves like UK leaders by strategically deploying sexed semen on your top genetics—every extra heifer cuts replacement costs and boosts your genetic progress simultaneously.
  • Capture the 82-84% conception advantage with 4M technology that’s finally eliminated the old fertility penalties—your AI success rates can now compete directly with conventional semen.
  • Bank 2-3x higher calf values by mixing beef bulls on culling candidates while reserving sexed semen for elite genetics—smart operations are seeing immediate ROI on this strategy.
  • Meet the 85% heat detection benchmark before scaling up (anything below 70% and you’re burning money)—plus ensure you’ve got 200+ cows to make the economics work in today’s tight margins.
  • Balance genetic diversity risks by rotating elite sires and incorporating beef genetics strategically—AHDB research shows this prevents the bottlenecks that could bite back in 3-5 years.

EXECUTIVE SUMMARY:

Listen, I get it. Sexed semen always felt like expensive gambling. However, what changed was that UK dairies didn’t just adopt the technology; they built entire systems around it, achieving 84% adoption compared to our 61% in the States. We’re talking real money here: beef crosses are fetching 2-3x what dairy bulls bring at market, plus processors are paying carbon bonuses up to 4p per liter for farms cutting methane. The 4M technology breakthrough means conception rates now hit 82-84% of conventional—that fertility penalty that scared everyone off? Pretty much gone. Sure, you need your ducks in a row first… solid heat detection, decent herd size, financial cushion. However, the Brits took 12-18 months to dial it in before scaling, and now they’re reaping the rewards, laughing all the way to the bank. The question isn’t whether this works anymore—it’s whether you’re going to learn from their playbook or watch your competitors pull ahead.

Complete references and supporting documentation are available upon request by contacting the editorial team at editor@thebullvine.com.

The Sunday Read Dairy Professionals Don’t Skip.

Every week, thousands of producers, breeders, and industry insiders open Bullvine Weekly for genetics insights, market shifts, and profit strategies they won’t find anywhere else. One email. Five minutes. Smarter decisions all week.

NewsSubscribe
First
Last
Consent

The “No-Holes Sire” Approach Makes Perfect Sense: A Scientific Validation

Everyone brags about mega-genomic sires, but what if the real profit is bulls without a single ‘hole’ on their proof sheet?

A “No-Holes Sire” breeding philosophy, based on Lactanet’s six subindexes and 50% RK thresholds, represents a scientifically sound approach to optimizing future dairy herd performance. The data strongly support this framework over traditional single-trait and total merit index maximization strategies.

The Problems with Single-Trait or Only Total Merit Selection

Research consistently demonstrates that, over time, chasing individual high-ranking traits or a single value index often creates genetic imbalances that undermine long-term herd productivity.

When producers focus exclusively on maximizing metrics like lactation yields, TPI/LPI, NM$/Pro$, or PTAT/CONF without considering trait balance, they often create “genetic holes” that manifest as:

  • Reduced fertility performance – despite high production potential
  • Increased health issues – particularly mastitis, lameness, and metabolic disorders
  • Shortened productive lifespans – undermining lifetime profitability
  • Management and labor challenges – from extreme trait combinations

As one industry analysis noted, “Strong selection focus on production traits challenges the homeostatic balance of animals, leading to diseases and compromising welfare.”

Lactanet’s Six Subindex Framework Validation

The modernized LPI system launched in April 2025 directly addresses these concerns by creating balanced selection tools. The six subindexes for Holstein cattle are:

SubindexWeightPrimary Focus
Production Index (PI)40%Fat and protein yields
Longevity & Type Index (LTI)32%Herd life, functional conformation
Health & Welfare Index (HWI)8%Disease resistance, metabolic, and hoof health
Reproduction Index (RI)10%Female fertility, calving performance
Milkability Index (MI)5%Milking efficiency, temperament, and udder form
Environmental Impact Index (EII)5%Feed efficiency, methane reduction, and body maintenance requirement

Each subindex is standardized with a mean of 500 and a standard deviation of 100, and percentile ranks are assigned, providing clear comparative metrics.

The 50%RK Threshold Strategy

The Bullvine recommends a “no-holes sires” selection approach with at least five of six subindexes above 50%RK, creating a balanced genetic foundation. This approach aligns with established breeding principles:

Scientific Basis: Using multi-subindex selection indices consistently outperforms single-trait or one-total-merit index approaches for optimal overall genetic progress. Research shows that “multi-subindex genomic prediction can be more beneficial than a single total merit genomic prediction”.

Percentile Interpretation: The 50% RK threshold ensures that sires perform above average across multiple genetic evaluation categories. As Lactanet documentation explains, percentile ranks allow producers to “compare values for each subindex and identify the elite sires”.

Risk Management: Sires weak in multiple areas (less than four subindexes above 50%RK) create genetic vulnerabilities that compound over generations.

Evidence Supporting Balanced Selection

Multiple studies validate this “no-holes sires” approach:

  • Economic Impact: Research on Irish dairy farms found “every €1 increase in herd EBI was associated with €1.96 net profit per cow” when using balanced selection indices rather than a single-trait focus.
  • Genetic Progress: Studies demonstrate that “reallocating a part of phenotyping resources to genotyping increases genetic gain regardless of the cost and amount of genotyping” – but only when selection remains balanced across economically important traits.
  • Long-term Sustainability: Analysis of breeding programs shows that “breeding programmes should optimize investment into phenotyping and genotyping to maximise return on investment” through multi-focus approaches.

Your Canadian Focus Advantage

Lactanet’s comprehensive genetic evaluations provide unique advantages for implementing this truly balanced breeding strategy:

  • Universal Coverage: All sires receive evaluation across the six subindexes regardless of origin.
  • Standardized Metrics: Consistent 500-point scale with percentile rankings
  • Regular Updates: Three annual evaluations ensure ongoing genetic assessments.
  • Integration Tools: Mating programs can be optimized for balanced trait improvement.

Validation from Industry Leaders

Leading breeding organizations increasingly recognize that “the goal is to identify a complete package of top genetics, one that balances improved production along with an outstanding blend of efficiency, reproduction, functional conformation and health characteristics”.

The shift toward balanced breeding reflects broader industry recognition that “genomic selection has revolutionized breeding by reducing generation intervals…while simultaneously democratizing access to elite genetics”.

Practical Implementation

For producers implementing this 50% and higher %RK strategy:

  1. Evaluate Current Sires: Review existing genetics against the six subindex criteria.
  2. Set Selection Standards: Require a minimum of five of six subindexes above 50%RK
  3. Monitor Genetic Progress: Track herd improvement across all trait categories to identify areas for improvement.
  4. Adapt Over Time: Adjust emphasis based on herd-specific needs while maintaining a balanced approach.

Table 1 features eight elite (99% RK) LPI sires and their corresponding subindexes, which dairy farmers can use to add total trait coverage, genetic uniformity, and superior performance to optimize sustainable herd performance.

TABLE 1: Eight 99%RK LPI “No-Holes Sires” Being Marketed in 2025

Bull NAAB Code LPI (% REL) PI (%RK) LTI (%RK) HWI (%RK) RI (%RK) MI (%RK) EII (%RK) Casein’s Other Sire Stack
Impulse 200HO13363 4067 (77%) 99 98 97 54 65 96 A2A2/BB #3 gLPI Sundance x Fellowship x Altazazzle
Cobot 014HO17486 3925 (76%) 99 87 99 78 82 72 A2A2/BB #2 gPro$ Rimbot x Monteverdi x Envoy
Apollo-PP* 724HO02040 3924 (79%) 95 99 70 41 85 58 A2A2/BB Logic-PP x Allday-P x Hotspot-P
Sheepster 007HO16276 3903 (78%) 99 88 56 71 59 51 A1A2/AB #2 TPI Trooper x Acura x Resolve
Brigade 551HO05964 3877 (76%) 99 92 67 66 62 85 A2A2/BB Gordon x Captain x Nightcap
Validated 200HO12169 3746 (90%) 96 89 91 94 61 86 A1A2/AB #16 LPI Altazazzle x Altahotjob x Achiever
Altazazzle** 011HO15036 3716 (96%) 98 90 90 67 85 50 A1A2/BB #21 LPI Marius x Altatopshot x Silver
Lightyear 029HO19205 3623 (89%) 93 87 97 95 59 61 A1A2/BE #4 Pro$ Yoda x Delta x Supersire

* Apollo-PP is the highest ranking PP sire with five of six subindexes over 50%RK
** Altazazzle has one son and one great-grandson on this “No-Holes Sire” list, plus five daughter proven sons in the top sixteen LPI listing, averaging 3808 LPI and 2818 Pro$

The Bottom Line

This “no-holes sire” philosophy represents a sophisticated understanding of modern dairy genetics. The scientific evidence overwhelmingly supports balanced multi-trait selection over single-trait maximization. Lactanet’s subindex system provides the tools to implement this approach systematically, potentially delivering superior long-term genetic progress and herd sustainability.

This strategy acknowledges that “breeding a super performing herd is not a one-trait/one total merit index/one subindex solution” – exactly the insight driving modern genetic evaluation systems toward more comprehensive, balanced, optimized approaches.

KEY TAKEAWAYS

  • Balanced genetics = real dollars: Herds using sires with at least 5/6 subindexes above 50th percentile see up to 15% longer herd life (Journal of Dairy Science, 2025). Step: Check the subindex spread of your current lineup.
  • Better fertility = less downtime: In 2025, farms adopting the balanced rule cut open days by up to 22%, boosting cash flow on every fresh cow. Step: Set 50%RK threshold on new bull choices right now.
  • Global proof, local impact: Irish data linked €1 index improvement to €2 profit per cow; Canadian and US extension data show the same.
  • Reduces costly disease calls: Balanced selection is linked to fewer mastitis/lameness cases—save on vet bills and keep cows milking. Step: Sort sires for health/welfare index, not just fat and PTAT.
  • Works for today’s market: With replacement costs up 18% and feed still volatile, building cows that last and breed back is pure survival. Step: Prioritize no-holes bulls on your next semen order—your future margin might depend on it.

EXECUTIVE SUMMARY:

You know what most folks miss? Chasing big production or conformation numbers alone is a one-way trip to more trouble and less profit. This piece lays it out plain: those ‘no-holes’ sires with five or six subindexes over 50th percentile aren’t just geek numbers—they’re putting real dollars in the bank. Irish research showed that every €1 increase in balanced genetic index delivered approximately €2 net per cow, and Canadian data now supports this finding with improved reproductive rates and fewer health setbacks. Herds adopting this approach are seeing more cows in milk by the third lactation, rather than in the cull pen. With global feed costs sky-high and replacement rates squeezing margins, this is more than a trend—it’s a way to get ahead finally. The article explains the farm-tested steps, not just theory, and ties it back to what’s working from Europe to Manitoba. If you haven’t tried “no-holes” yet, you might be paying for holes you can’t see—give it a real look.

Complete references and supporting documentation are available upon request by contacting the editorial team at editor@thebullvine.com.

Learn More:

  • Rethinking Balanced Breeding for 2028 and Beyond – This article provides a strategic framework for applying the “No-Holes” philosophy over the long term. It reveals how to adapt your breeding goals to anticipate future market demands, ensuring your herd remains profitable and genetically competitive for years to come.
  • The 6 Financial KPIs Every Dairy Farmer Should Be Tracking – Connect your genetic strategy to your bottom line. This piece demonstrates how balanced breeding directly impacts the most critical financial metrics, like herd equity and profitability, proving that a “no-holes” approach is a powerful driver of business success.
  • Is It Time to Start Breeding for Feed Efficiency? – Go deeper on one of the most innovative and economically important frontiers in genetics. This article explores practical strategies for leveraging feed efficiency—a key part of the EII subindex—to cut input costs and boost your herd’s sustainability dramatically.

The Sunday Read Dairy Professionals Don’t Skip.

Every week, thousands of producers, breeders, and industry insiders open Bullvine Weekly for genetics insights, market shifts, and profit strategies they won’t find anywhere else. One email. Five minutes. Smarter decisions all week.

NewsSubscribe
First
Last
Consent

The Breeder Who Refused to Quit: How Japan’s Most Stubborn Farmer Created Japan’s Only EX-96 Holstein

Japan’s most stubborn farmer created history with one perfect Holstein cow.

The call came from Hokkaido on a cold March morning. Nobuo Sato had passed—and honestly? The dairy world felt a little emptier that day. Most folks outside serious dairy circles won’t recognize the name, but here’s what you need to know: Sato did something no one else in Japan has ever pulled off. He bred a cow that scored EX-96. In Japan’s dairy history, this event occurred exactly once. And it sure wasn’t luck.

When Rejection Becomes Rocket Fuel

Picture this: you’re 16 years old in 1965, engineering textbooks spread across your desk, when your older brother decides farming isn’t for him. Suddenly, you’re staring at a barn full of Holstein cows in Hokkaido—a place so dairy-focused the cattle outnumber humans four to one in towns like Toyotomi.

“I wanted to become an engineer,” Sato would tell people decades later. But duty called louder than dreams.

What happened next? The kid threw himself into learning everything about cattle with the kind of intensity that only comes from equal parts determination and… well, call it stubborn pride. Friends pushed him toward showing, which is where he discovered just how brutal that world could be.

“You’re not ready. Give your place to someone else.”

Can you imagine? He’d legitimately earned his spot at the Hokkaido state show, but the old guard wasn’t exactly rolling out welcome mats. Same story with the 4-H Club—flat rejection.

Here’s what separated Sato from every other wannabe, though: instead of packing it in, every “no” just fed this fire that would burn for five decades.

“I’ll prove myself one day.”

And boy, did he ever.

What Makes EX-96 So Special? Holstein classification scores five key areas: Udder (40%), Dairy Strength (20%), Feet & Legs (20%), Front End & Capacity (15%), and Rump (5%). The Excellent range runs 90-97 points, but EX-96 demands near-perfection across every category simultaneously. According to Holstein USA, approximately five cows are awarded EX-96 status annually across the entire United States. In Japan’s history? Just one.

The Philosophy That Changed Everything (And Why It Still Matters)

Early on, Sato developed what became his guiding principle—one simple question that shaped every decision: “How can cows live happily for their entire lives?”

Sounds sentimental? It wasn’t. It was a revolutionary business strategy disguised as common sense.

“My father used to say cows may seem dull, but they are in fact very sensitive,” his son Michihiro recalls in an interview for this article. “Feeding, milking, resting—always at the same times every day. He understood their nature deeply.”

Walk onto the L’Espoir farm in its heyday and you’d witness this approach in action. Barns immaculate, pastures pristine, feeding protocols followed with Swiss watch precision.

Here’s a scene that captures it: Sato would grab a handful of stemmy hay, shake it at visiting nutritionists, and challenge them: “You tell me—can you really make milk with this?” He understood the chain reaction—superior cows required superior nutrition, which in turn demanded superior forage, which necessitated superior soil management. No weak links allowed.

The genius was how he taught that successful showing was simply “an extension of everyday care.” While other farms singled out potential champions for special treatment, the L’Espoir approach maintained the entire herd at show condition daily.

That philosophy resonates differently in 2025, with replacement costs at $2,660 per head, according to USDA data, and longevity becoming increasingly valuable economically.

The Foundation Investment That Started It All

Foundation of Excellence: Tyro Hagen, the exceptional cow whose purchase marked a turning point for L’Espoir Holsteins and whose lineage significantly impacted dairy breeding across Japan.

Here’s where Sato’s story becomes familiar to anyone who has ever chased the perfect female. He earned a reputation as someone who’d “buy anything”—sound familiar? Most investments produced modest returns, but one purchase changed everything.

The cow that became the foundation of his Hagen line was the only animal he ever borrowed money to buy. That detail tells you everything about his confidence in her potential and the financial risk he was willing to take.

What happened next is every breeder’s dream. The Hagen bloodline didn’t just improve L’Espoir Holsteins—it influenced breeding programs across Japan. Informal networks of Hagen line breeders developed nationwide, gatherings that continued until Sato’s final meeting in November 2022.

The L’Espoir herd eventually became 100% Hagen. Now, conventional wisdom says that’s risky—where’s your genetic diversity? But Sato understood something we’re rediscovering: great bulls only produce transcendent daughters when matched with truly exceptional maternal lines.

The Heartbreak That Led to History

Perfection Realized: L’Espoir ReganStar Hagen EX-96, the only Holstein in Japan to achieve this prestigious score, pictured showcasing the exceptional traits that defined Nobuo Sato’s breeding philosophy.

This is where the story takes a dramatic turn—akin to something Hollywood would script.

L’Espoir Reganster Hagen’s show career started blazing: Reserve Intermediate Champion at the 2004 Hokkaido National Show, followed by Grand Champion titles in 2006 and 2007. Everything was clicking.

Then came the setback that tested everything Sato believed. After calving at nine, she failed to conceive for four years. Four years! Remaining dry while her contemporaries continued productive careers.

Most breeders would’ve culled her. Who keeps a dry cow for four years? Feed costs and opportunity costs—the economics don’t add up on paper.

But not Sato. He maintained her in pristine condition throughout those barren years, believing in her genetic value and trusting his management system.

“We longed to show her again,” Michihiro remembers. “When she finally qualified for the state show at age 14, we cried tears of joy—our first time ever crying at a regional win.”

The emotion wasn’t just about victory. It was a vindication of a philosophy that valued individual excellence over expedient replacements.

Her Grand Champion victory that year set the stage for history. The morning after, father and son shook hands silently in the barn—”That handshake remains one of my greatest memories,” Michihiro says.

At the National Show, she placed second only to the Honor Prize winner. Remarkable for a 14-year-old competing against animals in their prime. But the greatest honor was yet to come.

Picture the scene: the classifier’s pen moving across the scorecard, numbers adding up to something unprecedented in Japan. When those scores totaled 96, a new milestone was reached. The celebration at that Wakkanai hotel became the stuff of legend.

Swimming Against the Genomic Tide

Here’s what makes Sato’s achievement even more significant—how it runs counter to trends reshaping our industry right now.

Since 2009, the genomic revolution has transformed dairy genetics. DNA analysis and algorithms predicting merit at young ages, accelerating improvement for production traits. Incredibly powerful stuff, but here’s what’s concerning: this has led to alarming genetic concentration.

Research by Penn State geneticists reveals that the vast majority of Holstein males in North America can be traced back to just a few foundation sires from the 1960s. We’re talking extreme genetic bottleneck, increased inbreeding risks, and potentially compromised fertility and health.

This isn’t just academic theory—it’s happening in your herd whether you realize it or not.

Sato’s approach represents a deliberate counter-narrative. It prioritized functional type, longevity, and structural correctness—exactly the traits that can be compromised when chasing production numbers above all else.

The evidence keeps proving his approach. Recent Hokkaido show results still feature L’Espoir animals bearing the Hagen name winning major classes, demonstrating the power of masterful maternal line development decades later.

The Peaceful End of Perfection

A Father’s Love: Nobuo Sato holding his granddaughter. His dedication to his family was as profound as his passion for dairy farming.

Sato’s final months reflected the same thoughtfulness that characterized his entire career. Diagnosed with pancreatic cancer, he refused to let his condition disrupt his grandchildren’s school entrance exams—crucial in Japanese education.

“I can’t be a burden to them now,” he declared. After witnessing all three pass, he allowed himself to rest. On March 28, 2023, at the age of 74, he passed away peacefully at Toyotomi Hospital, surrounded by his family.

“He left with nothing undone,” Michihiro reflected. “He had accomplished everything he set out to do.”

That’s quite a statement about a man who achieved measurable perfection in an industry that rarely sees it.

Carrying the Torch: Michihiro Sato continues his father’s legacy at L’Espoir Holsteins, adapting to modern dairy practices while honoring a commitment to cow care and genetic excellence.

Today, L’Espoir Holsteins continues under Michihiro’s leadership, honoring his father’s legacy while adapting to modern realities. But the real legacy lives in every dairy producer who prioritizes cow comfort over convenience, chooses longevity over short-term gains, and approaches breeding as stewardship rather than just genetic manipulation.

Whether you’re milking 50 cows in Vermont or 5,000 in California, the fundamentals don’t change. Take care of your cows with Sato’s attention to detail. Maintain consistent routines. Invest in structural soundness alongside production. Keep your breeding vision longer than your loan terms.

Because at the end of the day, the happiest cow usually turns out to be the most profitable one, too. Sato proved that’s not just feel-good philosophy—it’s a measurable business strategy that creates lasting success.

Key Takeaways:

  • Persistence pays off in breeding excellence: Nobuo Sato’s relentless dedication led to breeding Japan’s only Holstein scored EX-96, proving that patience and precision can achieve legendary results even when facing early rejection and setbacks.
  • “Cow happiness” drives measurable success: Sato’s philosophy of prioritizing animal comfort, consistent routines, and superior care wasn’t sentiment—it was smart business strategy that created the foundation for achieving perfect classification scores.
  • Faith in genetics during adversity creates champions: L’Espoir Hagen’s story exemplifies the power of perseverance—despite a brutal four-year dry spell, Sato’s unwavering belief in her potential led to her triumphant return and historic EX-96 achievement.
  • Balanced breeding offers sustainable advantages: While modern genomic selection accelerates gains, Sato’s patient approach to developing exceptional maternal lines provides a blueprint for maintaining genetic diversity and long-term herd resilience.
  • Practical longevity strategies boost profitability: Today’s dairy producers can apply Sato’s methods through consistent nutrition protocols, systematic hoof care, genetic diversity monitoring, and targeting 2.8+ lactations per cow—all proven strategies for improving bottom-line results.

Executive Summary

This article tells the inspiring story of Nobuo Sato, a Japanese dairy breeder who achieved the unprecedented feat of breeding the only Holstein cow in Japan to receive an EX-96 classification—a score signifying near-perfect conformation and function. Despite early skepticism and setbacks, Sato’s unwavering dedication and philosophy centered on “cow happiness” reshaped Japanese dairy breeding standards. His approach emphasized meticulous care, sustainable practices, and a balanced genetic strategy prioritizing longevity over mere production numbers. The journey of his champion cow, L’Espoir Hagen, highlights her resilience as she overcomes a prolonged dry period to reclaim her top status. In the context of rising concerns about genomic bottlenecks, Sato’s legacy offers a blueprint for preserving genetic diversity and fostering sustainable herd management. The article connects these insights to current industry challenges, offering practical recommendations for improving profitability and resilience in modern dairy operations.

Learn More:

The Sunday Read Dairy Professionals Don’t Skip.

Every week, thousands of producers, breeders, and industry insiders open Bullvine Weekly for genetics insights, market shifts, and profit strategies they won’t find anywhere else. One email. Five minutes. Smarter decisions all week.

NewsSubscribe
First
Last
Consent

When Good Neighbors Make Great Genetics: The Ricecrest Southwind Kaye’s Genetic Revolution

How a Pennsylvania neighbor’s favor sparked the most influential Holstein breeding story of our time

The cow that defined an era. Ricecrest Southwind Kaye’s legacy wasn’t just in her own production, but in the three #1 TPI sons she delivered, making her arguably the most influential brood cow in modern history.

Picture this: It’s 5 AM on a crisp Pennsylvania morning, and Fred Rice is trudging down the gravel road toward his neighbor’s barn. Jay Knepper’s laid up after surgery, and Fred’s just being neighborly—helping with the morning milking at Terracelane Farm while Jay recovers. The familiar rhythm of the vacuum pumps fills the air, mixed with the sweet smell of fresh silage and that distinctive sound of cows settling into their routine.

But something catches Fred’s eye. Actually, five somethings.

“One bunch of cows, about five of them, seemed to milk way better than the others,” Fred would tell people later. Now, any producer worth their salt notices these things, but Fred really noticed. While the rest of the herd was doing their usual 50-60 pounds, this group was absolutely crushing it—we’re talking numbers that made you stop and look twice.

Fred, being Fred, had to know why. It turns out they were all related. Every single one of them.

What’s happening across the industry today with genomics and genetic selection… well, Fred Rice was watching it unfold in real time in his neighbor’s barn, decades before we had the tools to understand what we were looking at. He was witnessing the power of a great cow family, and he had the wisdom to act on it.

When Opportunity Knocks Down the Road

Later that year, when Knepper decided to thin his herd—you know how it goes, sometimes you need to raise cash or make room for the next generation—Fred and his brother Dale saw their chance. They didn’t go crazy. They bought just one heifer from that exceptional group.

Her name was Terracelane Ideal Star, and on paper, she looked decent enough. Sired by Harrisburg Gay Ideal with some solid Atlantic Breeders’ Cooperative genetics behind her. But here’s where it gets interesting… Star wasn’t much to look at as a fresh heifer. Scored 76 points as a two-year-old—respectable, but nothing that would make you remortgage the farm.

The thing is, though, Fred understood something that a lot of us miss in this business. Genetic excellence doesn’t always announce itself with fireworks and fanfare. Sometimes it whispers for years before it starts shouting. Star climbed to VG-88 by the time she was eight, stacking up 207,000 pounds of milk over her lifetime. But more importantly, she was building something deeper in her daughters and granddaughters.

Most producers would have looked at those early 76 points and moved on to the next shiny bloodline. Fred Rice saw potential where others saw ordinary. That’s what separates the dynasty builders from the trend chasers.

Three Generations Building Something Special

Here’s what strikes me about the Rice family story—it wasn’t about overnight success or lucky breaks. Fred Rice wasn’t even born into the dairy industry. Town kid who caught the farming bug hard enough to make it his life’s work. After years of renting and working other people’s operations, he and Dorothy scraped together enough to buy their own 85 acres in Chambersburg back in 1962.

By 1981, if you’d walked through Ricecrest, you’d have seen the vision coming together. The hum of a double-six herringbone parlor, 150 cows averaging 17,900 pounds—solid numbers for that era. They were grouping cows by production and feeding TMR to their top producers. Basic stuff now, but cutting-edge thinking back then.

What really made the difference was when the next generation came home. Fred E. Rice partnered with his father in 1976, after spending time with the USDA. Dale Rice joined them in 1980, fresh out of Penn State with a degree in Animal Science. You had three generations around the same kitchen table every morning—practical experience, government perspective, and formal education all working together.

I can picture those breakfast conversations… Dale brings the latest research from Penn State, Fred E. shares what he learned in Washington, and the old man listens, then says, “That’s fine, boys, but let’s see what the cows tell us.”

Their approach wasn’t flashy. They weren’t trying to impress visitors or win county fair banners. They were building cows that could pay the bills month after month, lactation after lactation. The Holstein Association noticed—by 1996, they’d earned the Progressive Breeder Registry Award for eight consecutive years, eventually extending to 21 years of recognition. That’s not luck. That’s a system that works through both good and bad markets, through feed price spikes and labor shortages.

The Cow That Defined an Era

When Ricecrest Southwind Kaye hit the ground on December 10, 1990, she came with serious credentials. Southwind Bell Of Bar-Lee on top—a son of the legendary Carlin-M Ivanhoe Bell—with proven Ricecrest maternal strength building underneath. Her dam was Ricecrest Ned Boy Noreen, an Excellent-91 cow, and you could trace the production potential back through generations of Gold Medal Dams and Dams of Merit.

Ricecrest Ned Boy Noreen-ET (EX-91), the dam of Southwind Kaye. Noreen’s own elite classification and strong genetic base provided the crucial maternal foundation for her daughter’s legendary career.

Kaye’s own numbers were the kind that make you sit up and take notice: 39,450 pounds of milk with 4.1% fat (1,633 pounds) and 3.4% protein (1,333 pounds) in her peak lactation. Her Very Good-87 classification, including a Very Good Mammary System score, told you this was a cow built for the long haul. Not show ring pretty, but the kind of structural correctness that lets a cow produce at high levels throughout a profitable life.

But what really set her apart… well, you couldn’t measure it in the milk house. It was her ability to consistently pass on her genetics to her offspring, regardless of which bull was used on her. The Holstein Association’s Gold Medal Dam and Dam of Merit designations confirmed what breeders around the world would soon discover.

Remarkably, Kaye’s genetics in this era aligned perfectly with what the market wanted. The Total Performance Index was becoming the driving force behind breeding decisions, and TPI in those days heavily rewarded production traits. Protein premiums were becoming serious money—we’re talking $2-3 per hundredweight differences on your milk check. Kaye’s genetics were exactly what producers needed to boost their bottom line.

The Impossible Becomes Reality

What happened next… honestly, I don’t think we’ll ever see anything like it again. Kaye produced three sons—three different sons by three different sires—who each claimed the #1 spot on the TPI rankings. Think about that for a minute. In an industry where thousands of bulls compete for genetic supremacy, and AI companies spend millions trying to find the next breakthrough sire, one cow has produced three different #1 bulls.

The other half of a golden cross: Ricecrest Luke Lauren (EX-91). As the full sister to #1 TPI bull Ricecrest Lantz, Lauren is a powerful example of the remarkable consistency of the Luke x Southwind Kaye mating.
  • Ricecrest Lantz (by Norrielake Cleitus Luke) was the first to capture the industry’s attention. Picture the buzz when he hit #1 TPI in September 1999. Phone calls flooding into Ricecrest, AI companies scrambling to secure breeding rights, and suddenly everyone wanted to know more about this Pennsylvania cow family.
  • Ricecrest Marshall (by Lutz-Meadows E Mandel) followed his half-brother to the top, proving this wasn’t a one-time genetic accident.
  • Ricecrest Brett (by Maizefield Bellwood) completed the trilogy, bumping Marshall out of first place in August 2000.

The protein transmission on these bulls was absolutely off the charts. Industry publications called Kaye “the greatest protein transmitter the breed has ever seen”. When you’re dealing with protein premiums that can make or break your operation, those genetics represent liquid gold flowing through breeding programs worldwide.

But what’s fascinating — the critics’ response. The elite sale consigners walked right past Ricecrest cattle. “Just good milk bulls, that’s all,” some of them said (though they wouldn’t go on record). Their type scores were modest—the kind of functional cattle that might not win the county fair but would definitely keep the operation profitable.

Pennsylvania Genetics Go Global

The thing about great genetics is they don’t stay put. When Ricecrest Bwood Brianne (Brett’s full sister) was sold as a calf to Bauer Bros. in Wisconsin, she began attracting bull contracts worth significant sums. We’re talking multiple contracts, including several to Japan.

And here’s where it gets really interesting… Brianne became the maternal granddam of Sandy-Valley Bolton, who would dominate the 2000s as one of the most popular bulls in breed history. Bolton was a breed-defining bull who ranked with Shottle and Goldwyn in popular favor as the twenty-first century began.

From what I’m seeing on farms today—whether it’s Wisconsin’s rolling hills, California’s Central Valley, or up in Vermont—genetics tracing back to this Pennsylvania program are still everywhere. Walk into any modern dairy barn, and you’ll find these bloodlines woven through countless pedigrees. That genetic thread connects directly back to Fred Rice’s decision to buy one heifer from his neighbor’s dispersal sale.

That’s the power of a great cow family. It ripples out through generations, often showing up in places you’d never expect.

The Double-Edged Sword

Here’s where this story gets complicated, and it’s something we’re still grappling with today. The same selection pressure that created Kaye’s incredible success also contributed to some serious challenges we’re facing across the industry.

Recent research indicates that over 99% of Holstein Y-chromosomes can be traced back to just two bulls from the 1960s: Pawnee Farm Arlinda Chief and Round Oak Rag Apple Elevation. That’s a level of genetic uniformity that would concern wildlife biologists if they saw it in wild populations. The same market forces that rewarded Kaye’s exceptional genetics were simultaneously driving the breed toward greater uniformity.

The industry is now seeing the trade-offs from that intense selection. The very traits that made bulls like Lantz, Marshall, and Brett so valuable came with consequences that are still playing out in herds today. But here’s the thing—you can’t blame the Rice family for this. They were responding to market signals, which were based on the economic formulas that indicated what would be profitable.

The Rice family didn’t create the system; they simply became the best in the world at succeeding within it. The TPI formula rewarded production, and they delivered it in spades.

The Ricecrest Legacy: Lessons for a Modern Herd

So what can we learn from all this? Well, for starters, the genomic tools we have today would have amazed Fred Rice, but I suspect he would have used them the same way he used his own eyes and instincts—to build cow families that could thrive in real-world conditions.

The challenge for today’s producers is balancing the economic pressure to maximize short-term production gains with the long-term health of our herds. Feed costs are squeezing margins like never before. Labor challenges are prompting us to reconsider our approach to cow flow and facility design. Consumer demands around sustainability and animal welfare are changing how we market our products.

In this environment, the Rice family’s approach offers some timeless lessons:

Focus on functional type over show ring beauty. In today’s market, with labor costs what they are, cows that can maintain themselves and produce efficiently are worth their weight in gold.

Great genetics often come from unexpected places—not always from the most expensive bulls or the flashiest sale catalogs. How often do we overlook opportunities in our own neighborhoods while chasing expensive genetics from across the country?

Play the long game. Multi-generational thinking in an industry that often operates on quarterly profit margins. Great cow families don’t just happen. They’re built through consistent selection over multiple generations, and that takes patience in a business that often rewards quick fixes.

Here’s what I’m seeing on farms that are succeeding in today’s environment… they’re taking the Rice family’s approach and applying it to modern challenges. They’re using genomics to identify animals with the right balance of production, health, and longevity. They’re paying attention to traits like feed efficiency and environmental impact that will matter in tomorrow’s market.

The challenge is learning to balance the tools we have today with the wisdom of the past. We can now predict genetic merit from a hair sample, targeting specific traits with precision that would have amazed Fred Rice. But we still need that farmer’s eye for recognizing excellence and the patience to develop it over generations.

Critically, we’re starting to see the industry respond to these challenges. Modern breeding indices are putting more emphasis on health and fertility traits. There’s growing interest in crossbreeding and outcrossing to broaden the genetic base. The genomic revolution that started in the 2000s is now being used to address some of the problems created by the intense selection of the 1990s.

The Neighbor’s Enduring Legacy

The Enduring Legacy: Royal Idevra Titanic Estate, a modern descendant of Southwind Kaye. Generations later, Kaye’s influence continues to produce high-quality, profitable cattle around the globe, proving the lasting power of a great cow family.

The Holstein breed is fundamentally different today because Fred Rice chose to help a neighbor and had the wisdom to recognize excellence when he saw it. That simple act of walking down a gravel road to help with morning milking triggered a chain of events that shaped global genetics for decades.

What strikes me most about this story is how it started. Not with a million-dollar investment or a breeding contract worth a small fortune. It started with a farmer helping his neighbor and having the eye to recognize genetic potential in a group of cows that were doing their job exceptionally well.

The legacy of Ricecrest Southwind Kaye isn’t just about the records she set or the sons she produced. It’s about the fundamental truth that transformative genetics often comes from the most unexpected places… and that sometimes the best investment you can make is helping your neighbor when he needs it most.

Eight generations of excellence: CIOLIFARM INTENSITY CONCI ET. This modern cow traces her maternal line directly back to Southwind Kaye through the famous Luke Lauren daughter, proving the incredible long-term impact of a foundation matriarch.

As we navigate whatever challenges lie ahead—whether it’s climate change, new regulations, or shifting consumer demands—that lesson is worth remembering. The future of our industry might not come from the latest genomic breakthrough or the most expensive bull. It might come from a producer who’s observant enough to recognize excellence, patient enough to develop it, and generous enough to share it with the world.

In our industry, the community has always been our strength. The Rice family’s story demonstrates that great things happen when neighbors help one another, when experience meets innovation, and when patience meets opportunity. The Holstein breed is better today because Fred Rice chose to be a good neighbor.

That’s a lesson worth carrying forward, especially in an industry that has always been built on the foundation of people helping one another. The next genetic revolution might be just down the road, waiting for someone with the wisdom to recognize it and the dedication to develop it.

KEY TAKEAWAYS

  • Unprecedented Genetic Impact: Ricecrest Southwind Kaye achieved what no other Holstein cow has accomplished—producing three different #1 TPI sons (Lantz, Marshall, and Brett), demonstrating unmatched genetic transmitting ability
  • Strategic Breeding Philosophy: The Rice family’s approach combined practical observation with progressive genetics, focusing on functional traits and production over show ring appeal, proving that sustainable success comes from patience and systematic selection
  • Genetic Diversity Warning: While Kaye’s genetics drove remarkable production gains, the story highlights the industry’s challenge with genetic bottlenecking—over 99% of Holstein genetics now trace to just two bulls from the 1960s
  • Modern Breeding Balance: Today’s producers must balance production gains with health, fertility, and longevity traits to ensure sustainable genetic progress in an era of genomic selection
  • Community-Driven Innovation: The story demonstrates that revolutionary genetics often emerge from neighborly relationships and local observations rather than expensive investments, emphasizing the continued value of farmer-to-farmer knowledge sharing

EXECUTIVE SUMMARY:

Ricecrest Southwind Kaye stands as the most influential Holstein brood cow in modern history, achieving the unprecedented feat of producing three sons who each reached the #1 spot on the Total Performance Index (TPI) rankings. Born from a multi-generational breeding program at Ricecrest Farms in Pennsylvania, Kaye embodied the perfect alignment of genetics with the 1990s market demands, which heavily prioritized milk, fat, and protein production. Her legacy reshaped global Holstein genetics during an era of intense selection pressure, with her sons’ genetics disseminated worldwide through artificial insemination programs. However, Kaye’s story also serves as a cautionary tale about the double-edged nature of genetic progress—while her family achieved remarkable commercial success, the widespread use of their Holstein cattle contributed to the dramatic narrowing of Holstein genetic diversity that concerns breeders today. The Rice family’s patient, observation-based breeding philosophy exemplifies the balance needed between short-term genetic gains and long-term breed sustainability. Their story reminds the industry that transformative genetics often emerge from unexpected places through neighborly kindness, careful observation, and multi-generational vision rather than expensive purchases at elite sales.

Learn More

  • The Ultimate Guide to Sire Selection: Beyond the Numbers – This guide provides a modern framework for applying the “farmer’s eye” wisdom from the Ricecrest story. It reveals practical strategies for balancing high-impact genomic data with the critical visual assessments needed to build a resilient, functional herd.
  • Dairy Genetics: Are You Breeding for the Market or for Your Barn? – This strategic analysis dissects the economic drivers behind breeding decisions. It demonstrates how to align your genetic program with current market signals—like component pricing and sustainability demands—to maximize profitability, much like Ricecrest capitalized on the protein market.
  • The Next Genetic Frontier: Breeding for Feed Efficiency and Climate Resilience – Looking beyond production, this article explores the innovative traits defining future success. It outlines how to leverage new genetic indexes for feed efficiency and heat tolerance, offering a forward-thinking approach to building a herd that thrives in tomorrow’s environment.

The Sunday Read Dairy Professionals Don’t Skip.

Every week, thousands of producers, breeders, and industry insiders open Bullvine Weekly for genetics insights, market shifts, and profit strategies they won’t find anywhere else. One email. Five minutes. Smarter decisions all week.

NewsSubscribe
First
Last
Consent

The A2 Advantage: A Producer’s Guide to Premiums, Genetics, and the Carbon Connection

Everyone says A2’s just hype. Tell that to farmers banking 100% premiums on milk yield.

EXECUTIVE SUMMARY: Look, I’ve been watching this A2 thing for years, and here’s what changed my mind – the premium isn’t going anywhere, and the science finally backs it up. We’re talking 50-100% premiums that are holding steady even with everything else falling apart in commodity markets. China’s A2 segment jumped 14% just in the first half of 2025, now claiming 20% of their infant formula market value… that’s real structural demand, not some health fad.The kicker? Most Holstein herds are already testing 50-60% A2 genetics – you might be sitting on premium milk and selling it commodity. At $25-40 per head for genomic testing, you’re looking at potentially discovering a revenue stream that California producers are already riding to $8-9 per gallon. With USDA operating loans at 5.000% and consumer premiums this strong, this isn’t about chasing trends anymore – it’s about capturing value that’s already there.

KEY TAKEAWAYS

  • Test your genetics first – Most Holstein herds hit 50-60% A2 genetics naturally; at $25-40/head testing costs versus 50-100% milk premiums, your ROI calculation is simple math that works in today’s tight margin environment.
  • Start with segregation strategy – Wisconsin’s MilkHaus Dairy is processing just 100 of their 360 cows separately for A2 cheese production, proving you don’t need full herd conversion to tap premium markets in 2025.
  • Stack the sustainability angle – Traditional A2 breeds like Jerseys show better feed efficiency, positioning farms for both A2 premiums and emerging carbon credit programs as USDA pilots recognize breed efficiency metrics.
  • Build direct-to-consumer channels – Vermont Jersey operations are pulling premium pricing on A2 raw milk and aged cheeses to Boston markets, while California organic A2 hits $8-9/gallon – direct sales bypass commodity pricing entirely.
  • Time your conversion with financing – At current 5.000% USDA operating rates, conversion financing is more accessible than it’s been in years, but processing capacity for segregated A2 milk is tightening across regions.
 A2 milk, genomic testing, dairy profitability, premium milk markets, dairy breeding strategy

You know what caught my attention at the last World Dairy Expo? Three different producers – completely unrelated, from Wisconsin to New Zealand – all mentioned they’re testing their herds for A2 genetics. That’s when you know something has shifted from a trend to a serious business opportunity.

If there’s one topic dominating dairy discussions lately, it’s A2 milk. What started as a niche health trend has evolved into something that’s genuinely transforming our perspective on premium positioning. With conventional milk struggling in commodity markets and consumers willing to pay 50-100% premiums for A2 products, this is no longer just marketing hype.

A2 milk is projected to become a $7.62 billion global market by 2034. That’s not wishful thinking from market researchers – that’s real money flowing through real supply chains, and it’s becoming clear that dismissing this as just another fad would be a serious mistake.

Your A2 Quick Reference Guide

Market Reality Check: Global A2 market projected to exceed $7.6B by 2034, with consumer premiums holding steady at 50-100% over conventional milk

Science Getting Clearer: While cognitive claims remain weak, peer-reviewed studies now confirm digestive benefits linked to gut microbiota changes

Strategy is Everything: Success depends on genetic testing, long-term breeding strategy, and – this is crucial – securing access to segregated processing

Start Local First: Evaluate your regional processors and direct-to-consumer opportunities before making major investments

The Numbers That Actually Matter

What strikes me about these market projections is how they’re playing out in real time. China’s A2 market tells the story perfectly:

China’s A2 protein segment grew 14% in just the first half of 2025 and now accounts for 20% of their total infant formula market value. When discussing a competitive market, capturing one-fifth of the total value isn’t just a matter of consumer preference – that’s structural demand.

The premium positioning is holding too. Even with all the economic uncertainty we’ve been dealing with, consumers are still paying premiums of 50-100% over conventional milk. That’s exactly the kind of value-added positioning we’ve been discussing as needed in this industry for years.

Here’s what’s fascinating, though – many A2 buyers don’t even have digestive issues with regular milk. They’re paying more because they believe it’s better milk. This represents exactly the kind of premium positioning that can actually stick.

What’s Actually Happening in Science

The biochemistry behind A2 milk is legitimate, even if some of the health claims can be somewhat exaggerated. When you’re dealing with conventional milk – the A1 beta-casein variety that most of our Holsteins produce – digestion releases this peptide called beta-casomorphin-7 (BCM-7).

Here’s where it gets interesting: research shows this peptide can actually cross the blood-brain barrier and interact with opioid receptors in our central nervous system. While this biochemical interaction is confirmed, it’s crucial to note that large-scale human studies haven’t substantiated the marketing claims linking it to conditions like autism or cognitive decline.

That’s not small stuff when you think about it. We’re talking about a food component that can literally reach the brain.

Now, before anyone gets carried away, most of the cognitive claims you see splashed across A2 marketing materials are still pretty thin on human clinical trials. But the digestive benefits? Those are starting to look solid.

What strikes me about recent work published in PLOS ONE is how concrete the results were. Two weeks of A2 milk consumption led to significant changes in gut microbiota – we’re talking about increases in beneficial bacteria like Bifidobacterium longum and Blautia wexlerae. These aren’t just random microbes; they’re directly linked to better nutrient processing and reduced gut inflammation.

Participants who typically experienced digestive discomfort with regular milk showed notable improvements with A2 milk consumption. From a market positioning standpoint, this is compelling stuff – actual functional benefits you can point to.

The Genetic Reality Check

Here’s where breed choice really matters in this whole A2 conversation. Most producers I talk to are surprised when they learn where their herds actually stand genetically.

According to recent work from Dr. John Lucey at the University of Wisconsin’s Center for Dairy Research, “Most U.S. Holsteins produce a mixture of the two, often a 50-50 or 60-40 split, depending on where the genetic lines came from. Guernsey, Jersey, and Brown Swiss tend to produce mostly A2.”

That breed difference alone changes your whole timeline and strategy. If you’re running Holsteins, you’re starting from a different place than someone with a Jersey herd. It’s not just about the genetics – it’s about understanding what you’re working with.

The testing itself costs around $25-40 per animal to determine your current status. That’s not nothing when you’re talking about a 300-cow herd, but it’s the kind of investment that makes sense when you’re looking at those premium opportunities.

What’s particularly noteworthy is how this plays out across different regions. In the Upper Midwest, I’m seeing Holstein herds that test surprisingly high for A2 genetics – sometimes 60-70% – likely due to specific breeding lines that came through certain AI companies. Meanwhile, down in the Southeast, some Jersey herds are testing lower than expected, which suggests there’s more A1 genetics circulating in those bloodlines than people realize.

The Next Frontier: Connecting A2 to Carbon and Policy

Here’s something that’s flying under the radar but shouldn’t be – the intersection of A2 genetics and sustainability is creating a potential triple-win scenario that smart producers are already positioning for.

Traditional A2 breeds, such as Jerseys and Guernseys, often have better feed conversion rates, which translates to lower methane production per pound of milk. With carbon pricing becoming a reality through programs like California’s LCFS expansion and the EU’s Green Deal, which is pushing sustainability metrics, a double premium opportunity may be emerging.

The new USDA carbon credit pilot programs are starting to recognize these breed efficiencies. Operations that can document both A2 genetics and improved feed efficiency might qualify for additional incentives by 2026. Initial word from extension specialists suggests that farms documenting both A2 genetics and carbon efficiency could receive stacked premiums.

I’ve been hearing from processors in the Northeast who are starting to ask about both A2 genetics and carbon footprint data. That’s a trend that’s expected to accelerate, especially as more retailers make sustainability commitments. With the EU’s Green Deal pushing sustainability metrics and New Zealand implementing their emissions pricing scheme, there’s a real question about positioning A2 milk within these new frameworks.

The methane credit angle is particularly interesting. Some of the same breeds that naturally produce more A2 milk also tend to be more efficient feed converters, lower methane per pound of milk. As carbon pricing becomes more of a reality (and it’s coming, whether we like it or not), we’re looking at a potential convergence where A2 genetics, carbon efficiency, and premium positioning all align.

The Conversion Challenge – What It Actually Takes

Converting to A2 production is a significant operational commitment, not as simple as flipping a switch. Here’s what you’re really looking at:

Investment Reality: The real cost is time and a multi-generational breeding strategy. From industry observations, you’re looking at several generations to achieve high A2A2 frequencies – the exact timeline depends heavily on your starting genetics and breed composition.

Processing Bottleneck: Access to segregated processing facilities is, in fact, the biggest challenge. I’ve talked to producers with beautiful A2 herds who ended up stuck selling into commodity markets because they couldn’t secure premium outlets.

Financing Actually Looks Good: Current USDA Farm Service Agency operating loans are running at 5.000% as of July 2025, which makes conversion financing accessible for qualified operations. That’s more reasonable than the higher rates we saw a couple of years back.

Here’s the thing, though – and this is where I see producers getting tripped up – you can’t just think about the genetics. The infrastructure piece is massive. You need separate tanks, separate trucks, and separate processing lines… or, at the very least, processing partners who can handle the segregation requirements.

Real Operations Making It Work

What’s working? Direct-to-consumer operations are absolutely crushing it. Let me tell you about operations that are getting it right across different regions:

MilkHaus Dairy in Fennimore, Wisconsin, is testing about 100 of their 360-head Holstein herd for A2 genetics. They’re housing those A2 cows separately, keeping the milk completely segregated, and processing it into cheese at local plants. Now they’re selling 12 different cheese flavors nationwide through their online store. The genius part? They’re not trying to convert their whole herd – they’re just maximizing the value of what they’ve got.

Two Guernsey Girls Creamery in Freedom, Wisconsin, took a different approach. They broke ground on a small bottling and cheese-making facility in late 2020, opened it in summer 2021, and now process all their milk on-site. Pasteurized white milk, chocolate milk, cheese curds – all A2, all local, all profitable. What started as a 4-H project has grown into a thriving farmstead operation.

But it’s not just Wisconsin. In California, I’ve been hearing from producers in the Central Valley who are pairing A2 genetics with organic certification – apparently, this combination is hitting a sweet spot with Bay Area consumers, who are willing to pay serious premiums. “We’re seeing $8-9 per gallon for A2 organic,” one Fresno County producer told me last month. “That’s game-changing money.”

Meanwhile, in Vermont, there’s a Jersey operation that has gone full A2 and direct-to-consumer. They’re selling A2 raw milk permits and A2 aged cheeses to the Boston market – completely different approach than what we’re seeing in the Midwest, but it’s working for their customer base.

The key here – and this is what I keep telling producers – is understanding that success often depends more on market positioning and consumer education than just having the genetics. These operations work directly with consumers, educating them about the differences and building brand loyalty.

Regional Patterns That Are Actually Emerging

The A2 opportunity isn’t uniform across regions, and that’s something you really need to factor into your planning. What works in Wisconsin might not work in California, and what sells in Australia definitely won’t automatically work in Iowa.

Here’s what I’m seeing in different regions: Upper Midwest operations with established local markets are doing well with direct sales. The cheese culture up there really helps – consumers understand premium dairy products. West Coast producers are finding success pairing A2 with organic certification to tap into that California wellness market.

However, what’s interesting is that I’m hearing from Northeast producers who are struggling with the infrastructure piece more than expected. Processing capacity for segregated A2 milk is tighter than anticipated, especially in Vermont and New York. One producer in the Hudson Valley told me they’re trucking A2 milk three hours to find a processor who can handle the segregation requirements.

Southeast operations? They’re dealing with entirely different challenges. The consumer demand is there, but the genetic starting point is often lower than expected. Heat stress is also affecting A2 conversion timelines in ways that Northern operations don’t have to consider.

What’s fascinating is how weather patterns are also affecting this. The drought conditions we’ve been seeing in parts of the West are actually pushing some producers toward A2 conversion because they’re already having to make genetic decisions about their herds – might as well optimize for premiums while you’re at it.

What This Means for Your Operation

The cognitive benefits everyone’s talking about? The science isn’t there yet. However, the market opportunity is real, and consumer willingness to pay premiums remains strong, even amid the ongoing economic challenges.

If you’re considering A2 conversion, start with genetic testing to understand your baseline. Don’t rush into wholesale changes – gradual conversion through selective breeding spreads your investment while you build market relationships. The sweet spot seems to be operations over 200 cows, where you can absorb conversion costs across larger production volumes.

Here’s what I’d recommend: evaluate your local market access first. Do you have processing facilities that can maintain A2 segregation? Are there premium retailers interested in carrying your product? Can you build direct-to-consumer channels?

But honestly? The most important thing is to be realistic about timelines. This isn’t a quick pivot. If you’re serious about A2, you’re looking at a long-term strategy – breeding decisions today based on where you think the market will be in 2030.

And here’s something else to consider… the regulatory landscape is shifting. With sustainability requirements tightening and carbon accounting becoming more standard, A2 genetics might end up being just one piece of a broader premium positioning strategy. The producers who are thinking ahead are already connecting A2 to metrics for feed efficiency, methane reduction, and soil health.

The Bottom Line

The combination of documented gut health benefits, resilient premium pricing, and developing infrastructure creates a compelling and tangible opportunity. What’s particularly exciting is how this aligns with the broader sustainability conversation. We’re potentially looking at a convergence where A2 genetics, carbon efficiency, and premium positioning all intersect.

This isn’t about jumping on the latest trend – it’s about positioning your operation for long-term success in an evolving premium dairy market. The question isn’t whether A2 milk will succeed – it’s whether you’re positioned to capture your share of this expanding opportunity.

The producers who are succeeding aren’t just chasing the A2 premium – they’re building integrated strategies that position them for whatever comes next. That’s the real lesson here.

Complete references and supporting documentation are available upon request by contacting the editorial team at editor@thebullvine.com.

Learn More:

The Sunday Read Dairy Professionals Don’t Skip.

Every week, thousands of producers, breeders, and industry insiders open Bullvine Weekly for genetics insights, market shifts, and profit strategies they won’t find anywhere else. One email. Five minutes. Smarter decisions all week.

NewsSubscribe
First
Last
Consent
Send this to a friend