










Minnesota just cleared a single site near Morris to nearly double its herd without an environmental impact statement — and the costs could first fall on independents you’d never associate with that decision.
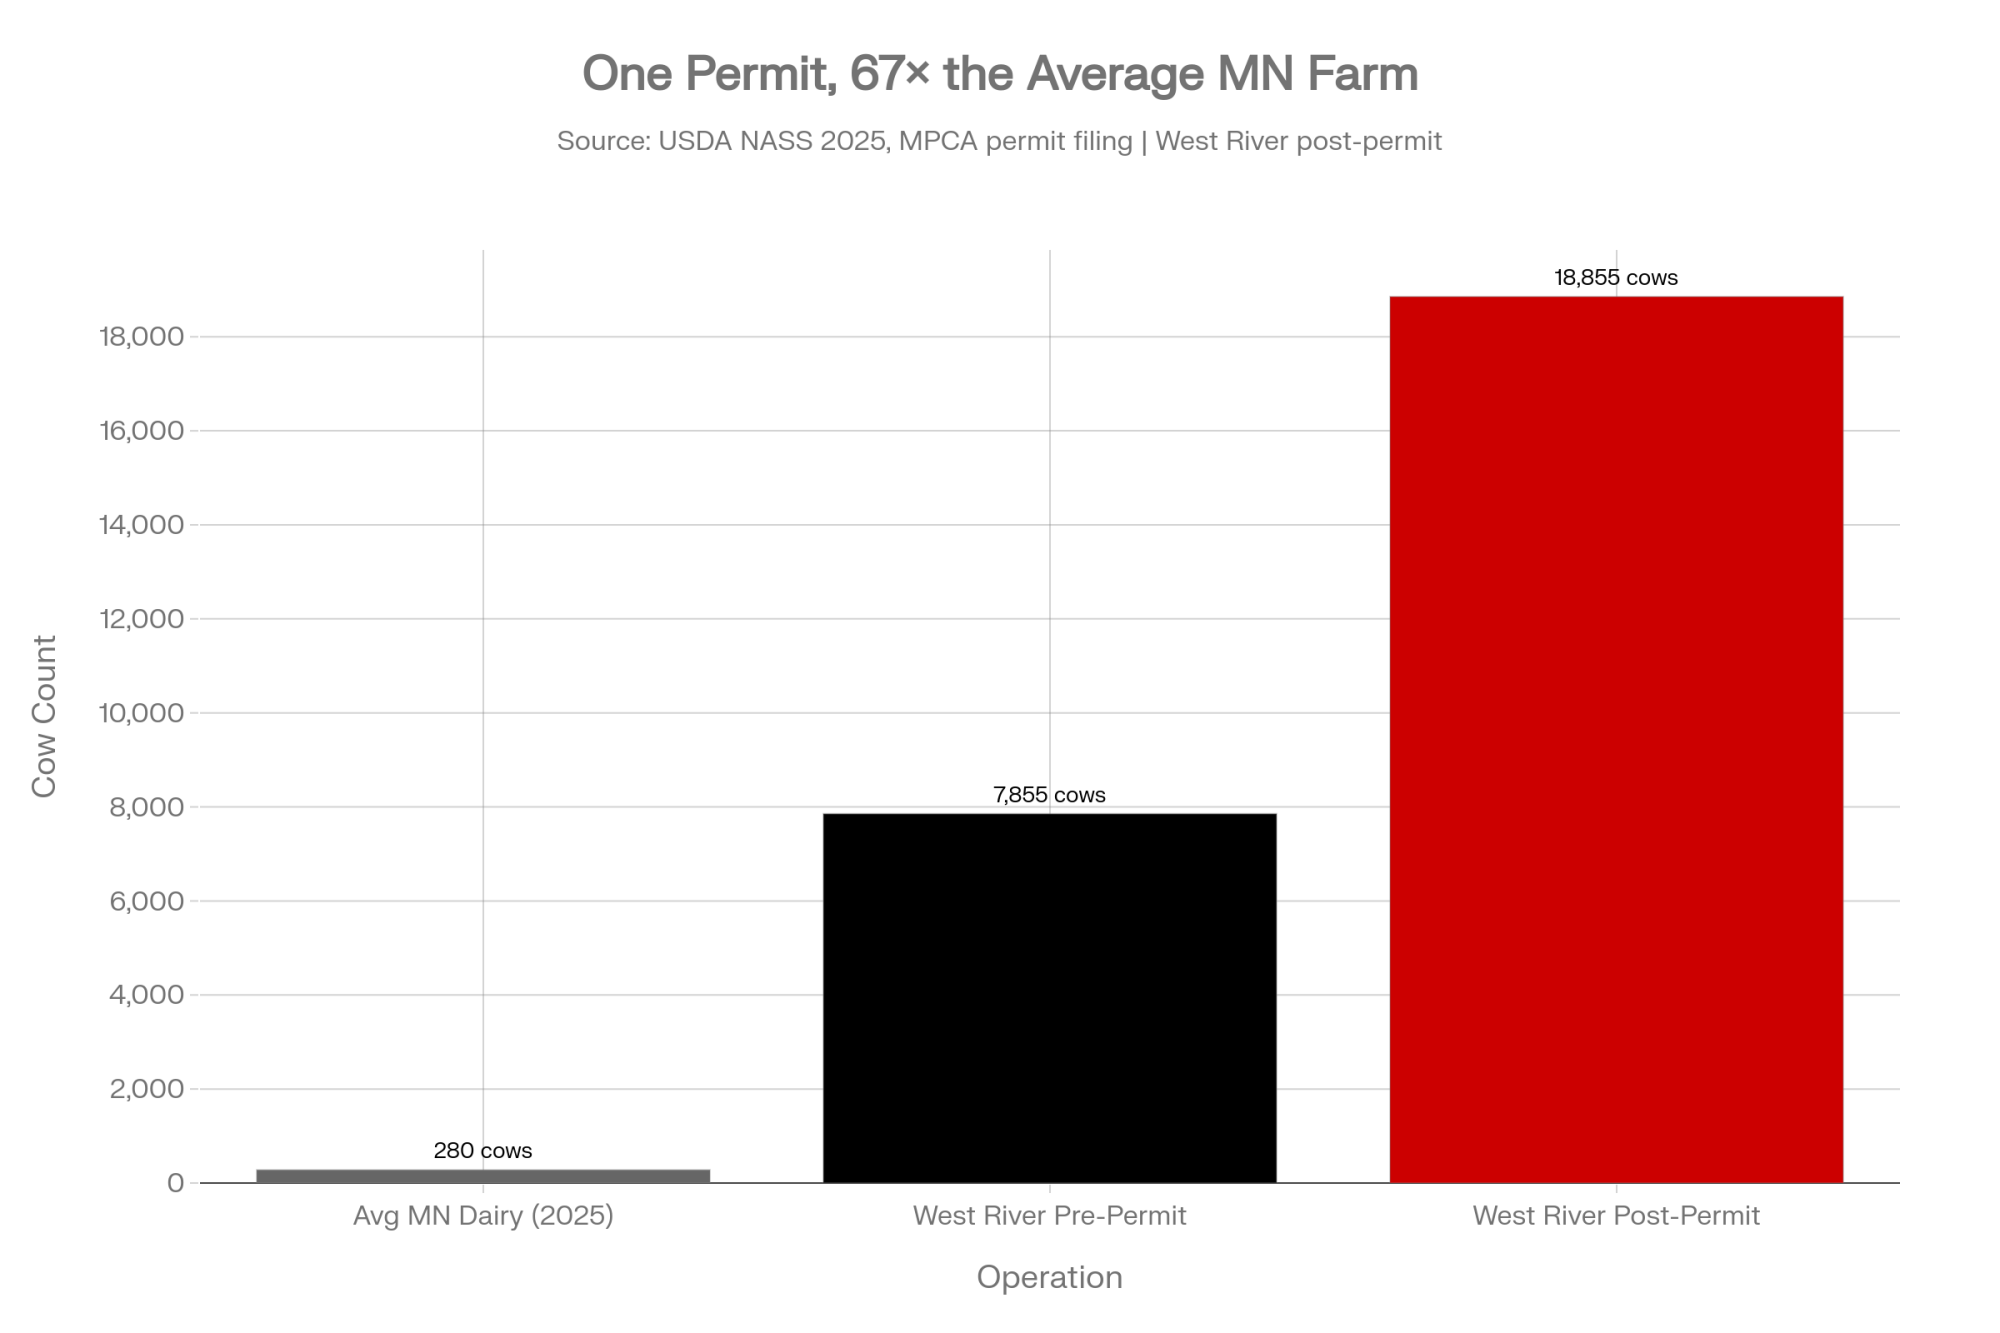
Executive Summary: Minnesota just cleared Riverview LLP’s West River Dairy near Morris to increase from 7,855 cows to 18,855 — without a full environmental impact statement. That single site would become the state’s largest feedlot, and Riverview already runs 16 Minnesota feedlots holding more than 135,000 cows, roughly a third of the state herd. The risk doesn’t stop at the property line: The Bullvine’s modeling puts a $0.40–$0.60/cwt basis drag on nearby independents as plants go long on milk, which on a 200-cow herd shipping ~46,000 cwt a year is $18,400 to $27,600 off the bottom line — before hauling, which on FO30 climbed about 30% in twelve months. Water’s the other pressure point: Riverview’s seeking up to 226 million gallons a year, near 75% of Morris’s municipal draw, and Arizona’s Willcox basin shows where reactive rules lead — a decade of falling water tables before a January 2026 settlement forced 2,000 fallowed acres and $11M in relief. If you’re a 300- to 800-cow operation shipping to the same plants or renting from the same landlords, this is your early-warning story, not a distant one. The piece lays out three honest paths — stay disciplined, scale into commodity volume, or pivot — plus a 30-day move: read your next base-program letter like a loan document and ask your fieldman what share of plant intake is already committed to its biggest suppliers. Read the full article if you want the barn math mapped to your own herd size, along with the leading indicators to watch before the squeeze reaches your milk check.
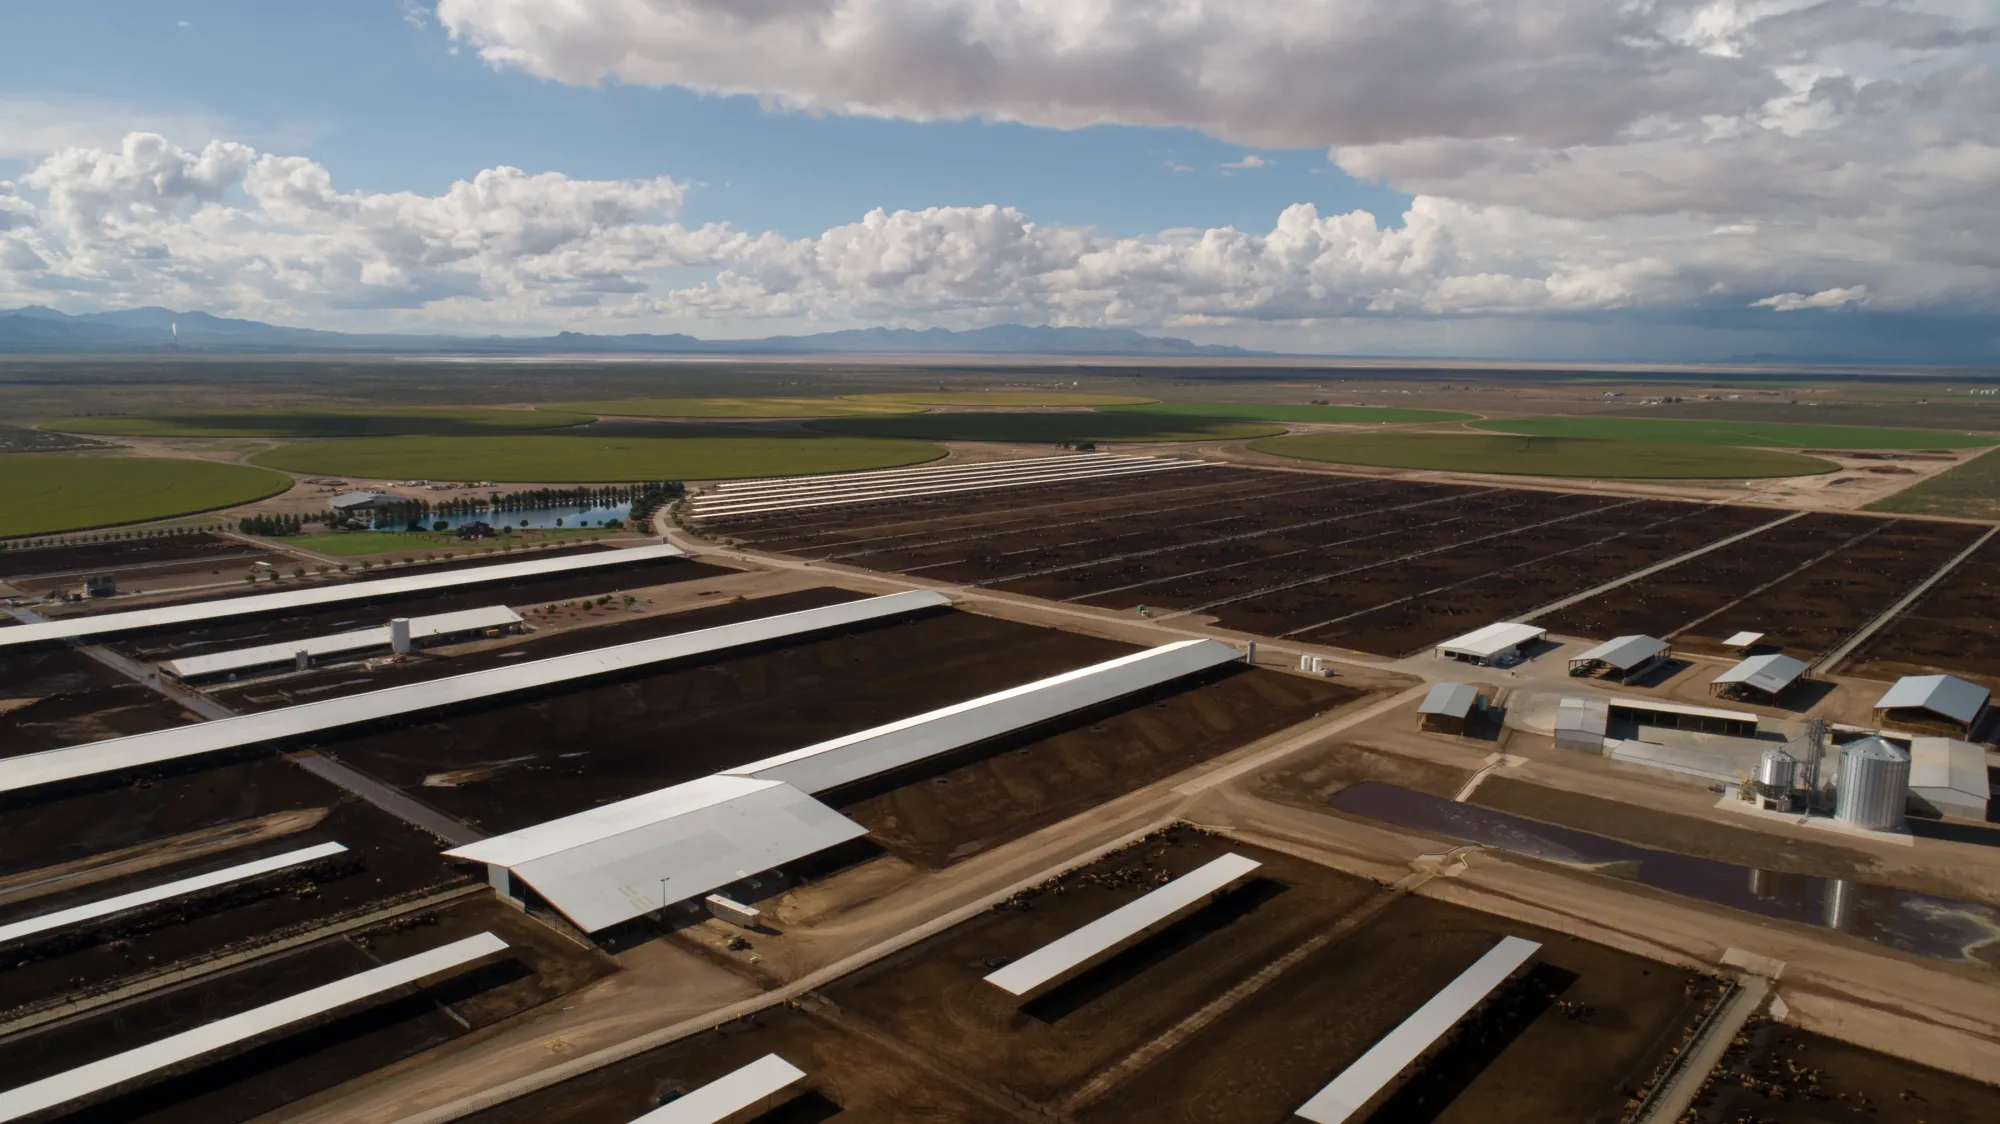
The week of June 22, 2026, the Minnesota Pollution Control Agency told Riverview LLP it could expand its West River Dairy near Morris from 7,855 cows to 18,855 — without a full environmental impact statement. If you milk 200 cows in Stevens County, that decision didn’t make your phone ring. But the kind of pressure that follows a build this size tends to show up on your milk check, your hauling bill, and your land lease — and our modeling suggests it will, long before anyone in St. Paul connects those dots back to one barn outside Morris.
Here’s the part worth sitting with. MPCA’s job, by law, is to police manure, water, and runoff — not your milk price, and not whether a family-scale dairy can survive next door to a site running 26,397 animal units. So the question isn’t whether the agency did its job. It’s what happens to everyone the system was never built to count.
What’s Changing and Why
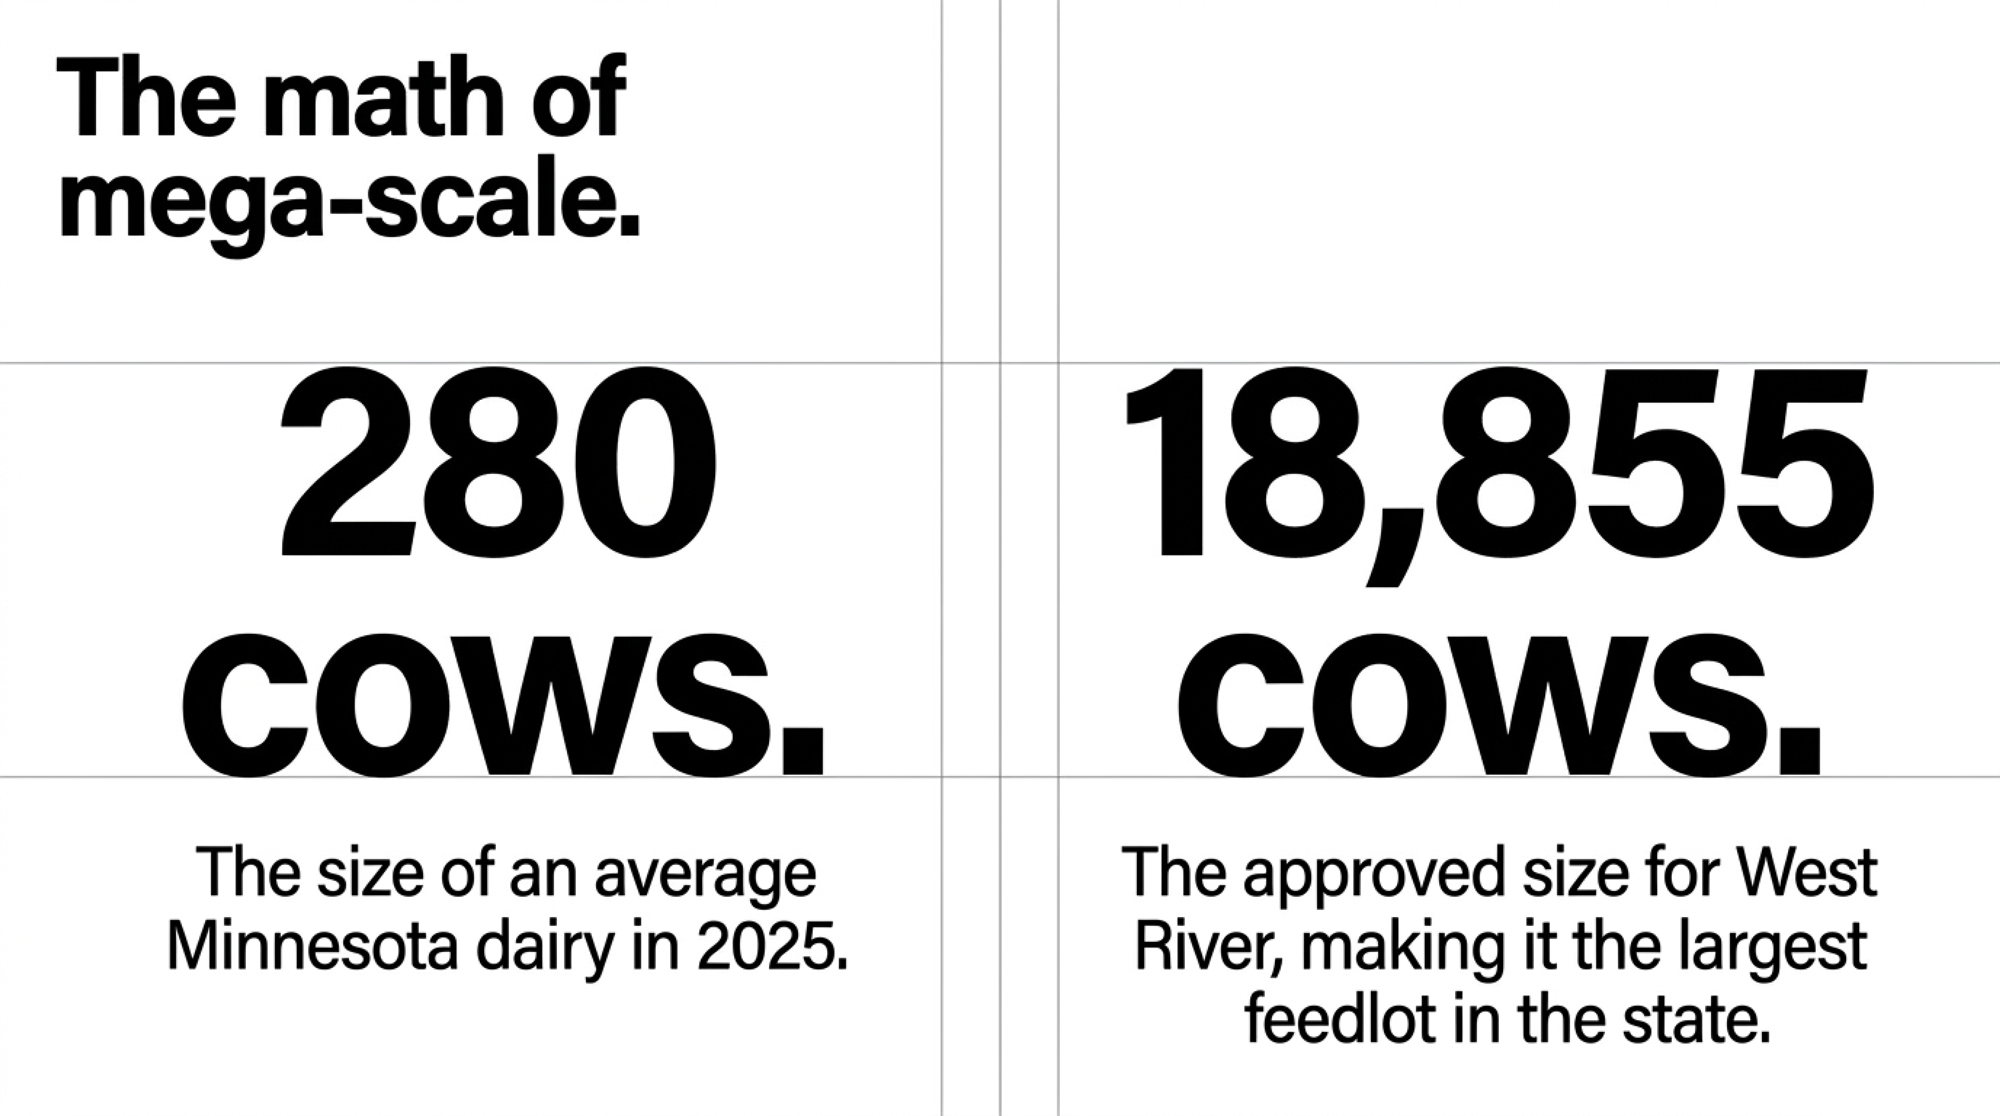
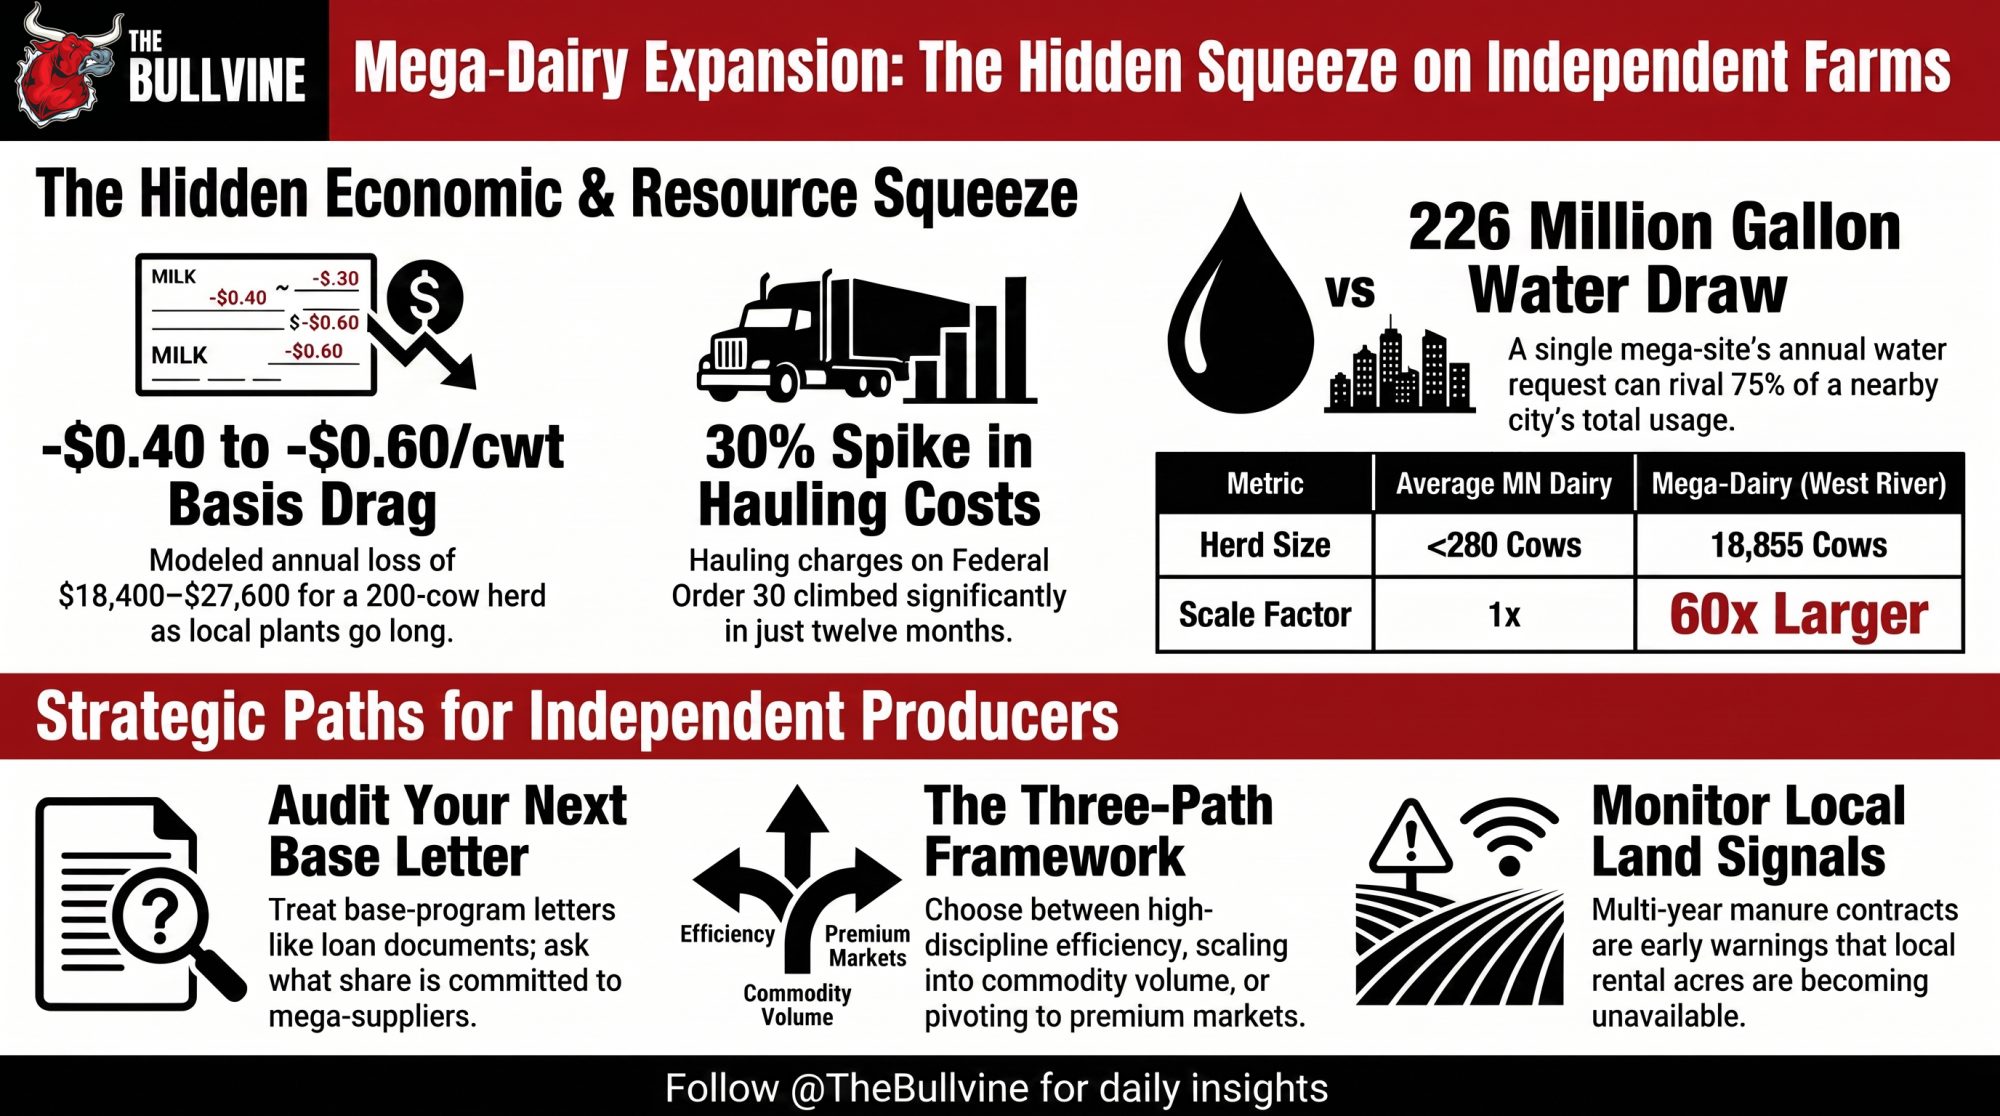
Riverview isn’t just another big dairy. According to state feedlot records cited by the Star Tribune in March 2026, the company owns 16 permitted dairy feedlots across Minnesota housing more than 135,000 cows — about a third of the state’s entire dairy herd. For scale, USDA’s NASS pegged Minnesota at 440,000 milk cows entering 2025, down 10,000 head in a single year. West River’s jump to 18,855 cows would make it the largest single feedlot in the state — more than 60 times the size of the average Minnesota dairy, which ran fewer than 280 cows in 2025.
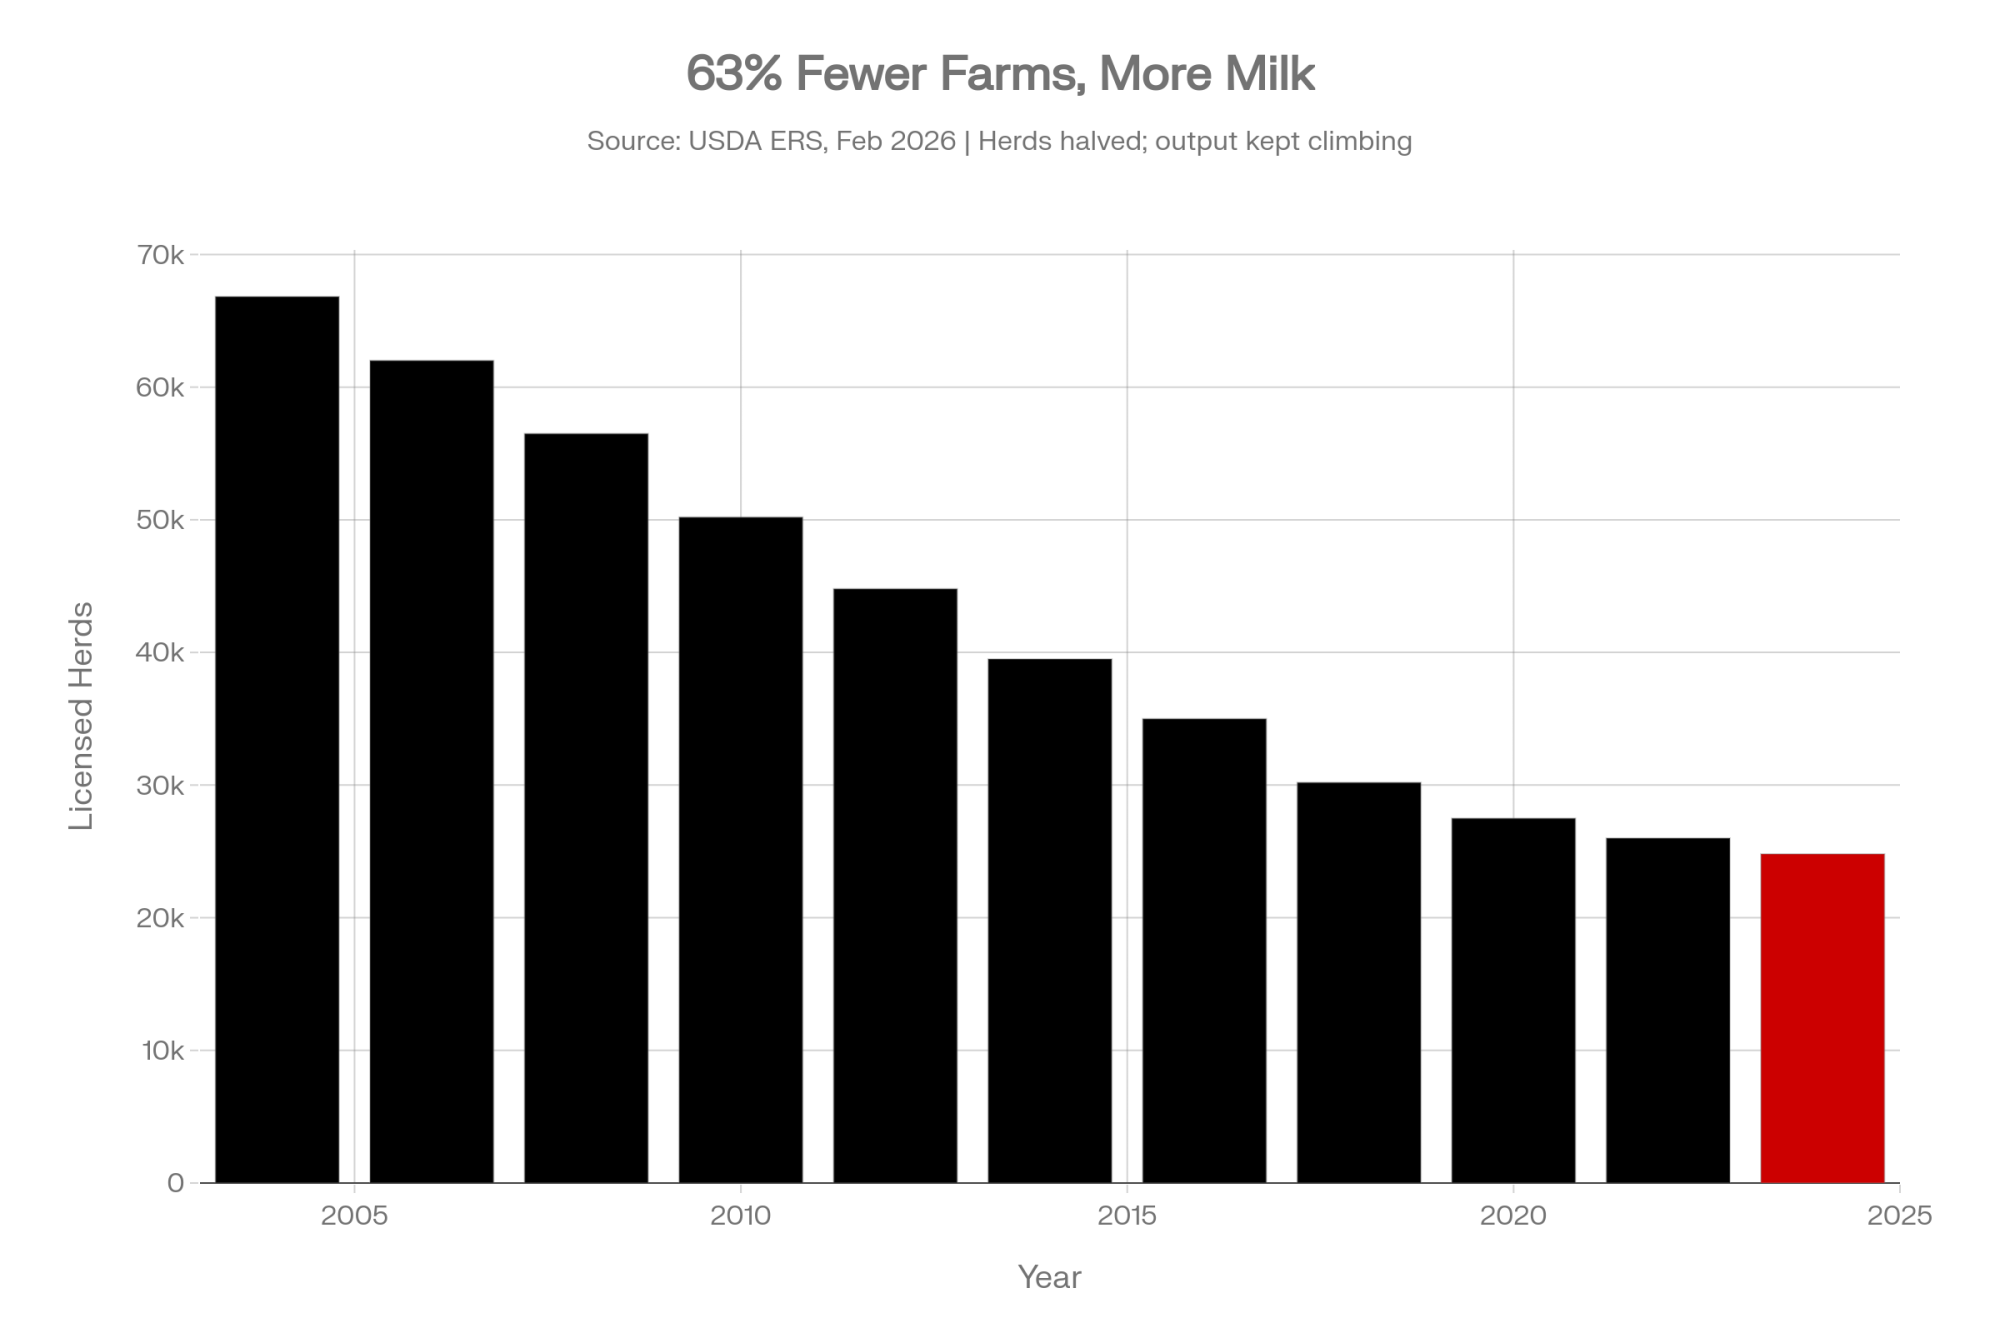
The national backdrop makes this less of an anomaly than a pattern. USDA’s Economic Research Service reported in February 2026 that licensed U.S. dairy herds fell 63% — from 66,825 in 2004 to 24,811 in 2024 — even as total milk output kept climbing. Fewer farms, more milk. That math only works if the remaining volume keeps concentrating into bigger operations.
The farms most exposed here aren’t the 2,000-cow operations that can match a mega-site on efficiency. By the structural data, it’s the mid-size tier — roughly the 300-to-800-cow herds The Bullvine’s survival-crisis reporting calls the danger zone, plus the smaller independents still shipping into the same plants and renting from the same landlords as a neighbor adding 11,000 cows in one move.
The argument isn’t one-sided. In a May 28, 2026 Star Tribune column, longtime Minnesota dairy voices framed Riverview’s scale as the next chapter of a transformation that started decades ago — noting, as the column put it, that the state has lost about 75% of its dairy farmers over the past two decades, long before this permit. On the other side, Sean Carroll, policy director for the Land Stewardship Project, has tracked CAFO permitting across western Minnesota for years. In LSP’s April 2026 white paper, the group estimates roughly 7,395 independent dairy farms were lost in Minnesota over 20 years, even as cow numbers held steady — a consolidation trend LSP argues is accelerated by operators like Riverview, now about a third of the state’s herd.
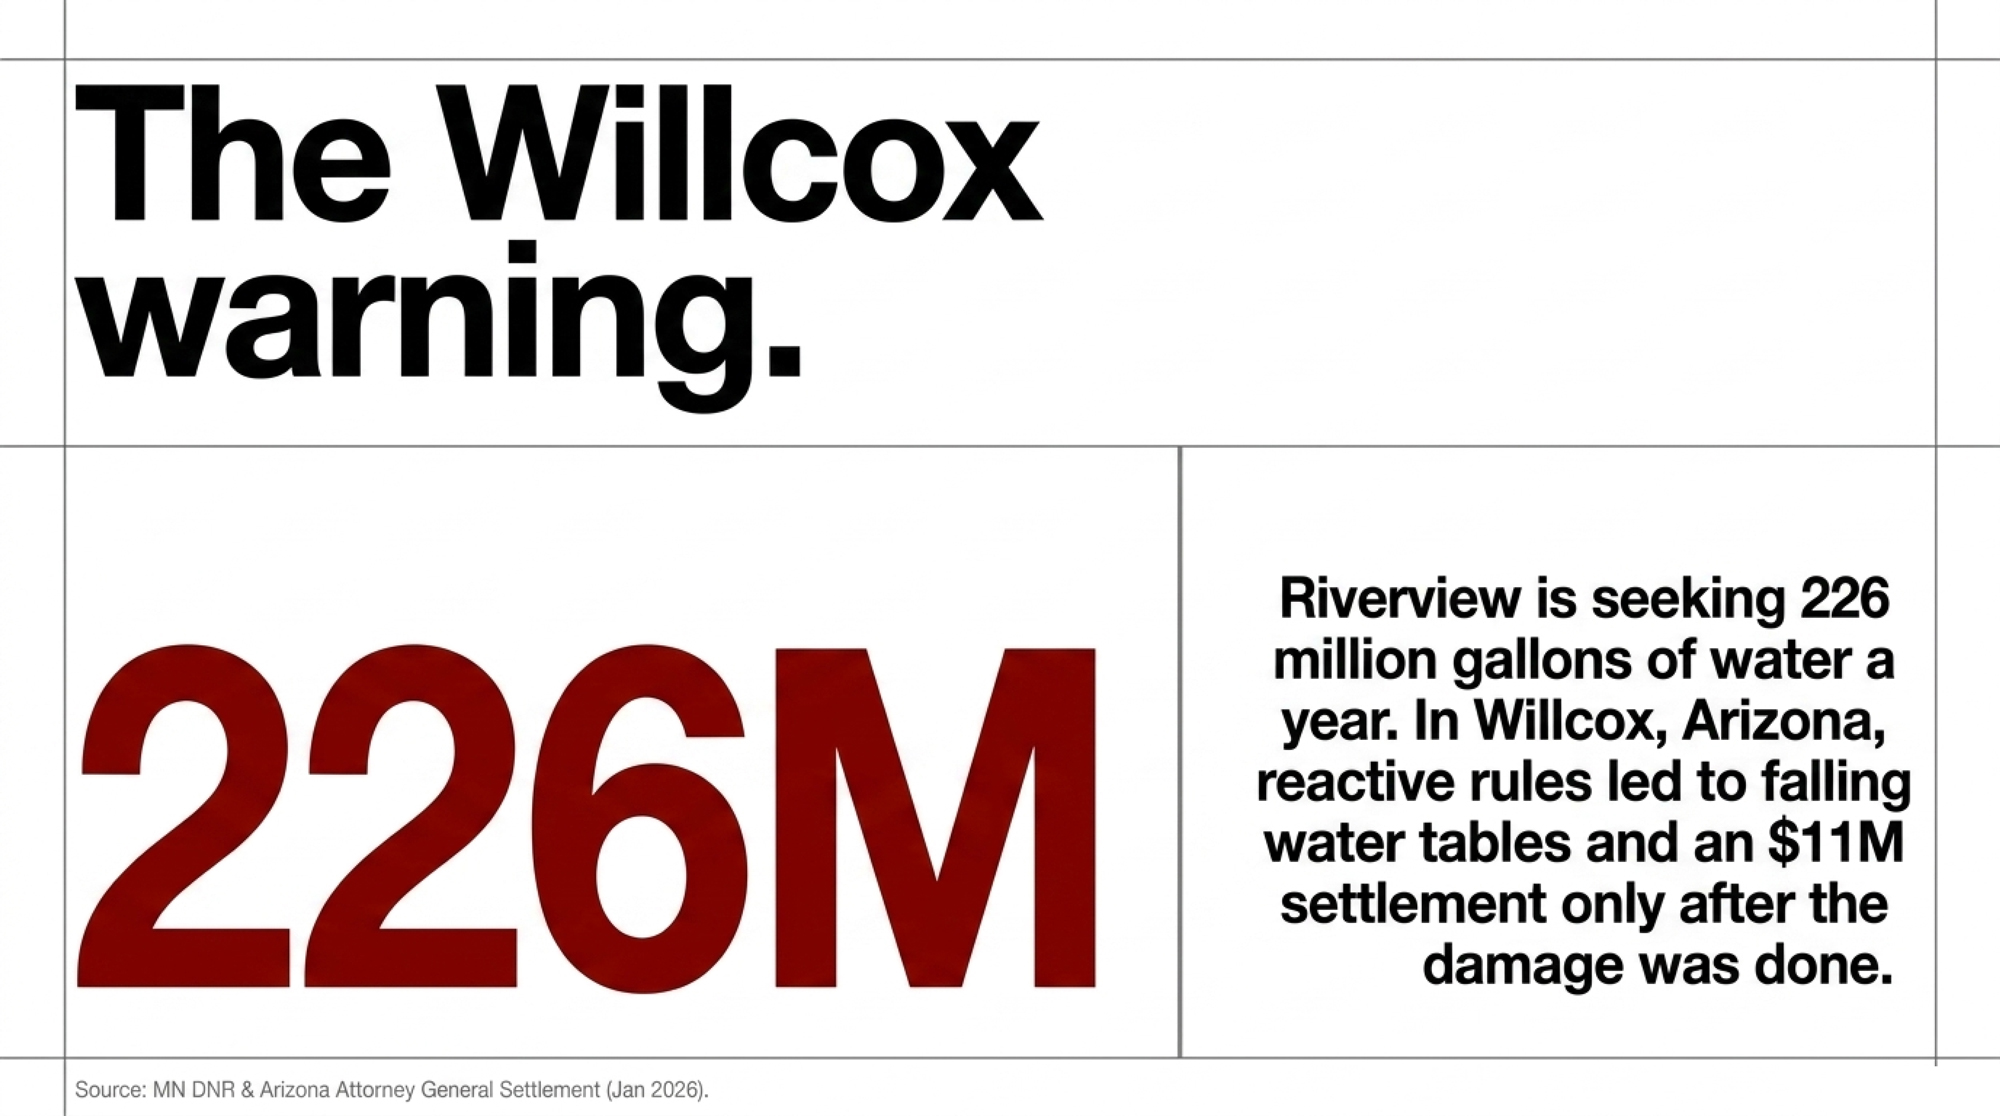
In fairness to Riverview, the company points to its own safeguards. It says it’s about 75% employee-owned, expects the project to add 40-plus permanent jobs, and has voluntarily cut the well’s permitted draw from 452 to 226 million gallons a year — running West River under an individual NPDES permit, one of Minnesota’s stricter feedlot categories.
“The MPCA’s job, by law, is to police manure, water, and runoff — not your milk price. The question isn’t whether the agency did its job. It’s what happens to everyone the system was never built to count.”
How This Plays Out on Real Farms — The Hidden Line Items
The trap doesn’t announce itself. There’s no foreclosure notice. It shows up as boring line items — a slightly worse basis, a new “market adjustment” charge, a hauling bill creeping up faster than your mailbox price, and landlords quietly signing longer deals with the big operator. By the time you spot the pattern, the structure’s already built.
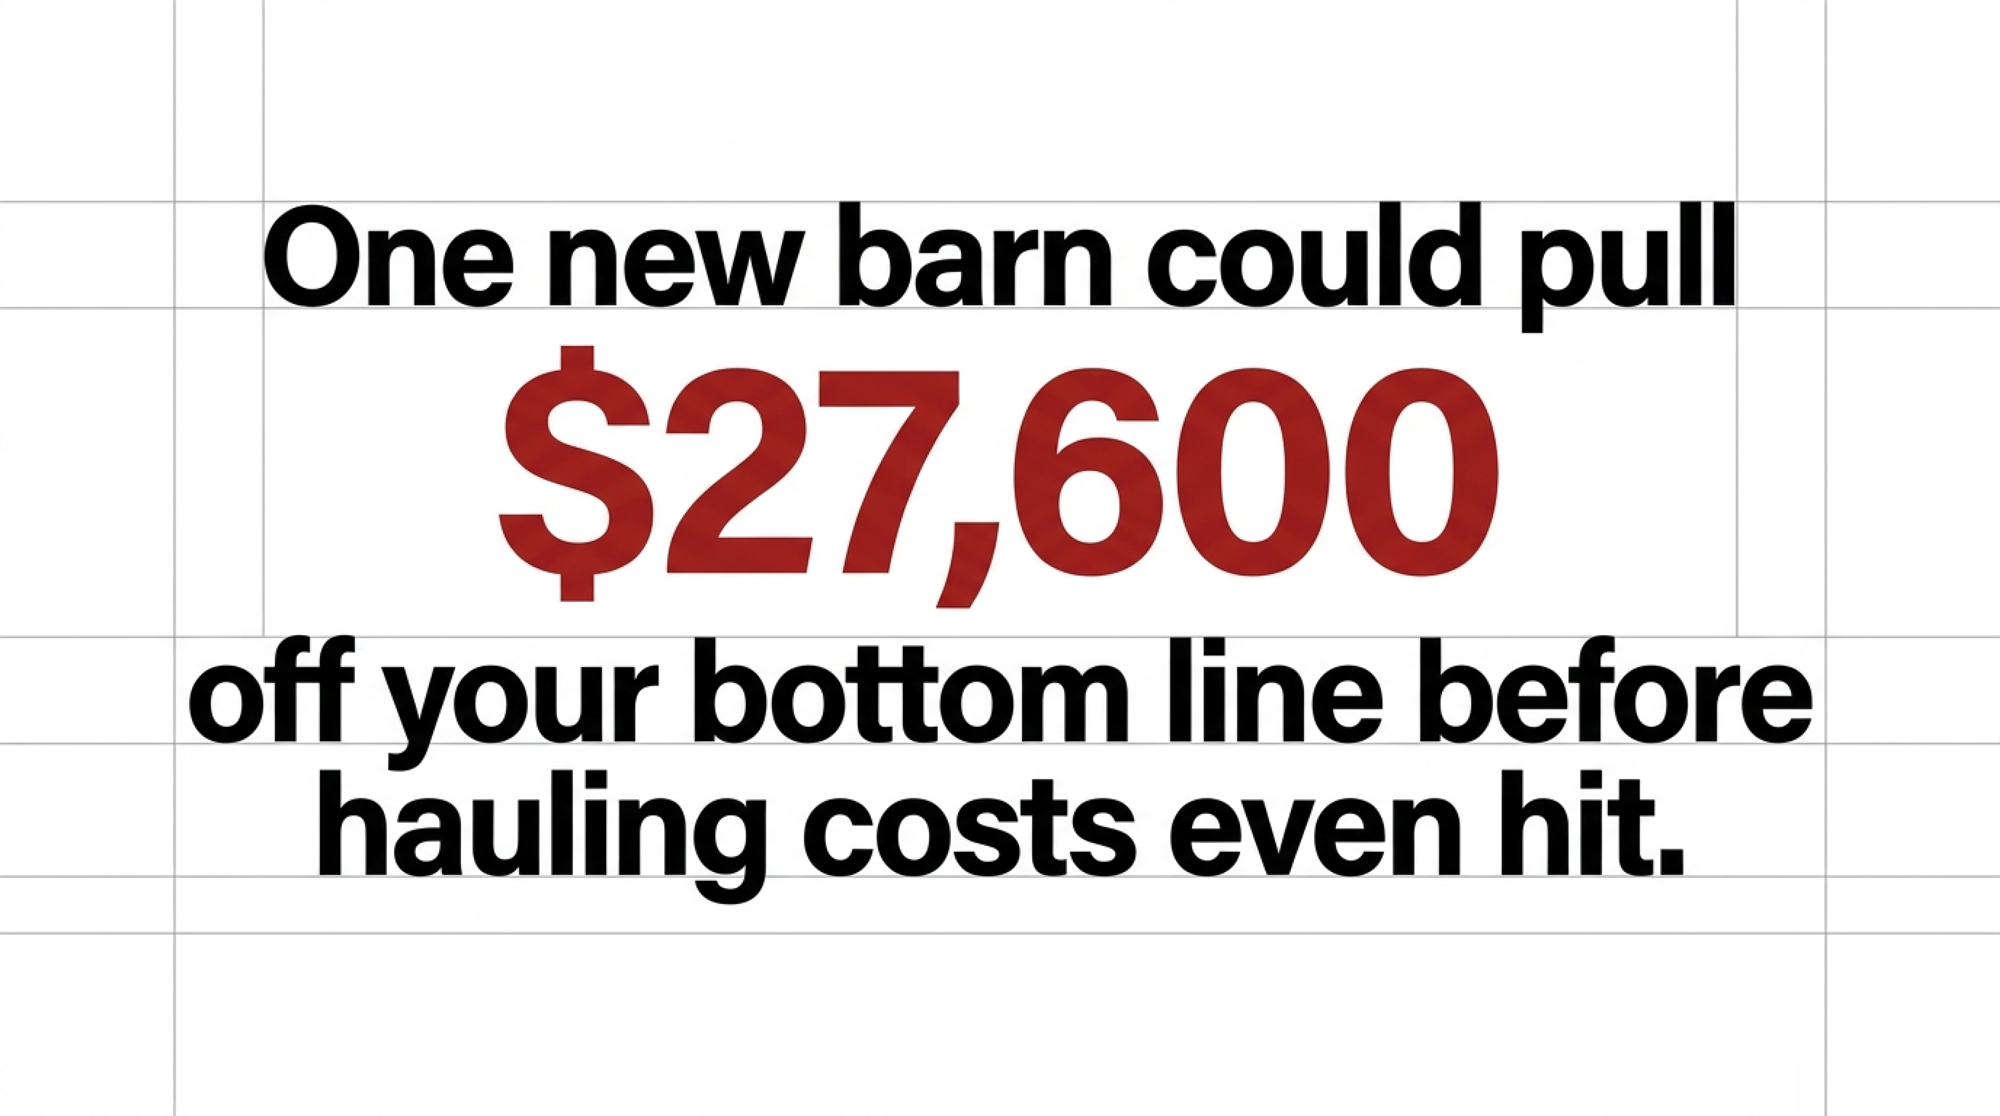
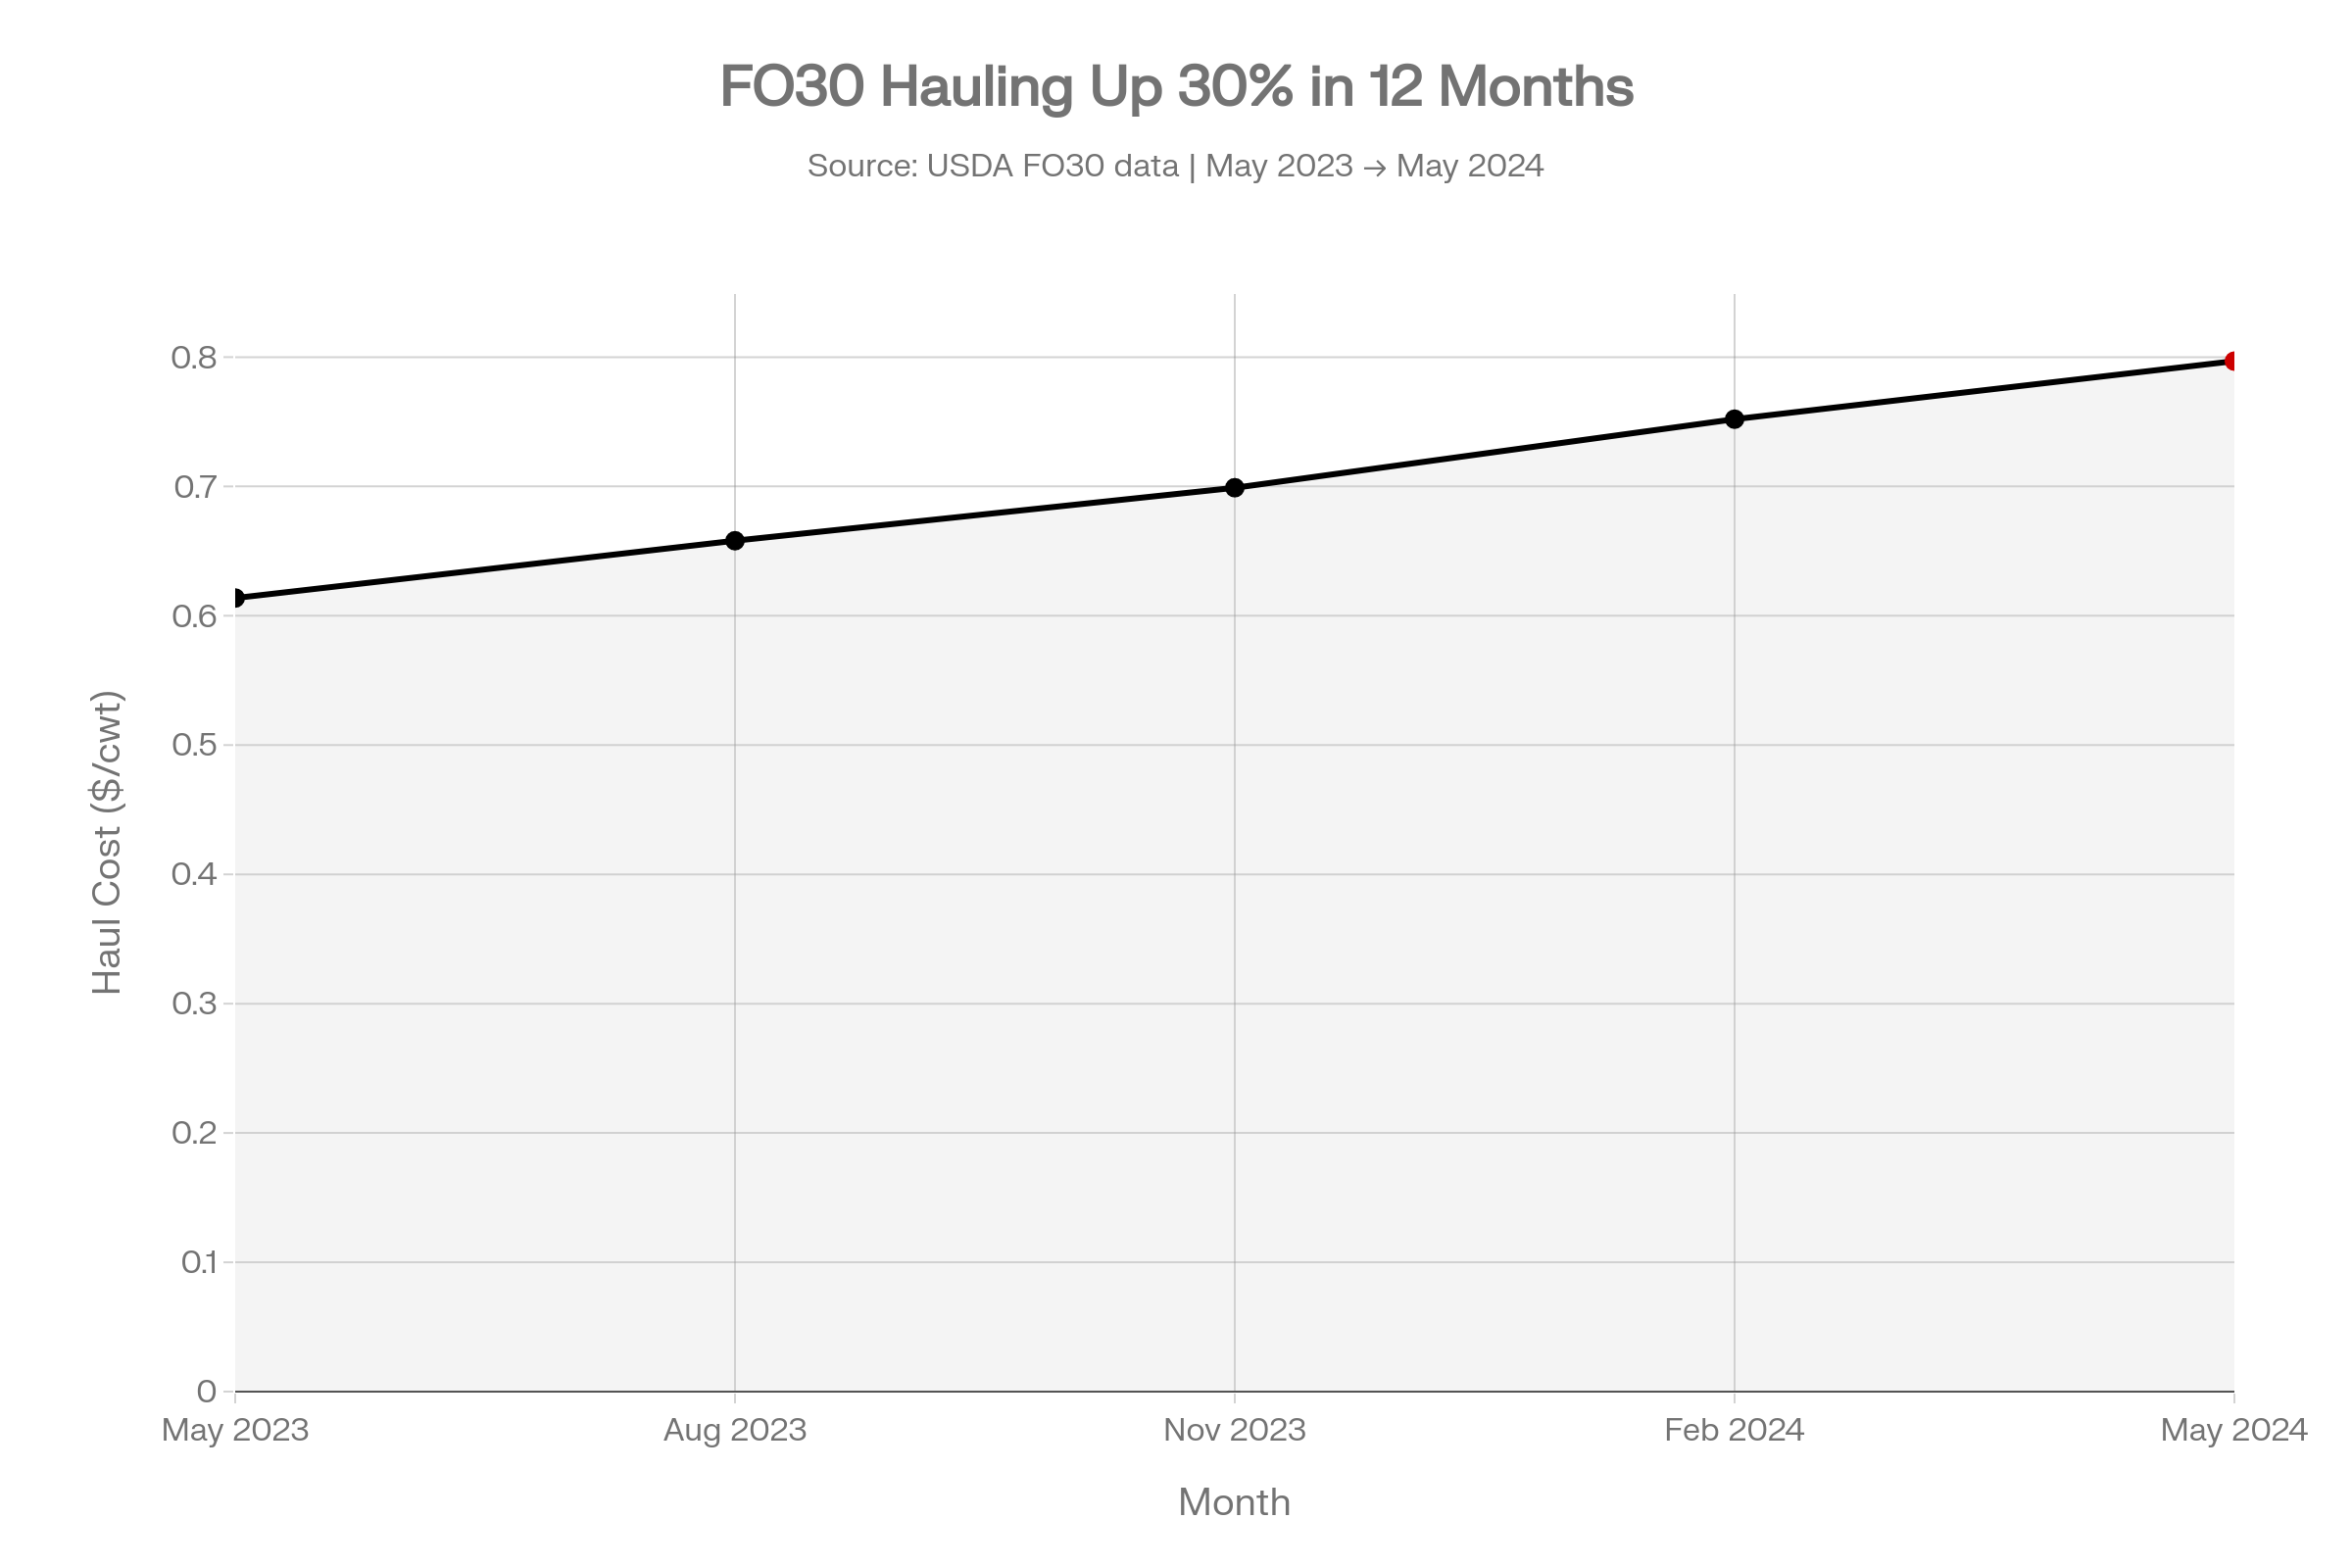
Run the barn math on just the milk-check piece. Take a 200-cow herd at a conservative 230 cwt per cow per year — a bit under the 24,390-lb (about 244 cwt) national average USDA logged for 2025 — and you’re shipping roughly 46,000 cwt annually. The Bullvine’s earlier analysis of West River modeled a realistic $0.40–$0.60/cwt drag on nearby independents as plants go long on milk and trim premiums. On those assumptions, that’s $18,400 to $27,600 off your bottom line every year — for a decision you had no vote in. And that’s before hauling. Federal Order 30 hauling charges jumped from $0.6137 to $0.7969/cwt in a single year, May 2023 to May 2024 — about a 30% climb.
Then there’s the land. Riverview’s own filing says West River will market about 10,000 acres of locally grown crops and spread manure on roughly 7,700 acres a year; LSP’s white paper puts the full manure land base near 13,200 acres. So when a landlord mentions a five-year manure contract with West River, that’s not just their security. It’s your signal that the acres you were counting on may already be spoken for.
The Mechanics Behind the Outcomes — Three Systems That Don’t Count You
Why does one barn ripple this far? Because three systems — permitting, milk pricing, and land — all treat scale as efficiency by default. None of them treats “how many independents survive” as an output worth tracking.
Start with water. Minnesota’s DNR uses flow-based triggers that cut a permit holder’s pumping only after streamflows in places like the Pomme de Terre River drop below set thresholds. That’s reactive by design — it responds to damage already underway. Riverview is seeking up to 226 million gallons of groundwater a year for West River, which The Bullvine’s own reporting puts at roughly 75% of the city of Morris’s municipal water volume.
Arizona shows where reactive rules lead. In the Willcox basin, where Riverview runs a large dairy, groundwater dropped 2–4 feet a year from 2010 to 2015, and 3–5 feet a year since. It took more than a decade of falling water tables and dry residential wells before the state moved. In January 2026, Arizona’s Attorney General announced a settlement requiring Riverview to fallow or convert 2,000 acres and fund $11 million in relief for affected residents. Riverview agreed to the terms, and the state didn’t find it broke the law. But the lesson for Minnesota is hard to miss: the fix arrived late, came through negotiation, and kept the biggest user operating under new rules. While Minnesota is far from an arid desert, the lesson is about localized aquifer depletion: when a single site draws a municipal-sized volume of water, nearby shallow residential and agricultural wells — and flow-sensitive streams like the Pomme de Terre — are the first to feel the drop, regardless of state lines.
| Dimension | Arizona — Willcox Basin (Past) | Minnesota — Morris / Pomme de Terre (Present) |
|---|---|---|
| Operator | Riverview LLP | Riverview LLP |
| Trigger event | Large-scale dairy expansion approved | West River permit: 7,855 → 18,855 cows approved June 2026 |
| Annual water draw | ~100M+ gallons/year (multiple sites) | Up to 226M gallons/year (single permit) |
| Regulatory framework | Reactive: cuts only triggered after flow/level drop | Reactive: DNR flow-based triggers on Pomme de Terre River |
| Aquifer decline rate | 2–4 ft/yr (2010–15); 3–5 ft/yr after | Unknown — Stevens County Geologic Atlas incomplete |
| Years before action | ~10+ years of declining water tables | Year 0 — permit just issued |
| Resolution | Jan 2026 settlement: 2,000 fallowed acres + $11M relief | No settlement framework yet; no EIS completed |
| Operator outcome | Continued operating under new rules; no law broken | Permit approved; individual NPDES; voluntary cut to 226M gal |
| Resident/farm impact | Dry wells, fallowed cropland, litigation | TBD — leading indicators not yet tracked publicly |
| Key lesson | Fix arrived late, through negotiation, kept big user running | Same structure, earlier in the timeline |
How Much Does Sitting Still Actually Cost You?
More than the milk check alone shows. Stack the pieces a 200-cow dairy near Morris could face — the modeled $0.40–$0.60/cwt basis drag, FO30 hauling up about 30% in a year, and the 2025 federal make-allowance change that pulled value out of pool prices nationwide — and the combined hit, on the assumptions in The Bullvine’s model, runs well into the tens of thousands of dollars annually. Here’s the cleaner way to think about it: on 46,000 cwt, every extra $1.00/cwt of total pressure is $46,000. You don’t need our model to feel that.
So don’t borrow our number — build your own. Where your figure lands depends on your plant, your hauler, and your contracts. But if you haven’t run those line items against your breakeven lately, you’re guessing at the one thing on this list you can actually measure.
What Should You Be Watching Before the Squeeze Tightens?
Three things, and they’re all leading indicators if you catch them early. First, your milk check — specifically whether “market adjustment” lines start growing faster than your base price. Second, your hauling terms — new minimum volumes, route changes, or per-cwt charges climbing while milk prices flatten. Third, the land conversations around you. When neighbors and landlords start mentioning multi-year contracts with a large operator, the open acres near you are shrinking.
The deeper signal nobody’s handing you is a basin-level picture: how much of your local water, cropland, and plant capacity is already effectively claimed. That data exists — in permit PDFs, hydrology reports, co-op filings — it’s just never on one page where a farmer can act on it. Stevens County doesn’t even have a completed County Geologic Atlas yet, which means key aquifer information isn’t available to guide these decisions in the first place.
Options and Trade-Offs for Farmers
There’s no single right answer here. It depends on your debt, your age, your land base, and what your family actually wants out of the next 20 years. But the honest framing for a 200-cow operation comes down to three paths.
| Factor | Path 1: Stay Disciplined | Path 2: Scale Into Volume | Path 3: Pivot Deliberately |
|---|---|---|---|
| Best fit for | Solid footing, low debt, secure land & water | Strong equity, proven management depth | Debt-heavy, seeking premium lane or exit |
| Core requirement | Cash cushion to absorb $0.40–$0.60/cwt drag for years | Per-cow capital + locked contracts for base, haul, land | New skills; separating identity from cow count |
| Annual pressure absorbed | $18,400–$40,200+ (basis + haul) | Same pressure, but at higher volume to dilute it | Potentially insulated via premium pricing or exit |
| Key risk / The Trap | Doing nothing, calling it “staying the course” | Racing a 19,000-cow competitor in its own lane | Underestimating skill/capital required to pivot |
| Land exposure | Medium — monitor multi-year manure contracts nearby | High — scaling needs more acres in same contested basin | Lower — reduced land dependency if pivoting off commodity |
| Water risk | Medium | High — expansion increases aquifer draw competition | Lower |
| Time horizon | 3–5 years before pressure builds | 2–3 years to lock structure or abort | 1–3 years to execute before equity erodes |
Path 1 — Stay with discipline. This is the play if your footing is solid.
- When it makes sense: your cost of production is genuinely competitive, your debt load is manageable, and your land and water position is secure — the footing The Bullvine’s survival-crisis analysis says separates viable mid-size herds from the danger zone.
- What it requires: a cash cushion deep enough to ride out a $0.40–$0.60/cwt drag and rising hauling for years without flinching.
- The trap: doing nothing while every lever moves against you, then calling it “staying the course.”
Path 2 — Scale into more commodity volume. Tempting, and sometimes right — but go in clear-eyed.
- When it makes sense: you have the equity and management depth to compete on cost per hundredweight.
- What it requires: real per-cow capital and a lot more leverage at a time when replacement heifers are historically expensive and inventories historically tight — plus iron-clad commitments on base, hauling, and land in writing.
- The trap: you’re racing a 19,000-cow neighbor in the exact lane it dominates.
Path 3 — Pivot deliberately. Maybe the smartest move isn’t more cows at all.
- When it makes sense: you can shift toward premium positioning — organic, specialty, A2 — or lean into custom work and off-farm income, or build a controlled exit you time on your terms instead of the bank’s.
- What it requires: new skills, and the harder thing — separating the family’s identity from cow numbers.
- The signal: ERS’s “fewer farms, more milk” curve says the mid-size herds that last tend to either grow big or get different — and getting different is often how three-generation farms stay on the land.
The 30-day action that fits any of these paths: read your next co-op base-program letter like it’s a loan document, and ask your fieldman directly what share of your plant’s intake is already committed to its largest suppliers over the next three years. If he won’t answer, that’s an answer too.
Key Takeaways
- If your “market adjustment” or hauling lines grew over the last six months while your base price didn’t, run those exact changes against your annual cwt before you do anything else — that’s your real number.
- If a single operator within 50 miles is permitted to add the equivalent of 50-plus herds your size (11,000 cows ÷ 200 ≈ 55), assume your co-op’s base rules could tighten within a year or two, and read the next base letter accordingly.
- Before you bank on rented acres for the next decade, find out which nearby parcels are already under multi-year manure or crop contracts.
- If you’re weighing expansion, ask whether you’re scaling into a commodity lane a mega-site already owns — and what makes your milk worth a premium it can’t match.
- Track DNR water-appropriation permits across your whole basin, not just your own well — watch for one name showing up on multiple high-volume permits.
- If two of your three levers — water, base rules, land — are tilting toward the big operator, stop waiting. Pick a path on purpose: partner, differentiate, or plan a controlled exit.
The real question isn’t whether consolidation is coming to your township. For most of Minnesota, it’s already parked down the road. It’s whether your margins can absorb a $20,000-plus annual drag at today’s feed costs — and which of those three paths actually fits your balance sheet and your kitchen-table conversations. So before the next permit clears or the next base letter lands, where does your breakeven really sit?
Run Your Numbers
Dairy Farm Corridor Score Calculator — Plug in your state, herd size, and hauling rate to see whether your corridor scores red, yellow, or green. It isolates FO30 hauling drag and the 2025 make-allowance hit as a share of your milk revenue, so you can size the structural squeeze before it reaches your mailbox.
Complete references and supporting documentation are available upon request by contacting the editorial team at editor@thebullvine.com.
Learn More
- Small herd cost of production: the $20.70 milk trap — Delivers a rigorous blueprint for calculating your farm’s structural ceiling against current market traps. Arms you with specific cost-slashing adjustments to defend your margin when your herd size falls outside the national volume curve.
- The Bullvine Dairy Curve: 15000 U.S. Farms by 2035 and Under 10000 by 2050 – Who’s Still Milking? — Exposes the macroeconomic consolidation timeline driving the industry’s rapid concentration into massive regional complexes. Outlines three distinct corporate structural pathways to help your multi-generation business dodge the devastating $100,000 mid-size margin squeeze.
- $3010 Heifers, 30% Labor Jumps: The Mid-Size Dairy Survival Crisis — Breaks down unconventional collaborative partnership models and mergers of equals as a radical alternative to pure capital expansion. Explains how mid-tier operations can capture massive scale economies without sacrificing independent family equity.
The Sunday Read Dairy Professionals Don’t Skip.

Every week, thousands of producers, breeders, and industry insiders open Bullvine Weekly for genetics insights, market shifts, and profit strategies they won’t find anywhere else. One email. Five minutes. Smarter decisions all week.
