A 1,200-cow Wisconsin dairy banked every $1,400 calf cheque this spring — then pulled six months of records: 25% poor passive transfer, 0.75 kg/day ADG, 32% scours. The feedlot saw it first.
Executive Summary: Day-old beef-on-dairy bull calves are moving off US dairies at $1,350–$1,500 this spring — roughly $400–$600 above straight Holstein bulls per USDA-AMS weekly reporting — and that cheque is propping up margins while the North American heifer hangover drives replacement cost higher. But the same genetics are auditing calf programs in real time: Texas Tech Beef on Dairy Symposium data show crossbreds with scours lose roughly 21 lbs at weaning versus about 8 lbs for Holsteins, and a 0.75 kg/day pre-weaning ADG (vs. a realistic 1.05 kg target) leaves an 18-kg weaning-weight hole that costs the downstream chain $70–$87 per head in catch-up days alone. Stack treatment costs, extra days on feed, and a 10–20-point grid-discount hit on upper Choice and Prime, and the hidden bill runs $130–$225 per head — roughly $44,000 a year on 250 calves, $88,000 on 500. The dairy rarely sees it directly; it shows up as $50–$80 lighter bids the next auction, and USDA’s November 2024 ADT rule plus Source & Age Verification now make that reputation data permanent. Producers with under 40% of calves in “excellent” passive transfer (serum TP >6.2 g/dL, IgG >25 g/L per Lombard et al. 2020) or 60-day scours above 25% are funding elite genetics for someone else. The 30-day move is a serum-TP audit — Brix on every colostrum, blood on two days of calves a week — before the next SimAngus or terminal-sire order. If you can’t pull passive transfer, ADG split, and scours rate in one report by Monday, you don’t have a beef-on-dairy program — you have a hope.
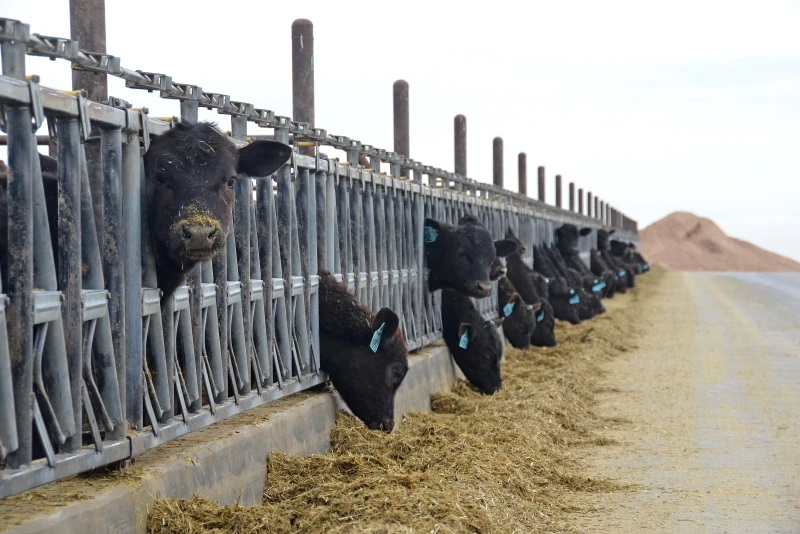
Veterinarians working south-central Wisconsin’s mid-size dairies keep walking into the same story on farm after farm. What follows is a composite of three operations from one Upper Midwest practice — stitched together so no single farm is identifiable, but every number is a real number pulled from real records. On a 1,200-cow dairy in that group, day-old beef-on-dairy bull calves were moving off the property in the ,350–,500 range per head this spring, consistent with USDA-AMS weekly dairy calf and feeder cattle reporting showing beef-on-dairy day-old premiums running roughly 0–0 above straight Holstein bull calves through the first half of 2026. The milk cheque was thin. Beef-on-dairy revenue was doing the heavy lifting. “These crossbreds hardly ever get sick,” the owner told his vet.
Then they pulled six months of records. Passive transfer: 25% of calves in the “poor” category on serum total protein. Pre-weaning average daily gain on the beef-on-dairy calves: 0.75 kg/day — dead-even with his Holsteins. Scours treatments: 32% of calves hit at least once in the first 60 days. Every number he was proud of turned out to be a number he’d never actually pulled. That’s what beef-on-dairy does in 2026. It doesn’t just pay a premium. It audits your calf program whether you want it to or not.
The $1,400 Honeymoon Is Over
Beef semen on dairy cows isn’t a side hustle anymore. It’s a structural piece of the US dairy revenue model. NAAB year-end semen sales reports have tracked beef semen units sold for dairy use in the multi-million-unit range annually since 2021, and USDA reporting from 2022 onward has documented a steady climb in the share of US dairy cows bred to beef sires.
That’s the math that makes a $1,400 calf possible on the front step. And here’s the piece most dairies haven’t processed yet: the beef-on-dairy calf cheque is propping up margins because the North American heifer hangover — documented in USDA NASS January Cattle inventory reports and Rabobank Dairy Quarterly analysis through 2025 — is simultaneously driving replacement costs higher. You are more dependent on that crossbred revenue in 2026 than you were in 2023, not less.
When a Holstein bull calf was worth $200, sloppy colostrum was annoying. When he’s worth $1,400, the same sloppy colostrum is a direct hit to your second-largest revenue line. And the crossbreds themselves are unforgiving in a way Holsteins never were. Research presented through the Texas Tech Beef on Dairy Symposium series has reported that crossbred calves with scours lost roughly 21 lbs of weaning weight versus about 8 lbs for Holsteins hit with the same illness, a finding consistent with the Journal of Dairy Science work of Windeyer et al. (2014) on early-life disease effects on dairy calf weight gain. Higher ceiling. Steeper fall.
The herds most exposed aren’t the ones just starting out. They’re the ones that got comfortable. Mid-size dairies running beef-on-dairy for two or three seasons, still using colostrum and weaning protocols built for Holstein replacements, still weaning on a calendar instead of by starter intake. Those are the farms cashing calf cheques today and losing reputation battles in the feedlot six months from now.
How This Plays Out on Real Farms
On that 1,200-cow operation, the maternity routine hadn’t changed in a decade. Colostrum got fed “when we get to it.” Brix was measured sometimes. Serum total protein — the blood test that tells you whether the antibodies actually made it into the calf — was never pulled, ever. Scours treatments lived in a notebook in the vet’s truck, a pattern Ontario Veterinary College survey work has flagged as widespread: a large share of surveyed herds either don’t record individual calf treatments at all or record them in a format that can’t be analyzed after the fact.
The calf buyer had already noticed, even if the dairy hadn’t. Bids on the last two groups were running $50–$80 a head below what comparable neighbors with tighter calf numbers were getting out of the same auction barns that week. The owner blamed “the market.” The market wasn’t the problem.
The Hidden Bill, at a Glance
Loss Category
Estimated Cost (per head)
Root Cause
Direct treatment
$20–$30
Scours/BRD incidence
Additional days on feed
$70–$105
Poor weaning ADG / 21-lb weight gap
Carcass quality discount
$40–$90
Reduced marbling from early-life illness
Total value leak
$130–$225
Systemic management failure
Treatment-cost band draws on the Journal of Dairy Science calf-illness economic modeling published by Dubrovsky et al. (2020) and related USDA-ARS work. Days-on-feed costs assume Iowa State Extension’s 2024–2025 Ag Decision Maker custom calf-feeding and yardage surveys, which reported total daily cost of gain in the $3.00–$4.00/day range. The grid-discount band assumes upper Choice and Prime premiums in the $20–$35/cwt range reported through USDA AMS LM_CT155 National Weekly Direct Slaughter Cattle — Premiums and Discounts during 2024–2025.
On a 250-calf operation, the midpoint of that table is roughly $44,000 a year; on 500 beef-on-dairy calves, it’s roughly $88,000. The awkward part? The dairy never sees most of it directly. The feedlot eats the extra days on feed. The packer eats the lighter, lower-grading carcass. You get a $50–$80 lighter bid next round, tell yourself the buyers got cheap, and lose next year’s bid the same way.
Colostrum to Carcass: Where the 0.75 kg/day Gap Actually Costs You
Three things separate herds banking the beef-on-dairy premium from herds quietly leaking it, and none of them live on a genomic test.
Passive transfer is the foundation. USDA NAHMS Dairy 2014 found a substantial share of preweaned heifer calves failed to achieve adequate passive transfer, and Lombard et al. (2020) in the Journal of Dairy Science has since reclassified the targets. Calves with failed passive transfer carry 1.5–2× the risk of diarrhea and pneumonia. Industry guidelines used by Penn State Extension’s CalfCare program, Michigan State Extension, and the Dairy Calf & Heifer Association Gold Standards III now aim for at least 40% of calves in the “excellent” bucket — serum total protein above 6.2 g/dL, IgG above 25 g/L. Plenty of farms running “good Brix” colostrum still have 30–40% of calves sitting in fair or poor when you actually pull blood. Brix tells you about the liquid. Serum TP tells you whether the calf got what you think you gave her.
Passive Transfer Category
Serum TP (g/dL)
IgG (g/L)
Disease Risk vs Excellent
% Farms Hitting 40%+ “Excellent” Target
Excellent
>6.2
>25
Baseline
<50% of US herds
Good
5.8–6.2
18–25
1.2–1.4×
Target threshold
Fair
5.1–5.7
10–17
1.5–1.8×
⚠ Common default
Poor
<5.1
<10
2.0–2.5×
25% of article herd calves
Starter, not milk, drives weaning weight. The Quigley and Drackley line of Journal of Dairy Science research — Drackley (2008) and the Quigley starter-intake series — has shown for two decades that age at first starter intake and starter consumed by 21–28 days are among the strongest predictors of weaning weight. Elite beef-on-dairy programs target 0.9–1.1 kg/day pre-weaning ADG — realistic when calves are eating 0.3–0.5 kg/day of starter by the end of week three and pushing past 1.5 kg/day before the milk comes off.
Here’s what that gap actually costs. If your calves are gaining 0.75 kg/day instead of 1.05 kg/day, the weaning-weight gap over 60 days is (1.05 − 0.75) × 60 = 18 kg. At yardage and feed costs of $3.50/day, that 18-kg deficit takes roughly 20–25 days to close in the feedlot, costing the chain about $70 to $87 in catch-up time alone.
At yardage and feed costs of $3.50/day$3.50/day, that 18 kg deficit takes roughly 20–25 days to close in the feedlot, costing the chain about $70$70 to $87$87 in catch-up time alone. That recovery window assumes typical beef-on-dairy compensatory gain rates reported in Ohio State’s beef × Holstein vs straight Holstein feedlot work (Fluharty et al. and the subsequent OSU beef-on-dairy feedlot study series). The carcass side makes it worse. Ohio State’s growth-performance and carcass-traits data showed measurable advantages for crossbreds on gain, feed efficiency, and carcass value — but those advantages erode when calves arrive with poor early growth or lingering respiratory damage. Penn State extension work on bovine respiratory disease and lung consolidation has linked early BRD to reduced marbling and lower quality-grade outcomes. Lose 10–20 percentage points of calves out of upper Choice and Prime at current grid spreads and the expected-value hit across the lot runs roughly $40–$90 per head. Your day-old cheque looked the same. Your actual value to the chain did not.
The feedback loop is the permanent one. A feedlot typically needs one turn of your calves — 6 to 12 months — to decide whether you’re what your marketing said. They see arrival treatments, gain in the first 60–90 days, then the close-out at harvest. Feeder-cattle research out of Kansas State (Schroeder et al.), UW-Madison, and Superior Livestock tele-auction price analyses has shown consistently that buyers discount negative reputations faster than they reward positive ones — and they rarely tell sellers why.
Why Feedlots Remember — and How EID Makes It Permanent
The reputation problem isn’t anecdotal anymore. It’s digital.
USDA’s Animal Disease Traceability final rule, which made electronic identification mandatory for breeding cattle and bison moving interstate effective November 2024, has accelerated what commercial feedyards were already doing: matching arrival health, gain in the first 60–90 days, and carcass close-out data back to the source dairy through EID tags and lot paperwork. Source and Age Verification programs under USDA Process Verified Programs and equivalent certifications have made those audit trails saleable. A feedlot’s “problem lot” database used to live in a yard manager’s head. It now lives in a database with your farm name next to it.
You don’t get blacklisted with a phone call. You get blacklisted with a quieter bid and a skipped auction. By the time you notice the pattern, the data upstream has already decided for the buyers.
Metric
What the Dairy Thinks
What the Feedlot Records
Data Now Permanent Since
Passive transfer rate
“We feed 4L colostrum”
25% of calves in “poor” category
Nov 2024 (USDA ADT rule)
Pre-wean ADG
“Crossbreds are growing great”
0.75 kg/day — at Holstein floor
Per-lot EID arrival data
60-day scours rate
“We treat when needed”
32% treated ≥ once
Source & Age Verification PVP
Calf health reputation
“Buyers just got cheap”
$50–$80/head bid discount
Lot history, digital & permanent
Carcass outcome
“Not our problem after sale”
10–20pt upper Choice/Prime loss
USDA AMS LM_CT155 grid data
Feedlot feedback
“Nobody tells us anything”
One turn = permanent source score
Kansas State/UW-Madison buyer research
How Much Is a 0.75 kg/day ADG Really Costing You?
Run the numbers on your own herd and the answer isn’t a rounding error. At 0.75 kg/day instead of 0.95–1.1 kg/day, you’re 15–20 kg light at weaning before you factor any post-weaning slump. Against 2026 calf values of $1,350–$1,500, the leak table above puts $130–$225 of value per calf at risk — a meaningful share of the premium the market is currently paying you for crossbred genetics. That math stays ugly whether corn is $4 or $5.
Is Your Calf Program Ready for $1,400 Genetics?
Beef-on-dairy calves were built to outperform. That’s why buyers pay for them. But the outperformance is conditional — on colostrum that actually gets into the calf, on starter that actually gets eaten, on weaning decisions that respect what the rumen is doing rather than what the calendar says.
The honest question isn’t whether your genetics rep sold you the right bull. It’s whether your maternity pen, your colostrum bucket, and your starter pail are holding up their end. A 25% “poor” passive transfer rate on a $200 Holstein bull calf was a rounding error. The same 25% on a $1,400 crossbred is a different conversation, and it’s one the feedlot is already having about you — just not with you.
Options and Trade-Offs for Producers
Path
Core Action
Timeline
Cost
Risk if Ignored
Key Metric
1 — Colostrum Audit
Brix + serum TP protocol
30 days
Low (~$3–8/calf)
Continued value leak
≥40% calves in “Excellent”
2 — Wean by Starter
1.5 kg/day intake threshold
60–90 days
Low (extra MR on slow calves)
18-kg weaning-wt hole
Starter intake Week 3–4
3 — Segment Breeding
30–40% sexed dairy, 50–60% beef
Ongoing
Medium (genomic testing)
⚠ Heifer shortage by 2028
Replacement rate vs cull rate
4 — Feedlot Feedback
Annual data debrief with buyer
Annual
None (relationship cost)
Permanent reputation damage
Arrival health + carcass grades
Path 1 — The “Stop Lying to Yourself” Colostrum Audit (do this within 30 days)
When it fits: any herd that can’t tell you, off the top of its head, the percentage of calves sitting in “excellent” passive transfer.
What it requires: Brix on every first-milking colostrum, a written SOP for volume and timing (4 L within 2 hours of birth, no exceptions), and a rolling serum TP check on a sample of calves at 24–48 hours of age. Pull blood on every calf born across two days a week and run the panel.
Risk and limit: it surfaces problems fast, which means someone has to own the fix. The refractometer is useless if nobody changes what happens between the cow and the calf.
Path 2 — Wean by Starter Intake, Not by Calendar
When it fits: any dairy still pulling milk on a fixed calendar — 42 days, 56 days — regardless of what calves are actually eating.
What it requires: starter in front of calves by day 3–4, buckets dumped and refreshed daily, and a simple rule the barn team can live by: no full milk removal until calves are eating roughly 1.5 kg/day of starter for three consecutive days.
Risk and limit: you’ll extend the milk window on some calves, which costs a few dollars in milk replacer per head in the short run. On $1,400 calves, that’s a bargain.
Path 3 — Segment Your Breeding Instead of Blanket-Beefing It
When it fits: herds using beef semen as a dumping ground for every “low” cow without a genomic plan behind the decision.
What it requires: a genomic framework that puts sexed dairy on roughly the top 30–40% of cows and beef on the bottom 50–60%, with clear calving-ease rules for heifers. Using Angus on first-calf heifers and reserving terminal breeds (Simmental, Charolais, Limousin) for mature cows isn’t a style choice — it’s dystocia management. Watch replacement inventory hard; the heifer hangover reshaping 2026 breeding plans came from over-beefing two and three years ago.
Risk and limit: if your replacement math is off, you’ll fix your calf revenue and break your cow supply at the same time.
Path 4 — Close the Feedlot Feedback Loop
When it fits: any dairy selling more than a truckload of beef-on-dairy calves a year and getting no carcass data back.
What it requires: one structured annual debrief with your primary calf buyer or receiving feedlot — arrival health, gain in the first 60 days, days on feed, carcass weights, grades. EID tagging at birth and BVD-PI ear-notching remove two of the biggest buyer objections at once.
Risk and limit: some buyers won’t share numbers. Sell to the ones who will. The data is worth more than a $20/head bid bump from someone who treats your calves as a black box.
Key Takeaways
If fewer than 40% of your last 30 calves land in “excellent” passive transfer on serum TP, your colostrum program is your first problem — regardless of what Brix says on the bucket.
If your beef-on-dairy pre-weaning ADG isn’t clearly ahead of your Holstein ADG, stop blaming genetics. The crossbreds give you a higher ceiling; management is what’s pinning you to the Holstein floor.
If your 60-day scours treatment rate is above 25%, treat it as a five-alarm fire. In the Texas Tech Beef on Dairy Symposium dataset, every case costs roughly triple the weaning-weight penalty a Holstein pays.
If your starter buckets are dusty, caked, or sorted tomorrow morning, your calves aren’t eating enough to hit elite ADG — no matter what the bag label promises.
If you’re still weaning on a calendar, switch to a 1.5 kg/day starter-intake threshold for three consecutive days before full milk removal.
If your primary calf buyer won’t share arrival health, days on feed, or carcass data once a year, assume the worst about how your calves are actually performing — and find a buyer who will.
If you can’t pull passive transfer, pre-weaning ADG split, and scours treatment percentage in the same report by next Monday, you don’t have a beef-on-dairy program. You have a hope.
Your Next Step
Don’t order your next batch of SimAngus or terminal-sire semen until you’ve audited your serum total protein.If you’re under 40% “excellent,” you aren’t ready for elite genetics — you’re funding them for someone else.
This week, put a refractometer, a serum TP kit, and a scale in the calf pens. Pull two days of blood and one week of starter intakes. Then decide whether your calf program deserves your breeding program.
Somewhere downstream, a feedlot is already building a picture of your calves from data you don’t see. The only move that fixes that is deciding to see it first. The week-by-week starter curve and the full colostrum-to-carcass cost model live in Bullvine Weekly and the next Tier 2 playbook — that’s the piece to read before your next sire order.
Run Your Numbers
Calf Feed ROI Tool — Before you pull another $50 off the calf program, run your colostrum, starter, and pre-weaning ADG through the Calf Feed ROI Tool and see whether the cheaper plan is actually funding that $1,400 crossbred — or quietly draining it.
Complete references and supporting documentation are available upon request by contacting the editorial team at editor@thebullvine.com.
Beef-on-Dairy’s $6,215 Secret: Why 72% of Herds Are Playing It Wrong — Capture your share of the $6,215 monthly performance gap by revealing the reproductive guardrails top earners use. Delivers a blueprint for matching beef semen deployment to specific pregnancy rate tiers and genetic markers.
Boosting Dairy Farm Profits: Using Embryo Transfer and Male-Sexed Beef Semen — Accelerate genetic progress by dismantling the cost barriers of embryo transfer and male-sexed beef semen. Illustrates how leveraging hybrid vigor generates up to 200% higher premiums for your crossbred day-old calves.
The Sunday Read Dairy Professionals Don’t Skip.
Every week, thousands of producers, breeders, and industry insiders open Bullvine Weekly for genetics insights, market shifts, and profit strategies they won’t find anywhere else. One email. Five minutes. Smarter decisions all week.
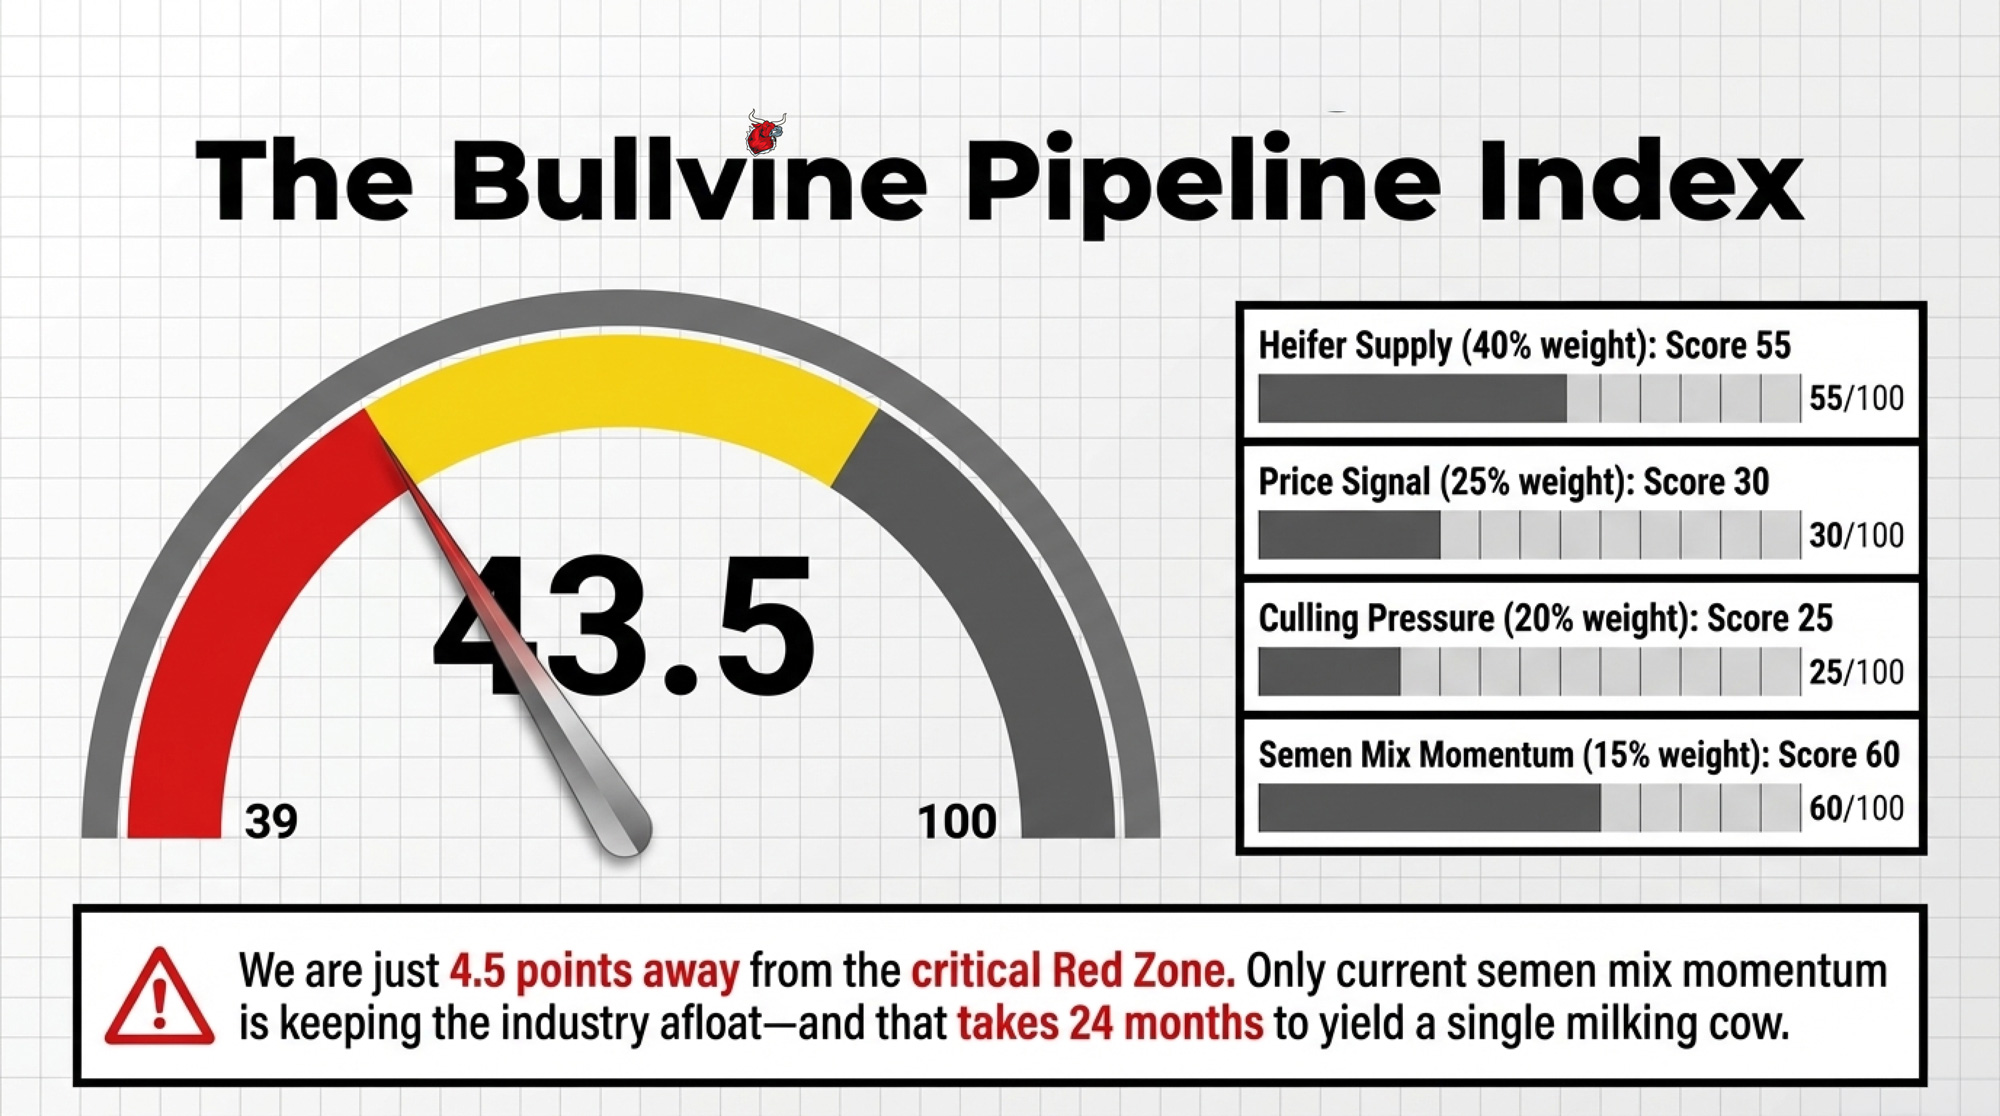
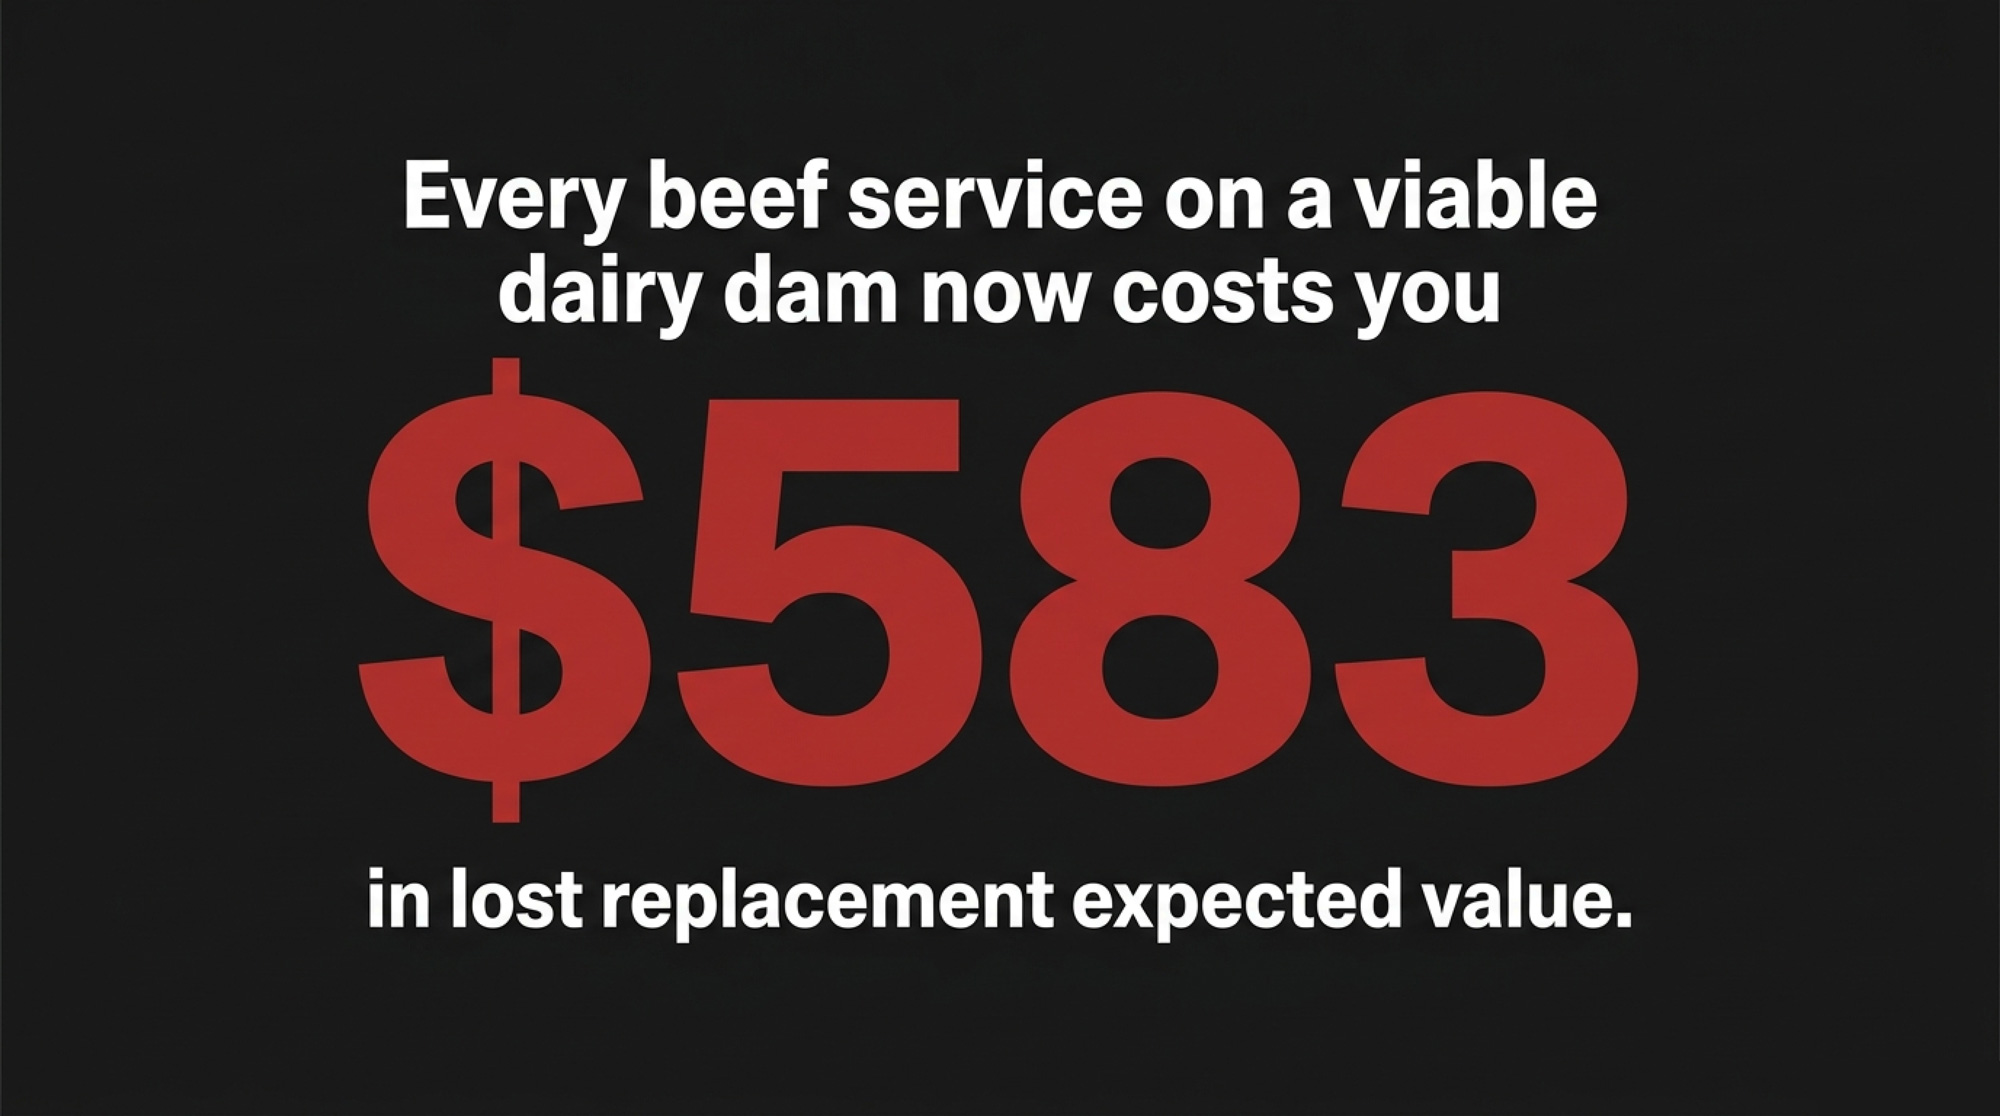
500-cow Panhandle herd, 35% beef through 2023–24. At a $3,010 replacement and a $500 calf, every beef service on a viable dairy dam now costs $583. Pipeline Index: 43.5. Yellow Zone.
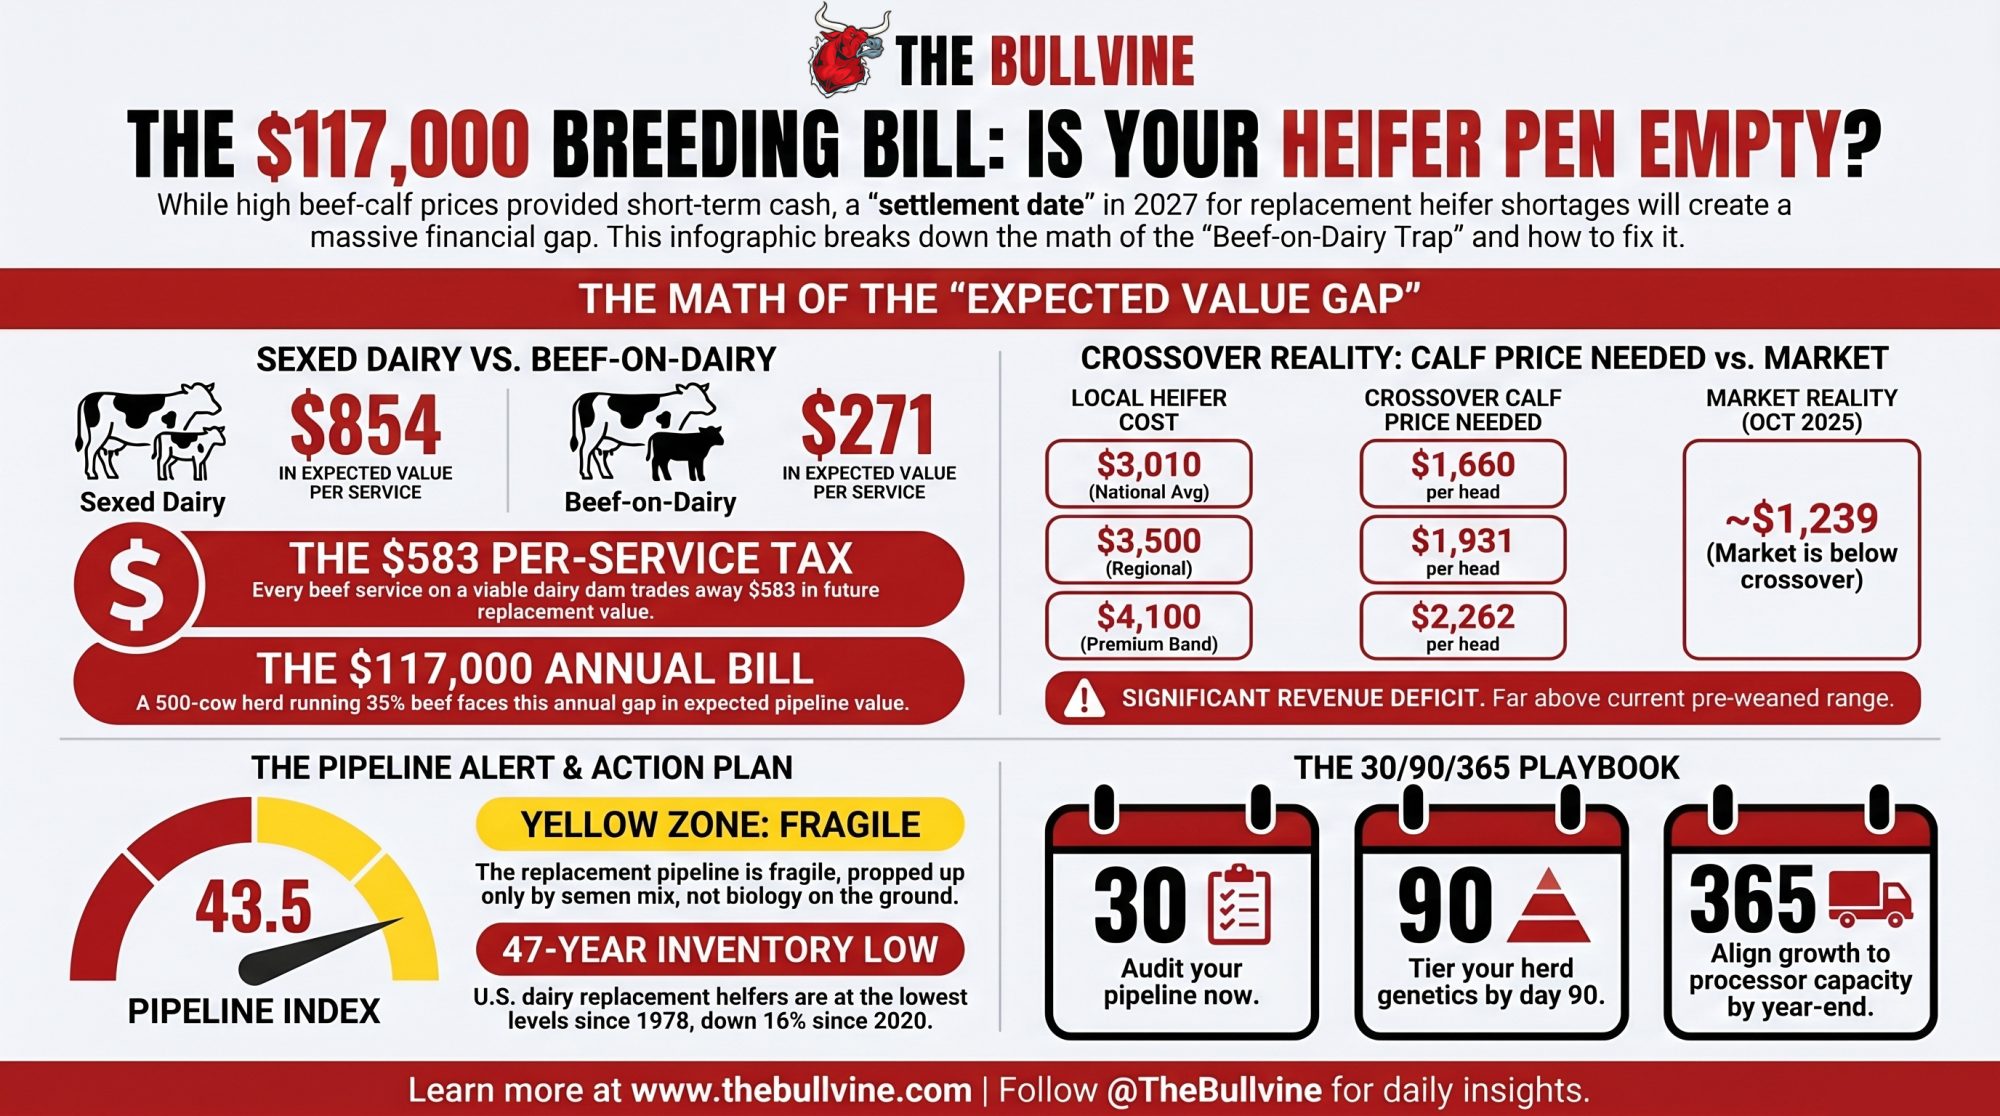
Executive Summary: A 500-cow Panhandle dairy that ran 35% beef-on-dairy through 2023 and 2024 is staring at a $117,000-a-year expected-value gap on its 2026 breeding sheet, with every beef service on a viable dairy dam now costing $583 against a $3,010 national replacement heifer (USDA NASS, July 2025) and a $500 crossbred calf. The Bullvine Replacement Pipeline Index just printed 43.5 — Yellow Zone, 4.5 points from Red — carried almost entirely by semen-mix momentum, not biology on the ground. The math is blunt: sexed dairy delivers $854 per service in expected value, beef-on-dairy delivers $271, and crossbred calves don’t pencil against sexed dairy until they clear $1,660/head at a $3,010 heifer. Settlement date is Q1 2027, when a 27%-turnover herd projects 87 heifers to first calving against 135 needed — 48 head short at spot prices that already ran ,110 in October 2025. The October 2025 correction (/cwt off CME December live cattle in twelve business days, calves from ~,400 to ,239) proved calf revenue and Class III aren’t independent streams — same operation, overlapping signals, correlated downside. Lenders are starting to model this; producer balance sheets generally haven’t caught up. If you ran 30%+ beef the last two cycles, the 30/90/365 playbook inside (plus the LRP Unborn Calves window and the $1,660/$1,931/$2,262 crossover prices) is the math before the heifer pen comes up short.
An archetypal 500-cow Panhandle dairy that ran 35% beef-on-dairy through 2023 and 2024 is looking at a 7,000-a-year expected-value gap on its 2026 beef-on-dairy breeding sheet — math anchored on a late-October 2025 crossbred calf trough near ,239/head reported across regional auction channels and USDA NASS’s July 2025 national replacement milk-cow price of ,010/head. Brad Kooima of KKV Trading has characterized beef-on-dairy, in effect, as a packer’s dream in recent industry commentary: known genetics, predictable gain, a schedulable 341-day pipeline from calf to kill. The Bullvine Replacement Pipeline Index just named the other side of that trade.
43.5 on the Index as of April 2026. Yellow Zone, 4.5 points from Red. Roughly 4.29 million dairy heifers projected by Bullvine’s model to enter the 2027 milking string from 2025 breedings, against a U.S. dairy cow herd near 9.35 millionhead per USDA’s January 1, 2025 Cattle Inventory, and more than billion in new processing steel rising across 19 states per industry build-out tracking.
This is a beef-on-dairy 2026 breeding story. It reads like a credit memo.
Why the Packer’s Dream Is Only Half the Trade
Kooima’s framing points at a real structural gain. Known genetics. Predictable gain. A 341-day pipeline is something native beef never offered the packer-feeder complex at this volume.
CoBank Knowledge Exchange analysis of USDA AMS slaughter-cattle auction data covering March 2024 through February 2025 pegged beef-on-dairy animals at $2,485 at slaughter, native beef at $2,385, and pure dairy at $2,210. Feeder-to-fat value retention ran 81.3% for beef-on-dairy on a $/cwt basis, 72.1% for pure dairy, 69.6% for native beef. Ohio State and Michigan State feedlot trials have documented lower cost of gain on beef-on-dairy steers versus Holsteins, with the spread varying by ration and finishing system.
That efficiency is real. It’s not a packer profit story either. Drovers’ Sterling Marketing Beef Cutout and Packer Margin Tracker has shown deeply negative packer margins through most of 2025 and into spring 2026. Tyson Foods has disclosed materially elevated cattle procurement costs across fiscal 2025 in public filings and announced the closure of its Lexington, Nebraska beef plant.
So where did the supply-chain value come from? NAAB’s 2025 Year-End Report, released March 2026, puts domestic beef-on-dairy semen at 8.1 million units, on top of 10.6 million sexed dairy and 6.0 million conventional. Every beef service on a cow that could carry a viable dairy pregnancy is a dairy heifer that won’t walk into a milking string in 2027.
What Does a $3,010 Replacement Heifer Mean for a 500-Cow Panhandle Herd in 2026?
National numbers turn into a breeding sheet fast. An archetypal 500-cow Panhandle dairy shipping to one of the new plants outside Amarillo needs about 135 replacement heifers a year at a 27% turnover rate. At USDA NASS’s July 2025 Agricultural Prices national average of $3,010/head, that’s a $406,350 annual replacement line. In Texas and California premium bands where springers cleared $4,000–$4,500 in late 2025 per regional auction reporting, the number climbs toward $500,000. USDA NASS’s October 2025 reading was already $3,110 — up $100 in three months, up $510 year-over-year.
Run 35% beef on that herd and you’re putting roughly 200 beef services a year on cows that could carry a viable dairy pregnancy. Using Dr. Michael Overton’s Zoetis field dataset from 85 commercial Holstein herds — 42% sexed conception, 57% conventional, 90% and 50% heifer ratios, 95% pregnancy survival, 79% born-to-first-calving — every one of those 200 services trades away roughly $583 in expected replacement value at a $3,010 heifer and a $500 pre-weaned beef calf.
Running the Numbers — The Spread at a Glance
Based on $3,010 national heifer average vs. $500 crossbred calf. Sources: USDA NASS July 2025 Agricultural Prices; Overton Zoetis 85-herd dataset.
Units note: The October 2025 CME December live cattle move is $/cwt on fat cattle. The ~$1,400 → $1,239 per-head calf move is a different instrument. Both tracked the same signal down.
Heifer-calf baseline: At 35% beef on a 500-cow herd, about 65% of pregnancies are dairy. Against Overton’s conception and heifer-ratio rates, that produces roughly 110 heifer calves/yr. Multiply by 0.79 born-to-first-calving and the herd delivers ~87 heifers to first lactation against 135 needed. That’s the 48-head shortfall the 2027 pipeline has to cover at spot prices.
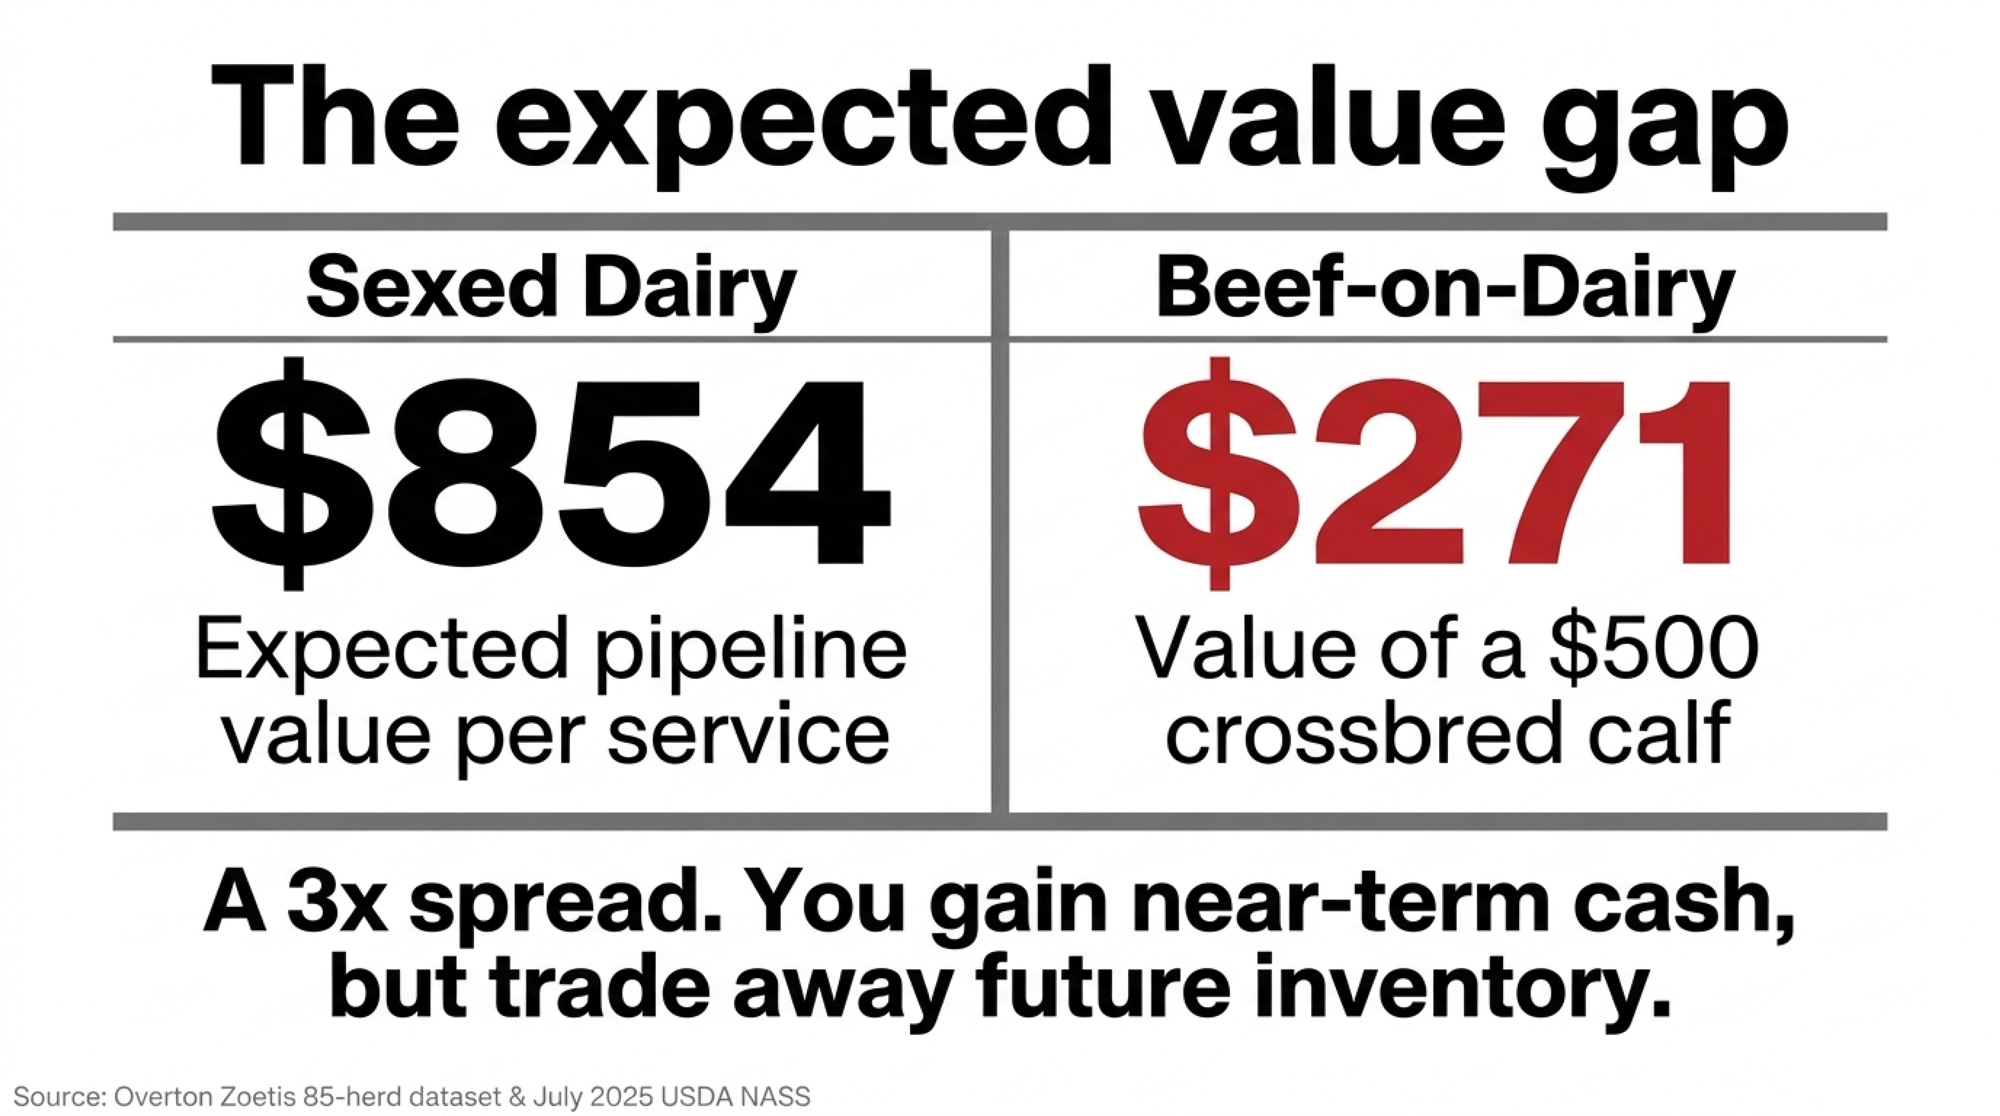
“$854 per sexed-dairy service. $271 per beef-on-dairy service at today’s $500 calf. The spread is 3x — and the settlement date is 2027.”
What Does the October Correction Actually Say About Calf Price Risk?
Most of the industry filed October 2025 as a blip. It wasn’t.
Per CME Group settlement data, December live cattle futures fell from the mid-$248 range in early October to $241.82on October 16 — a single-session $6.05/cwt drop — and bled to $226.57 by October 28. Roughly $22/cwt in twelve business days. Market analysts linked the move to public presidential commentary that week pressing ranchers on beef prices, and crossbred calf values fell with the futures from roughly $1,400 to near $1,239. Bullvine’s prior modeling on a 1,000-cow / 40%-beef archetype put the annualized revenue impact near $196,000.
The assumption most coverage leaned on: beef-on-dairy is diversification against milk-price weakness. The data says otherwise. USDA AMS Class III printed $14.59/cwt in January 2026 — the lowest since July 2023 — and recovered to $16.16 in March 2026. Thin milk margins, volatile calf revenue, same operation. Both streams moved on overlapping signals, not independent fundamentals.
That’s correlation, not diversification. A different risk structure than the one the 2023 breeding decision was made against.
Red threshold: 39.0 · Distance from Red: 4.5 points
What it is: Bullvine’s proprietary replacement-pipeline health score. It combines NAAB’s domestic semen-sales mix, Overton’s biological conversion rates, and USDA’s weekly Livestock Slaughter data into a single weighted reading (Heifer Supply 40%, Price Signal 25%, Culling Pressure 20%, Semen Mix Momentum 15%). Refreshes quarterly as USDA and NAAB data update.
Read: Fragile recovery. The bounce is carried almost entirely by semen-mix shift, not by biology on the ground. Settlement-date risk for 2027–2028 replacements remains elevated.
The Four Components
Heifer Supply — 55 (weight: 40%). Marginal. Replacement ratio runs near 27 per 100 cows. Why it matters:direct line from current inventory to 2027 milking cows.
Price Signal — 30 (weight: 25%). Red-Zone range, driven by the $3,010 national heifer price. Why it matters:price is the market’s vote on scarcity, and the vote is already in.
Culling Pressure — 25 (weight: 20%). Red-Zone range; retained-cow overhang is keeping today’s milk on. Why it matters: retained cows mask supply tightness now and widen the 2028 gap.
Semen Mix Momentum — 60 (weight: 15%). The one component propping the score up. Sexed dairy climbed to 64% of domestic dairy units used in 2025 per NAAB’s 2025 Year-End Report. Why it matters: the pipeline’s only tailwind — and it won’t produce a milking cow for 24 months.
USDA’s January 2025 Cattle Inventory counted just 3.91 million dairy replacement heifers on U.S. farms — the smallest reading in 47 years, down 16% from 4.61 million on January 1, 2020. Iowa State Extension’s NW Iowa Dairy Outlook (Lee Schulz) has tracked weekly dairy cow slaughter running behind year-earlier across most of the period since September 2023. Bullvine’s modeling pegs cumulative “extra cows kept” at 600,000–611,600 head versus normal culling pace — an extrapolation from the ISU weekly deficit, not a USDA number.
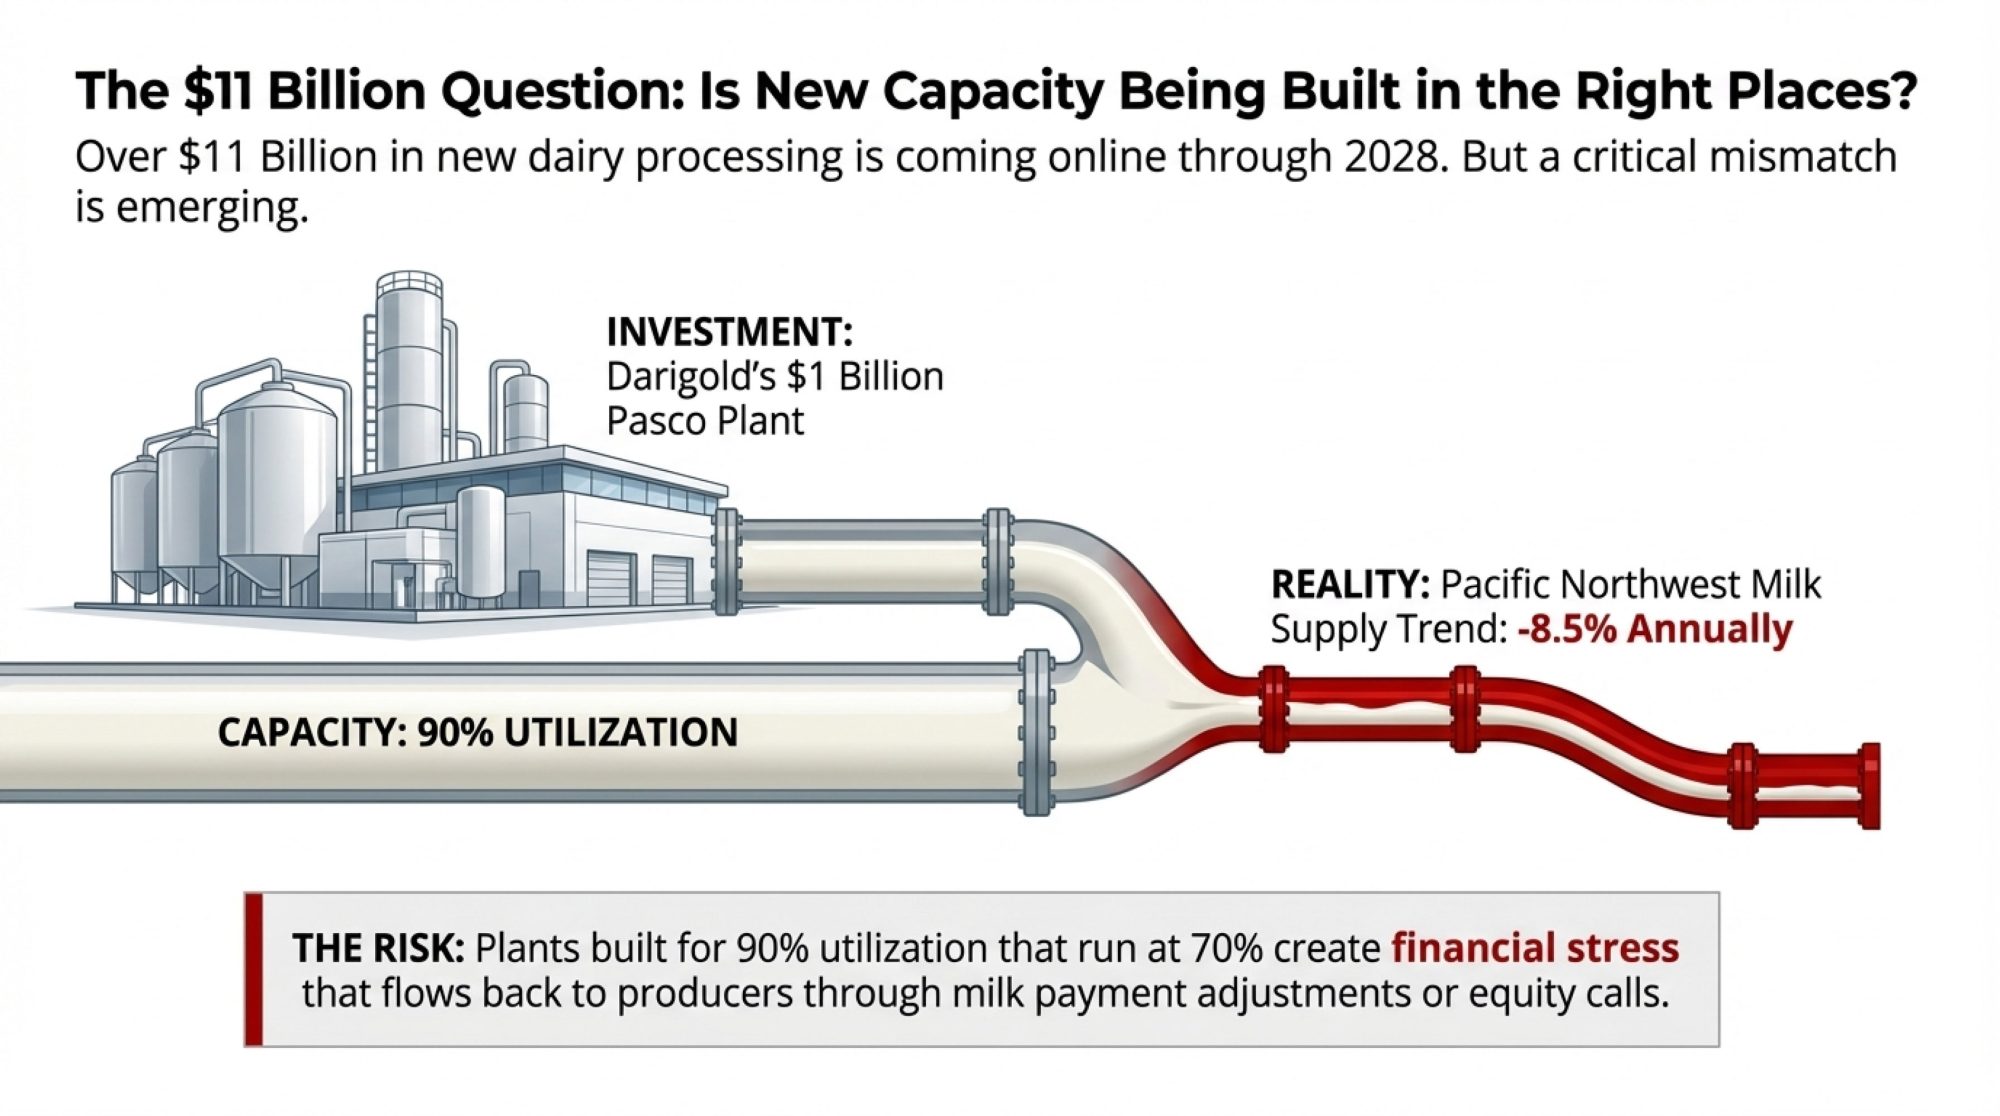
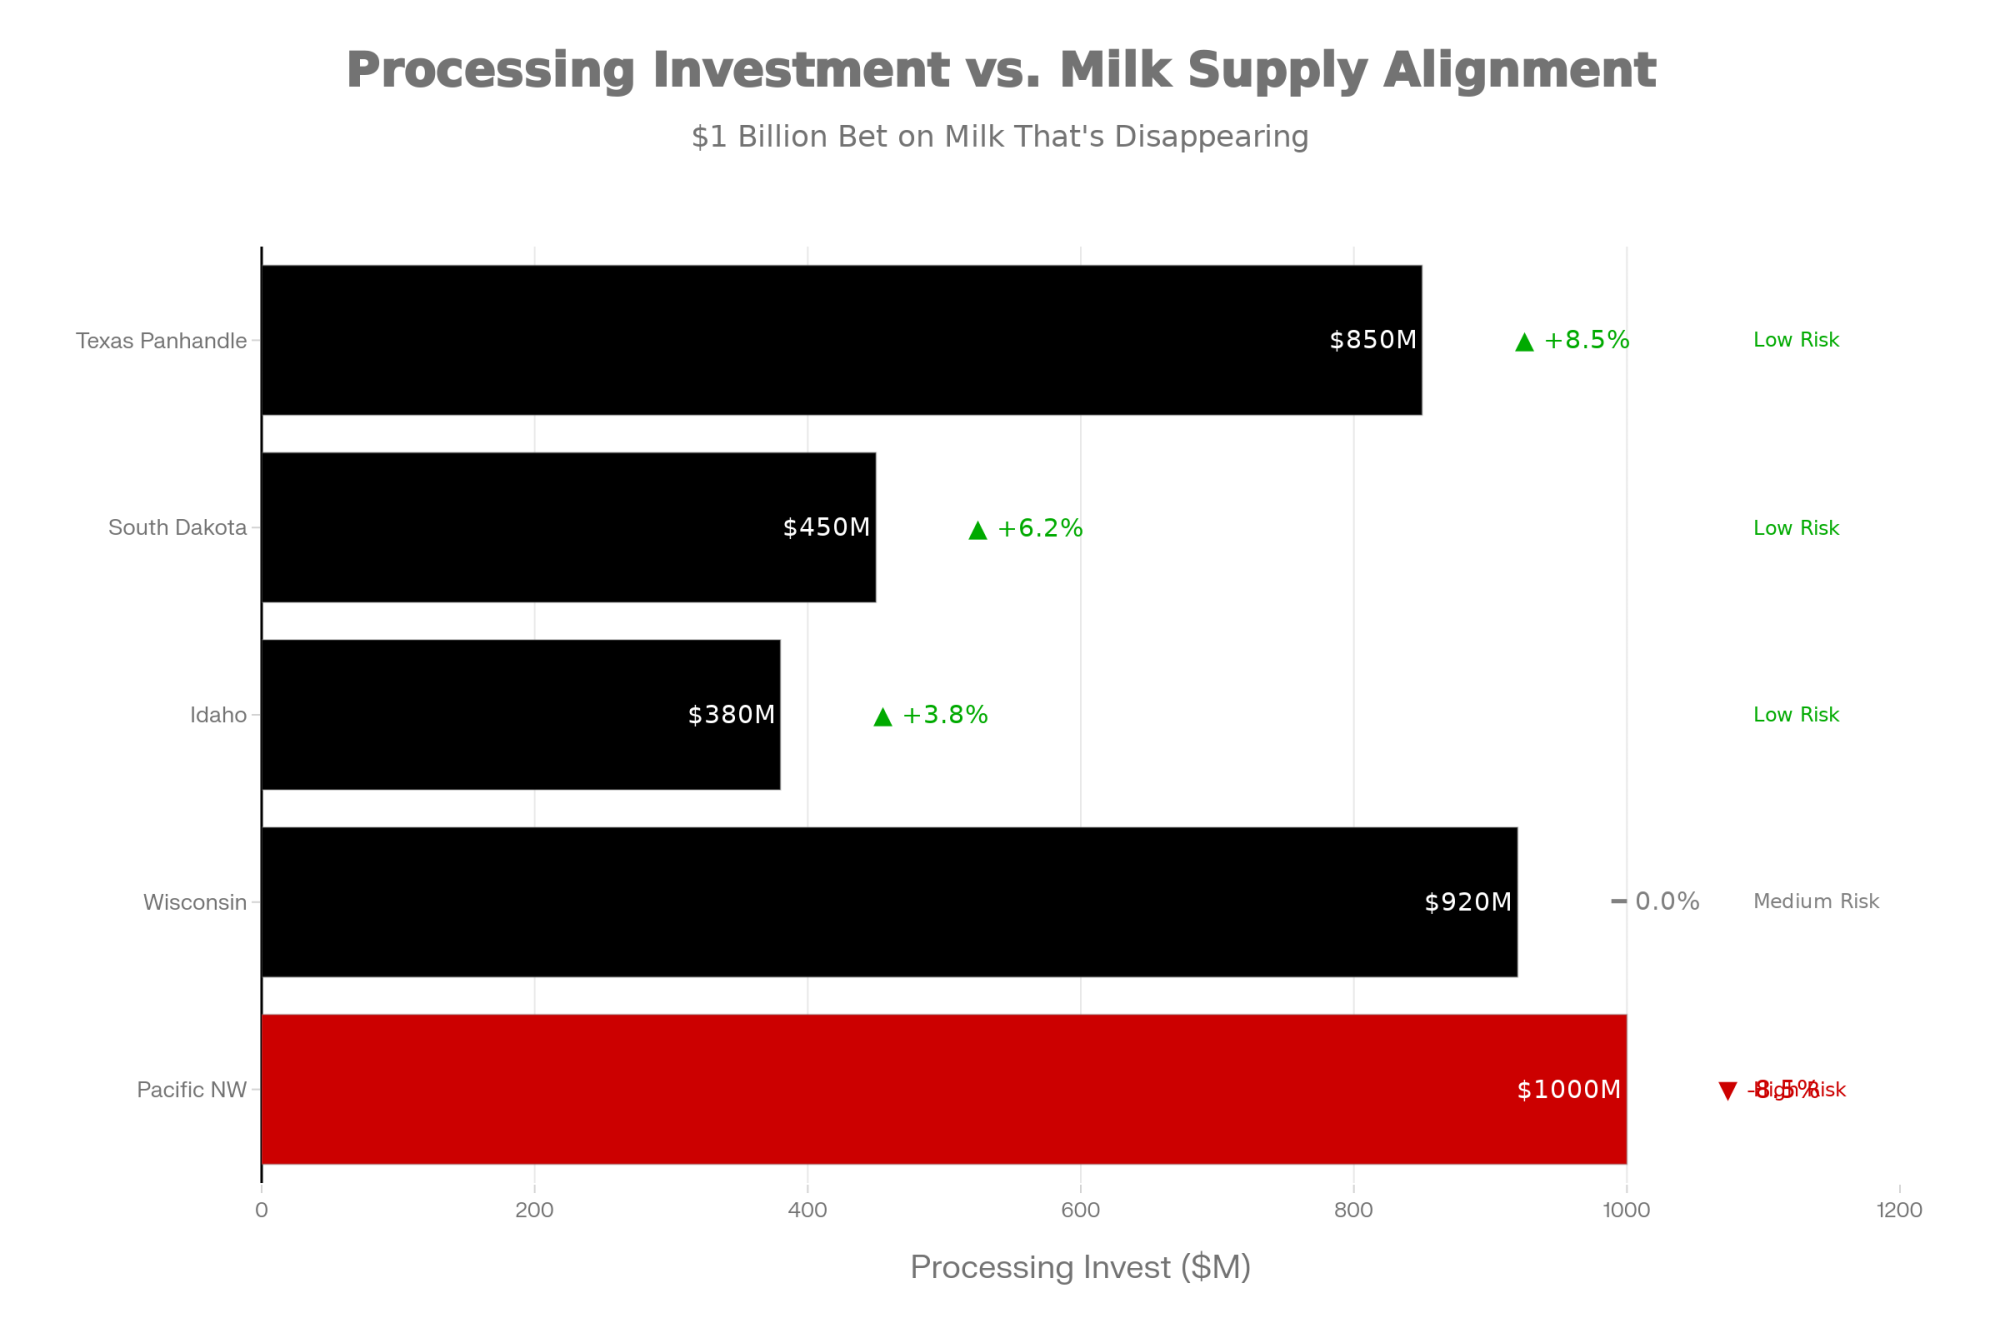
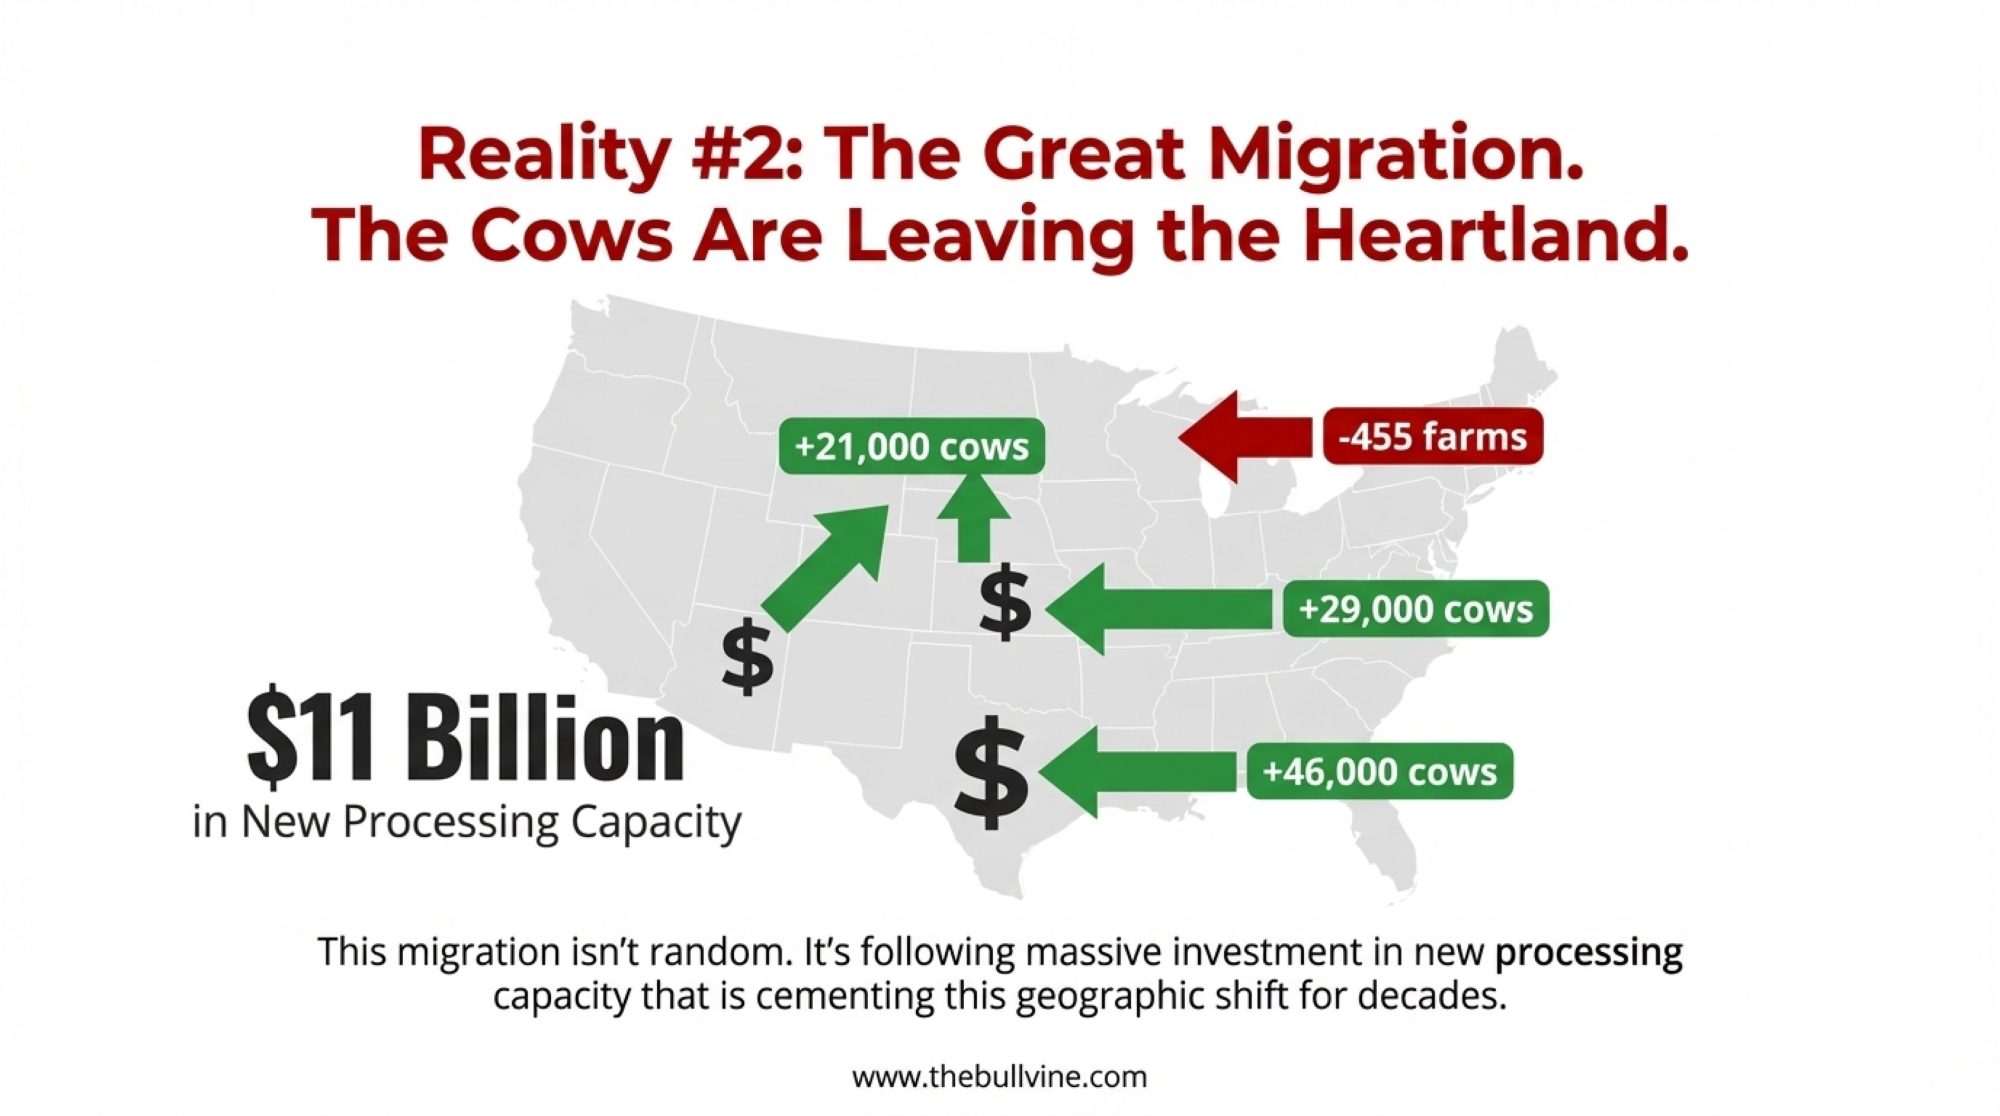
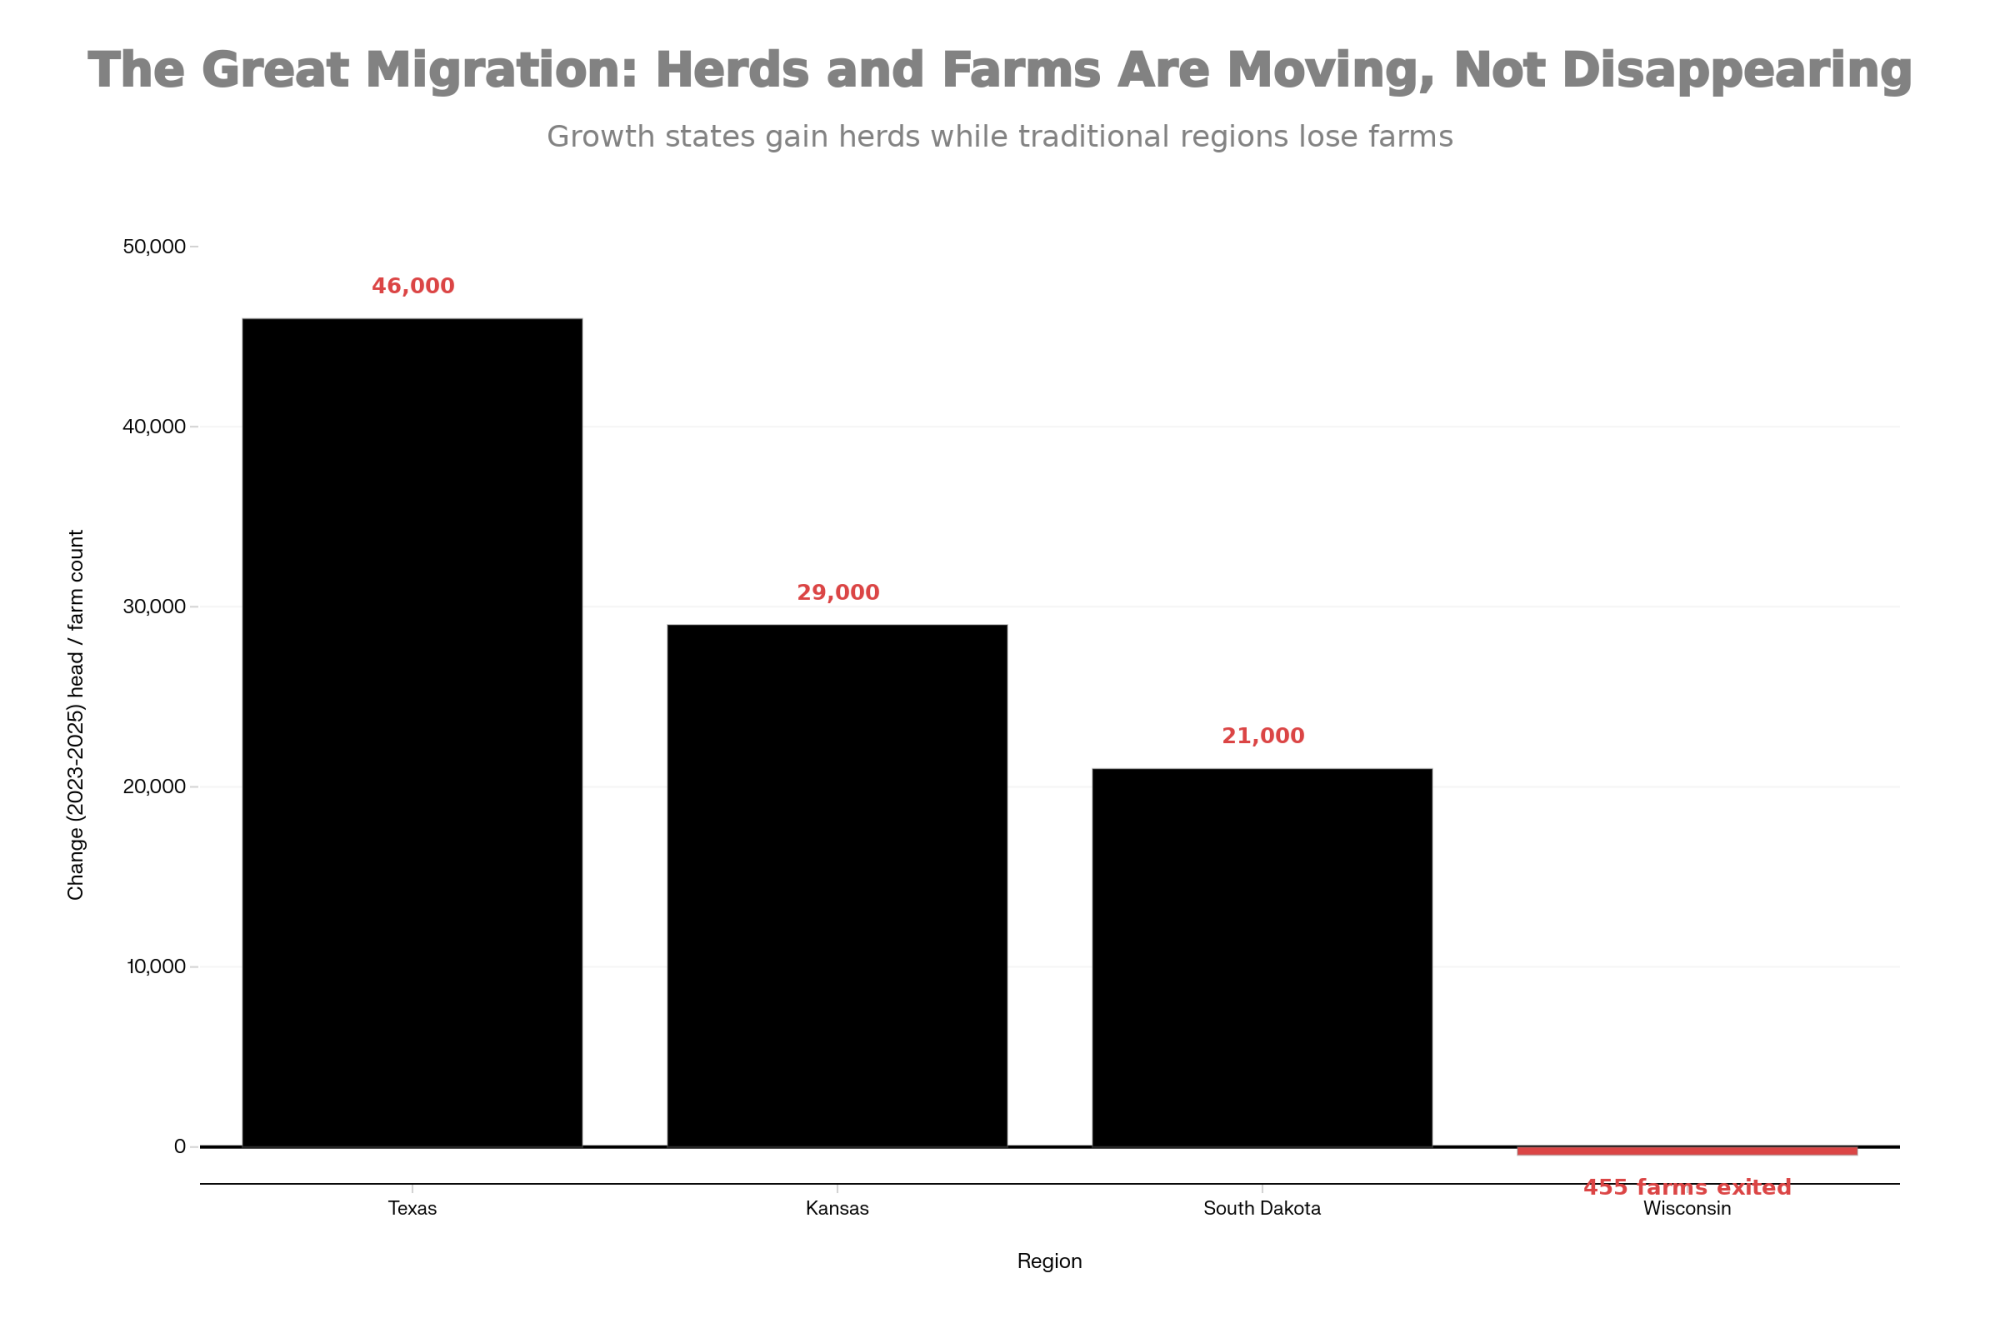
Those retained cows carry milk volume today. They won’t carry a new plant in 2028. The $11 billion in new processing capacity was sized against herd-growth assumptions from 2022–23 that no longer hold.
Why the Operator Who Got the Calf Market Right Got the Settlement Date Wrong
The Panhandle operator who made good money on beef calves through 2023 and 2024 didn’t miscalculate. They executed leg one of a two-leg trade well. What most haven’t done is look up leg two’s price.
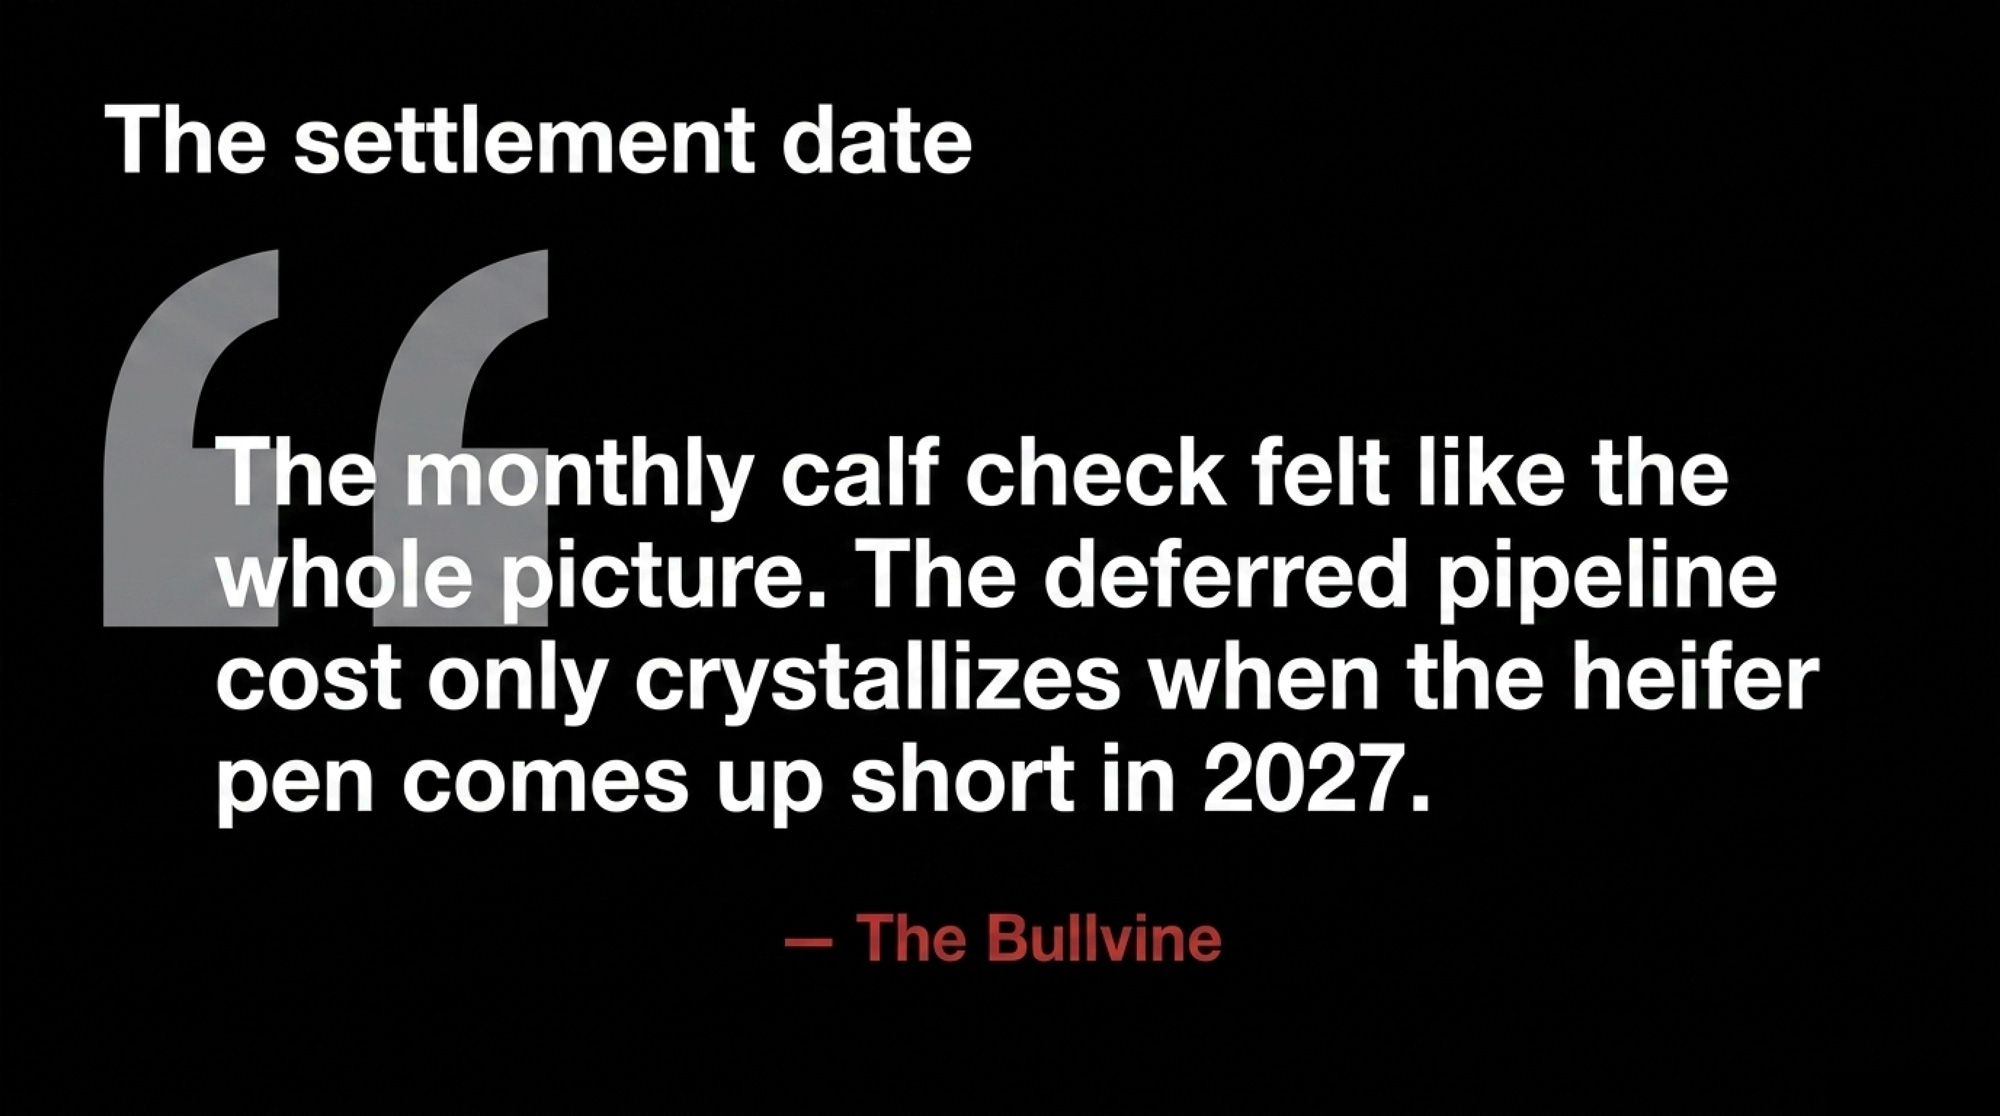
That’s not on the operator. It’s on how the trade got sold. One leg at a time. The $900–$1,400 calf checks landed every month through that run. The pipeline cost was deferred, off balance sheet, and only crystallizes when the heifer pen comes up short in Q1 2027.
Some operators ran the full math and took the trade eyes-open. For others, the settlement-date cost didn’t get modeled because the monthly calf check felt like the whole picture. Both positions exist in the data. What’s changed is the spread at the service level: sexed dairy at $854 against beef-on-dairy at $271. More than three times. The crossover doesn’t arrive until beef-cross calves clear $1,660 at a $3,010 heifer. Most markets aren’t in the same zip code.
Will Babler of Atten Babler Risk Management has publicly argued that premium U.S. beef will increasingly be held by dairy producers because of the extra benefits these animals bring to market. He’s right about the premium. The question is whether your animals qualify — traced genetics, breed-society enrollment, direct feedyard relationship — or whether they’re anonymous crossbreds moving through the sale barn at $200–$500 and carrying all the pipeline risk for a fraction of the revenue.
Gregg Doud has framed the reclassification plainly in recent NMPF communications, telling dairy audiences they may be in the beef business more than the dairy business. Lenders have started modeling it that way. Producer balance sheets generally haven’t caught up.
Where Does This Leave Ontario and Supply-Managed Herds?
Different mechanism, same breeding-sheet question. Supply management protects the Canadian milk check in a way the U.S. spot market does not, which blunts the milk-price-weakness argument for riding beef-on-dairy hard. Quota carrying costs and genetic replacement economics still drive the service-by-service EV decision. Beef-cross calves from Ontario herds still move into a North American feedyard market that cleared near $1,239 at the October 2025 trough. The crossover math above holds; the variables that change are your local heifer cost and your calf-sale channel.
The 30/90/365-Day Playbook for Herds That Ran 35%+ Beef in 2023 and 2024
30-Day Actions — Before Your Next Breeding Round
Run your pipeline math. Pull 12 months of heifer-calf births. Multiply by 0.79 for completion to first calving. Compare to herd size × your replacement rate. A 500-cow operation needing 135 heifers/yr but projecting 110 heifer calves × 0.79 ≈ 87 to first calving is roughly 48 head short for 2027–2028. Threshold: any shortfall above 10% of annual demand is a planning problem, not a shopping problem. Where it backfires: if your actual born-to-first-calving rate runs below 79%, the shortfall is bigger than your spreadsheet shows.
Audit beef-on-dairy EV at your own calf price and local heifer cost. EV_beef = your calf price × 0.57 × 0.95. EV_dairy = your heifer cost × 0.42 × 0.95 × 0.90 × 0.79. If the dairy advantage lands near $583/service, decide how many beef services you keep on viable dairy dams. You gain near-term cash. You give up future replacement inventory.
Call your heifer suppliers this week. Ask how far they’re booked and whether they’ll lock numbers 12–18 months forward. If “I’ll just buy later” is the plan, find out whether the supply actually supports that.
💡 Pro Tip — The LRP Window Opens Before the Calf Is Born
Per Farm Credit East’s October 2025 guidance, the USDA RMA’s LRP Unborn Calves program (launched July 1, 2025) lets you floor the price on beef-on-dairy crossbred calves before they hit the ground. Farm Credit East’s worked example shows coverage up to roughly $1,200/head at a post-subsidy premium near $26.20/head, based on a 95-lb target weight and a 395% price adjustment factor. Parameters vary by endorsement length, coverage level, and sale date — confirm current rates with your crop insurance agent.
Most producers miss the window because they don’t realize the coverage is available at breeding-decision time, not at weaning. If you’re making the beef-service call this month, the LRP decision is the same conversation — not a separate one six months later.
Red-flag trigger: If beef revenue runs above 10–12% of gross income (thresholds vary by lender; confirm with yours) and you aren’t carrying LRP on unborn calves, this moves to the top of the 30-day list. LRP is a U.S. RMA program; Canadian producers should consult provincial risk-management options separately. Where it backfires: LRP floors price risk, not local basis risk.
90-Day Actions — Structural Adjustments
Tier your herd and write it into SOPs. Top genetics on sexed dairy. Middle tier mixed. True terminal cows only get beef. Requires: current genomic evaluation, AI technician cooperation, a small conception-rate give-back on sexed services. Where it backfires: aggressive sexed use on a herd running below 20% 21-day preg rate can widen, not close, your pipeline gap.
Forward-book 30–40 springers for Q1 2027 delivery. Heifer developers contacted by Bullvine report contracting 12–18 months forward at typical premiums of $100–$200/head over spot, with 10–20% deposits. Converts a forced peak-market purchase into a known commitment. Where it backfires: if heifer markets soften faster than calf markets, you’re carrying an above-market forward against tighter cash flow.
Cull on profit, not habit. Keep productive older cows if SCC and repro allow. Ship chronic mastitis, repeat breeders, and low-index animals. A retained cow buys you time. She doesn’t buy you margin.
365-Day Moves — Positioning for the Next Cycle
Align your herd plan to your plant. If you’re shipping to new processing steel, decide whether you’re growing, holding, or shrinking. Pipeline, beef percentage, and culling strategy need to match that call — and the processor’s volume expectation. Opportunity signal: if your genetics and repro numbers support program qualification and your local heifer basis is tracking the $3,010 national average rather than the $4,100 peak, 30–40% beef inside a direct-feedyard program can still pencil.
Set hard floors and ceilings. Floor: the minimum beef-calf price where beef services still pencil. Ceiling: the maximum percentage of breedings you’ll put to beef on viable dairy dams. $1,660 at a $3,010 heifer is your north star; $1,931 at $3,500; $2,262 at $4,100.
Recalculate quarterly, not annually. Sexed semen, beef semen, replacement heifers, and calf markets have all moved enough in 24 months that a 2024 analysis won’t hold up in a 2026 credit file. The Pipeline Index refreshes quarterly.
The Trade-Off, Stated Plainly
Every beef service on a viable dairy dam is a near-term calf check bought with a 24-month pipeline drawdown. At a $3,010 heifer and a $500 beef calf, that trade costs roughly $583 in expected replacement value per service. At 200 services on a modeled 500-cow Panhandle herd, it’s $117,000 a year. At 4.29 million projected pipeline entries against a 9.35 million U.S. dairy cow herd and billion in new plants, it’s a national structural question. Neither number moves itself. Both settle on a specific date — when the heifer pen is supposed to be full and isn’t.
The crossover prices are the line in the dirt: $1,660 at a $3,010 heifer, $1,931 at $3,500, $2,262 at $4,100. Everything below those prices is a pipeline drawdown with a monthly calf check attached.
The 500-cow Panhandle dairy referenced throughout is an illustrative archetype, not a specific operation. The Bullvine Pipeline Index just put beef calves and replacement heifers on the same invoice — 43.5, Yellow Zone, 4.5 points from Red.
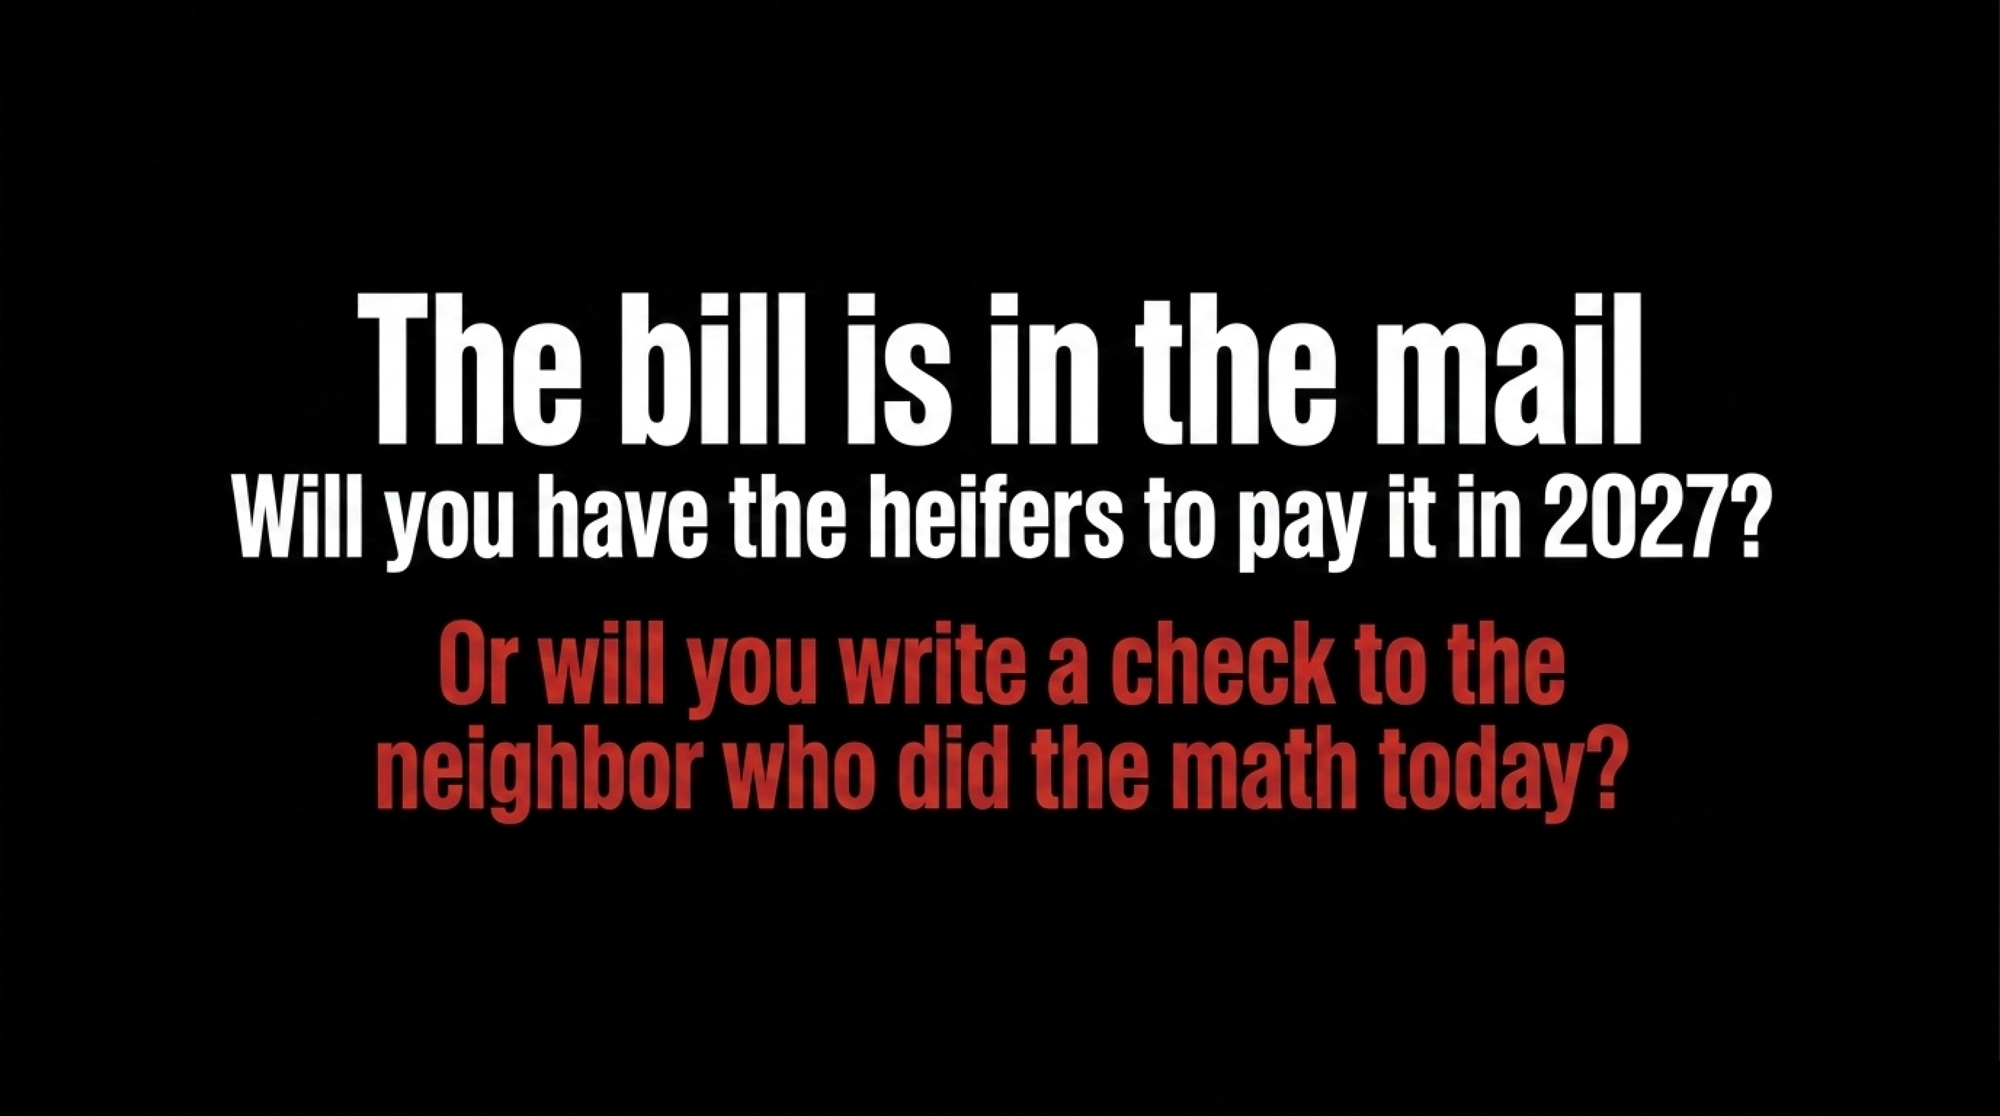
The $117,000 bill is already in the mail. The only question is whether you have the heifers to pay it in 2027, or whether you’ll be writing that check to a neighbor who saw the Yellow Zone coming.
What does your last 12 months of heifer-calf births × 0.79 actually produce — and at what beef-calf price does your own breeding sheet stop building revenue and start building a 2027 liability?
Complete references and supporting documentation are available upon request by contacting the editorial team at editor@thebullvine.com.
Beef-on-Dairy’s $3,000 Trap: 800,000 Missing Heifers and Who Pays the Bill — Exposes the 800,000-head replacement hole already baked into the 2027 dairy calendar. Mastering this market intelligence allows you to navigate $4,100 price tags and secure elusive processor partnerships before the supply-chain window slams shut.
The Missing Piece in Genomic Selection: Why the Best Herds Still Walk the Pens — Dismantles the “spreadsheet-only” approach to breeding by layering physical structural checks over genomic proofs. Leveraging this hybrid method keeps cows producing into their fourth lactation, effectively slashing your annual heifer replacement draw by 15 percent.
The Sunday Read Dairy Professionals Don’t Skip.
Every week, thousands of producers, breeders, and industry insiders open Bullvine Weekly for genetics insights, market shifts, and profit strategies they won’t find anywhere else. One email. Five minutes. Smarter decisions all week.
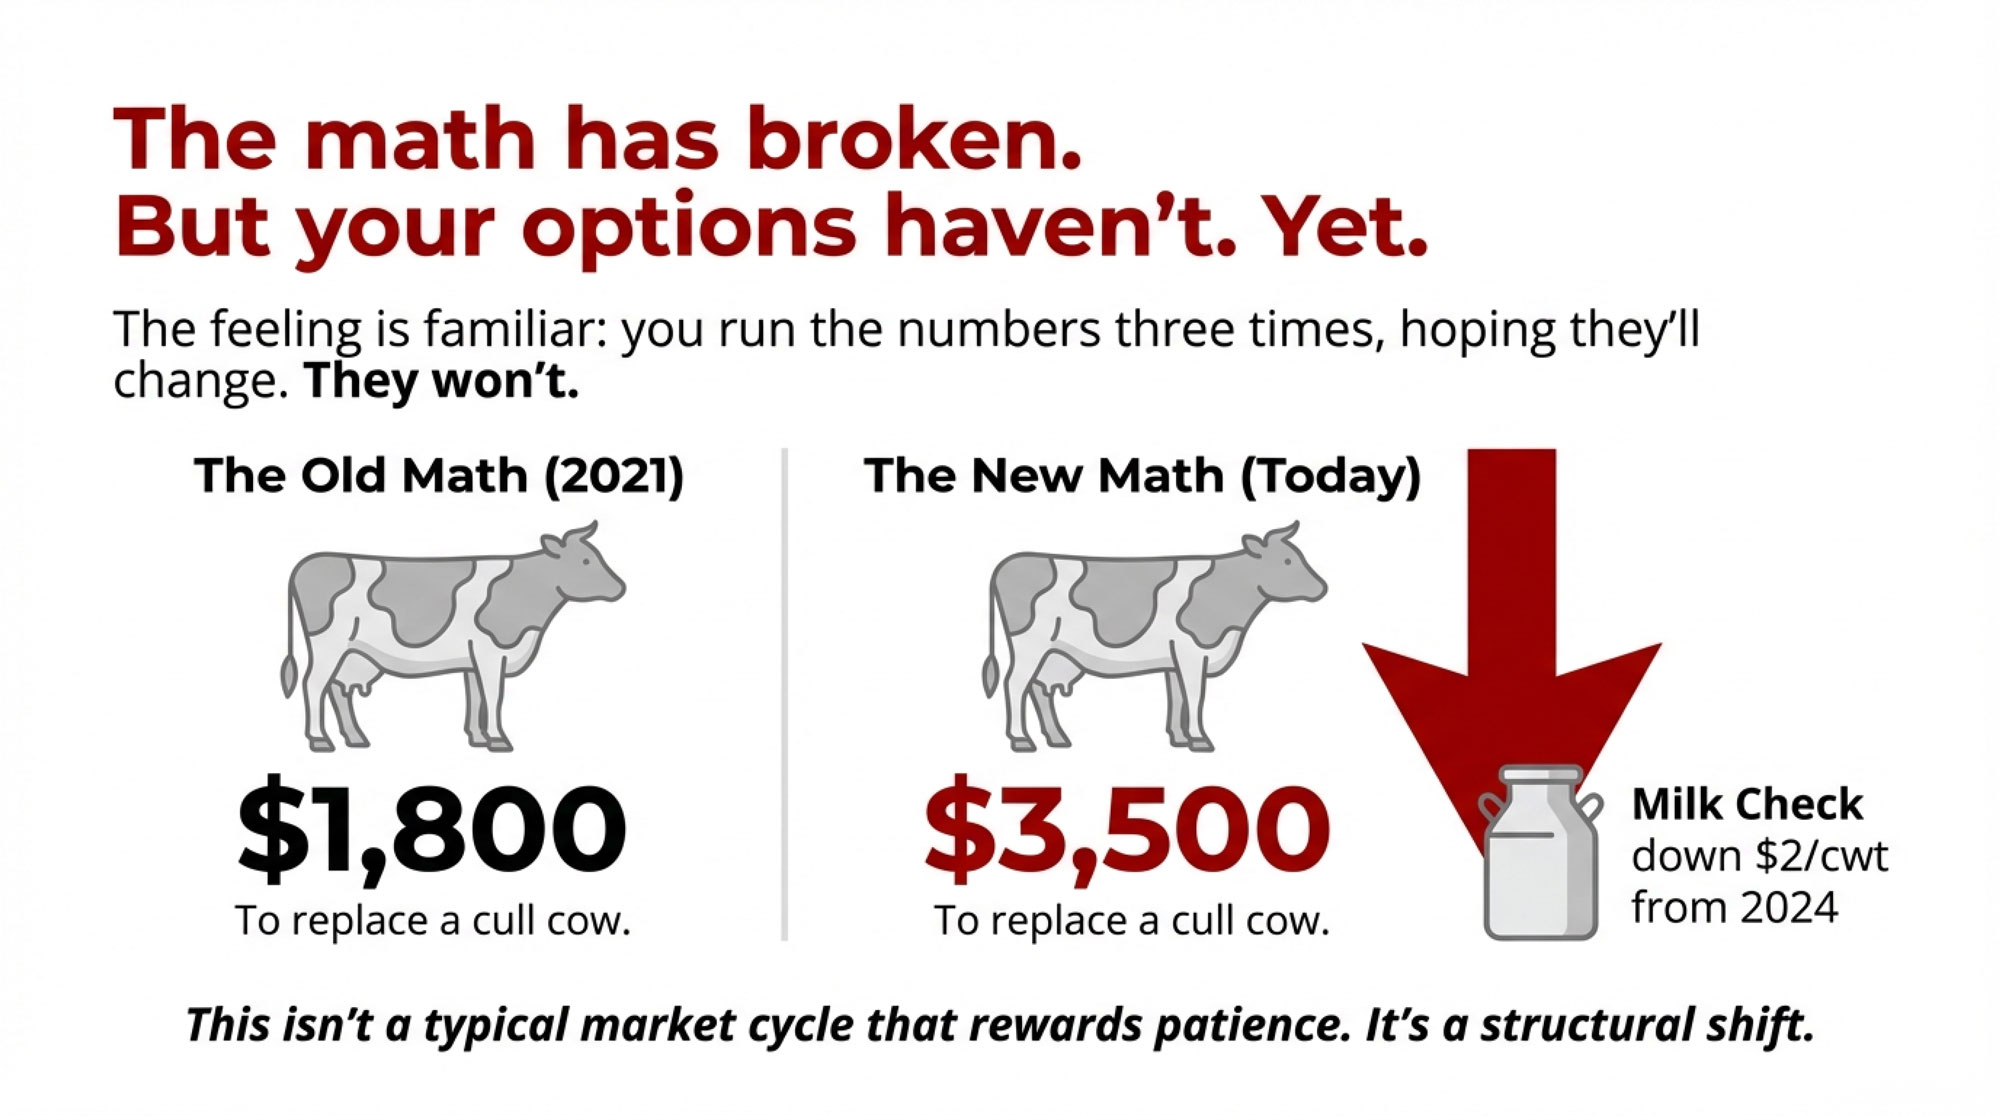
You’ve run the numbers three times, hoping they’d change. They won’t. For 300-1,000 cow dairies, the math has broken—but your options haven’t. Yet.
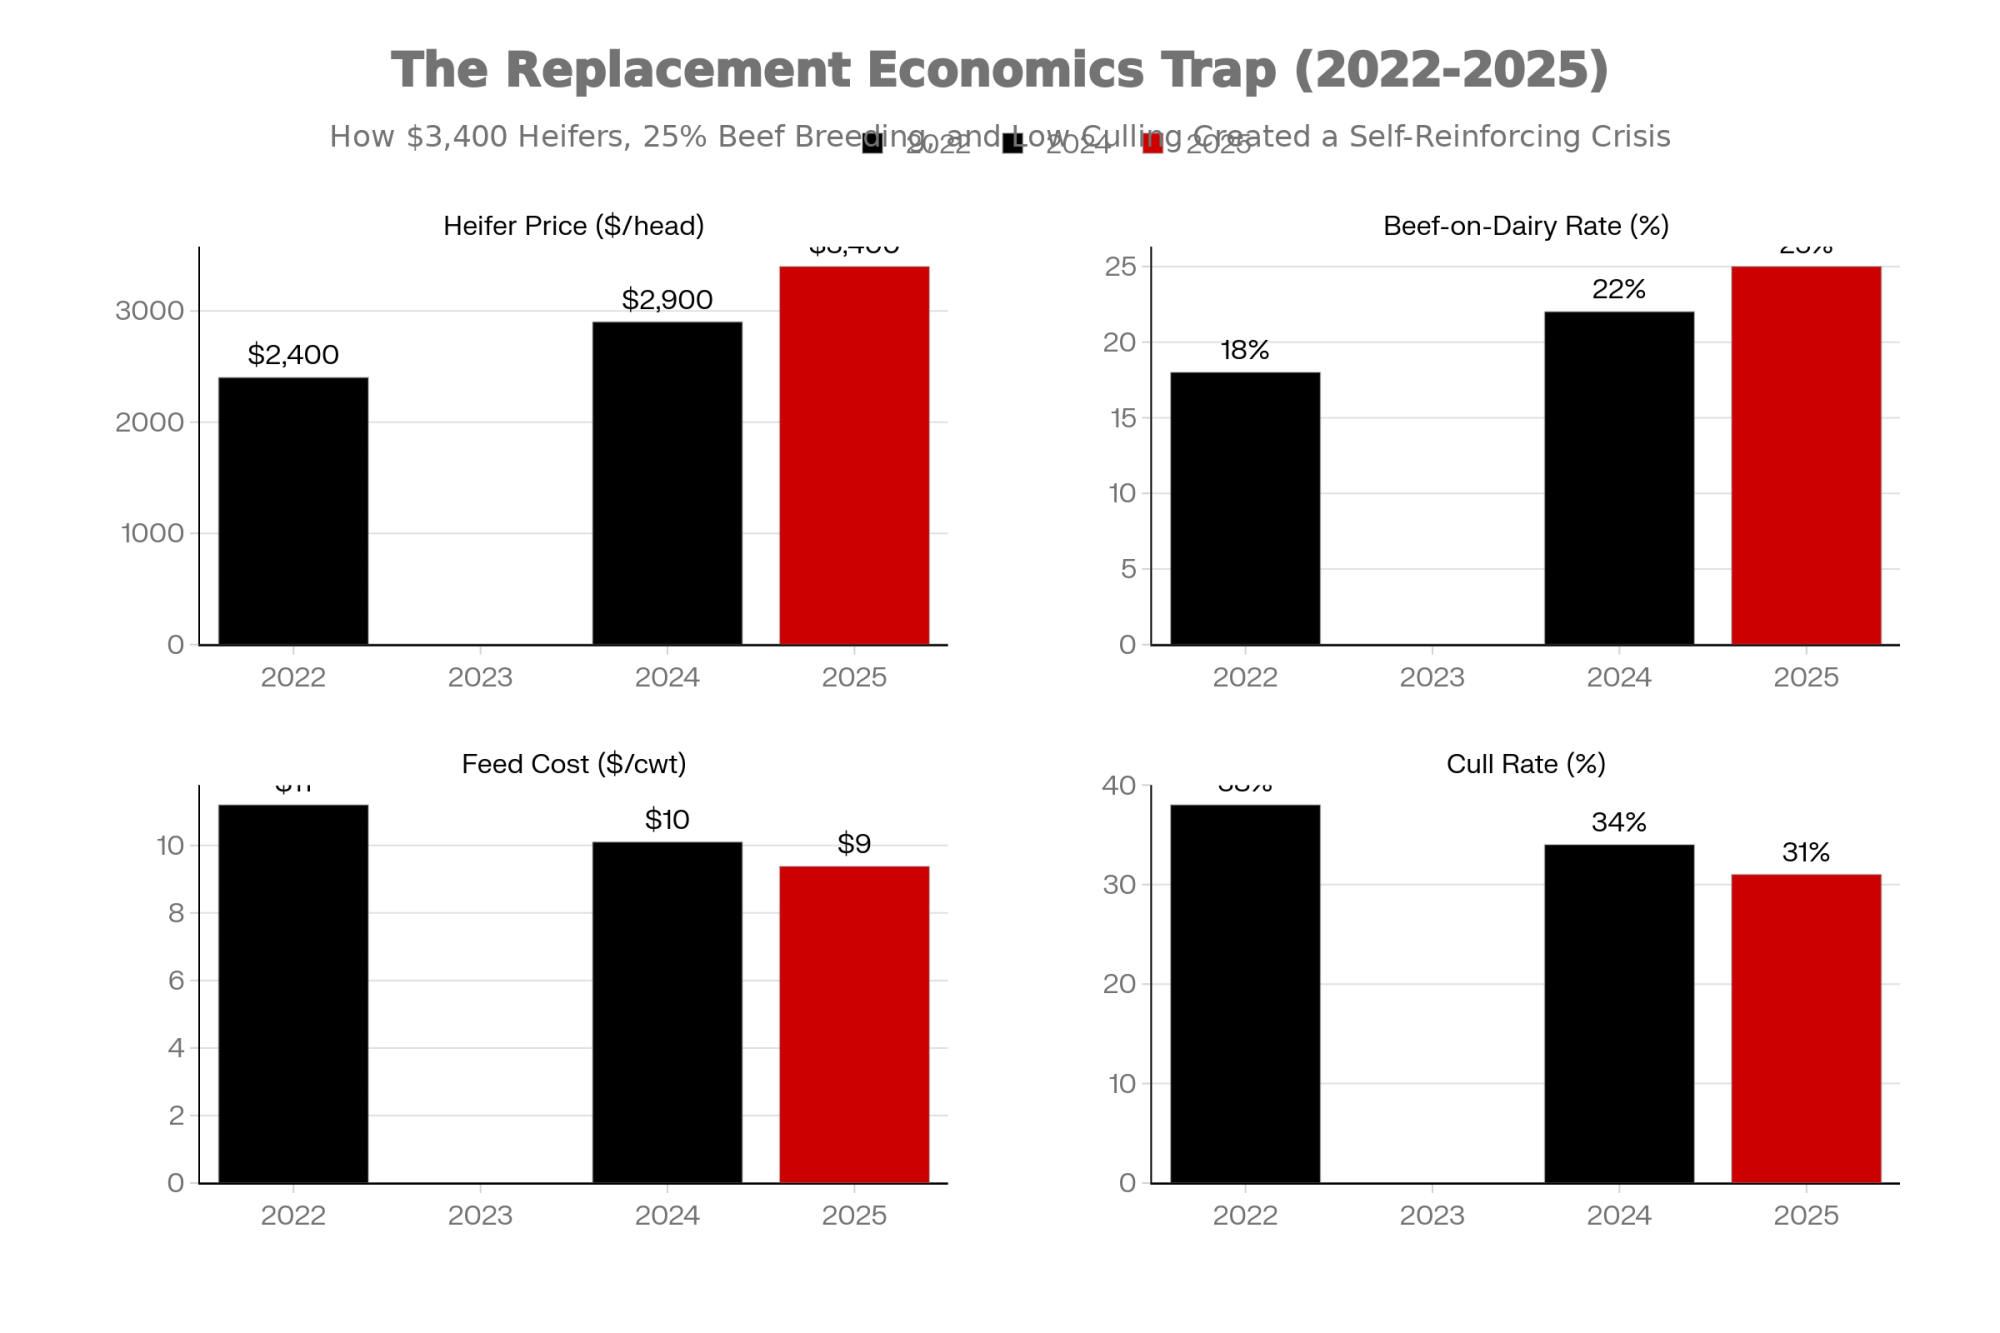
Executive Summary: The economics that sustained mid-size dairy farming are disappearing faster than most producers realize. Heifer prices have tripled since 2019, milk is down $2/cwt from 2024, and component pricing is shifting from butterfat to protein—meaning genetics selected two years ago are now optimized for a vanishing market. For 300-1,000 cow operations, this creates a structural squeeze: too large for specialty positioning, too small for automation to be economically viable. With USDA reporting the lowest heifer inventory since 1978 and Rabobank projecting 2,800 farm closures this year, the pressure is real and accelerating. The paths forward—organic transition, cooperative processing, strategic scaling, or well-timed exit—all require decisions within 12 months. Here’s the verified data, honest analysis, and practical framework you need to choose your path while options remain open.
You know that feeling when you run the numbers three times, hoping they’ll come out different? I was sitting with a third-generation Wisconsin dairy farmer last month, and he did exactly that—pulled out his calculator, punched in the same figures again, shook his head.
“Three years ago, I could replace a cull cow for eighteen hundred dollars and still make it work,” he told me. “Now I’m looking at thirty-five hundred, and my milk check is down almost two dollars from where it was. Something fundamental has shifted.”
He’s right. And here’s what I’ve been seeing across the industry this year: what’s happening right now isn’t a typical market cycle that rewards patience. Several structural forces are converging at once, creating conditions that favor operations at the extreme ends of the scale spectrum—the very large and the strategically small—while putting real pressure on the traditional middle that’s defined family dairy farming for generations.
I share that not to be pessimistic, but because I think you deserve honest information while meaningful options are still available. And frankly, there are options worth exploring.
What’s Actually Going On
Let me walk through what the data shows, because the way these factors connect matters as much as any single one.
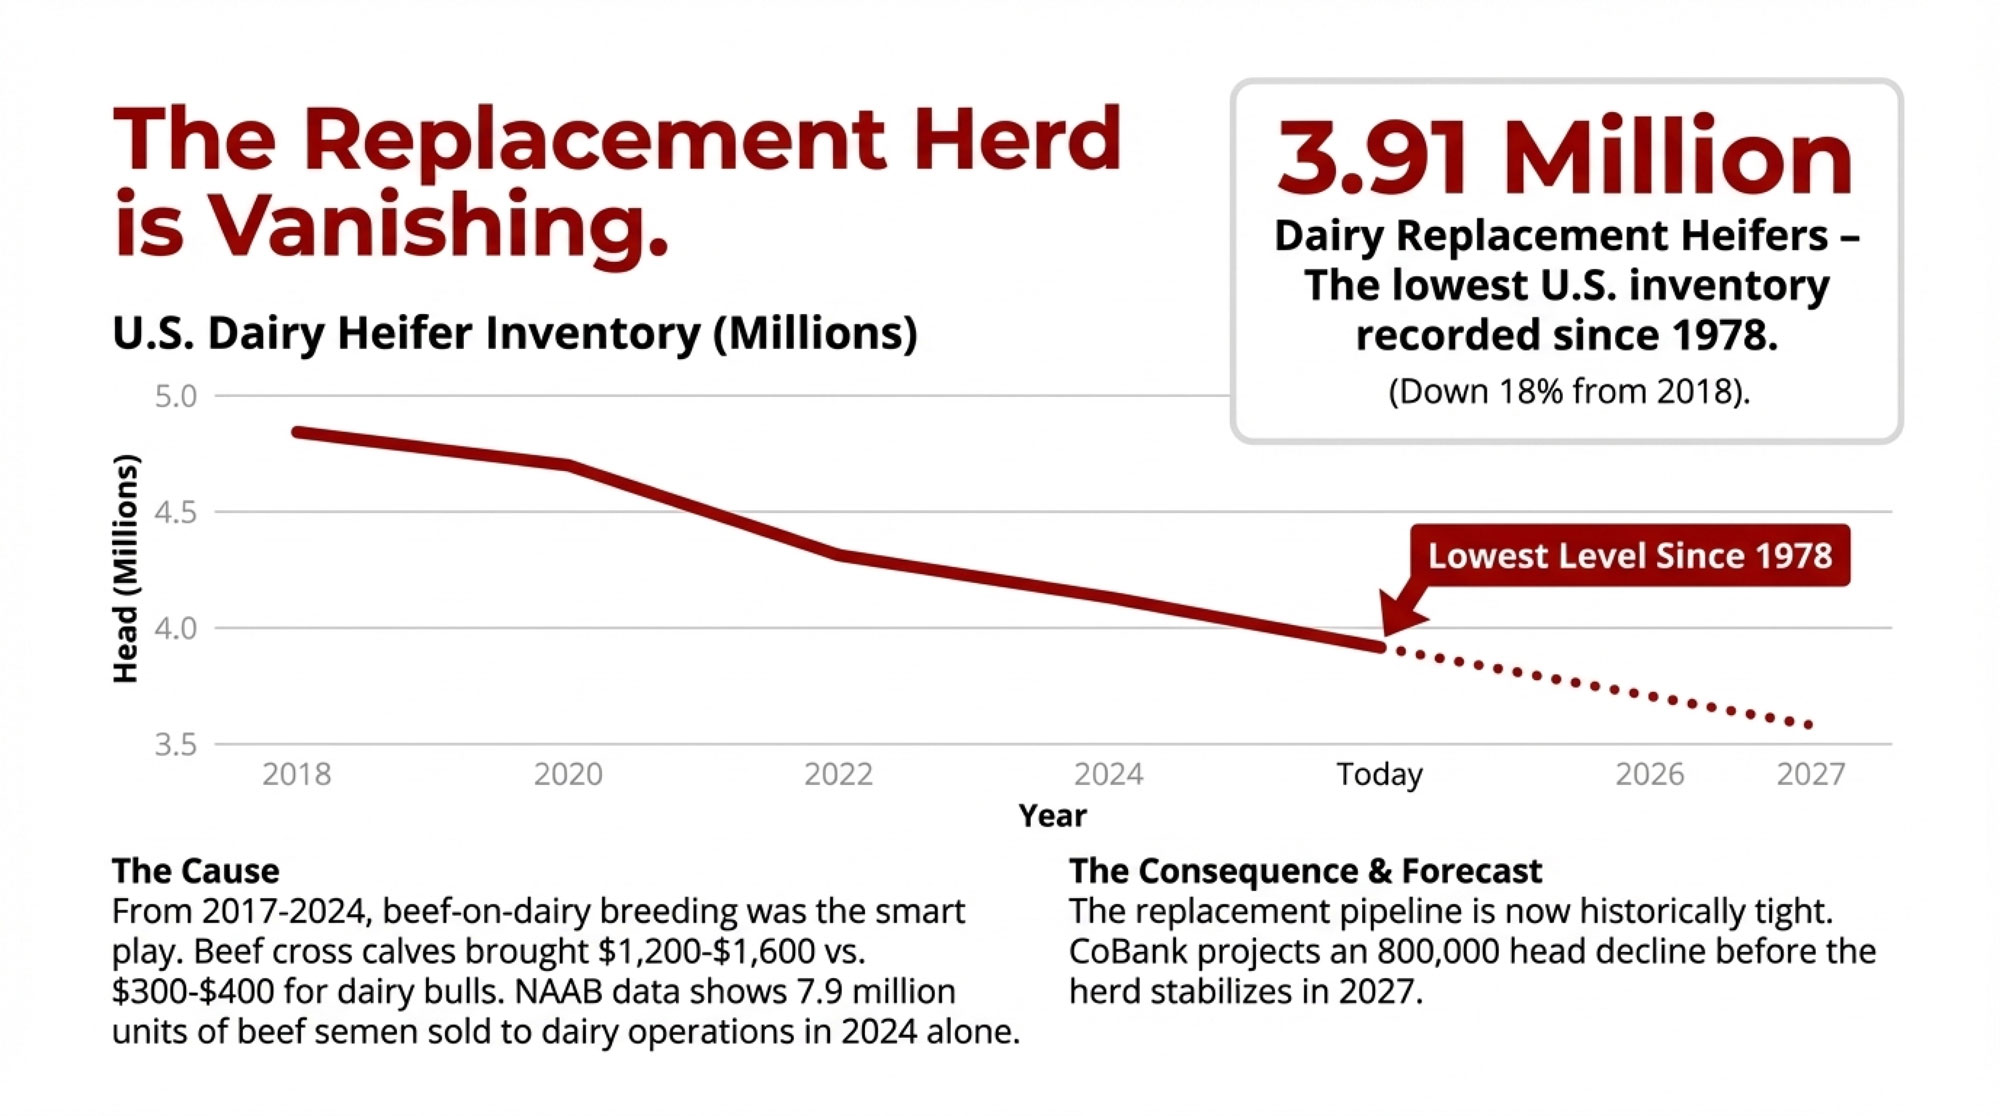
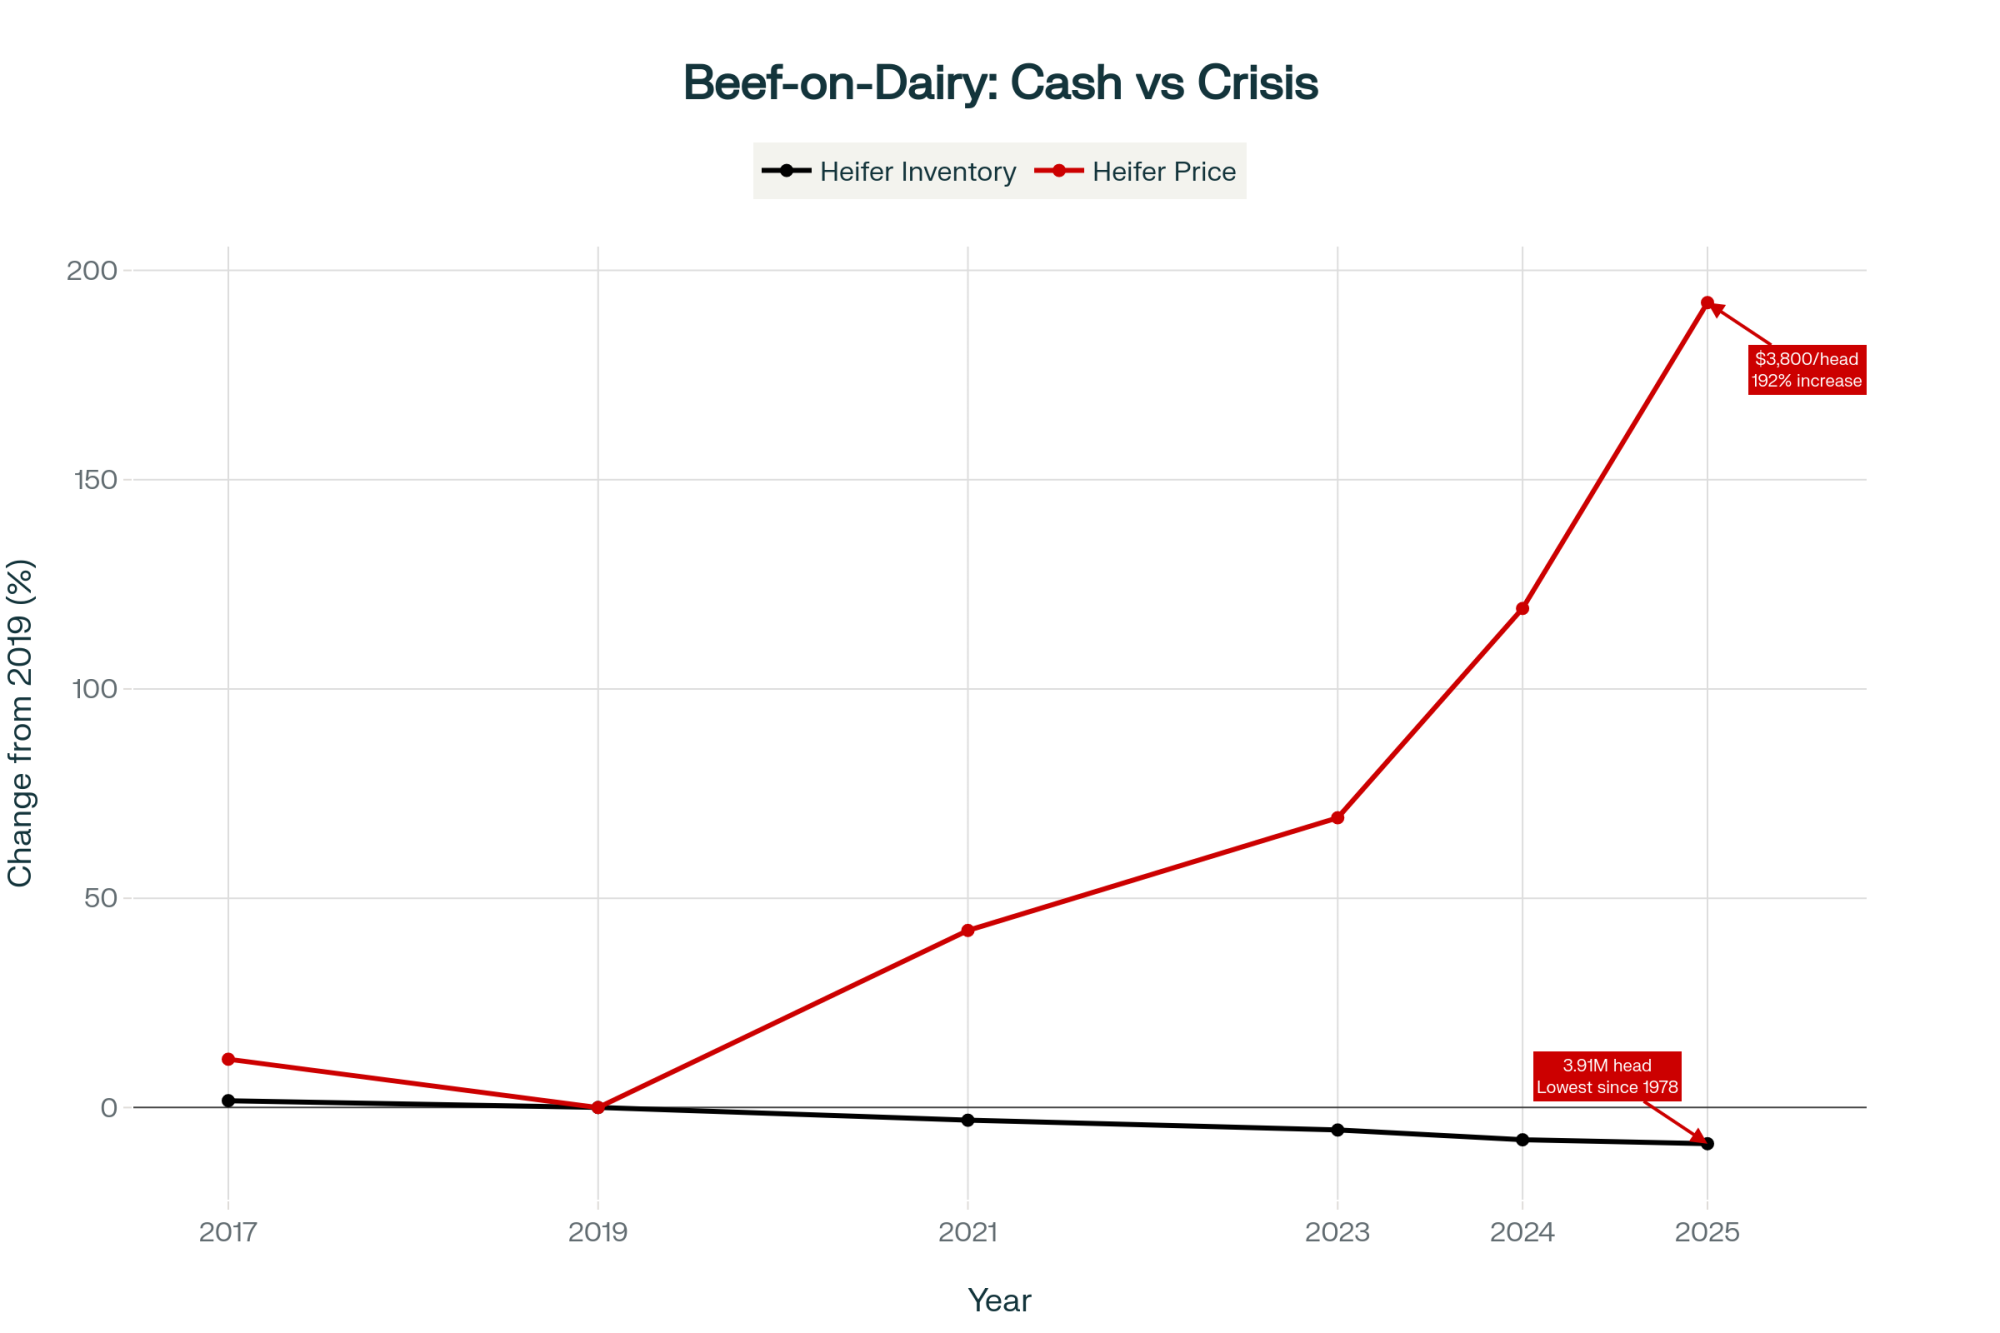
The heifer situation is tighter than most folks realize. USDA’s January 2025 cattle inventory came in at 3.91 million dairy replacement heifers—that’s the lowest level we’ve recorded since 1978. We’re down 18% from 2018 levels. CoBank’s August analysis suggests we’ll see another 800,000 head decline over the next couple of years before things stabilize, probably sometime in 2027.
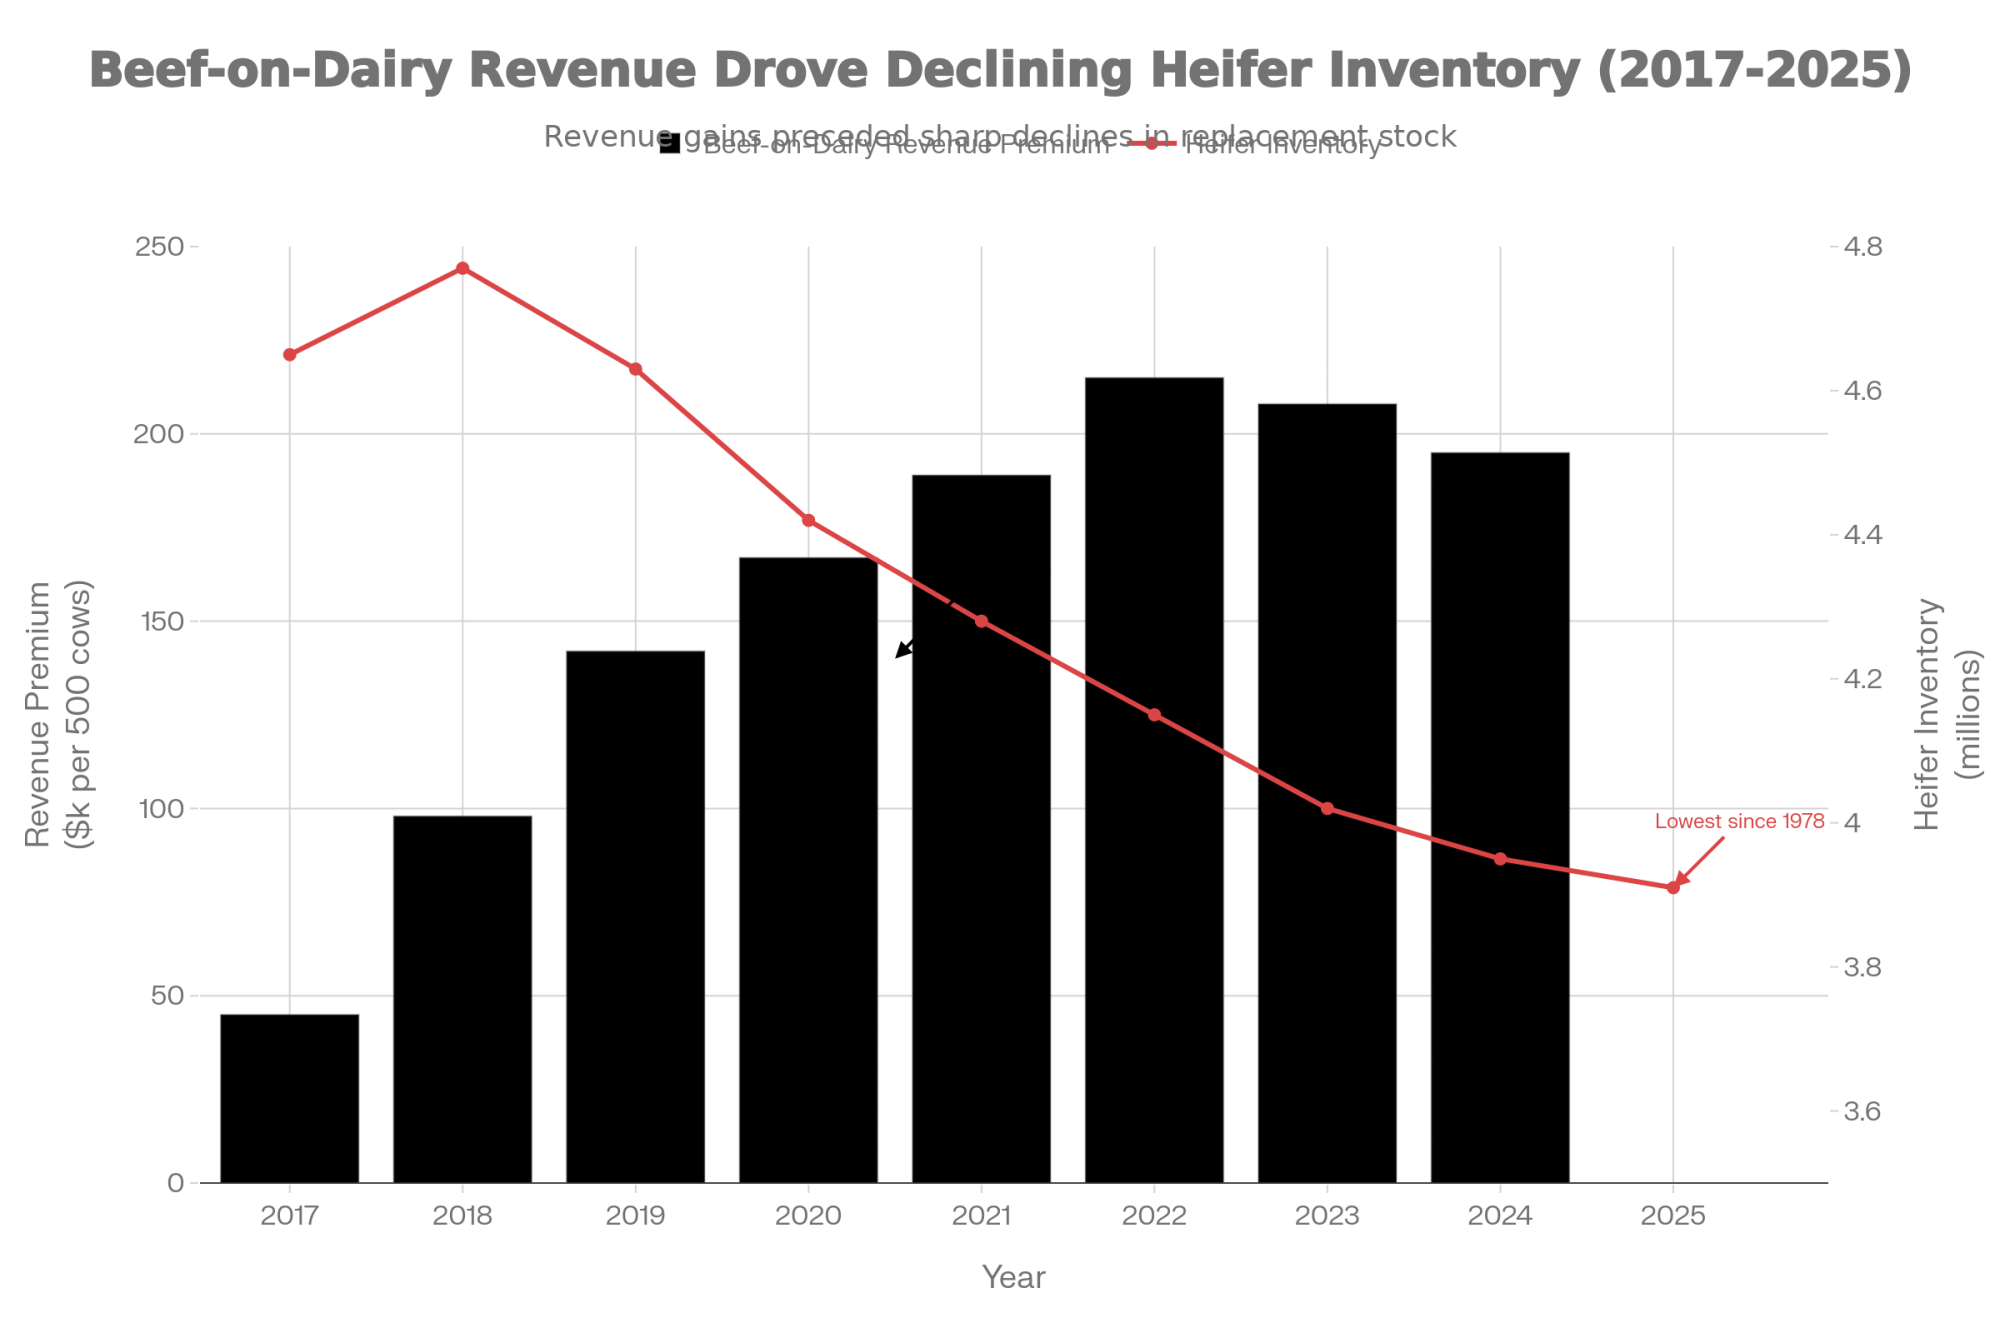
Now, here’s what’s interesting about how we got here. Between 2017 and 2024, beef-on-dairy breeding took off because the math was genuinely compelling—you probably saw this in your own operation or talked with neighbors who did. Dairy bull calves were bringing $300-$400 at auction, while those beef crossbreds commanded $1,200-$1,600. For a 500-cow operation, that difference meant an extra $200,000 or more in annual calf revenue. Hard to argue with those economics at the time. The National Association of Animal Breeders reported 7.9 million units of beef semen sold to dairy operations in 2024 alone.
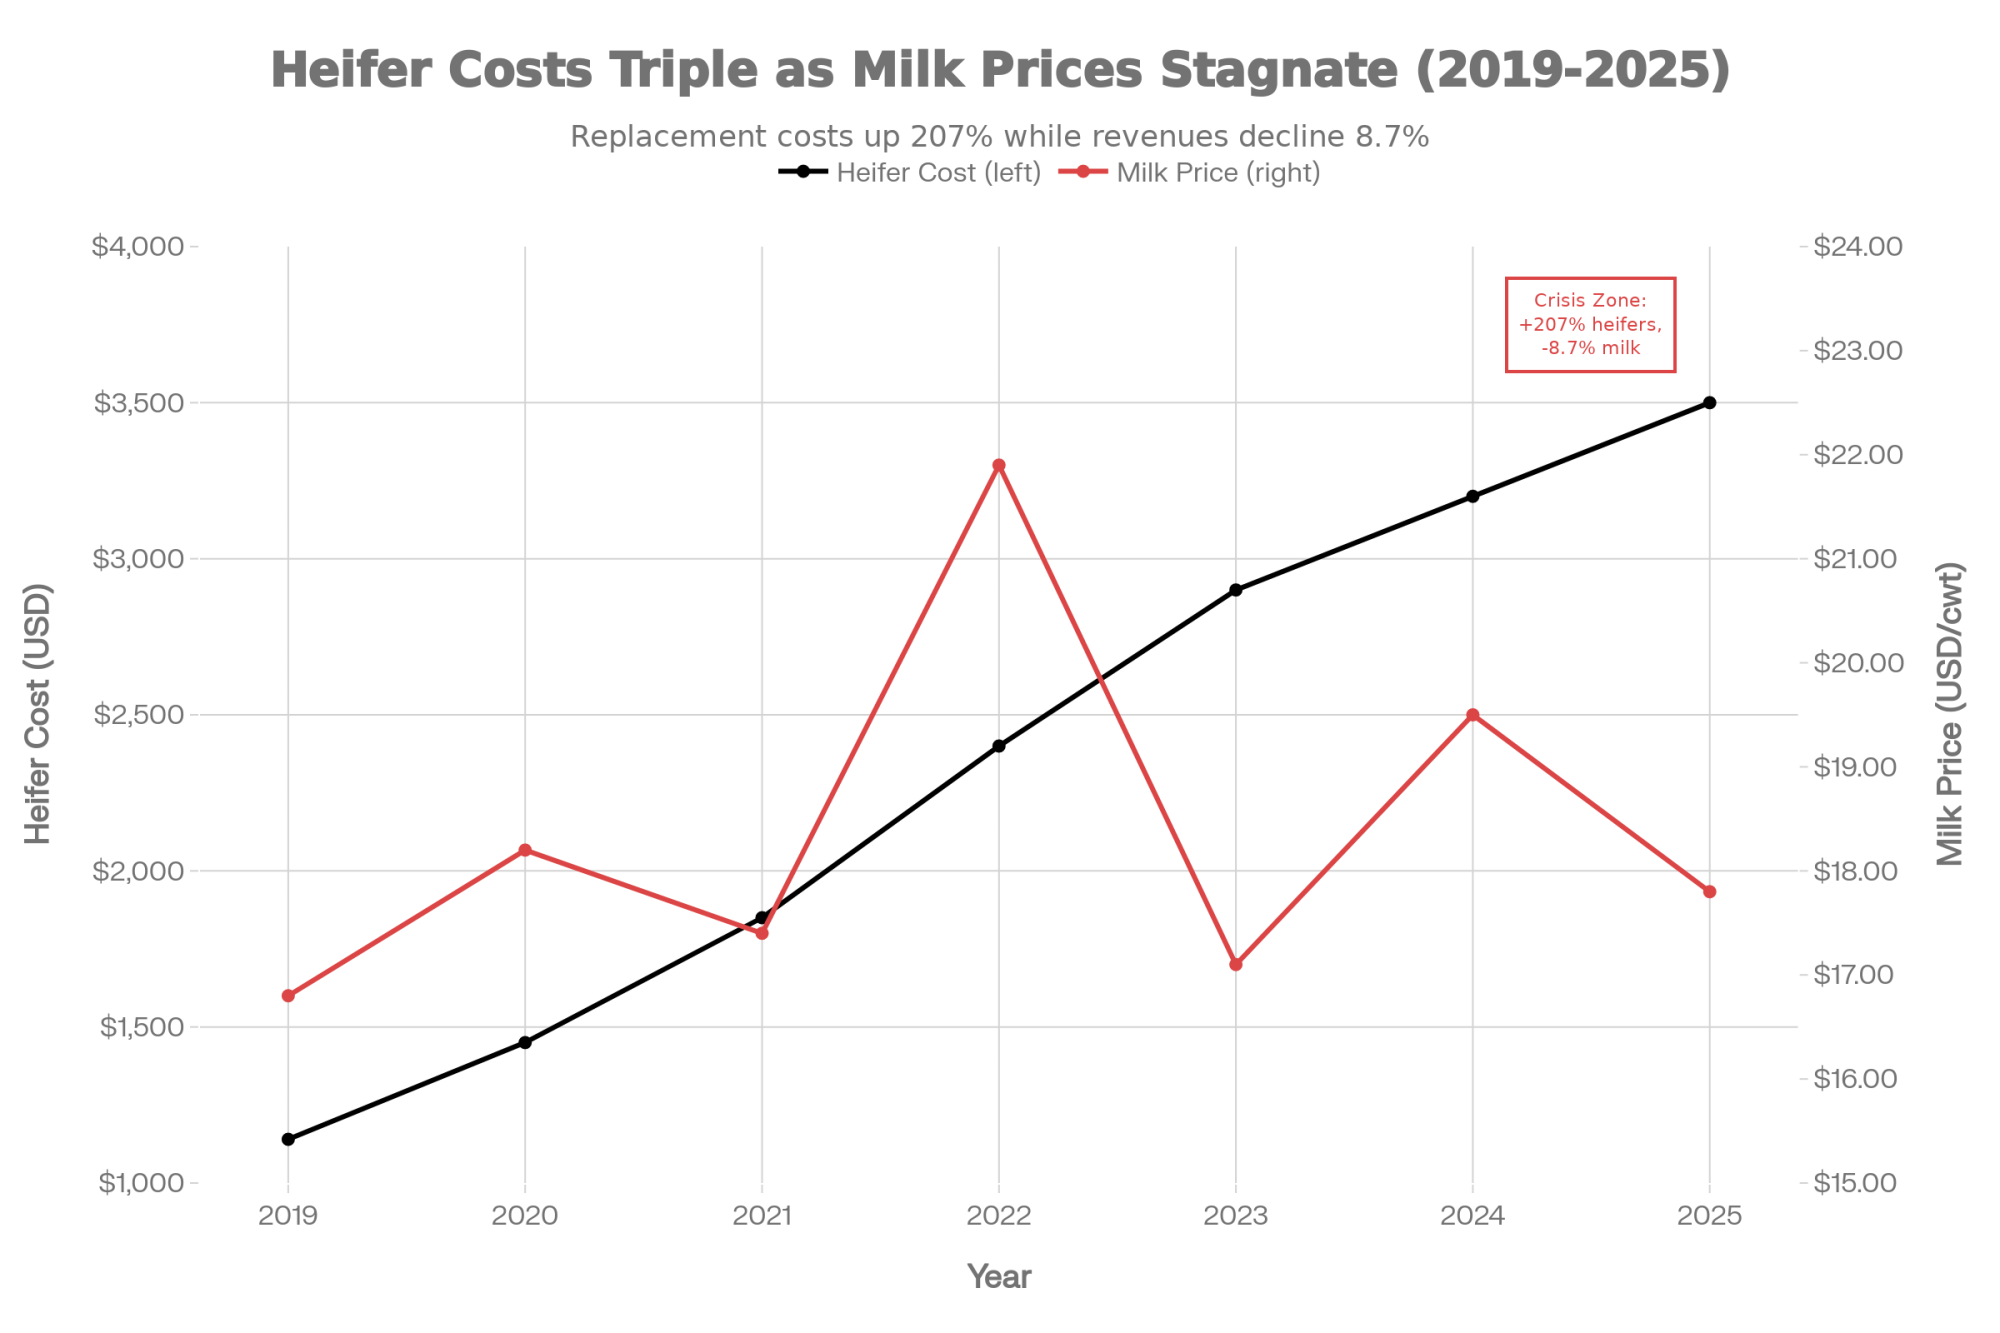
The consequence of those decisions—rational as they were—is now arriving. Heifer prices have climbed from roughly $1,140 back in 2019 to $3,000-$4,000 at current auctions. For operations trying to maintain herd size through normal culling cycles, the replacement math looks very different from what it was even two years ago.
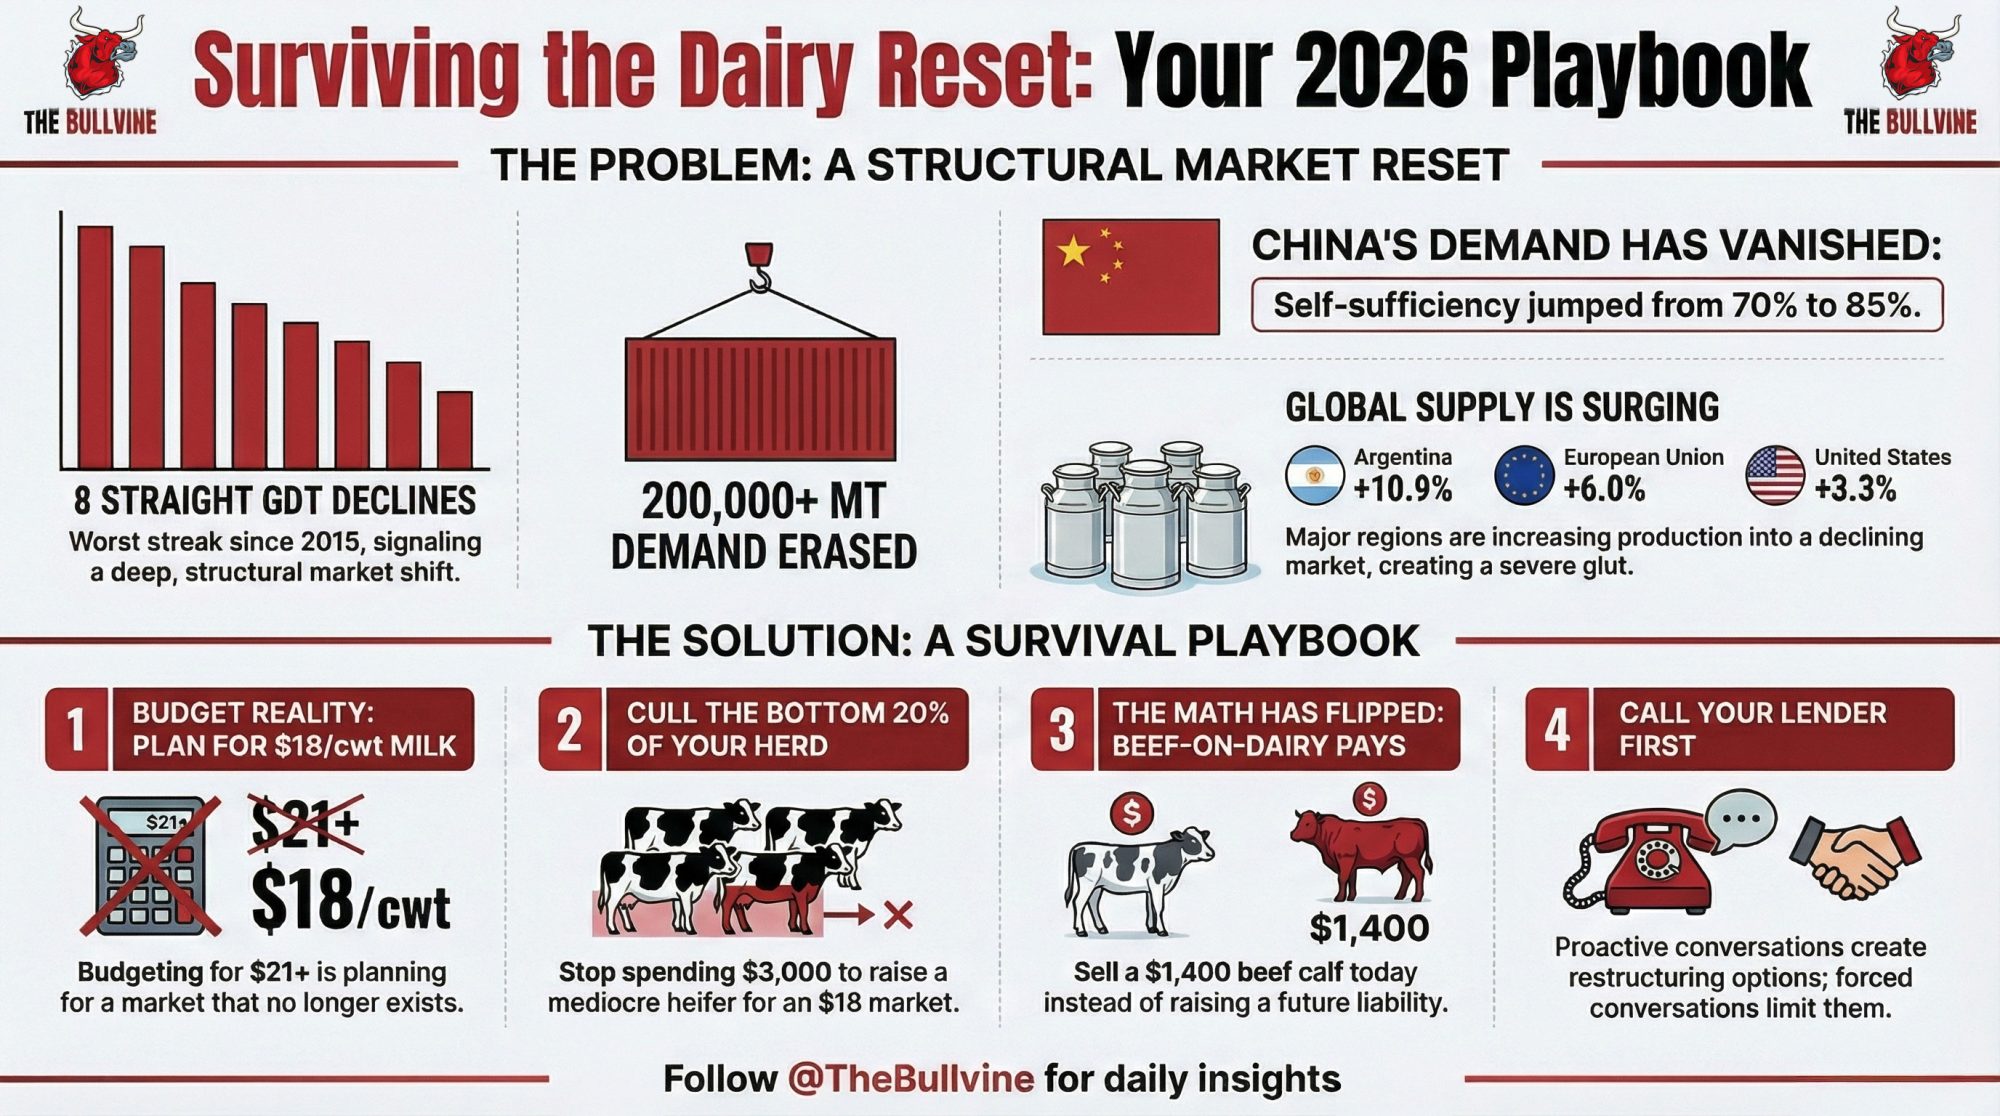
Milk pricing has found a new range. Class III has been trading in that $17-20/cwt corridor through 2025—some months dipping toward the lower end, others pushing higher, but the overall pattern sits $1.50-$2.50 below where we were in 2024. What I find myself thinking about isn’t the decline itself—we’ve all weathered price cycles. It’s the structural factors that suggest this might be more of a new baseline than a temporary dip.
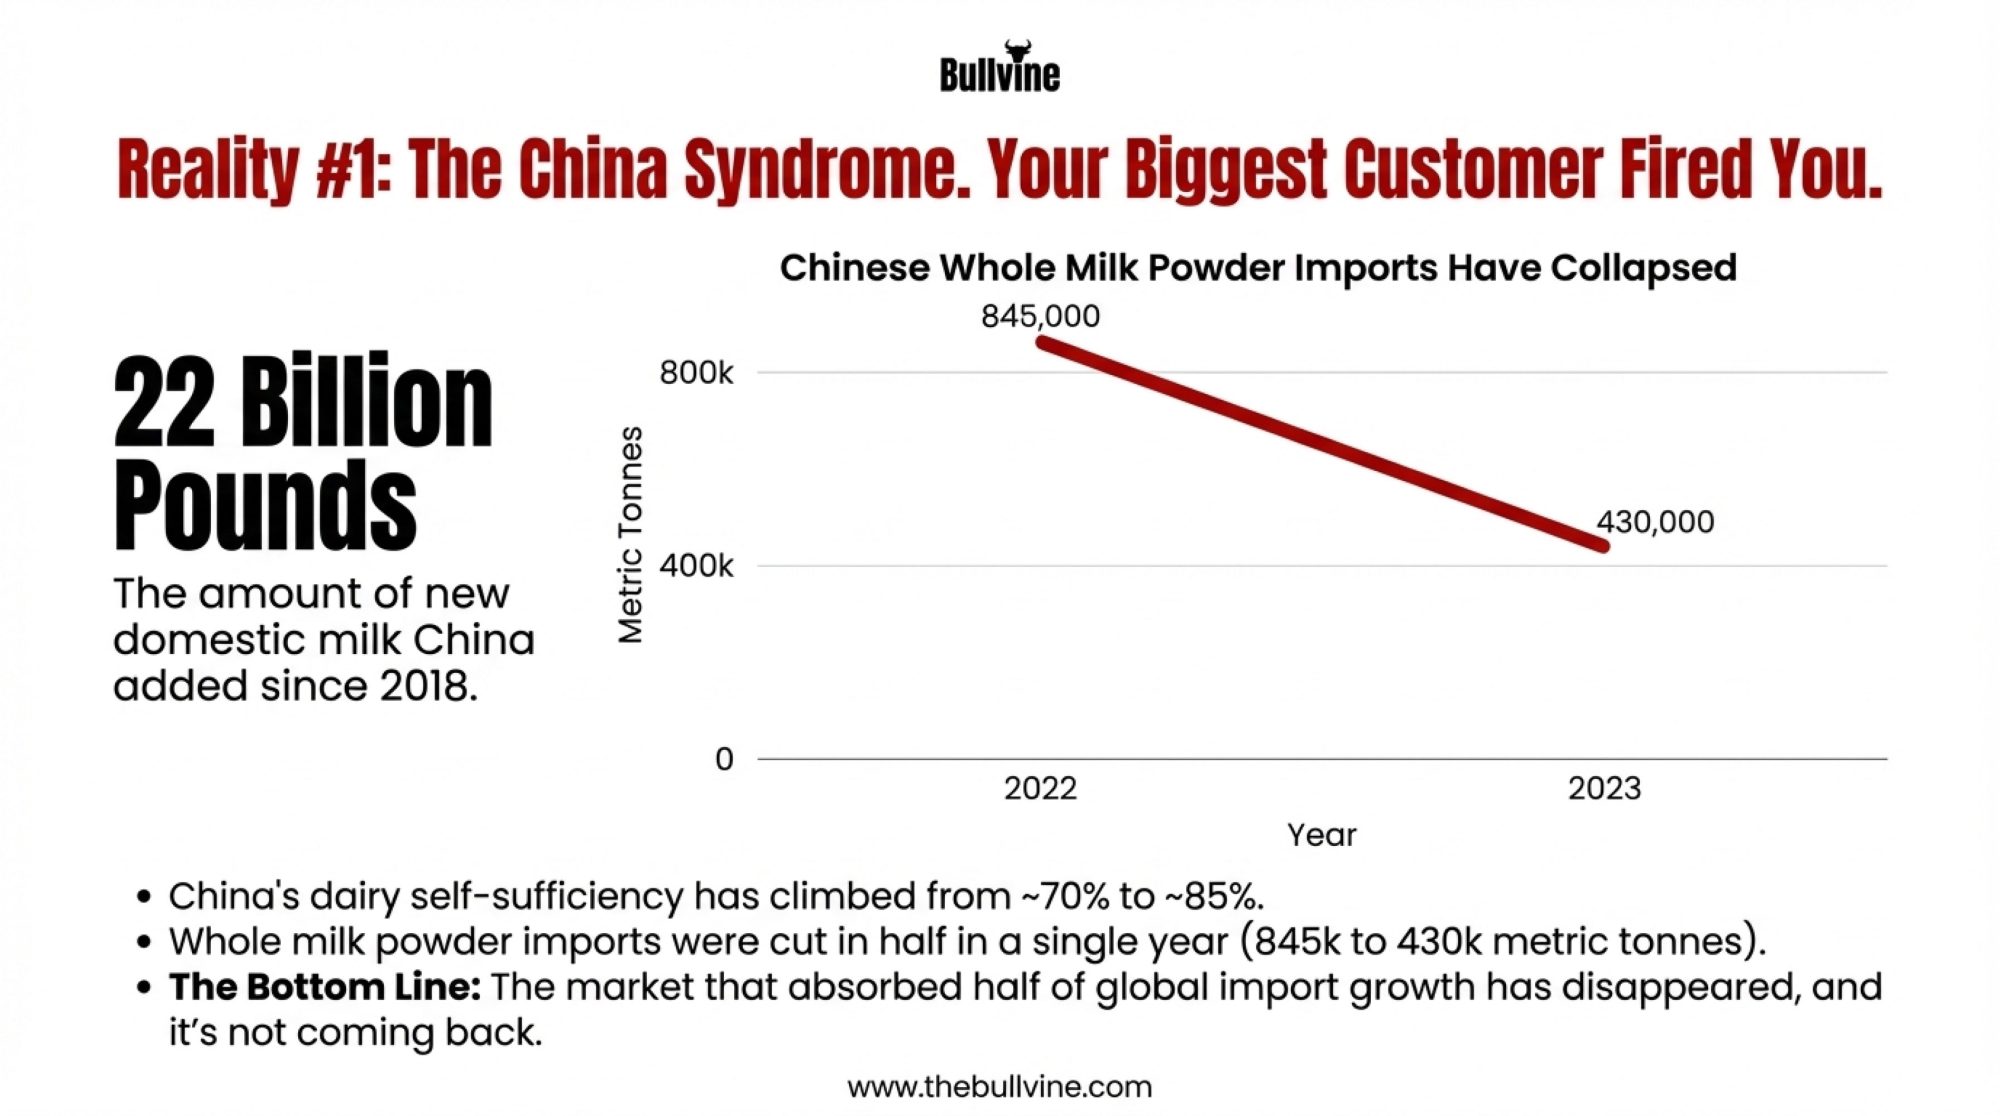
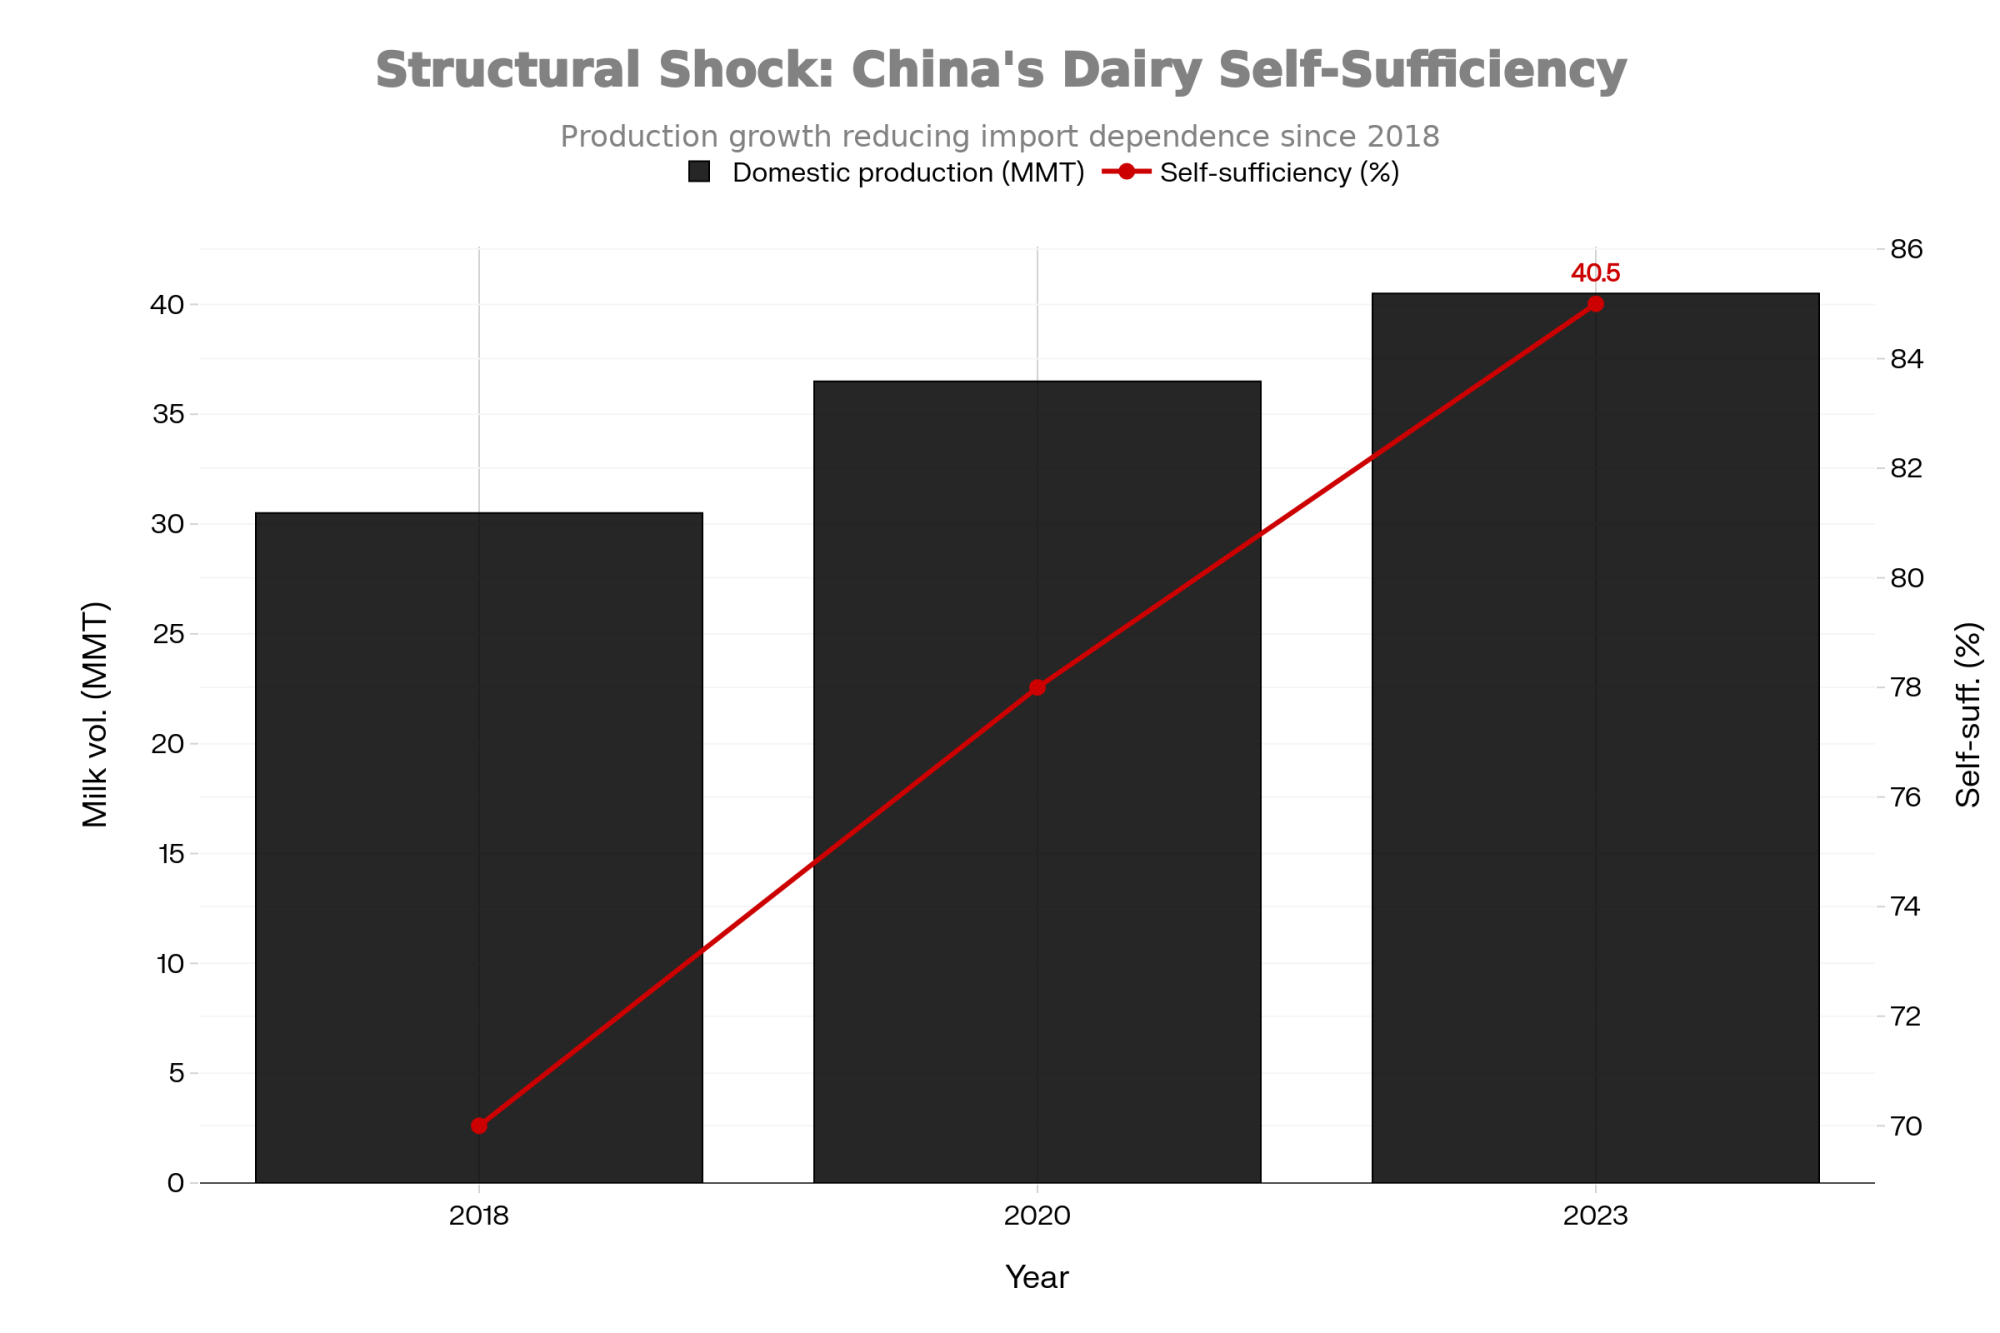
China’s domestic dairy production has expanded significantly, reaching roughly 85% self-sufficiency according to the USDA Foreign Agricultural Service tracking. That compresses what had been a growing export opportunity for U.S. producers. Meanwhile, domestic production continues to expand even as farm numbers decline—larger operations are adding capacity faster than smaller ones are exiting.
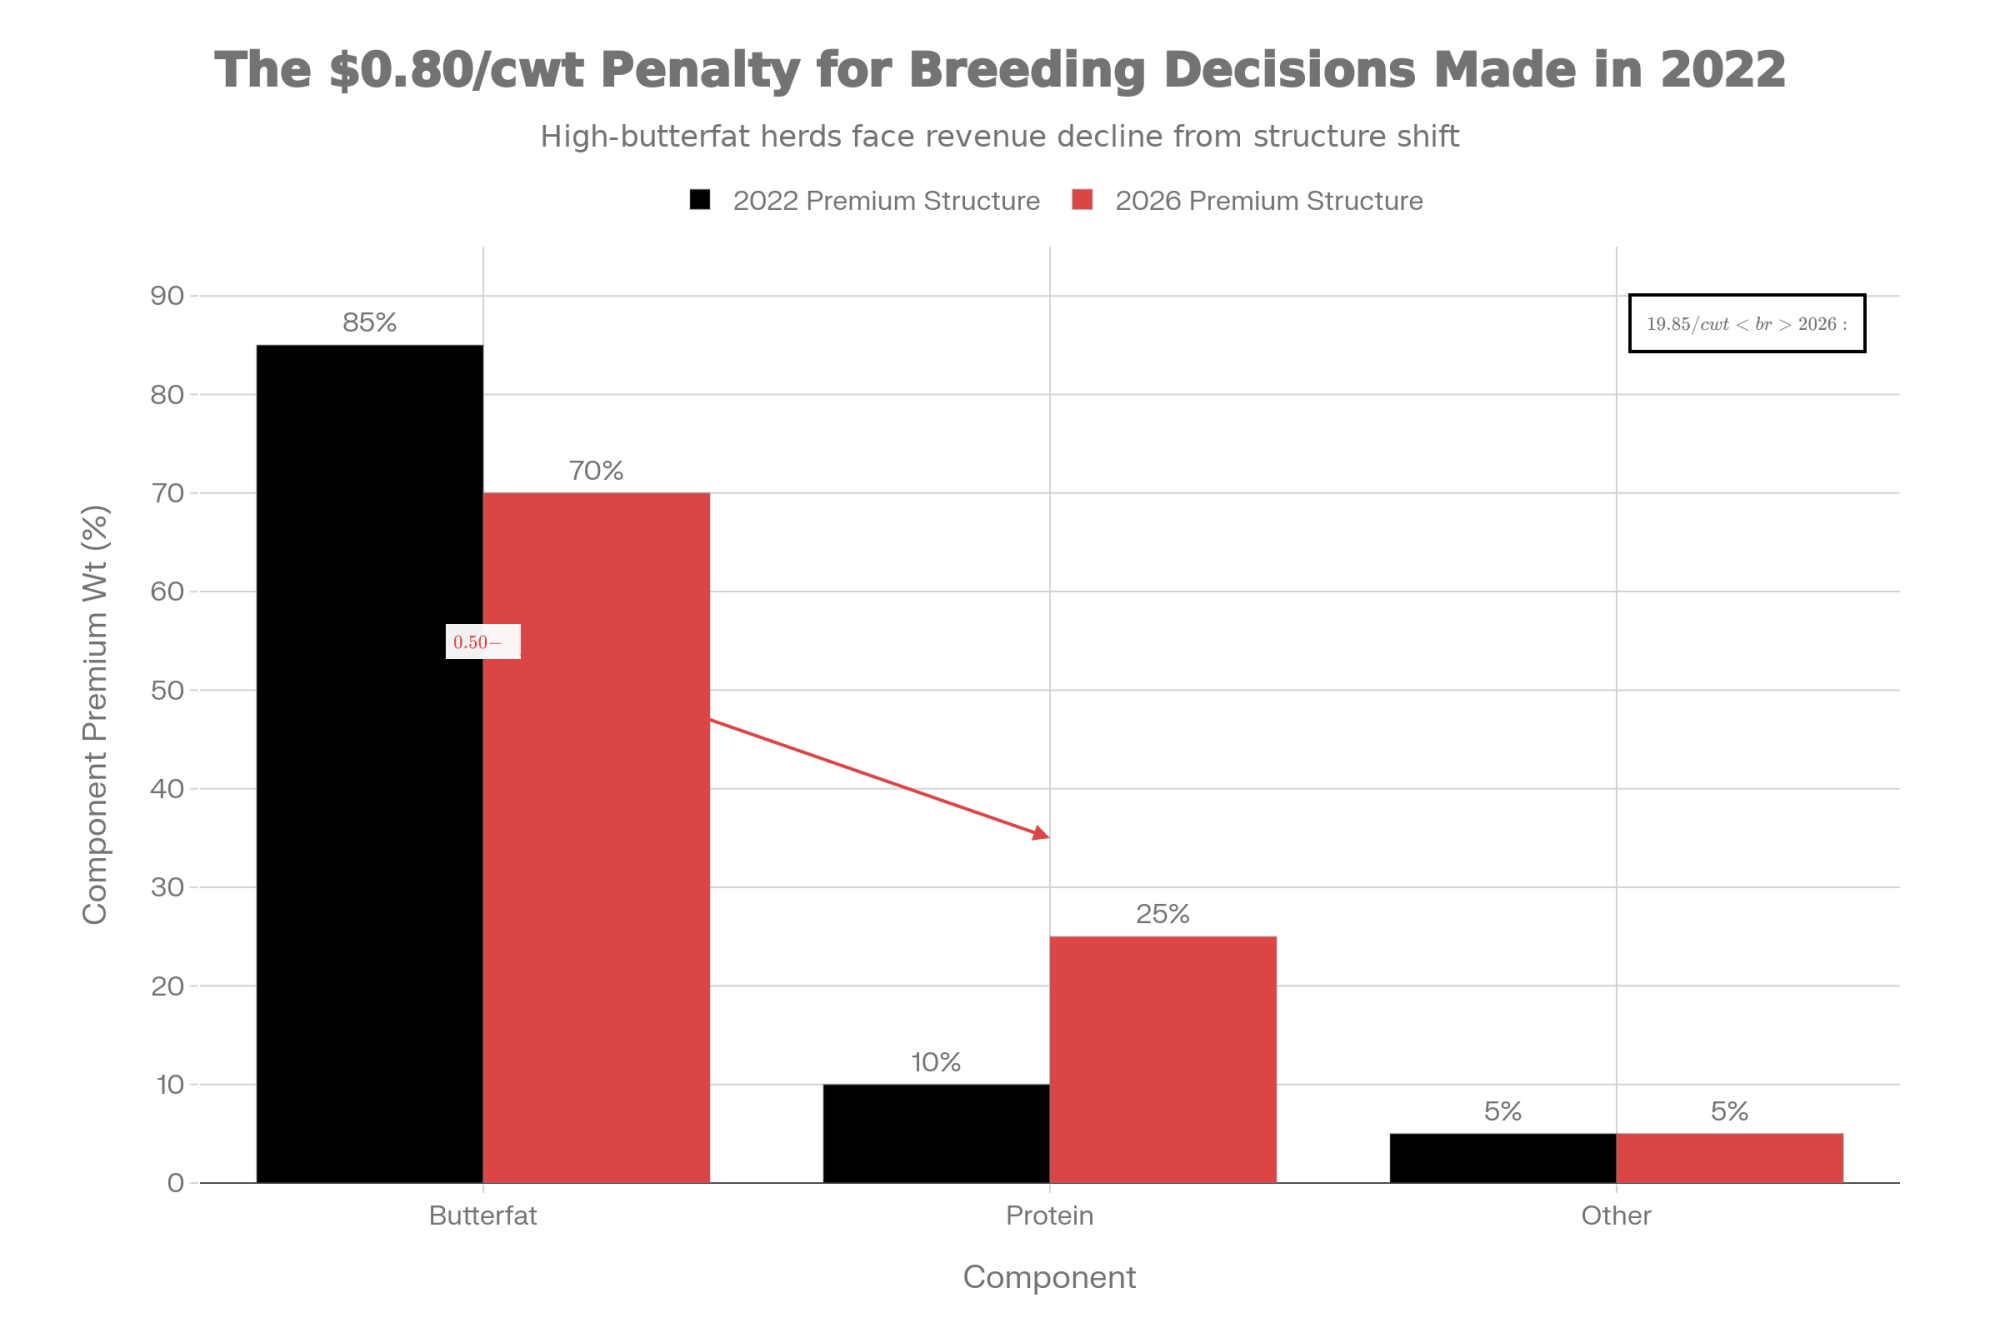
Component economics are shifting in ways that matter. This one’s been on my radar because it affects breeding decisions many of us made years ago. Western Canada’s milk marketing boards announced in October that, effective April 1, 2026, component pricing will move from roughly 85% butterfat emphasis to a 70/25/5 split that weights protein significantly higher than historical norms. You can find the details on the BC Milk Marketing Board’s website.
American processors are beginning to explore similar adjustments. Producers in Wisconsin and Minnesota have mentioned contract offers with $0.30-$0.50/cwt premiums tied to protein content above 3.4%—something that would have seemed unusual three years ago when butterfat commanded all the attention.
Why does this matter right now? Those genetic decisions we made in 2022-2023 are entering the milking herd. They were overwhelmingly butterfat-focused because that’s what the market rewarded at the time. If your tank average is still chasing butterfat because of the bulls you picked in 2022, you’re optimizing for a market that is rapidly evaporating. The premium is moving to protein.
The biological reality of a 24-36 month lag between breeding decisions and production outcomes means some operations may find themselves locked into yesterday’s pricing signals for another full cycle. It’s worth reviewing your current breeding program with this shift in mind—not panic, but awareness and action.
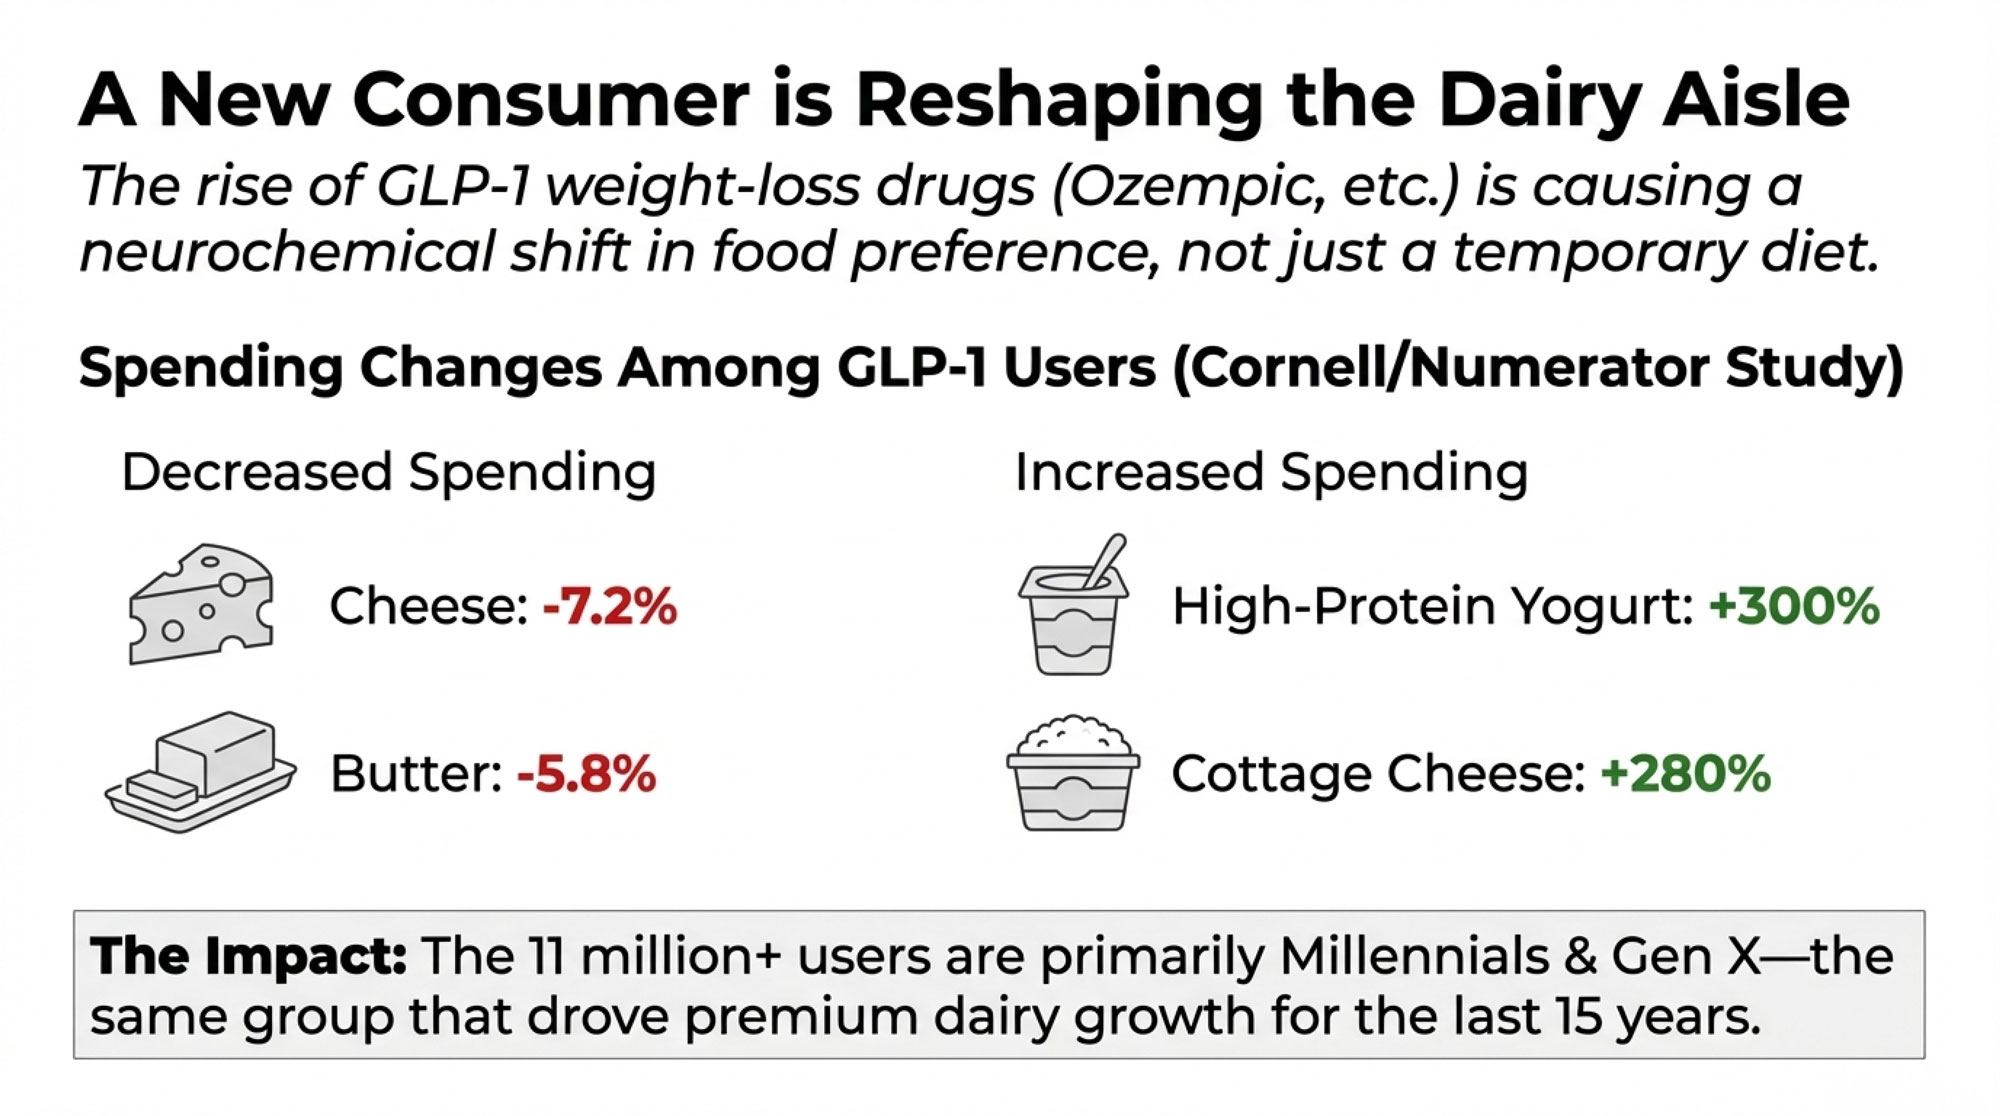
The GLP-1 Factor: A Genuine Shift in Consumer Behavior
Here’s something genuinely interesting from the demand side that I think deserves thoughtful attention.
A collaborative research effort between Cornell University and Numerator, which tracks household purchasing data across more than 100,000 households, published findings analyzing how consumers using GLP-1 weight-loss medications are changing their eating habits. The patterns were notable:
Cheese spending down 7.2%
Butter down 5.8%
Ice cream down 5.5%
High-protein yogurt up nearly triple
Cottage cheese purchases up 280%
As of mid-2025, IQVIA data shows approximately 11 million Americans are actively using GLP-1 medications, with that number steadily increasing. Now, there’s been confusion about Medicare coverage—let me clarify what actually happened. The Trump administration declined to extend Medicare coverage for weight-loss-only indications back in April 2025. But commercial coverage continues expanding, costs are moderating, and most healthcare analysts expect the user base to keep growing through 2026.
What makes this different from typical diet trends is the underlying mechanism. These medications don’t just suppress appetite temporarily—they appear to shift food preferences by affecting dopamine pathways.
“Users report that high-fat foods simply become less appealing. That’s a different kind of demand pattern.”
We’re not talking about willpower or temporary restriction. We’re talking about neurochemical changes that persist as long as patients remain on medication—and many of these drugs are prescribed long-term.
The demographic profile matters too. According to the Numerator data, 71% of GLP-1 users taking these drugs for weight loss are Millennials or Gen X—the same consumer groups that drove premium dairy category growth over the past fifteen years.
What’s encouraging is the flip side of this data: protein-focused dairy is growing dramatically. Operations positioned to serve that demand—high-protein yogurt, cottage cheese, protein-enhanced products—are seeing real opportunity. The question becomes whether your operation can participate in that shift.
Labor Economics: A Threshold Worth Understanding
Farms have always dealt with labor challenges—that’s nothing new. But the current cost structure warrants careful examination.
The H-2A program restructuring established tiered wage requirements. In Michigan—a reasonable proxy for Midwest dairy regions—the Adverse Effect Wage Rate for experienced agricultural workers is $18.15/hour, according to Department of Labor data. But that base wage significantly understates actual costs.
Once you factor in employer-provided housing (required under H-2A), transportation, insurance, payroll taxes, and turnover replacement costs… many operations I’ve talked with are seeing all-in costs of $19-$21/hour. A 600-cow dairy requiring 2.5 full-time-equivalent milking positions now faces annual labor costs exceeding $140,000 just for parlor staffing.
What’s interesting is how this interacts with scale. Larger operations spread specialized positions across more cows, reducing per-unit labor cost. They can also more readily justify automation investments—which brings me to a topic that deserves nuanced discussion.
The Automation Question at Different Scales
The numbers here tell a more complicated story than equipment marketing materials often suggest.
For a 100-130 cow operation, a two-robot system (Lely, DeLaval, or comparable) plus barn modifications, feed integration, and installation runs somewhere in the $430,000-$740,000 range based on late 2025 dealer quotes. That’s getting fully operational with adequate support infrastructure.
For a 600-cow dairy, you’re looking at 8-10 robots minimum—now we’re talking $1.5-$2.5 million in total investment. The per-cow economics shift dramatically depending on how that fixed cost gets distributed.
Industry research and extension analyses suggest payback periods vary significantly with herd size. Smaller operations often face 15-20+ year payback at current financing rates, while larger operations with 2,000+ cows may achieve returns in under 10 years. These aren’t hard rules—individual circumstances matter enormously—but the pattern is worth understanding.
And there’s the financing dimension. A dairy lender I spoke with (he asked to remain anonymous, given client relationships) put it directly: “We’re looking at debt service coverage ratios very carefully. A producer comes in wanting financing for robotics, but their margins have compressed significantly over the past two years. That’s a challenging loan to structure, even when the long-term investment thesis makes sense.”
This isn’t to say automation is wrong for mid-size operations—some are making it work beautifully. But the economics require an honest assessment of your specific situation.
What Processors Are Building Toward
The processing side of this equation often gets discussed abstractly. Let me make it more concrete.
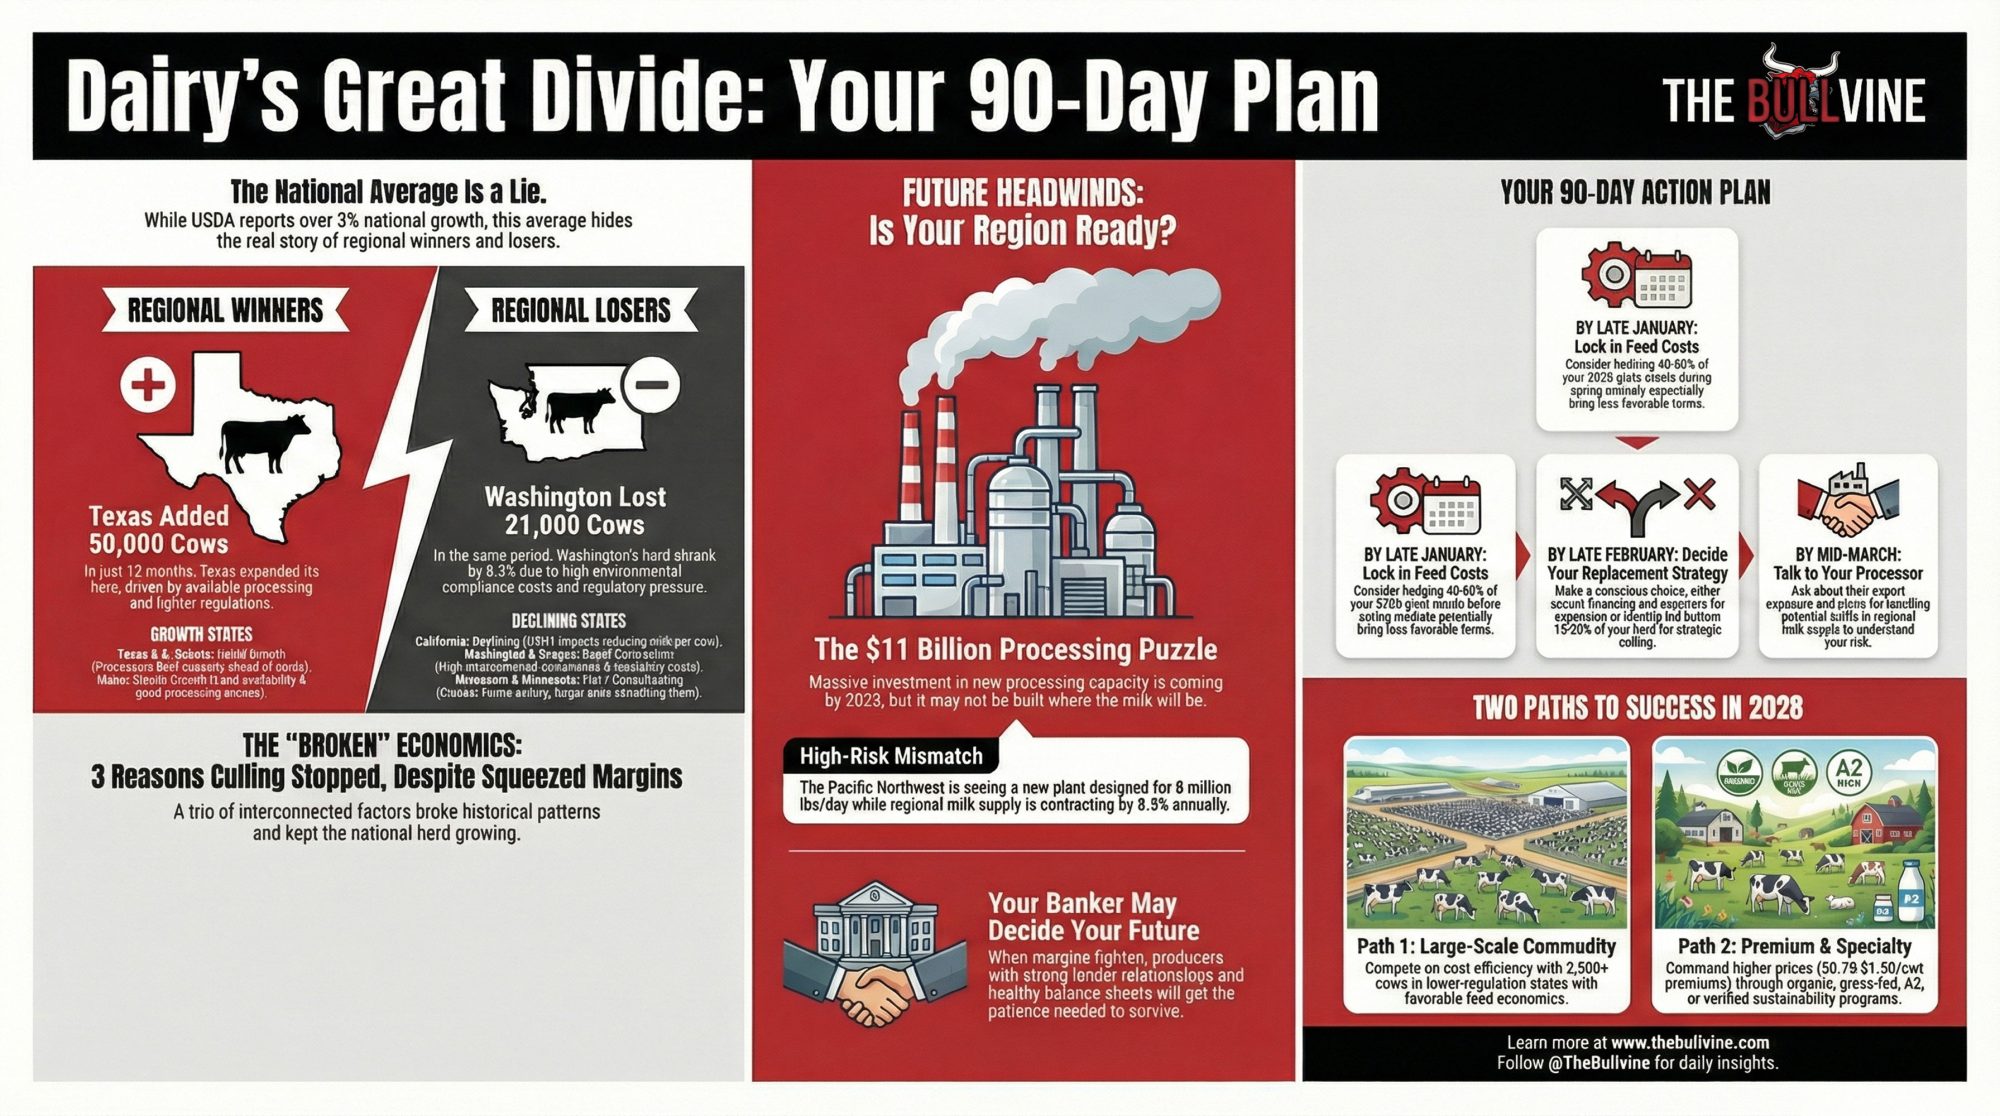
The International Dairy Foods Association released October data showing that between 2024 and 2027, U.S. dairy processing capacity expansion totals more than $11 billion in announced investments across 19 states. New cheese plants, expanded fluid milk processing, protein isolation facilities—substantial infrastructure.
What’s particularly noteworthy isn’t the investment volume alone. It’s the supply relationship structure underlying it. Major facility expansions—Hilmar in Kansas, Valley Queen in South Dakota, Glanbia and Leprino projects—are largely being built around long-term supply agreements with operations milking 2,000 cows or more.
A dairy cooperative field representative in the Upper Midwest explained the underlying economics: “A 600-cow operation represents maybe 60,000 pounds of milk daily. For a plant processing 8 million pounds, that’s less than 1% of the supply. The transaction costs of managing that relationship—quality monitoring, logistics, payment processing—are roughly the same whether it’s 60,000 pounds or 600,000 pounds.”
He was careful to add that cooperatives remain committed to their member base. “But producers need to understand the economics their buyers are navigating. The pressure toward consolidation has structural roots.”
So What Does “Viable” Actually Mean Right Now?
This is where I want to be careful to distinguish between what the data clearly show and what represents my analytical interpretation.
Operation Size
Per-Cow Labor Cost
Automation ROI Payback
Processor Leverage
Premium Access
2025 Viability Status
<100 cows
$520/cow/year
20+ years (not viable)
Minimal
Direct-to-consumer, organic
Viable if specialty
100-300 cows
$465/cow/year
15-20 years
Low
Organic, grassfed possible
Transition required
300-600 cows
$410/cow/year
12-18 years
Moderate
Limited at current scale
⚠️ High pressure zone
600-1,000 cows
$385/cow/year
10-15 years
Moderate
Scale too large for specialty
⚠️ Severe structural squeeze
1,000-2,500 cows
$315/cow/year
8-12 years
Strong
Component optimization focus
Structurally advantaged
2,500+ cows
$245/cow/year
6-10 years
Preferred supplier
Contract leverage
Dominant position
The data shows that operations above 1,000 cows have structural advantages in the current environment—lower per-unit fixed costs, automation ROI that pencils out more readily, processor leverage, and stronger capital access. The data also shows that specialty operations under 300 cows can achieve premium pricing that fundamentally changes the economics—several dollars per hundredweight above conventional for organic, significantly more for direct-to-consumer channels.
What I can’t tell you with precision is exactly how many operations will exit or consolidate, or over what timeline. When I suggest that traditional 400-1,000 cow conventional commodity operations face structural rather than cyclical challenges, that’s my analytical conclusion from watching these forces converge—not an official forecast from USDA or university research.
The trajectory raises legitimate questions. Rabobank’s analysis projects that approximately 2,800 dairy operations will close in 2025. If structural factors continue operating as they have—and I don’t see any obvious near-term reversal mechanisms—exit rates could remain elevated.
Dairy Category
GLP-1 User Consumption Change
Current U.S. GLP-1 Users
Projected Annual Market Impact
Strategic Implication
Cheese
-7.2% ⚠️
11 million
-$840M category pressure
Declining demand for commodity cheese milk
Butter
-5.8% ⚠️
11 million
-$320M category pressure
Butterfat premium erosion accelerating
Ice Cream
-5.5% ⚠️
11 million
-$675M category pressure
High-fat dessert categories vulnerable
Fluid Milk (whole)
-3.1% ⚠️
11 million
-$180M category pressure
Commodity fluid milk continues secular decline
Greek Yogurt
+185% ✓
11 million
+$920M category opportunity
Protein-focused growth accelerating
Cottage Cheese
+280% ✓
11 million
+$450M category opportunity
Dramatic protein-demand spike
High-Protein Beverages
+195% ✓
11 million
+$615M category opportunity
Emerging premium protein channel
Skyr / Icelandic Yogurt
+220% ✓
11 million
+$285M category opportunity
Ultra-high protein positioning working
The dynamics play out somewhat differently across regions. California operations face additional water cost and regulatory pressures that compound the structural challenges we’ve discussed. Idaho’s rapid consolidation has created different competitive patterns, with fewer mid-size operations surviving the squeeze. Texas and New Mexico dairies navigate the economic impacts of heat stress, which affect both production and labor. But the underlying forces—hierarchal costs, component shifts, processor consolidation, labor thresholds—are similar across geographies.
Here’s what’s equally important to acknowledge: different producers in different circumstances will navigate this very differently. I’ve talked with 800-cow conventional operations in Wisconsin, genuinely optimistic about their positioning—strong processor relationships, manageable debt, recent automation investment. I’ve talked with 500-cow operations in the same region that see no viable path forward without fundamental restructuring. Context matters enormously.
Paths That Are Working
Let me share what I’m observing in operations as they find viable paths forward, because genuine success stories exist alongside the challenges.
The organic transition continues to offer meaningful premium for operations willing to commit to production system changes. Operating margins for organic dairy typically exceed conventional operations substantially—though specific returns vary considerably by region, market relationships, and transition management. Several producers who converted from larger conventional operations emphasized that they had to reduce herd size significantly to make organic economics work long-term.
One Vermont organic producer—she runs about 200 cows and has been active in regional organic dairy advocacy—described her experience: “We ran 450 conventional cows for fifteen years. When we converted in 2019, we dropped to 200 and actually increased net income. The gross revenue decline was scary initially, but the margin improvement proved real.”
The transition period requires careful planning and an adequate financial runway. It’s not a quick fix, but it’s working for operations that approach it strategically.
Cooperative processing models are emerging in several regions and merit attention. The concept: multiple mid-size operations collectively invest in processing capacity—typically Greek yogurt, high-protein products, or specialty cheese—to capture value-added margins on a portion of their milk.
One Minnesota cooperative involving four farms with a combined 1,800 cows reports routing 25% of collective production through a small processing facility they financed together. That portion generates roughly twice the commodity price. The remaining 75% continues through traditional channels.
“We didn’t have the scale individually to make processing investment work,” one participating farmer explained. “Together we did.”
This model won’t fit every situation, but it represents creative thinking worth exploring.
Strategic positioning toward protein-focused products is another path to gaining traction. Some operations are pivoting toward products that align with GLP-1-influenced consumption patterns—high-protein yogurt, cottage cheese, protein-enhanced beverages. Rather than resisting the demand shift, they’re moving with it.
→ Confidential consultation with ag financial advisor and equipment appraiser
A Necessary Conversation About Timing
I want to address something directly that industry coverage sometimes avoids.
For some operations facing the structural challenges discussed here—compressed margins, elevated replacement costs, processor relationship pressure, automation economics that don’t pencil out, no clear specialty pivot—strategic exit while asset values remain elevated may represent the soundest financial decision available.
Choosing to exit under these circumstances isn’t failure. It’s asset management.
It’s recognition that structural economics have shifted in ways that particular operational configurations can’t accommodate. The industry changing isn’t any individual producer’s fault.
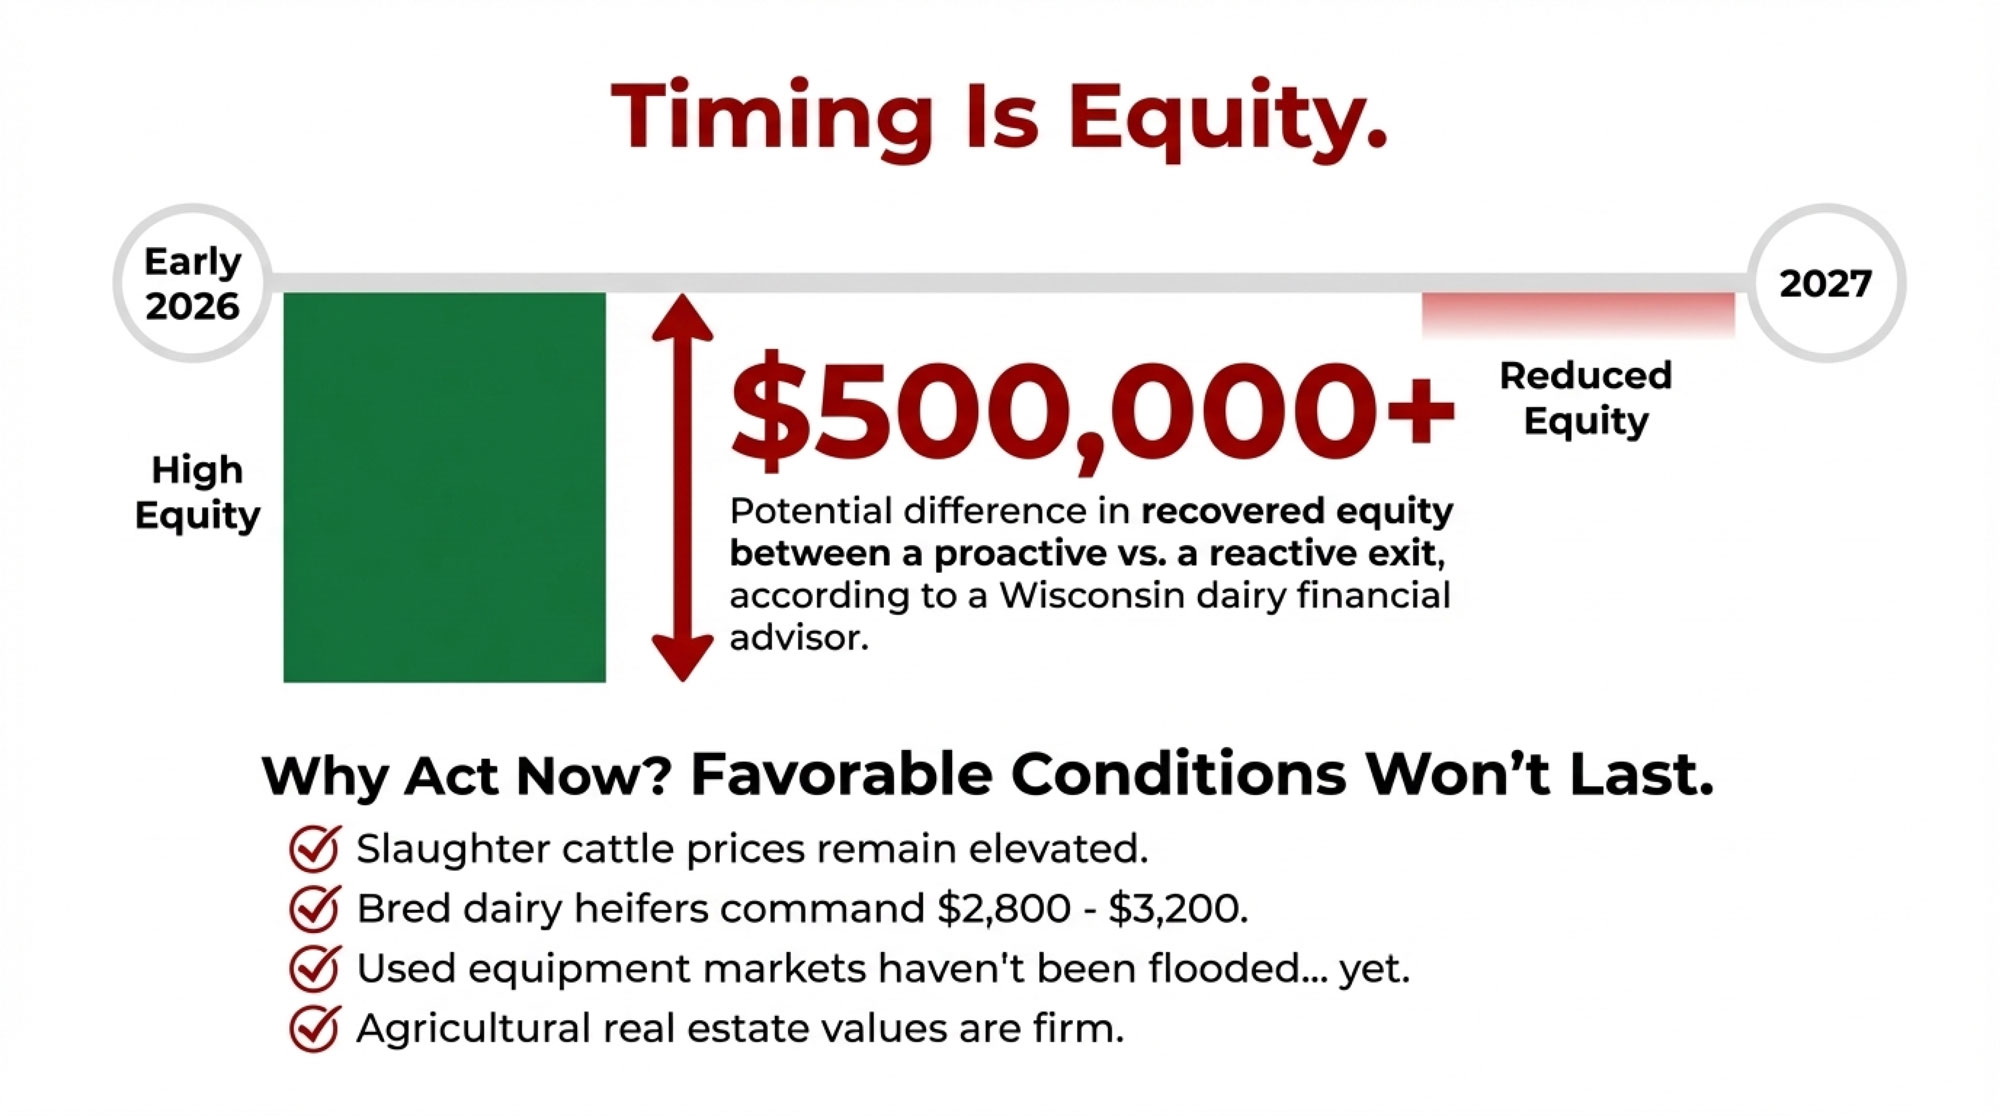
Current asset values remain relatively favorable. USDA market data shows slaughter cattle prices elevated, with bred dairy heifers commanding $2,800-$3,200 at many auctions. Used equipment markets haven’t yet flooded with liquidation inventory. Agricultural real estate values in productive regions remain firm.
These conditions won’t persist indefinitely if exit rates accelerate as structural pressures suggest they might.
A financial advisor working exclusively with Wisconsin dairy operations framed it this way: “The difference between a proactive exit in early 2026 and a reactive exit in 2027 can exceed half a million dollars in recovered equity for a mid-size operation. That’s not about farming ability—it’s about timing.”
What I’d Tell Someone Navigating This
If I were sitting across from you working through these realities—and I’ve had many such conversations this year—here’s what I’d want you to understand:
The structural forces are real, but they’re not uniform. Your specific circumstances—debt levels, processor relationships, facility condition, labor situation, geographic positioning, family involvement, personal goals—matter enormously. There’s no single right answer that applies universally.
The timeline for proactive decision-making appears compressed. Whether you’re considering specialty transition, cooperative participation, strategic investment, or planned exit, the window for making deliberate choices rather than reacting to crisis seems to be the next six to twelve months. Asset values, credit access, and market options tend to deteriorate once financial stress becomes externally visible.
Professional guidance matters more than usual. This isn’t a moment for figuring everything out alone. State agricultural extension services offer transition planning resources—Wisconsin’s Center for Dairy Profitability and Cornell’s PRO-DAIRY program have developed tools specifically for this environment. The Farm Financial Standards Council maintains directories of qualified agricultural financial consultants. USDA’s Farm Service Agency administers loan programs supporting organic transition or operational restructuring.
Consider what you actually want. Beyond financial analysis lies a personal question: What do you want your life to look like in three years? Five years? Sometimes the right answer is to continue farming dairy under restructured circumstances. Sometimes it means preserving the equity you’ve built and redirecting it elsewhere. Both can represent good decisions depending on your situation and values.
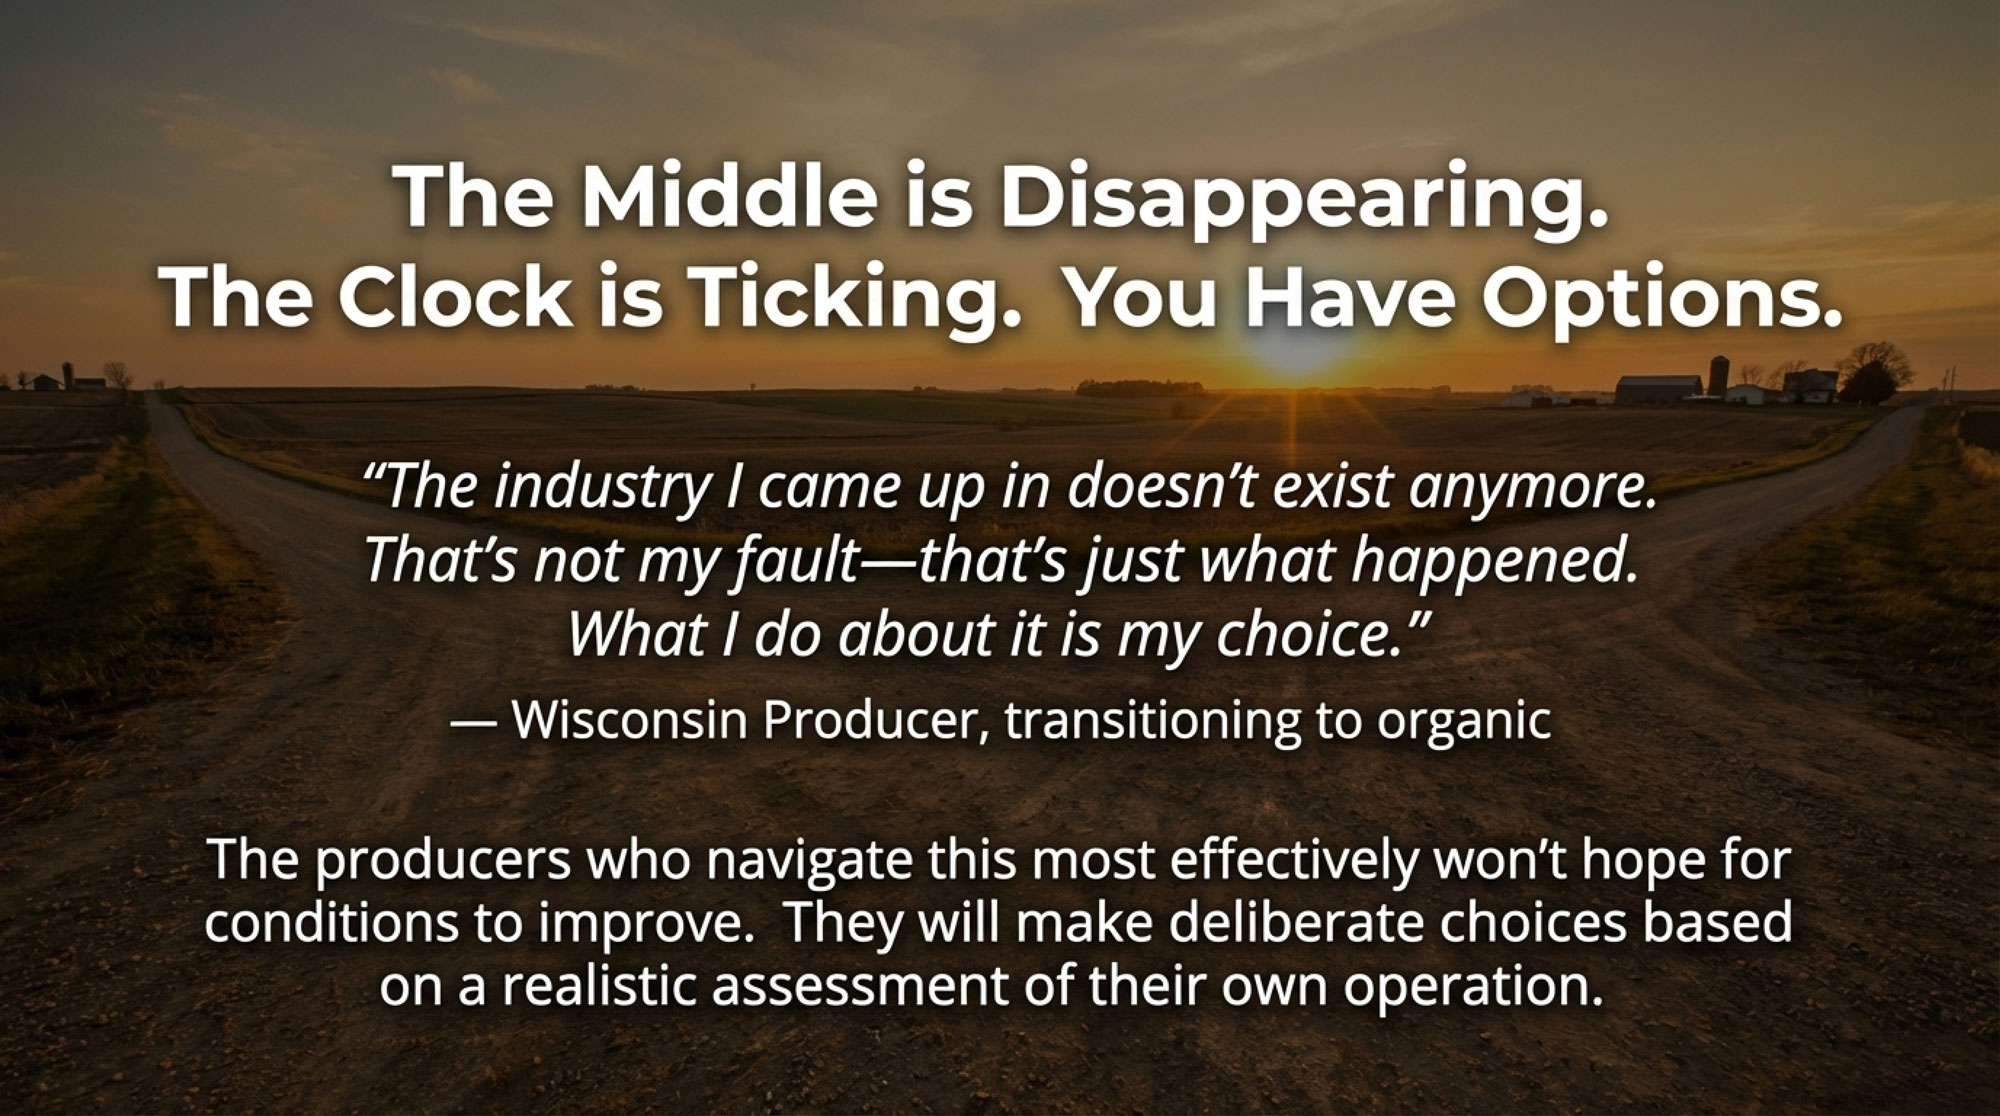
A producer working through organic transition planning after thirty years in conventional dairy offered a perspective that’s stayed with me: “The industry I came up in doesn’t exist anymore. That’s not my fault—that’s just what happened. What I do about it is my choice.”
Practical Considerations by Operation Size
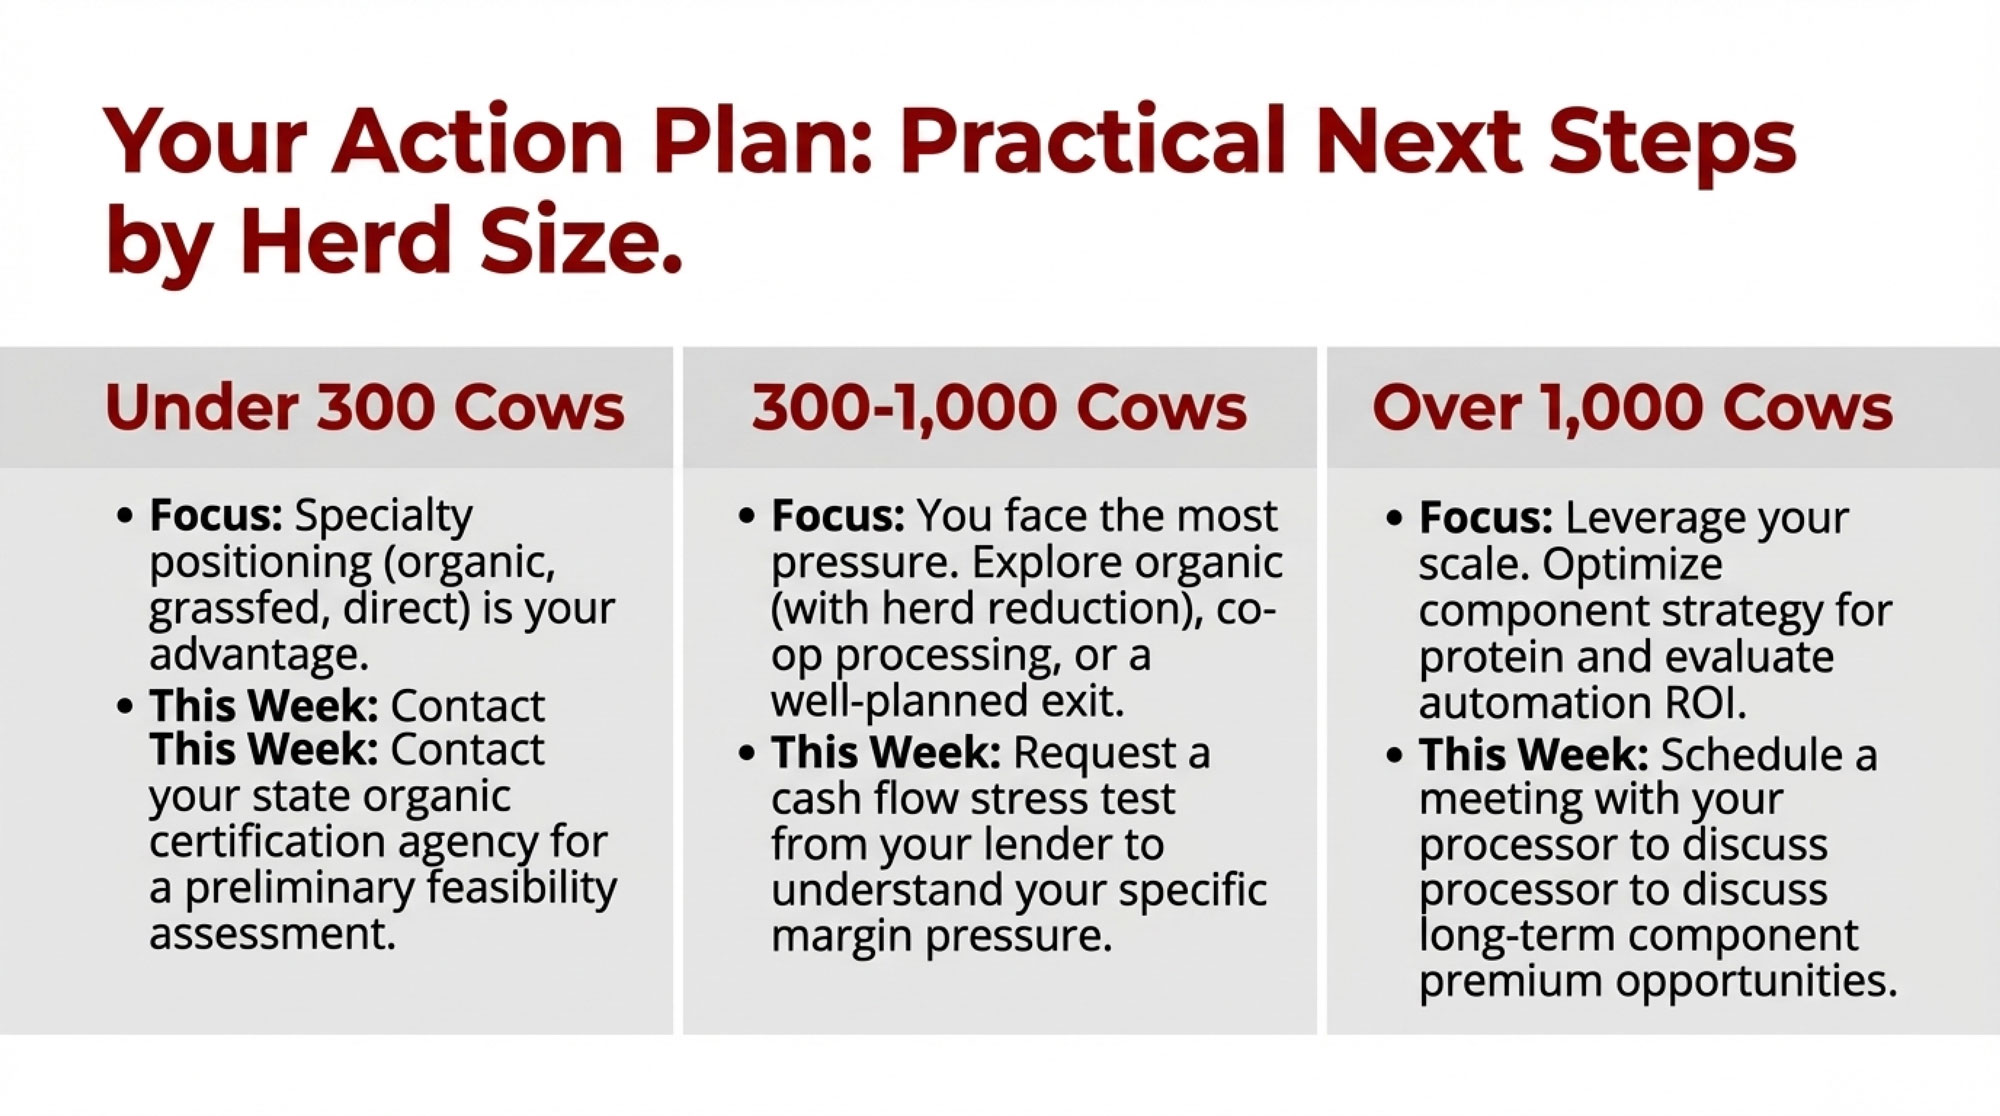
For operations under 300 cows:
Specialty positioning—organic, grassfed, direct-to-consumer—offers economics that commodity production increasingly struggles to match
Your scale disadvantage in commodity markets can become an advantage where authenticity and direct relationships matter
Organic certification typically requires 18-24 months of transition planning; raw milk licensing varies significantly by state
State organic certification agencies and NODPA offer valuable transition guidance
This week: Contact your state organic certification agency to request a preliminary feasibility assessment for your operation
For operations of 300-1,000 cows:
This scale faces the most significant structural pressure—large enough that specialty positioning at current capacity is difficult, but not large enough for automation economics to work straightforwardly
Viable paths worth exploring: organic conversion with strategic herd reduction, cooperative processing partnerships, or well-planned exit
Timeline for decision-making matters; consultation with dairy financial specialists before mid-2026 seems prudent
Conversations with neighboring operations about cooperative arrangements may reveal unexpected opportunities
This week: Request a cash flow stress test from your lender or farm financial consultant to understand your specific margin pressure under various price scenarios
For operations above 1,000 cows:
Automation ROI becomes more favorable at this scale; systematic robotics evaluation is appropriate if not already undertaken
Processor relationships and component optimization—particularly protein—represent strategic priorities worth attention
Structural advantages in labor efficiency, purchasing leverage, and capital access provide meaningful flexibility
Expansion through the acquisition of exiting operations may warrant consideration depending on circumstances
This week: Schedule a meeting with your processor contact to discuss long-term supply relationship options and component premium opportunities
For all operations regardless of size:
Breeding program review with attention to emerging component economics favoring protein
Recognition that GLP-1 demand impacts appear structural rather than cyclical
Early lender conversations if refinancing or restructuring might become necessary
The dairy industry has weathered profound changes before and will continue producing the milk, cheese, and products consumers depend on. What’s shifting is who produces them and at what scale—and that transition is happening faster than many anticipated.
For individual producers, the essential insight is this: the forces reshaping dairy economics appear structural rather than cyclical. Making strategic decisions—whether restructuring toward specialty production, joining cooperative arrangements, investing in scale and automation, or executing an orderly exit—tends to preserve options and equity that waiting erodes.
The producers who navigate this most effectively share a common characteristic: they make deliberate choices based on a realistic assessment of their specific circumstances rather than hoping that general conditions will improve on their own.
The choice belongs to each of you. The information needed to make it wisely is increasingly available.
Key Takeaways:
Heifer economics have flipped: Prices tripled ($1,140 → $3,500+), and inventory is at its lowest since 1978. Every replacement costs $2,000+ more than it did three years ago.
Protein is overtaking butterfat: Component premiums are shifting. Review your breeding program now—genetics from 2022 may be optimized for a vanishing market.
The middle is disappearing: 300-1,000 cow operations face a structural squeeze—too large for specialty pivots, too small for automation ROI to work.
Four paths, one timeline: Organic transition, cooperative processing, strategic scaling, or planned exit. All require action before mid-2026.
Timing is equity: Asset values favor decisions made now. The difference between proactive and reactive exit can exceed $500,000 in recovered value.
Complete references and supporting documentation are available upon request by contacting the editorial team at editor@thebullvine.com.
Learn More:
Beef-on-Dairy’s $6,215 Secret: Why 72% of Herds Are Playing It Wrong – Reveals how to balance calf revenue with replacement needs using a specific tiered breeding framework to maximize profitability without creating a terminal “financial time bomb” for your herd’s future.
Robot Revolution: Why Smart Dairy Farmers Are Winning with Automated Milking – Demonstrates how to effectively transition to robotic systems, providing specific benchmarks for labor savings, production increases, and the 2025 ROI math required to justify high-capital automation investments in a tight-margin environment.
The Sunday Read Dairy Professionals Don’t Skip.
Every week, thousands of producers, breeders, and industry insiders open Bullvine Weekly for genetics insights, market shifts, and profit strategies they won’t find anywhere else. One email. Five minutes. Smarter decisions all week.
Everyone’s celebrating 2025’s wins. Almost nobody’s asking how heifer shortage, processor overcapacity, and component changes interact—and what to do about it. The complete 2025 strategic analysis.
Walk into any dairy industry gathering in late 2025, and you’ll hear the same narrative: FMMO passed, DMC extended, $11 billion in new plants. What you won’t hear is how the heifer shortage just made half of those “wins” irrelevant for the next 30 months.
Industry associations called it progress. Most coverage treated these as separate wins.
Here’s what that narrative misses. These ten developments aren’t independent stories—they’re interconnected forces that fundamentally reshaped who’s positioned to thrive and who’s scrambling for the next five years. Some created real strategic advantages, others masked structural problems that are surfacing now, and a few are going to prove costly for producers who waited too long to respond.
What follows is what actually happened in 2025, beyond the headlines.
The Heifer Shortage: How Beef-on-Dairy Breeding Created a 27-Month Supply Constraint
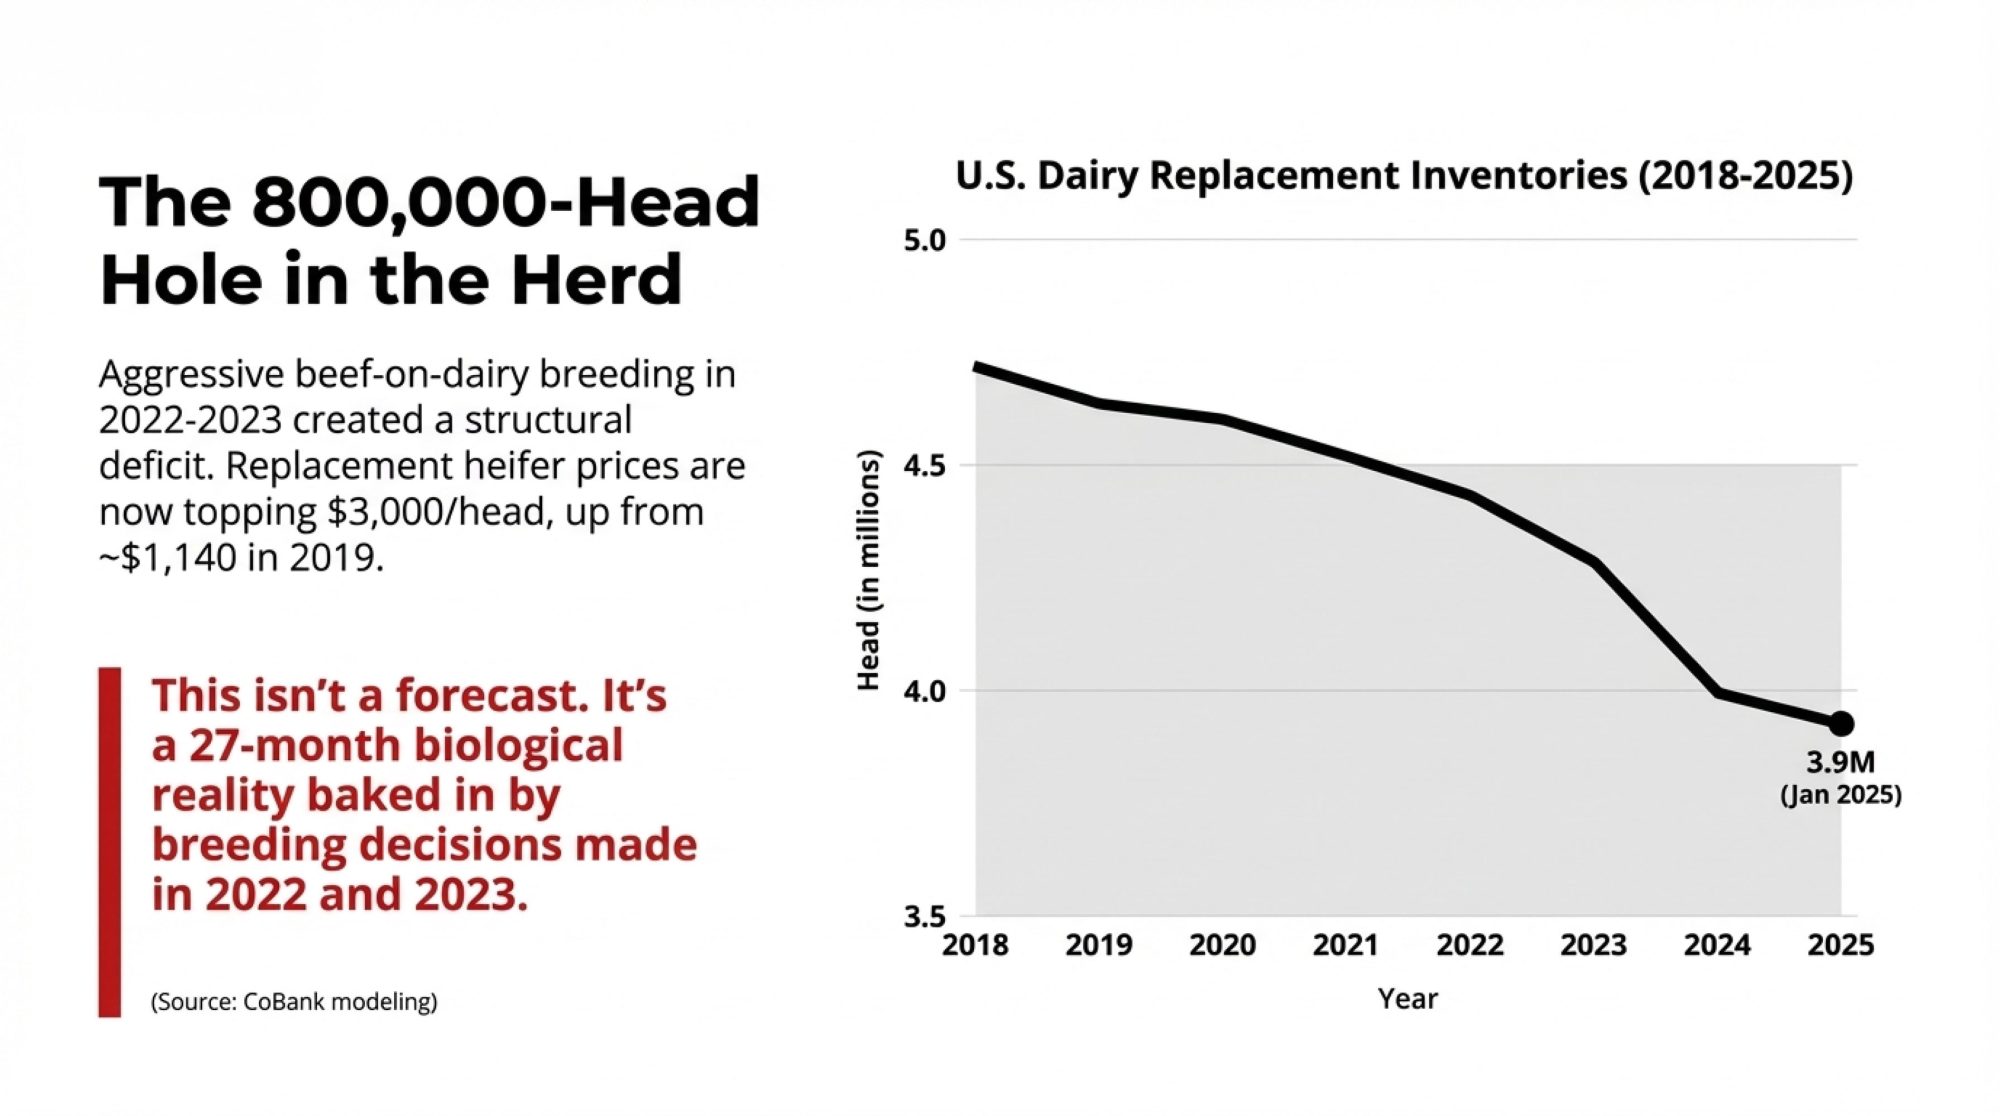
Visit any Upper Midwest or California auction barn in mid-2025, and you saw the same scene playing out: replacement heifers averaging above $3,000 per head—up from around $1,140 back in April 2019, according to CoBank’s August report. Premium animals with strong genetics were commanding significantly higher prices.
And here’s the thing. This isn’t a pricing problem you hedge or a policy issue you lobby. It’s a biological constraint that binds for 24 to 30 months, and there’s no shortcut around the gestation and growth timeline.
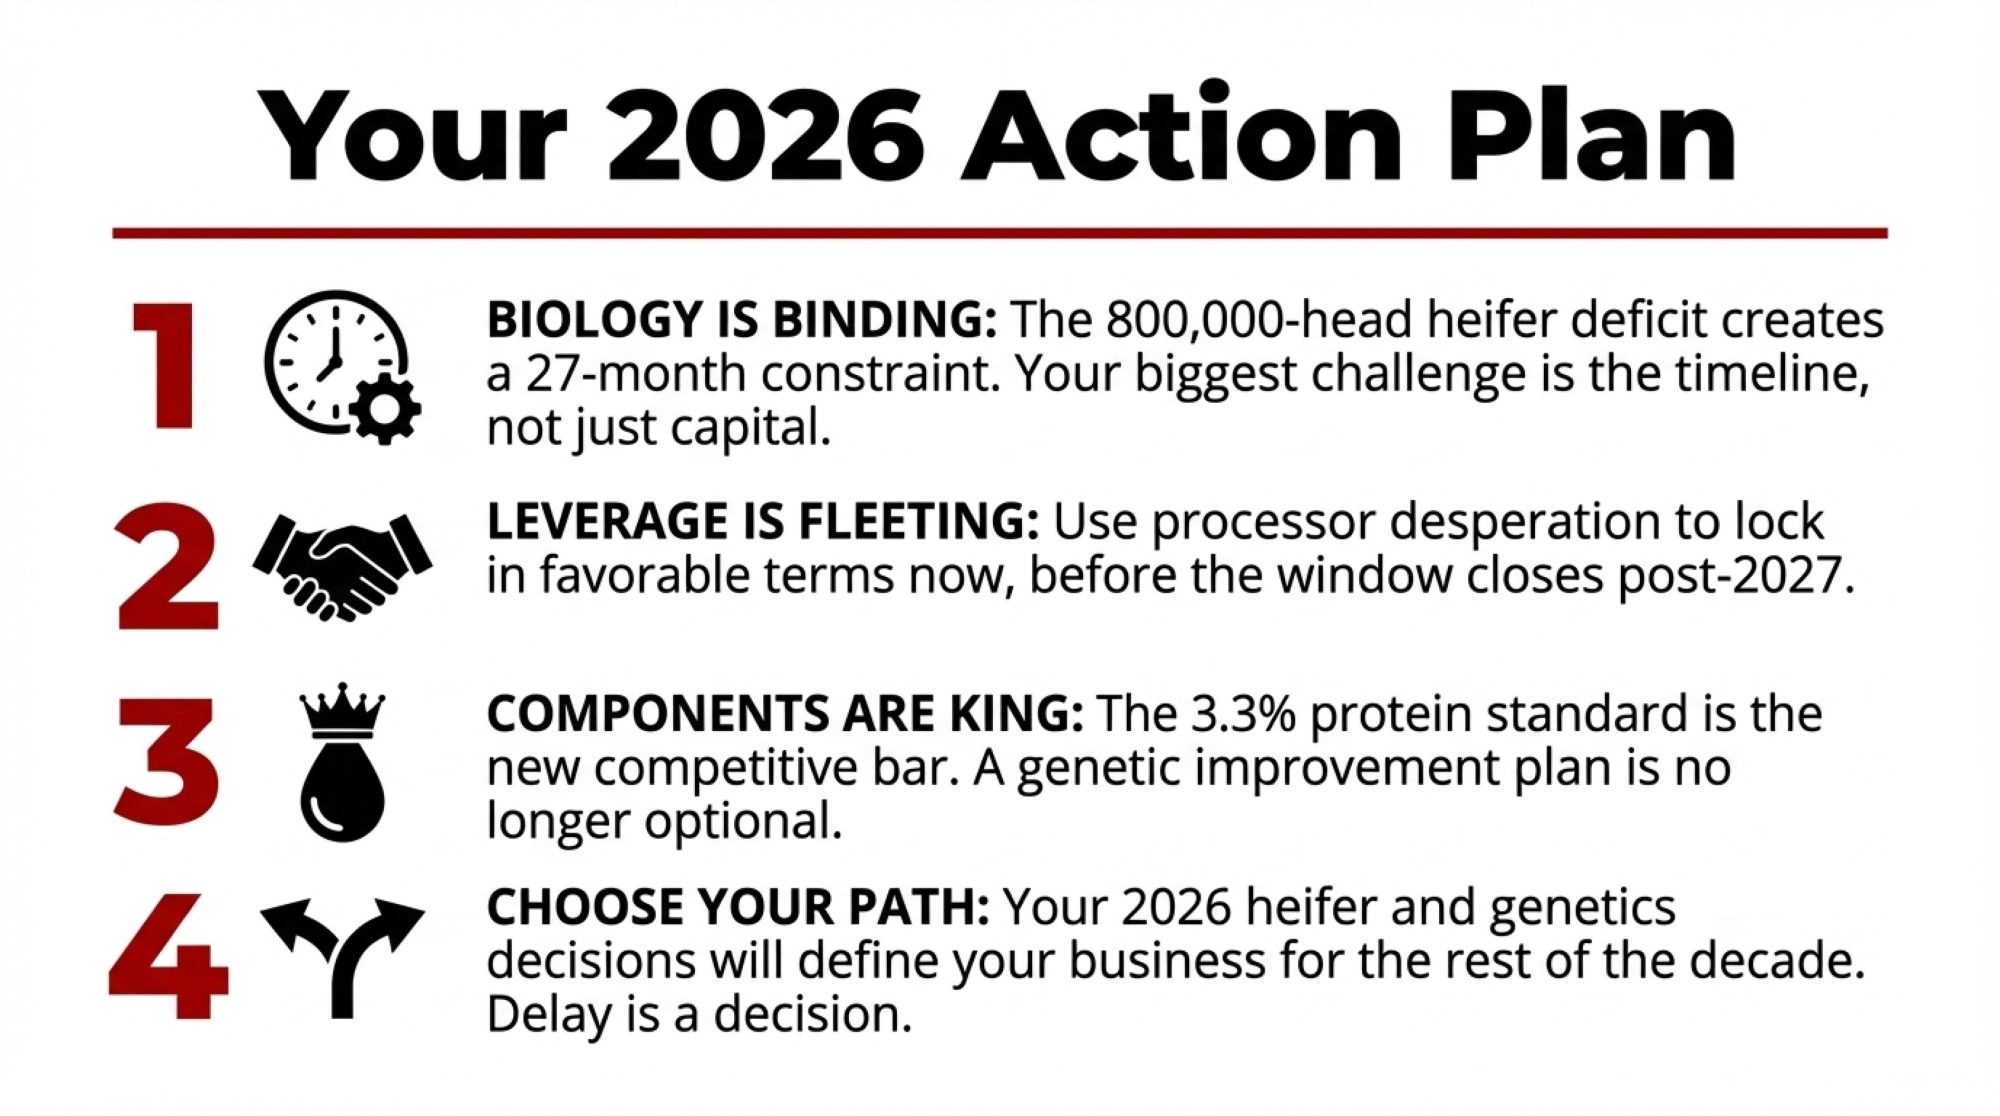
Dairy replacement inventories dropped to 3,914,300 head in January 2025, down 18% from 2018 levels, according to the USDA’s Cattle Inventory report. CoBank’s modeling shows heifer inventories will shrink by an estimated 800,000 head over the next two years before beginning to rebound in 2027. That 800,000-head deficit isn’t a projection—it’s already baked into the system based on breeding decisions made in 2022 and 2023.
The cause is straightforward, you know. Producers spent 2022-2023 breeding 60-70% of their herds to beef semen because beef-on-dairy calves brought $1,200-$1,800 while dairy bull calves fetched $50—numbers documented throughout that period in Progressive Dairy and Hoard’s Dairyman market reports. The short-term cash flow looked smart. The long-term math created a structural deficit we’re living through now.
How the Math Actually Works
Several Wisconsin producers have described similar experiences in industry discussions, with operations reporting they thought 65% beef breeding in 2022 was conservative. Looking back now, they realize those decisions created their own shortage problem.
Here’s how it plays out. An 800-cow herd with a 35% replacement rate and 85% completion needs roughly 330 heifer calves annually. Heavy beef breeding during 2022-2023 dropped that to 65-70 calves per year, creating a 260-heifer annual shortfall. Scale that behavior across the country and you get the 800,000-head hole CoBank documented in their August sector analysis.
The Timeline Won’t Speed Up
From the moment you switch back to sexed dairy semen, you’re staring at 27 months to first calving: nine months gestation plus 18-24 months to freshening. Even with perfect execution, it won’t be until mid-to-late 2028 before replacement inventories feel healthy again.
What keeps coming up in conversations—and I’ve heard this from producers across three regions now—is how quickly this creates a cascade of impacts we’re already seeing:
Culling math flips entirely. That marginal cow you would have shipped for chronic lameness or weak production now represents a different equation. Culling brings in $2,200-$2,400 at current cull cow prices, but forces a $3,000+ replacement purchase. You’re suddenly in the hole rather than keeping a marginal producer for one more lactation.
This is clearly evident in USDA livestock slaughter data. Dairy cow slaughter trailed year-ago levels for 94-98 of the past 100+ weeks through November 2025, with cumulative declines exceeding 550,000 head. Producers are keeping cows they would have shipped two years ago, which suppresses turnover and drags on herd-average production efficiency.
Expansion plans die or get completely redesigned. A planned 250-cow expansion at previous heifer pricing would cost nearly twice as much at current rates. That kind of capital increase pushes projected returns well below most lender thresholds for dairy expansion projects.
Producers who are still expanding have pivoted strategies entirely—chasing 24,000-26,000 pounds per cow through better genetics and management, buying fresh cows instead of heifers, or locking in long-term heifer contracts at fixed prices with neighboring operations or heifer growers. Each approach has tradeoffs, but they’re all designed to work around the heifer constraint rather than pretend it doesn’t exist.
Every breeding decision becomes capital allocation. You can’t afford to waste pregnancies on beef calves, but you also can’t dump expensive sexed semen on low-merit cows that deliver weak daughters. The new logic emerging across progressive herds: sexed dairy on the top 40% for genomic multipliers, conventional dairy on the middle 40% for higher conception rates, and that 50/50 gender split, limited beef on the bottom 20% to purge genetics you don’t want to propagate.
“The ones who treated it like a temporary price spike are learning that biology doesn’t negotiate.”
The operators who recognized this constraint early in 2025 rewired breeding protocols, slowed or reshaped expansion plans, and leaned into their newfound leverage with processors hunting for milk.
$11 Billion in New Stainless: When Processing Capacity Outran Milk Supply
By mid-2025, new and expanded dairy processing projects added capacity to process nearly 20 million pounds of milk per day, according to industry announcements compiled by Dairy Foods magazine.
Chobani announced a $500 million expansion in Twin Falls, Idaho, and broke ground on a $1.2 billion plant in Rome, New York, designed to process 12 million pounds of milk daily. Once at full capacity, Chobani will purchase an estimated 6 billion pounds per year. Darigold opened a $1 billion facility in Pasco, Washington, processing up to 8 million pounds daily. Hilmar Cheese launched a cutting-edge facility in Dodge City, Kansas. California Dairies and several other processors added significant capacity throughout the year.
Now, historical U.S. milk production growth has run about 1.5-2% annually, according to USDA data. Food processing facilities typically need to operate at 80-85% utilization to meet their return targets and justify capital deployment.
Biology just vetoed those growth assumptions.
Replacement heifer inventories fell to 20-year lows, with the pipeline expected to shrink further before rebounding after 2027, as CoBank’s dairy economists documented. Producers kept marginal cows longer, and national cow slaughter stayed unusually light, but per-cow efficiency gains produced a one-time volume bump rather than sustainable long-term growth.
The tension is explicit in industry commentary. “Farmers are shipping more milk components, which is most important as 80% of U.S. milk flows into manufactured dairy products,” said Corey Geiger, CoBank lead dairy economist, in their August report. “With the amount of new processing capacity coming online across the country, the ability for milk production to keep up with the demand is worth noting. Given the historically high prices for dairy replacements to enter the milking string, dairy farmers are planning two to three years out for expansions.”
In other words, these plants were built on growth assumptions just as biology capped supply, which shifts negotiating leverage toward producers who can reliably deliver milk.
What Processor Desperation Actually Looks Like
Processors don’t publicly admit supply desperation. They telegraph it through behavior patterns we’ve been tracking throughout 2025.
If a plant historically pulled milk from a 100-150 mile radius and starts recruiting 300-500 miles out, that signals supply desperation. If you’re 50 miles from that plant while they’re wooing farms 400 miles away, you’re their lowest-cost, lowest-risk volume source. That’s leverage worth understanding.
Volume bonuses, consistency premiums, multi-year price floors, richer component incentives, and co-funded capital projects signal that standard pool pricing isn’t securing enough milk. Industry sources report that some operations have negotiated arrangements, including premiums of $0.20-$0.30 per hundredweight above pool pricing, structured as multi-year agreements with processor co-financing for replacement heifers at favorable interest rates. Essentially, processors are using their cheaper cost of capital to lock in a reliable milk supply.
Plants sold as 24/7 engines running three shifts can’t hide if they’re stuck at two shifts, hiring below announced job numbers, or taking frequent maintenance downtime. If they built for 80-85% utilization and are running in the low-60s, every extra million pounds you can commit moves their return needle meaningfully.
The window for producer leverage is real but temporary. Once replacement inventories rebuild after 2027-2028 and milk supply catches up to the $11 billion of new capacity, processors drift back toward classic commodity behavior: more milk than needed, less desperation, harder-edged pricing.
Between now and then, producers who understand the supply-demand mismatch have a once-in-a-cycle opportunity to lock in better premiums, real partnership terms, and multi-year structures that still look attractive when the leverage pendulum swings back. These opportunities typically don’t announce themselves with flashing lights—they show up as unusual persistence from field reps or surprising openness to negotiation on terms that were non-starters six months ago.
FMMO Component Factor Changes: The Permanent Repricing of Standard Milk
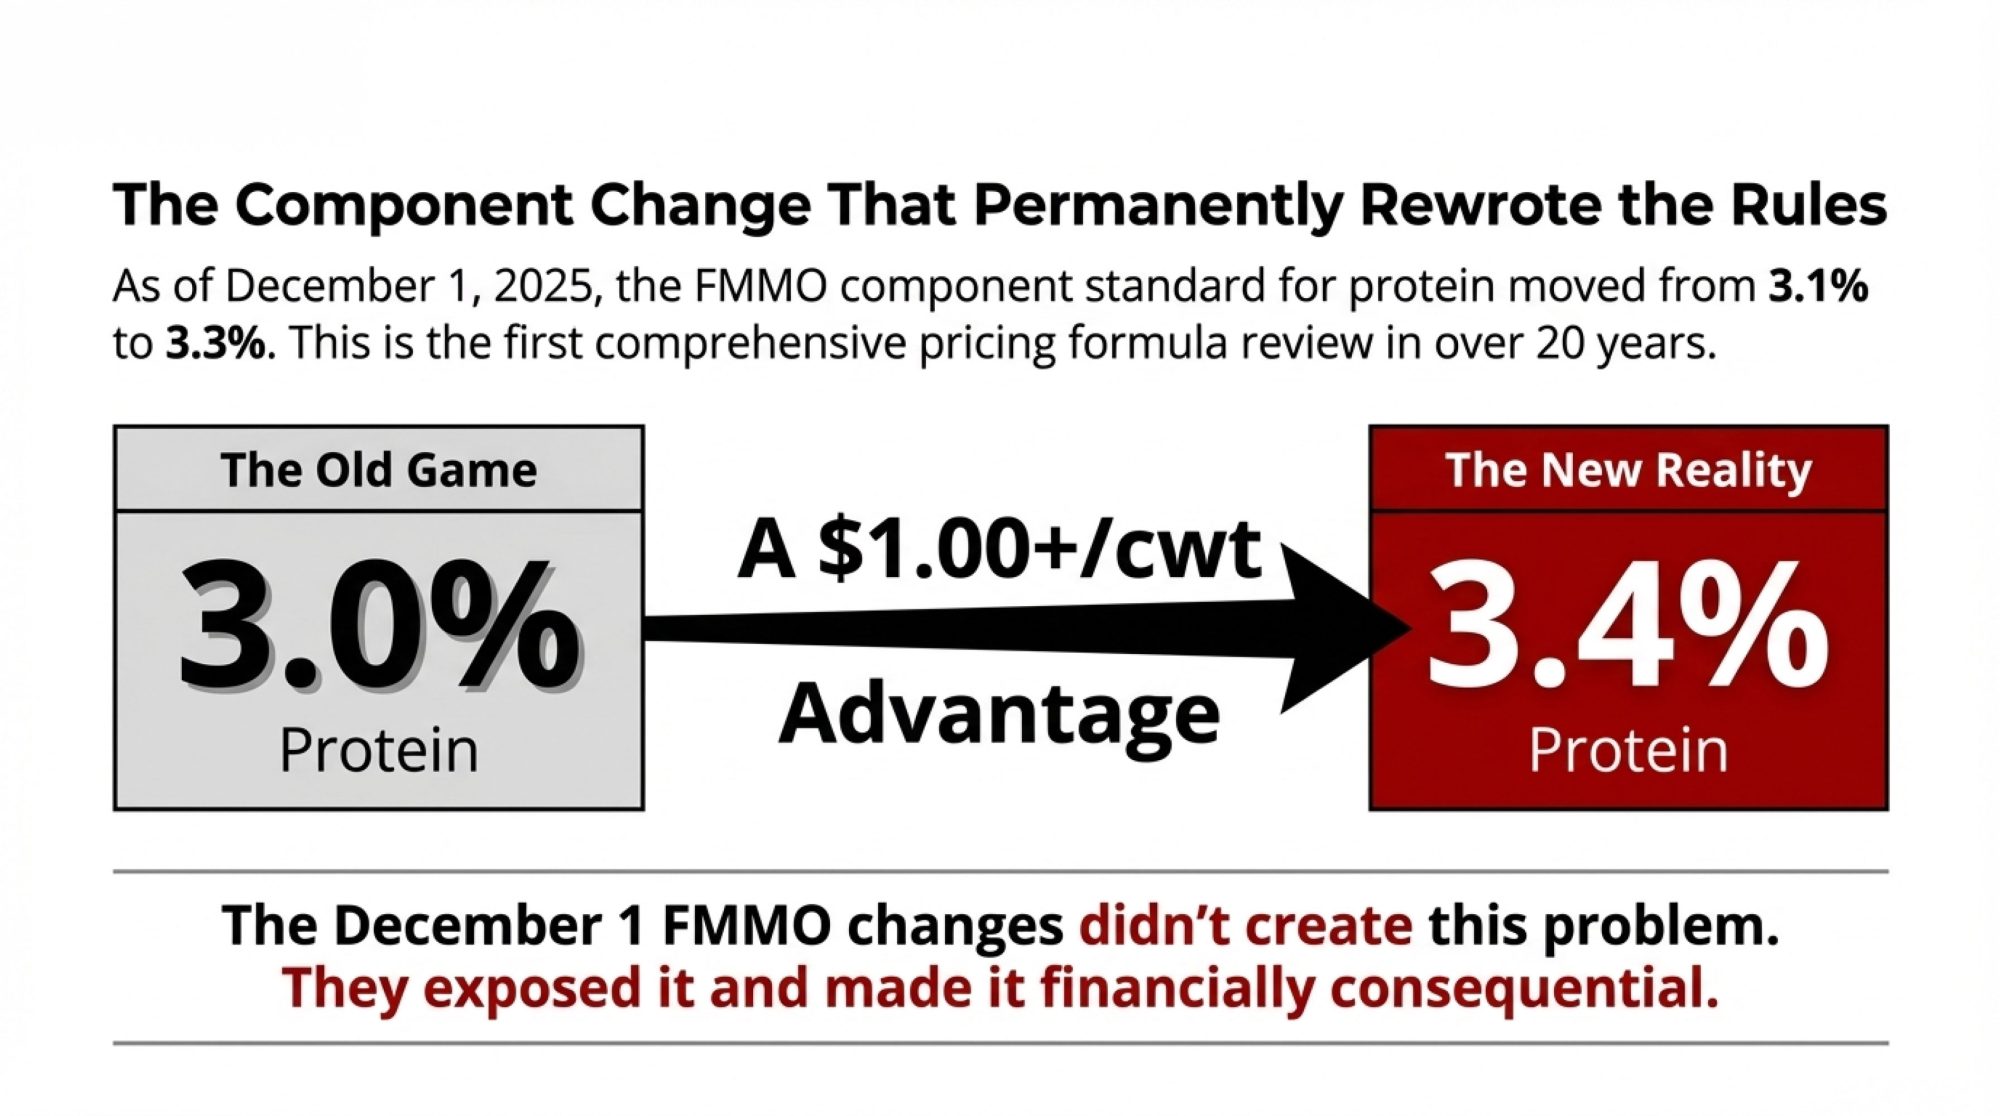
December 1, 2025, marked a fundamental shift in how milk gets valued. The component standard updates moved to 3.3% protein, 6.0% other solids, and 9.3% nonfat solids, according to the USDA’s Agricultural Marketing Service final rule published in October.
These aren’t technical adjustments—they’re a permanent repricing of what counts as standard milk.
The protein composition factor increased from 3.1% to 3.3%, the other solids factor from 5.9% to 6%, and the nonfat solids factor from 9% to 9.3%. This marked the first comprehensive pricing formula review in over 20 years after a 49-day national hearing that ran from August 2023 to January 2024, as documented in the Federal Register.
If your herd meets or exceeds these new standards, the system now better reflects the value you’re shipping. If you’re below, you’re being benchmarked against a higher bar every single month moving forward.
The spread between a low-protein herd and one at 3.4-3.5% protein can easily exceed a dollar per hundredweight once you layer in protein value and the new composition factors, according to University of Wisconsin dairy economist analyses published in early 2025.
The Trap Many Producers Haven’t Recognized Yet
There’s a common mindset you hear: “our milk has always been good enough.” And for two decades, that was largely true because the game rewarded volume. More cows, more pounds, big barns, scale economics. Components mattered, but didn’t always override sheer throughput.
Once the component bar moves up, that calculus shifts fundamentally. A neighbor at 3.4-3.5% protein and better butterfat performance can stack $1.25-$1.50 per hundredweight extra on every shipment, often running fewer cows with higher per-cow efficiency and lower overhead.
Can you fix it with genetics? You can move your herd’s component profile, but not quickly or cheaply.
Breeding your way out takes at least 4-6 years. During the spring 2025 breeding season, progressive herds significantly revised their protocols. The approach: genomic test the herd, target the top 30-40% for component-focused breeding, use sexed semen from high-component bulls, conventional dairy on the middle tier, beef or aggressive culls on the bottom.
But here’s the timeline reality. Years 1-2: you’re spending on testing and premium semen while improved daughters are still calves. Years 3-4: first wave of high-component heifers hits the parlor, herd protein inches from 3.0% toward 3.10-3.15%. Years 5-6: approaching 3.25-3.30% if you’re disciplined about culling and consistent with breeding protocols. That’s a long runway, and it requires sustained commitment and capital.
Buying your way out takes 2-3 years and substantial capital. Quality replacements with superior component genetics are trading in the same $3,000+ range currently. Replacing 50-60% of a 1,200-cow herd translates into millions in gross animal purchases, partially offset by cull revenue but still a heavy net capital outlay.
“The December 1 FMMO changes didn’t create this problem. They exposed it and made it financially consequential.”
When the math says exit. If you’re running close to 3.0% protein and 3.8% butterfat, while regional peers are closer to 3.3%+ protein and 4.1-4.2% butterfat, the widened component spread, plus your volume and cost structure, leaves you hundreds of thousands of dollars a year behind the competition.
A serious hybrid genetics improvement program might cost mid-six figures over 5-7 years between semen, genomic testing, and strategic animal purchases, with break-even landing close to a decade out. If you’re in your late 50s or early 60s with no identified successor and significant term debt, you’re grinding and investing hard for most of what’s left of your operating career just to get back to parity with more competitive herds.
The question worth asking is whether, given your age, debt structure, succession plan, and market alternatives, fixing genetics is actually the smartest strategic move or whether this is the moment to plan an orderly, strategic exit while your assets still command reasonable value. There’s no single right answer—it depends entirely on your specific situation—but it’s a question worth answering honestly.
DMC Extension Through 2031: Insurance, Life Support, or Strategic Protection?
The Dairy Margin Coverage program extension through 2031 included updated production history using 2021-2023 data, raised Tier 1 protection to 6 million pounds, and offered 25% premium discounts for long-term enrollment, according to a March USDA Farm Service Agency announcement.
Between January 2019 and December 2024, margin payments triggered in 38 months for producers who opted for $9.50 margin coverage. Total payments under DMC reached nearly $3.3 billion, with $1.2 billion paid in 2023 alone when payments triggered in 11 of 12 months, according to USDA payment data.
Three Faces of the Same Program
After watching DMC play out through six years and three very different market cycles, three distinct patterns have emerged in how farms actually use the program.
Real risk management for structurally sound operations. A 500-800 cow operation with solid components, strong efficiency, manageable leverage, and competent management enrolls Tier 1 max at top coverage levels with multi-year enrollment for the 25% discount. In a normal year, they pay low-five-figure premiums and receive modest payouts when margins briefly dip. In a disaster year like 2023—when payments reached $1.2 billion across the program—they see substantial indemnities that shore up the balance sheet or fund strategic investment in genetics, facilities, or automation.
Life support for marginal operations. Older operator, high cost structure, mediocre components, low production per cow, heavy debt service, tired facilities, no identified successor. For that operation, DMC often represents the difference between continuing to milk and being forced to liquidate. When you look at 2023’s $1.2 billion in program payments distributed across enrolled operations, you can see how meaningful those checks were for operations running on thin margins. For a marginal 300-500 cow herd, that money covered operating loan interest, minimum term-debt payments, and property taxes. Without it, a meaningful chunk of those operations likely would have hit the financial wall in 2023-2024.
Underpriced fat-tail insurance for sophisticated operators. DMC is basically a put option on the margin between the all-milk price and feed cost. USDA premiums are set using historical data and Congressional budget math, not a live options market. Premiums on Tier 1 $9.50 coverage, especially with the 25% multi-year discount, are relatively low per hundredweight compared to the extreme margins that can occur in fat-tail years. Sophisticated operators aren’t buying it for average years—they’re buying it for the one or two 2023-style years per decade where the program delivers substantial protection on Tier 1 alone.
The Program Is a Mirror
The program itself reflects your fundamentals and your strategic posture. If you’re structurally competitive, DMC is a weapon that lets you stay aggressive through margin squeezes while competitors pull back. If you’re structurally challenged, it’s buying time—either to fix fundamentals or to exit on your own terms instead of through forced liquidation.
Given DMC is now extended through 2031 with improved terms, the practical move is straightforward: use it, then be honest about why you’re using it. If you’d be profitable without DMC checks, enroll Tier 1 to the maximum and treat premiums as the cost of staying aggressive when the next 2023-style margin collapse hits. If you need DMC payments to meet loan covenants and tax obligations, admit you’re either buying time to fix structural problems or buying time to plan an orderly exit with dignity intact. Neither path is wrong—they’re just different strategic choices based on different operational realities.
Dairy Exports: Record Value Amid Structural Uncertainty
U.S. dairy exports reached $8.2 billion in 2024, the second-highest total on record, according to the U.S. Dairy Export Council’s year-end summary released in February 2025. Cheese exports to Mexico and Latin America hit records throughout the year.
At the same time, 2025 Class III futures spent chunks of the year in the mid-$15-$16 range, and make-allowance increases implemented with the FMMO changes stripped hundreds of millions in aggregate from producer milk checks, as University of Missouri agricultural economists documented in their June policy brief.
What this reveals is an uncomfortable truth: export volume can boom while your milk check tanks. U.S. and global supply were both heavy throughout 2025. The EU ran substantial output, New Zealand stayed solid, and Australia recovered. The U.S. had to move more product at lower prices just to clear processing capacity and avoid backing milk up into farm tanks.
Three Fundamentally Different Kinds of Export Growth
Understanding which type you’re looking at matters because they have very different implications for long-term sustainability.
Demand-driven growth that actually helps you. Mexico is the poster child. Big, growing population with a rising middle class. Persistent structural milk deficit—can’t self-supply because of climate constraints and limited production infrastructure. The U.S. typically supplies the bulk of Mexico’s dairy imports due to geographic proximity and the USMCA trade framework. Mexico now accounts for roughly one-third of all U.S. dairy exports, according to USDA export data. Here, exports are pulled by genuine demand. Volume increases, prices stay reasonably firm, and geography, logistics, and stable trade agreements anchor the trade relationship.
Supply-driven exports that signal trouble. The U.S. pushes more NFDM, whey, and other bulk commodities because domestic fluid consumption is flat to declining, and cheese and butter production can’t absorb everything. When China or Southeast Asia is buying, that surplus moves. When tariffs shift or political tensions rise, the same product has to be rerouted or discounted into weaker outlets. You still export it, but at prices that drag your milk check down because you’re selling into a buyer’s market, not a shortage market.
“When production growth exceeds domestic consumption growth by 2-3 percentage points, headlines calling that ‘export strength’ are basically describing an oversupply problem with better PR language.”
Political-theater exports that shift with headlines. Deal announcements and tariff suspensions that show up right before elections or major summits. The late-2025 easing of certain China tariffs and framework language on dairy market access is a good example: some relief on paper, but clearly conditioned and reversible depending on broader trade negotiations. These can bump market sentiment or create a short-term sales pop, but they’re not something you build a 10-year expansion plan around.
The Math That Tells You If Export Growth Is Actually a Warning Sign
Production growth minus domestic consumption growth equals pounds that must be exported, whether or not world demand actually grew that much.
In 2025, U.S. milk output grew about 4% year-over-year in certain months, according to USDA Milk Production reports, while overall domestic demand only crawled up around 1-2% across fluid, cheese, butter, and yogurt categories. That left a couple of percentage points of total production with nowhere to go domestically, forcing it into export channels at whatever price cleared the market.
When you see that pattern, it’s a structural red flag. And prices behave accordingly.
Interest Rate Cuts: Timing Can Make Cheap Money a Weapon
The Federal Reserve lowered the federal funds rate to 4-4.25% through a series of cuts in late 2024 and 2025, as heifer costs tripled, components were repriced, and processors desperately needed a reliable milk supply.
Cheaper money can actually be a strategic weapon right now, but only if deployed in very specific, de-risked ways that align with the structural shifts already in motion.
Where Lower Rates Create Genuine Competitive Advantage
Financing competitive genetics, not raw cow numbers. If you’re on the wrong side of the new component economics—running below 3.3% protein with mediocre butterfat—the real lever is genetics improvement, not adding headcount. A multi-year program combining sexed semen, targeted culling, strategic purchasing, and genomic testing can easily land in the mid-six to low-seven figures over 5-7 years. With borrowing rates closer to 5% than 8%, the financing cost for that genetic improvement program drops meaningfully over the life of the investment, improving returns and shortening payback.
Processor-backed capital arrangements. Processors sitting on half-empty, multi-hundred-million-dollar plants are far more sensitive to utilization than you are to adding a few extra cows. Some are already offering volume incentives, multi-year price deals, and capital assistance for heifers, genetics, or equipment for their anchor milk suppliers. Their cost of capital is often lower than yours. If they can borrow in the 4-5% range and turn that into 7-9% plant-level returns by filling processing capacity, it makes sense for them to co-finance your replacements or automation at mid-5% interest, rather than you borrowing at 7-8% independently.
Automation in a structurally tight labor market. Labor is the one input category everyone agrees is structurally constrained and getting worse. In the Northeast, where labor costs already exceed $18-20 per hour and qualified milkers are nearly impossible to find, the automation ROI math shifted even more dramatically, as USDA farm labor reports consistently document. In the Southwest, where temperatures routinely exceed 100°F and dairy-qualified labor has migrated to higher-wage construction and energy sectors, the combination of climate-related worker stress and wage competition makes automation ROI even more compelling.
Robotic milking systems, automated feeding equipment, and similar technologies typically require investments of $200,000-$700,000, depending on herd size and configuration. At 8% many of those projects were borderline on return. Knock financing down into the 5% range and combine that with another 10-20% jump in prevailing wages for qualified dairy labor, and suddenly the payback math looks dramatically different.
Where lower rates don’t save you: Generic herd expansion without locked-in buyers and replacement heifer availability is still terrible math. Cheap debt financing on top of scarce replacements and volatile milk prices is just leveraged hope wearing a lower interest rate. The fundamentals have to work first—financing just makes good fundamentals better.
Trade Wars and Tariff Volatility: Structural Markets Versus Political Theater
Trade policy volatility creates real pricing swings that require protection protocols. Late 2025 tariff adjustments on certain dairy products, including whey and NFDM, provided export relief that helped prevent an even uglier milk surplus from hitting Class III pricing. But tariff swings—from roughly 20% to triple digits and back down, as happened with certain Chinese dairy tariffs through 2024-2025—proved these are political levers subject to rapid change, not stable market foundations you build expansion plans around.
Before you bet significant capital on trade-dependent growth, here are the questions worth asking:
Are U.S. prices at a premium to global benchmarks or a discount? If CME cheese, butter, and powder prices are consistently above New Zealand GDT auction equivalents or EU spot markets, the world is pulling on U.S. product due to quality, logistics, or a genuine shortage. If the U.S. is at parity or trading at a discount, we’re the cheap barrel dumping surplus, not the prized supplier.
If tariffs doubled tomorrow, would your export market still buy U.S. product? True structural markets, like Mexico, tend to retain a substantial U.S. share even amid friction due to geography, logistics, existing relationships, and structural deficits. Tariff-fragile commodity buyers like China for whey and NFDM often shift to whoever offers the lowest landed cost after tariffs.
Is your buyer growing exports on top of a healthy domestic business, or because domestic demand can’t absorb the milk? If it’s the latter, export growth is just the pressure relief valve of an oversupply machine, and prices will reflect that reality.
The 2026 USMCA review with Canada matters considerably in the medium run because Mexico is a more stable, higher-share destination for U.S. dairy exports than politically volatile markets in Asia. That doesn’t mean ignore Asia entirely—it means understand the difference between structural and opportunistic trade relationships.
New World Screwworm: Low-Probability, High-Consequence Wildcard
Since late 2024, New World Screwworm has advanced steadily north through Mexico. The critical moment came September 21, 2025, when an eight-month-old heifer in a certified feedlot at Sabinas Hidalgo, Nuevo León—less than 70 miles from the Texas border—tested positive for New World Screwworm, according to USDA APHIS emergency notifications.
USDA and Mexican agricultural authorities ramped up sterile-fly release programs, deployed trap grids with around 8,000 traps across key southern states, and conducted sample screening, analyzing over 13,000 samples through December with no U.S. detections confirmed, according to APHIS situation reports. New sterile-fly production infrastructure came online in Texas with a dispersal facility established in Tampico, Mexico.
What Happens If NWS Is Confirmed in a U.S. Commercial Herd
What makes this worth watching closely is how fast the operational landscape changes if—and it’s still an if at this point—NWS gets confirmed in a U.S. commercial herd.
In the first 72 hours after lab confirmation, emergency notifications go out, and markets don’t wait for full epidemiology reports. Local auctions and feedlots stop accepting cattle from the suspect region immediately. Buyers step back or apply steep discounts to anything from the affected area, anticipating movement restrictions. Feeder cattle prices in the affected zone gap sharply lower.
Within a week or two: APHIS would define quarantine zones with specific geographic boundaries, restrict livestock movement out of those designated areas, and ramp up mandatory inspections and surveillance protocols. That effectively freezes cattle as collateral, snarls normal feedlot marketing flows, and triggers immediate red flags in packers’ and agricultural lenders’ risk management systems.
For integrated dairy-plus-beef-calf operations: Any beef-on-dairy calves in feedlots within or near quarantine boundaries can’t be moved as originally planned. Feed costs keep accruing daily. New calves may suddenly have nowhere to go without accepting a massive price haircut or waiting months for marketing. The same beef-on-dairy income stream that’s been a profit engine for three years can flip into a cash-flow risk almost overnight.
Practical Risk Management Moves Worth Considering
Map where your cull cows and beef-on-dairy calves typically go, and identify alternative marketing outlets genuinely outside likely quarantine radiuses if southern border states face restrictions. Producers in affected regions report developing contingency marketing plans with feedlots and buyers in neighboring states—not because they expect the worst, but because the cost of planning is minimal compared to scrambling during a crisis.
Stress-test operating cash flow assuming a 60-90 day period where beef-calf revenue is sharply reduced, delayed, or requires expensive transportation to alternative markets. Talk to lenders now about how an NWS-driven cattle movement disruption would affect loan covenants and whether pre-agreed covenant flexibility or temporary relief is possible before you need it.
Consider quietly trimming beef-on-dairy exposure slightly and modestly building dairy replacement capacity and cash reserves heading into the higher-risk spring and summer 2026 window. This isn’t about panic—it’s about building operational flexibility that serves you well regardless of whether NWS crosses the border or stays contained in Mexico.
Unlike the heifer shortage or FMMO component changes, this one doesn’t respect careful planning horizons. Once NWS crosses into established U.S. herds and gets a foothold, the first 30-60 days are about damage control and operational paralysis, not optimization and strategic positioning.
Farm Bill Extensions and Baseline Program Stability
Farm bill extensions throughout 2025 maintained operational stability through renewal of the DMC program, continuation of conservation program funding, and sustained support for Market Access Program trade promotion activities, according to Congressional appropriations language and USDA announcements.
The extensions provided operational certainty amid ongoing political gridlock on comprehensive farm policy reform, keeping baseline safety net programs intact while longer-term policy debates and structural reform discussions continue into 2026.
For producers, this means the safety net remains in place and predictable, but it also means the deeper structural challenges the industry faces—consolidation pressure, component economics, global competition, labor constraints—won’t be addressed through major policy overhauls in the near term. The strategic focus shifts to optimizing within the existing policy framework rather than waiting for Washington to solve fundamental competitive challenges through legislation. That’s not cynicism—it’s realism based on how policy actually develops in divided political environments.
HPAI Surveillance Through National Milk Testing
Ongoing surveillance of highly pathogenic avian influenza through the National Milk Testing Strategy implemented by USDA APHIS aimed to mitigate risks to dairy cattle and milk supply integrity. With most states participating in routine milk-testing protocols and a new H5N1 genotype highlighting ongoing wild-bird spillover dynamics, HPAI remains something to manage actively through biosecurity, not to center long-term strategy around.
Confirmed herd impacts through late 2025 were confined to a limited number of states—primarily California, Colorado, and Michigan—with manageable mortality rates in most affected herds, according to APHIS weekly situation reports. Maintain rigorous biosecurity protocols, including visitor controls, equipment sanitation, and active wildlife management around feed storage and water sources. But outside recognized hot-spot regions, this is operational hygiene and risk mitigation, not a fundamental competitive differentiator or strategic constraint.
The key distinction worth making: HPAI requires attention and good biosecurity practices, but it doesn’t fundamentally reshape competitive positioning the way component pricing or heifer availability does. Treat it seriously without letting it dominate strategic planning.
Whole Milk in Schools: Cultural Win, Minimal Cash Impact
The Whole Milk for Healthy Kids Act gained strong bipartisan support throughout 2025, with the Senate approving the bill and sending it to the House for consideration, according to Congressional records. The legislation would allow flavored whole milk and unflavored low-fat milk back into school nutrition programs after years of restrictions.
School milk accounts for only about 8% of total U.S. fluid milk demand, according to USDA consumption data, and one policy change won’t reverse more than a decade of structural decline in fluid consumption by itself. It’s a meaningful cultural and political win that reinforces the broader shift toward full-fat dairy products and could provide modest long-term demand support, particularly for younger consumers forming preferences. But it won’t materially move your 2026 milk check.
Pay closer attention to sustained growth areas like cottage cheese—which saw double-digit percentage growth throughout 2024-2025, according to USDA dairy products reports—and the high-protein and Greek yogurt categories, which are driving more substantial incremental volume than school milk policy shifts will deliver. Those categories matter because they’re pulling volume based on shifts in consumer demand, not policy adjustments.
The One Constraint You Cannot Afford to Get Wrong
Out of everything that happened in 2025, replacement heifers represent the binding biological constraint. Every other structural force you’re dealing with—biological lag from beef-on-dairy breeding, component repricing through FMMO changes, overbuilt processing capacity, trade volatility, interest rate shifts—ultimately hits the wall of replacement heifer availability and cost.
CoBank and other agricultural lenders expect U.S. dairy heifer inventories to stay at 20-year lows and shrink further before rebounding after 2027, with the national replacement deficit measured in the hundreds of thousands of head. At current pricing levels, expansion shifts from a barn-and-bank problem to a biology-and-capital-allocation problem.
The Real Strategic Fork in the Road
Most people think the decision is breed versus buy. The actual fork is whether heifer supply normalizes—prices drop meaningfully, availability improves—by around 2027-28 as CoBank projects, or whether supply stays structurally tight and constrained well into 2029-30 if breeding behavior doesn’t shift fast enough or if beef-on-dairy economics stay attractive enough to slow the return to dairy replacements.
If scarcity lasts longer than expected and you didn’t move proactively in 2026, you’re 18-24 months behind neighbors who locked in genetics programs, secured heifer supply agreements, and negotiated processor partnership deals early. If supply unexpectedly normalizes faster and you did invest heavily in a robust internal heifer development program, you’re still positioned well: you’ve got home-grown, high-component replacements at a production cost far below whatever the new market-clearing price settles at.
Both scenarios reward proactive planning. The risk lies in waiting to see what happens.
Three Real Strategic Paths Forward
Internal rebuild: slow, capital-intensive, operationally independent. Stop counting on the open market for replacements and rebuilds; build sufficiency from within your own genetics. Slash beef-on-dairy usage to the bare minimum—reserve it only for the bottom 10-15% you’re actively purging. Use sexed dairy semen on the top tier of the herd and conventional dairy on the middle tier. Accept a few challenging years of higher rearing costs and lost beef-calf revenue while you rebuild your own replacement pipeline from the ground up.
This path takes the longest but gives you complete control and insulates you from market price volatility. Producers who began this transition in early 2025 have described the approach as an expensive insurance policy against future supply constraints. That captures it well.
Processor-financed growth: faster, relationship-dependent, shared risk. Lean directly into the capital mismatch that’s driving processor behavior. Approach your buyer with hard numbers: your current volume, component profile, and realistic growth potential over 24-36 months. In exchange for a firm multi-year volume commitment with delivery guarantees, negotiate a base price and component premium structure locked through at least 2028, cost-sharing or direct co-financing on replacement heifers, and potentially financial assistance on automation or facility upgrades that directly support the additional volume they need.
This path is faster but requires trust, transparency, and a processor genuinely desperate for a reliable milk supply. Not every processor relationship supports this approach, but for those that do, the economics can be compelling.
Hybrid approach: flexible, moderate growth trajectory. Split the difference strategically. Dial back beef-on-dairy usage significantly, but don’t eliminate it entirely—maintain maybe 15-20% beef breeding to generate some beef-calf income and purge your weakest genetics. Grow internal replacements to cover baseline needs. Use selective external heifer purchases, ideally with some processor financial assistance or partnership, to avoid herd shrinkage or to add modest 10-15% growth capacity.
Aim for controlled expansion and steady genetic improvement rather than a dramatic step-change in herd size. This balances flexibility with progress and suits operations that value optionality.
“By 2028, the difference between operationally competitive and planning an exit will trace back to a set of heifer and genetics decisions you either made deliberately in 2026, or let the market make for you by default.”
The Window for Strategic Action Is Shorter Than It Appears
Your leverage with processors is real right now, but it isn’t permanent. Processing capacity will eventually fill as replacement inventories rebuild and milk supply catches up to the $11 billion of new stainless steel that came online in 2025. Between now and late 2027 or 2028, producers who genuinely understand the mismatch—capital deployed on growth assumptions that biology is delayed by 30+ months—have a once-in-a-cycle opportunity to lock in better premiums, real partnership structures, and multi-year agreements that still look attractive when the leverage pendulum inevitably swings back toward processors.
The biology is the biology. The only variable is how you respond to it.
Key Takeaways:
Biology dictates timing: An 800,000-head heifer deficit creates a 27-month expansion constraint through late 2027 that capital can’t override—breeding decisions made in 2022-2023 are binding today’s strategic options, regardless of farm size or financial strength
Leverage window is narrow: $11 billion in new processing capacity collided with biology-capped milk supply, creating temporary negotiating power for reliable producers to lock better premiums, multi-year contracts, and processor-backed financing before leverage evaporates in 2027-2028
Component standards reset competition: FMMO protein requirements rose to 3.3%, creating permanent $1+ per hundredweight advantages for high-component herds—but genetic improvement takes 4-6 years, making 2026 breeding decisions critical for competitive positioning through 2030
Multiple strategic paths work: Three approaches suit different operational realities—internal genetic rebuilds (independent, slower), processor-financed growth (faster, relationship-dependent), or hybrid strategies—each with distinct capital requirements, timelines, and risk profiles
Act while forces align: Ten interconnected developments—heifer shortage, processor overcapacity, component repricing, trade volatility, and more—temporarily favor proactive producers, but the strategic window closes as heifer inventories normalize after 2027 and 2026 decisions determine positioning through 2028
Executive Summary:
Ten interconnected forces reshaped dairy’s competitive landscape in 2025—from the 800,000-head heifer deficit locked in by beef-on-dairy breeding to $11 billion in processing capacity that came online just as biology capped supply growth. The collision created temporary producer leverage with desperate processors, permanent component repricing through FMMO changes to 3.3% protein, and widening performance spreads exceeding $1 per hundredweight. These forces simultaneously redefined expansion math, genetics timelines, processor negotiations, and risk management. The strategic window to capitalize on leverage, rebuild genetics, and lock multi-year terms closes after 2027 as heifer inventories recover. This year-in-review connects all ten forces, maps three pathways for different operational realities (internal rebuilds, processor-financed growth, hybrid approaches), and provides decision frameworks for the narrow action window ahead.
Complete references and supporting documentation are available upon request by contacting the editorial team at editor@thebullvine.com.
Learn More:
The $4,000 Heifer: Seven Strategies to Navigate the New Dairy Economy – Delivers seven immediate financial and operational defenses against rising replacement costs, offering specific input cost adjustments and partnership models to mitigate the 27-month biological lag described in the main analysis.
Every week, thousands of producers, breeders, and industry insiders open Bullvine Weekly for genetics insights, market shifts, and profit strategies they won’t find anywhere else. One email. Five minutes. Smarter decisions all week.
Here’s the thing about national averages—they can hide more than they reveal. While USDA reports 3%+ growth, one state added 50,000 cows and another lost 21,000. Let me walk you through what’s really happening and the decisions that matter most before spring.
Executive Summary: Here’s what the national dairy numbers aren’t telling you: Texas added 50,000 cows last year while Washington lost 21,000—and both get averaged into that 3% growth everyone’s celebrating. Three self-reinforcing factors explain why herds haven’t contracted despite margin pressure: heifer prices above $3,400, making culling uneconomical; beef-on-dairy breeding consuming 25% of the herd’s replacement capacity; and feed costs near multi-year lows. Add $11 billion in new processing capacity coming online through 2028—much of it potentially misaligned with where milk will actually be produced—and you’ve got an industry approaching a meaningful reset. Smart producers have a 90-day window to hedge feed costs, lock in replacement strategies, and have honest conversations with their processors and bankers. The operations that come out ahead won’t just be the best operators—they’ll be the ones who understood their regional trajectory and kept enough flexibility to move when the time came.
You’ve seen the headlines by now. Milk production up. Herd expanding. Cheese exports are hitting records.
Now here’s what those numbers don’t tell you.
There isn’t one U.S. dairy industry anymore. There are at least two, maybe three—and they’re operating under completely different conditions, facing completely different futures. A producer in the Texas Panhandle and a producer in Washington’s Yakima Valley might see similar milk prices on any given month. But you know what? They’re playing entirely different games right now.
I should mention upfront: not everyone sees it this way. I was talking with a consultant last month who made a pretty compelling case that strong export demand signals continued growth across the board. And honestly, the optimists might be right. But the regional divergence I’ve been tracking suggests the headline numbers are masking something we all need to understand.
So let me show you what I mean.
The Great Divide: Where Dairy Is Growing vs. Where It’s Shrinking
That national milk production number everyone’s quoting—up more than 3% in August according to USDA NASS—is really just the average of dramatically different regional stories.
Here’s how it actually breaks down:
Region
What’s Happening
The Numbers
What’s Driving It
Texas
Rapid expansion
+50,000 cows in 12 months
Processing built ahead of herds; lighter regulations
Data from USDA NASS September 2025, Dairy Herd Management, Farmers Advance, and IDFA analysis
You see what’s happening here? Texas added enough cows to fill a major cooperative. Washington lost enough to empty one. And we’re calling that a “national trend.”
What’s Fueling the Growth States
I had a chance to tour a newer Texas Panhandle operation last spring, and a few things really stood out to me.
First—and this is important—the processing came before the cows. Cheese plants in Dumas, Amarillo, and Lubbock were already running when producers started expanding. That sequencing matters more than people sometimes realize. You don’t have to wonder where your milk’s going when there’s a plant down the road hungry for supply.
The feed economics work differently out there, too. Land costs and crop prices create structural advantages that are hard to replicate in traditional dairy regions. And while Texas certainly has regulations, the overall compliance burden is measurably lighter than that faced by coastal operations.
South Dakota’s telling a similar story. Dairy Herd Management reports that Valley Queen’s expansion could accommodate roughly 25,000 additional cows over 2025-2026. The processor built the capacity first. The cows are following.
What’s Driving the Contraction
Now, Washington’s situation… that’s tougher to watch.
A producer I know in the Yakima Valley—third-generation, solid operator—told me he’s spending more time with regulators than with his cows some weeks. That’s an exaggeration, but it captures something real about what’s happening out there.
The challenges are stacking up: groundwater nitrate issues have brought EPA involvement to some operations. The Washington State Department of Ecology is proposing regulations that would substantially increase costs. Labor costs run higher than competing regions. And the result, according to Dairy Herd Management, is 21,000 fewer cows in October compared to the prior year.
California’s dealing with its own complexity—H5N1 outbreaks have hit productivity in numerous Central Valley herds, contributing to declining milk per cow even while the overall herd held relatively steady. It’s a different challenge, but the direction is similar.
Producers Who’ve Made the Move
Not everyone’s standing still, though. I’ve talked with a few producers who saw the writing on the wall and made strategic relocations. One Wisconsin family I know sold their 800-cow operation two years ago and partnered with an established South Dakota dairy. They’re now managing a larger string with better margins and—here’s what surprised them—less overall stress despite the bigger numbers. “The regulatory load alone,” the son told me, “freed up 15 hours a week we used to spend on paperwork.”
That’s not the right move for everyone. Plenty of operations have deep roots, family land, and established processor relationships that make staying put the smarter play. But it’s worth noting that some producers actively choose their region rather than just accept the one they inherited.
The Math Is Broken: Why High Costs Didn’t Shrink the Herd
Here’s something that’s been puzzling economists for months now: margins got squeezed, but culling rates stayed low. The national herd actually grew when every historical pattern said it should contract.
What’s going on? Three factors, and they’re all connected.
Metric
2022
2024
2025
Replacement Heifer Price ($/head)
$2,400
$2,900
$3,400
Beef-on-Dairy Breeding Rate (%)
18%
22%
25%
Feed Cost ($/cwt)
$11.20
$10.10
$9.38
Cull Rate (%)
38%
34%
31%
Heifer Shortage Severity
Moderate
Elevated
Critical
Replacement Heifers Got Really Expensive
You probably know this already if you’ve been to an auction lately. Current prices from USDA Agricultural Marketing Service reports:
Upper Midwest: $3,200-$3,500 per head for quality replacements
Premium springers:$4,000+ at some California and Wisconsin auction barns
Mark Stephenson—he’s the director of dairy policy analysis at the University of Wisconsin-Madison—has pointed out that at these prices, payback periods on marginal replacements stretch to nearly 15 years.
I was talking with a 400-cow producer in central Wisconsin who put it pretty simply: “At $3,400 a head, I’m not culling anything that can still put milk in the tank.” And that sentiment seems widespread.
Beef-on-Dairy Changed Everything
This is the part that doesn’t get enough attention, in my view. Council on Dairy Cattle Breeding data shows roughly 25% of the dairy herd is now bred to beef genetics. Those crosses are generating $400-$600 premiums—sometimes more—for quality blacks with good conformation.
But here’s the catch, and it’s a big one: every beef-cross calf is a dairy heifer that doesn’t exist.
The heifer shortage isn’t temporary. It’s structural. And it’s self-reinforcing.
Feed Costs Hit Multi-Year Lows
The USDA Dairy Margin Coverage program calculated feed costs at $9.38 per cwt for August 2025. The Center for Dairy Excellence confirmed that figure—down nearly 50 cents from July. That’s among the lowest readings we’ve seen in years.
When feed is cheap, even that older cow in the back pen—the one you’d normally have shipped by now—can still contribute to cash flow. The economic pressure to cull just isn’t there.
And here’s the trap: These factors reinforce each other. Expensive heifers mean you keep old cows. Keeping old cows means you don’t need expensive heifers. Beef-on-dairy means fewer heifers get born anyway. And cheap feed makes all of it pencil out.
For now, anyway.
Feed Cost Outlook: Why Many Advisors Are Saying Hedge Now
Here’s what’s interesting about the forward markets. CME Group data shows that December 2026 corn futures are trading above current spot prices. The market’s signaling higher costs ahead.
Timeframe
What Corn’s Telling Us
What It Means for Feed Costs
Right now
Favorable pricing
$9.38/cwt (August DMC calculation)
Dec 2026 futures
Higher than spot
Could push toward $11.00+/cwt
Normal price swing
+$0.50-$0.75/bushel
Adds $1.50-$2.00/cwt to your feed line
Now, futures markets have been wrong before—I want to be honest about that. But the signal’s worth noting.
The window to lock in favorable feed pricing may be closing. I’ll get into specific timing in the action steps below.
Period
Feed Cost ($/cwt)
Futures Signal
Aug 2025
$9.38
Spot (Favorable)
Nov 2025
$9.50
Favorable
Mar 2026
$10.20
Rising
Jun 2026
$10.80
Elevated
Sep 2026
$11.20
High
Dec 2026
$11.40
High
The Processing Puzzle: $11 Billion in New Capacity—But Is It in the Right Places?
IDFA confirmed during Manufacturing Month that more than $11 billion in new dairy processing capacity is coming online through 2028 across 19 states. That’s cheese plants, butter facilities, powder operations, and fluid processing. It’s a massive investment that reflects real confidence in American dairy’s future.
But here’s the question worth asking: Is it being built where the milk will be?
The Mismatch Worth Watching:
Region
Processing Investment
Milk Supply Trend
What to Watch
Wisconsin
Major expansions underway
Essentially flat production
Where does the milk come from?
Pacific Northwest
Darigold’s $1 billion Pasco plant (8M lbs/day)
Contracting 8.5% annually
Real supply/capacity tension
Texas/South Dakota
Matched to growth
Expanding steadily
Better alignment
I don’t have a definitive answer on how Darigold plans to fill a billion-dollar facility when regional supply is declining nearly 9% annually. Their leadership clearly sees a path forward that I may not fully appreciate—and they know their market far better than I do.
But facilities built expecting 90%+ utilization that end up running at 70-75%… that financial stress eventually flows somewhere. Often, back to producers through milk payment adjustments or cooperative equity calls. It’s something to be aware of.
The Silent Partner: Why Your Banker Decides Who Survives 2026
Here’s something that rarely makes industry headlines but may matter as much as milk price or feed cost.
When margins compress—and they will at some point; they always do—the question isn’t just “Can my farm cash flow at $14 milk?” It’s “Will my lender give me time to get back to $17?”
That’s not purely an economic question. That’s a relationship question. And it might quietly decide who’s still farming in 2028.
Two producers with nearly identical cost structures can face completely different outcomes:
Producer A
Producer B
Modest leverage
Aggressive expansion of debt from low-interest years
Six months of working capital
Thin operating lines
Lender who’s been through dairy cycles
Lender with stressed ag portfolio
Gets patience when needed
Gets pressure instead
A farm financial consultant I was talking with in Minnesota made this point effectively: the best-positioned producers right now aren’t just focused on cost per cwt. They’re using this window—while milk checks are decent and lines aren’t maxed—to:
Clean up any covenant issues
Term out short-term debt into longer amortizations
Build transparent, data-driven relationships with their lenders
The operations that emerge as consolidators on the other side of any transition won’t necessarily be the best operators. They’ll often be the ones whose banks stayed in the game.
The Biosecurity Wildcard: H5N1
I’d be remiss not to mention what’s been on everyone’s mind this year.
USDA APHIS has confirmed Highly Pathogenic Avian Influenza outbreaks in dairy cattle across multiple states, including Kansas, Idaho, Texas, Iowa, and others. The virus can move between herds, particularly through cattle movements and the use of shared equipment.
The current picture: Economic damage has been contained and localized so far. Some affected dairies experience temporary production drops during transition periods and during the fresh-cow phase. Export partners are watching but haven’t acted dramatically.
The risk: If regulators move from “monitor and manage” to “contain and control,” the orderly consolidation we’ve been discussing could become something more disruptive.
What to do now: The basics matter more than ever. Review boot and clothing protocols. Tighten visitor policies. Isolate new animals before introducing them to the string. Be thoughtful about shared equipment between operations.
None of this is new advice for anyone who’s been around dairy cattle. But the stakes for following it have increased.
The Sustainability Angle: $0.75-$1.50/cwt in Potential Premiums
Let’s skip the greenwashing debate and talk about what actually matters here: money.
Global food companies—Nestlé, Danone, and PepsiCo—have legally binding 2030 emission targets they must meet. Multiple pilot programs are already paying producers premiums for:
Verified methane reductions
Documented feed efficiency improvements
Low-carbon-intensity milk tagged to specific supply chains
The math that actually matters:
A “preferred” supplier with documented feed conversion efficiency, verified practices, and tight nutrient management could capture $0.75-$1.50/cwt in stacked value—base premiums, carbon credits, sustainability bonuses, and preferential contract access.
What’s encouraging is that a well-managed 1,500-cow Wisconsin or New York operation with strong sustainability credentials could compete with a 3,000-cow commodity operation. The premium contracts change the math.
Scale isn’t the only path forward. For producers looking for differentiation that doesn’t require doubling herd size, this is worth exploring.
The 90-Day Plan: What to Do Before Spring
Given everything we’ve walked through, what should you actually be doing between now and late March? Let me get specific.
By Late January: Consider Locking Feed Costs
Target: Hedge around 40-50% of your projected 2026 grain needs
Why now: December 2026 corn futures are already pricing above spot; winter weather and planting signals will move markets further
Risk of waiting: March and April often bring less favorable terms
Worth talking through with your nutritionist and financial advisor.
By Late February: Make Your Replacement Decision
If you’ve got capital flexibility:
Establish financing now
Identify heifer suppliers
Be positioned to move fast if prices soften mid-2026
If you’re focused on efficiency:
Identify the bottom 15-20% of your string
Target chronic health cases and poor reproduction performers
Consider strategic culling Q1-Q2 while beef prices remain favorable
The key: Make a conscious choice. Operations that drift into mid-2026 without a strategy end up reacting rather than acting. And reactive decisions during stressed markets rarely work out as well.
By Mid-March: Have the Processor Conversation
Four Questions Worth Asking:
What percentage of our facility’s intake goes to export markets? Which destinations?
If you needed to reduce intake by 15-20%, what would the notification timeline be?
If regional supply keeps changing, how does that affect sourcing and our cost structure?
These conversations are easier to have now than during a disruption. The answers tell you a lot about your actual risk exposure.
Deadline
Critical Action
Why Now
Risk of Delay
Late January
Hedge 40-50% of 2026 grain needs
Dec 2026 futures above spot
Higher feed costs locked in
Late February
Lock replacement strategy (buy or cull)
Heifer prices still elevated
Forced culling decisions
Mid-March
Processor/banker conversations
Build relationships pre-crisis
Reactive instead of proactive
April (Post-Action)
Monitor and adjust
Flexibility to pivot
Lost opportunities
What 2028-2029 Might Look Like
If current trends hold—and that’s always a meaningful “if”—here’s what seems to be taking shape:
Fewer, larger operations. U.S. dairy farms dropped from over 40,000 to under 25,000 over the past couple of decades. Generational transitions without clear successors continue to accelerate this. It’s not inherently good or bad—it’s just the reality we’re working with.
Geographic shifts. Texas, South Dakota, and Idaho are capturing share. The Pacific Northwest faces headwinds. California likely remains the largest state, but its market share is declining.
Two distinct tracks are emerging. This is the part I find most interesting. The industry’s splitting into large-scale commodity operations—think 2,500+ cows competing primarily on cost efficiency, often in lower-regulation states with favorable feed economics—and premium/specialty production commanding meaningful price premiums through organic certification, grass-fed programs, A2/A2 genetics, or verified sustainability credentials.
Production Model
Typical Herd Size
Milk Price Range ($/cwt)
Primary Strategy
Risk Level
Large Commodity
2,500+
$16-18
Cost efficiency
Commodity exposed
Mid-Size Conventional
800-1,500
$17-19
Scale up or exit
High vulnerability
Organic Certified
400-900
$26-28
Premium capture
Protected
Grass-Fed/Verified
300-800
$23-26
Direct relationships
Moderate
A2/Specialty
200-600
$22-25
Niche differentiation
Moderate
I know a 900-cow organic operation in Vermont that’s pulling $26-28/cwt consistently while their conventional neighbors struggle at $18. Different game entirely. And a grass-fed producer in Missouri who’s built direct relationships with regional grocery chains that insulate him almost completely from commodity price swings.
Both tracks can work. The challenge is being clear about which game you’re playing—and not getting stuck in the undifferentiated middle where you’re too small for cost leadership but not specialized enough for premium markets.
This isn’t a story of decline. Dairy demand remains solid. Exports keep expanding. Well-run operations build real wealth.
But it is a story of restructuring. And the producers who navigate it successfully will be those who understand the forces at play, make deliberate choices, and maintain enough flexibility to adapt.
Resources Worth Bookmarking
If you want to track the indicators we’ve discussed, a few sources are worth checking monthly—it takes maybe 20 minutes:
USDA NASS Milk Production Reports — released around the 20th
CME Group Dairy Futures — corn, soybean meal, Class III/IV signals
The planning window’s open. What you do with it is up to you.
We’ll be watching these developments and keeping you informed as things unfold.
KEY TAKEAWAYS
The national average is hiding two industries: Texas +50,000 cows, Washington -21,000—both called “3% growth”
Three factors broke the old economics: $3,400+ heifers, beef-on-dairy taking 25% of replacements, and feed costs at multi-year lows
$11B in new processing capacity may be misaligned: Plants expanding where milk supply is flat or declining
Your 90-day action window: Hedge 40-50% of feed (January) → Lock replacement strategy (February) → Processor/banker conversations (March)
Your lender decides who survives: The winners won’t just be the best operators—they’ll be the ones whose banks stayed in the game
Complete references and supporting documentation are available upon request by contacting the editorial team at editor@thebullvine.com.
Learn More:
Feed Smart: Cutting Costs Without Compromising Cows in 2025 – Provides a tactical playbook for the “feed cost hedging” strategy mentioned in your 90-day plan. Learn specific methods for forward contracting corn below $4.60 and optimizing forage digestibility to protect margins against the potential spring rally.
The Wall of Milk: Making Sense of 2025’s Global Dairy Crunch – Expands on the “24-month trap” and global supply factors currently capping milk prices. This strategic analysis explains why the U.S., EU, and New Zealand expanding simultaneously creates the specific market ceiling your banker is watching closely.
Generate $15,000+ Annual Carbon Revenue: The Dairy Producer’s Guide – Delivers the implementation roadmap for the “sustainability premiums” opportunity. Discover how to stack Section 45Z tax credits with feed additives and carbon markets to generate new revenue streams without increasing herd size.
The Sunday Read Dairy Professionals Don’t Skip.
Every week, thousands of producers, breeders, and industry insiders open Bullvine Weekly for genetics insights, market shifts, and profit strategies they won’t find anywhere else. One email. Five minutes. Smarter decisions all week.
Why this downturn is different—and the brutal math deciding which operations survive
EXECUTIVE SUMMARY: The dairy cycle you’re waiting for isn’t coming back. China added 22 billion pounds of domestic production since 2018, permanently closing a market that absorbed half of global import growth. Meanwhile, American dairying is migrating: Texas gained 46,000 cows last year while Wisconsin lost 455 farms, and $11 billion in new Southwest processing capacity is cementing this shift for the foreseeable future. The economics have turned existential. Operations above $20 per hundredweight are hemorrhaging cash, while larger dairies at $16-17 are building war chests for acquisition. Beef-on-dairy bought time, but created a replacement crisis—heifer inventories at 20-year lows, prices hitting $4,000. This structural shakeout accelerates through 2027. The market doesn’t care about your heritage. It cares about your production costs. Do the math now, or the bank will do it for you.
Stop waiting for the cycle to turn.
Economists tracking dairy markets are increasingly using a word we don’t often hear: structural. This isn’t 2009 or 2018. The game board has changed.
The FAO’s November numbers tell the story: the Dairy Price Index recorded its fifth consecutive monthly decline, dropping to 137.5 points—the lowest since September 2024. Global food prices have fallen for three straight months. But what’s making veteran producers uneasy isn’t just the price decline. It’s what’s driving it.
The forces reshaping this market aren’t cyclical headwinds that will reverse when prices fall far enough. They’re structural shifts that have permanently altered the demand equation. Understanding that distinction changes everything about how we should approach the next few years.
The China Syndrome: Why the Export Dragon Stopped Roaring
If there’s one development that separates this market environment from previous downturns, it’s China’s move toward dairy self-sufficiency. We’ve heard “China is changing everything” before, and sometimes those predictions haven’t aged well. But this time? The numbers don’t lie.
Between 2018 and 2023, China increased domestic milk production by 10 million metric tonnes. Let that sink in for a moment—that’s roughly 22 billion pounds of new milk supply that used to come from exporters like us. According to the USDA Foreign Agricultural Service, they reached the 40.5 million tonne target ahead of schedule. This wasn’t gradual market evolution. It was deliberate policy execution backed by massive state investment.
The Rabobank analysts tracking this have documented the shift in brutal detail. China’s dairy self-sufficiency climbed from roughly 70% in 2018 to approximately 85% by 2023. Their whole milk powder imports got cut in half in a single year—dropping from 845,000 metric tonnes in 2022 to just 430,000 in 2023.
And the domestic farms driving this aren’t small operations. Chinese dairy farms with more than 1,000 head grew from 24% of the national herd in 2015 to 44% by 2020, with government targets pushing toward 56% by 2025. These are modern, efficient mega-dairies designed to eliminate import dependency.
Why does this matter for a dairy farmer in Minnesota or Idaho, or Vermont? Because China was absorbing roughly half of global dairy import demand growth during the 2010-2020 period. That demand engine hasn’t just stalled—it’s running in reverse.
In five years, China added over 10 million tonnes of domestic milk and pushed self‑sufficiency toward 85%. That milk used to be your outlet. Betting on a Chinese demand rebound today is like betting that a brand‑new barn will sit empty.
Industry economists point out that even optimistic forecasts project only about 2% growth in Chinese imports for 2025. That’s nowhere near sufficient to absorb the additional production coming from major exporting regions.
Could Chinese demand recover faster than expected? A severe domestic disease outbreak or major policy shift could alter the trajectory. But those mega-dairy operations represent 20-30 year infrastructure investments. They’re not going away. Building your business plan around hoping they will is a recipe for disappointment.
The Great Migration: Why the Cows Are Leaving the Heartland
While global demand dynamics shift, something equally dramatic is happening right here at home. The geographic center of American dairying is moving—and moving fast.
The USDA’s production reports tell the story. Texas added about 46,000 dairy cows between late 2023 and early 2025, increasing from about 635,000 to roughly 690,000. Texas accounted for about 56% of all U.S. herd growth during that period. Production in the state increased by more than 10% year over year. Kansas added another 29,000 head. South Dakota grew by 21,000.
What’s driving it? Processing capacity. New cheese plants are pulling production to the region like gravity.
Texas A&M AgriLife Extension has been tracking the build-out: Cacique Foods opened their cheese plant in Amarillo in May 2024. Great Lakes Cheese completed their Abilene facility late last year. H-E-B’s processing operation in San Antonio opens this summer. And Leprino Foods’ Lubbock facility reaches Phase 1 completion in early 2026.
Meanwhile, traditional dairy states are hemorrhaging farms. Data from the Wisconsin Department of Agriculture shows the state lost 455 licensed dairy farms in 2023, with monthly exits running at 87-94 operations through late 2024—94 dairies exited in October, 94 in November, and 87 in December.
Here’s the twist: total herd size stayed relatively flat at around 1.27 million cows, and production actually ticked up slightly. The remaining farms are becoming remarkably more efficient—Wisconsin producers achieved 10-pound-per-cow yield gains last year, double the national average.
California faces its own pressures—water constraints and regulatory costs have contributed to herd reductions in recent years, though the state remains the nation’s top milk producer. In the Northeast, many operations have found viability through fluid milk premiums and direct market relationships that provide some insulation from commodity swings.
The cows aren’t leaving these states entirely. They’re concentrating into fewer, larger operations. That’s consolidation, not collapse—though the distinction offers cold comfort to the families exiting the business.
Texas, Kansas, and South Dakota are quietly adding tens of thousands of cows, while Wisconsin loses hundreds of licenses. This isn’t a slow fade; it’s a rerouting of national milk supply toward steel, stainless, and dryer capacity in the Southwest.
The Brutal Math: Why Location Determines Survival
Let’s cut through the sentiment.
When you build a new dairy operation in Texas or the Southwest, you’re typically building at a 3,000-5,000 cow scale with modern facilities optimized from the ground up. Land costs range from $2,000 to $ 3,500 per acre. Feed availability is strong—corn belt proximity, regional sorghum production, steady distillers grain supplies. University extension budgets from the region suggest efficient large operations can often achieve costs of production in the $15-17 per hundredweight range.
Wisconsin operations face different math. Land costs run $6,000-8,500 per acre—two to three times Texas levels. Existing farms often average 100-300 cows. Extension analysis from the region puts the average dairy’s cost of production in the $18-21 per hundredweight range.
At current milk prices of $17-19, that cost differential isn’t just significant; it’s substantial. It’s existential.
A Texas 4,000-cow dairy optimized from scratch can show positive margins at these prices. A 200-cow dairy in the Upper Midwest at the same prices is bleeding cash every single month.
Heritage and sentiment don’t pay the bills. If you’re milking 200 cows in Wisconsin without a niche market or paid-off land, the math is working against you every single month. That’s not pessimism—it’s arithmetic.
This doesn’t mean Upper Midwest dairy is dead. Wisconsin has real advantages: exceptional forage quality, deep industry infrastructure, generations of expertise, and world-class cheese-making facilities. But the farms that thrive there will look different than the traditional model. Larger. More efficient. More specialized. The producers who recognize this and adapt will survive. The ones waiting for the old economics to return will not.
Following the Cheese: Where the Processing Money Is Going
Dairy processors are making strategic allocation decisions that favor cheese production over commodity powders. These decisions have direct implications for which farms command premium pricing.
The investment numbers are staggering. According to the International Dairy Foods Association’s October announcement, U.S. dairy processors are putting approximately $11 billion into more than 50 new or expanded facilities across 19 states, with projects coming online between 2025 and early 2028. Industry publications are calling it the largest investment wave in U.S. agricultural processing history.
The market signal is clear: cheese demand remains genuinely strong. Global cheese market projections show growth of 4-5% annually through 2035. U.S. cheese exports surged significantly in 2025. Domestic consumption continues climbing.
Powder markets tell a different story. The FAO noted that weak import demand for powders—particularly from Asia—contributed to recent price declines, with heavy butter and skim milk powder inventories in the EU adding pressure.
This creates a pricing divergence showing up directly in milk checks. Industry reports from October showed the spread between Class III and Class IV prices reaching around $2.47 per hundredweight—historically wide. For a 500-cow farm, that’s a meaningful income difference depending on how your milk gets allocated.
The guidance from dairy economists is straightforward: think carefully about component profiles and processor relationships. Farms optimizing production for cheese components—typically balanced butterfat-to-protein ratios in the 1.15-1.20 range—are positioning themselves for the products processors actually need.
The Beef-on-Dairy Trap: When Short-Term Cash Creates Long-Term Problems
Beef-on-dairy helps cash flow. No question about it. According to NAAB data, beef semen sales to dairy farms reached 7.9 million units in 2023, with 2024 showing continued growth. Farms producing 300 beef-cross calves annually at current market prices of around $1,400 per head are generating substantial supplemental income.
But beef-on-dairy creates downstream consequences that are about to bite.
CoBank’s dairy analysis team has documented what’s coming: they project roughly 357,000 fewer dairy replacement heifers available in 2025, with an additional 439,000 fewer in 2026. These shortfalls reflect breeding decisions made in 2022-2023 that can’t be reversed. It takes more than two years for a heifer calf born today to enter the milking string.
Here’s where the math gets ugly. CoBank’s analysis shows heifer inventories have fallen to a 20-year low, with prices at some auctions reaching $4,000 per head. Think about that for a moment. If you’re selling beef-cross calves for $1,400 and you need to buy replacement heifers at $3,500-$4,000, the economics of that trade look very different from than they did two years ago.
New processing capacity coming online in 2025-2026 needs milk supply now. But the heifer rebound won’t materially impact milk supply until 2027-2028 at the earliest.
“The beef check helps. But it buys time rather than solving the underlying milk price problem. What producers do with that time is the real question.”
The Scale Advantage: Why Size Matters More Than Ever
USDA’s Economic Research Service publishes cost-of-production data that shows why scale has become the critical survival factor.
For a 500-cow operation at current prices around $18 per hundredweight, total production costs often run in the $20-21 per hundredweight range. Run those numbers across annual production, and you’re looking at losses approaching $300,000 or more per year. That’s roughly $600 per cow in the red.
A 2,000-cow operation at the same milk price sees different economics. Total production costs can run closer to $16-17 per hundredweight when you spread overhead across more volume. That translates to potential profit approaching $1 million annually—$450-500 per cow in the black.
Same milk price. Opposite outcomes.
A 200‑cow Upper Midwest dairy can lose roughly $300,000 a year at $18 milk while a 2,000‑cow Southwest unit clears close to $1 million. Same mailbox price, completely different story. If you don’t know which cost bar represents your farm, you’re flying blind into this shakeout.
The cost advantage comes primarily from non-feed costs: overhead, labor, equipment, and management spread across more production. Agricultural economists note that the cost curve has gotten steeper over the past decade. The spread between high- and low-cost producers has widened, meaning price downturns hit the bottom quartile much harder than in previous cycles.
Operations losing $300,000 annually are burning through reserves. With typical liquid reserves of $50,000-150,000, these farms face 6-18 months before financial stress forces difficult conversations with lenders. The larger operation strengthens its balance sheet—positioning to weather extended weakness or acquire neighboring operations.
The Consolidation Trajectory: Where We’re Headed
According to USDA Census data, the U.S. had about 24,000 dairy farms as of 2022, down from over 39,000 in 2017. That’s a 38.7% decline in five years. During this period, total milk production grew, and the national herd stayed near 9.4 million cows. The cows didn’t disappear—they concentrated into fewer, larger operations.
Current exit rates in major dairy states are running 6-8% annually. Wisconsin and Minnesota both saw 7.4% declines in 2023 alone.
Based on current cost structures and price forecasts, industry analysts project continued consolidation through 2026-2027, with exit rates potentially moderating toward 2028-2030 as the bottom of the cost curve exits and remaining operations stabilize.
These projections could shift based on several variables, including policy changes to the Dairy Margin Coverage program, unexpected demand recovery, disease events, or significant movements in feed costs. But they represent the trajectory suggested by current economics.
What’s Working: Patterns from Farms That Are Thriving
Certain patterns emerge among operations that are well positioned for this environment. None of this is magic—it’s execution.
Component optimization. Forward-thinking operations are shifting focus from pounds of milk to butterfat and protein pounds. Producers selecting for component production and feed efficiency rather than just milk yield are seeing butterfat gains of 0.2-0.3 points and protein improvements of 0.1-0.15 points. At current component prices, that’s often worth more than chasing another 1,000 pounds of milk per cow.
Balance sheet strength. Farms that will weather extended price weakness are preserving every dollar of margin for cash reserves or debt reduction. Agricultural lenders consistently advise producers to manage as if prices were $2 lower than they actually are. The farms that build 12-plus months of operating reserves will have options. The ones operating margin-to-margin won’t.
Feed cost management. With corn prices relatively favorable—USDA projects season-average prices around $3.90 per bushel for 2025—strategic operations are securing pricing on multi-month contracts. The operation with 60% of corn needs forward-priced knows its costs precisely. That certainty creates planning ability when milk prices are volatile.
Proactive lender relationships. Farms approaching lenders early—before struggling—are presenting scenarios showing performance at $18, $17, and $16 per hundredweight. Lenders who understand an operation’s position in advance tend to be more flexible than those who discovering stress after the fact.
The Questions That Matter
As you evaluate your operation, here are the questions that will determine your future:
On your cost position: What’s your true cost of production? Not the industry average—your number. How many months can you sustain current conditions with the reserves you actually have?
On your market position: Is your milk optimized for what processors need? Do you know whether your processor has growing, stable, or declining capacity needs?
On your regional position: Is new processing capacity coming to your area? What’s happening with your neighbors—expanding, maintaining, or showing signs of exiting?
On your timeline: If you’re contemplating an exit, does acting sooner preserve more equity than waiting? If you’re committed to continuing, what specific improvements can you implement in the next 90 days?
The Bottom Line
The dairy industry that emerges from this period will feature fewer, larger, more efficient operations concentrated in regions with processing capacity and favorable cost structures. That’s the direction the data points, consistent with trends underway for decades—just compressed and accelerated.
Some farms will use this period to strengthen their position and emerge as regional leaders. Others will make the difficult but wise choice to exit while equity remains intact.
The market doesn’t care about your family history. It cares about your production costs. Do the math, or the bank will do it for you.
KEY TAKEAWAYS:
This isn’t cyclical—it’s structural. China added 22 billion pounds of domestic milk production since 2018, permanently closing a market that absorbed half of global import growth.
The cows are moving Southwest. Texas gained 46,000 head last year; Wisconsin lost 455 farms. $11 billion in new processing capacity is cementing this shift for decades to come.
Scale now determines survival. Operations above $20/cwt are hemorrhaging cash at current prices. Larger dairies at $16-17/cwt are building war chests for acquisition.
Beef-on-dairy bought time—at a price. Heifer inventories hit 20-year lows. Replacements are reaching $4,000 per head.
Act while options exist. This shakeout accelerates through 2027. Know your true cost of production—before the bank calculates it for you.
Complete references and supporting documentation are available upon request by contacting the editorial team at editor@thebullvine.com.
Learn More:
The $200K Dairy Margin Trap: What Cheap Feed Won’t Tell You About 2026 – Provides immediate tactical adjustments for cost control, revealing how weekly forage analysis and precise income-over-feed-cost (IOFC) calculations can uncover hidden margins even when feed prices look deceptively favorable.
The Wall of Milk: Making Sense of 2025’s Global Dairy Crunch – Deepens the structural analysis by explaining the “24-month biological trap,” showing why global supply collisions in the EU and Argentina are keeping prices suppressed despite strong U.S. exports.
The Beef-on-Dairy Wake-Up Call: What Some Farms Are Still Missing – Offers a strategic solution to the “heifer trap” mentioned above, demonstrating how to use genomic testing on the bottom 20% of the herd to balance beef premiums with adequate replacement generation.
The Sunday Read Dairy Professionals Don’t Skip.
Every week, thousands of producers, breeders, and industry insiders open Bullvine Weekly for genetics insights, market shifts, and profit strategies they won’t find anywhere else. One email. Five minutes. Smarter decisions all week.
Raising mediocre genetics into an $18 market is a $3,000 mistake walking on four legs. 8 GDT declines say it’s time to cull harder.
EXECUTIVE SUMMARY: Eight straight GDT declines—the worst streak since 2015—isn’t a cycle. It’s a structural reset. China’s self-sufficiency jumped from 70% to 85%, erasing 200,000+ metric tons of annual demand that isn’t returning. Production keeps accelerating everywhere: the US up 3.3%, the EU up 6%, Argentina up 10.9%. For operations still budgeting $21 milk, the math turns brutal fast—at $18/cwt, working capital burns in months, not years. The response demands ruthless clarity: cull the bottom 20% of your genetics, sell $1,000-1,400 beef-on-dairy calves instead of raising $3,000 replacement heifers, lock in price protection, and call your lender before covenants force the conversation. The dairies thriving in 2027 won’t be those that waited for recovery—they’ll be those that used 2026 to make the hard calls their competitors avoided.
Something shifted in global dairy markets this fall. Those of us watching the twice-monthly Global Dairy Trade auctions could sense it building, but the numbers from Event 393 on December 2nd brought it into sharp focus.
The damage in one auction:
GDT Price Index: Down 4.3%
Butter: Down 12.4% (the hardest hit)
Whole Milk Powder: Down 2.4%
Average price:US$3,507/MT (lowest in nearly two years)
Streak:Eight consecutive declines—worst since 2015
Butter prices collapsed 12.4% at Event 393. Anhydrous milk fat fell 9.8%. These aren’t modest corrections—they’re demand destruction in fat products. Meanwhile cheddar climbed 7.2% and lactose 4.2%. Message: high-fat commodity products are vulnerable in this market. Component strategy must shift toward cheese and protein, away from butter margin dependency.
For producers mapping out Q1 and Q2 of 2026—whether you’re managing a 200-cow operation in Vermont, running 3,000 head in the Central Valley, or navigating the unique economics of Southeast pasture-based systems—these results raise questions that deserve careful thought.
Is this a cyclical correction that resolves in a few months? Or does it reflect something more structural?
Here’s my read: eight consecutive declines with this breadth across product categories suggests supply-demand fundamentals that may take longer to rebalance than we’d like. That’s not cause for panic, but it is a reason for strategic action. The operations that navigate the next 12-18 months successfully will be those that understand what’s driving this weakness—and position accordingly.
The Supply Picture: Everyone’s Running Hot
The basic dynamic is pretty clear once you lay it out. Global milk production across major exporting regions is growing faster than demand can absorb. USDA Foreign Agricultural Service data and Rabobank’s quarterly analysis both point to this imbalance persisting through at least mid-2026.
Everyone’s running hot. Argentina’s milk production surged 10.9% in Q1 2025. The EU is up 6%. The US 3.3%. The problem? Demand isn’t returning. When all suppliers produce simultaneously into shrinking demand, there’s only one outcome: prices collapse.
What makes this period particularly concerning is the breadth. It’s not one region running hot while others moderate. Everyone’s pushing milk at the same time:
Region
Growth Rate
Source
New Zealand
Season-to-date up 3.0%
Fonterra November Update
United States
August production up 3.3% (24 major states)
USDA Milk Production Report
European Union
September deliveries up 6.0%
AHDB Market Analysis
Argentina
Q1 2025 up 10.9%
USDA Attaché Reports
Fonterra has already raised their collection forecast from 1,525 million kgMS to 1,545 million kgMS. The US herd continues expanding even as futures soften. You know how it goes—once you’ve invested in facilities, genetics, and labor, the economic pull favors keeping stalls occupied.
“This cycle, we’re seeing production accelerate into declining prices. That pattern—when it persists—typically indicates a longer adjustment period ahead.”
The China Shift: This Isn’t Cyclical
No factor shapes the global dairy trade outlook quite like China’s changing import patterns. For nearly a decade, China served as the primary growth engine for dairy exports worldwide. What’s shifted there helps explain everything we’re seeing at GDT.
China’s government-backed self-sufficiency push worked. From 70% to 85% domestic production in five years. Translation: 200,000+ metric tons of annual demand that exported countries will never see again. This isn’t a market cycle. It’s geopolitics as food security policy.
The key numbers:
Self-sufficiency: Climbed from ~70% (2020-2021) to ~85% (2025) per USDA and Rabobank estimates
WMP imports: Dropped from 845,000 MT at peak to ~430,000 MT by 2023
Missing demand:200,000-240,000 MT annually that isn’t coming back soon
Rabobank’s Mary Ledman, its global dairy strategist, framed it clearly: China moved from about 70% self-sufficiency to roughly 85%, and that shift cascades through global trade flows. When China’s import demand contracts, it affects pricing for exporters worldwide.
What this means: Business planning built around a rapid return to peak Chinese imports probably warrants reconsideration. Beijing invested heavily in domestic processing capacity as a food security priority. Some analysts believe import demand could stabilize if domestic production growth slows—but for planning purposes, assuming reduced Chinese appetite persists seems prudent.
Where’s the Milk Going?
With China absorbing less, displaced volume is finding alternative homes—but at a cost:
Secondary markets are absorbing volume. The Middle East, Southeast Asia, and parts of Latin America have increased purchases at competitive pricing. But these markets are smaller and more price-sensitive. They take the milk—just at prices that drag everything down.
Product mix is shifting. EU processors are directing more milk toward cheese and whey rather than powder. This doesn’t eliminate surplus; it redistributes pressure across product streams.
Inventories are building. US nonfat dry milk stocks have grown through 2025, according to USDA Dairy Products data. The milk is moving, but it’s backing up. That overhang suppresses spot prices until stocks normalize.
Farm-Level Math: Where It Gets Real
For individual operations—particularly those carrying debt from recent expansions—extended margin compression creates genuine planning challenges.
Fonterra’s adjustment illustrates how GDT weakness hits farmgate: They narrowed their 2025/26 price range from NZ$9.00–$11.00/kgMS to NZ$9.00–$10.00/kgMS. For a farmer supplying 200,000 kgMS, that 50-cent midpoint reduction means roughly NZ$100,000 less this season.
US operations face a similar arithmetic:
500-cow dairy producing 25,000 lbs/cow annually
Each $1/cwt change = approximately $125,000 in gross revenue impact
I recently spoke with a producer running about 450 cows in east-central Wisconsin—debt-to-asset ratio around 47%, which isn’t unusual for operations that expanded during 2021-2022. At $22/cwt, modest positive cash flow. At $18-19/cwt, he’s projecting monthly shortfalls of $35,000-45,000. Working capital covers roughly three months at that burn rate.
His approach? Running all projections at $18 now, not $21.
“I’d rather be surprised by better prices than caught short by worse ones.”
The timeline pressure: Working capital reserves on many operations cover 2-4 months of shortfalls. When those deplete, operating lines of credit come at higher rates—what was 6-7% might now cost 10-11%, further pressuring cash flow.
Practical Responses That Are Working
Across regions, proactive producers are responding with concrete adjustments. The specifics vary—feed costs differ between California and Wisconsin, Southeast operations face different heat-stress economics, and Northeast producers navigate distinct cooperative structures—but certain approaches work broadly.
Get Brutally Honest on Cash Flow
Run projections at $18.00/cwt, not $21-22. Answer these questions candidly:
What’s the monthly cash flow at current prices through Q2 2026?
How many months can you sustain negative cash flow before exhausting working capital?
At what price does the operation return to breakeven?
Operations projecting shortfalls above $30,000-50,000/month should initiate lender conversations now—before covenant pressures force them.
Lock In Some Protection
Forward contracting and hedging deserve fresh attention:
Forward contract 30-50% of near-term production through co-ops or direct processor contracts
Put options on Class III or Class IV milk for downside floors with upside participation
Dairy Margin Coverage enrollment at coverage levels matching your debt structure
Options protection typically costs $0.20-0.40/cwt. That’s insurance math—worth evaluating against your exposure.
Strategic Cost Management
Ration optimization remains the biggest lever. Maximize the number of components per pound of dry matter intake. With butterfat and protein premiums available through many marketing arrangements, component-focused feeding can partially offset lower base prices. Transition cow nutrition and fresh cow management remain areas where investment pays returns—you probably know this, but it bears repeating during tight margins.
Forward purchase feed ingredients at current favorable levels for 6-12 months.
Capital discipline—defer projects that don’t show clear payback within 12 months at $18/cwt.
Ruthless Heifer Inventory Calibration
This is where genetics strategy meets financial survival.
Stop raising the bottom 20% of your genetics. Move from 110% of replacement needs to strictly 100%. Use beef-on-dairy crosses on everything that isn’t top-tier. In a market like this, raising a mediocre heifer is a luxury you cannot afford.
Downturns are the time to concentrate genetic investment. Focus sexed semen only on your elite animals. Let beef sires cover the rest. The operations that emerge strongest from price cycles are typically those that used the pressure to accelerate genetic progress—not those that kept feeding average genetics because “we’ve always raised our own replacements.”
Here’s what’s interesting about the economics right now. Dairy beef has become a meaningful revenue stream—according to Hoard’s Dairyman, dairy-beef crosses now represent 15-20% of national beef production. That $1,000-1,400 dairy-beef calf you’re selling at a few days old is worth far more than a replacement heifer you’ll spend $2,500-3,000 raising only to freshen into an $18 milk market. The math has completely flipped from where it was just a few years ago, when those calves were bringing $350-400.
Early Lender Engagement
For operations where projections suggest restructuring may be needed, earlier conversations produce better outcomes. Options farmers are exploring:
Extending term debt amortization (10 → 15 years) to reduce annual payments
Converting operating lines to term debt for covenant breathing room
Adjusting payment timing to align with milk check cycles
Providing additional collateral for better terms
Lenders prefer restructuring to foreclosure. But that preference is strongest when borrowers approach proactively—not when they’re already in technical default.
The Coordination Reality
Could coordinated production cuts accelerate rebalancing? Probably not.
US antitrust law restricts coordination on production or pricing. Cooperative structures require accepting all member milk. And even if one region cut output, others would expand to capture the opportunity—Argentina’s 10.9% Q1 surgeshows how fast capacity elsewhere fills gaps.
Historical precedent: During 2014-2016, US milk production actually grew despite severely compressed margins. Recovery came when demand improved—not from coordinated supply reduction. The survivors managed through individually: maintaining reserves, restructuring early, achieving efficiencies their neighbors didn’t.
Market rebalancing will occur through aggregated individual responses to economic pressure. That places the burden on each operation to assess its own position and act accordingly.
How the Next 18 Months Might Unfold
Here’s one informed perspective—not prediction:
Through Q1 2026: Current dynamics persist. Production growth continues despite weak prices, China maintains a reduced import posture, and inventories stay elevated. GDT likely stays below $3,500/MT, potentially testing $3,200-3,300.
By mid-2026: Margin compression forces more decisive responses. Some operations exit through individual financial pressure. Others restructure and emerge leaner. Consolidation accelerates.
Late 2026 into 2027: If sufficient capacity adjusts, supply comes into better balance. Prices recover—though likely to equilibrium levels reflecting China’s structurally lower imports and more consolidated global production.
The operations positioned well for 2027 won’t necessarily be the largest. They’ll be those that assessed their situations honestly now, made difficult decisions while options remained, and configured for a market that differs from 2021-2022.
The Bottom Line
This market weakness is structural, not cyclical. Eight consecutive GDT declines, plus China’s sustained import reduction, create headwinds that won’t resolve quickly.
Run your numbers at $18/cwt. Operations showing significant monthly negative cash flow face decisions within 6-12 months.
Talk to lenders before you have to. Proactive conversations yield better outcomes than forced ones.
Concentrate your genetic investment. Stop subsidizing mediocre genetics with expensive heifer development. Use beef-on-dairy aggressively—at $1,000+ per calf, the economics have never been better.
Protect some downside. Evaluate forward contracting and options based on your specific debt exposure.
Early action preserves options. Delayed response narrows them.
These are genuine challenges—and ones the industry has navigated before. The operations thriving when conditions improve will be those making informed decisions now: understanding what market signals indicate, assessing their position realistically, and acting while choices remain.
Your local extension dairy specialists and farm business management educators can provide perspective tailored to your specific circumstances. Run your numbers, have the conversations, and position your operation for whatever comes next.
We’ll continue tracking these developments. In the meantime—sharpen your pencil, sharpen your genetics, and sharpen your strategy.
Key Takeaways
Stop waiting for recovery. China’s at 85% self-sufficient. That 200,000+ MT of vanished demand isn’t returning. This is the market now.
Budget at $18. Today. At $21, you’re planning for a market that no longer exists. Run your numbers at $18 and see if your runway is months—or weeks.
Cull the bottom 20%. Ruthlessly. A $1,400 beef calf at 3 days old beats a $3,000 heifer raised to freshen into $18 milk. That math has permanently flipped.
Call your lender this week. Proactive conversations get restructuring options. Forced conversations get whatever terms are left.
The 2027 winners are being decided now. They won’t be the biggest operations—they’ll be the ones that culled harder, budgeted tighter, and moved while competitors waited.
Complete references and supporting documentation are available upon request by contacting the editorial team at editor@thebullvine.com.
Every week, thousands of producers, breeders, and industry insiders open Bullvine Weekly for genetics insights, market shifts, and profit strategies they won’t find anywhere else. One email. Five minutes. Smarter decisions all week.
July 2025 exports soared 53% year-over-year—yet most U.S. dairy farms saw shrinking profit margins, not bigger milk checks.
Executive Summary: Dairy exports shattered records in 2025, with the U.S. shipping 1.6 billion pounds of product abroad in July alone—a staggering 53% surge compared to the prior year. But beneath those headlines, American producers are battling tight margins as block cheese dipped to $1.67/lb and Class III futures slumped below $16/cwt, despite robust global demand. Recent research and USDA data highlight that this disconnect is driven by low export pricing, aggressive global competition, and a shrinking pipeline of replacement heifers—a result of widespread beef-on-dairy breeding. While mega-operations leverage scale and small niche dairies build premium brands, mid-sized farms face contraction at a rate of 7-8%. Practical insights from universities and leading advisors reveal that strategic culling, honest financial assessment, and proactive reinvestment now will best position operations for the volatile months ahead. Looking forward, success in 2026 depends not on riding out the “old normal,” but on embracing new models—whether that means cost control, vertical integration, or value-added marketing. The choices you make today could shape your farm’s resilience for years to come.
You can’t sit around the farm kitchen table or check your milk check without someone bringing up the gap between those record-smashing export headlines and what we’re actually seeing on the farm. This year’s export stats (2025, per USDEC, USDA, and CME data) are wild—so let’s walk through the fine print, and offer a clear, honest look at what the numbers do (and don’t) mean for your bottom line.
Looking Past the Headlines: Big Numbers, Real Questions
July 2025 delivered a headline: U.S. dairy exports hit 1.6 billion pounds milk-fat equivalent—a staggering 53% higher than last year, with cheese breaking records for 13 months straight and butter exports more than doubling (USDEC, August 2025). Mexico, Southeast Asia, and the Middle East are fueling those gains. (Editorial suggestion: Here’s where a quick online chart comparing U.S. and EU butter prices, or a timeline of shrinking mid-size herds, could really drive it home.)
The brutal irony driving 2025’s dairy crisis: exports hit all-time highs while farm gate prices plummet. This inverse relationship reveals how discount export pricing—driven by aggressive global competition—is bleeding value from domestic producers. When you’re the world’s cheapest cheese supplier, volume growth becomes a liability, not an asset.
But talking with neighbors from Wisconsin to California, a different reality surfaces. Class III milk futures for November struggled below $16/cwt in October (CME Oct 2025), block cheese found a floor at $1.67/lb, and butter—the one bright spot early—crashed from $2.48/lb in August down to $1.65. Feed, fuel, and labor bills just keep nipping at margins. As Dr. Mark Stephenson at UW-Madison says, “There’s a world of difference between what’s happening on the docks and what’s happening in the mailbox.”
Why Export Growth Isn’t Filling Milk Checks
Take a closer look, and you’ll see what’s really moving: American products is cheap. U.S. butter traded at $1.65/lb in October, while EU butter held firm at $2.80/lb (EU Commission). The world always chases a bargain—and lately, we’re it.
Mexico now accounts for nearly a third of U.S. dairy exports—including over half of the nonfat dry milk produced in American plants (USDEC/USDA FAS, July 2025). However, the Mexican government’s 2025 policy papers and NMPF trade summits clearly indicate that they’re backing local dairy expansion and processing, preparing to buy less from us as soon as possible.
Think about Southeast Asia: U.S. powder lands in Vietnam or Indonesia precisely because it’s cost-effective for local processors to build finished value at home. Rabobank’s summer 2025 reports refer to it as “the Asian processing pivot.” It isn’t about U.S. branding; it’s pure economics.
CME Spot Cheese: Small Trades, Big Impact
It always comes up at local co-op meetings—how is the price for millions of pounds of milk set by just a few trades, a couple of times a week? Less than 1% of U.S. cheese goes through the CME spot market (Wisconsin JDS industry surveys, 2024), but that market sets the base for half the nation’s milk. Since the move to all-electronic trading in 2017, those price swings are sometimes driven by a single processor’s urgency, rather than real supply/demand.
Plenty of us wonder: can a handful of loads really justify moving cheese price brackets for thousands of family farms? Truth is, the market says yes—for now.
Processing Expansion: Efficiency and Exposure
You’ve likely heard the figures: since 2023, about $10 billion’s been sunk into new plants (Rabobank, Dairy Quarterly Q3 2025; Cheese Reporter, Jan. 2025). Many are capable of running over 20 million pounds daily—an incredible show of confidence in the future.
But here’s the rub: those plants need full pipelines to pay off. If exports soften or domestic demand plateaus, processors continue to churn out product, often selling it abroad at marginal prices. All too often, this reality is felt not at headquarters, but on the farm, reflected in base price pressure and pooling deductions.
Beef-on-Dairy: Quick Cash, Long-Term Crunch
Every $1,000 beef-cross calf sold today is gutting tomorrow’s milk supply. Heifer inventories have plummeted 10% in three years while prices rocketed 192%—creating a replacement crisis that will constrain expansion through 2027. The math is brutal: today’s survival strategy becomes tomorrow’s bottleneck
Talk to any extension officer or herd consultant this year, and beef-on-dairy is front and center. Those beef-cross calves fetching $800 to $1,200 (USDA AMS, 2025) are saving some farm budgets, especially when pure Holstein bulls bring half that—at best.
But the development suggests a tightening squeeze just over the horizon. USDA’s July 2025 inventory shows replacement dairy heifers over 500 lbs are at their lowest since the 1970s (just under 3.9 million head). Extension consensus (CoBank, UW, MSU) expects that, unless beef-on-dairy trends change, bred springer prices will start a strong upward climb by 2026–27, right as herds may want to rebuild. The risk is real: today’s survival could complicate tomorrow’s comeback.
The Industry Barbell: Big, Niche—Middle at Risk
UC Davis, USDA, and regional co-ops are all reporting similar realities: large, vertically integrated herds with dry lot systems and their own processing arrangements continue to gain market share—especially in the Southwest and California. Scale gives them leverage most can’t touch.
Smaller, direct-sale focused herds—think Vermont or Pennsylvania bottlers, specialty cheese producers—are thriving by telling their story, emphasizing butterfat, freshness, and a personal connection. They can get $30–$50/cwt retail. It’s not easy, but the premium is real.
Yet the traditional family operation—the 200 to 1,500 cow “community dairy”—faces the tightest squeeze. Recent USDA structure reports show these farms contracted by 7–8% in 2025. Once those barns go quiet, the loss is felt far and wide.
The middle is collapsing. Operations with 200-1,500 cows—the backbone of rural communities—are contracting at 7-8% while mega-dairies and specialty producers expand. This isn’t market evolution; it’s forced consolidation driven by scale economics that mid-sized farms simply can’t match at current milk prices.
Exit Trends: More Quiet Closures Than Court Losses
Higher-profile bankruptcies get headlines (361 Chapter 12 filings as of August 2025, US Courts), but five times that many farms have transitioned out over the year without court involvement—through voluntary sale, lender wind-down, or generational transition. Extension and local lenders across Wisconsin and Iowa confirm this broader landscape. Every exit isn’t just less milk; it’s a ripple to schools, dealerships, feed outfits, and beyond.
Here’s the dirty secret: DMC margins staying above $9.50 doesn’t mean you’re making money—it means the government won’t bail you out. Mid-sized operations need $15.50/cwt to actually survive, creating a $2.70-$5.20 monthly shortfall that’s draining equity faster than most producers realize. The ‘safety net’ catches you after you’ve already fallen.
Surviving and Thriving: Pragmatic Action Beats Waiting
It’s not always what you want to hear, but this fall, the best extension and ag lender advice is simple: Cull sooner, cull harder. With cull cow prices at $145–$157/cwt (USDA AMS), and the forecast for 2026 pointing to lower levels, producers who right-size now are shoring up working capital, easing transition period stress, and improving herds’ butterfat performance.
Groups like FarmFirst Dairy and others have even started pooling supply power, making the Capper-Volstead Act mean something again in regional price discussions. Meanwhile, value-added co-ops, marketing alliances, and on-farm processing efforts (boosted by local and USDA Rural Development grants) are offering mid-size and small producers a path to retain more margin.
Three Questions Every Farm Should Ask
Set these out before winter business meetings:
Can you weather another 12–18 months at $16–$17/cwt milk without burning through savings or risking your land?
Is $18/cwt all-in cost a realistic or reasonable goal based on your geography, size, and current practices? What benchmarks or systems will close the gap?
Is everyone on board with your next phase—expanding, holding, or planning an exit? The answers shape what you do before the next market cycle.
Regional Realities: No One-Size Solution
The playing field is uneven. West Coast and Northwest dairies incur $1.50-$2/cwt higher base costs than their Midwest peers (OSU/WSU Extension, 2025), primarily due to transportation and regulatory overhead. California herds are finding their margins in digesters, water rights, and environmental mitigation. In the Midwest and Northeast, adaptive grazers are focusing on low-input strategies, diversified crop rotations, and shifting genetic emphasis to achieve whole-herd resilience.
The Real Bottom Line: Adaptation and Community
If there’s one message carrying through from every conference and farm walk this year, it’s that success hinges on honesty—with yourself, your partners, and your books. Peer benchmarking, ongoing dialogue with advisors and neighbors, and clear, sometimes tough, family talks are what keep businesses and communities weatherproof.
What farmers are finding is that adaptation—sometimes fast, sometimes gradual—isn’t a choice anymore; it’s a business necessity. We’ve steered the dairy industry through harder times before, and every forward step now is a brick in the path to the next, better cycle.
So, keep asking, keep sharing, and let’s keep steering together. Our best solutions always start in these conversations.
Key Takeaways
Despite a 53% increase in exports, most U.S. milk checks fell in 2025 as global buyers capitalized on discount pricing.
Strategic culling now—while cull prices are high—can safeguard cash flow, boost butterfat performance, and reduce transition headaches.
Use regional benchmarking and trusted university data to determine if your operation can realistically hit sub-$18/cwt all-in costs.
Don’t wait: initiate open succession talks, review lender relationships, and explore value-added/cooperative marketing to hedge future risk.
Adaptation—whether through efficiency, product innovation, or strategic exit—is essential for all farm sizes as the middle ground shrinks and 2026 market volatility looms.
Complete references and supporting documentation are available upon request by contacting the editorial team at editor@thebullvine.com.
Learn More:
Why Are Dairy Farmers Desperately Holding onto Their Cows in 2024? Uncover the Truth – Reveals the financial mechanics of the beef-on-dairy trend, providing critical data on soaring replacement costs and the long-term heifer supply crunch. This perspective demonstrates how to use genetic tools to protect cash flow and strategically plan for future herd expansion, essential for navigating price volatility.
CME Daily Dairy Market Report: May 2, 2025 – Markets Surge Despite Bearish Forecasts – Analyzes the striking disconnect between CME spot market rallies and long-term USDA price forecasts, showing how low-volume trades influence your milk check. It provides strategies for component optimization and utilizing futures/options to protect margins against volatile market shifts.
Norfolk’s Dairy Meltdown: What You Need to Know, Straight from the Trenches – Details the critical risk of relying on non-compliant processors and reveals how leading European operations are turning environmental innovation into profit. This piece demonstrates how embracing technologies like digesters and advanced wastewater treatment secures your market access and commands premium pricing.
The Sunday Read Dairy Professionals Don’t Skip.
Every week, thousands of producers, breeders, and industry insiders open Bullvine Weekly for genetics insights, market shifts, and profit strategies they won’t find anywhere else. One email. Five minutes. Smarter decisions all week.
Why are some producers expanding herds during margin squeezes? The answer reveals a fundamental shift in dairy economics
EXECUTIVE SUMMARY:
Recent research shows U.S. milk production increased 3.4% through July 2025 despite challenging margins, with New Zealand up 8.9% and South America rising 7.7%—a pattern that breaks traditional market correction cycles. What farmers are discovering is that beef-on-dairy crossbred calves now generate revenue streams that can offset monthly feed costs, fundamentally altering culling decisions that historically balanced supply and demand. This shift coincides with processing consolidation, as demonstrated by Lactalis’s $4.22 billion acquisition of Fonterra, creating fewer competitive alternatives for milk marketing. University research indicates that when processing facilities operate above 95% capacity, basis relationships deteriorate for producers—a situation becoming more common as companies optimize throughput over redundancy. The convergence of alternative revenue sources, reduced processing competition, and government programs like Dairy Margin Coverage creates market dynamics in which traditional price signals no longer effectively drive supply adjustments. For progressive producers, this means developing risk management strategies that account for combined milk-plus-calf returns while diversifying processing relationships. Understanding these structural changes—rather than waiting for cyclical recovery—positions operations to navigate an industry where market fundamentals are being permanently rewritten.
So I’m having coffee with this producer last week—big operation, been at it for decades—and he says something that’s been bugging me ever since. “You know what’s weird?” he goes. “My margins are terrible, milk check keeps shrinking, but I’m milking more cows than I ever have.”
And I’m thinking… wait, what?
See, I’ve been covering these markets since Clinton was president (yeah, I’m that old), and this just doesn’t follow the old playbook. You know how it’s supposed to work, right? Prices tank, producers cull hard, supply drops, prices recover. Economics 101 stuff.
Except look at what the USDA put out last month. U.S. milk production up 3.4% through July—during what should be a massive correction period. New Zealand’s running 8.9% ahead of last year, according to Global Dairy Trade reports. South America’s up 7.7%. These numbers keep coming in month after month.
I mean, when’s the last time you saw production climbing during a price crash? Never, right? Because it makes no damn sense economically.
And honestly? That should scare every independent producer reading this.
Global milk production defying economic logic – while prices crash, production surges in key regions, breaking the fundamental supply-demand corrections that have balanced dairy markets for decades
The Beef-Cross Money That’s Breaking All the Rules
You guys all know about these beef-on-dairy calves bringing serious money lately. I’m talking… well, let’s just say crossbred calves are covering expenses that used to come straight out of the milk check.
But here’s where it gets nuts—that calf money is completely screwing up everything we thought we knew about supply and demand responses.
Think back to 2014. I remember writing about operations that culled hard when Class III dropped. Supply tightened up real quick. Prices recovered. Basic market mechanisms are working like they should.
Not anymore.
You’ve got cows bleeding money on every hundredweight of milk, but that same cow’s beef-cross calf might cover months of feed costs. So instead of sending her down the road like you would’ve done back then, you keep her around for the calf revenue.
Makes total sense from a cash flow standpoint, I get it. But multiply that decision across every dairy operation dealing with tight margins… and suddenly you’ve got this bizarre situation where terrible milk prices are actually keeping more cows in production.
What are the feedback loops that are used to correct market imbalances automatically? They’re not just broken—they’re working backwards.
When Your Processor Starts Playing Games
You know what really bothers me? How tightly these processing networks run nowadays. I keep hearing about plant shutdowns that create these massive disruptions—milk backing up at farm tanks, basis going to hell, producers scrambling to find alternative processing.
And the basis? Starts at maybe a small discount and just keeps sliding. Gets ugly real fast.
But what really gets me is how it exposes just how deliberately lean these processors run their operations. Mark Stephenson up at Wisconsin Extension—sharp guy, does good work—he’s mentioned how when processing plants approach capacity limits, basis relationships start deteriorating for producers.
Which makes you wonder… why are so many facilities always running right at that edge?
My theory? Because they figured out that tight capacity gives them leverage. When every processor in your region is maxed out, where else are you gonna haul your milk? They can knock your basis down, and you’ll take it because—what choice do you have?
Talk to producers lately. Basis penalties that used to be seasonal exceptions are becoming… well, more frequent occurrences. Because some genius in corporate figured out that running short on capacity works better than building enough to actually serve their suppliers properly.
The Lactalis Deal That Shows How This Game Really Works
You want to see corporate timing that’d make a Wall Street trader jealous? Watch how Lactalis—try saying that name three times fast—played their Fonterra buyout.
So these guys are already the biggest dairy company on the planet, right? Pulling in over €30 billion annually according to their own financial reports. They could’ve struck this deal anytime they wanted.
But did they move when milk prices were strong and farmers actually had some negotiating power? Hell no.
They waited until this year, right when global oversupply was building and operations were getting squeezed on margins. Those Australian Competition and Consumer Commission documents show the negotiations happening right as market pressure was building. Final deal: $4.22 billion for Fonterra’s consumer and foodservice businesses.
Coincidence? I seriously doubt it.
Want proof this is a pattern? Look at what they did in France after they consolidated operations there. Despite making record money—record money—they cut milk collection by 450 million liters last year. That’s nearly 10% of their French volume, according to European dairy reports. French producers were screaming about it, but by then, competitive alternatives were already gone.
Funny how that timing works out, isn’t it?
Why “Cheaper Feed” Is Mostly Marketing Nonsense
Every trade publication—and I read way too many of them—has some consultant talking about how lower grain costs are gonna save our margins. Corn backing off from highs, soybeans down… sounds encouraging in theory.
Until you actually run the numbers on real operations.
So let’s say feed costs drop significantly—and I mean really drop, more than you’d normally see. When you break that down per cow per day versus what most operations are losing on milk revenue… well, it’s like trying to fill a swimming pool with a garden hose while someone’s got the drain wide open.
I keep hearing from producers who’ve done the math. Feed improvements might save you fifty cents, maybe seventy-five cents per cow daily. But if milk revenue’s down two-fifty, three dollars per cow… you see the problem?
Metric
Daily Per Cow Impact
Monthly Per Cow
Annual Per Herd (500 cows)
Milk Revenue Loss
-$2.50
-$75.00
-$456,250
Feed Cost Savings
+$0.60
+$18.00
+$109,500
NET IMPACT
-$1.90
-$57.00
-$346,750
But these consultants keep pushing feed procurement strategies because—and I suspect this is part of the game plan—it keeps producers focused on optimizing costs while the real money flows toward corporate consolidation. Keep us busy saving pennies while Rome burns.
The Processing “Emergency” Pattern
What bothers me about these plant shutdowns? Every time one goes down, it requires this massive coordination effort—state agencies getting involved, emergency rerouting across multiple states, even companies that don’t normally handle dairy getting pressed into service.
When one facility failure requires government-level intervention, that tells you everything about how this system’s designed to operate. Zero redundancy is built in. Everything is running right at the breaking point.
If any of us ran our dairy operations with that little backup… hell, we’d never sleep at night. But for processors? Apparently, running lean means every breakdown creates regional pricing opportunities they can use to their advantage.
And that’s becoming the pattern. Processing disruptions that create permanent changes to local basis relationships. Never temporary adjustments that recover—always permanent shifts that favor the processor.
Makes you wonder how accidental some of these emergencies really are…
What the Experienced Guys Are Actually Doing
I’ve been talking to producers who’ve figured out this cycle’s different from anything we’ve seen before. The ones positioning to survive aren’t sitting around waiting for some magical market recovery.
They’re getting serious about risk management for Q4 production. Class III put options for fourth quarter production—locking in price floors when things could get uglier. Some operations regularly rotate milk between multiple processors. Soon as one plant starts offering heavy discounts, they shift volume to keep everyone competitive.
DMC enrollment deadline’s coming up fast—September 30th, that’s next Monday. Coverage costs you maybe fifteen cents per hundredweight but pays out when margins collapse below certain thresholds. Joe Outlaw at Texas A&M’s Agricultural and Food Policy Center ran the numbers after that 2023 squeeze—program paid out $1.27 billion to enrolled producers. With margins running where they are now? Enrolled operations could see substantial government checks.
Strategic culling’s getting weird, too. Some producers I know are scoring every cow on total economic return—milk revenue plus calf value minus feed costs. Some of their best milk producers are getting shipped because their calves don’t bring premium money. Makes sense mathematically, but it feels backwards, you know?
Regional feed coordination with neighbors still makes sense if you can coordinate bulk purchases and negotiate decent freight rates. Every dollar saved per ton adds up when you’re feeding this many animals.
The Government Program Making Everything Worse
This probably won’t make me popular with the bureaucrats in Washington, but I gotta say it: Dairy Margin Coverage isn’t protecting family farms. It’s subsidizing the oversupply that’s letting corporate processors buy cheap milk.
Think about the logic here. DMC literally pays producers to keep milking cows that lose money on every hundredweight. Who benefits from a sustained cheap milk supply? Processing companies are buying raw materials at below-market rates.
It’s corporate welfare disguised as farmer relief, and most of us are too desperate to turn it down.
The program uses national averages that completely ignore regional basis manipulation games. Producers dealing with heavy local discounts see DMC calculations based on milk prices they’ve never actually received in their mailbox. It’s like calculating your gas mileage based on highway speeds when you’re stuck in city traffic all day.
Still, with margins this brutal, you probably need the coverage. Just understand what you’re really signing up for—subsidizing a system that’s working against your long-term interests.
The Reality Nobody Wants to Discuss Publicly
Hell, I’ve been doing this since the late 90s, and I’ve never seen market mechanisms get systematically dismantled like this. What are the automatic balancing systems that are used to correct supply-demand imbalances? They’ve been neutralized.
Beef-cross revenue eliminates price-driven culling incentives. Processing consolidation kills competition for our milk. Global production growth creates sustained oversupply conditions. Government programs subsidize below-cost production.
This isn’t your typical cyclical correction. It’s a managed transition toward corporate control of milk pricing, with independent farmers becoming contract suppliers instead of actual market participants.
Back when we had real competition for our milk—and some of you remember those days—you could play processors against each other. Get a better basis here, threaten to move volume there. Now? Good luck with that strategy.
Industry publications keep using words like “partnership” when they talk about these corporate acquisitions. Lactalis is partnering with farmers after they buys up assets. Partnership. Right. Like David partnering with Goliath—how’d that work out?
When one party controls processing capacity and the other has nowhere else to sell their product… that ain’t partnership. That’s dependency, presented in fancy marketing language.
Bottom Line for Producers Who Understand What’s Happening
Smart farmers are repositioning for an industry where volume might matter more than efficiency per cow, where calf checks could drive more herd decisions than milk production metrics, and where basis management becomes more critical than traditional futures hedging.
Reality check time. Feed cost improvements can’t offset milk revenue losses when prices drop faster than input costs. Government programs provide short-term cash flow but perpetuate the structural problems driving margin compression. Beef-cross returns generate immediate revenue while potentially undermining long-term market stability.
Operations implementing serious risk management strategies—protecting production with options, diversifying processor relationships, culling based on total economic returns instead of just milk numbers—those farms will survive this transition period.
The ones waiting for a traditional cyclical recovery? They’re gonna discover that “normal” doesn’t include the competitive market relationships that made independent dairy farming economically viable.
Corporate consolidation is accelerating rapidly across the industry. Producers who recognize this as a permanent structural change rather than a temporary market weakness have limited time to position defensively before competitive alternatives disappear entirely.
Your operation’s survival depends on understanding that current market conditions aren’t just natural economic forces playing out. They reflect corporate strategies designed to concentrate industry control while systematically reducing the number of independent producers.
The question isn’t whether markets will eventually improve—they might. The question’s whether your farm can adapt to survive in the corporate-controlled industry that’s emerging from this transformation.
Makes me sick to write that last part, but it’s the truth as I see it developing.
KEY TAKEAWAYS:
Combined revenue optimization: Producers tracking total economic returns per cow (milk revenue plus calf value minus feed costs) are making more profitable culling decisions, with beef-cross calves potentially covering 2-3 months of feed expenses per animal
Risk management enhancement: Class III put options for Q4 production and Dairy Margin Coverage enrollment (deadline September 30th) provide essential downside protection, with 2023 DMC payments totaling $1.27 billion to enrolled operations during margin squeezes
Processing relationship diversification: Operations rotating milk between multiple processors monthly, maintain competitive basis pricing, and avoid the 15-20¢/cwt penalties that can occur when single-plant dependencies face capacity constraints
Strategic feed procurement coordination: Regional cooperatives coordinating bulk grain purchases and freight optimization can achieve meaningful cost reductions, though these savings alone cannot offset significant milk revenue declines
Market structure adaptation: Successful operations are positioning for an industry where basis management becomes more critical than traditional futures hedging, requiring a deeper understanding of local processing dynamics and capacity utilization patterns
Production data sourced from the USDA Economic Research Service monthly dairy reports and Global Dairy Trade auction results that track international supply trends. Corporate financial information from publicly available Lactalis Group reports and Australian Competition and Consumer Commission regulatory filings. Academic analysis from the University of Wisconsin Extension dairy economics research and Texas A&M’s Agricultural and Food Policy Center studies on government program impacts.
Complete references and supporting documentation are available upon request by contacting the editorial team at editor@thebullvine.com.
Every week, thousands of producers, breeders, and industry insiders open Bullvine Weekly for genetics insights, market shifts, and profit strategies they won’t find anywhere else. One email. Five minutes. Smarter decisions all week.
With fewer heifers but more milk, USDA data shows a dairy revolution. Efficiency and genetics are key—is your farm ready?
EXECUTIVE SUMMARY: Dairy folks, here’s the deal: getting more milk from fewer heifers is the new reality, not just a theory. The USDA says milk production’s set to rise to 229.2 billion pounds this year, yet replacement heifers are at a 47-year low, around 3.9 million. Farms that improve feed efficiency are saving $60 to $100 per cow annually, and genomic testing is increasing lactation gains by up to 15%. We’re seeing global demand keep prices firm, but with new cheese plants coming online, you have to be smart with costs and herd management. This isn’t just science—it’s real dollars in your pocket. If you want to stay ahead, dialing in technology and genetics isn’t optional; it’s essential. Take that step, question the old ways, and watch your operation shift into high gear to drive profits.
KEY TAKEAWAYS
Boost feed efficiency: Target daily savings of up to $0.27 per cow with precision nutrition programs—start with a ration audit as recommended by University of Wisconsin research.
Leverage genomics: Improve herd productivity by 10-15% in component-corrected milk; consider partnering with extension services for testing programs.
Manage risk smartly: Use Dairy Margin Coverage and explore Dairy Revenue Protection for cash flow stability amid Class III price swings over $12 per cwt.
Monitor heat stress: Install cooling systems, such as tunnel ventilation, to combat up to 8% daily milk loss in heat events; this is critical even outside traditional hot zones.
Adapt breeding for profit: Beef-on-dairy calves can add $370+ premium per calf; diversify calf markets to optimize revenue in tight heifer supply conditions.
The USDA’s August milk production forecast throws a curveball at our assumptions about dairy growth. Milk production is forecast to hit 229.2 billion pounds in 2025 before settling at 229.1 billion in 2026—a 900-million-pound upward revision from just last month’s projection. But here’s the rub: replacement heifers have dropped to 3.9 million head, the lowest since 1978.
This fundamentally alters the traditional growth model. Instead of simply adding stalls, success now hinges on getting more from the cows we already have.
What strikes me most is how cow inventories have increased to approximately 9.4 million, and on average, each cow in the national herd is producing an additional 15-20 pounds of milk per day compared to a decade ago. That’s impressive, yet the bottleneck caused by heifer scarcity means we can’t simply rely on herd growth to solve capacity issues. The data is clear that we’re in a transition.
Feed Efficiency Becomes Everything
Feed efficiency isn’t just a buzzword anymore—it’s what’s keeping many farms afloat. Recent work from the University of Wisconsin-Madison demonstrates that precision feeding systems can save between $0.16 and $0.27 per cow per day, adding up to $60-$100 per cow annually. These aren’t just small tweaks; when multiplied across large herds, these savings make a significant difference.
The export side is holding up prices better than some anticipated. The U.S. Dairy Export Council reports that butter and cheese exports are setting records, driven by steady global demand for butterfat. But I keep hearing about new cheese processing plants coming online—around 360 million pounds of annual capacity, mostly in places like Kansas and Texas. This could dampen Class III prices if exports don’t keep pace, something producers need to be wary of.
Heat Stress: The Northern Problem Nobody Saw Coming
Heat stress is a cost no one can ignore now. Cornell University research estimates that the industry incurs nearly $2 billion in costs each year, with milk yields declining by as much as 8.2% during heatwaves. It used to be something only the Southwest worried about, but now even farmers in Wisconsin and Minnesota are investing in shade and cooling setups to maintain steady production.
A farm manager from Northeast Wisconsin told me, “We lost 6 pounds per cow per day for nearly three weeks straight last July. We’re now investing in tunnel ventilation for a barn that was built to withstand blizzards.”
This isn’t just a Wisconsin problem. We’re seeing operations in Minnesota installing cooling infrastructure for the first time, Pennsylvania farms reevaluating summer feeding strategies, and even Michigan dairies assessing heat abatement systems that weren’t on their radar five years ago.
Technology: Where the Smart Money’s Going
Strategic technology investment is shifting from a luxury to a necessity. Robotic milking machines aren’t cheap—$185,000 to $230,000 before you add facility changes—but farms that properly integrate the technology with their facility design and herd management protocols are reporting paybacks in 24-30 months thanks to better milking frequencies and reduced labor.
On the genetics side, some operations are documenting significant gains in component-corrected milk and herd health traits compared to conventional sire selection, making genomic testing a valuable tool when replacements are limited and premium heifers are selling for $ 4,000 or more at auctions.
This premium is directly reshaping the replacement pipeline, as more producers opt for the immediate cash from a beef-cross calf over raising a heifer. It’s a feedback loop tightening the supply, and its impact is larger than many operators realize.
Risk Management Gets Real
On risk, the Dairy Margin Coverage program is stepping up, offering the best protections we’ve seen since it began. However, milk price swings still pack a significant punch, sometimes shifting by over $12 per hundredweight within just a year. Anyone serious about 2025-26 needs to prioritize risk management, whether through hedging with Dairy Revenue Protection (DRP) and futures options or by securing fixed-price processor contracts.
The Bottom Line
So here’s where it all lands: success is going to those who take these numbers seriously and act on them. Extend lactations where you can, rethink culling strategies considering replacement costs, lean into feed efficiency and genomics where the ROI makes sense, and don’t shy away from risk management tools.
The opportunity is clear: USDA production forecasts demonstrate that efficiency can overcome biological constraints. The operations that move fastest and smartest will set the pace in this new era. How fast can your operation adapt and turn insight into profit? That’s the challenge—and the opportunity—we’re all facing.
Complete references and supporting documentation are available upon request by contacting the editorial team at editor@thebullvine.com.
Learn More:
Genomic Testing 101: A Producer’s Guide to Smarter Breeding Decisions – This guide breaks down the science of genomics into actionable steps, revealing how to use test results to accelerate genetic gain, improve herd health, and maximize your return on investment in a tight replacement market.
Every week, thousands of producers, breeders, and industry insiders open Bullvine Weekly for genetics insights, market shifts, and profit strategies they won’t find anywhere else. One email. Five minutes. Smarter decisions all week.
Andrew grew up on a dairy farm in southern Ontario — which means he learned about herd management, hard work, and tight margins long before it became a career. He went on to build an animal genetics marketing company, running campaigns that actually moved the needle in a notoriously tough-to-reach industry. Today he channels that background into The Bullvine, where he writes about genetics, farm business, and the decisions that separate profitable operations from struggling ones. He doesn’t pull punches, and dairy farmers seem to appreciate that.
To provide the best experiences, we use technologies like cookies to store and/or access device information. Consenting to these technologies will allow us to process data such as browsing behavior or unique IDs on this site. Not consenting or withdrawing consent, may adversely affect certain features and functions.
Functional
Always active
The technical storage or access is strictly necessary for the legitimate purpose of enabling the use of a specific service explicitly requested by the subscriber or user, or for the sole purpose of carrying out the transmission of a communication over an electronic communications network.
Preferences
The technical storage or access is necessary for the legitimate purpose of storing preferences that are not requested by the subscriber or user.
Statistics
The technical storage or access that is used exclusively for statistical purposes.The technical storage or access that is used exclusively for anonymous statistical purposes. Without a subpoena, voluntary compliance on the part of your Internet Service Provider, or additional records from a third party, information stored or retrieved for this purpose alone cannot usually be used to identify you.
Marketing
The technical storage or access is required to create user profiles to send advertising, or to track the user on a website or across several websites for similar marketing purposes.
To provide the best experiences, we and our partners use technologies like cookies to store and/or access device information. Consenting to these technologies will allow us and our partners to process personal data such as browsing behavior or unique IDs on this site and show (non-) personalized ads. Not consenting or withdrawing consent, may adversely affect certain features and functions.
Click below to consent to the above or make granular choices. Your choices will be applied to this site only. You can change your settings at any time, including withdrawing your consent, by using the toggles on the Cookie Policy, or by clicking on the manage consent button at the bottom of the screen.
Functional
Always active
The technical storage or access is strictly necessary for the legitimate purpose of enabling the use of a specific service explicitly requested by the subscriber or user, or for the sole purpose of carrying out the transmission of a communication over an electronic communications network.
Preferences
The technical storage or access is necessary for the legitimate purpose of storing preferences that are not requested by the subscriber or user.
Statistics
The technical storage or access that is used exclusively for statistical purposes.The technical storage or access that is used exclusively for anonymous statistical purposes. Without a subpoena, voluntary compliance on the part of your Internet Service Provider, or additional records from a third party, information stored or retrieved for this purpose alone cannot usually be used to identify you.
Marketing
The technical storage or access is required to create user profiles to send advertising, or to track the user on a website or across several websites for similar marketing purposes.


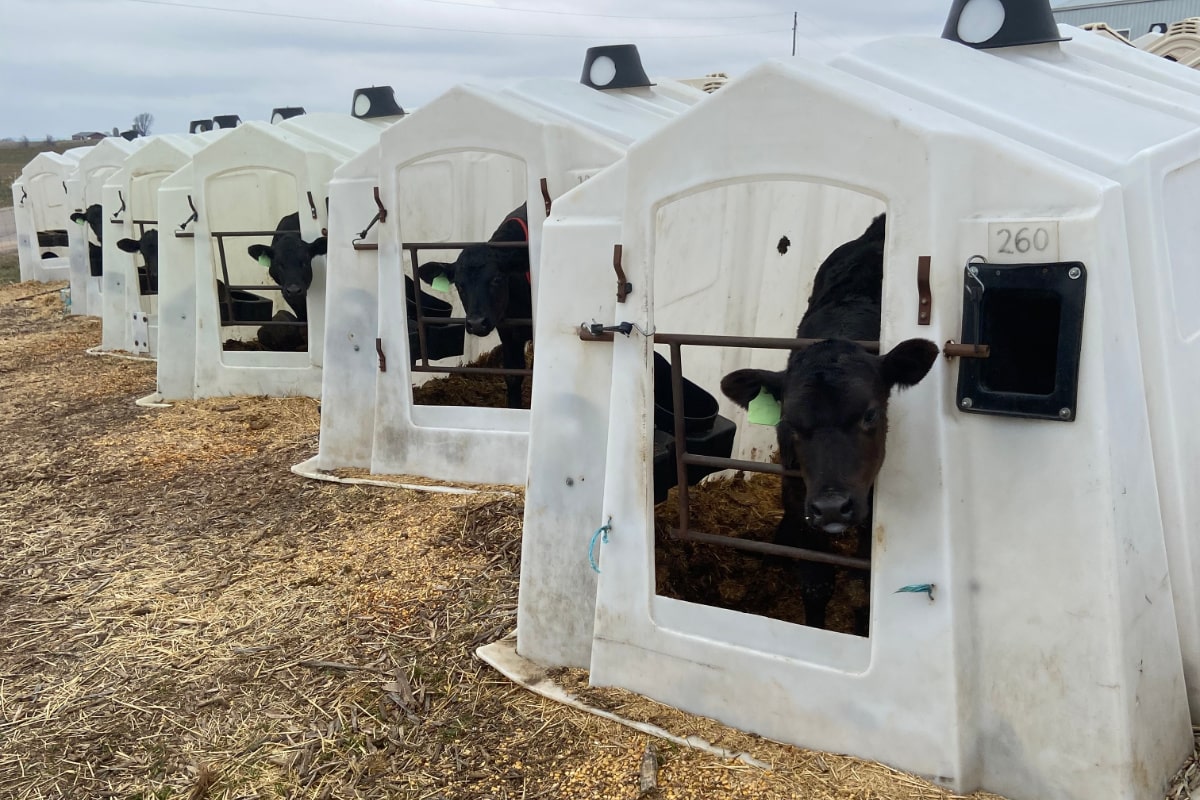
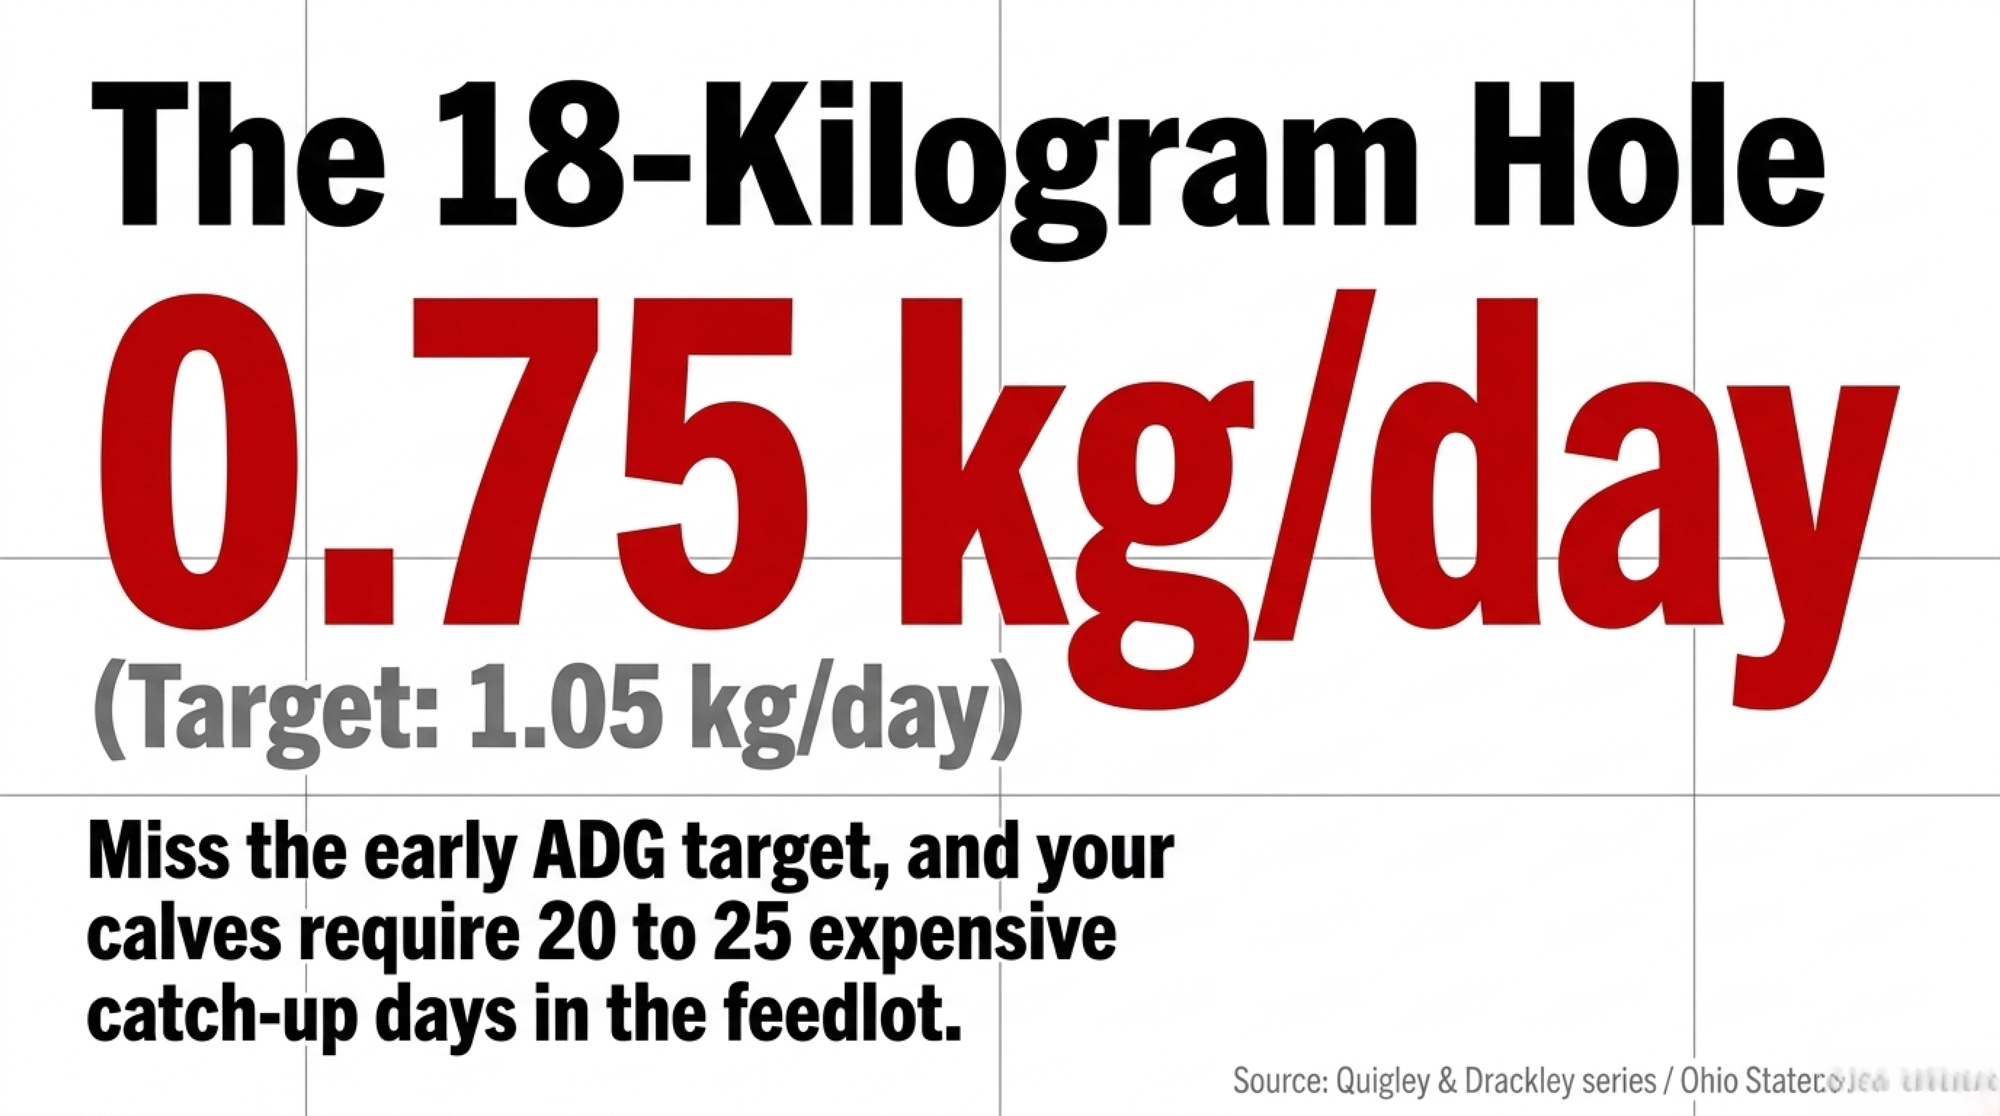
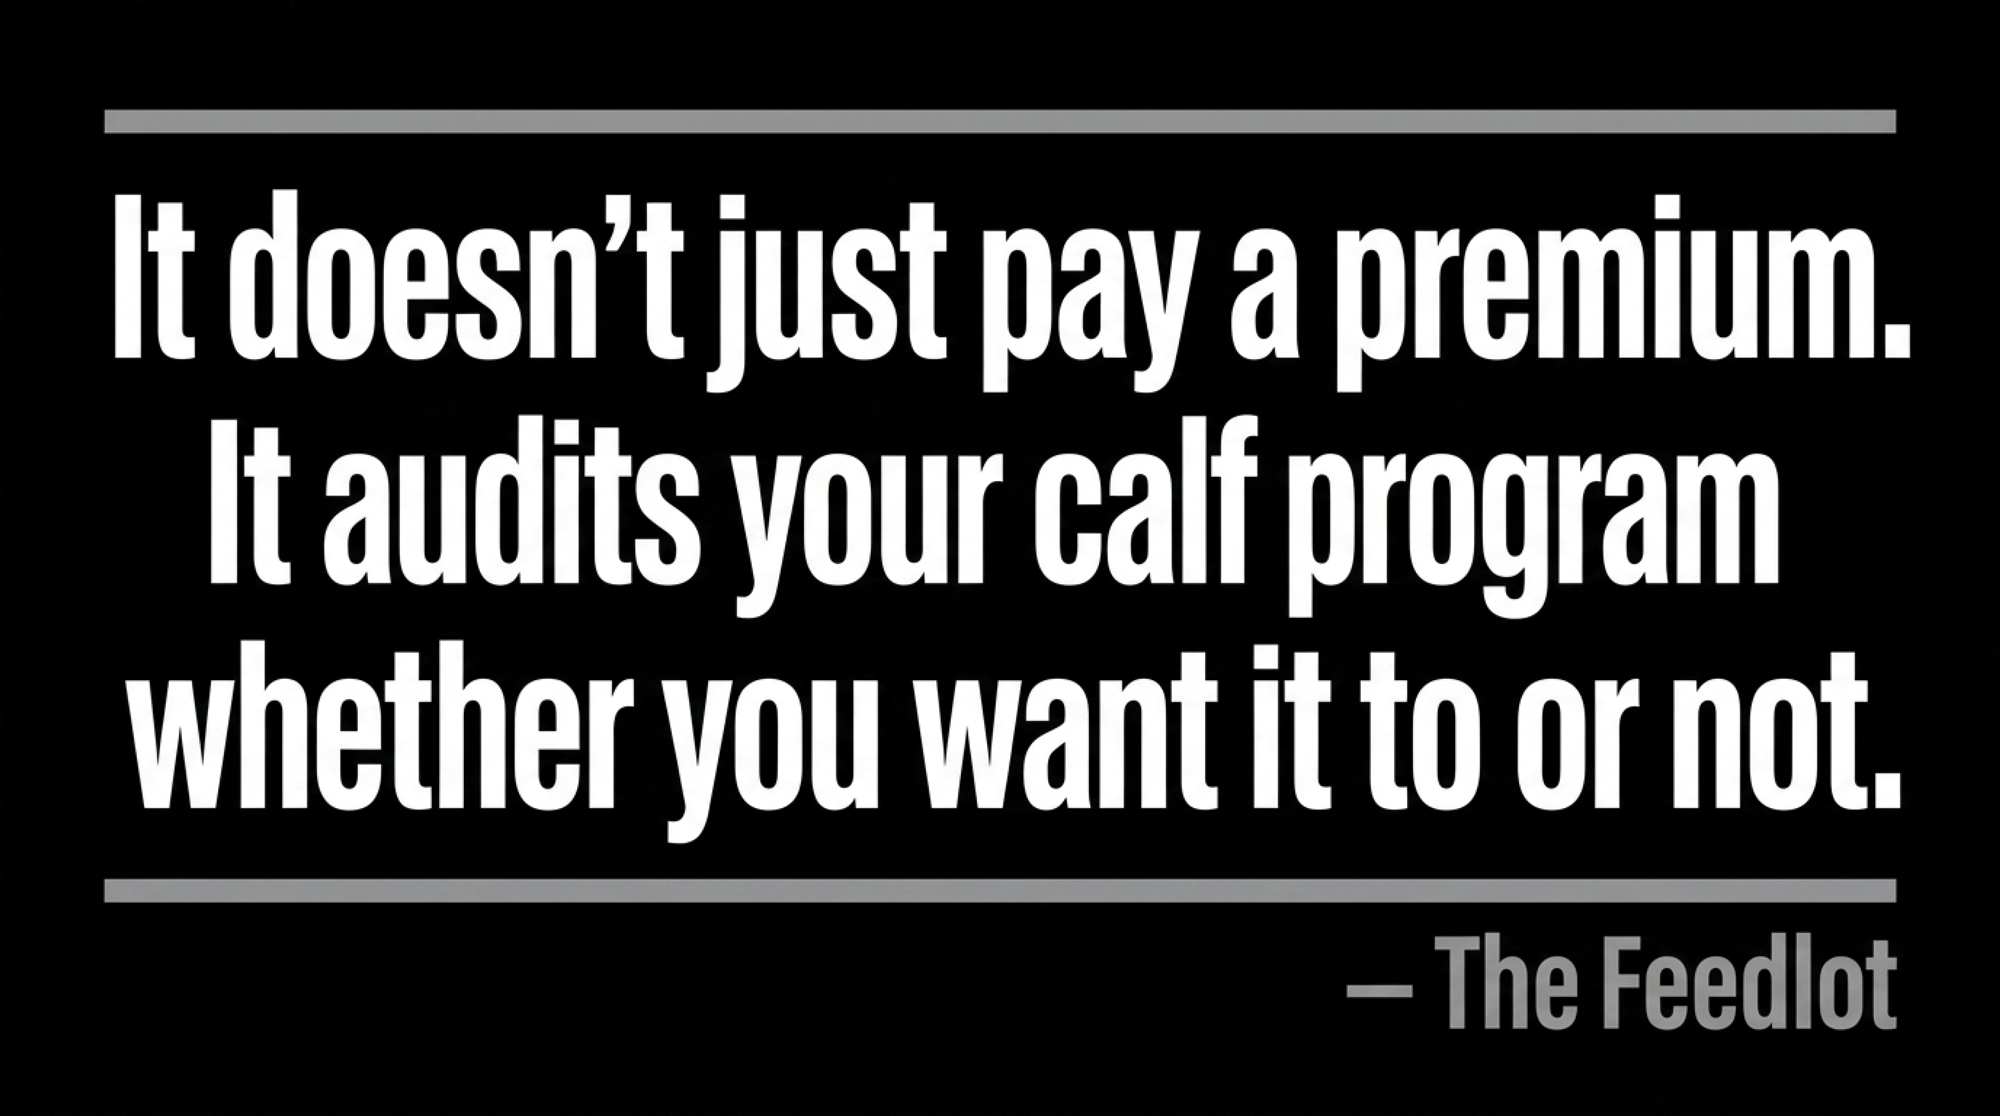
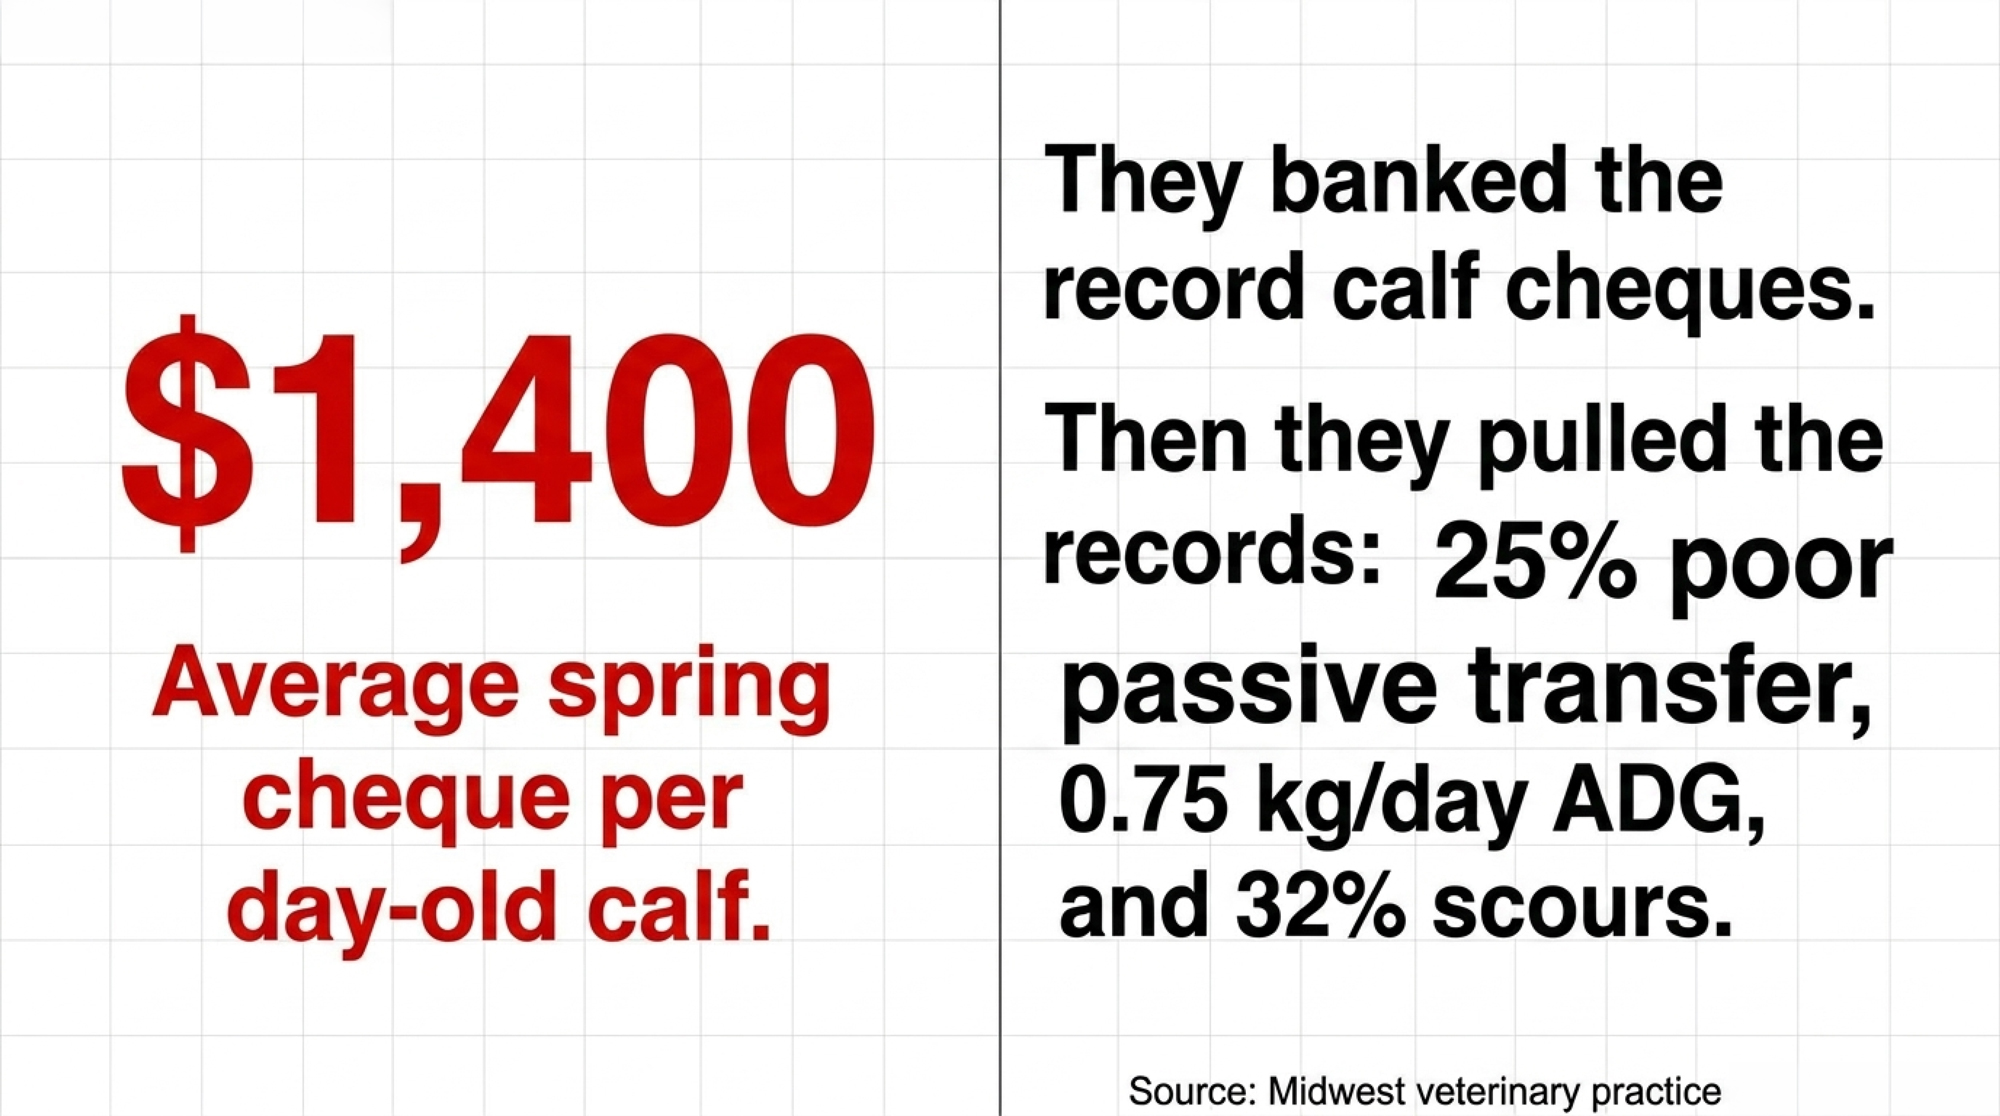
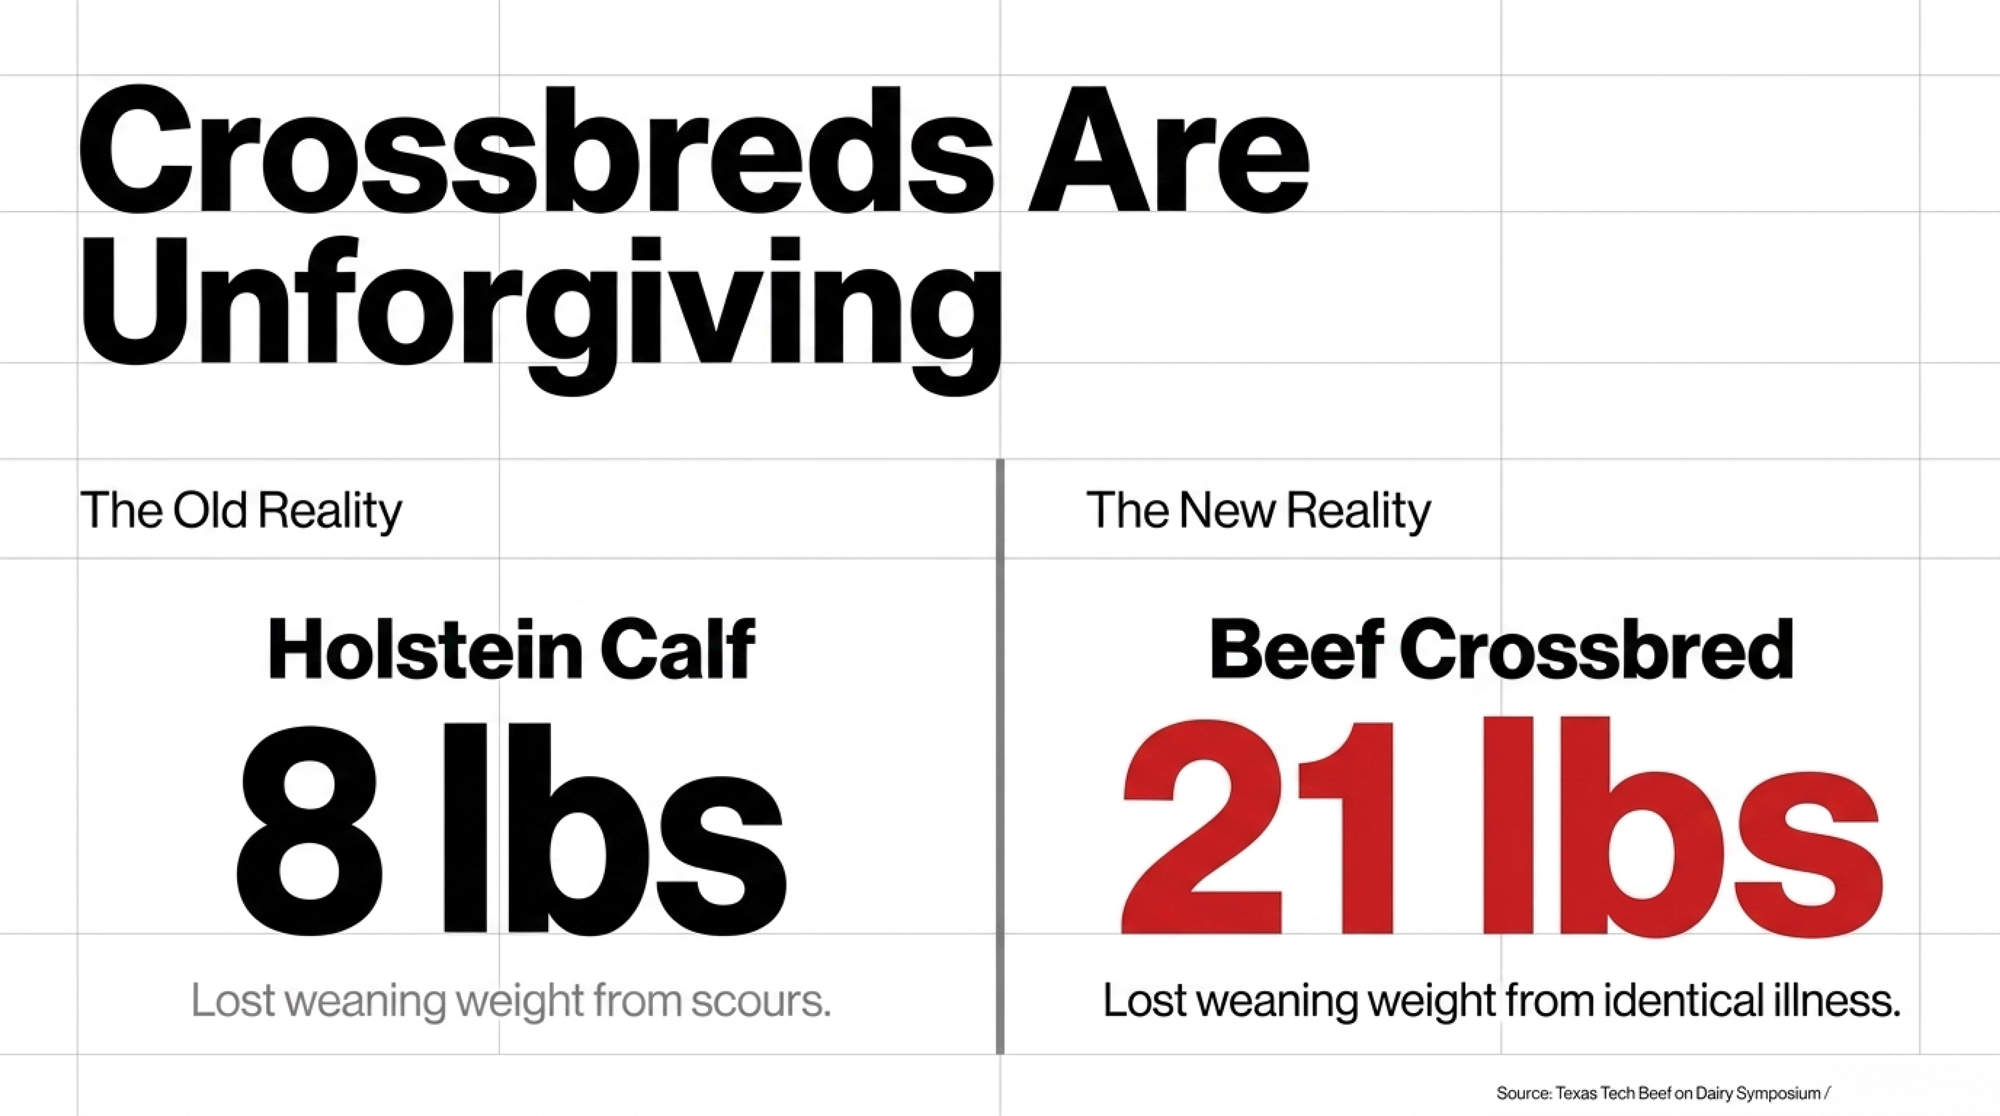
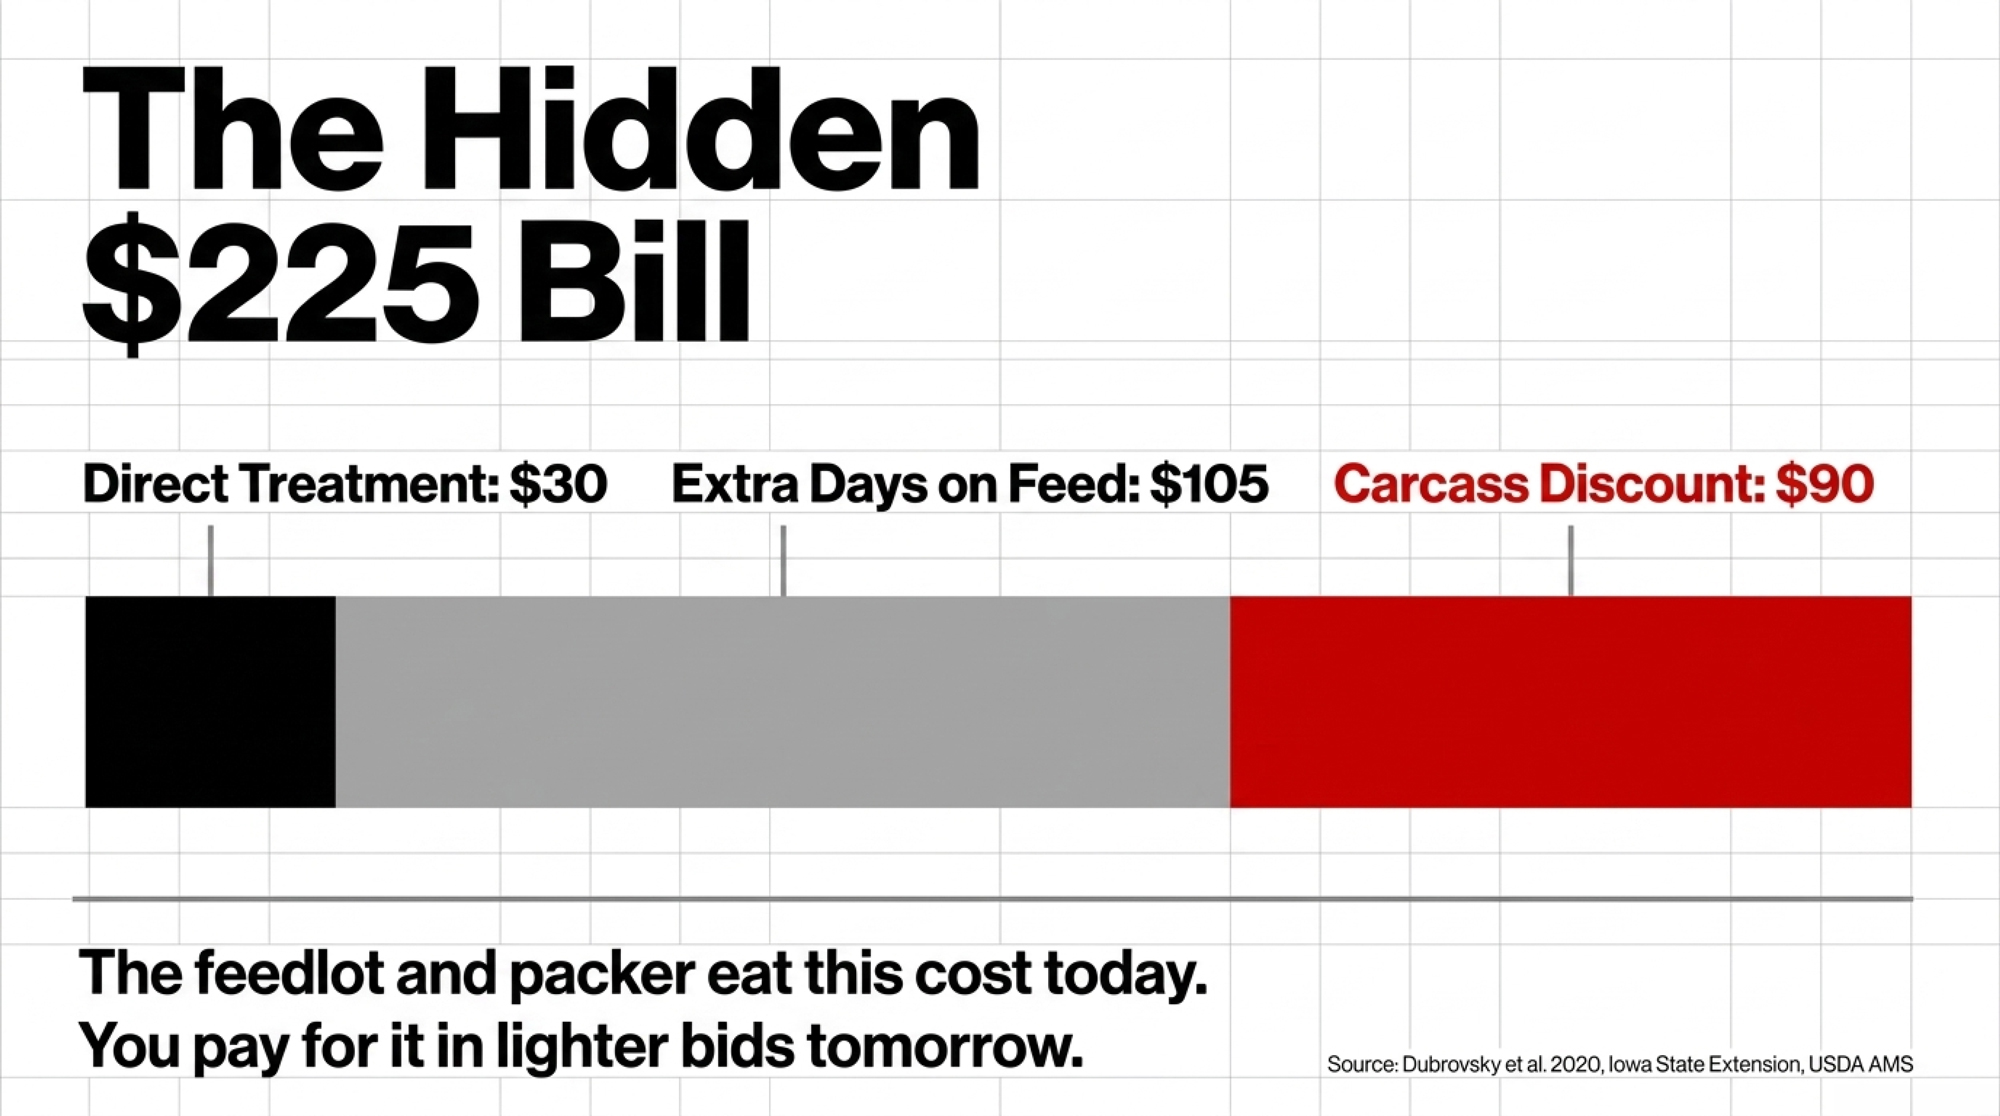
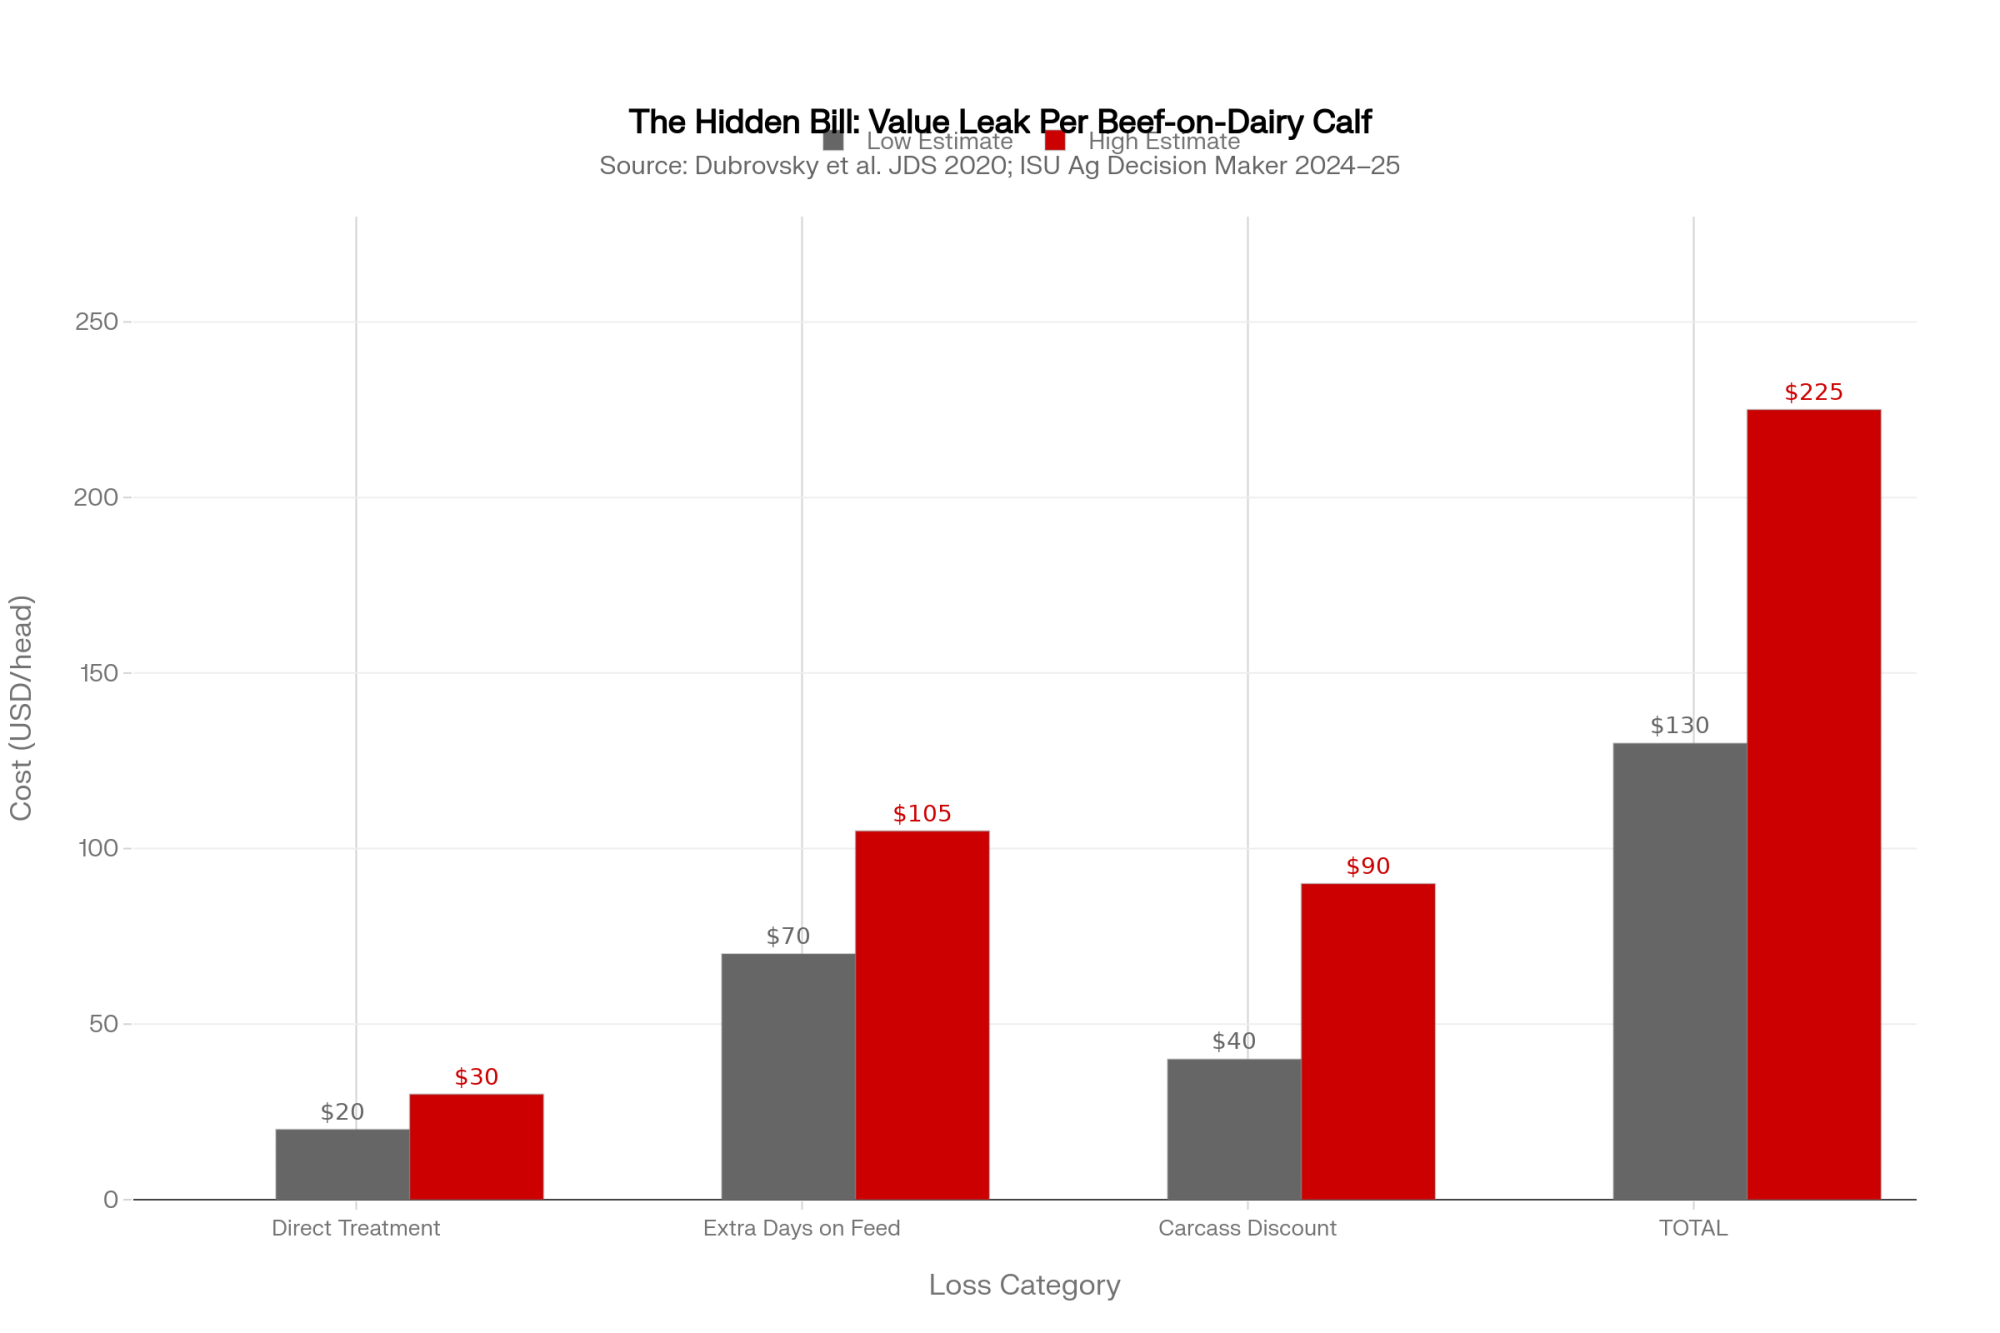
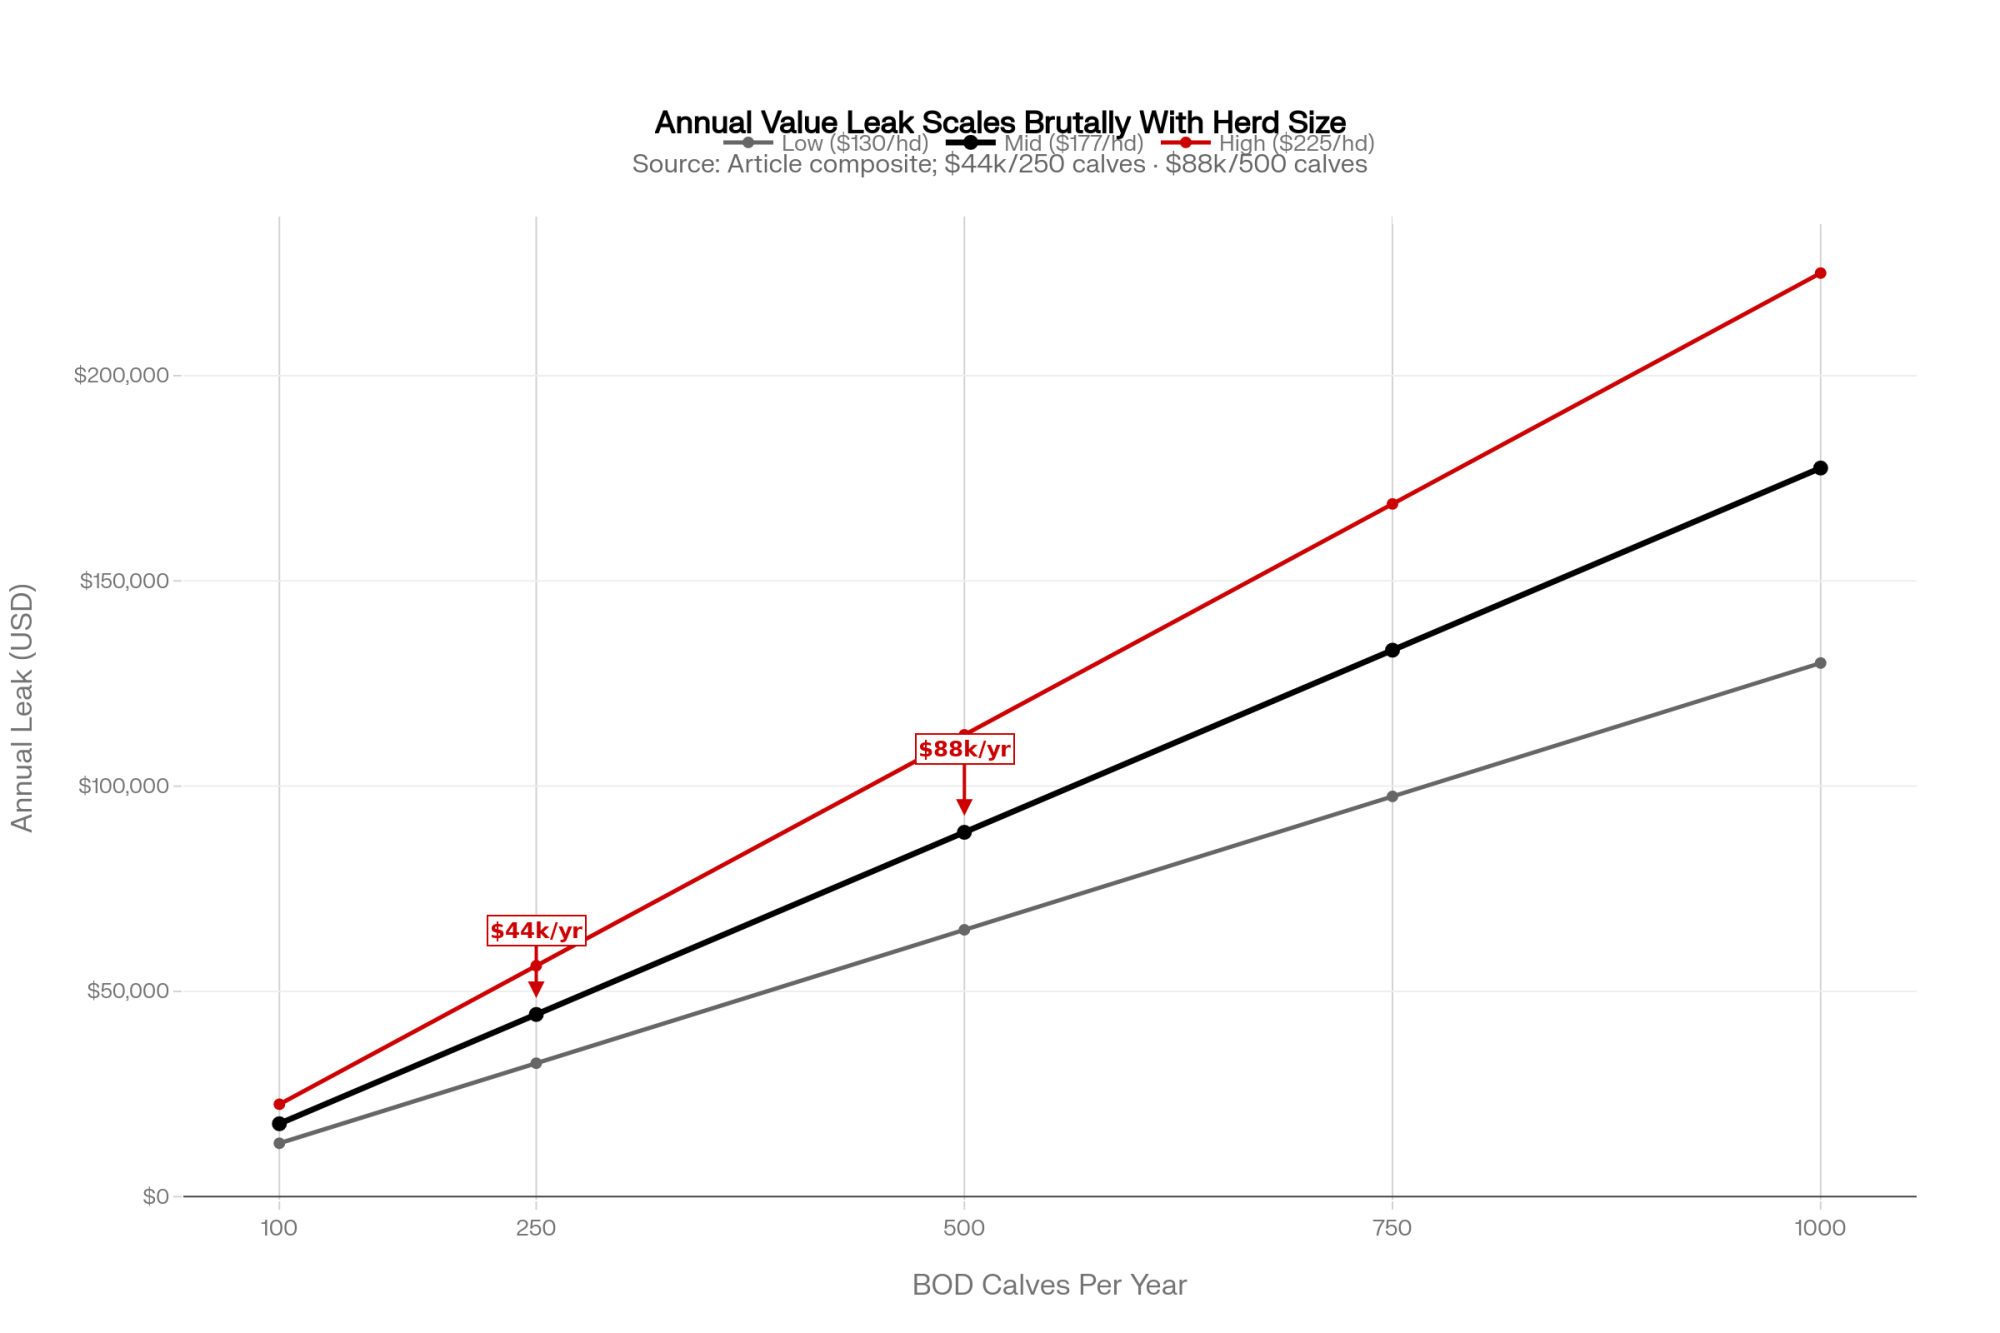
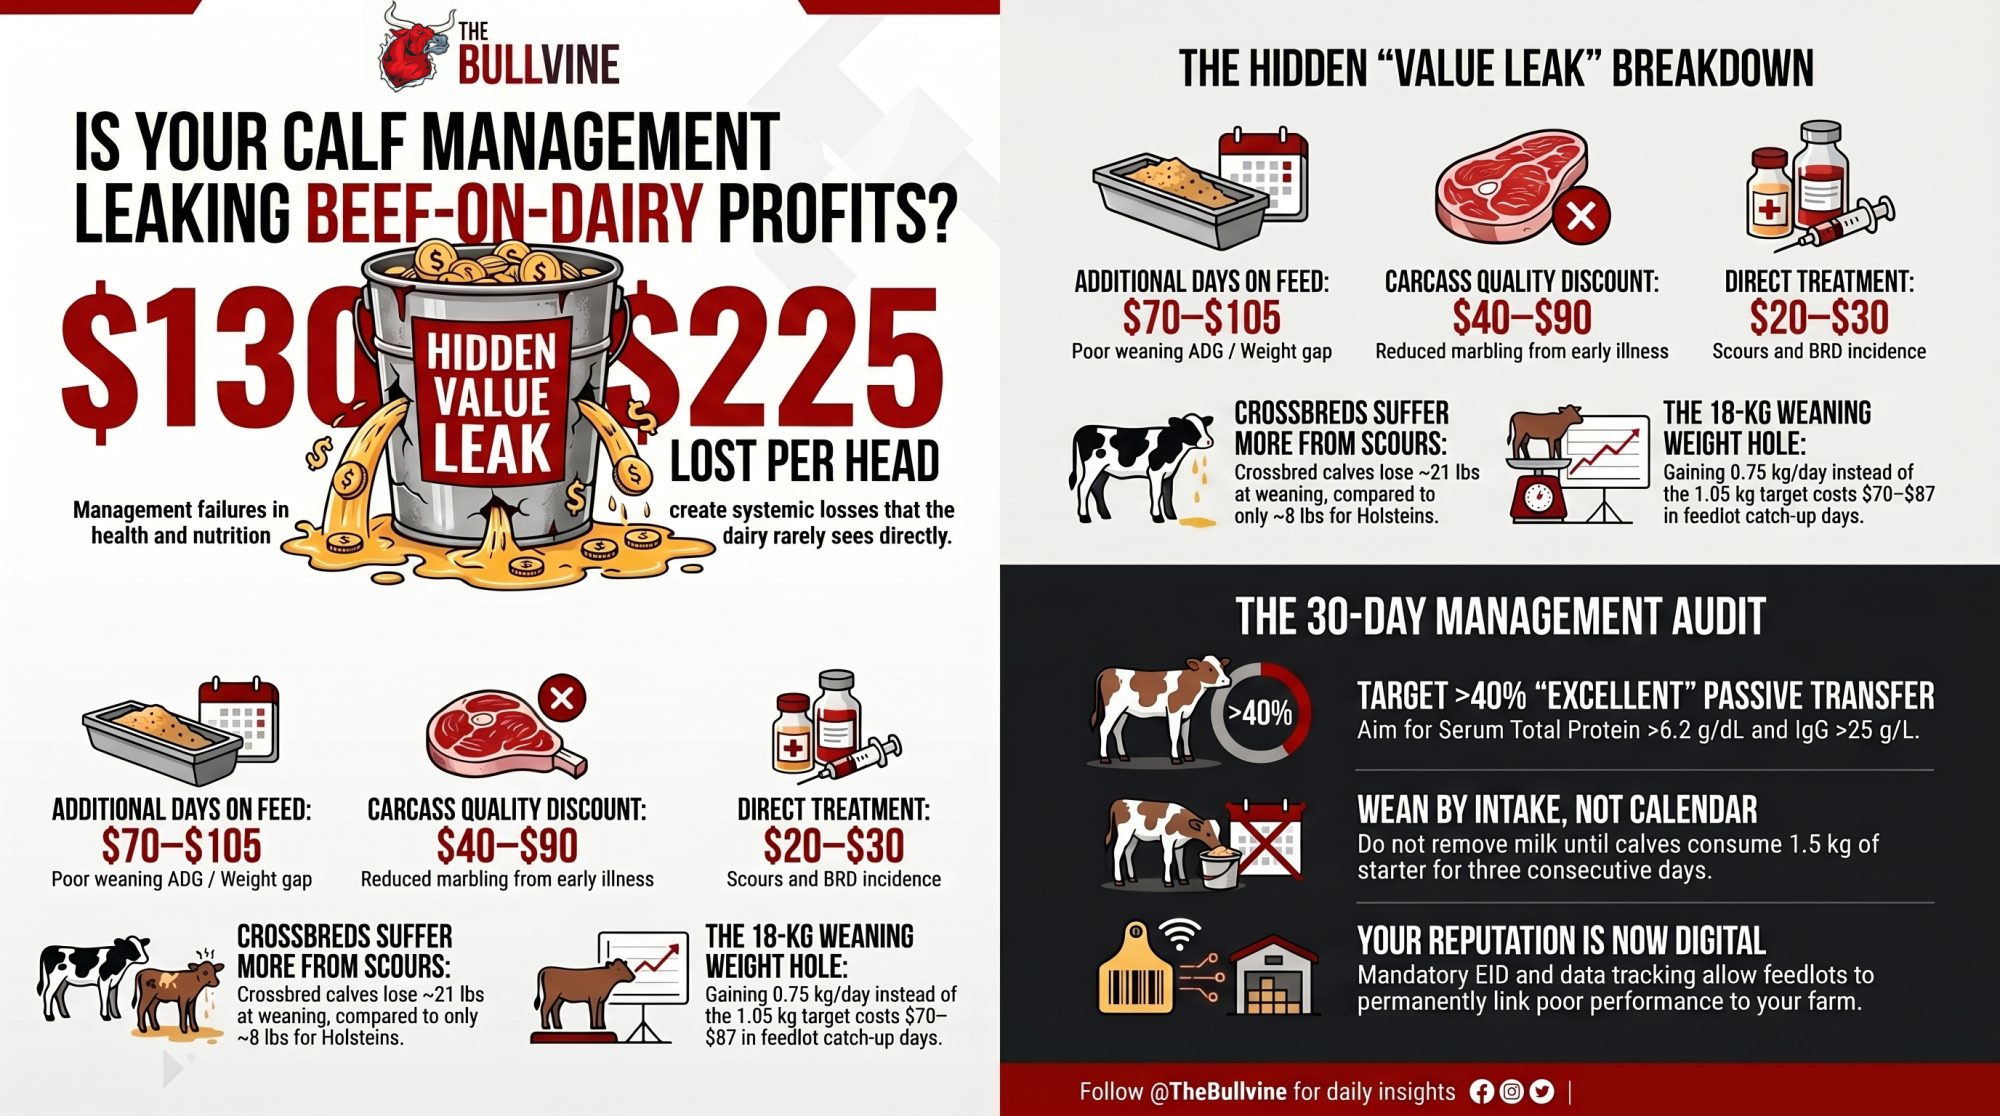
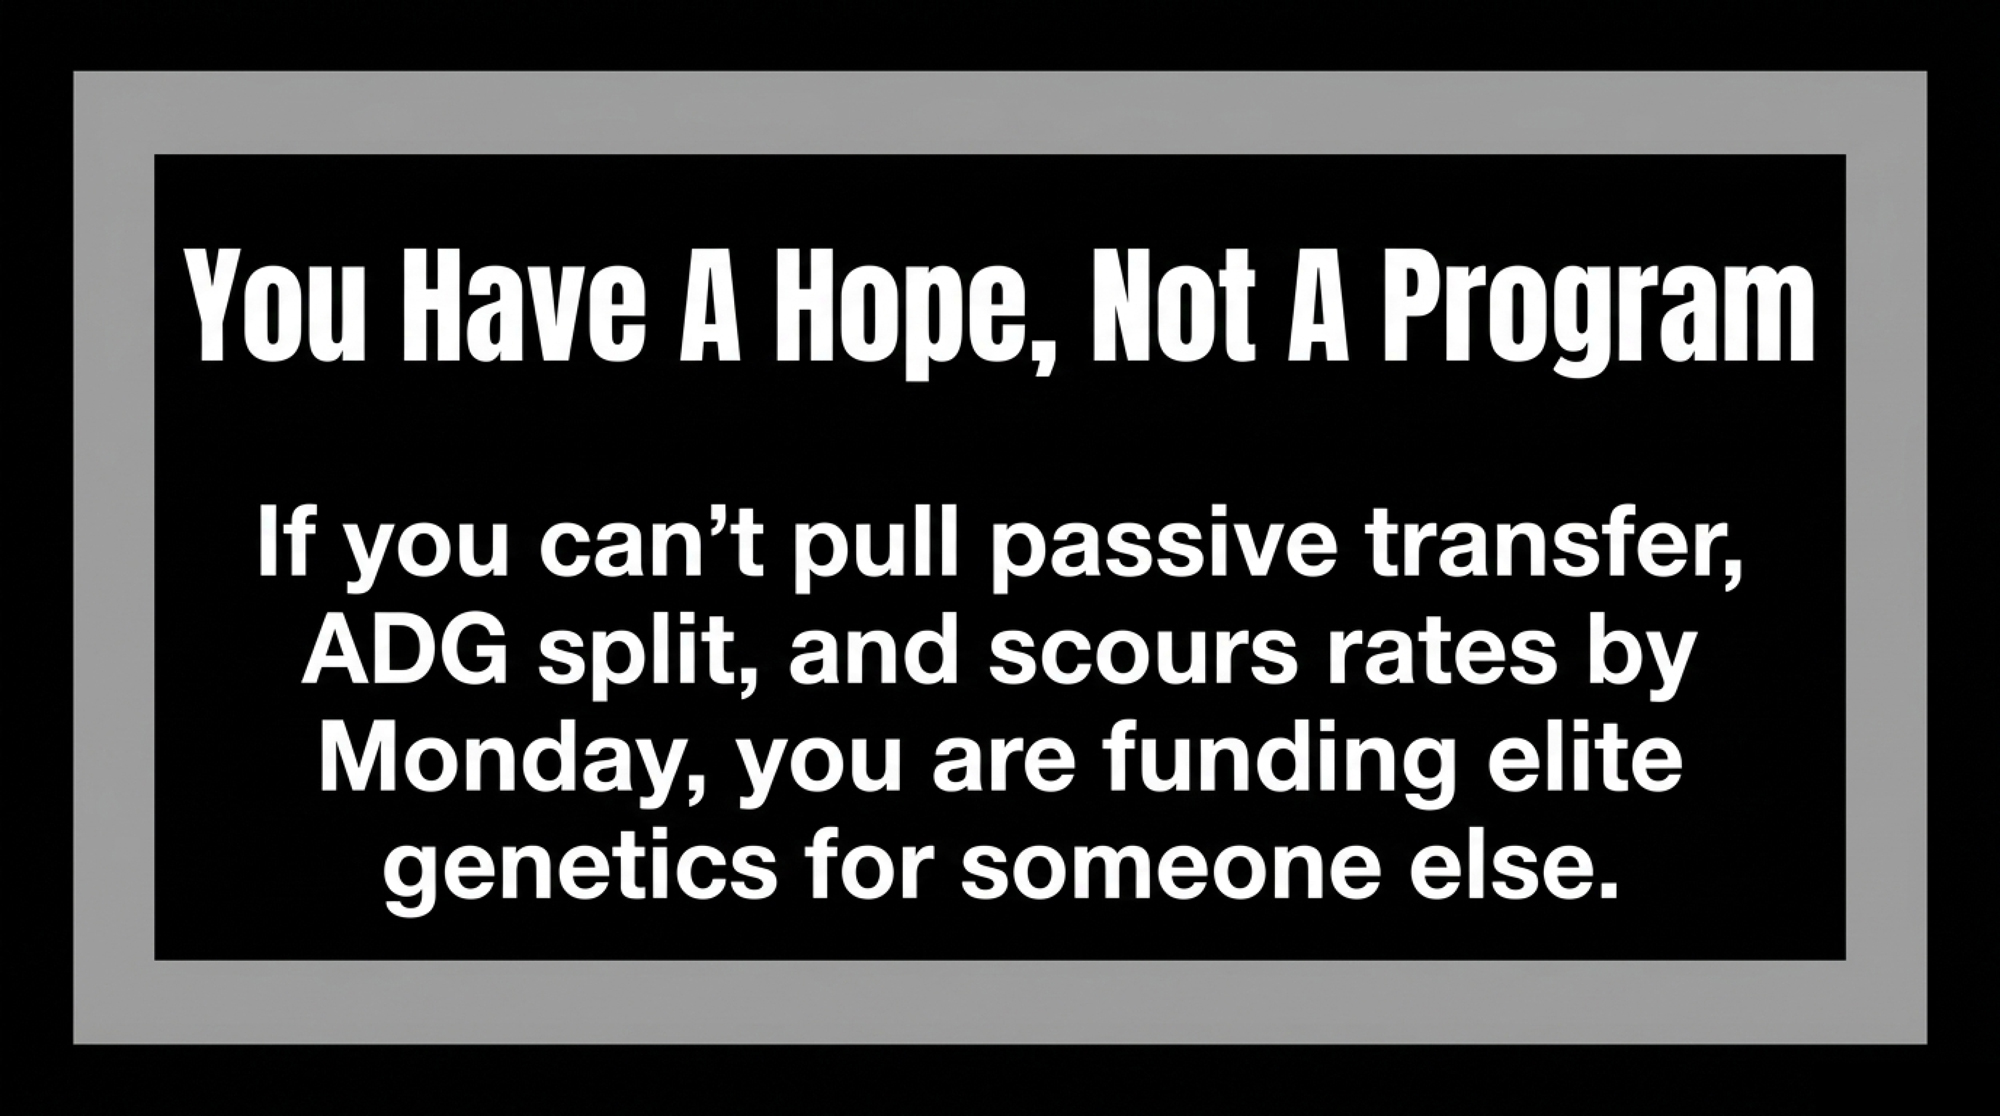
 The Sunday Read Dairy Professionals Don’t Skip.
 The Sunday Read Dairy Professionals Don’t Skip.