


A Panhandle dairy is 200 beef services deep on viable dams and $116,600 short on 2028 replacement value. The straw’s in the gun this week. The $3,500 springer check comes later.
Executive Summary
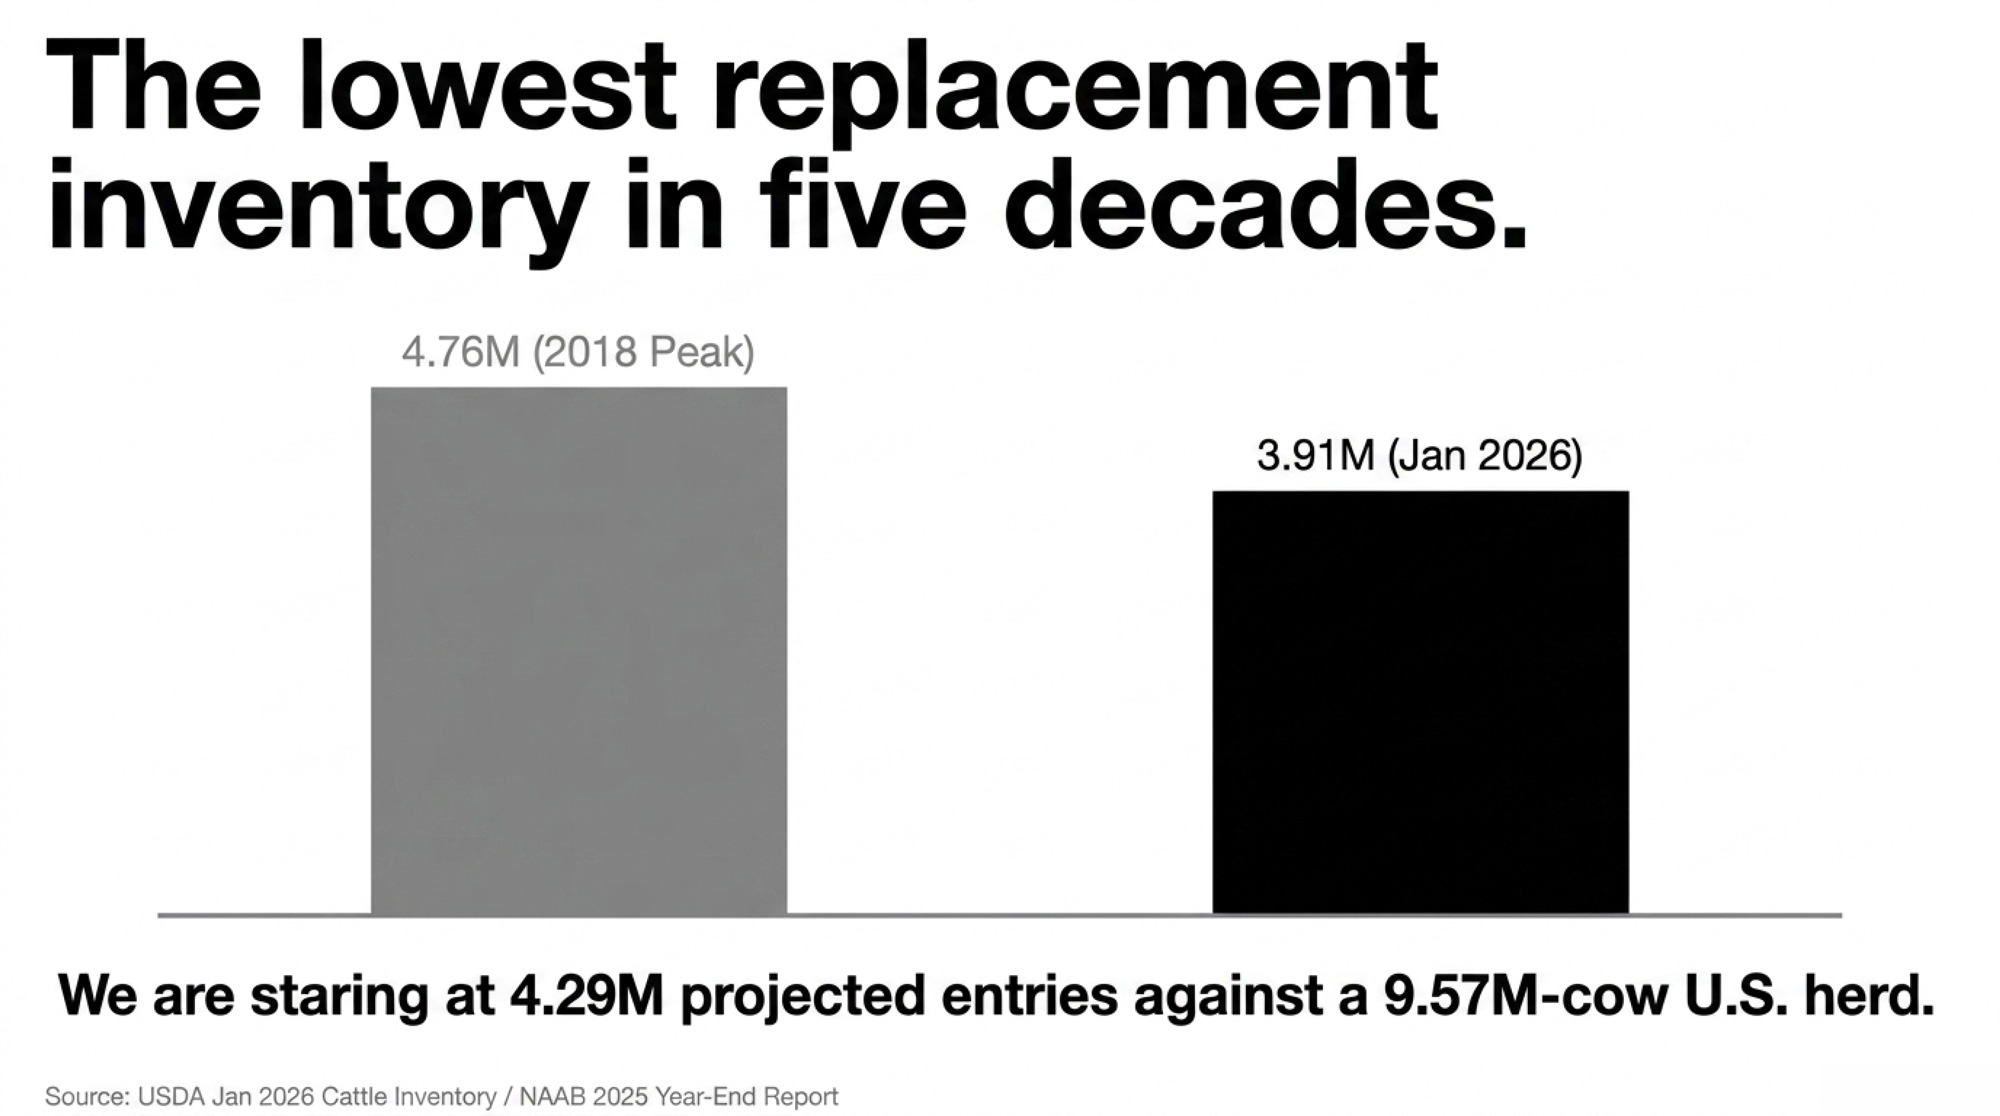
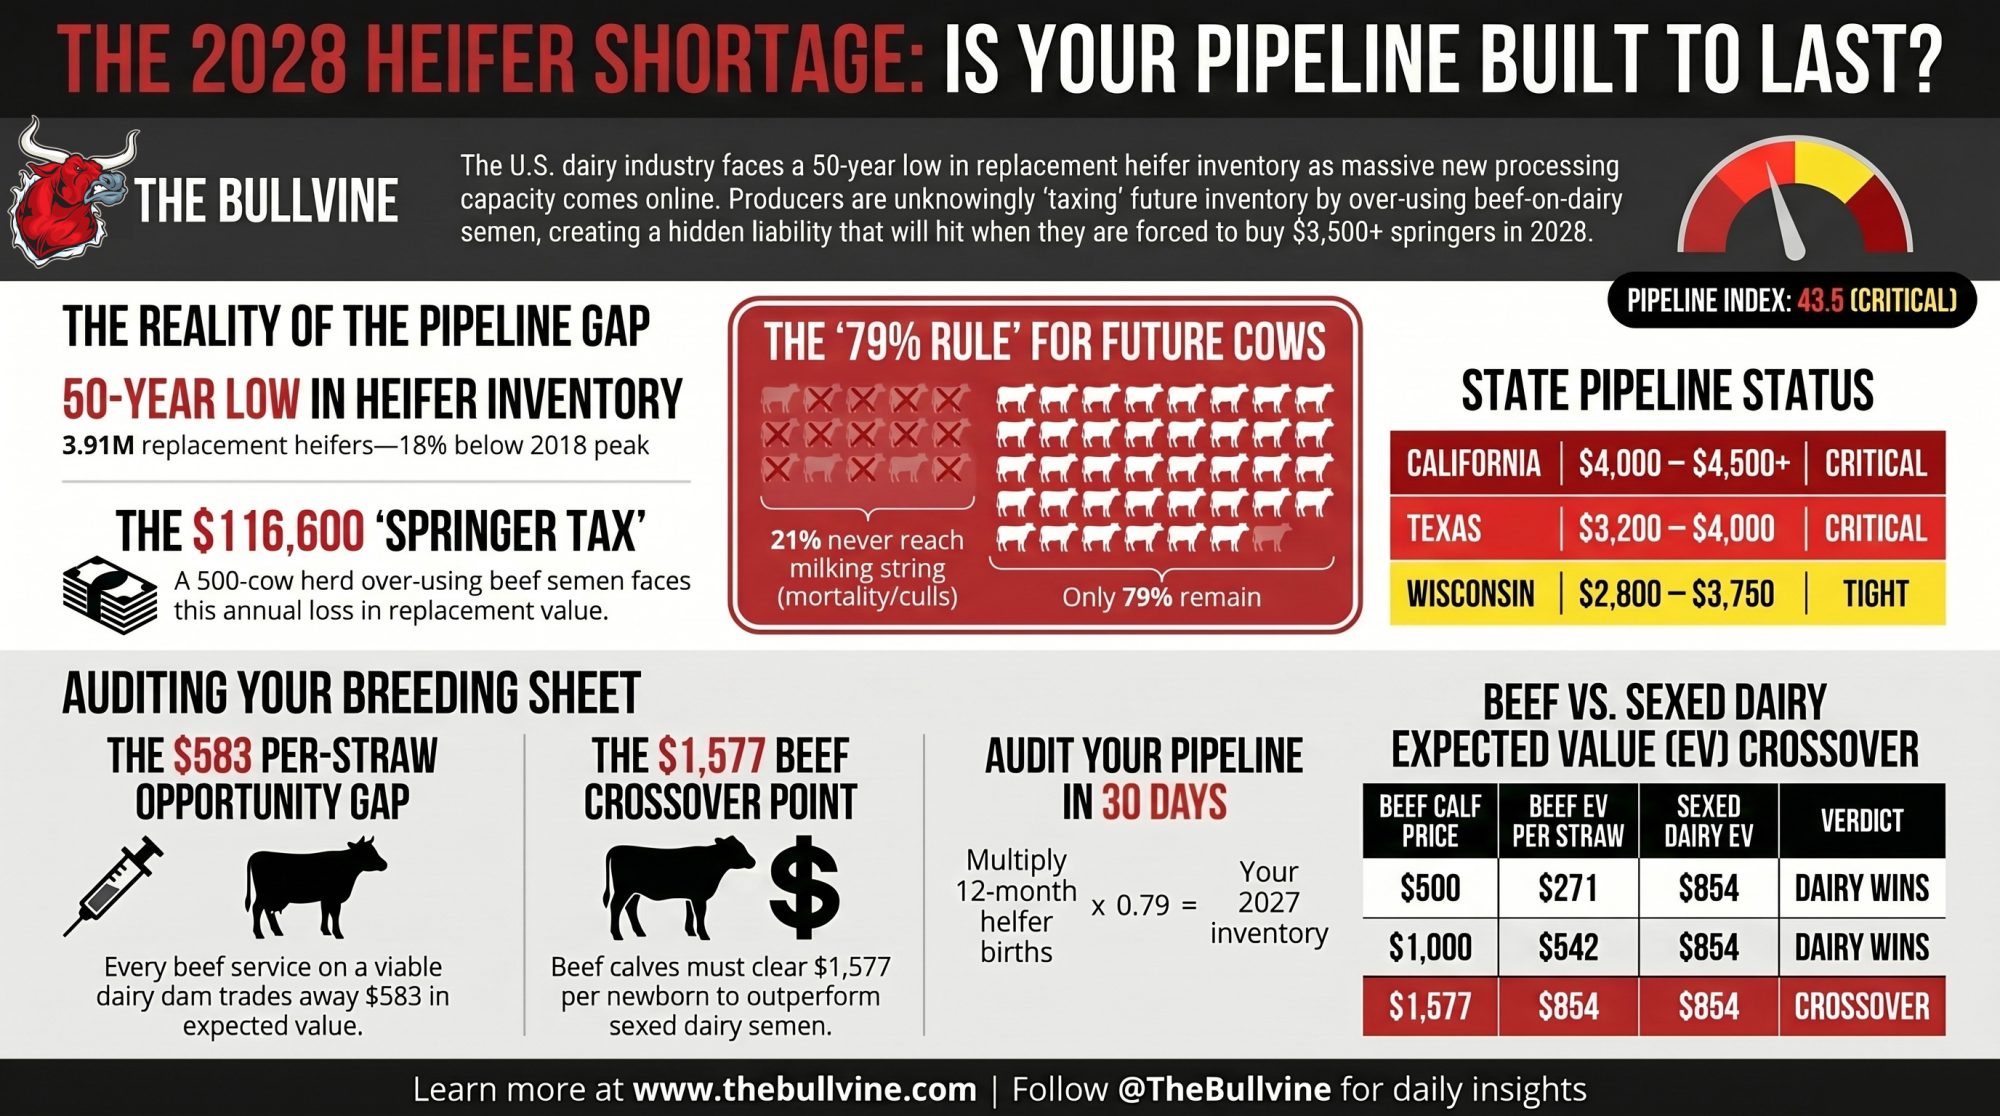
- The gap is real: 4.29M projected milking-herd entries for 2027 against a 9.57M-cow U.S. herd, with USDA’s most recent Cattle Inventory at 3.91M replacement heifers — the lowest in nearly five decades.
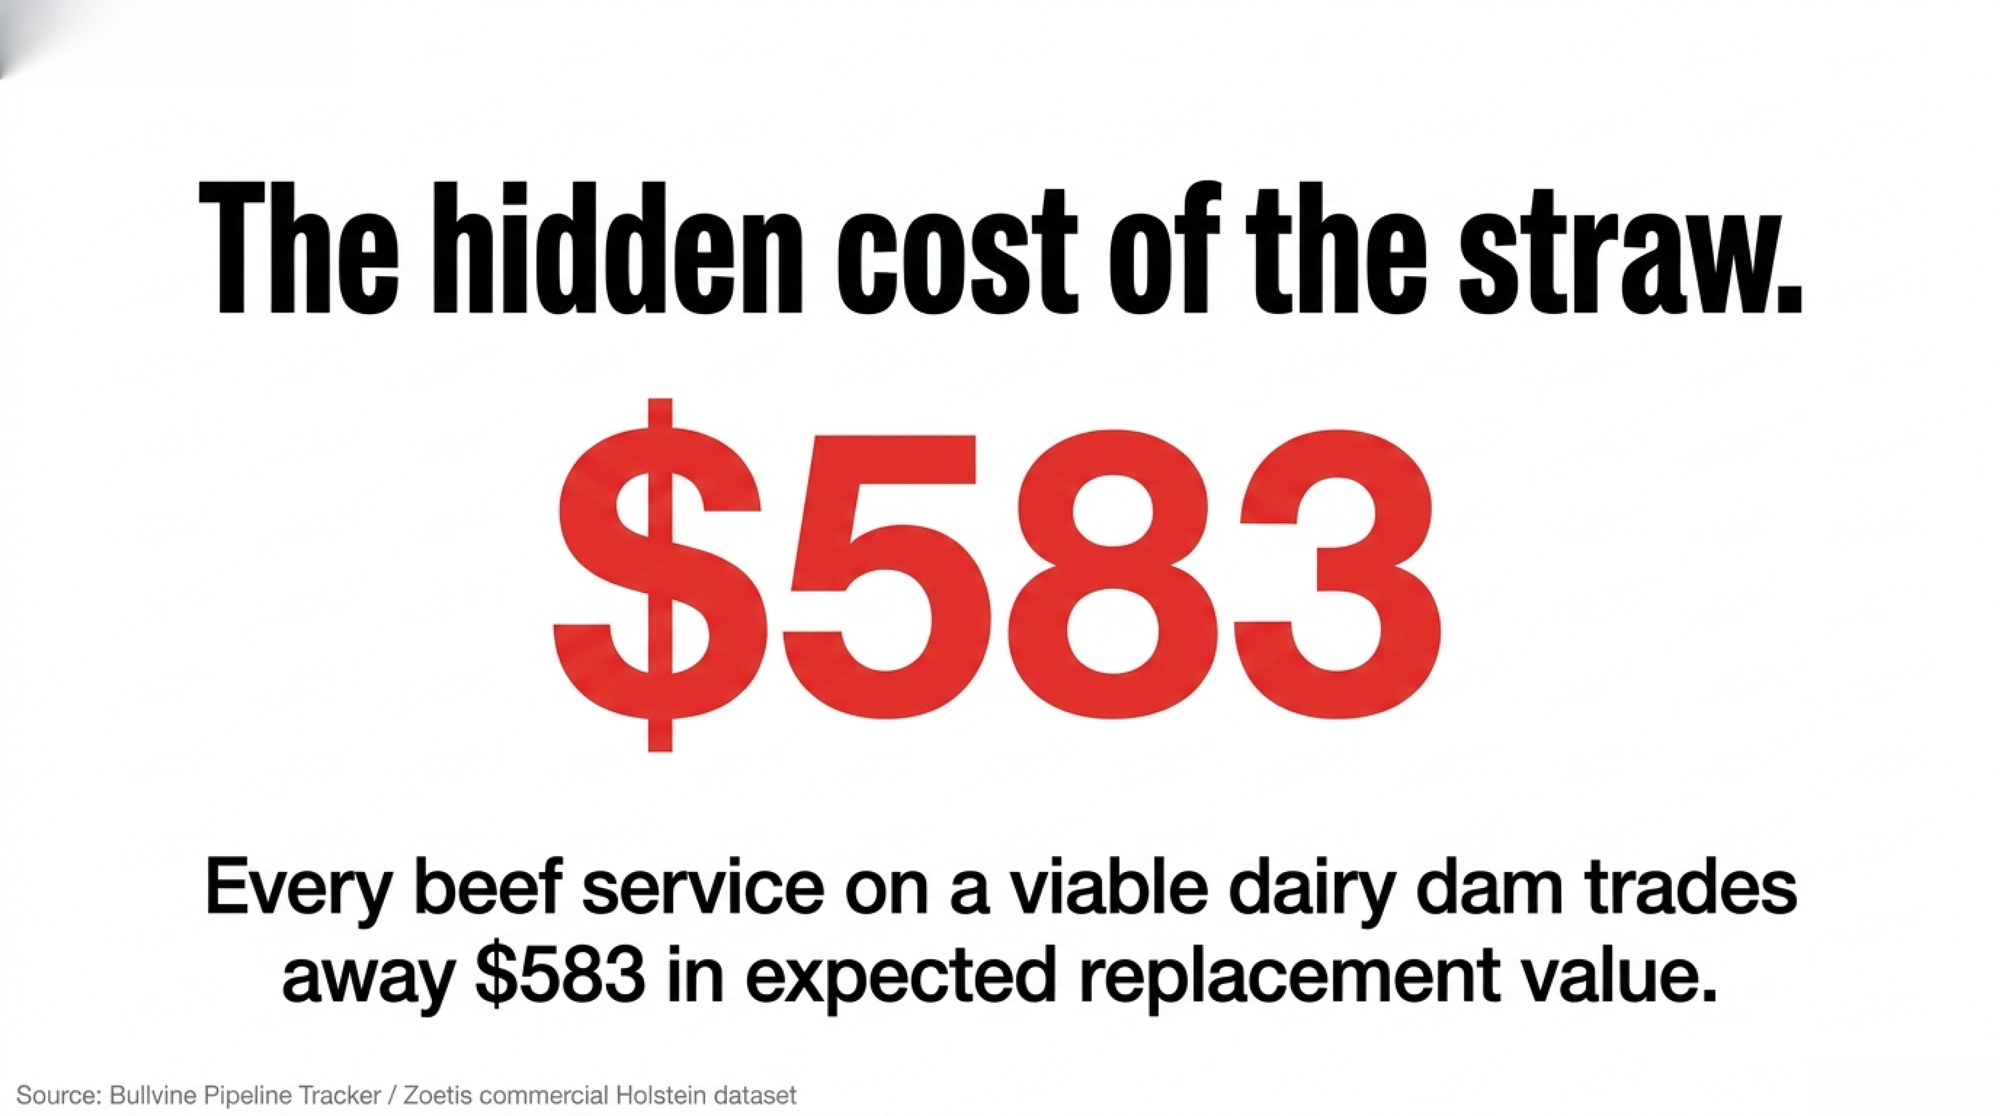
- The per-straw math isn’t close: Every beef service on a viable dairy dam trades away ~$583 in expected replacement value. On a 500-cow Panhandle herd running 35% beef-on-dairy, that’s ~$116,600 a year walking off the breeding sheet.
- Retention has masked the hole: Weekly slaughter ran below year-earlier levels in 86 of 88 weeks through mid-May 2025, but Class III at $14.59, $14.94, and $16.16 across Jan–Mar 2026 is changing the retention math fast — into the same shortage that $11B in new processing capacity is landing on top of.
- The lender question: If your 12-month heifer-calf count × 0.79 doesn’t clear herd size × replacement rate, you’re already buying someone else’s springers at $3,500-plus in 2028 — the question is whether that’s on your budget or a working-capital covenant breach.
A 500-cow Panhandle dairy needs 135 replacement heifers a year at a 27% turnover rate. At the July 2025 U.S. replacement-heifer average of $3,010 per head (USDA Agricultural Prices), that’s a $406,350 annual replacement line — closer to $500,000 once California and West Texas premium bands kick in. The breeding decisions on that farm’s clipboard this week decide whether those 135 head come out of the home barn in 2028 or go under the hammer at $3,500-plus.
That Panhandle herd is a composite built from Bullvine Pipeline Tracker inputs. The pressure it’s under is not.
HOW TO READ THE PIPELINE TRACKER The Tracker converts NAAB’s semen-unit totals into projected milking-herd entries using published commercial-Holstein conversion rates (conception, pregnancy survival, heifer sex ratio, calf-to-milking-cow completion). Every Tracker number in this piece traces back to those two inputs: units sold and what they become by first lactation.
What the Pipeline Tracker Actually Shows
The Bullvine Replacement Pipeline Tracker applies commercial-Holstein conversion rates to NAAB’s 2025 Year-End Report, released March 2026. Domestic units only: 10.6 million sexed dairy, 6.0 million conventional dairy, 8.1 million beef-on-dairy. Sexed now accounts for 64% of domestic dairy units, up from roughly 58% a year earlier.
Run those volumes through the published conversion rates from Dr. Michael Overton’s Zoetis field dataset of 85 commercial Holstein herds — 42% sexed conception, 57% conventional, 95% pregnancy survival, 90% heifer sex ratio on sexed, and a 79% calf-to-milking-cow completion rate. The arithmetic lands at 4.29 million milking-herd entries projected for 2027. (Derivation applies a 50% heifer sex ratio to conventional services; sexed services carry the stated 90% ratio. The Overton dataset reflects U.S. commercial-Holstein average conditions across 85 herds, not top-third management benchmarks.)
Line that up against a 9.57-million-cow U.S. dairy herd — the largest since the early 1990s — and roughly $11 billion in new processing capacity committed across 50-plus projects in 19 states (CoBank Knowledge Exchange, August 2025). USDA’s January 2026 Cattle Inventory counted 3.91 million replacement heifers on U.S. farms, the lowest in nearly five decades and 18% below the 2018 peak.
That’s the hole. It’s not rhetoric. It’s arithmetic.
The 4.29 million number assumes current conversion rates hold. Real pipeline outcomes will move with protocol quality, pre-weaning calf mortality, and economic conditions that shift culling behavior. But the direction isn’t in dispute.
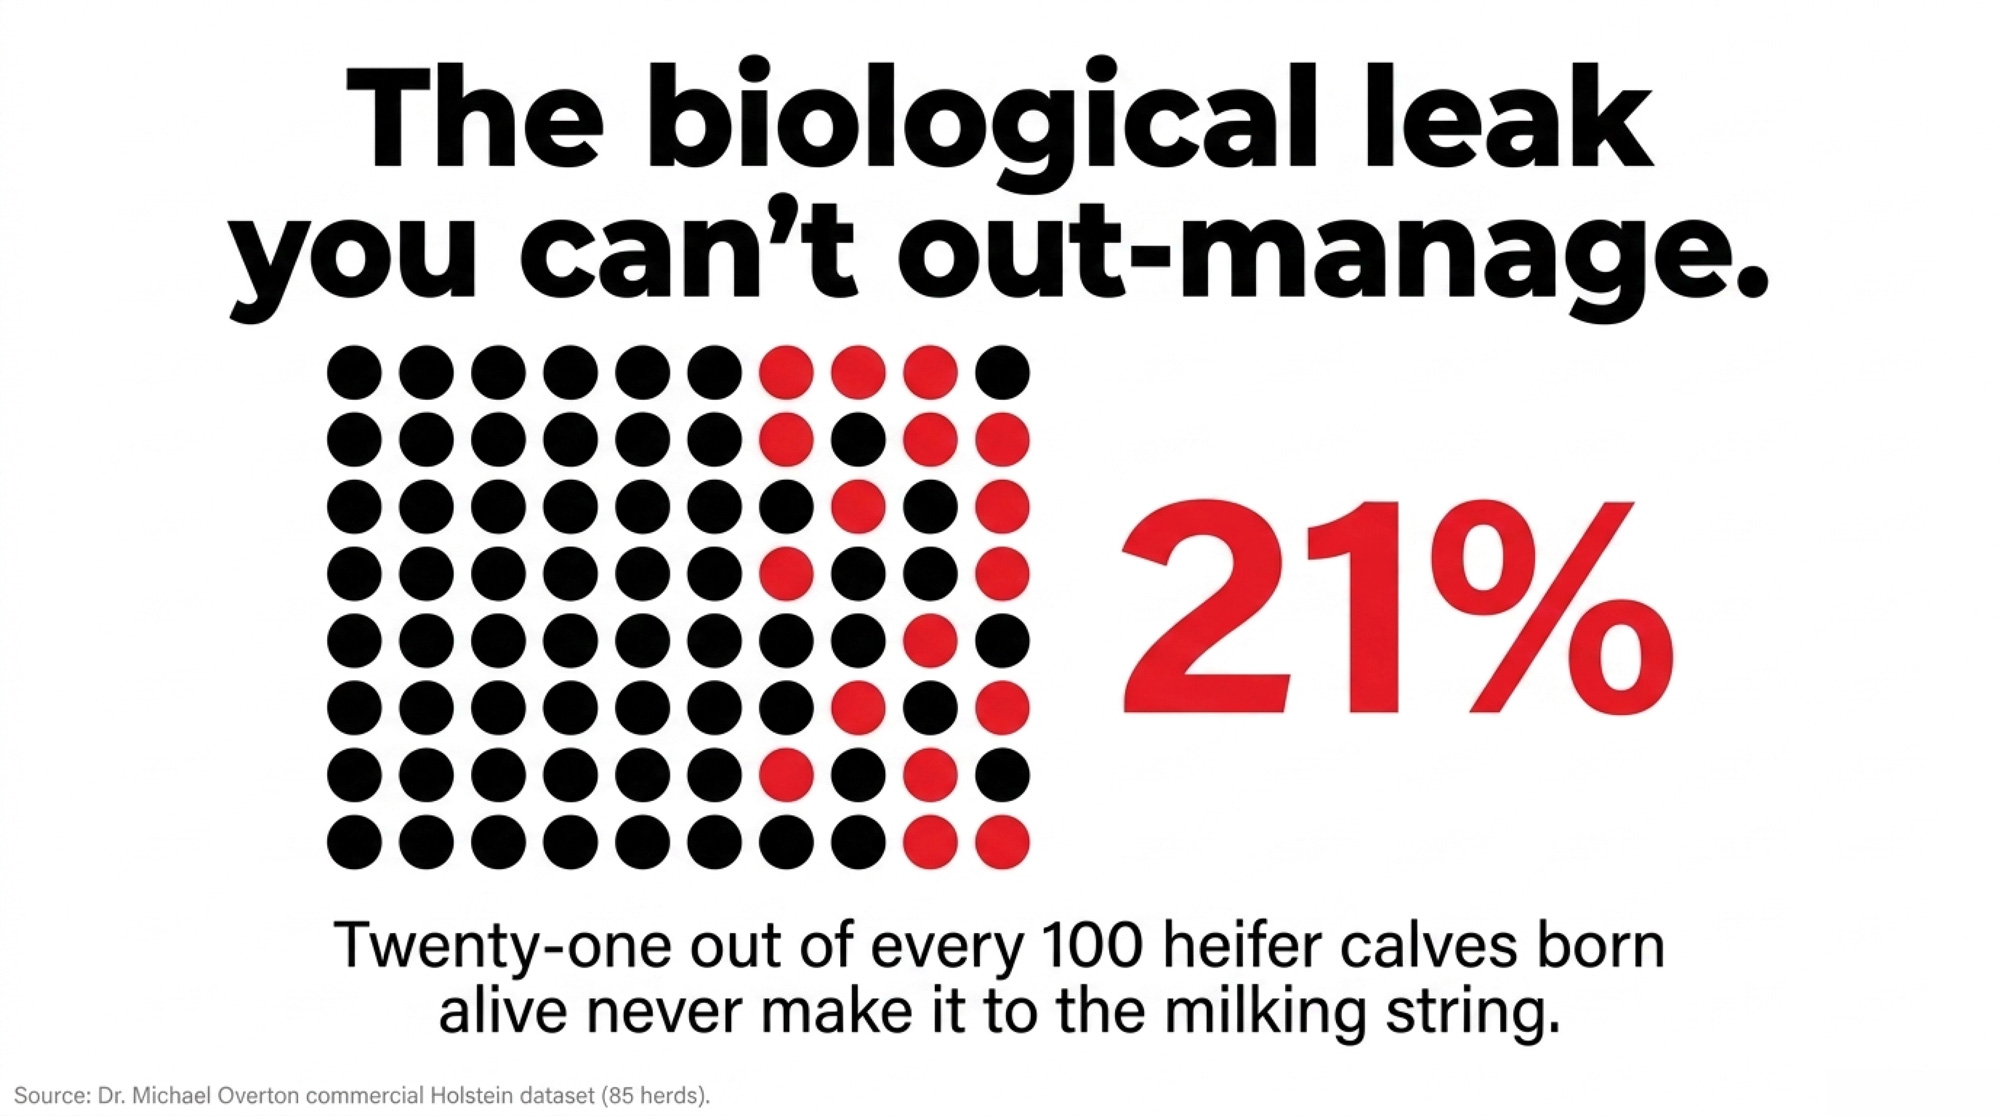
Why 79% Is the Number Producers Underestimate
Twenty-one out of every 100 heifer calves born alive never make it to the milking string. That’s a fifth of the rearing investment walking out the door, baked into every pipeline projection that matters.
Where the 21% leaks out — audit your own barn against each of these checkpoints:
- Pre-weaning mortality: calf scours, pneumonia, failure of passive transfer.
- Post-weaning to breeding age: respiratory disease, lameness, chronic poor-doers.
- Failed breeding: heifers that don’t conceive in the breeding window your SOPs allow.
- Pregnancy loss: abortions and twins lost between confirmed preg check and calving.
- Stillbirth and dystocia loss at calving.
- Did-not-complete-first-lactation culls: fresh-cow disease, chronic mastitis, repeat breeder, classifier-flagged conformation issues shipped before 305 DIM.
Plug it into a 500-cow herd: pull the last 12 months of heifer-calf births, multiply by 0.79, and compare against herd size × replacement rate. If the number lands at 110 or 115 against a 135-heifer need, the future herd is already under-built. No market rally generates animals that aren’t in your pipeline.
The $583 Gap — Where Your Breeding Sheet Is Writing Checks
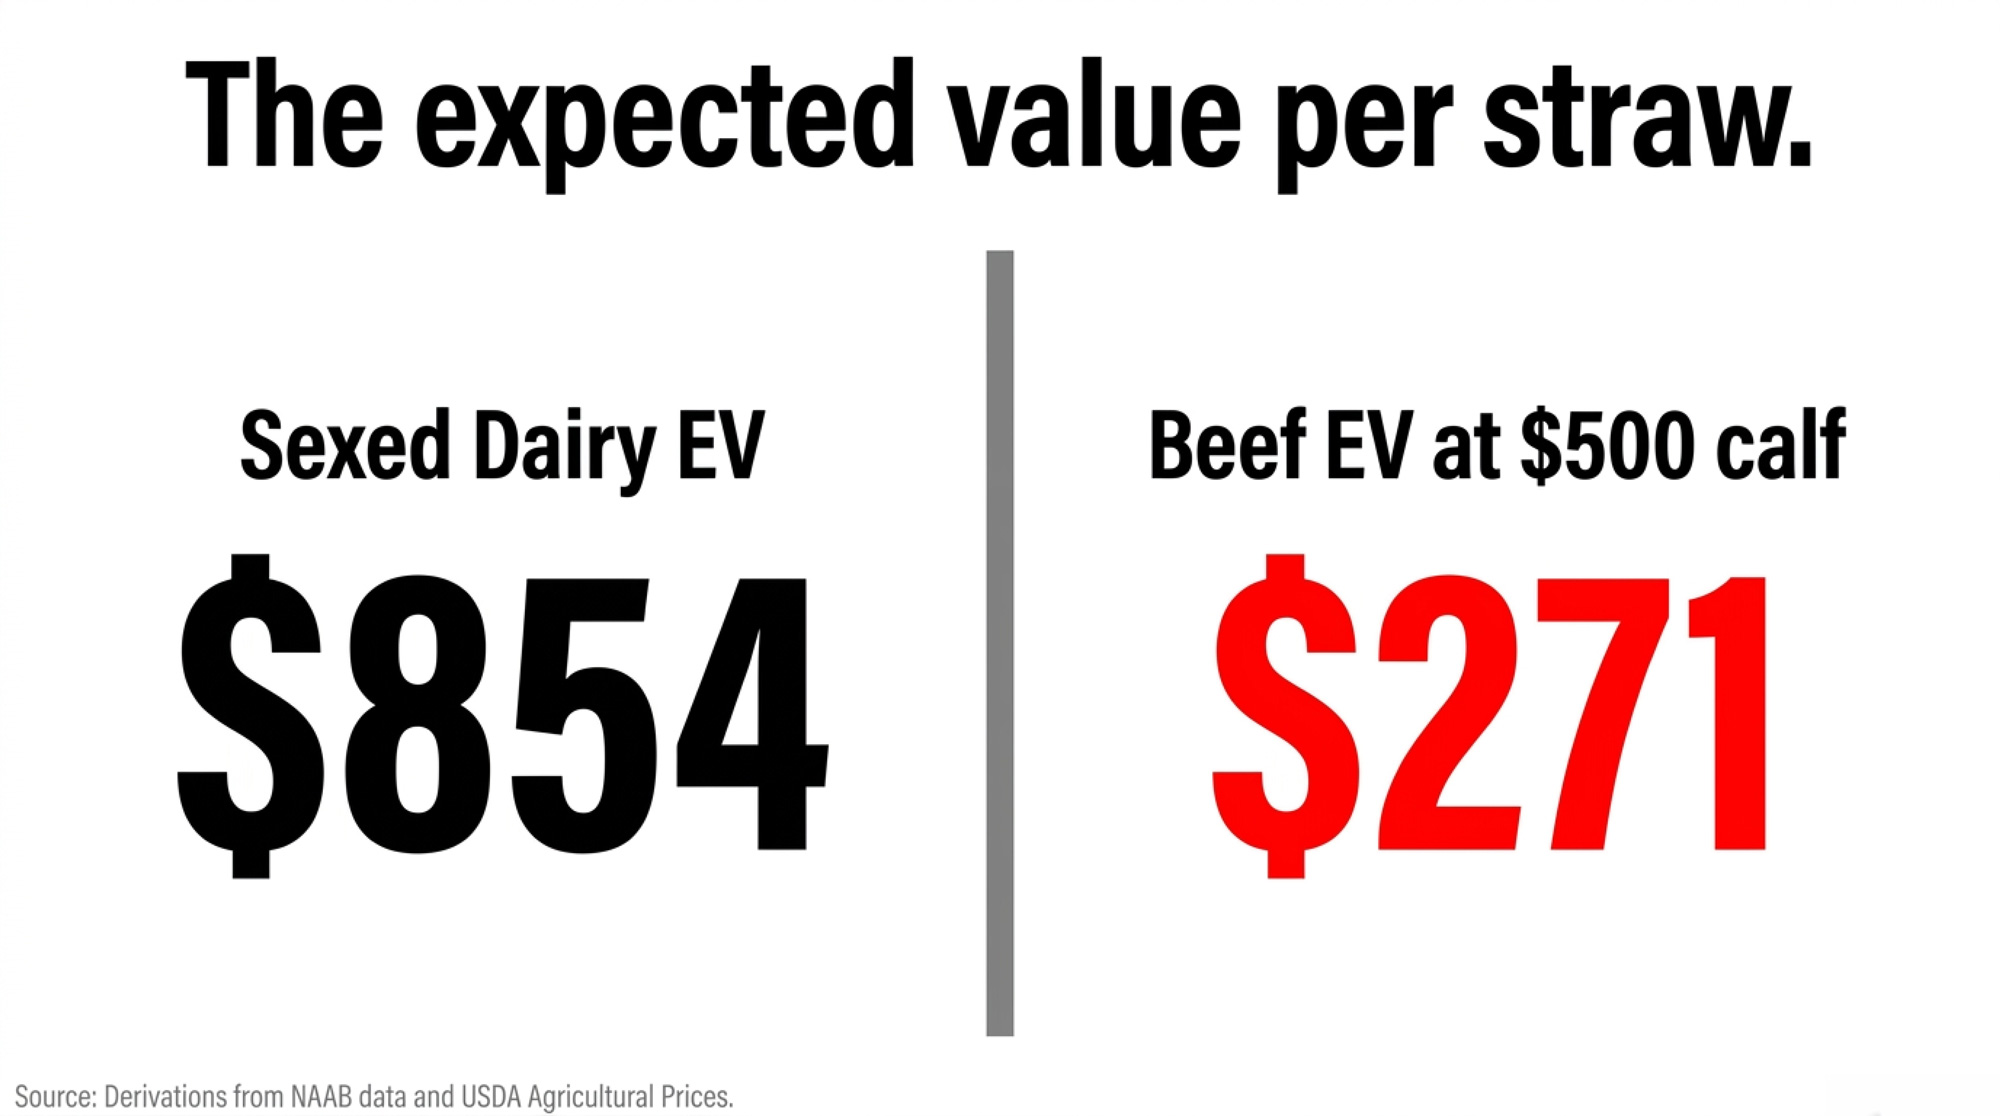
Here’s the expected value at the straw level, using the Tracker’s inputs.
- Sexed dairy EV per straw: $3,010 × 0.42 × 0.95 × 0.90 × 0.79 ≈ $854.
- Beef EV per straw at a $500 calf: $500 × 0.57 × 0.95 ≈ $271.
Three times the expected value for dairy. Every beef service on a cow that could carry a viable dairy pregnancy is roughly a 3 gap in expected replacement value — the hidden cost of rearing replacements few breeding sheets actually price in.
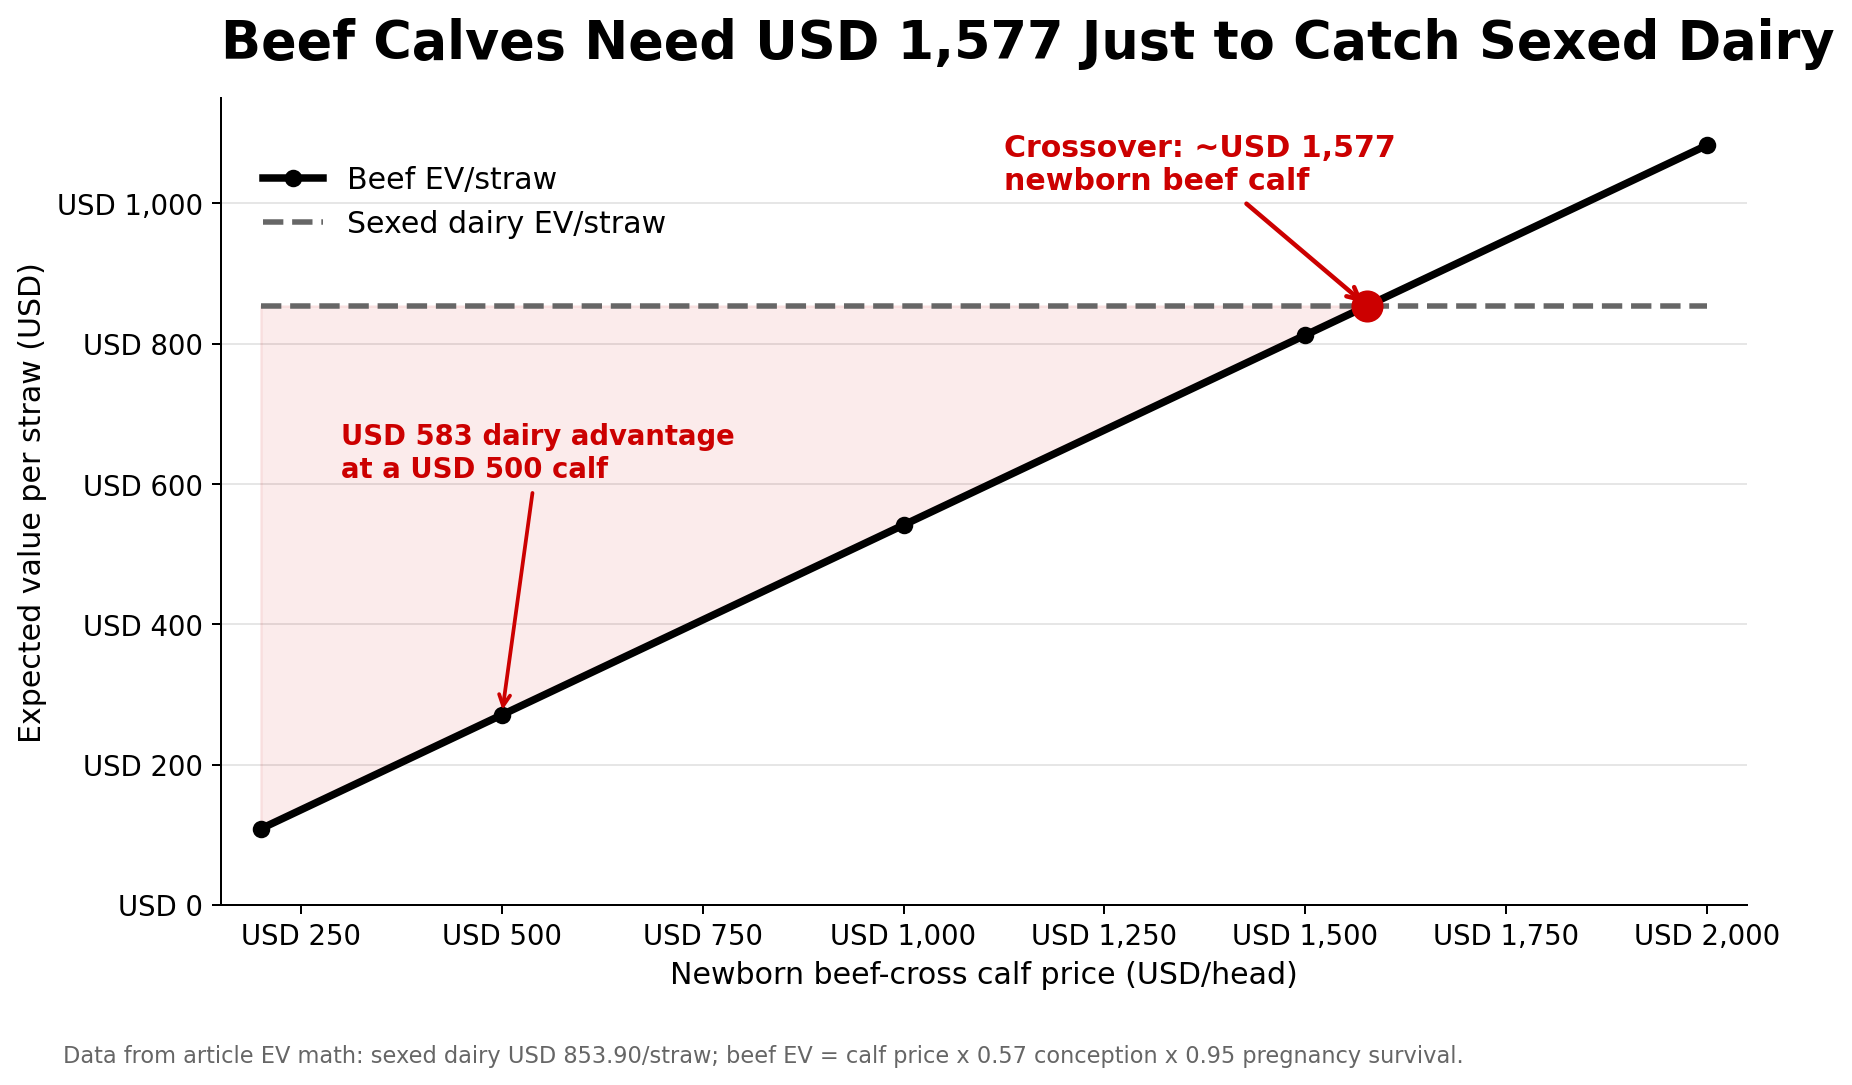
The scenario table shows the crossover plainly.
| Beef Calf Price | Beef EV/Straw | Sexed Dairy EV | Dairy Advantage | Verdict |
| $200 | $108 | $854 | $746 | Dairy dominates |
| $500 | $271 | $854 | $583 | Dairy wins |
| $1,000 | $542 | $854 | $312 | Dairy still ahead |
| $1,500 | $812 | $854 | $42 | Near breakeven |
| ~$1,577 | $854 | $854 | $0 | Crossover |
| $2,000 | $1,083 | $854 | -$229 | Beef wins |
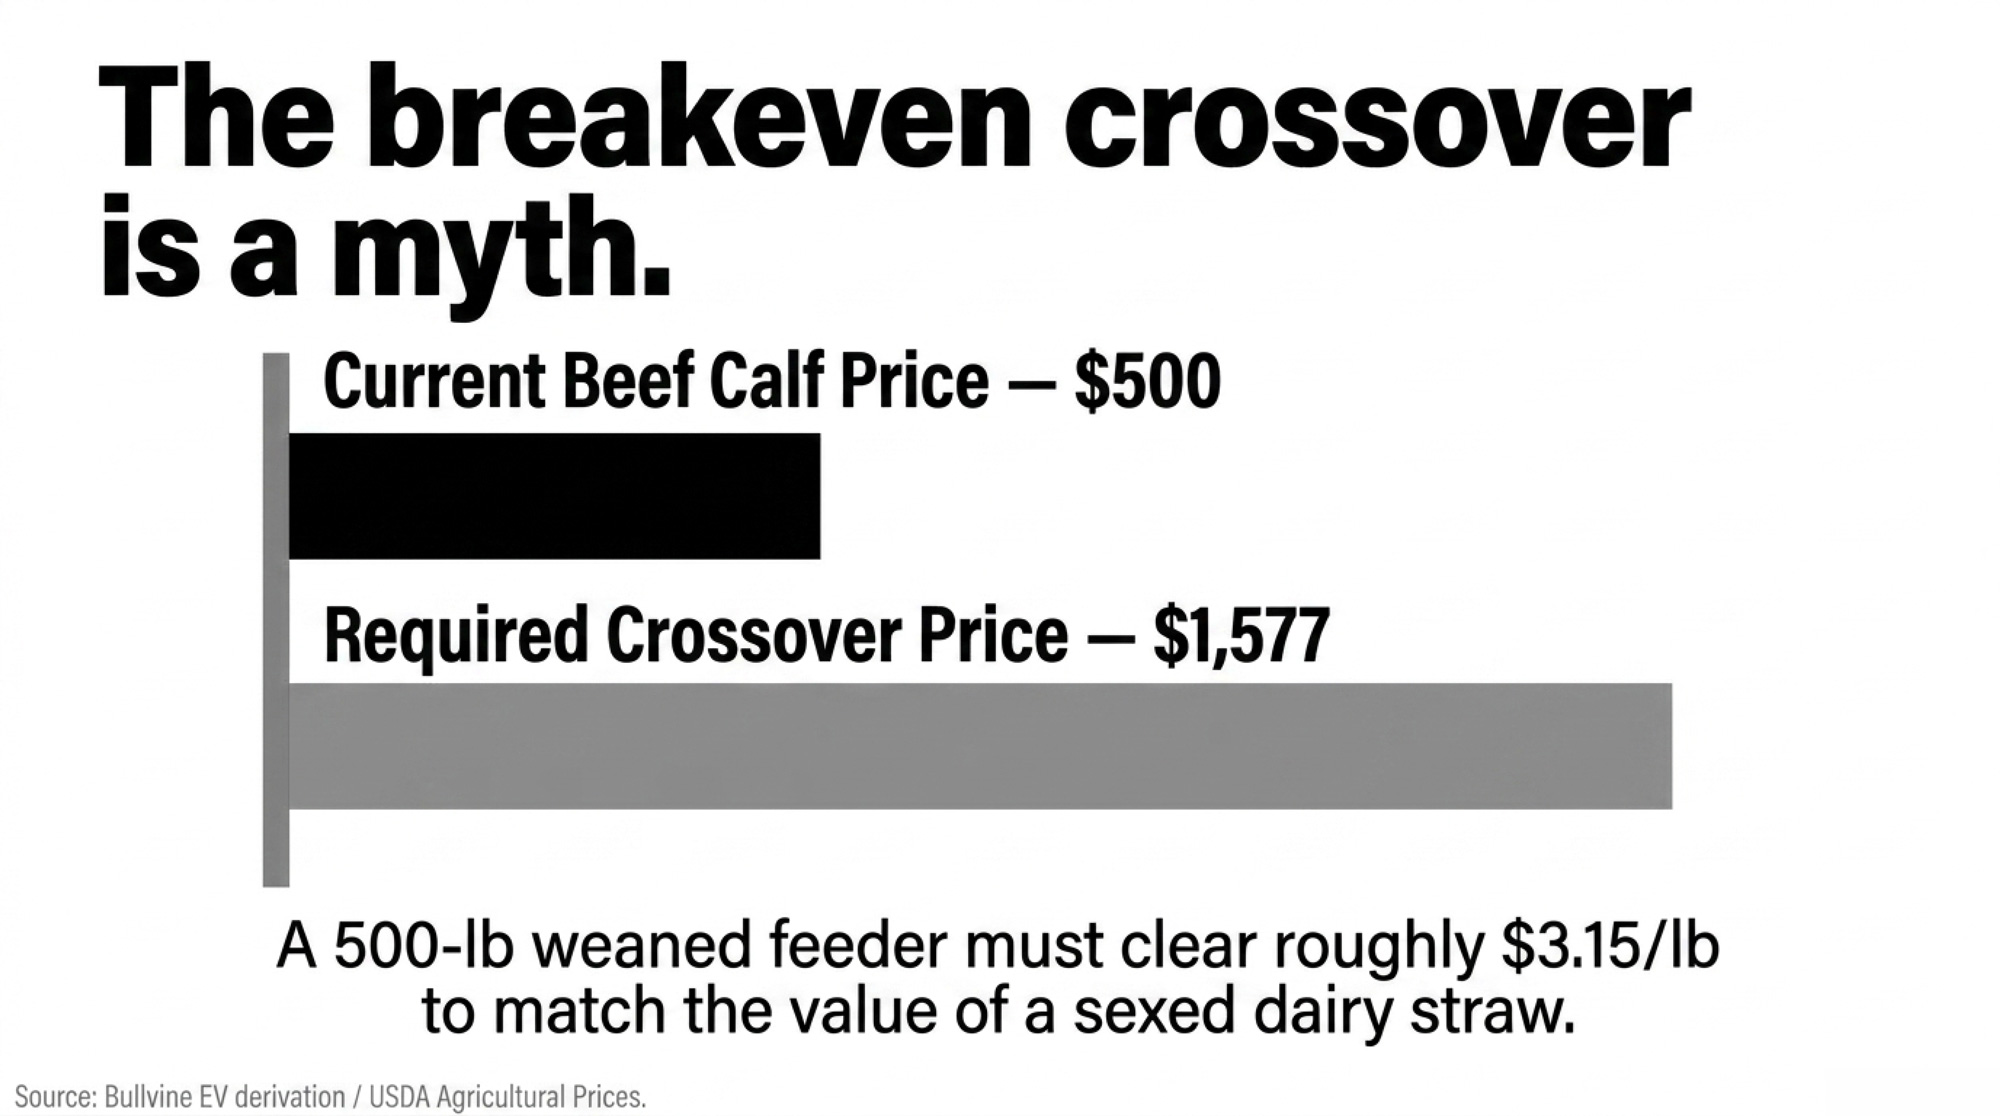
Beef calves have to clear roughly $1,577 per newborn to match sexed dairy at a $3,010 heifer. To put that in barn terms: a 500-lb weaned feeder would need to clear roughly $3.15/lb to land there — a number that assumes a high-demand year and ignores the feed and yardage cost of carrying the calf from newborn to that weight. Current beef-cross calf prices from dairy herds run $200 to $500-plus depending on genetics and region. Weaned feeders in program and video sales push higher, but at the breeding-decision level — the straw going in the gun — the math isn’t close.
Can One Panhandle Herd Really Be Leaving $117,000 on the Table?
Yes. And the arithmetic is boring.
Say that 500-cow Panhandle operation runs 35% beef-on-dairy across its total annual services — roughly 200 beef services a year on animals that could carry a dairy pregnancy, targeted at bottom-third cows. At the $583 per-service gap, the hidden math is:
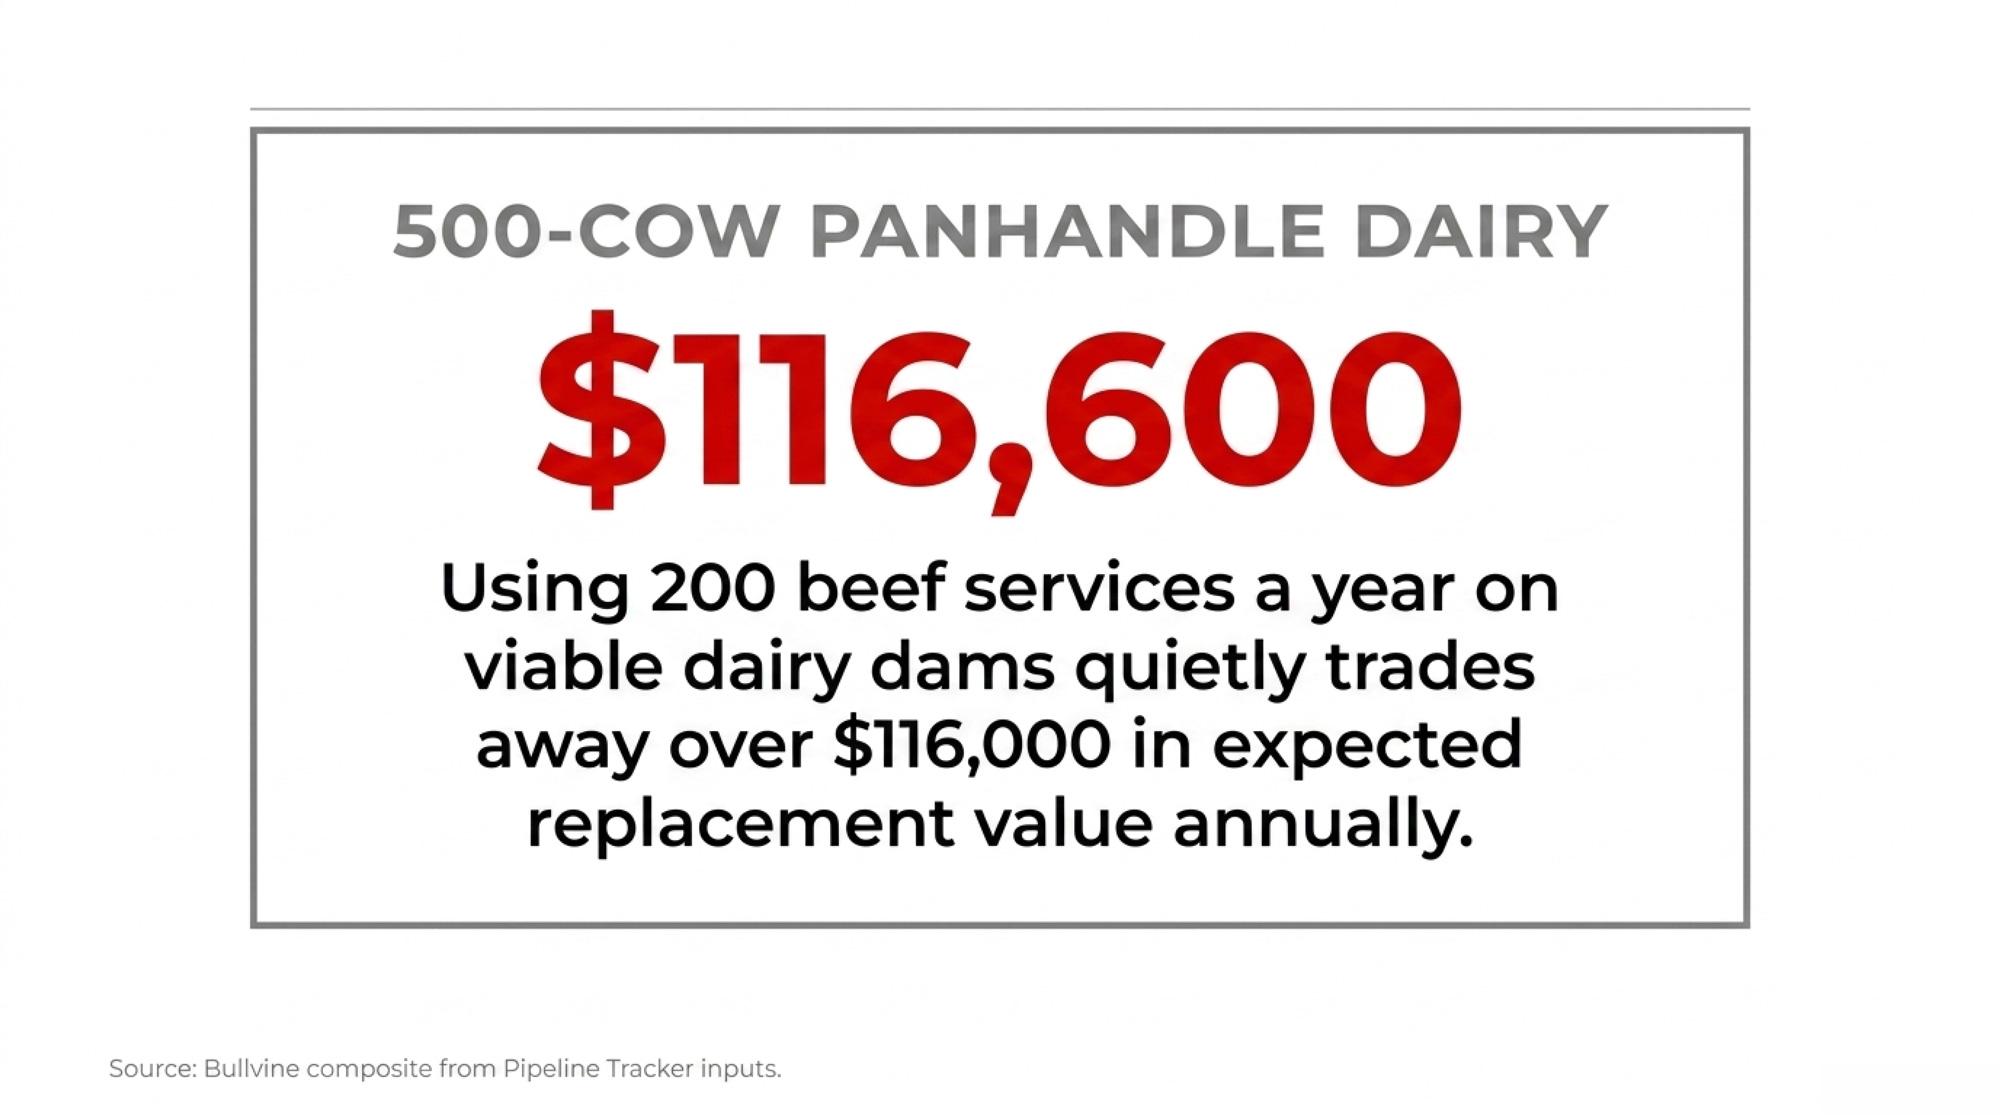
200 × $583 ≈ $116,600 in expected replacement value traded away, every year. Rounded to $117,000 in headline framing for scan value.
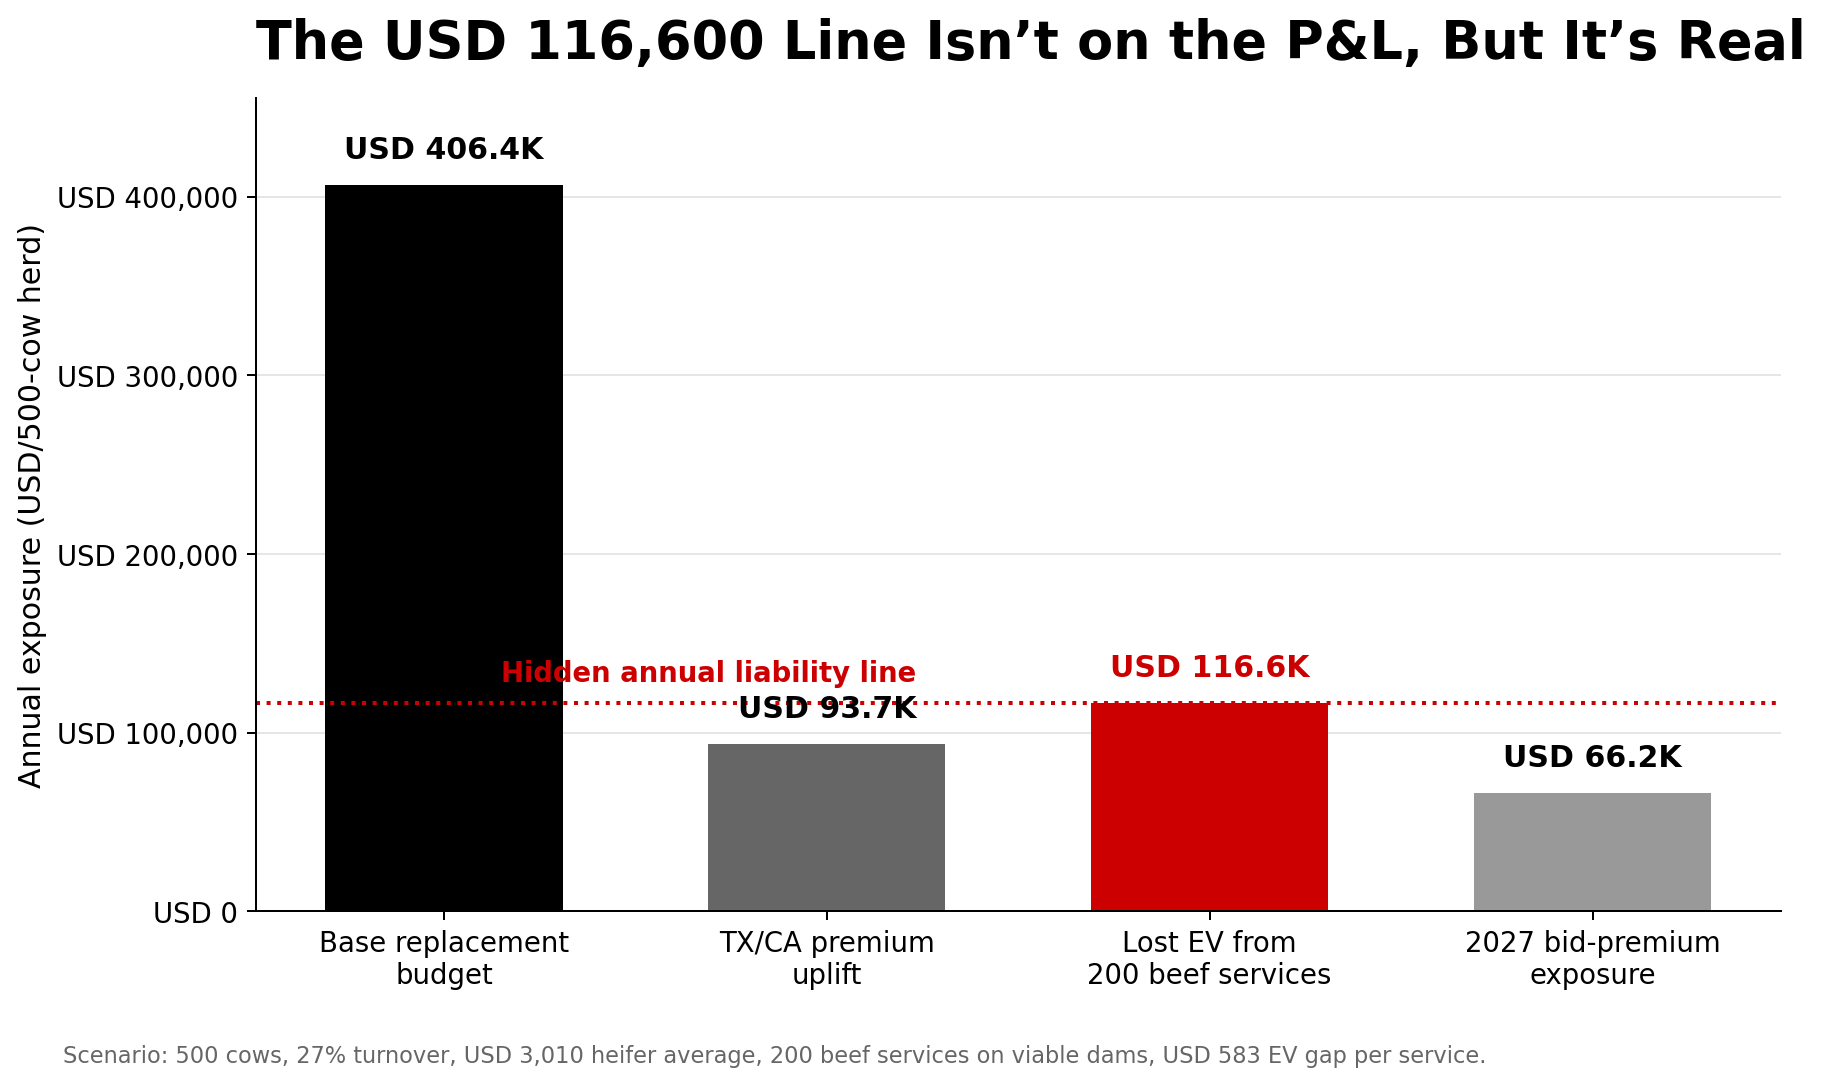
| Cost Driver | Annual $ Exposure | Category |
| Base replacement budget (27% × $3,010) | $406,350 | Base budget |
| TX/CA premium band uplift | ~$93,650 | Direct cost premium |
| Lost EV: 200 beef services × $583 | ~$116,600 | Hidden risk |
| 2027 bid-premium exposure, 135-heifer purchase at $3,500 vs. $3,010 ($490 premium) | ~$66,150 | Future risk (single-year) |
That $116,600 isn’t a P&L line. It’s future cow inventory the herd is choosing not to create — and then buying back at ,010-plus when the auction ring gets to it. Your exact number moves with your calf price and your local heifer cost. The direction doesn’t. That Panhandle breeding sheet is quietly writing checks the pipeline can’t cash in 2027.
Why Behavior Hasn’t Caught Up
Three reasons. None of them irrational. All of them expensive.
Cash flow timing: a beef calf brings a check in weeks, a heifer generates milk in about 24 months. Strategy inertia: programs built when dairy-beef cross calves pulled stronger prices in 2023–2024 haven’t been rewritten for today’s 0–0 market. The biological lag itself: any heifer you want calving in 2028 has to be conceived now, and that feels like forever when feed bills hit monthly.
None of that makes the choice crazy in the moment. It just explains why the pipeline keeps bleeding. The vets running dairy-repro programs across the Panhandle and Central Valley are saying the quiet part out loud at producer meetings this spring: the breeding sheets still look like 2023, and the cash-flow math that justified them doesn’t.
The Retention Overhang Masking the Gap
Cow retention has been quietly covering the pipeline hole. Iowa State Extension’s NW Iowa Dairy Outlook (May and December 2025) documented the pattern: from September 2023 through mid-May 2025, weekly dairy cow slaughter ran behind year-earlier levels in 86 of 88 weeks. January–April 2025 slaughter came in at roughly 889,900 head — the lowest start to a year since 2008.
The Bullvine estimate extends that documented deficit through late 2025 at roughly 600,000–611,600 extra cows retained versus normal culling pace — an extrapolation from ISU’s weekly data, not a USDA statistic. Those cows carry the milk volume today.
When Class III compressed to $14.59 in January 2026, $14.94 in February, and $16.16 in March (USDA Class and Component Prices), the math on keeping marginal animals turned fast.
| Month (2026) | Class III Price |
| January | $14.59/cwt |
| February | $14.94/cwt |
| March | $16.16/cwt |
Source: USDA Class and Component Prices, Jan–Mar 2026.
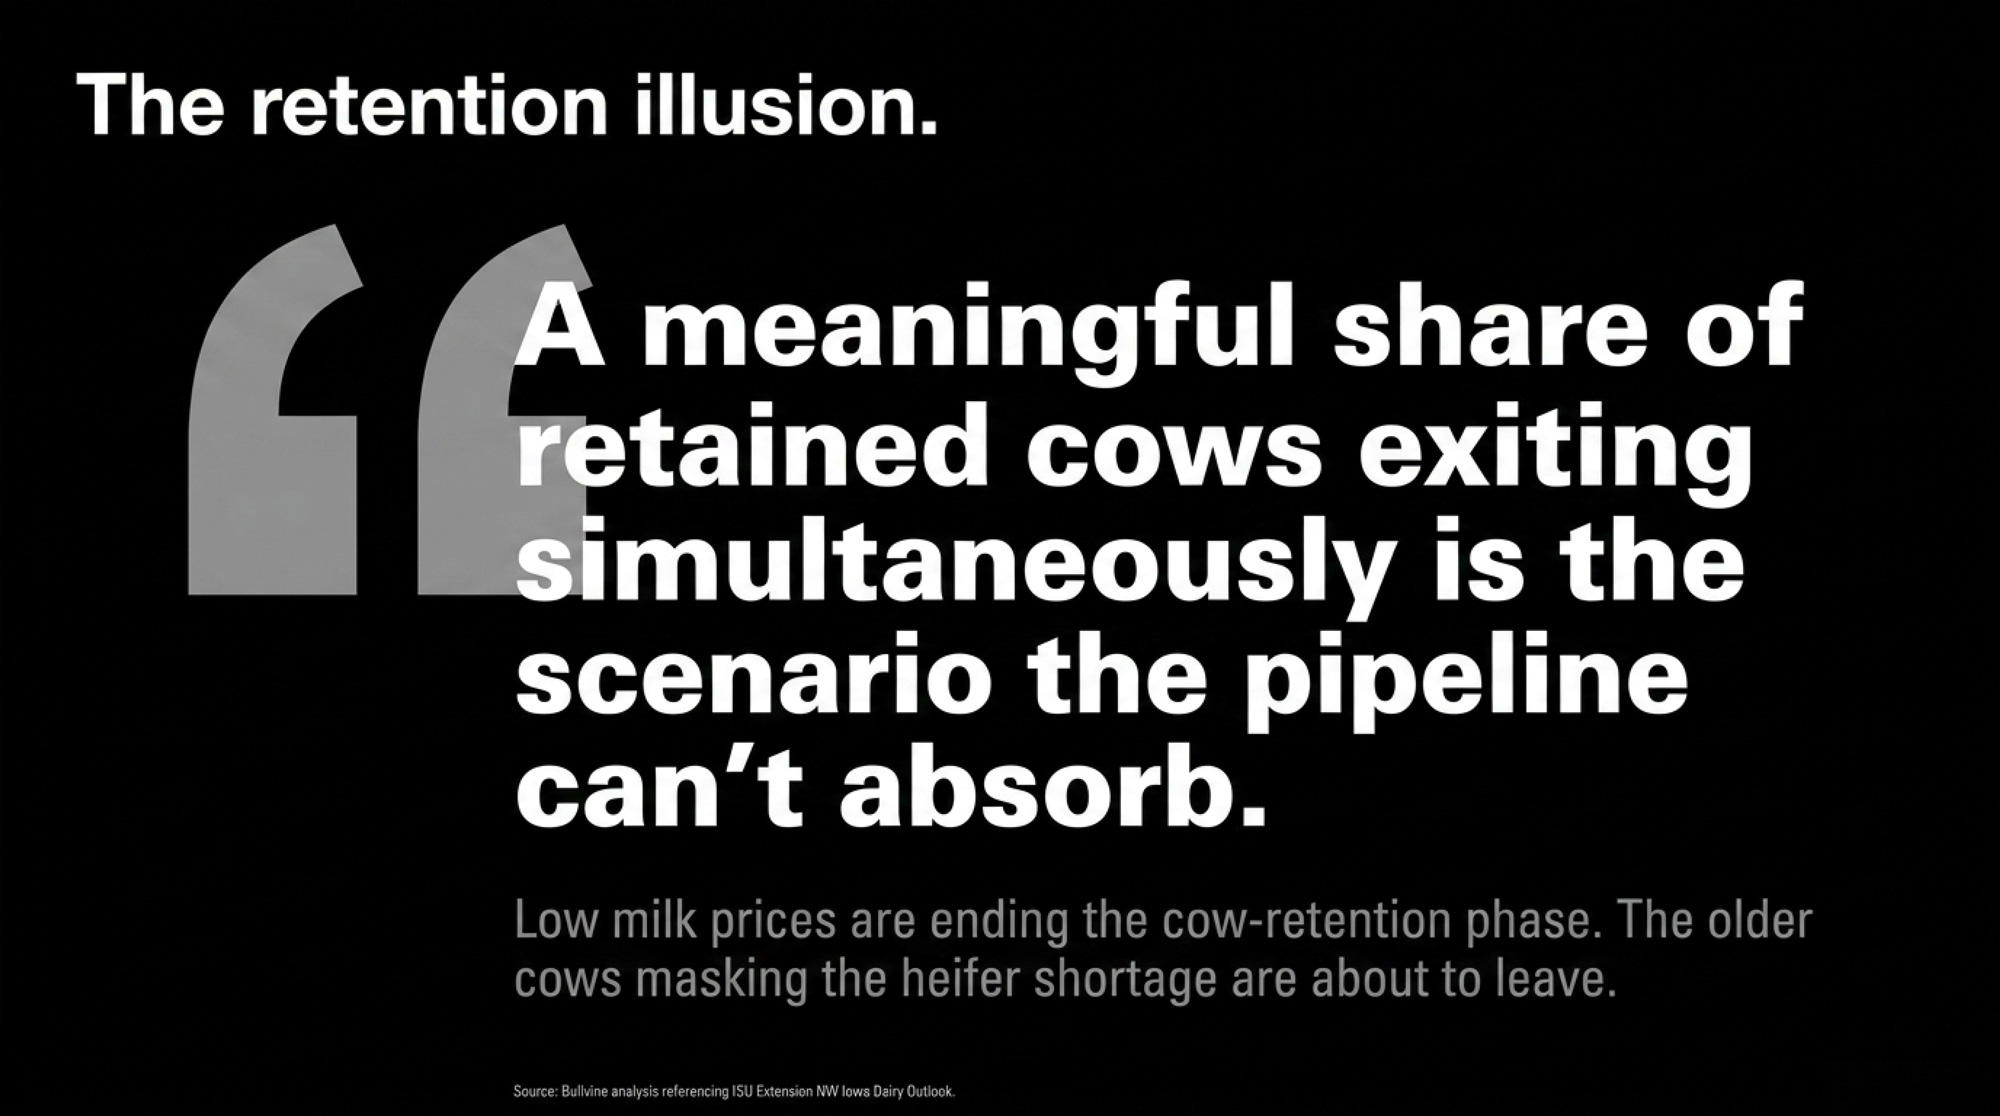
A meaningful share of those retained cows exiting simultaneously is the scenario the pipeline can’t absorb. The cows being held to supply $11 billion in new processing capacity are, by definition, the least productive animals in the herd.
Branch 1: Buying Your Way Out Is a Covenant Breach Risk
For many 500-cow herds sitting on the edge of their credit lines after Q1 2026 Class III in the $14s, buying your way through a pipeline shortfall isn’t just “expensive.” It’s a working-capital covenant question.
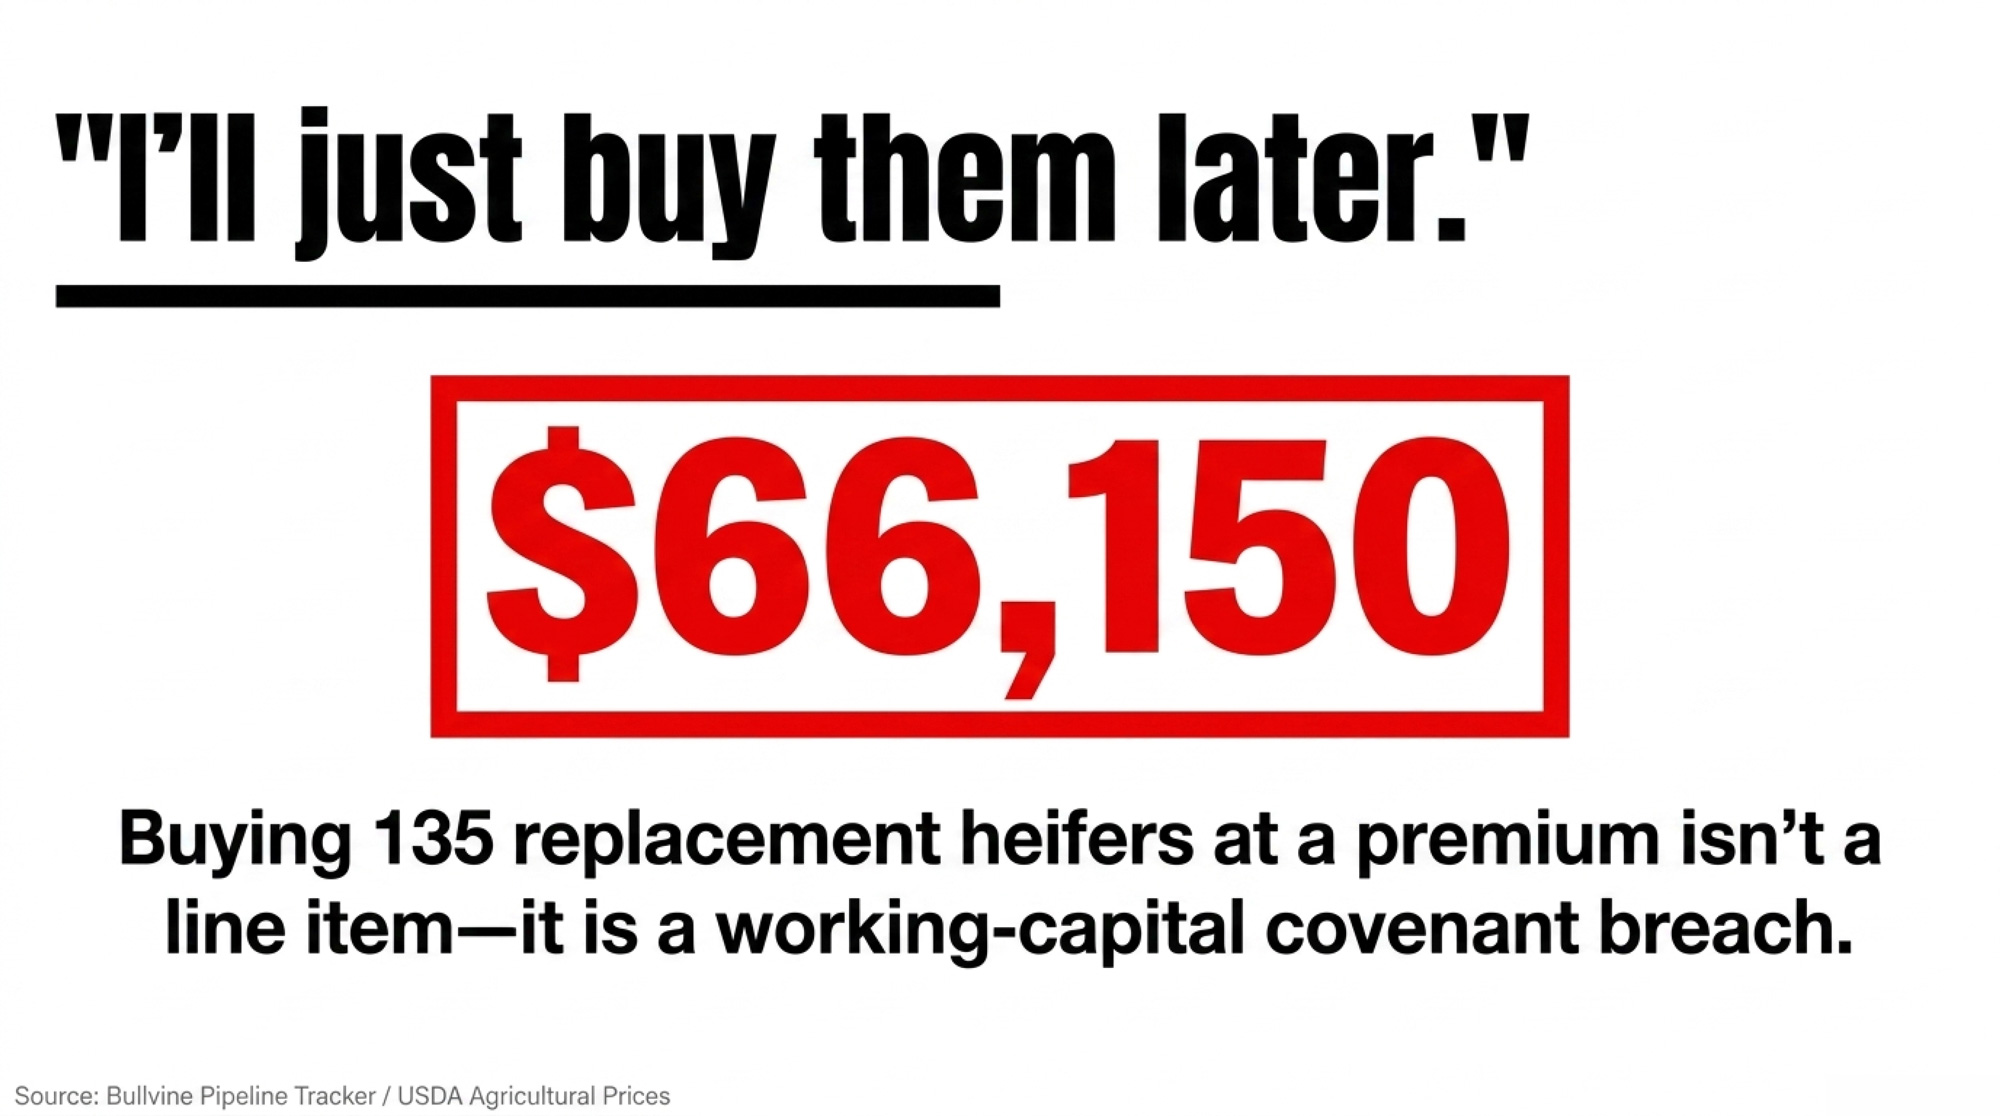
Run the arithmetic at the kitchen table. A 40–60 head single-year purchase at a $490 premium ($3,500 vs. $3,010) adds $19,600 to $29,400 of unplanned capital outlay. A full 135-heifer purchase year at the same premium is $66,150. Neither is catastrophic on its own, but neither is free working capital either — and both land on top of depressed Q1 revenue, feed carry, and whatever springer timing the auction ring actually gives you.
Before your next lender review, know two numbers cold: your current working-capital-to-revenue ratio and the specific covenant thresholds in your operating note. If a $66,000-plus unplanned heifer draw trips a covenant or forces a term-out, “I’ll buy later” stops being a strategy and starts being a restructuring conversation.
The Pipeline Index: 43.5, and 4.5 Points From Red
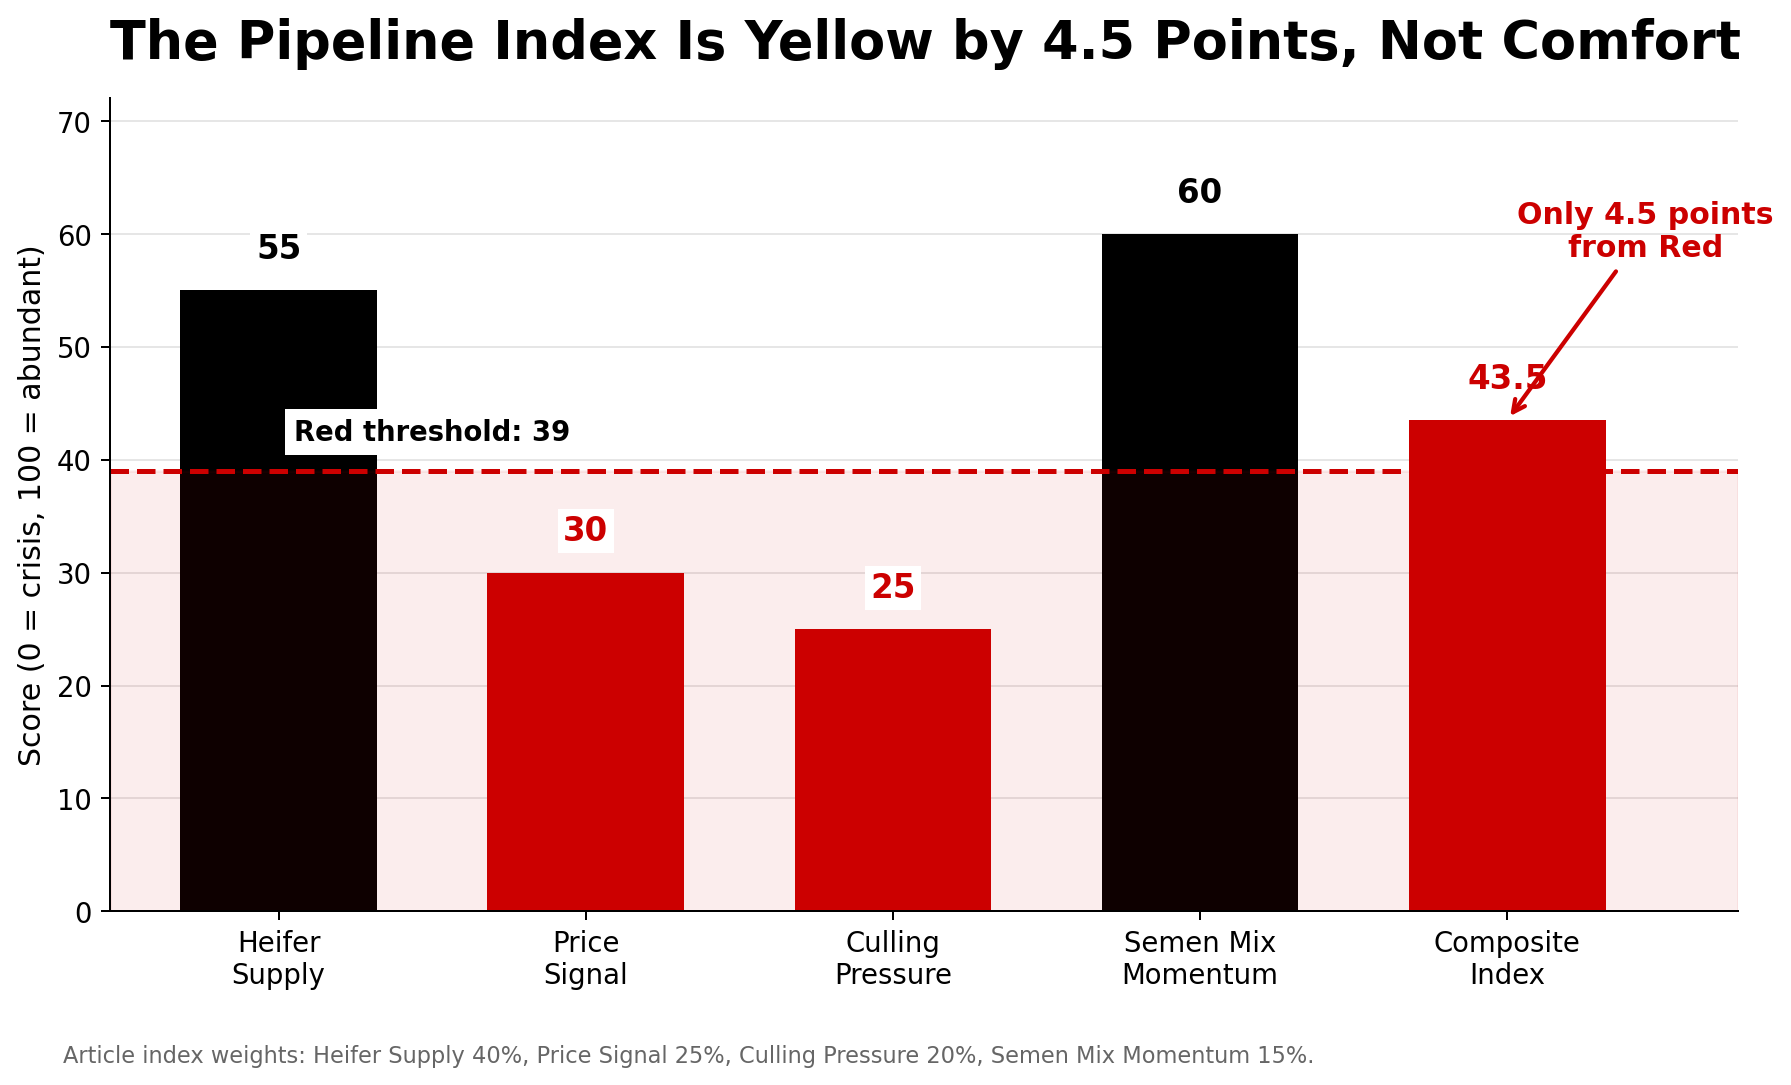
The Bullvine Pipeline Index runs 0 (crisis) to 100 (abundant) across four weighted components.
| Component (weight) | What it measures | Current score | Status |
| Heifer Supply (40%) | Replacement ratio — ~27 per 100 cows | 55 | Marginal |
| Price Signal (25%) | Inverse of heifer price — $3,010/head | 30 | Red-zone range |
| Culling Pressure (20%) | Deviation from normal culling pace | 25 | Red-zone range |
| Semen Mix Momentum (15%) | Sexed dairy share — 64% and rising | 60 | Adequate |
| Composite | 43.5 | Yellow Zone |
Red threshold: 39. Yellow: 40–69. The Index is riding on one component — semen mix momentum — and that’s a behavior change that takes 24 months to become a milking cow.
If slaughter normalizes and the Culling Pressure Score climbs from 25 to 15 (a −10 × 0.20 weight hit), the Index slides to 41.5. Layer in sexed-semen adoption stalling — Semen Mix Momentum dropping from 60 to the high-30s as cash-strapped herds revert to cheaper conventional — and the composite lands near 38. Red Zone. No catastrophe needed. Just normal economics catching up.
The back-trend tells the same story. Mid-2024 the Index sat at 49.4. It bottomed at 40.0 in mid-2025 — exactly on the Yellow/Red boundary — and has recovered 3.5 points since. That’s not a rebound. That’s a bounce off the floor, and the entire recovery is riding on sexed-semen adoption that won’t show up in the milking string until 2027.
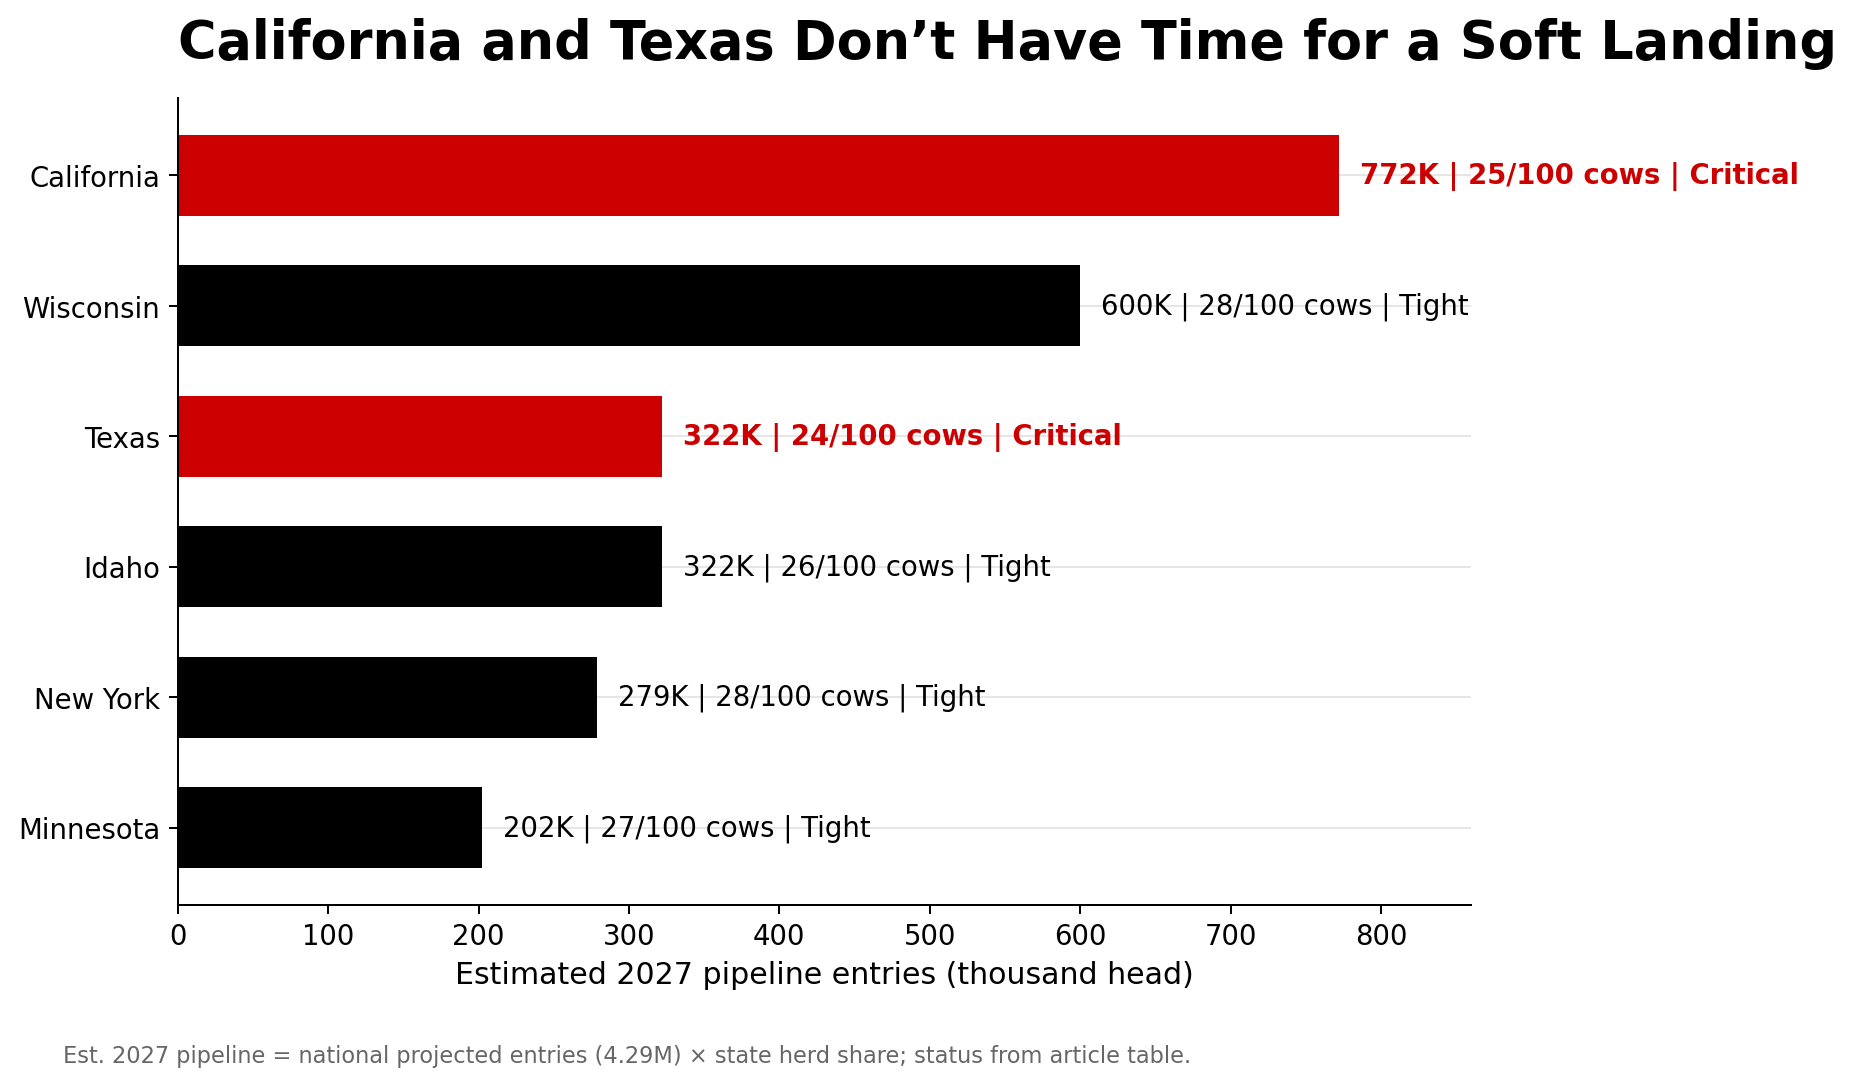
Where the Shortage Bites First
| State | Share of herd | Est. 2027 pipeline* | Replacement ratio | Heifer price range | Status |
| California | ~18% | ~772,000 | ~25 per 100 | $4,000–$4,500+ | Critical |
| Wisconsin | ~14% | ~600,000 | ~28 per 100 | $2,800–$3,750 | Tight |
| Texas | ~7.5% | ~322,000 | ~24 per 100 | $3,200–$4,000 | Critical |
| Idaho | ~7.5% | ~322,000 | ~26 per 100 | $3,100–$3,900 | Tight |
| New York | ~6.5% | ~279,000 | ~28 per 100 | $3,000–$3,600 | Tight |
| Minnesota | ~4.7% | ~202,000 | ~27 per 100 | $2,800–$3,850 | Tight |
*Est. 2027 pipeline reflects each state’s projected share of national milking-herd entries (4.29M × state herd share), not in-state replacement-heifer inventory. State herd shares derived from USDA NASS Milk Cows: State (2025).
California sits at a 25-per-100 ratio, with HPAI reproductive fallout layered on top — more than 750 affected dairies and field reports of roughly 7% conception drops in the August 2024–March 2025 window. Premium Central Valley springers routinely clear $4,500. Texas added close to 40,000 cows in 2025, and the bulk of the state’s milking herd sits on a small fraction of its dairies concentrated in the Panhandle — so when one 4,000-cow dairy needs ~1,200 heifers to cover normal turnover, the regional market feels it fast. Traditional overflow from the Upper Midwest shrinks as small operations exit, and the broader replacement-price squeeze rolls downhill.
A pattern showing up across the herds feeding the Tracker: beef straws drifting onto cows that aren’t truly terminal — second-lactation animals with one bad quarter, heifers that got one rough breeding. Those are the animals that carry next year’s best daughters, and they’re getting bred to terminal sires because the protocol never got rewritten.
What This Means for Your Operation
In the next 30 days:
- Run your pipeline math. Pull 12 months of heifer-calf births, multiply by 0.79, and compare to herd size × replacement rate. Any gap is baked into 2027–2028, regardless of what prices do.
- Audit beef-on-dairy with your own numbers. EV_beef = your calf price × 0.57 × 0.95. EV_dairy = your local heifer cost × 0.42 × 0.95 × 0.90 × 0.79. If the dairy advantage looks anything like $583, decide how many beef services stay on viable dairy dams.
- Pull your operating-note covenant language. Know the working-capital ratio that triggers a review, and model what a $66,000-plus unplanned heifer draw does to it.
- Call your heifer suppliers this week. Ask how far they’re booked and whether they’ll lock numbers 12–18 months out. If “I’ll buy later” is the plan, find out whether the supply actually supports that.
In the next 90 days:
- Tier your herd and put it into SOPs with a concrete genomic game plan. Top genetics to sexed dairy. Middle tier mixed. True terminal cows only get beef. Don’t let beef creep back onto viable dams because the straw is cheaper that day.
- Cull on profit, not habit. Keep productive older cows if SCC and repro allow; ship chronic mastitis, repeat breeders, and low-index animals. A retained cow buys time, not margin.
Over the next 365 days:
- Align your herd plan to your plant. If new processing steel is landing within your hauling radius, decide whether you’re growing, holding, or shrinking. Your pipeline, beef percentage, and culling strategy have to match that call.
- Set hard floors and ceilings. Floor: the minimum beef-calf price where beef services still make cash-flow sense. Ceiling: the maximum share of breedings to beef on viable dairy dams. The ~$1,577 crossover is your north star.
Key Takeaways
- If your 12-month heifer-calf count × 0.79 doesn’t cover herd size × replacement rate, you’re already short on future cows — and that shortfall is locked into 2027–2028, regardless of how market prices move.
- Every beef service on a viable dairy dam trades away roughly $583 in expected replacement value at a $3,010 heifer and a $500 calf. Crossover is ~$1,577 per newborn beef calf — roughly $3.15/lb on a 500-lb feeder in a high-demand year, before feed carry. Most markets aren’t close.
- The Pipeline Index sits at 43.5 — Yellow Zone, 4.5 points from Red. Semen mix momentum is the only component holding the score up, and it takes 24 months to turn a straw into a milking cow. One rough culling quarter pushes the national pipeline into critical territory.
- A $66,000-plus unplanned heifer draw is a working-capital covenant question, not a line item. The $116,600 on one 500-cow Panhandle breeding sheet is the local shape of a national number. Scale it to your herd, your calf price, and your heifer cost, and the call is yours — but it’s getting made right now, whether or not it’s written down.
Before your next lender review or processor supply meeting, print the EV table and your own pipeline math side by side. One question decides the rest: does your current breeding program produce the cows your operation will need in 2028, or are you planning to compete for someone else’s heifers at $3,500-plus — and does your operating note have room for that check?
The breeding decisions locking in that answer are being made this week. Biology won’t wait for the market to make them comfortable.
Pipeline and economic data: NAAB 2025 Year-End Report (March 2026), USDA Cattle Inventory (January 2026 release), USDA Agricultural Prices (July 2025), USDA Class and Component Prices (January–March 2026), CoBank Knowledge Exchange (August 2025) as a secondary reference, and ISU Extension NW Iowa Dairy Outlook (May and December 2025). State herd shares derived from USDA NASS Milk Cows: State (2025). Biological conversion rates reference Dr. Michael Overton’s Zoetis field dataset of 85 commercial Holstein herds. The 600,000–611,600 retained-cow estimate is The Bullvine’s extrapolation from ISU’s documented weekly deficit data, not a USDA statistic. EV figures rounded from precise derivation: $853.90 sexed and $270.75 beef at a $500 calf. The ~$3.15/lb feeder-equivalent is derived from dividing the $1,577 crossover by a 500-lb weaned weight, not from a published market series; it is illustrative only. State-level HPAI and Texas herd-concentration figures reflect Bullvine reporting aggregated from USDA APHIS and state extension sources. National averages may not reflect your specific region, herd size, or management system. All figures USD.
Learn More
- The Missing Piece in Genomic Selection: Why the Best Herds Still Walk the Pens — Arms you with a genomic sorting blueprint to stop the high-cost habit of raising every heifer. Reveals how setting hard profit-index cutoffs protects your balance sheet from expensive, low-merit replacements before third-lactation profit.
- 9.57 Million Cows, 3.9 Million Replacements: Genetics Built This Dairy Herd Paradox – and 2027 Ends It — Exposes the structural paradox of the largest U.S. herd since 1993 facing a 50-year replacement low. Explains how the $8,000 longevity dividend becomes the primary survival tool for herds outlasting the 2027 market break.
- $3,010 Per Heifer. 800,000 Short. Your Beef-on-Dairy Bill Is Due. — Dismantles the beef-on-dairy “cash-flow hero” myth by exposing the $1,870 per-head replacement cost increase. Delivers four concrete strategic paths, including leveraging documented pipeline sustainability to secure favorable long-term processor contracts in tight markets.
 The Sunday Read Dairy Professionals Don’t Skip.
 The Sunday Read Dairy Professionals Don’t Skip.
Every week, thousands of producers, breeders, and industry insiders open Bullvine Weekly for genetics insights, market shifts, and profit strategies they won’t find anywhere else. One email. Five minutes. Smarter decisions all week.
