










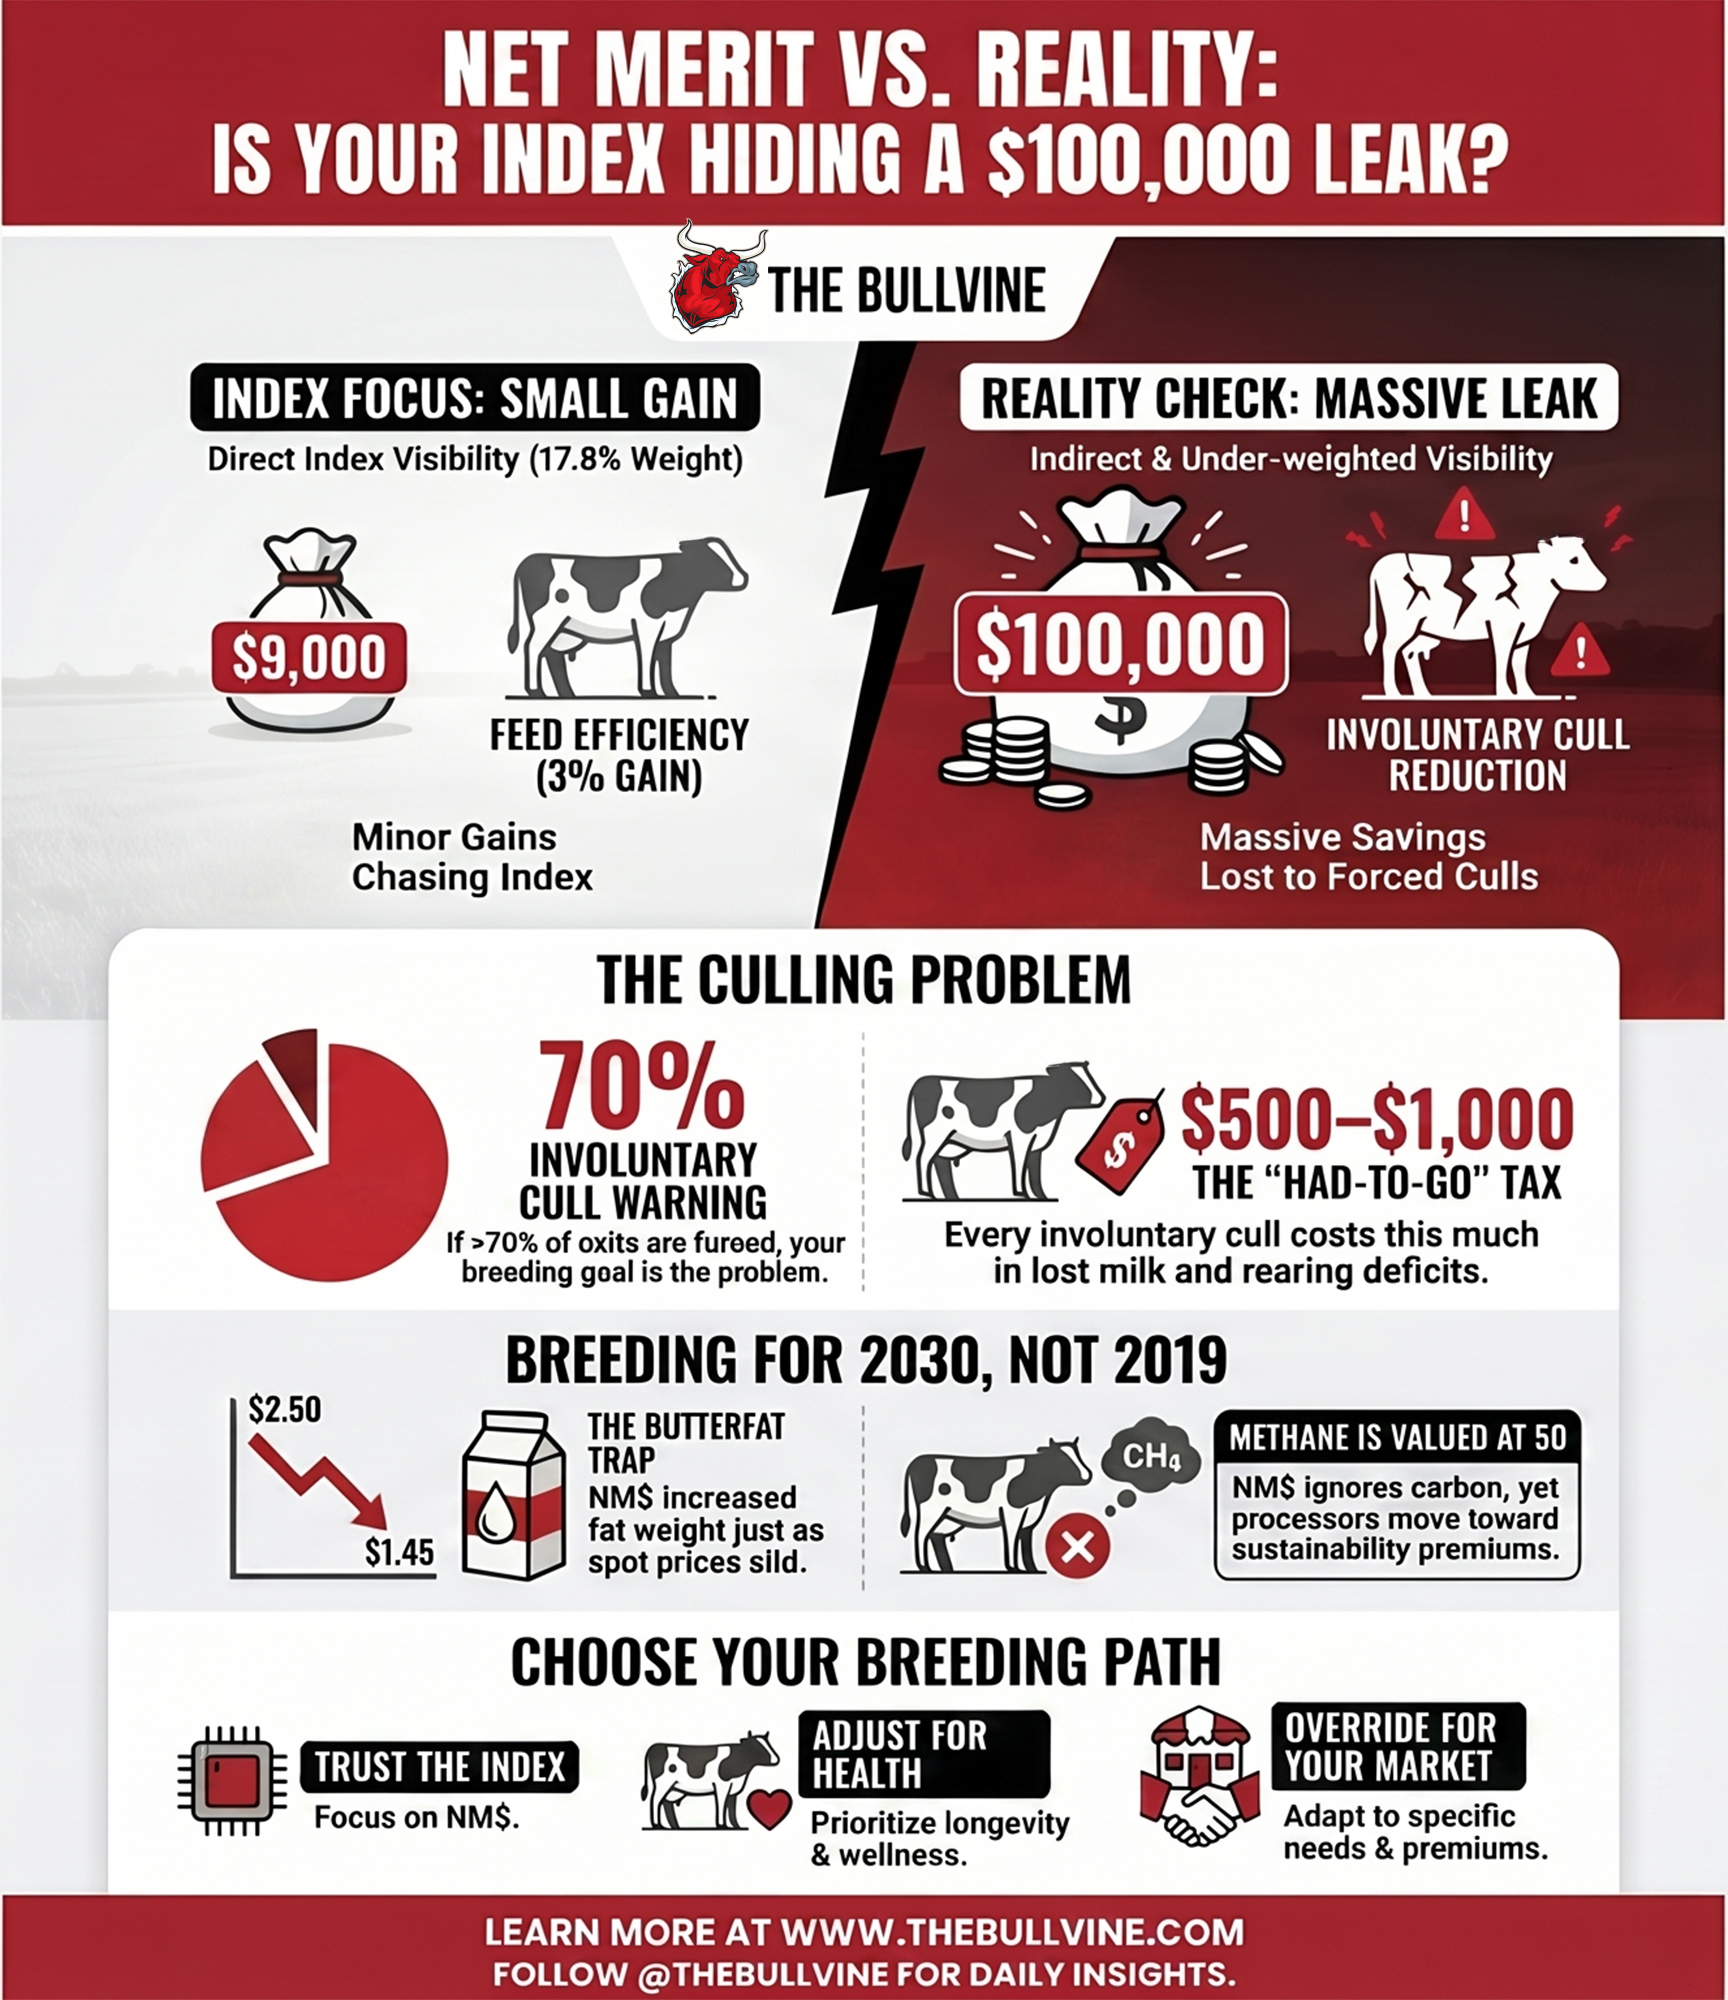
One barn chases $9,000 a year in feed efficiency the index rewards — and loses up to $100,000 out the cull gate it barely scores. Net Merit sees one number. Guess which.
Executive Summary: When CDCB updated Net Merit in April 2025, it effectively priced butterfat near $2.90/lb and methane at $0, pushed the fat weight to 31.8% while cutting protein to 13.0%, and bumped Feed Saved to 17.8% — but the formula re-ranked almost nothing, correlating 0.992 with the old weights for young Holstein bulls. That stability is the trap: it leans on a high-butterfat window that the market already gutted, with CME spot butter sliding from about $2.50/lb in early 2025 to roughly $1.45 by December. For a 1,200-cow, high-output Holstein herd, the bigger blind spot isn’t components — it’s culling. Chasing a genuine 3% feed-efficiency gain is worth maybe $9,000 a year, while 70–100 fewer forced culls is worth $35,000–$100,000 using de Vries-style $500–$1,000/cow modeling, and NM$ only touches that leak indirectly through PL, LIV, DPR, and SCS. Meanwhile, methane sits at $0 even as DFA, Saputo, and FrieslandCampina (already paying €2.63/100kg in sustainability premiums) move toward carbon-graded milk, and the heifers you breed today on a $0 methane value won’t hit the string until 2028–2029. The piece lays out three honest roads — trust the index, adjust it around your own cull and fertility data, or override it with Cheese Merit, EBI, or custom weights — plus a 30-day move: pull your last 12 months of culls, and if more than 70% are involuntary, your breeding goal, not just your transition pen, is the problem.
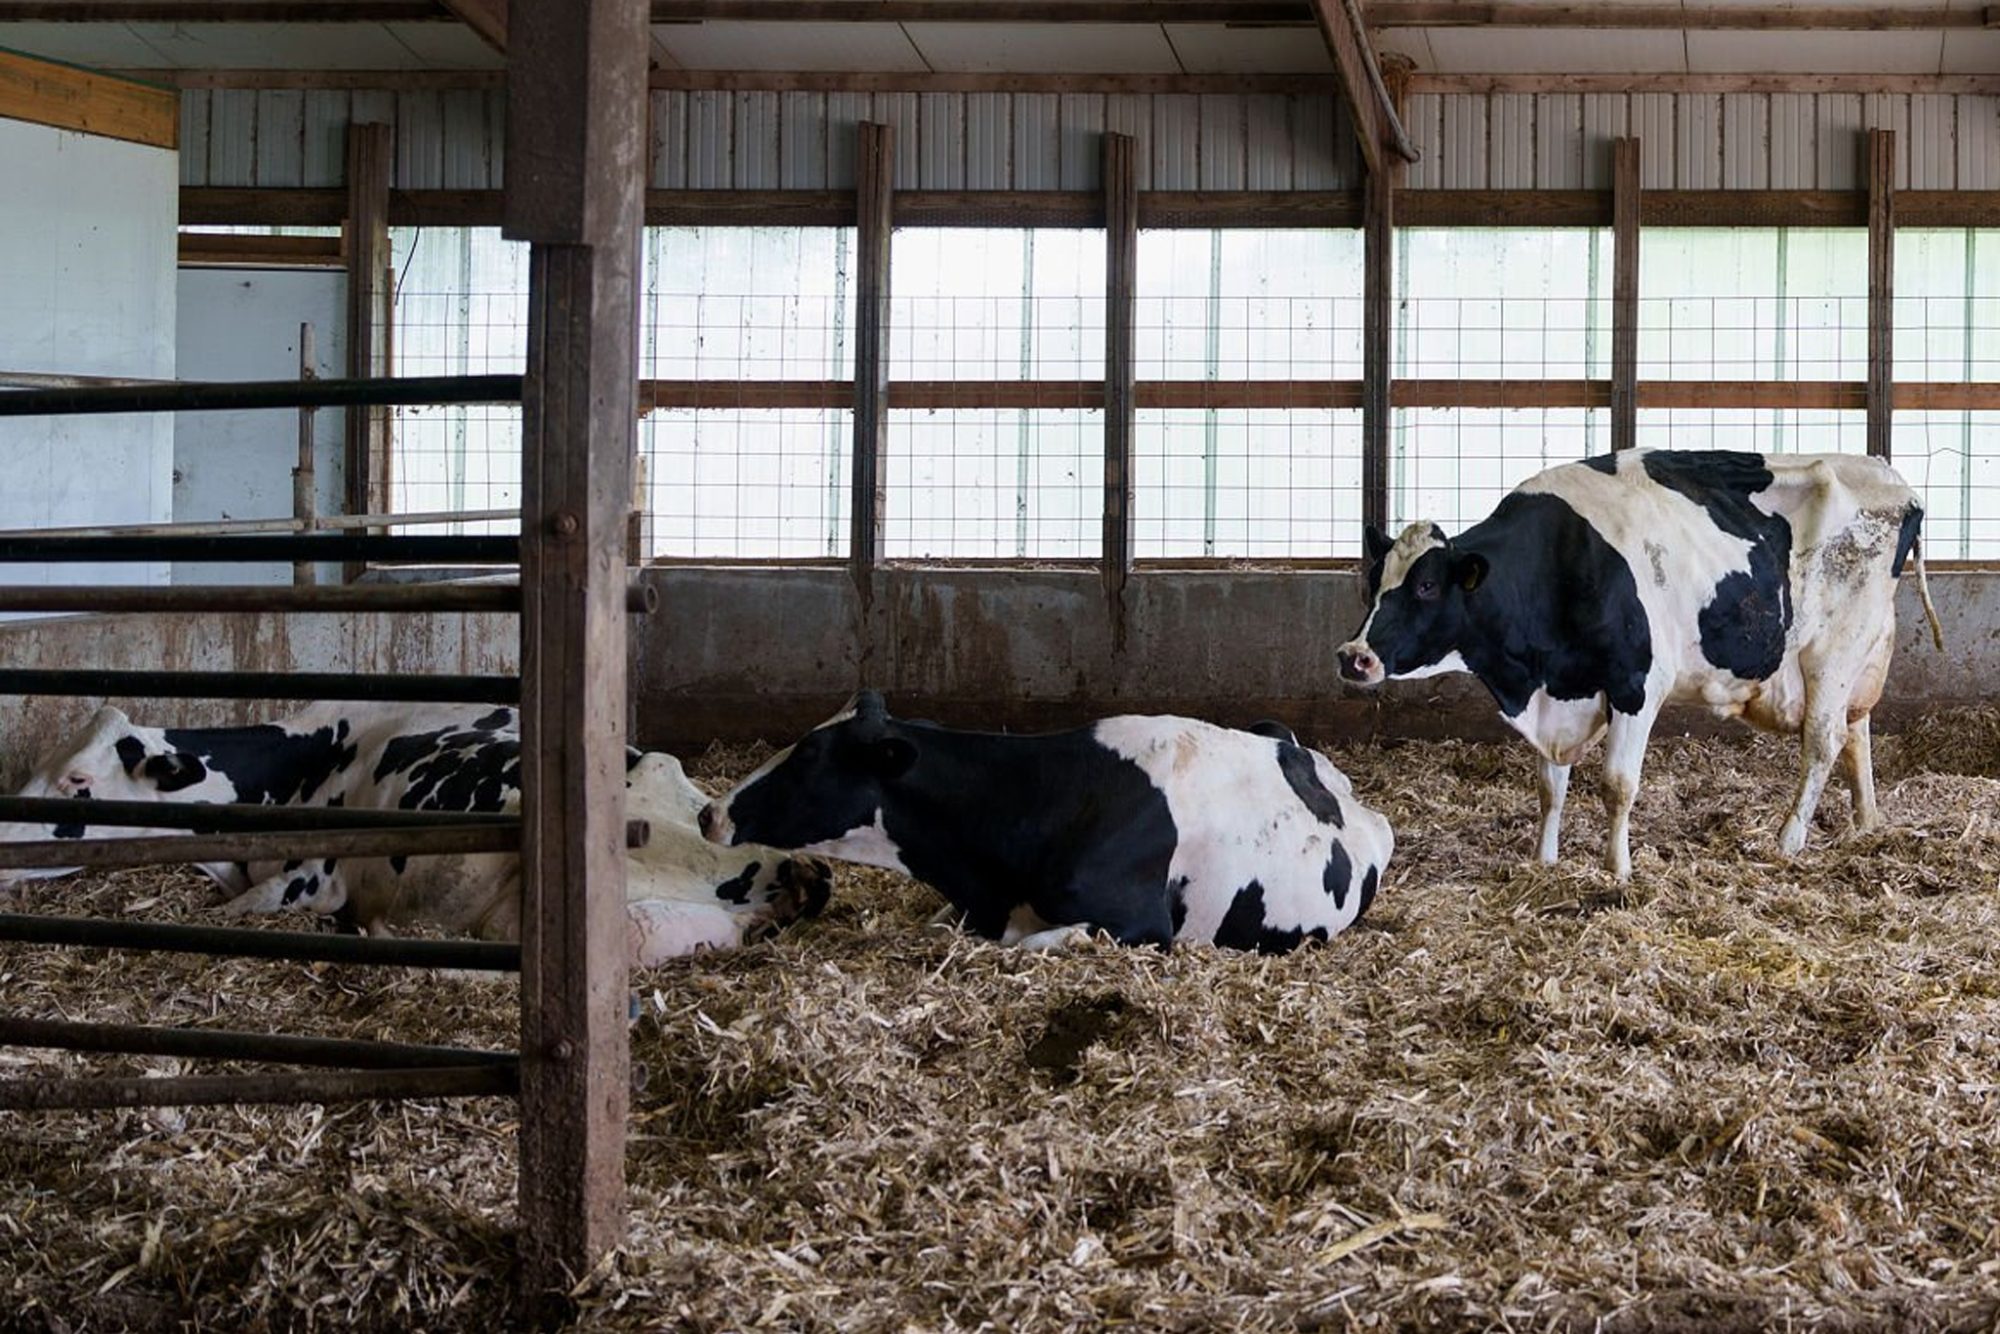
Editor’s Note: The 1,200-cow western New York Holstein operation in this story is a composite scenario modeled on multiple high-output herds that The Bullvine has reviewed since the April 2025 Net Merit update. The barn math, cull patterns, and adviser conversations are illustrative — drawn from realistic ranges in herd records and published research, not a single farm. All program names, trait weights, researcher names, and economic figures are real and sourced.
Picture the kitchen-table breeding meeting at a 1,200-cow Holstein operation in western New York, late March. Two open laptops. A pot of coffee gone cold an hour ago. A stack of breeding sheets that keeps growing as the herdsman pulls more sire proofs off the printer. This farm is a composite — but the numbers on those sheets are real. For more than a decade, the rule here has been simple: sort by Net Merit, take the top 10 bulls, don’t overthink it.
The vet truck is now a regular fixture at the fresh pen. The hoof trimmer spends most of his day in the high groups. And the cull report shows a rate in the high-30s to low-40s, with most exits starting as a health or fertility problem in the first 60 days.
Sooner or later, somebody at the table asks the question that matters on any operation like this: what is this index actually breeding the herd for in 2030, and does that still match the cows they can keep, and the milk their buyer will want to pay for?
The April 2025 Shift: High-Fat Illusion vs. Genetic Reality
Nobody at this table thinks Net Merit is ‘bad.’ NM$ remains one of the best tools for ranking bulls on expected lifetime profit under typical U.S. conditions. The problem is the gap between the conditions Net Merit assumes and the conditions a herd like this is actually facing now — and will face when today’s calves are in their third lactation.
When the Council on Dairy Cattle Breeding rolled out the updated Net Merit weights in April 2025, the headline changes were clear:
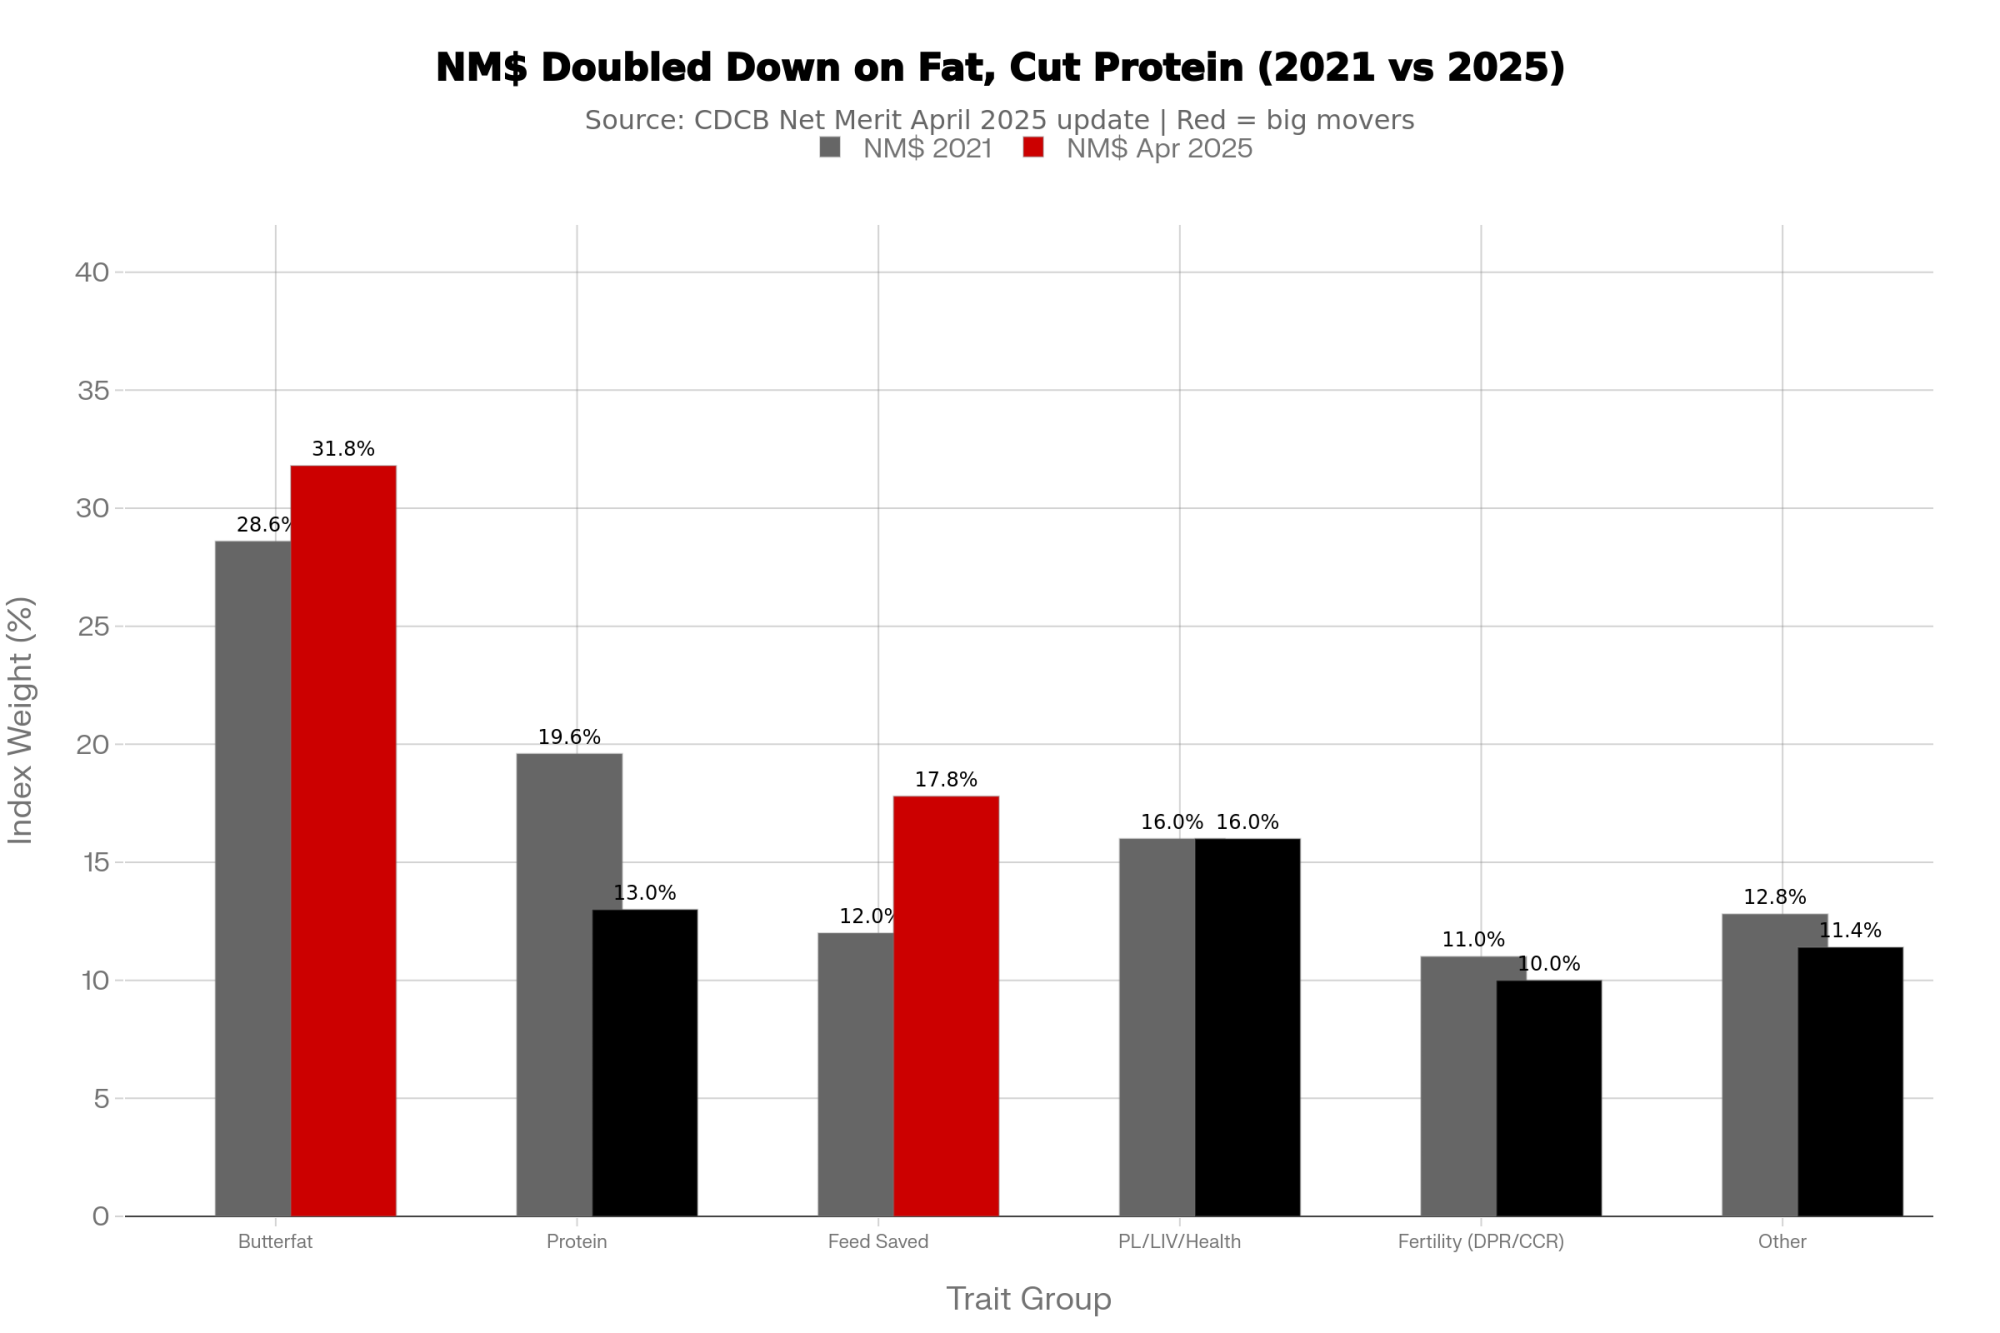
- The butterfat weight rose from 28.6% to 31.8%.
- The protein weight dropped from 19.6% to 13.0%.
- Feed Saved jumped from 12.0% to 17.8%.
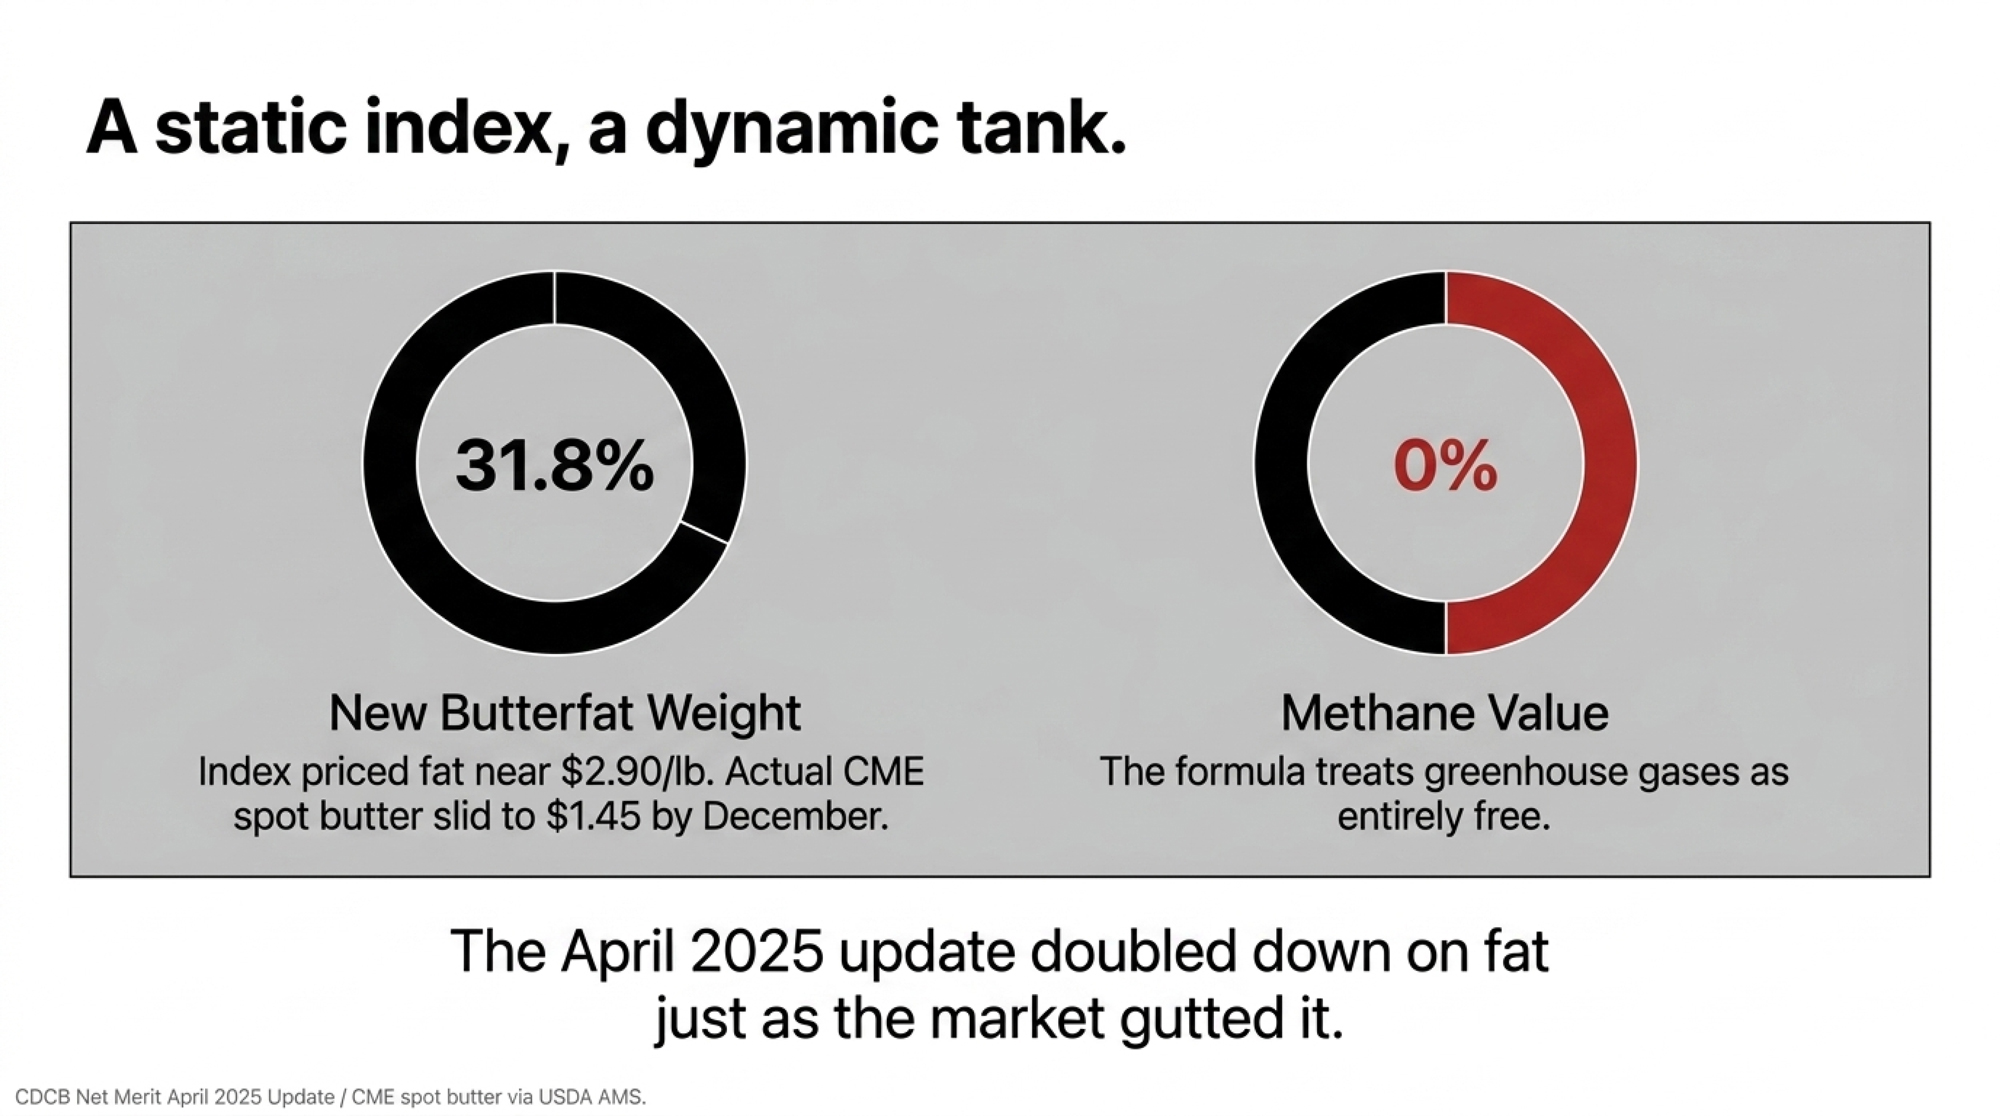
Here’s what that fat-heavy tilt means for your actual milk check. The index is telling your breeding program to chase butterfat hard and ease off protein — but it’s pricing those components off lagging multi-year averages, not what your tank is worth this week. Component values swing, Class prices jump, and a fat-to-protein ratio that looked right when CDCB built the formula can flip before the semen you ordered off it ever produces a milking daughter. A static index will always lag a dynamic tank. So the question isn’t just ‘is butterfat valuable?’ — it’s ‘will it still be priced this way when these matings hit the bulk tank in 2028?’
That’s not a hypothetical. CME spot butter traded near $2.50 per pound at the start of 2025 — right in the window CDCB used to reset those weights — then slid to roughly $1.45 by December and hovered near $1.71 by June 2026 (CME via USDA AMS and trade reporting). The index doubled down on fat just as the market spent a year taking the air out of it. That’s the lag in one commodity within a single year.
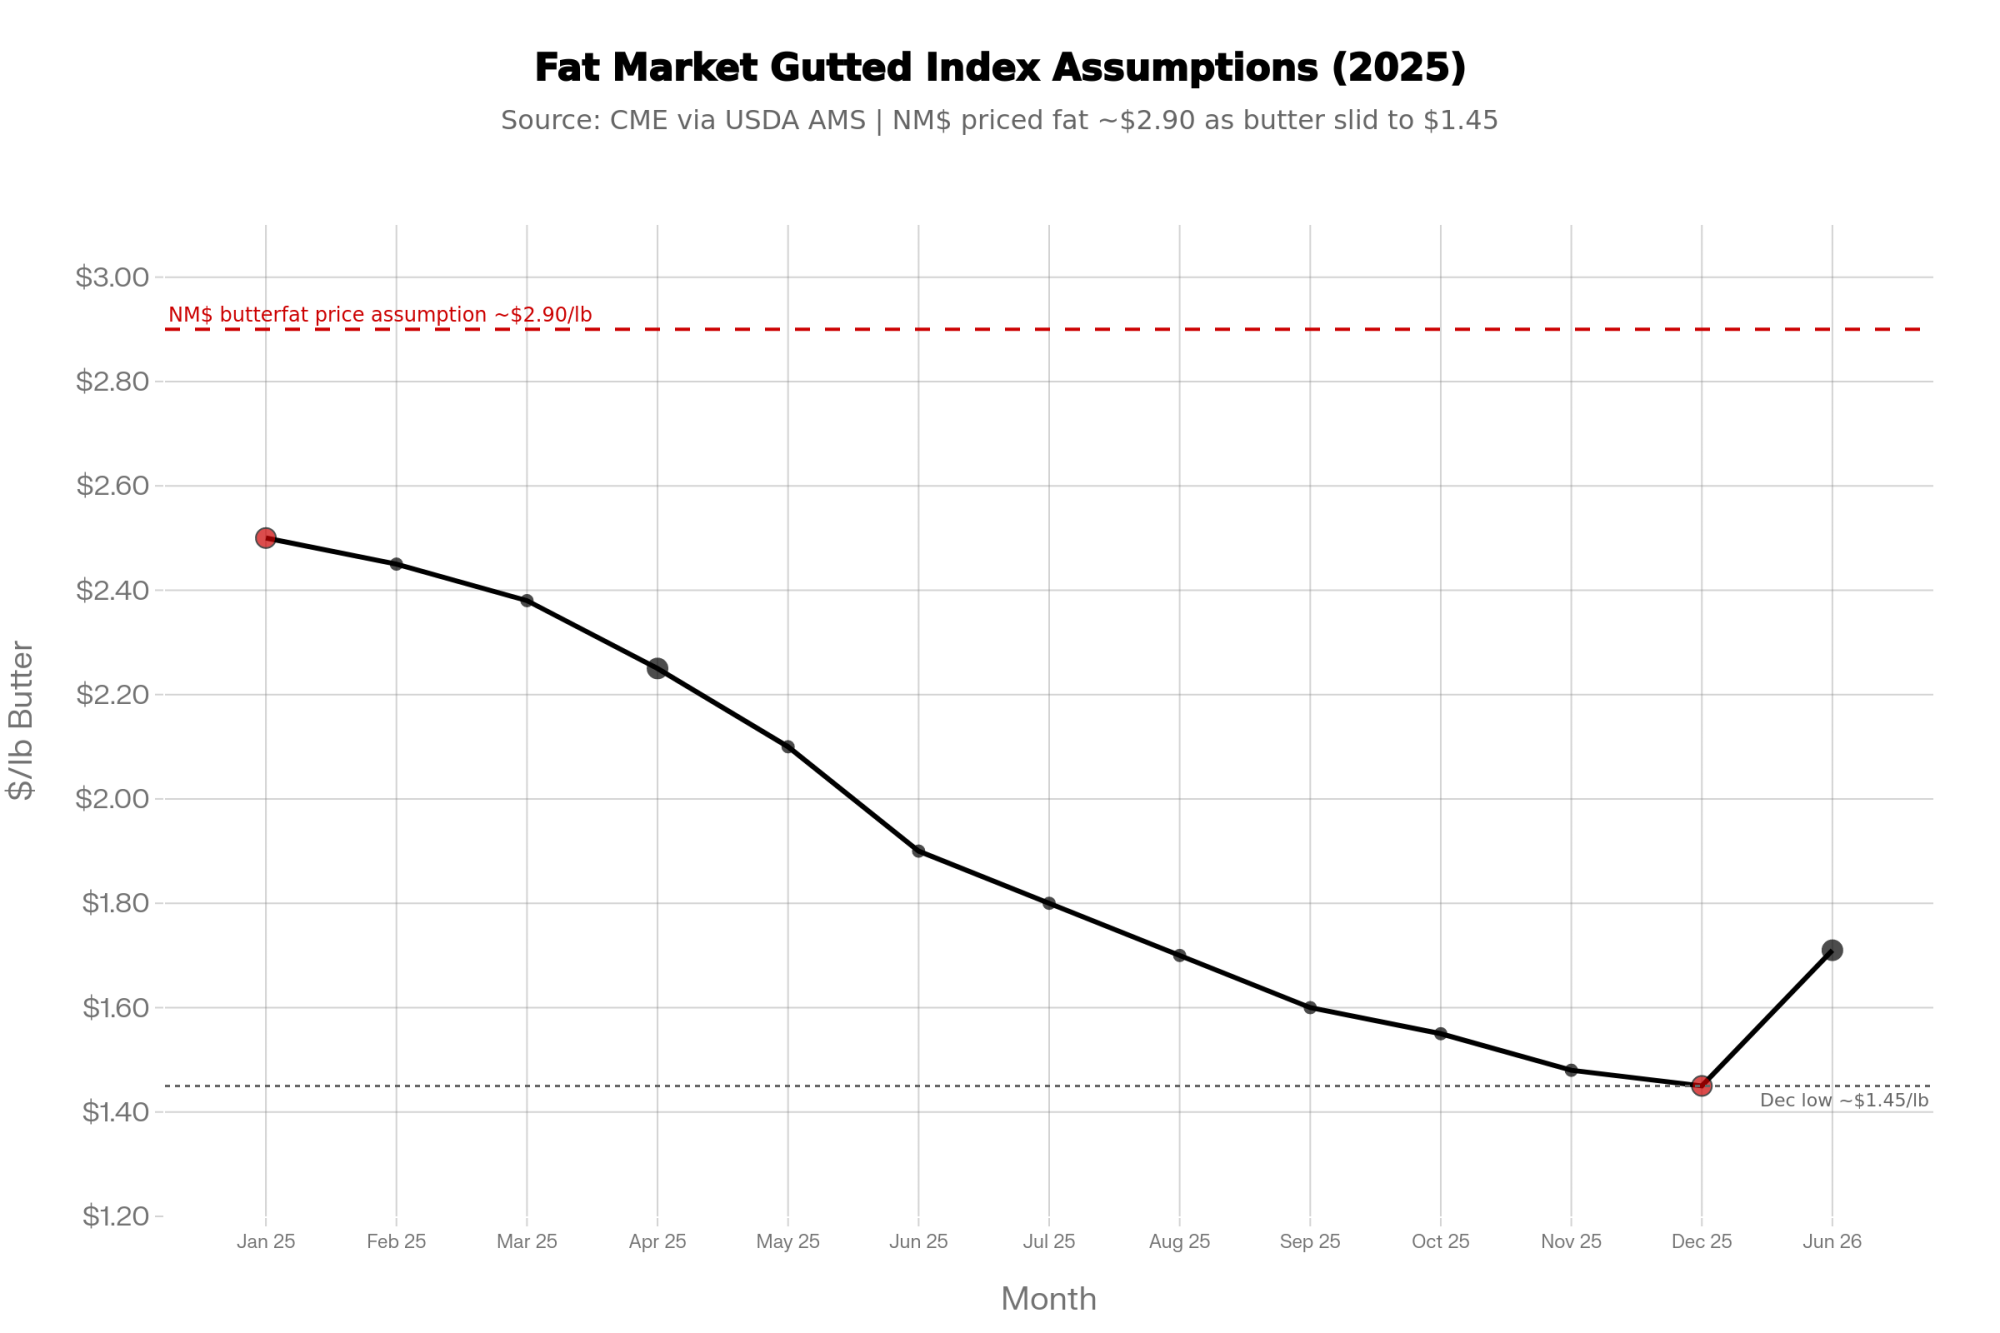
Translated into pricing, the update effectively values butterfat at about $2.90 per pound and feed at roughly $0.13 per pound of dry matter, while assigning methane a value of exactly $0 in the index math. CDCB and USDA-ARS used recent rolling averages of milk prices and feed margins — drawn from the years leading into the launch — to reset those economics. Butterfat had been the star during that window, trading near the high-$2-per-pound range in many orders, while protein prices sagged. Feed costs spiked, so Feed Saved was worth more.
Methane, heat tolerance, and welfare penalties weren’t in the equation at all. The official Net Merit documentation is explicit: only traits with a direct, currently measurable impact on farm profit are priced into the index, and greenhouse-gas traits are not yet included. CDCB has stated that traits are added to NM$ only when reliable national evaluations and clear economic values exist, and that greenhouse-gas evaluations are ongoing.
One number from CDCB’s own rollout really lands: the 2021 and April 2025 NM$ indexes correlate at 0.992 for young Holstein bulls and 0.981 for recent progeny-tested bulls. In plain language, almost nothing re-ranked. The same bulls a herd would have picked three years ago still float to the top of the list today — even though the butterfat, protein, and feed markets that drove the new formula look different from when most “top 10 NM$ only” rules began.
A growing number of U.S. processors are publicly discussing scope 3 emissions and sustainability reporting, and several have signaled that future producer payments may be linked to greenhouse gas performance. Nothing on the milk cheque yet. But the direction of travel is obvious.
The Bullvine walked through how the updated formula was built in its coverage of the CDCB Net Merit update.
When the Fresh Pen Says “Enough”
The cull report from a herd like this looks a lot like what you see in many high-output Holstein freestall operations. Overall, culling has crept into the high-30s. Sort culls into two piles — voluntary (older, low-producing cows with planned exits) and involuntary (health, fertility, injury, chronic problems) — and most exits are “had to” cows, not “chose to” cows.
There’s no single “official” cost of an involuntary cull, but economic modeling summarized by Albert de Vries and others puts the loss in the $500–$1,000 per cow range when you fold in lost future milk, replacement rearing cost, and health costs. And here’s why the timing hurts so much. Lose a second-lactation cow at 45 days in milk, and you’re not losing an average cow — you’re losing her at the exact moment she’s climbing toward peak yield, the most productive stretch of her life. She never gets the chance to milk back the rearing deficit she ran up as a heifer. You ate two years of feed, labor, and opportunity cost raising her; she’s three weeks from paying it back, and she leaves on the cull trailer instead. Do that 70 to 100 times a year, and the leak isn’t a rounding error — it’s much of the problem.
| Cull Pattern | Involuntary Share | Estimated Annual Leak | Likely Genetic Signal | Recommended Action |
|---|---|---|---|---|
| Mostly older, low-producing cows | <30% involuntary | Minimal ($5k–$15k) | Program working; monitor components trend | Stay Path 1; re-check butterfat vs. protein pricing quarterly |
| Mix of health + low production | 40–60% involuntary | Moderate ($20k–$45k) | Fertility and health traits under-weighted | Move to Path 2; add DPR/CCR and SCS floors |
| Dominated by fresh-cow disease, lameness, infertility | >70% involuntary | High ($50k–$100k+) | Breeding goal misaligned with system pressure | Path 2 or 3 immediately; audit sire stack for PL, LIV, hoof health |
| High culls concentrated in first 60 DIM | >65% involuntary | High + rearing cost unrecovered | Transition risk baked in genetically | Full genetic audit; consider Nordic/EBI sires for robustness |
For 1,200 cows with a cull rate near 40%, even modest improvements in involuntary culling add up fast — and they add up to a number that dwarfs anything achievable by chasing feed efficiency alone.
Where the Money Actually Sits
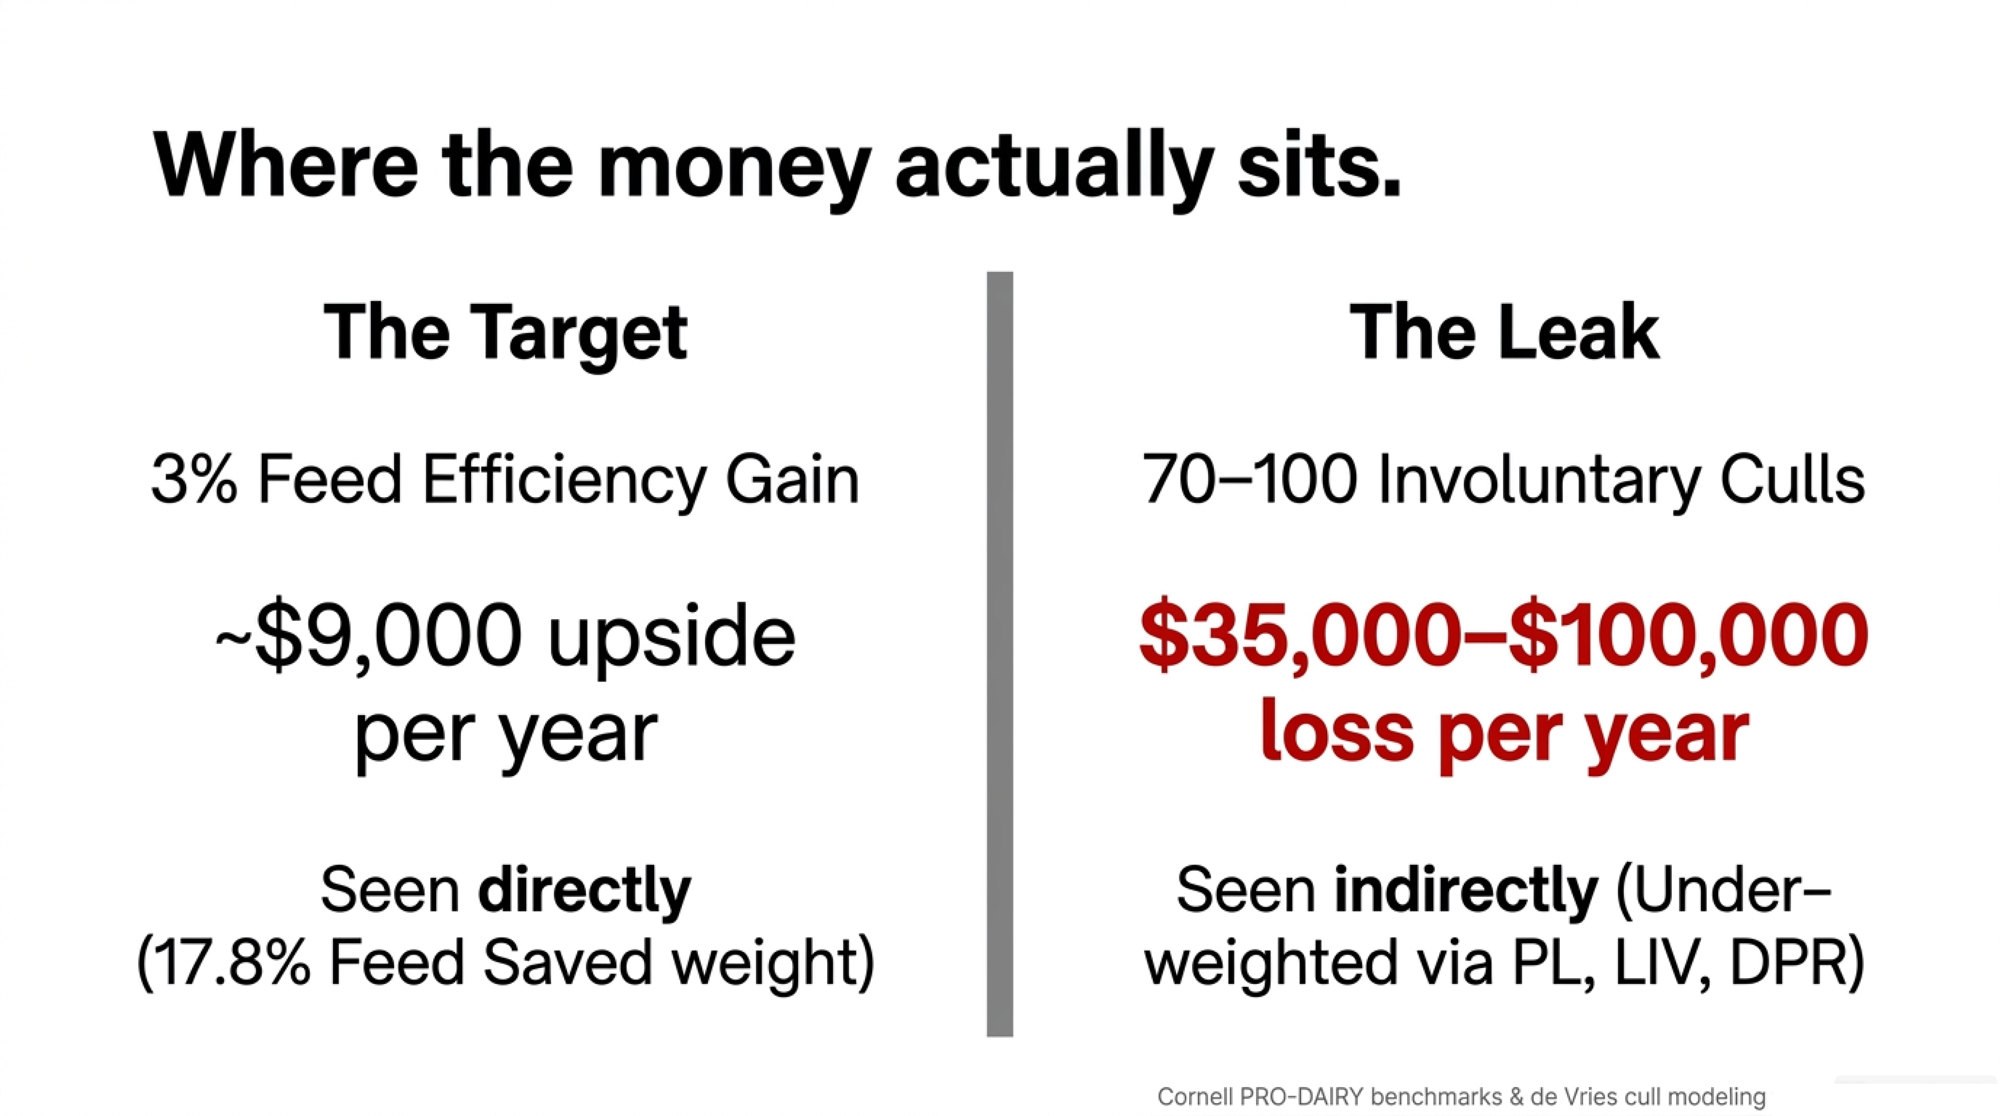
| Involuntary Cull Leakage | Feed-Efficiency Upside | |
| What’s being modeled | 1,200 cows × 40% cull rate = 480 culls/yr; 15–20% reduction in forced exits = 70–100 fewer “had to” cows | A genuine 3% improvement in feed use (genetics + management together) on 30,000 cwt shipped, at a Northeast purchased-feed cost around ~$10/cwt, consistent with recent Cornell PRO-DAIRY / Northeast Dairy Farm Summary benchmarks |
| Per-unit economics | $500–$1,000 per involuntary cull saved (de Vries-style modeling) | 3% of ~$300,000 annual feed cost |
| Annual impact | $35,000–$100,000/yr | ~$9,000/yr (more if your landed feed cost runs higher) |
| Source of the gain | Cows staying in the herd long enough to pay off rearing cost | Smaller cow size + intake efficiency in the Feed Saved PTA |
| Visible in the index? | Indirectly via PL, LIV, DPR, SCS — all under-weighted relative to this leak | Directly via Feed Saved (17.8% weight) |
🔴 The P&L Blind Spot
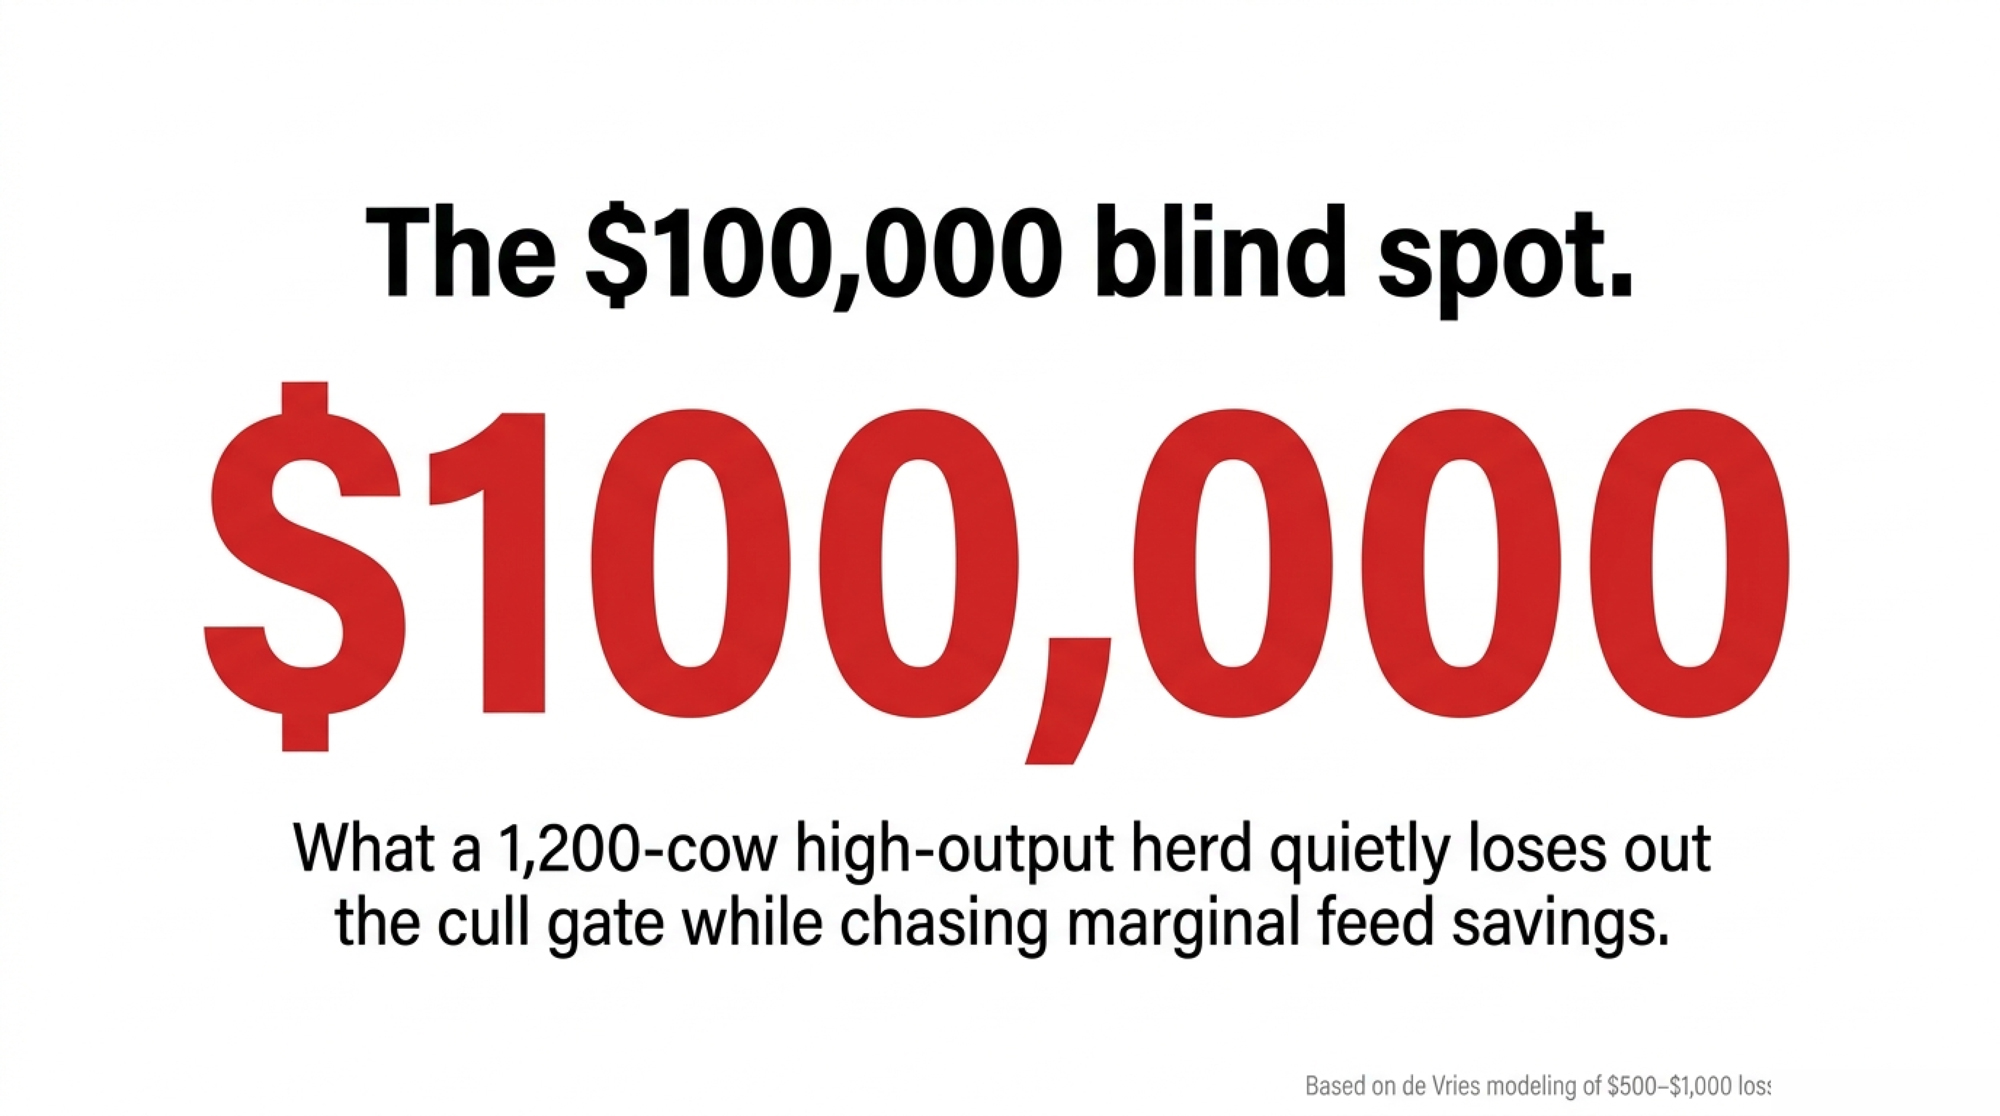
High-output herds are chasing roughly $9,000 a year in marginal feed-efficiency gains the index explicitly rewards — while quietly leaking up to $100,000 a year through transition wrecks and forced culls the index barely sees. One number sits on the spreadsheet your breeding program optimizes for. The other walks out on the cull trailer.
So why is a breeding goal still leaning as hard on production and Feed Saved as the national average?
“We Bred Exactly What We Asked For”
A decade of sire choices on a farm like this tells an ordinary story. The team chased high NM$ and TPI, especially big milk and components. Less weight on body condition and “middle,” more on tall and angular. They eventually bolted on Productive Life and SCS filters once the cost of mastitis and early exits became impossible to ignore.
The cows walking the freestall alleys in 2025 are the predictable result. Powerful milkers, especially in first and second lactation. But many fresh cows dive into a deep negative energy balance — the window Cornell and PRO-DAIRY transition research has long flagged as the highest-risk stretch for high-output Holsteins — that drops them right on the edge between “profitable” and “problem.”
In our reporting on transition cow disease across high-output Holstein herds, one pattern keeps surfacing: genetics now produce cows that can out-milk the ability of an operation to keep them healthy through the first 60 days. Good transition management still helps. But genetics quietly loads the dice against you before the calf is even born.
Cornell’s NYSCHAP transition-cow benchmarks draw the alarm lines in hard numbers: displaced abomasum at or above 6% (target under 3%), milk fever at or above 5% (target under 2%), retained placenta at or above 10% (target under 8%). Herds that have selected hard on production for years tend to flirt with those lines unless genetics and transition management are pulling in the same direction.
Lay health and culling patterns next to a genetic trend, and what shows up isn’t a “transition program” problem. It’s a breeding-goal problem that’s been compounding across multiple sire generations.
If you want the mechanics, The Bullvine breaks down how feed efficiency is actually measured in its primer on residual feed intake.
Net Merit: Where It Still Helps and Where It’s Blind
This isn’t “abandon NM$.” It’s knowing what Net Merit is genuinely good at for a herd like this — and where it’s blind.
Where NM$ still shines:
- Ranks bulls for lifetime profit under average U.S. confinement herd economics, assuming FMMO-style component pricing and no carbon price.
- Keeps obviously risky sires — very poor somatic cell, extremely low fertility, weak livability — out of the tank.
- Provides a consistent national yardstick to compare bulls, cow families, and herds.
Where NM$ goes blind for this kind of herd:
- Feed efficiency. The Feed Saved trait combines actual feed intake data, where available, with the body weight composite. A big slice of that PTA still comes from smaller cows, not necessarily cows that convert feed more efficiently at the same size. For a herd already pushing milk per stall hard, smaller isn’t automatically better if it means less “middle” to handle higher output.
- Environment. Methane and other environmental externalities are valued at $0 in the NM$ formula. Any future carbon premium or deduction from a processor is invisible to the index, which leaves any herd thinking about methane efficiency or low-carbon dairy genetics working off-index.
- How it plays in robots. Udder and teat composites that work fine in a parlor can be a headache in AMS barns. Robot herds have learned the hard way that rear teats too close together are one of the quickest ways to make a robot hate your cow. National udder composites weren’t originally built around AMS needs.
- Responsiveness. The April 2025 update didn’t add any new traits and barely moved bull rankings overall, despite real changes in butterfat prices and feed costs. That’s a deliberate trade-off CDCB makes to keep the national index stable: changes that re-rank too many bulls or invalidate years of breeding decisions are, by design, hard to push through quickly.
For a herd with a full fresh pen, a high share of involuntary culls, and a processor warming up for sustainability scoring, NM$ is still useful — but more as a minimum standard than the steering wheel.
Trust the Index, Adjust It, or Override It?
Here’s where the kitchen-table conversation gets honest. Three roads forward. And which one you take isn’t a personality test — it’s dictated by how far your herd has drifted from the “average U.S. parlor herd” the index assumes.
Start at Path 1. The further your reality sits from that national average, the further down the line you move. Cull report still looks normal, and your processor’s quiet on carbon? Trust works. Watching involuntary culls climb, and fresh-pen disease creep toward those NYSCHAP alarm lines? You’re already past Path 1, whether you’ve admitted it or not. Running robots, grazing, or staring down a processor sustainability contract? You’re at Path 3. Find the road that matches what you’re actually living — then decide whether it still fits the next decade.
| Selection Path | Primary Sort Tool | Key Assumption | What You Give Up | Red Flag Trigger |
|---|---|---|---|---|
| Path 1 — Trust NM$ | NM$ top 10–20 bulls | Avg U.S. confinement economics, FMMO pricing, no carbon price | Direct control over methane, AMS udder fit, index lag | Involuntary culls >70%; fresh-pen disease at NYSCHAP alarm lines |
| Path 2 — Adjust Around Your Data | NM$ as gatekeeper + custom minimums | Your DPR, CCR, mastitis, and hoof floors override top-end ranking | Some NM$ points at top of list | High forced-cull rate + processor starting carbon conversation |
| Path 3 — Override the Index | Cheese Merit / EBI / NTM / custom weights | Your system (robots, grazing, OAD) differs materially from national average | Single national ranking; smaller reference populations | Robots, grazing, processor sustainability contract, OAD milking |
| Methane Value in Each Path | $0 (NM$) | $0 (NM$) | €2.63/100kg already paid in NL | U.S. processor carbon premiums ~2028–2030 window |
Path 1 — Trust the Index
You are here if: Your primary sire-selection rule is “sort by NM$, take the top 10–20 bulls, move on.”
What it assumes: Average U.S. confinement herd economics, FMMO-style component pricing, no carbon price, and a herd structure close to the national mean.
What you give up: Direct emphasis on the traits NM$ doesn’t price — methane, heat tolerance, AMS-specific udder design — plus any responsiveness to the gap between your milk cheque and the index’s pricing assumptions.
Honest tell: If your involuntary cull share is climbing and your fresh-pen disease rates are flirting with NYSCHAP alarm levels, “trust” is quietly costing you the leakage in the table above.
Path 2 — Adjust Around Your Own Data
You are here if: You use NM$ as a gatekeeper but layer your own minimums on top.
What it looks like in practice: A hard floor on Daughter Pregnancy Rate and Cow Conception Rate. More weight on mastitis resistance and hoof health, where credible proofs exist. A preference for bulls with real feed-intake data behind their Feed Saved PTAs, not just a smaller body weight composite. Acceptance that you’ll give up some top-end NM$ points to get cows that stay in the herd longer.
What you give up: Some short-term genetic merit on the top-line index number.
Honest tell: If your composite herd looks like the New York one in this story — full fresh pen, high involuntary culls, processor talking carbon — this is usually the right starting road.
Path 3 — Override the Index
You are here if your future system looks materially different from the “average U.S. parlor herd.”
What it looks like in practice: Cheese Merit or Grazing Merit as your primary sort instead of NM$. Irish or Nordic sires were brought in because EBI and NTM placed greater weight on fertility, pasture performance, and emissions. Or rough custom economic weights built off your own numbers — your feed costs, your culling pattern, your labor situation, and the language in your processor’s contract.
What you give up: The simplicity of a single national ranking, and reference populations that may be smaller for some traits.
Honest tell: Robots, grazing, OAD, processor sustainability scoring, or a strong components-only payment structure are all signs the override path is worth a serious look.
A composite herd like this New York operation usually lands between Path 2 and Path 3. Keep an NM$ threshold but stop insisting on only top-10 bulls. Weight health, fertility, livability, and moderate stature harder when picking sires. Hunt for bulls with credible feed-efficiency stories. And look at EBI-bred and Nordic sires with curiosity instead of writing them off as “pasture bulls from somewhere else.”
The agreement that emerges around the table is usually the same: cows that stay in the herd and pay off their rearing cost deserve more weight in the breeding goal than cows that leave after one or two rocky lactations.
What Does a Case of Ketosis Really Mean for Your Genetics?
Most of us talk about genetics and picture proofs before pens. The health patterns in your fresh pen are exactly where your index choices show up.
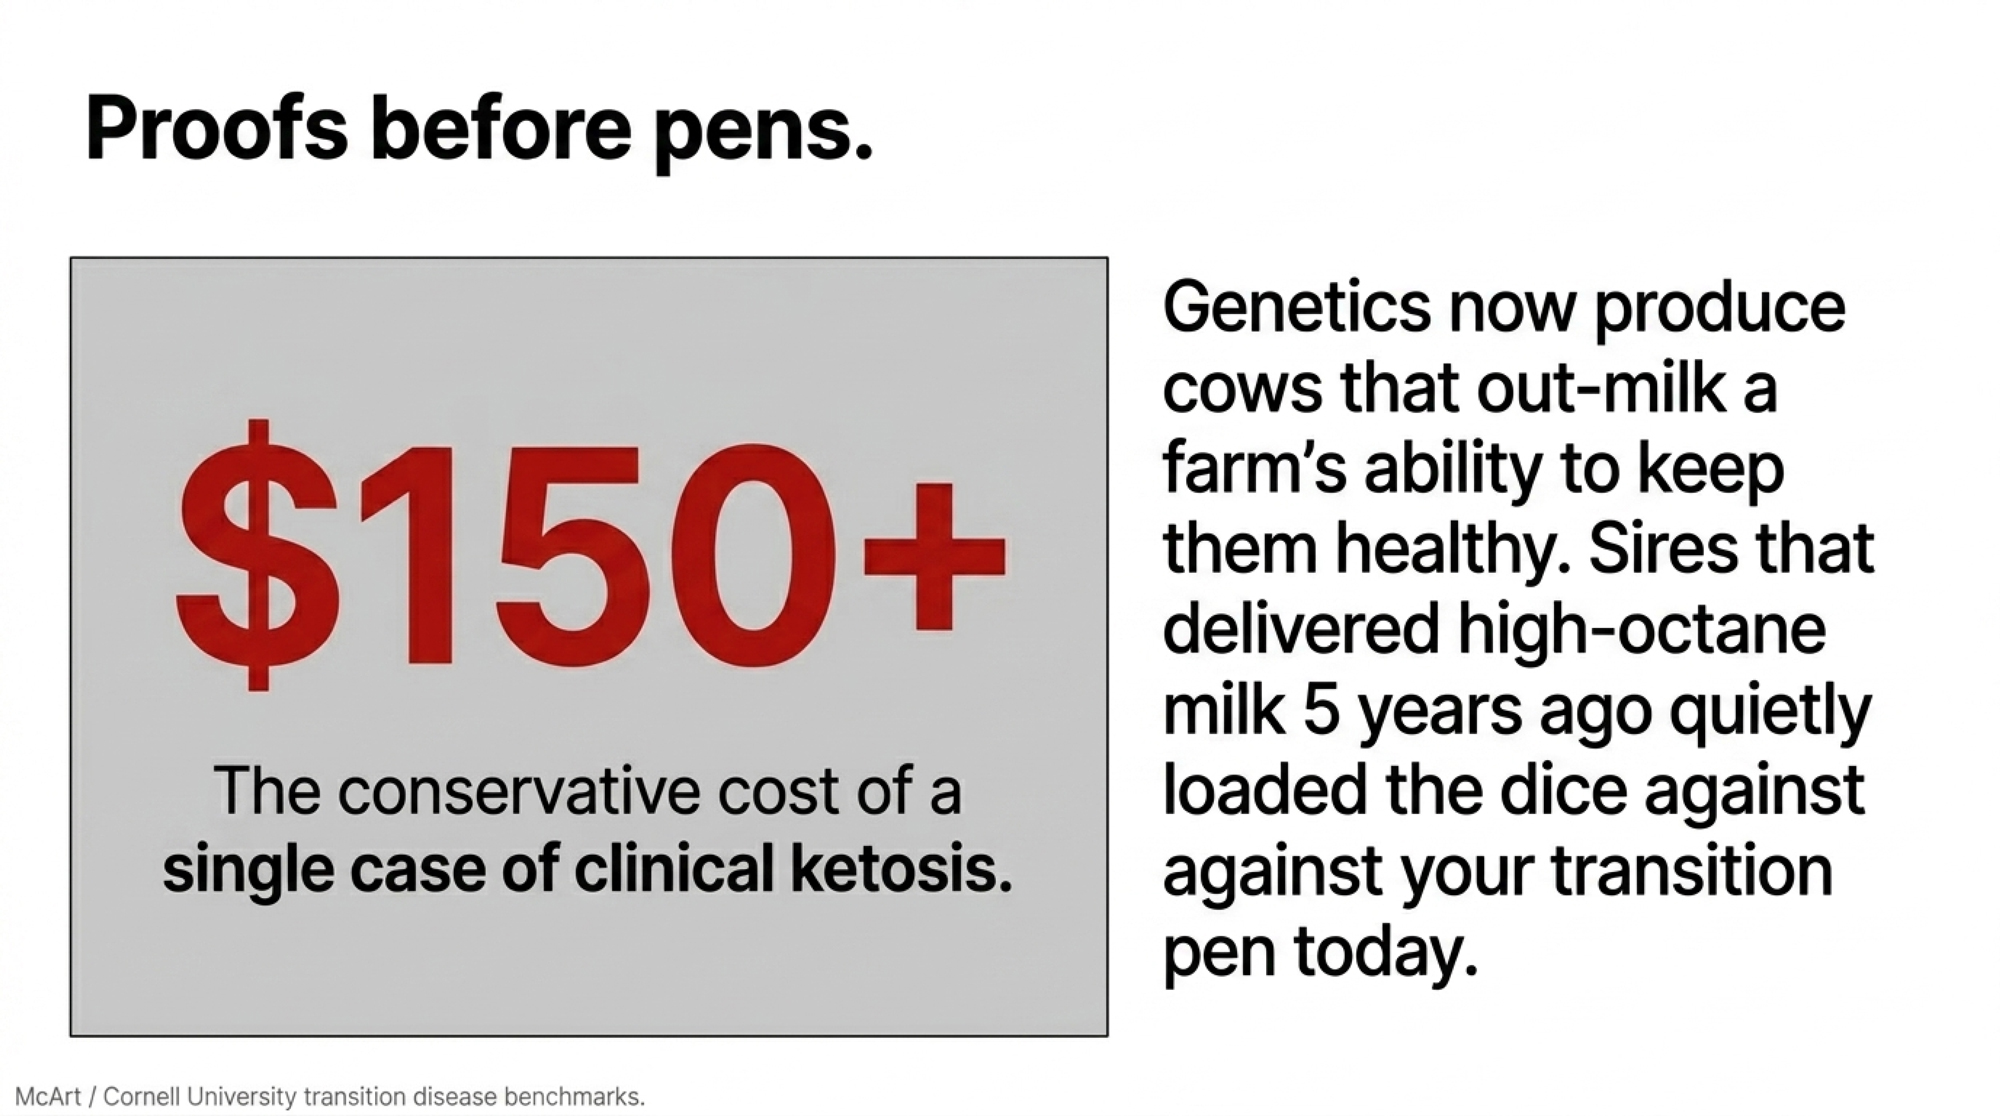
Take ketosis. Cornell research led by Jessica McArt and recent extension summaries put a single case of clinical ketosis in the low hundreds of dollars per cow — published estimates range from roughly $117 to over $230 per case once treatment, lost milk, reproduction delays, and added culling risk are factored in. The exact number depends on the system and prices, but it’s not trivial.
Run the example off this herd’s scale:
- 1,200 cows, with 10% hitting some form of ketosis in early lactation. That’s 120 cases.
- If better genetics and management together trimmed that by 20%, that’s 24 fewer cases.
- Use a conservative blended estimate of around $150 per case to stay on the low end of published ranges, and you’re looking at about $3,600 a year back in your pocket.
You’re not retiring on that number. But stack it with fewer DAs, fewer down cows, better fertility, and a few more cows making it into third and fourth lactation, and now you’re talking real money.
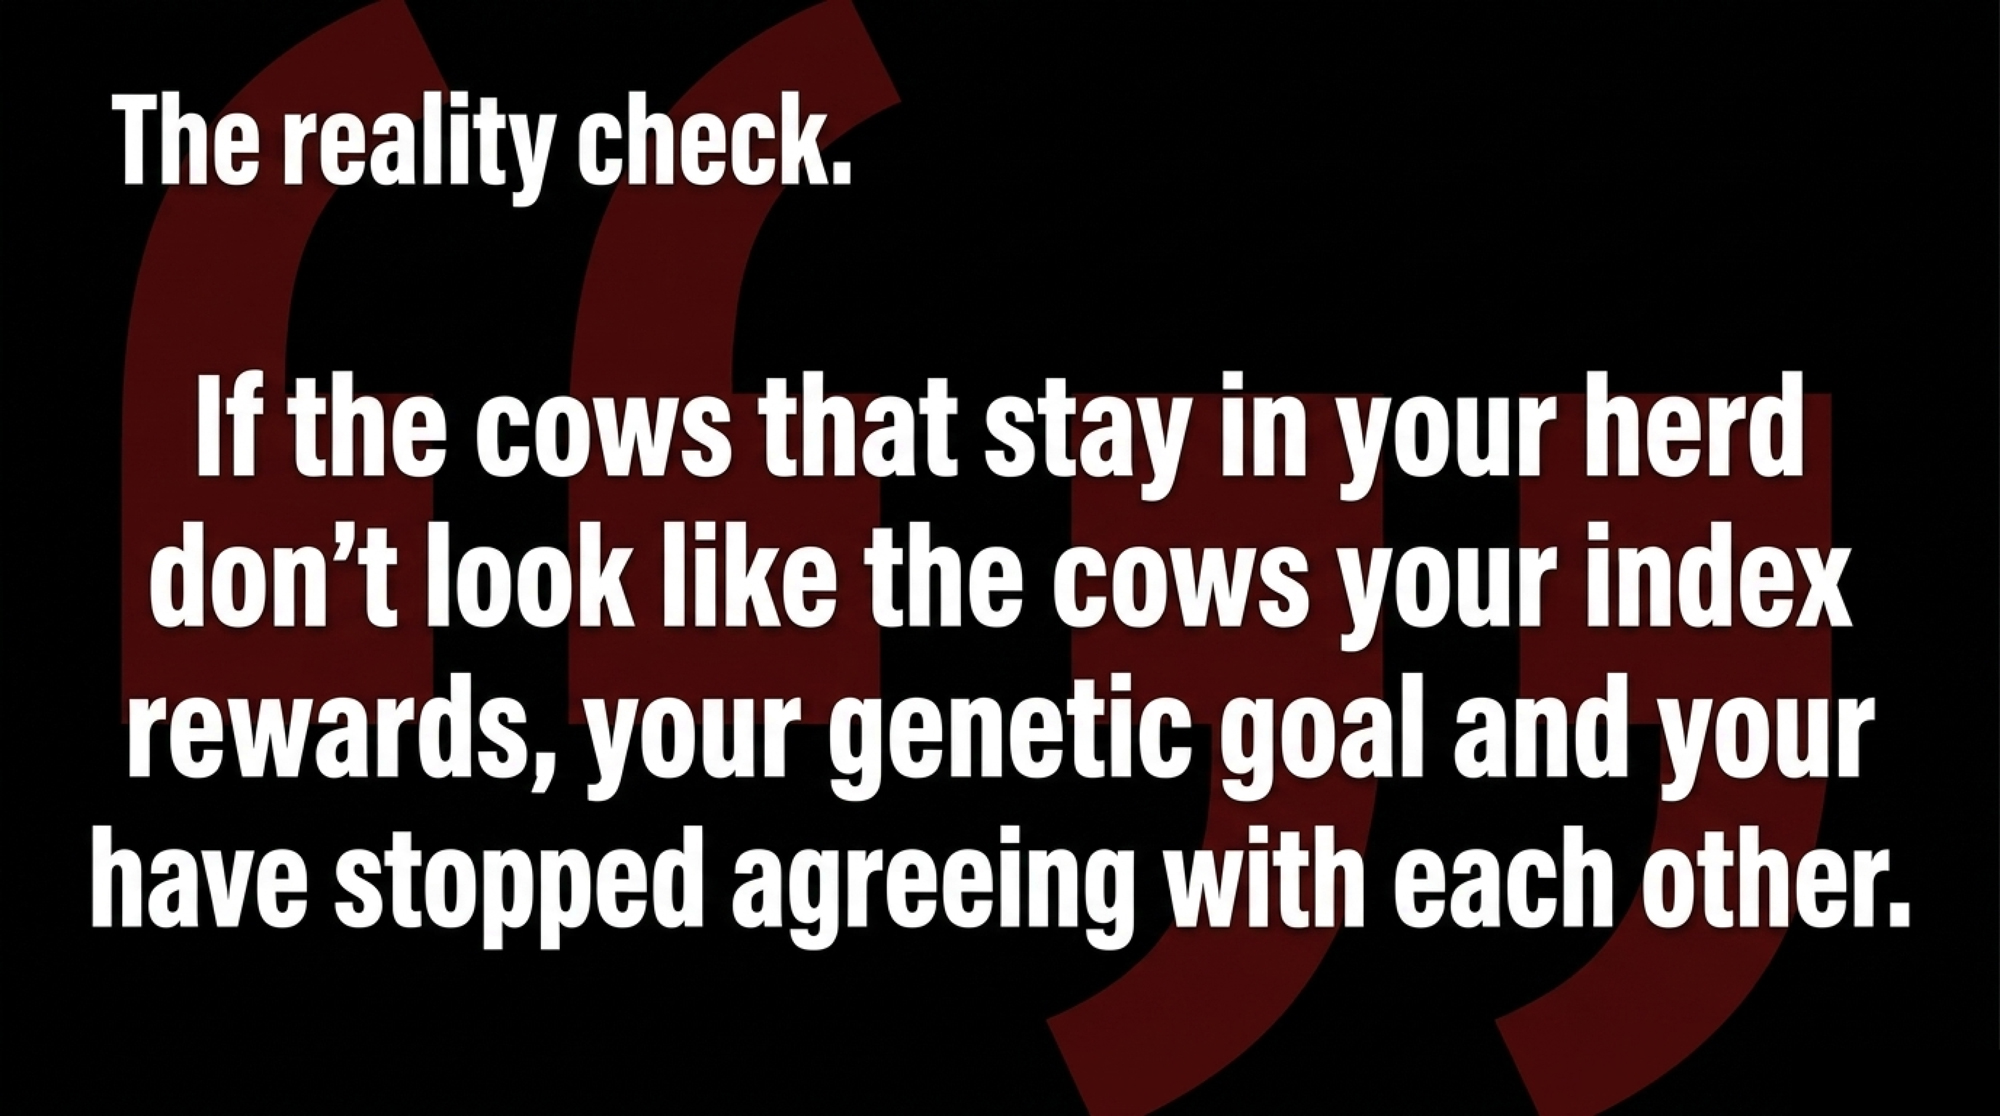
Changing trait weights doesn’t magically fix everything. But the cows getting sick now are partly the product of mating decisions made 5–10 years ago. The same proofs that gave you high-octane milk can quietly raise the odds that cows tip over in a high-pressure transition program. And if the cows that stay in your herd don’t look like the cows your index rewards, your genetic goal and your business have stopped agreeing with each other.
This isn’t a “transition program” problem that showed up in 2025. It’s a long-running genetic strategy that never got updated as the economics and farm realities shifted around it.
Is Your Index Already Behind Your Processor?
The other source of tension at the table isn’t the vet bill. It’s the milk buyer.
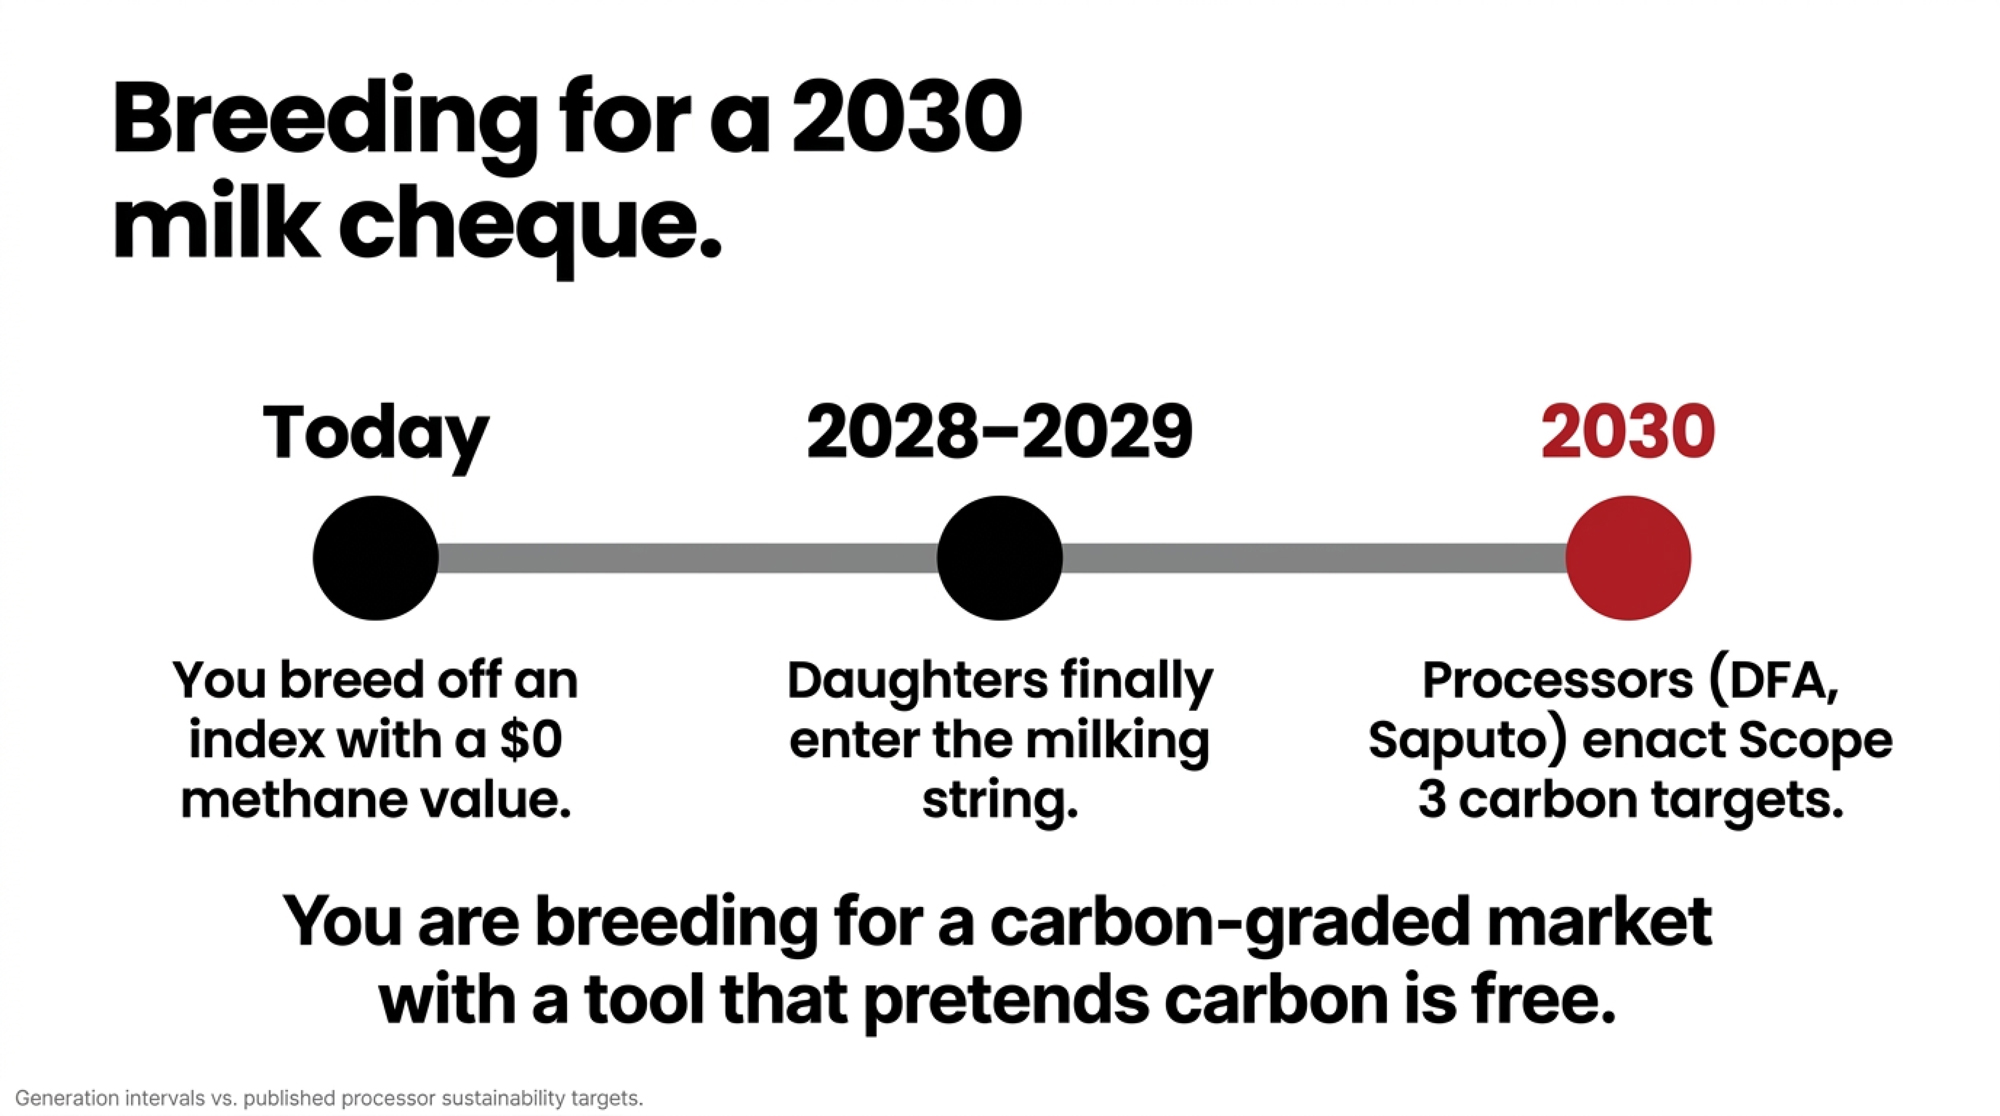
Several large U.S. processors — Dairy Farmers of America among them, with its publicly committed net-zero greenhouse-gas goal by 2050 and ongoing scope-3 reporting, and Saputo with its publicly stated commitment to reduce absolute scope 1 and 2 emissions and to engage suppliers on scope-3 emissions by 2030 — have lined up sustainability targets that put farm-level emissions on the table. Nobody knows exactly what the premium and deduction structure will eventually look like. But at some point, a kilogram of milk from a low-footprint herd won’t be treated the same as a kilogram from a higher-footprint one.
International examples are the warning shot. In November 2022, Ireland’s Economic Breeding Index added a dedicated carbon sub-index, which ICBF and Teagasc set at a 10% weighting of the total EBI — putting a monetary value on emissions at €80 per tonne of carbon dioxide. Teagasc and ICBF data show cows bred under EBI have become measurably more carbon-efficient per kilogram of milk solids, mostly through higher fertility, better solids, and tighter calving patterns, diluting emissions per unit of output.
Now factor in the clock that makes this urgent: a dairy animal’s generation interval runs roughly 3 to 4 years. Breed off a “$0 methane value” index today, and the heifers you’re creating won’t even enter the milking string until 2028 or 2029 — and they’ll be in your herd for years after that. So if a U.S. processor lands a carbon premium or deduction by the turn of the decade, the cows facing that penalty are being conceived right now, off an index that prices their emissions at nothing. You’re not breeding for today’s milk cheque. You’re breeding for a milk cheque you can’t see yet, with a tool that pretends carbon is free.
Dutch dairy co-op FrieslandCampina already runs the real-world version of this on the milk cheque. The co-op paid out more than €245 million in sustainability premiums to member farms for 2023 — averaging €2.63 per 100 kg of farm milk — with about €190 million of that flowing through the Foqus planet sustainable-development incentive system, and the remaining €55 million-plus tied to special milk flows such as organic and PlanetProof. The exact split shifts year to year, but the principle is fixed: greenhouse-gas and sustainability performance is already cash on a Dutch milk cheque.
| Index / Program | Country | Methane / Carbon Value | Fertility Weight | Sustainability on Milk Cheque? |
|---|---|---|---|---|
| Net Merit (NM$) Apr 2025 | USA | $0 | ~10% (DPR/CCR) | No |
| Economic Breeding Index (EBI) | Ireland | €80/tonne CO₂ (10% sub-index) | ~38% (fertility) | Indirect via EBI-linked premiums |
| Nordic Total Merit (NTM) | Sweden/Finland/Denmark | Included in health/longevity cluster | ~15–20% | Partial (national programs) |
| Grazing Merit | USA (alt) | $0 | Higher DPR floor | No |
| FrieslandCampina Foqus | Netherlands | Priced into farm sustainability score | Standard NL | Yes — avg €2.63/100kg paid in 2023 |
The Bullvine broke down exactly how that bonus lands — and why it doesn’t always show on the cheque — inFrieslandCampina Pays €2.63/100kg Sustainability Bonus.
Net Merit still values methane at $0, even after the April 2025 update. For a herd that sells embryos or bulls, or supplies a processor already thinking in carbon accounting, that mismatch matters. If your index assumes greenhouse gases cost nothing and your buyer’s long-term plan treats them as a real liability, you’re breeding into a gap that shows up somewhere — on your milk cheque, in your access to certain programs, or in how marketable your genetics are to buyers further down the sustainability path.
For a herd like this, that’s the final nudge. Nobody wants to discover in 2030 that their genetics were perfect for a 2023 milk cheque and badly misaligned with a carbon-graded market.
For the bigger picture on the 2025 base changes, see The Bullvine’s full breakdown of CDCB’s 2025 genetic base and merit indices update.
What This Means for Your Operation
- Pull your last 12 months of cull records and sort them into “voluntary” and “involuntary.” If more than 70% of your culls are involuntary, and infertility, lameness, mastitis, and transition disease top the list, that’s a strong sign you need more genetic emphasis on health, fertility, and robustness — not just better management.
- Ask your genetics adviser one specific question about Feed Saved. For the bulls you’re using, how much of their Feed Saved PTA is attributable to true feed intake data versus just smaller body size? If the answer leans heavily on body weight composite, you’re mainly selecting for smaller cows, not necessarily cows that convert feed better at the same size.
- Compare your milk cheque to the index’s pricing assumptions. Net Merit’s updated weights lean toward butterfat and protein values that reflect recent U.S. component prices, with a heavier emphasis on fat than on protein. If your market pays more aggressively for protein, or your fat price has already slid from those highs — and it slid hard through 2025 — give Cheese Merit or a custom trait profile more weight alongside NM$.
- Look at your 5-year system plan, not just this proof run. Are robots, grazing, or alternative housing in the pipeline? Start filtering now for the traits that matter in those systems — teat placement and udder depth for robots, fertility and feet for grazing — instead of assuming the national composite will automatically produce the right cows.
- Do one “override the index” exercise in the next 30 days. For your next semen order, deliberately pick two or three bulls that aren’t in your usual top-10 NM$ list but rank strongly for the traits your own numbers say matter most. Track their daughters separately. See whether they match the kind of herd you actually want to milk.
- Use your own numbers to set genetic red lines. If your records show that DAs, metritis, or down cows at certain levels destroy your margin, work with your adviser to set minimum thresholds for relevant traits — not just maximum NM$ points — and stick to them.
Key Takeaways
- If your cull report is dominated by cows you “had to” ship, that’s not just a transition management story — it’s feedback on your breeding goal. Genetics and management pull on the same rope. Adjust only one end, and the herd won’t move very far.
- Net Merit’s updated weights make it a solid national index, but it’s built on 2021–2024 economics with zero value on methane and limited direct emphasis on the traits that keep cows in a high-pressure system. Use it as a baseline, not a blind autopilot.
- Your own data is the best starting point for adjusting or overriding the index. The three biggest leaks in your P&L — usually involuntary culls, fresh-cow disease, and labor around “problem cows” — should drive more of your trait emphasis than they probably do today.
- If your processor, lender, or genetics customers are already talking about sustainability and 2030 targets, your breeding program is in the sustainability business whether you like it or not. The genetics you choose now will decide whether your herd fits those programs or constantly fights them.
A herd like this, the New York composite, still looks at NM$ every proof run. The difference, once the conversation goes honestly, is that it becomes one lens, not the whole picture. The sire list bends toward cows you can keep, and toward a milk cheque your buyer is likely to be writing in 2030, not 2019.
If you laid your last ten years of sire choices next to your last 12 months of cull reasons and vet bills, would those two stories look like they came from the same farm — or is it time to redraw your genetic target?
Run Your Numbers
Herd Health ROI Calculator — This article puts the cull-gate leak at up to $100,000 a year. Plug in your own culling rate, replacement heifer cost, and mastitis incidence to see what slowing those forced exits is actually worth on your herd — before you blame the breeding goal or the transition pen.
Complete references and supporting documentation are available upon request by contacting the editorial team at editor@thebullvine.com.
Learn More
- The Net Merit Trap: Why Breeding for the “Average Cow” is Leaking Dollars on Your Dairy — Arms you with a customized financial framework to evaluate regional component adjustments. You will stop sacrificing top-end performance for national averages that do not reflect your local milk contract.
- Beyond the Bulk Tank: How Scope 3 Emissions Will Rewrite Your Next Breeding Order — Projects the upcoming economic impact of carbon-graded regulations on North American herds. This guide breaks down the multi-year generation interval timeline you must adopt today to protect future processor access.
- Is Smaller Actually Better? Debunking the Body Weight Composite Myth in Modern Sire Selection — Dismantles the standard assumption that lower stature automatically equals high feed conversion efficiency. It delivers a hard look at the structural capacity high-output Holsteins require to prevent transition pen crashes.
The Sunday Read Dairy Professionals Don’t Skip.

Every week, thousands of producers, breeders, and industry insiders open Bullvine Weekly for genetics insights, market shifts, and profit strategies they won’t find anywhere else. One email. Five minutes. Smarter decisions all week.




