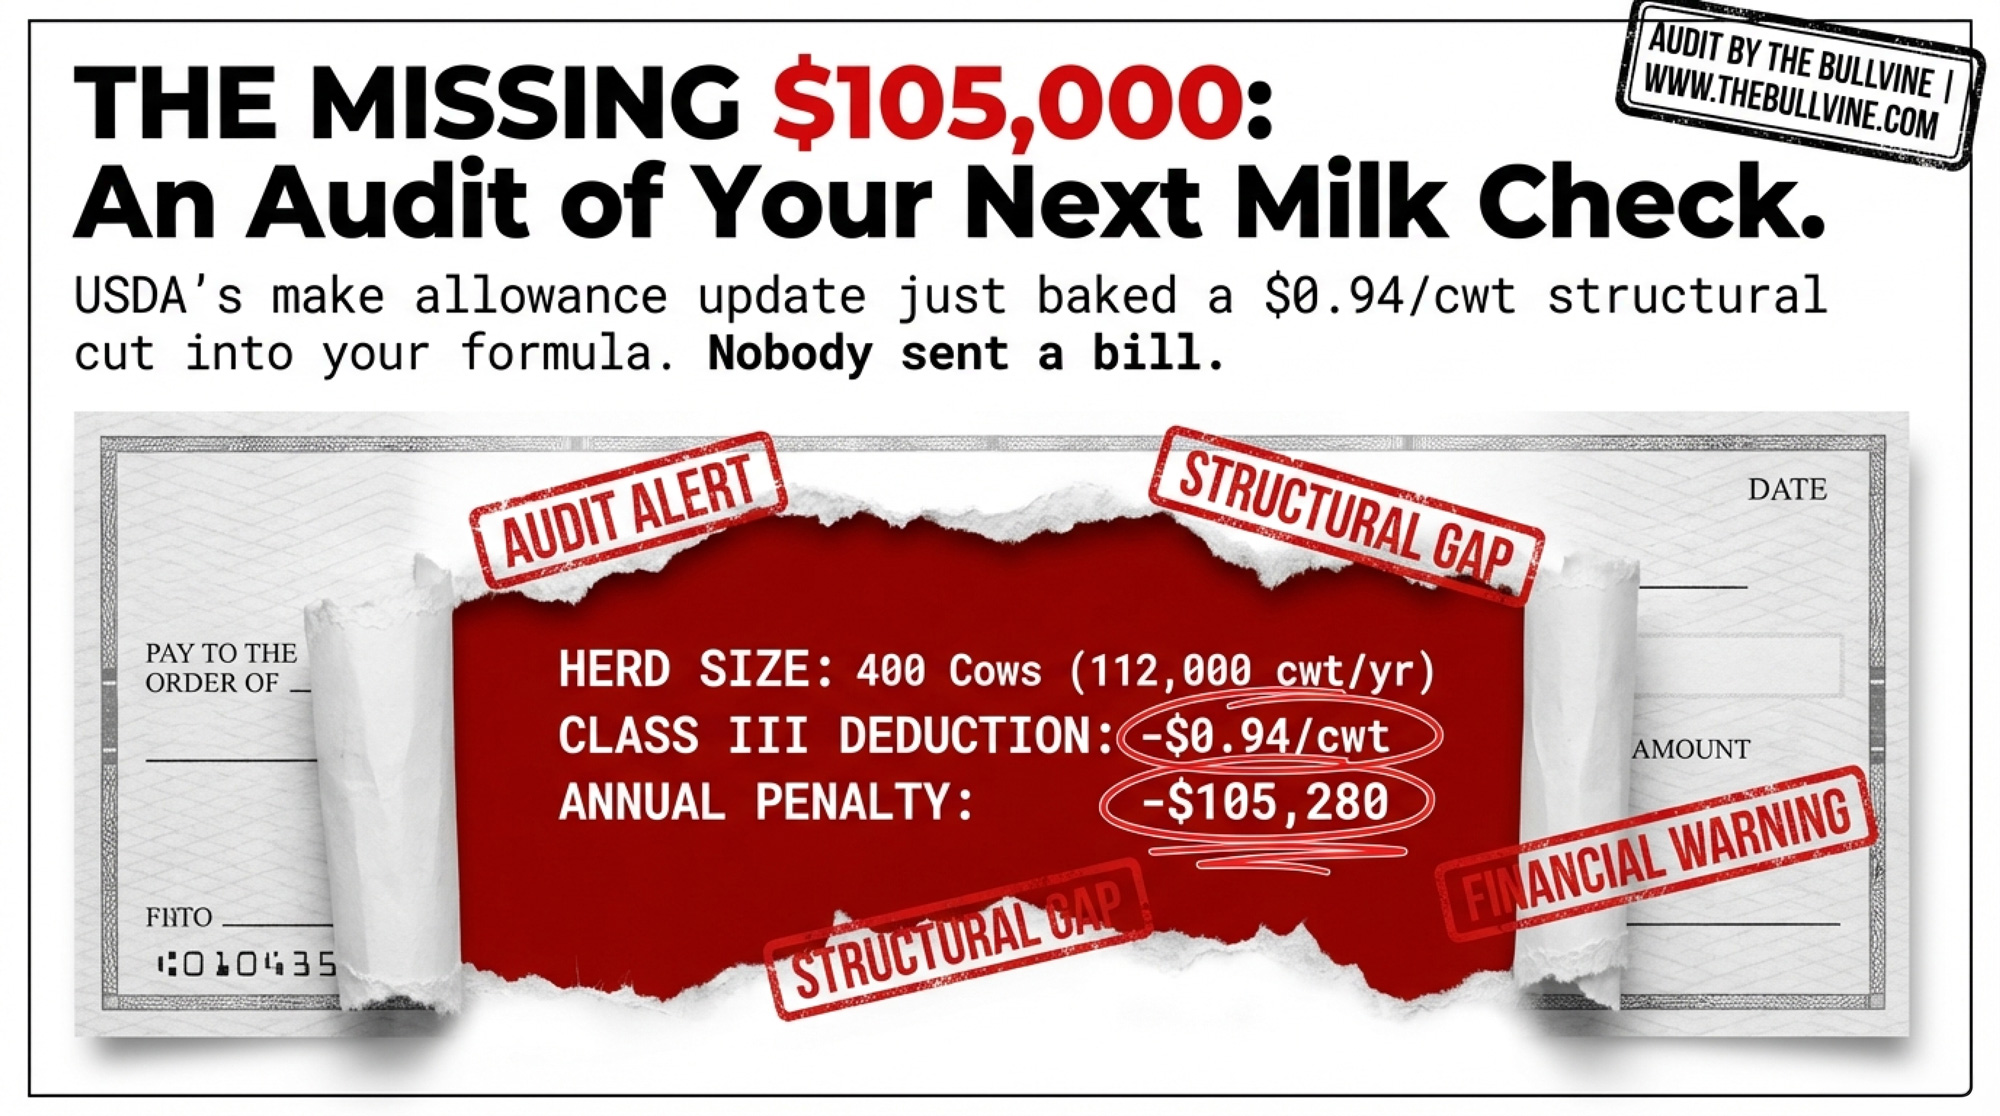
USDA’s make allowance update structurally cut Class III minimum prices by $0.94/cwt — and the mandatory survey that’s supposed to bring transparency could lock those numbers in for a decade.
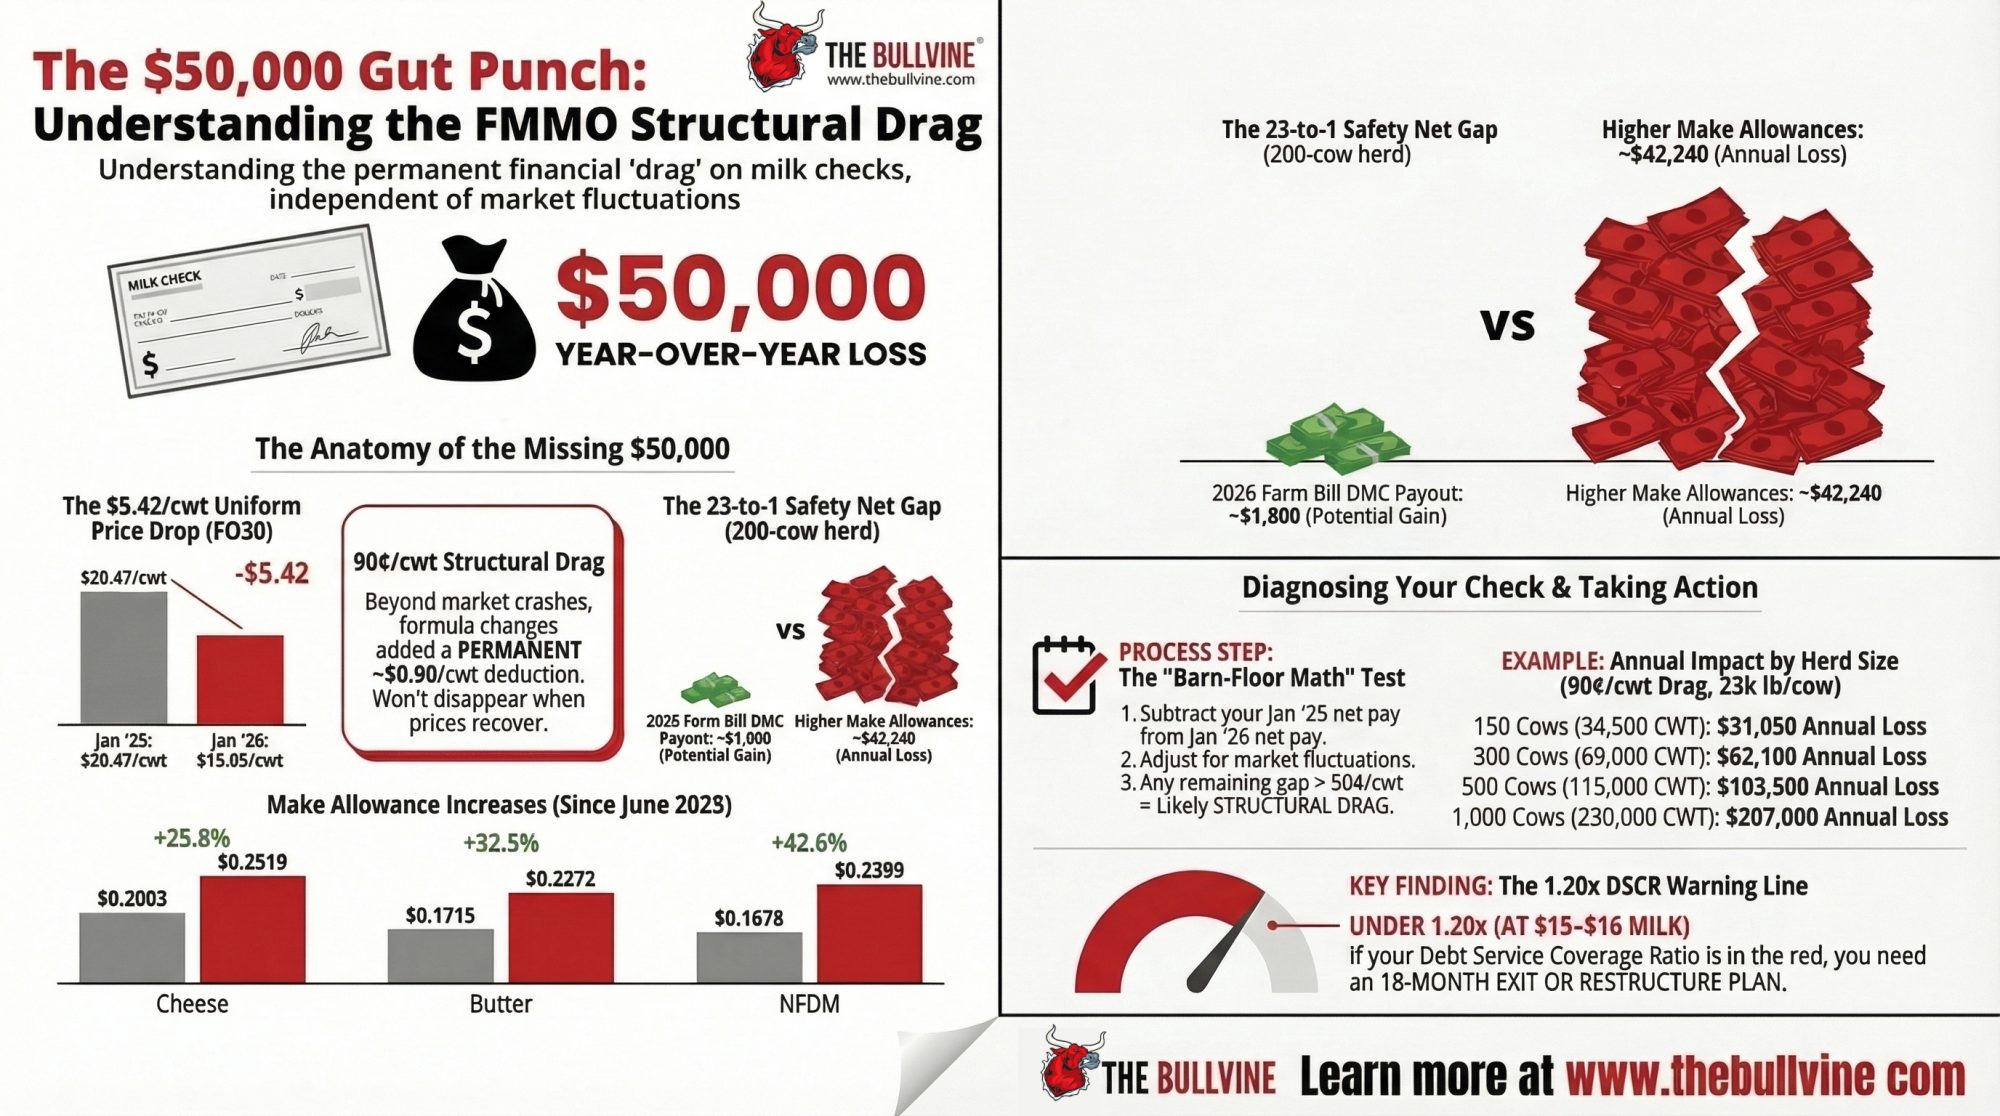
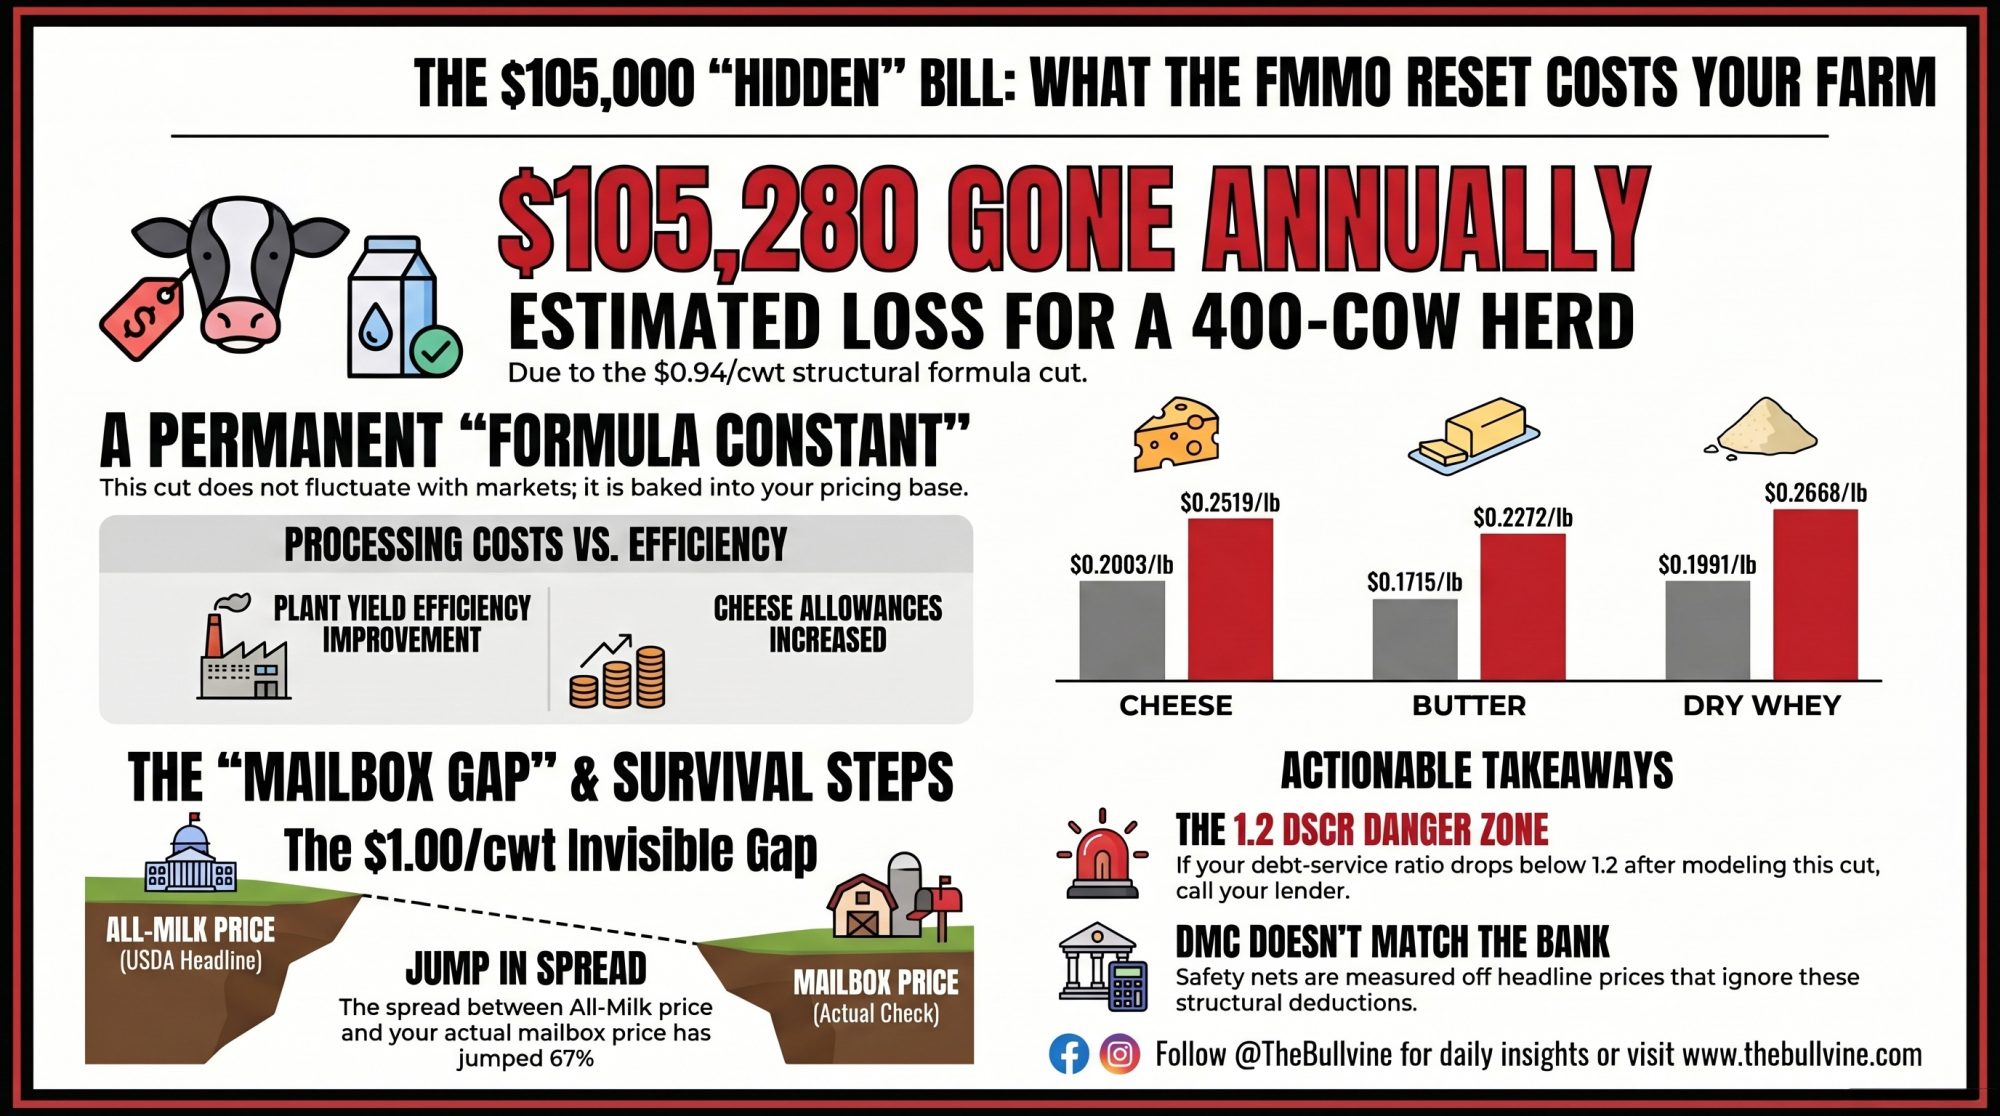
Executive Summary: USDA’s June 2025 make allowance increases baked a $0.94/cwt structural cut into every Class III milk check — not a market swing, a formula constant that hits at any commodity price. On a 400-cow herd, that’s $105,280 a year gone before your component values are even calculated. The cheese allowance alone jumped 25.8% — the first reset since 2008 — despite a 12% improvement in plant yield efficiency over that same stretch. Now add the All-Milk/mailbox gap, which has widened to roughly .00/cwt: DMC is measuring a margin your bank account doesn’t actually see. The real fight is the OBBBA’s mandatory processing cost survey, now in rulemaking, where USDA’s approach to cost categories will either audit these allowances down or lock them in for years. If your DSCR drops below 1.2 after you model this $0.94 deduction, the lender conversation needs to happen before the survey results — not after.
We ran the math ourselves — on the June 2025 FMMO change, month by month, through March 2026. Using USDA’s published pricing formulas and commodity prices from AMS Dairy Product Mandatory Reporting, The Bullvine calculated the make allowance impact independently.
The result: $0.94 per cwt stripped from every Class III milk check, and $0.87 per cwt from every Class IV check. Every single month. It doesn’t fluctuate with cheese or butter markets — it’s baked into the formula constants. For a 400‑cow Holstein herd shipping about 112,000 cwt a year, the Class III hit alone works out to $105,280 per year at standard component tests, and closer to $112,000 at actual pool test levels.
“Dairy farmers remain the only participants in the supply chain without the ability to set prices or recover costs through a built‑in mechanism,” says Laurie Fischer, CEO of the American Dairy Coalition. “In practical terms, that’s a multi-dollar deduction built into the pricing system on the front end.”
The comfortable story in 2025 was that FMMO modernization gave everyone something. The formula math says processors got a margin reset. Family herds got deeper into a hole.
Where the Money Goes Before It Reaches Your Check
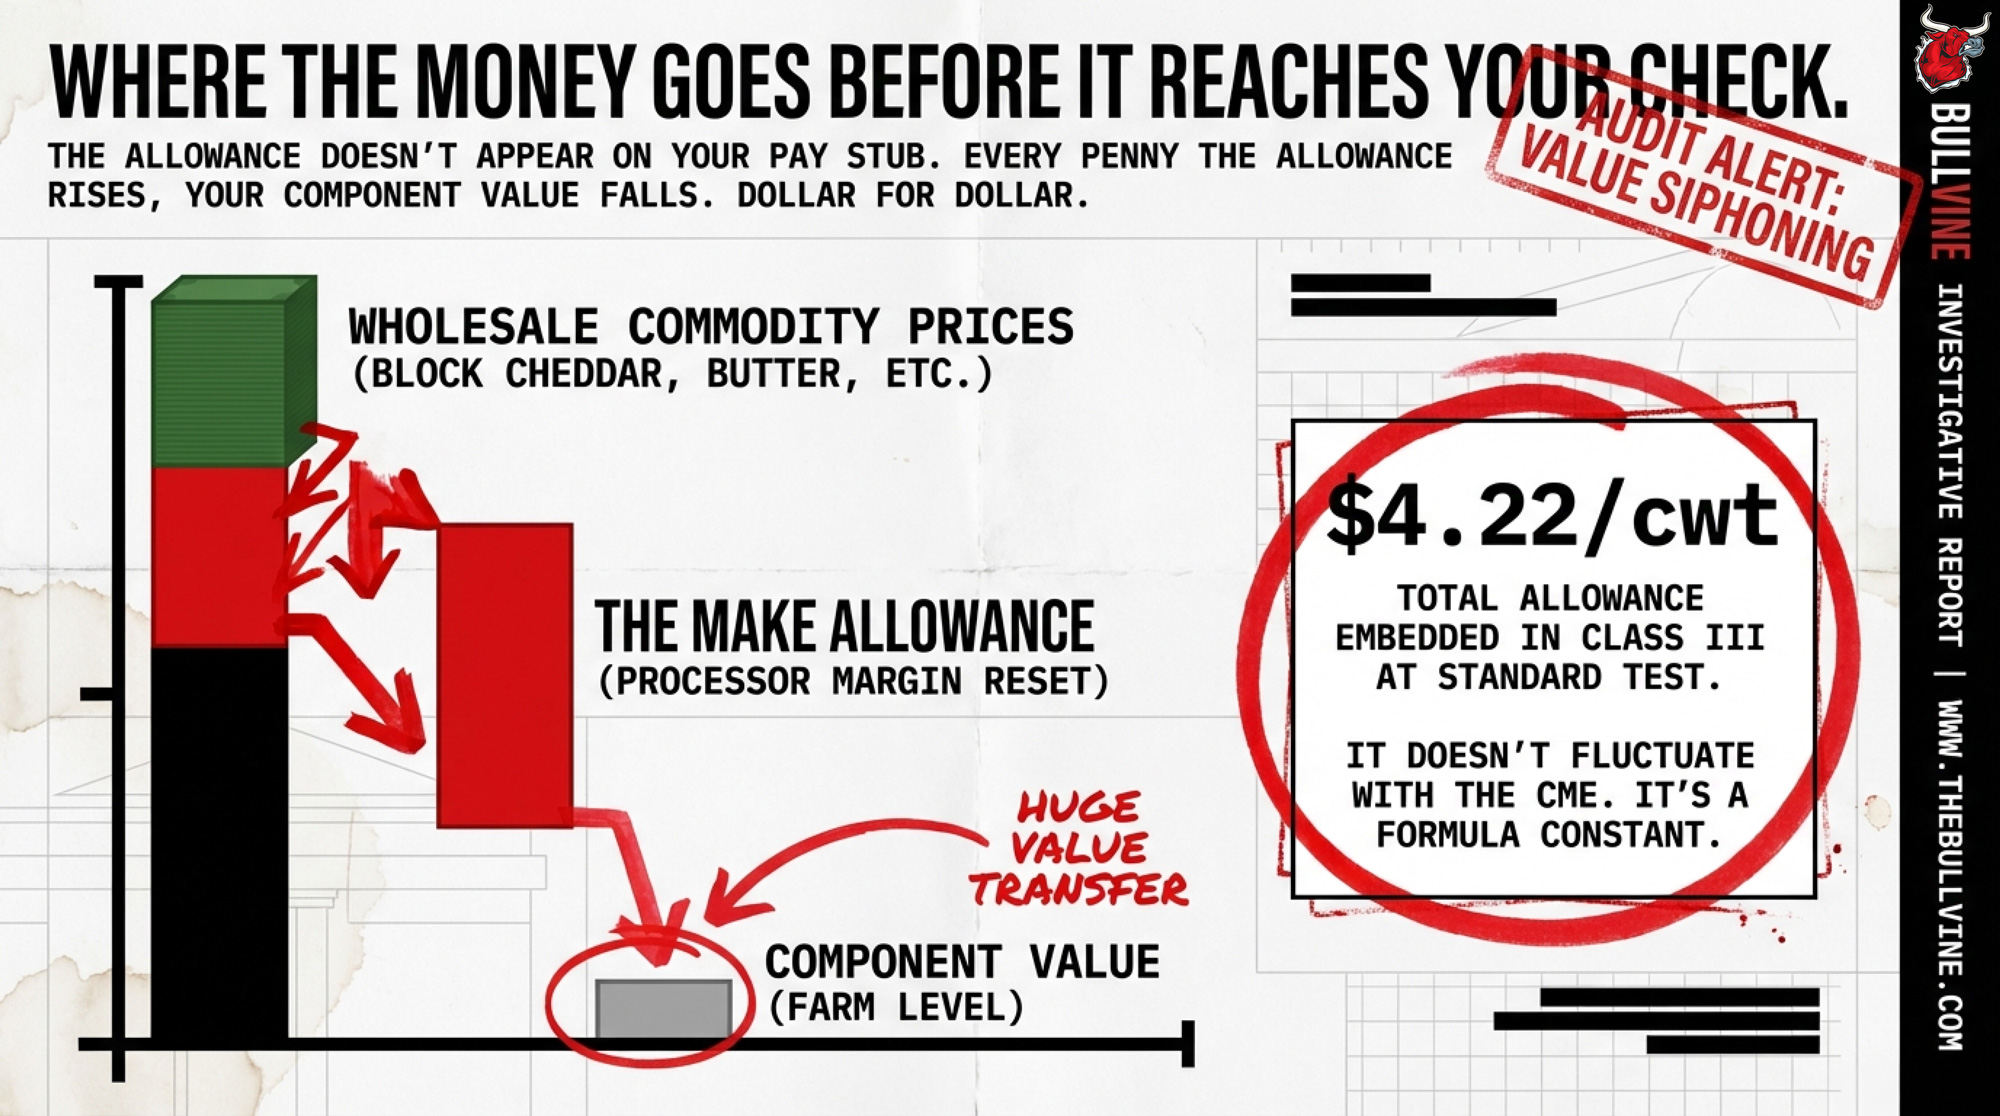
The allowance doesn’t appear on your pay stub. USDA starts with wholesale commodity prices — block cheddar, butter, nonfat dry milk, dry whey — then subtracts the make allowance before calculating component prices. Every penny the allowance rises, your component value falls. Dollar for dollar.
The June 2025 increases, finalized in rule 90 FR 6600 and effective across all 11 federal orders, were not pennies:
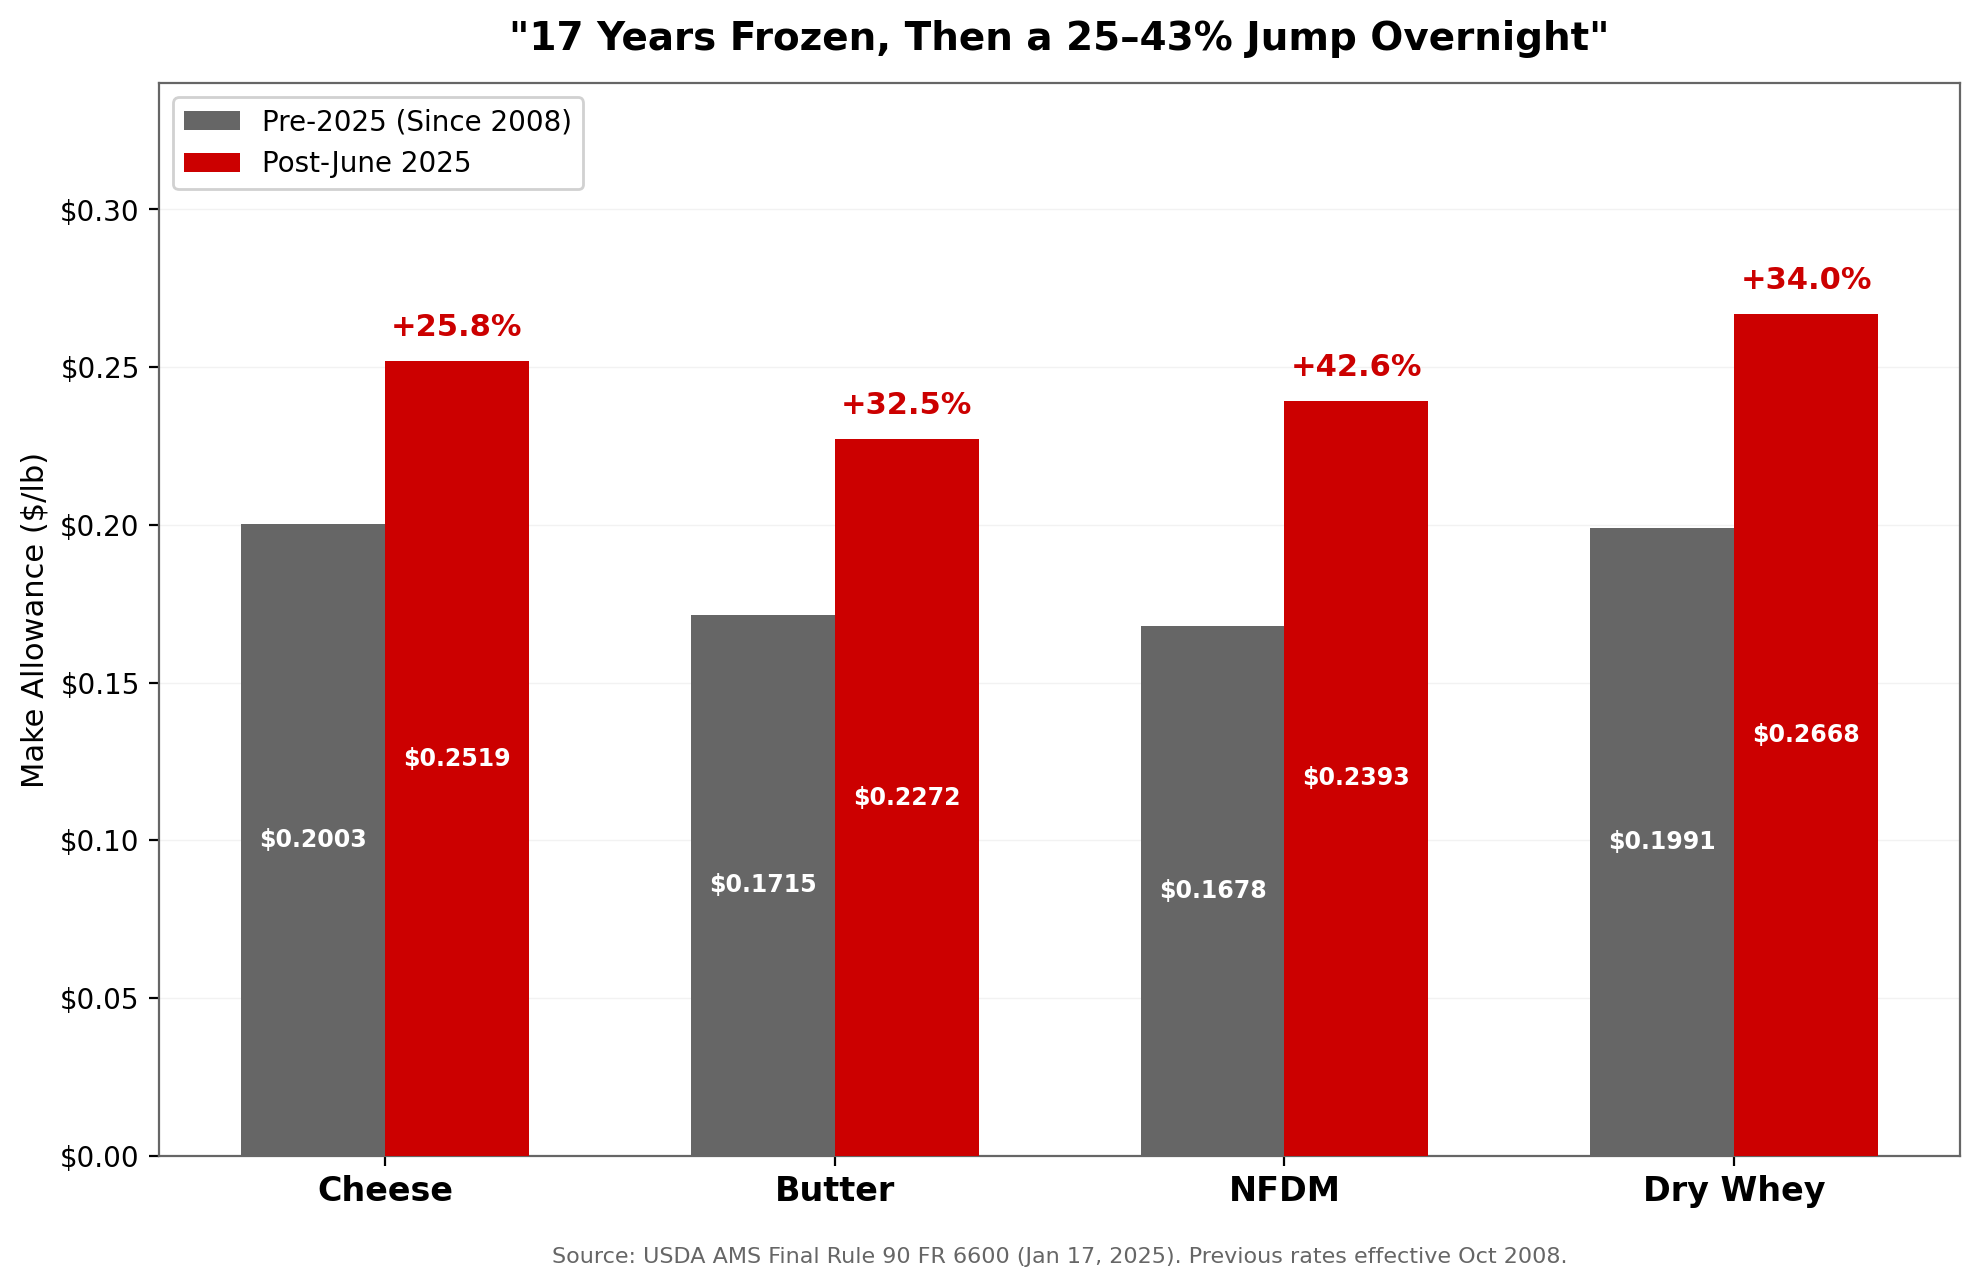
| Product | Pre‑2025 | Post‑2025 | Increase |
| Cheese | $0.2003/lb | $0.2519/lb | +25.8% |
| Butter | $0.1715/lb | $0.2272/lb | +32.5% |
| Nonfat Dry Milk | $0.1678/lb | $0.2393/lb | +42.6% |
| Dry Whey | $0.1991/lb | $0.2668/lb | +34.0% |
Source: USDA AMS Final Rule 90 FR 6600, January 17, 2025. Previous rates had been in effect since October 2008.
Run those rates through the published Class III and IV pricing formulas, and the total allowances embedded in Class III come to $4.22/cwt at standard test (3.5% BF, 3.3% protein), $3.09/cwt in Class IV. At actual pool component levels — butterfat running north of 4.0% nationally — those totals climb higher. ADC’s calculation, using published USDA NASS and AMS data at the pool-average test, puts the range at $3.22 to $5.04/cwt, directionally consistent with our independent figures.
What you feel on the farm: a protein price weaker than expected, a butterfat value that doesn’t track the CME board, and a blend that keeps missing your mental target. Almost none of it is labeled “make allowance.” All of it is influenced by it.
Who Held the Pencil — and Why It Matters Now
USDA set these allowances after a record‑long national hearing in Carmel, Indiana, from August 2023 into early 2024. The agency acknowledged it didn’t have mandatory, audited manufacturing cost surveys when it issued the final rule. It set allowances using voluntary and commissioned data, with full intent to backfill with better surveys later.
Processor groups have been clear about their side. IDFA and others warned that allowances set below actual manufacturing costs risk financial strain and potential plant closures, especially at aging facilities in high‑cost orders. Some pointed to episodes where co‑ops imposed production limits because plant capacity couldn’t keep pace — arguing that realistic make allowances were part of keeping plants open, modern, and able to accept all members’ milk. For producers in those orders, that’s not just a processor problem. A closed plant or a capped intake is a market‑access problem that lands right back on the farm.
The trade‑off is real: you gain plant stability and market access when allowances cover true manufacturing costs, but you give up milk price when those allowances overreach into specialty overhead. The formula math tells you which side of that line we’re on. Using the 2025 average Class III price of $18.01/cwt (from USDA AMS monthly class price announcements, CLS series), the $0.94/cwt structural increase represents a 5.2% reduction in the minimum regulated value of Class III milk. Under the old allowances, every one of those months would have paid producers $0.94 more per hundredweight — no commodity rally required.
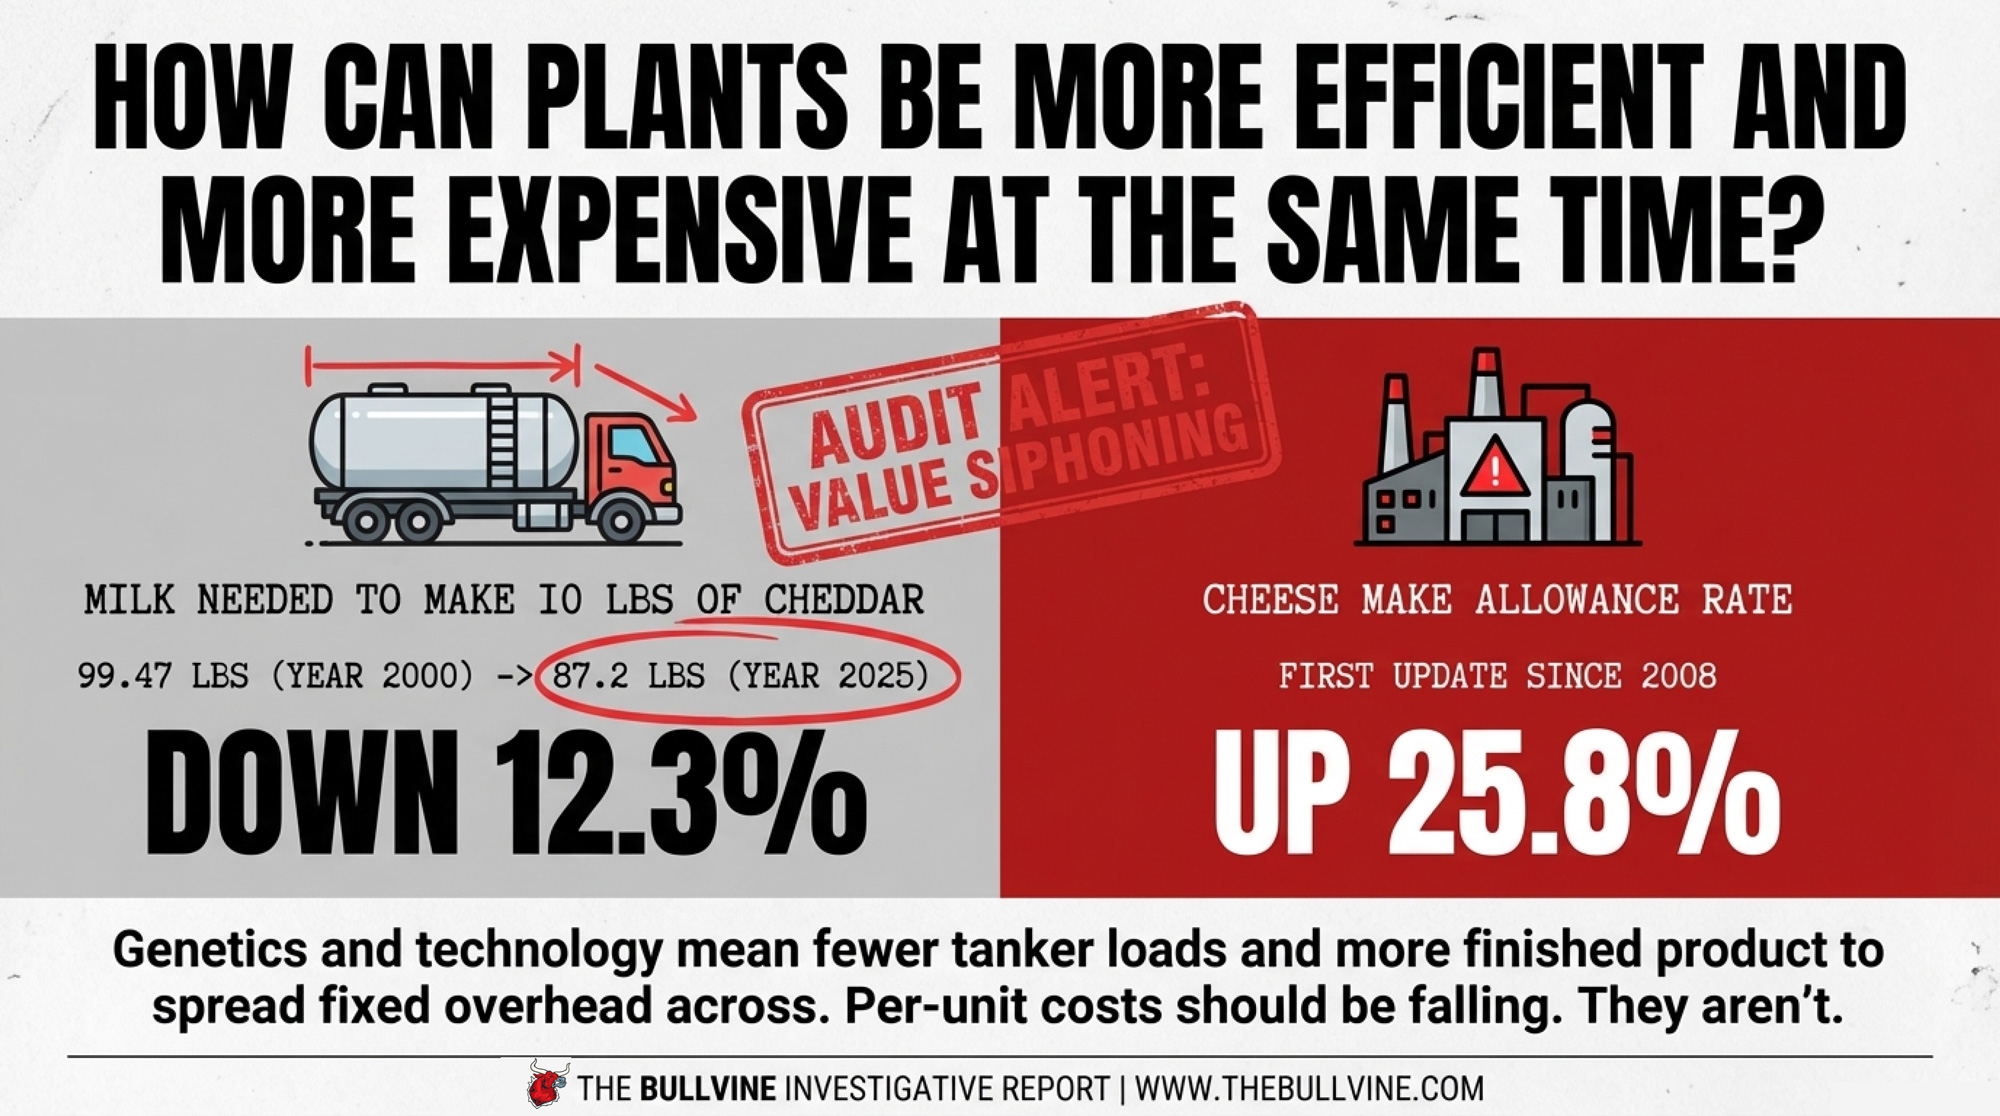
How Can Plants Be More Efficient and More Expensive at the Same Time?
Calvin Covington — retired CEO of Southeast Milk and longtime pricing expert formerly with National All‑Jersey — compiled yield data that creates the sharpest contradiction in this fight.
In 2000, it took 99.47 pounds of milk to produce 10 pounds of 38% moisture cheddar. By 2025, that dropped to 87.2 pounds — a 12.3% improvement driven by genetics pushing components higher and decades of plant‑level technology. Independent analysis by CoBank’s lead dairy economist Corey Geiger, using USDA and FMMO data, corroborates this trend: cheese yield per hundredweight grew from 10.14 to 11.24 pounds between 2000 and 2022, a 10.8% gain. Extrapolating that trajectory through 2025’s record component levels — national butterfat averaged 4.15%, a new high — Covington’s endpoint falls well within the expected range. Fewer tanker loads. Less volume through receiving and storage. More finished products to spread fixed overhead across.
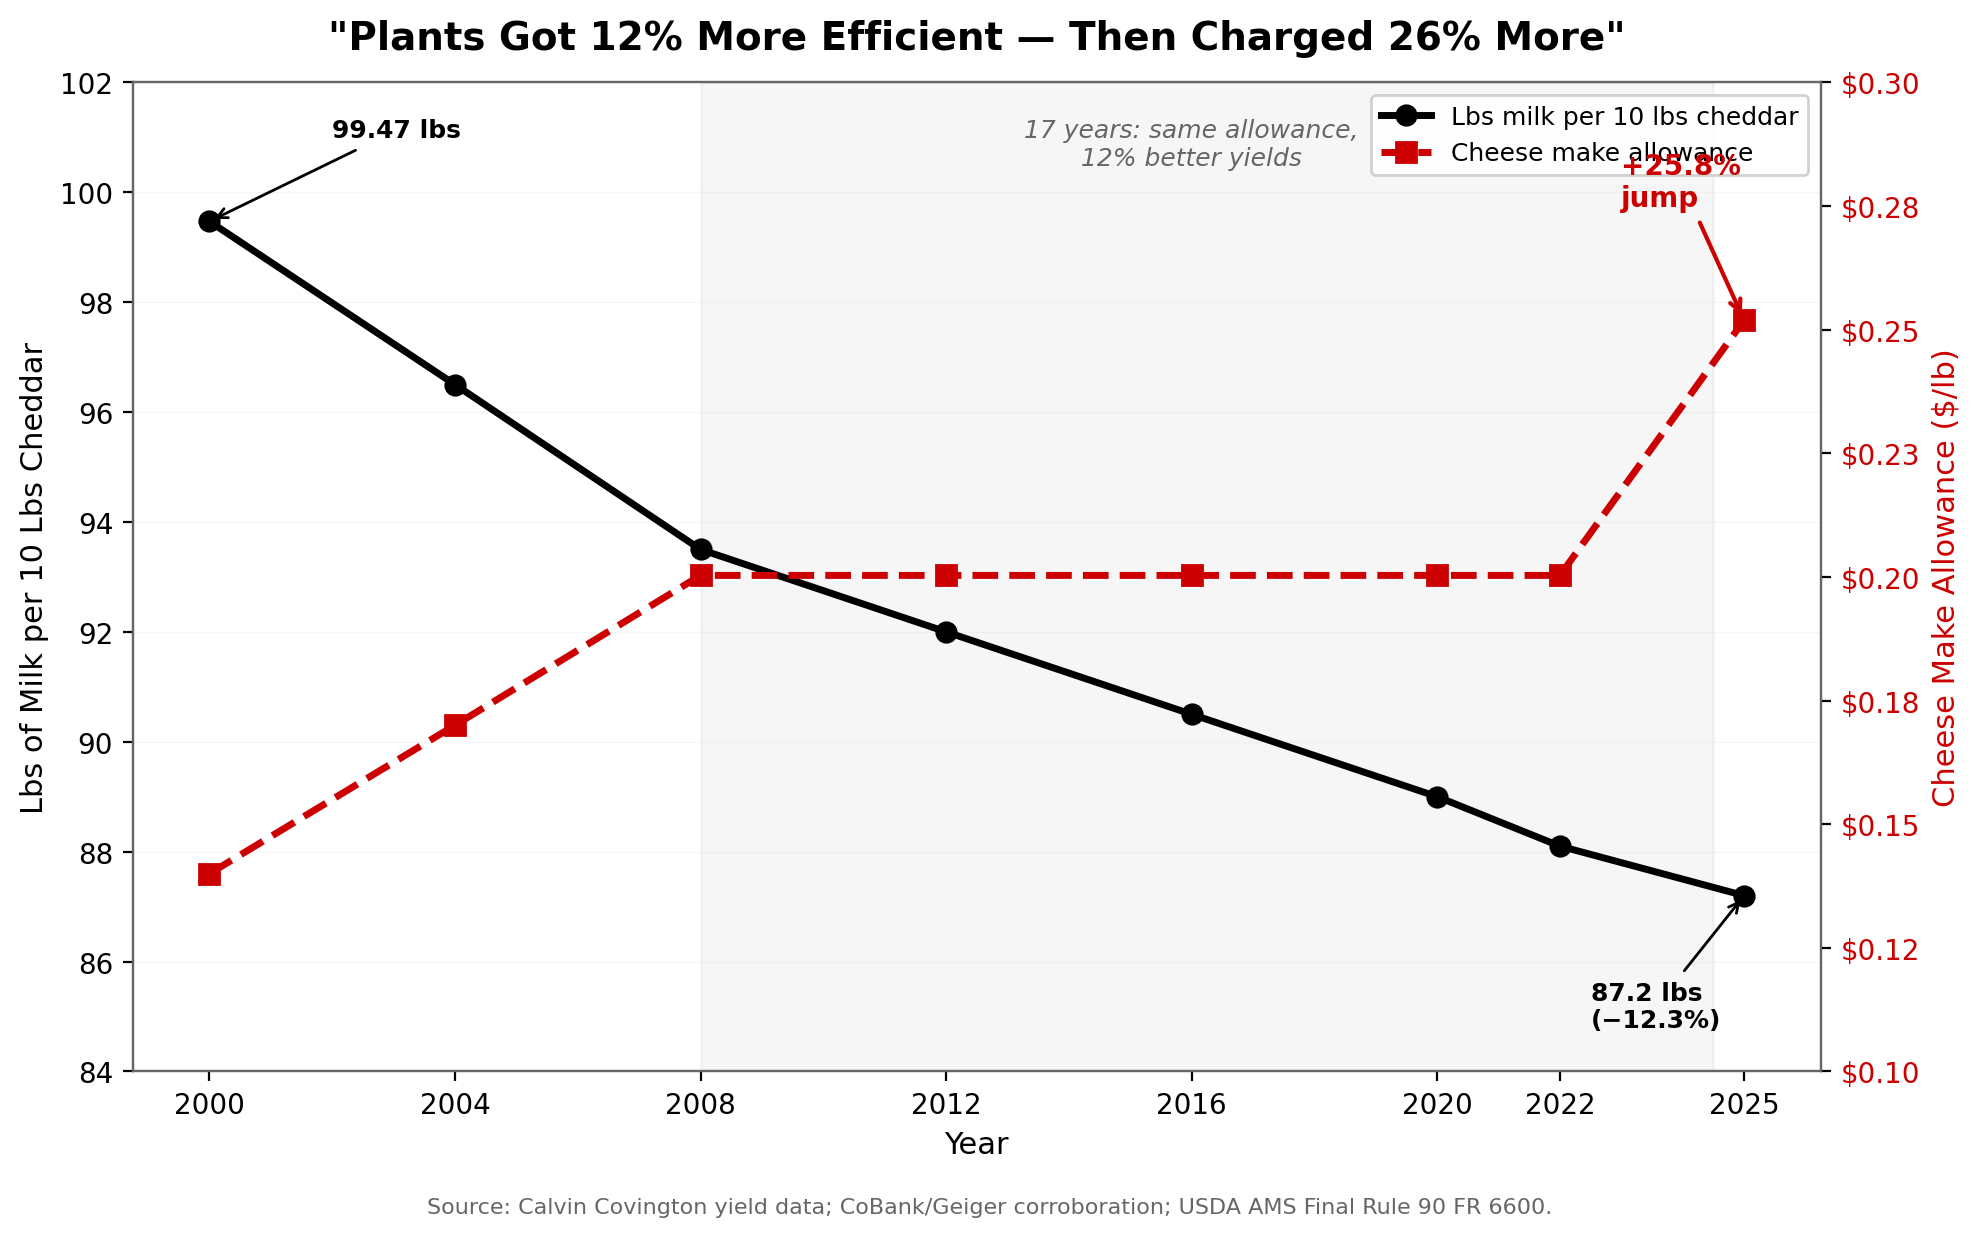
If per‑unit costs should be falling with those efficiency gains, why did the cheese make allowance jump 25.8%? NFDM, 42.6%?
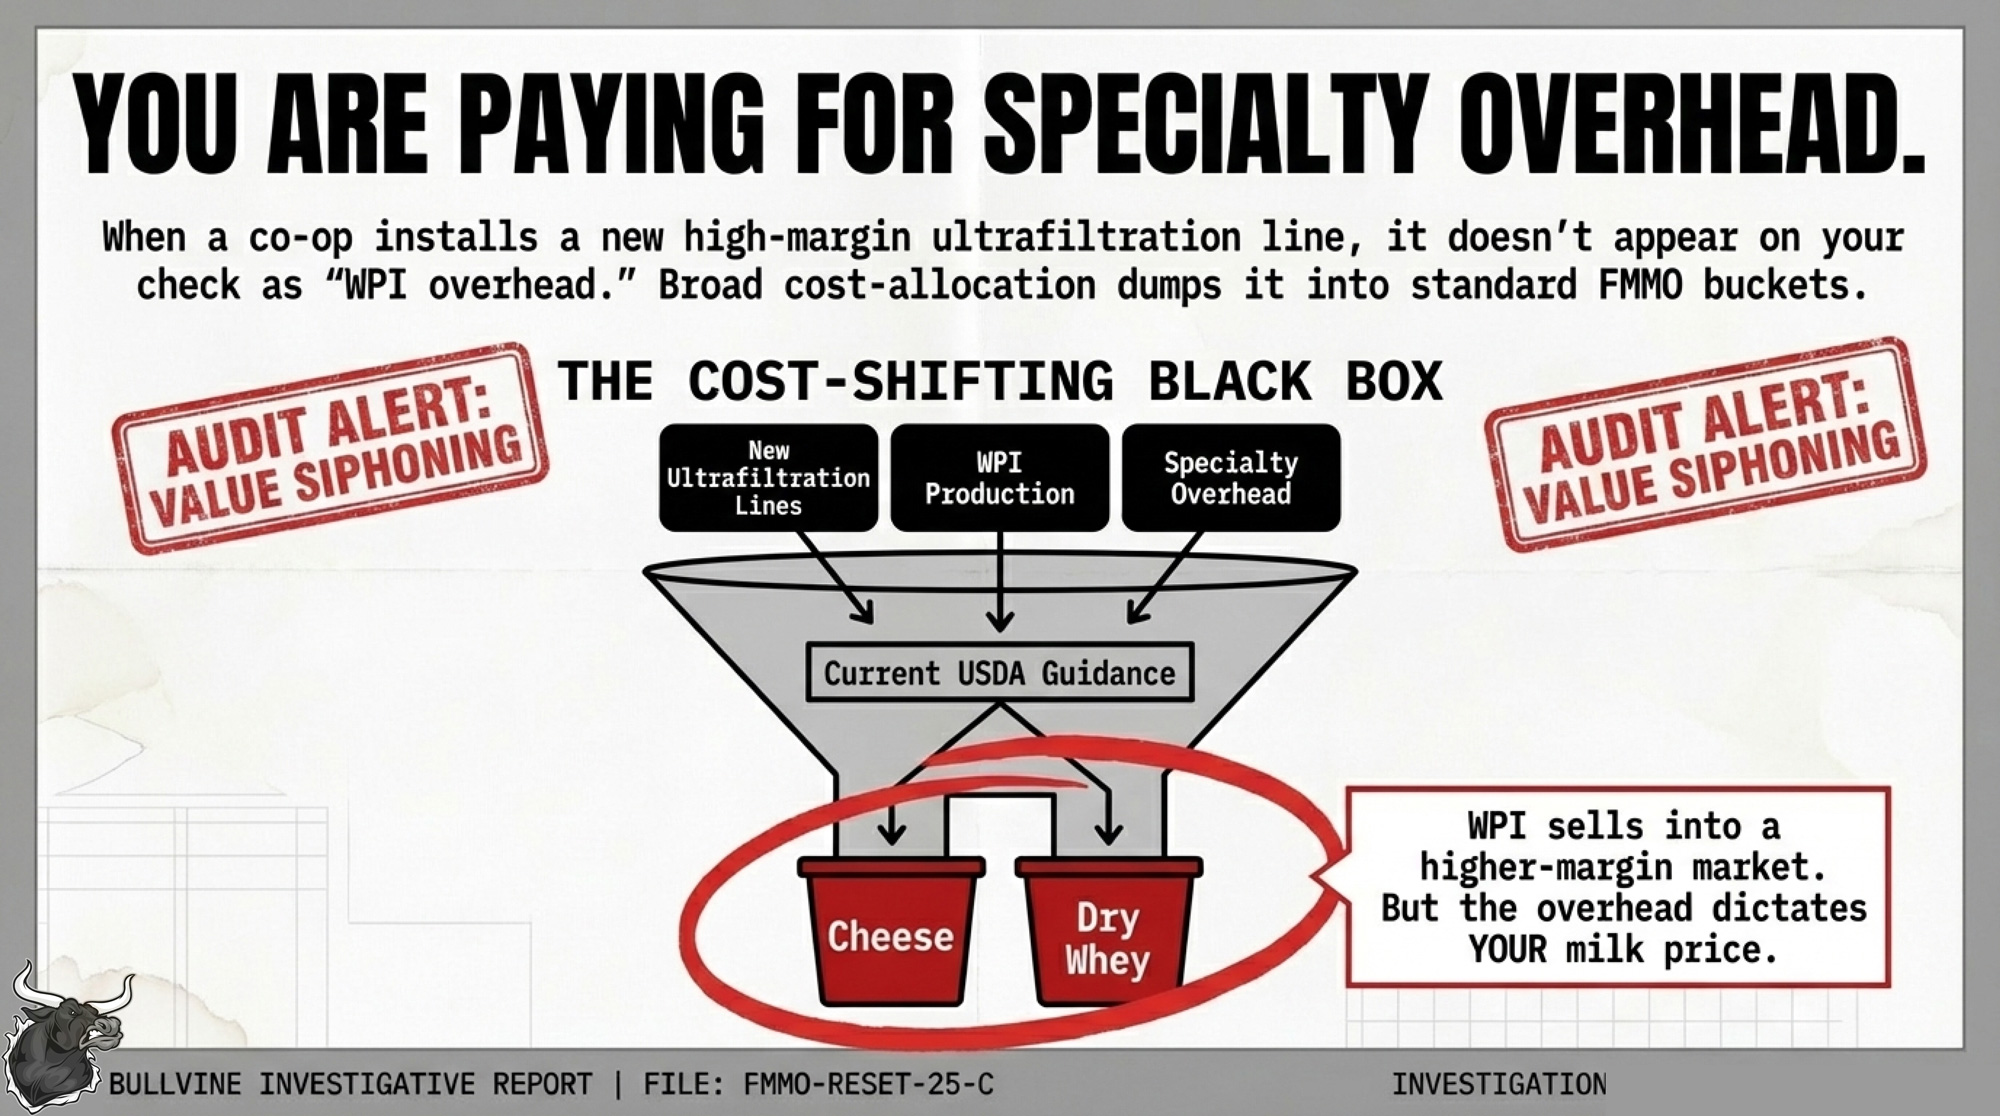
Nobody’s arguing that plants haven’t seen real inflation in labor, energy, and compliance. The question is whether the mandatory survey will separate those costs from overhead tied to high‑margin specialty products — WPI, MPC, ultrafiltered milks — that don’t determine your milk price.
When a co‑op installs a new ultrafiltration line, that capital expenditure doesn’t appear on your check as “WPI overhead.” It shows up in the total plant cost. If overhead is allocated broadly across all product streams, some of it lands in the cheese and dry whey buckets that feed the FMMO formulas — even though WPI sells into a completely different, higher‑margin market.
ADC calls this “cost shifting.” Processors say their allocation methods follow current USDA guidance. That’s exactly why the survey definitions and allocation rules matter: what USDA writes now will determine which costs land in your make allowance for years.
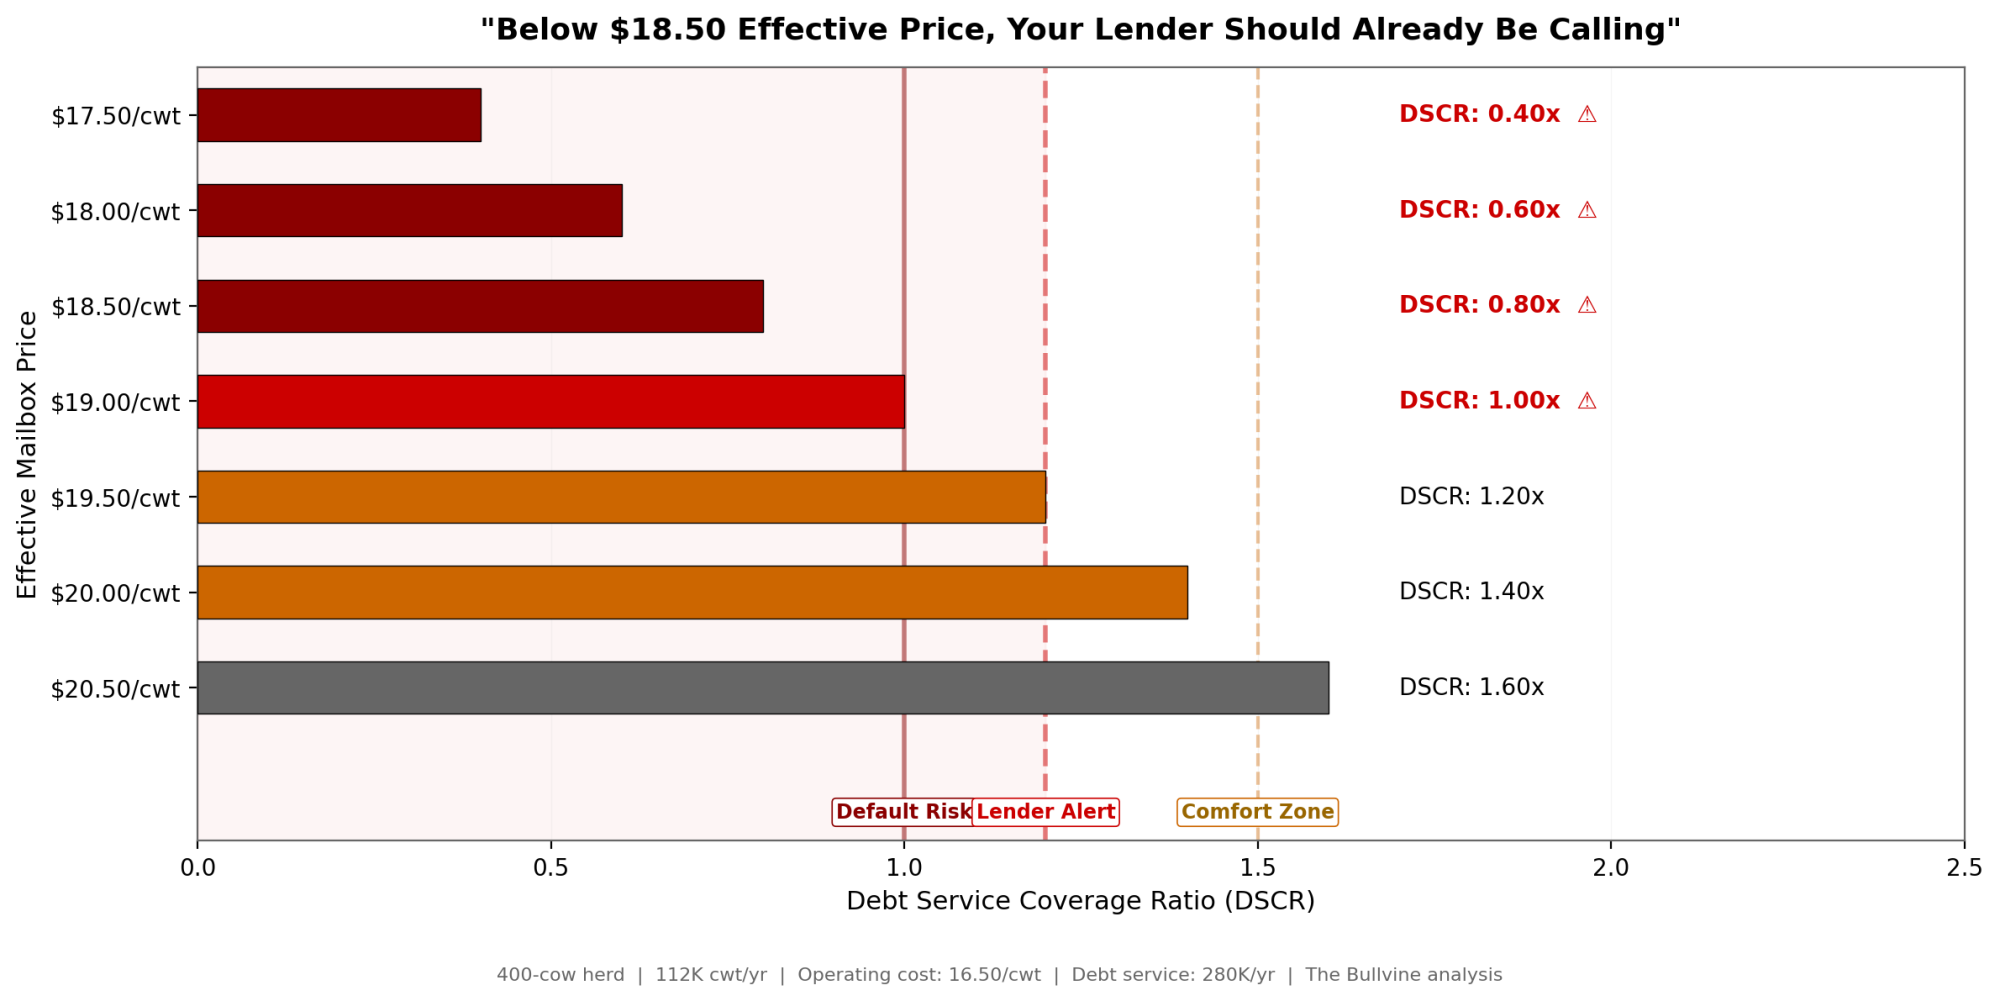
⚠️ Lender Alert: The DSCR Threshold You Can’t Ignore
Before the playbook — one number that should stop you cold.
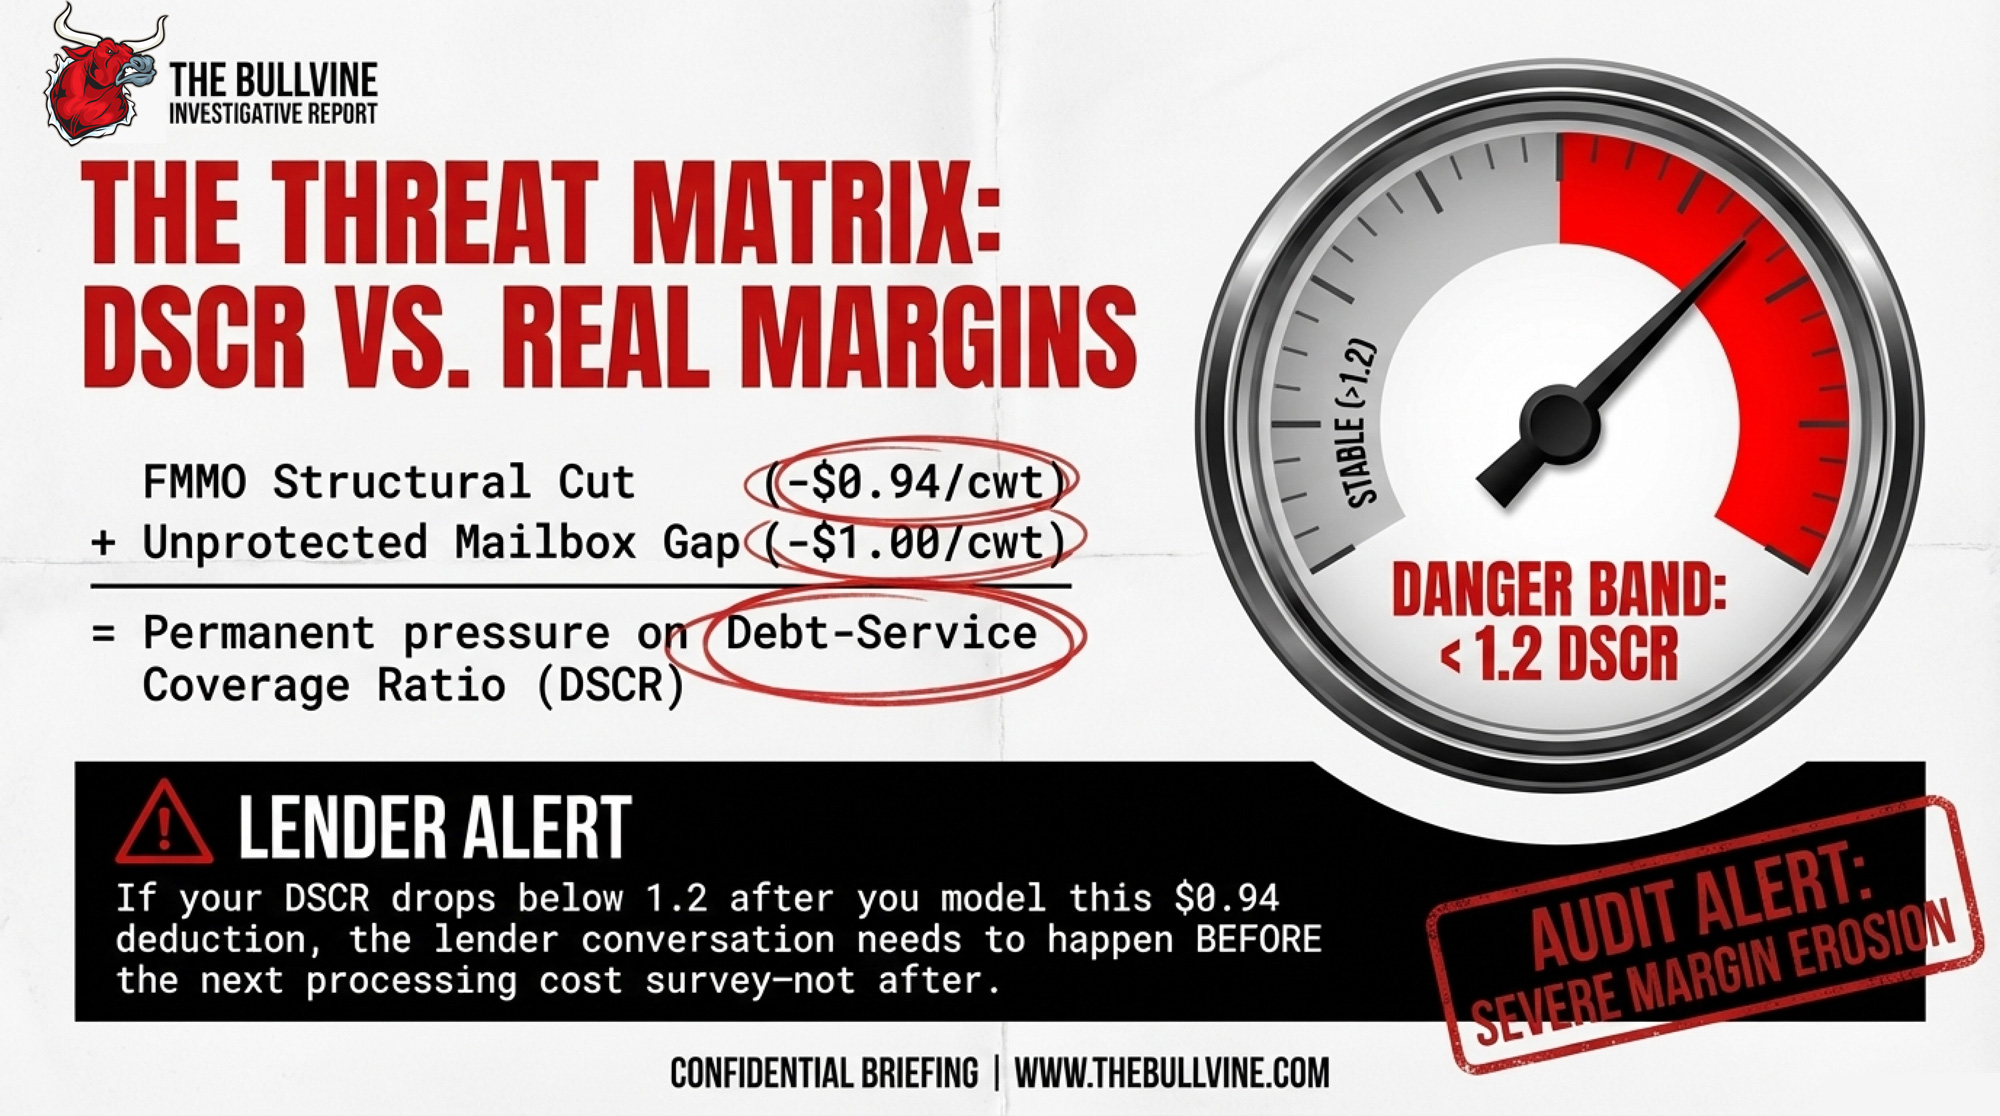
If your debt‑service coverage ratio stays above 1.5 after you model a $0.94/cwt hit from structural make allowance deductions, you’ve got room to absorb survey surprises. Below 1.2 — a level extension and lender materials commonly flag as a minimum comfort zone for leveraged dairies — you’re in a risk band that justifies a hard conversation with your lender before the next survey results lock in.
The 2025 allowances already shifted $0.94/cwt from every Class III check and $0.87/cwt from every Class IV check — permanently, at any commodity price level. Fischer sees a real possibility that if the new survey rules don’t narrow cost‑allocation practices, a future update could push allowances higher again.
That’s an outlook, not a guarantee. But your capital plan shouldn’t pretend it’s impossible.
Why DMC Is Measuring a Margin You Don’t Actually Receive
Dairy Margin Coverage calculates your margin by subtracting a formula feed cost from the NASS All‑Milk price — a gross number that ignores make allowance deductions, hauling, co‑op retains, and basis. Your actual realized price, the mailbox price, runs lower.
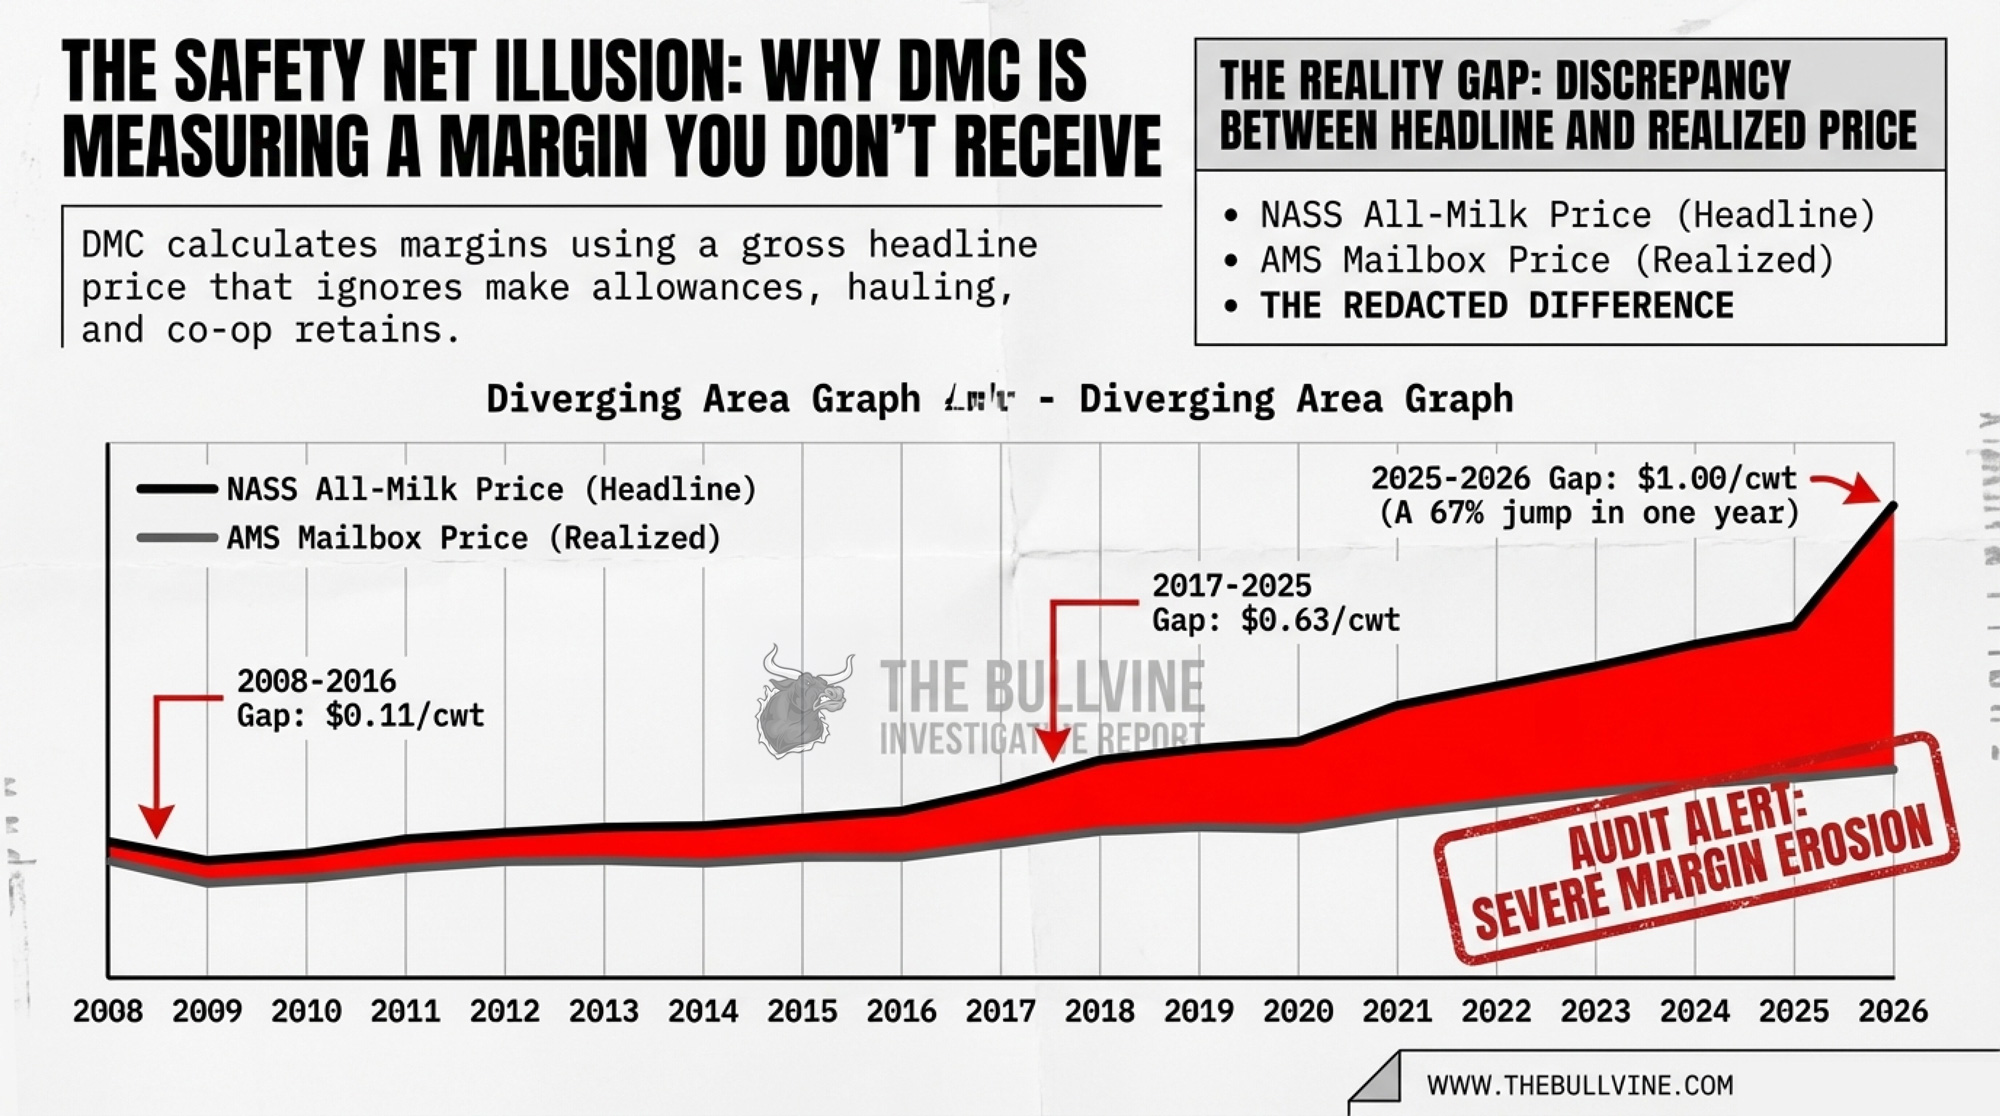
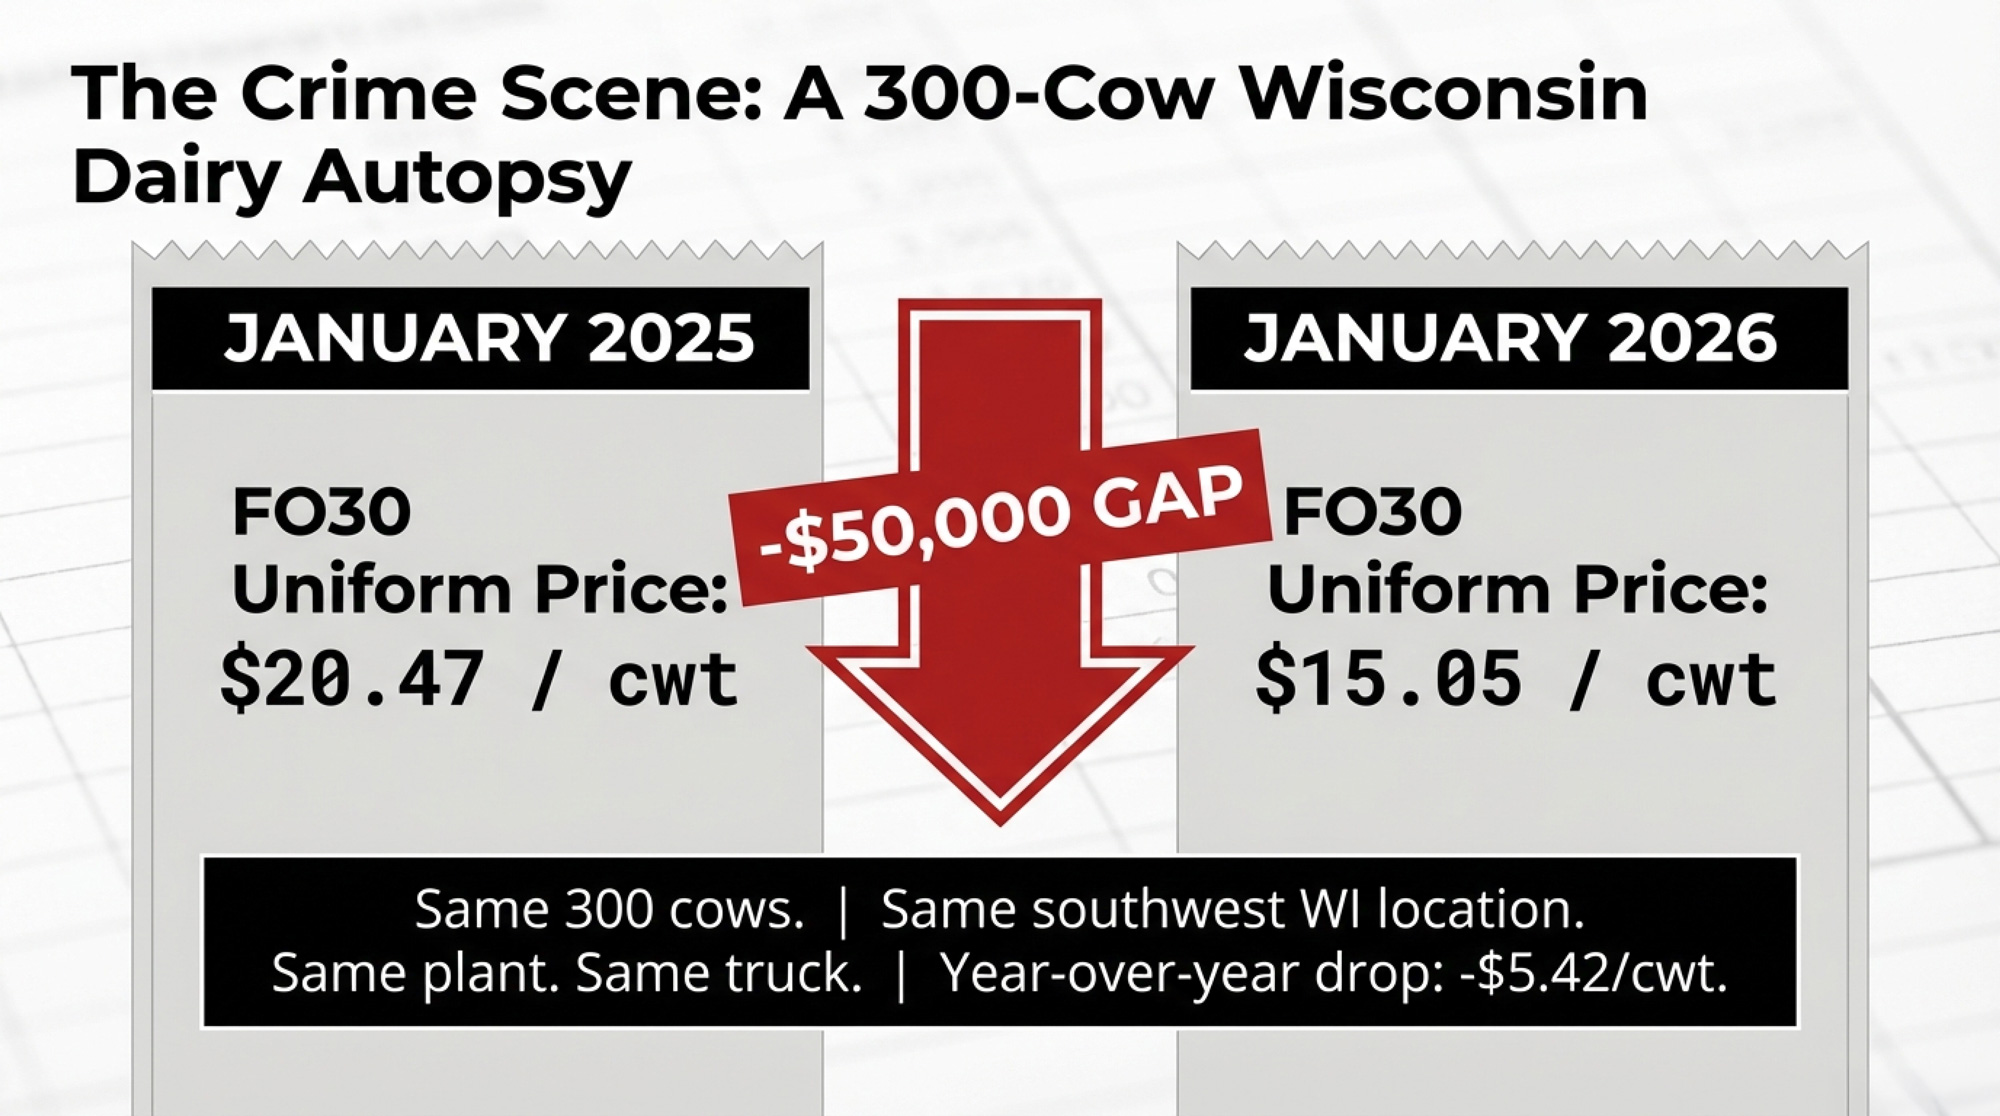
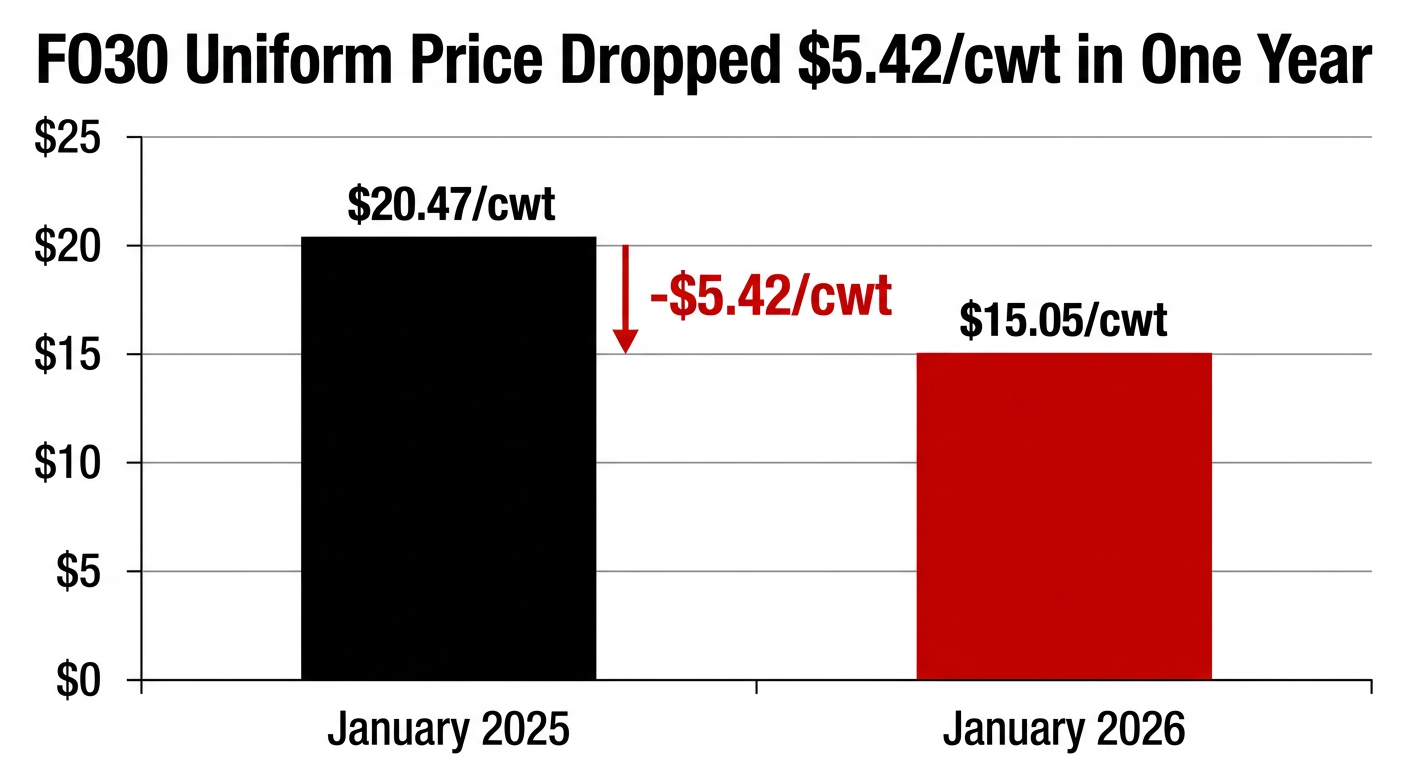
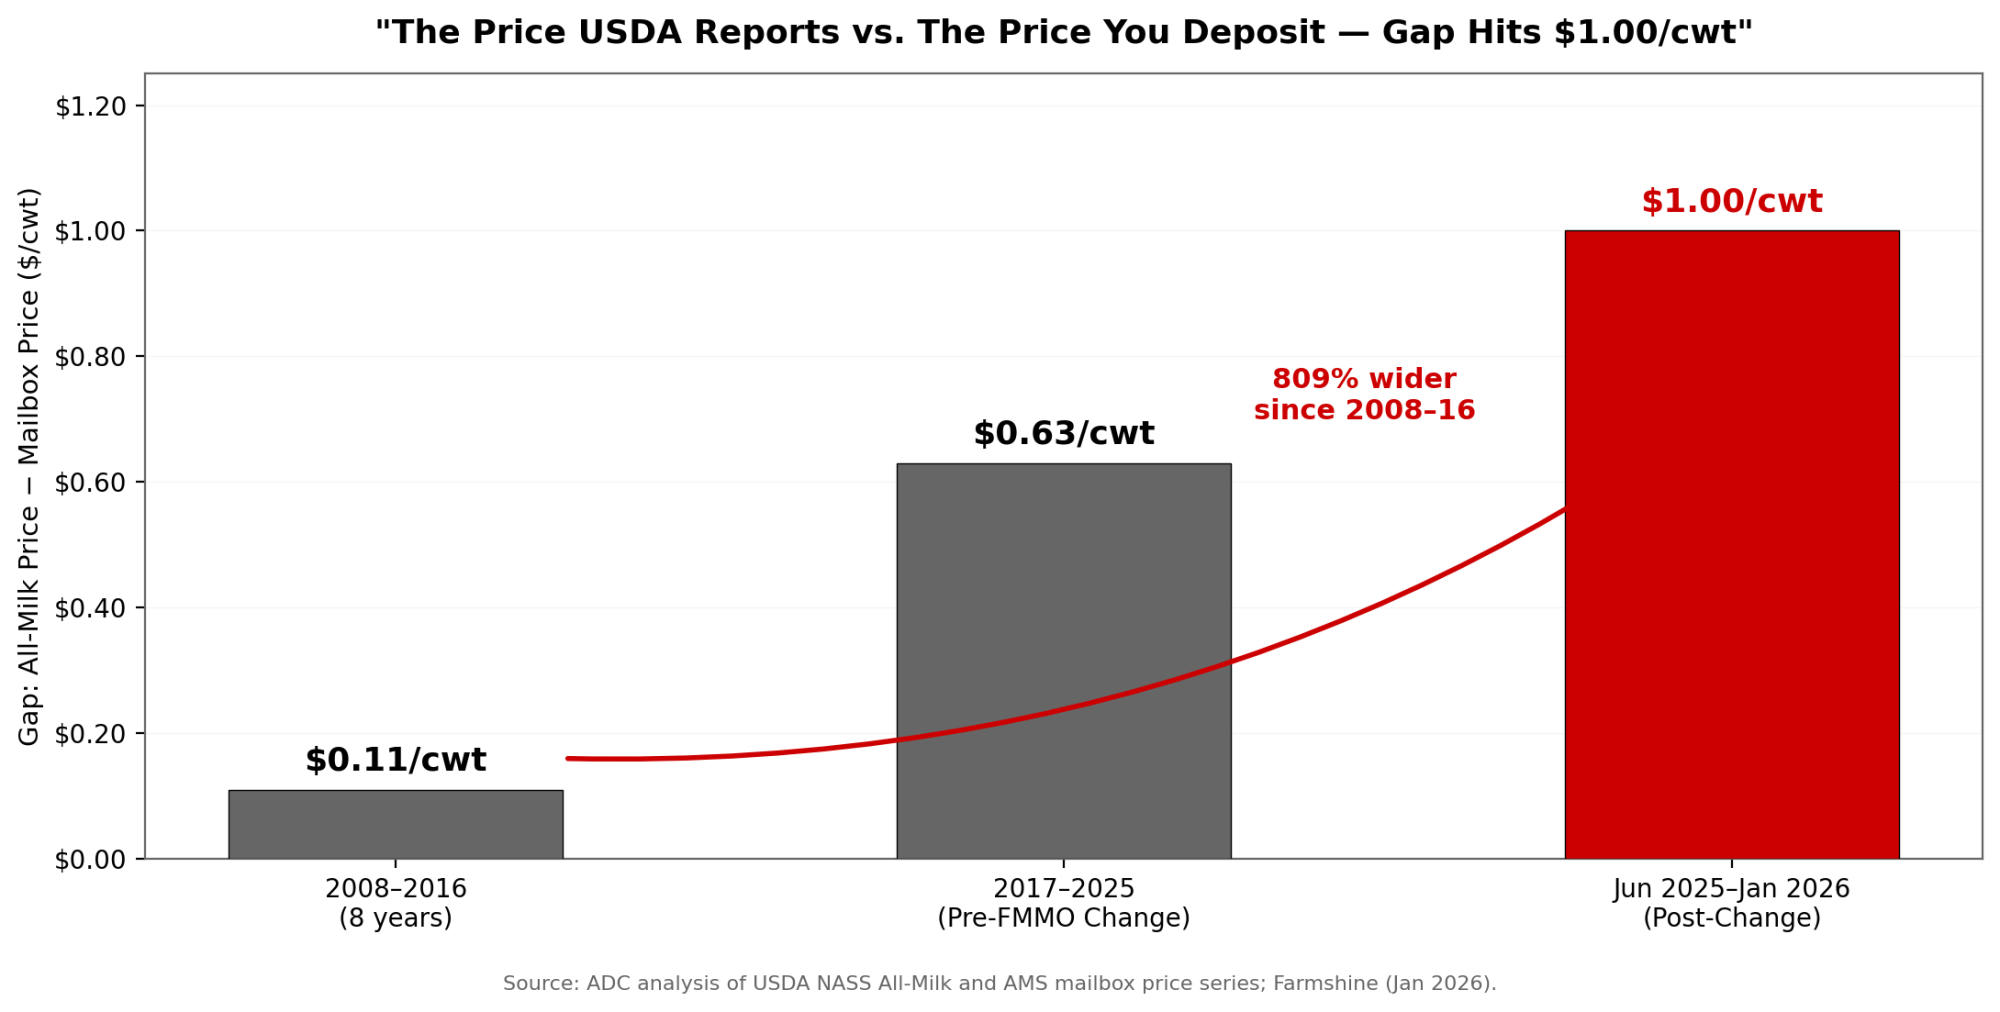
ADC compared published USDA NASS All‑Milk and AMS mailbox price series and found the gap has quietly widened: about $0.11/cwt in 2008–2016, $0.63/cwt in 2017–2025, and roughly $1.00/cwt from June 2025 to January 2026 — a 67% jump in one year. The most recent trend is corroborated by Farmshine’s January 2026 report, which confirmed that the USDA mailbox price had plummeted by $5.23 from a year earlier. For additional context, Covington’s own 2019 analysis of the same USDA mailbox data in Progressive Dairy showed the 2018 weighted national average mailbox price at $15.72/cwt — with NASS All‑Milk for that year averaging approximately $16.26/cwt, a gap of roughly $0.54/cwt that falls within ADC’s reported $0.63 average for the 2017–2025 window.
AFBF economist Daniel Munch notes that DMC has distributed roughly $2.7 billion in net support since 2019, but total production costs reached about $23.65/cwt in 2024 — meaning many producers were underwater even when DMC margins sat above trigger levels. OBBBA raised Tier I coverage from 5 million to 6 million pounds and created a 25% premium discount for multiyear enrollment (2026–2031), but it didn’t change the All‑Milk margin calculation itself.
Your safety net is being measured off a headline price that’s drifting farther from what actually hits your bank account. And the 2025 allowance changes are a big reason why.
What Does a $0.94/cwt Make Allowance Hit Mean for a 400‑Cow Herd?
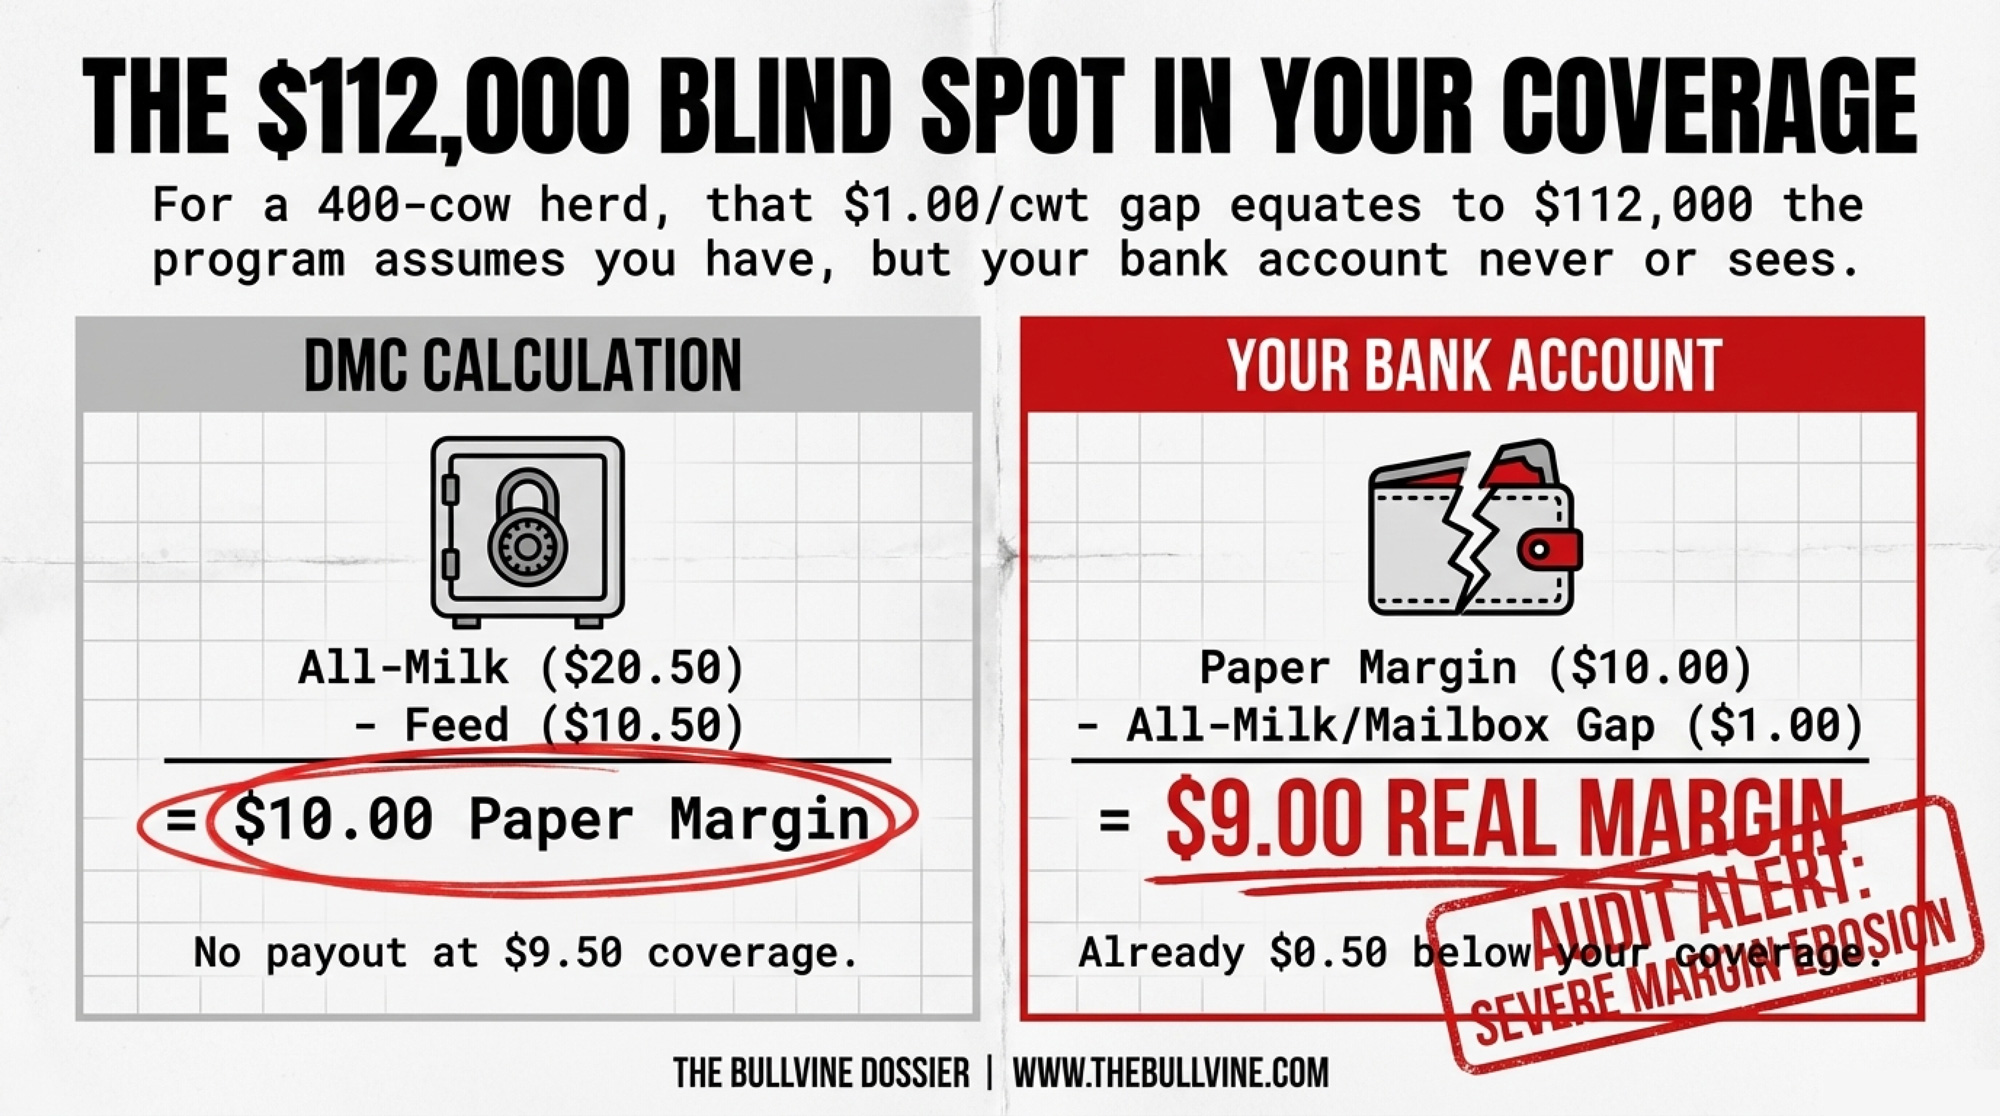
- Herd: 400 cows, 28,000 lb/cow/year ≈ , 112,000 cwt
- Scenario: All‑Milk at $20.50/cwt, formula feed at $10.50/cwt
DMC sees a $10.00/cwt margin — no payment at $9.50 coverage.
But with a $1.00/cwt All‑Milk/mailbox gap:
- Mailbox: ~$19.50/cwt → Real margin: $9.00/cwt — already $0.50 below your coverage
- Annual unprotected gap: 112,000 × $1.00 = ~$112,000 the program assumes you have, but your bank account doesn’t
Tighten it. All‑Milk drops to $19.75, feed stays at $10.50:
- DMC margin: $9.25/cwt → 25¢ indemnity at $9.50 coverage
- Mailbox: ~$18.75 → Real margin: $8.25/cwt — a full $1.25 below the margin you insured
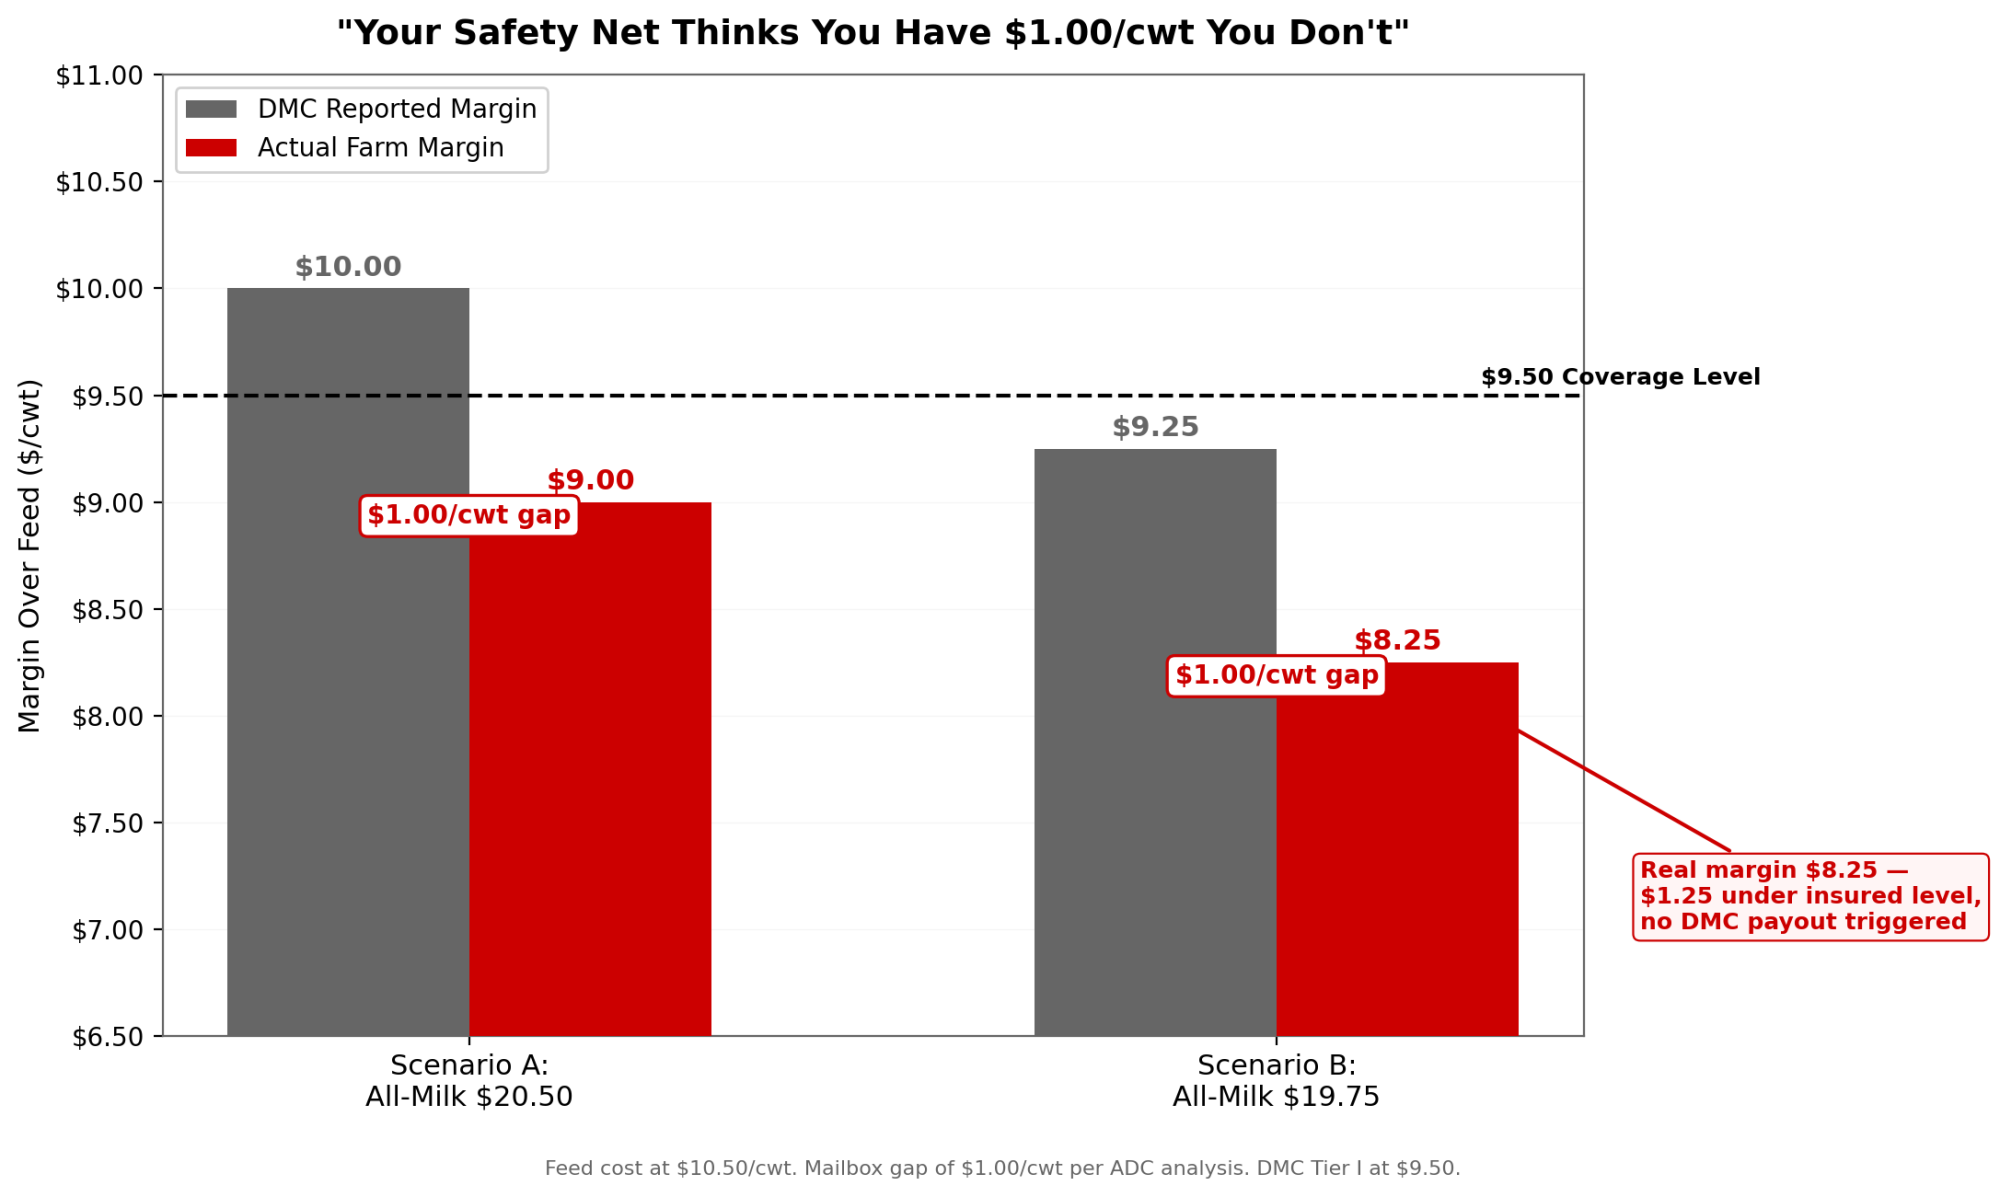
Same herd. Same feed. Same coverage. The only variable: the spread between a national headline price and what actually hits your account.
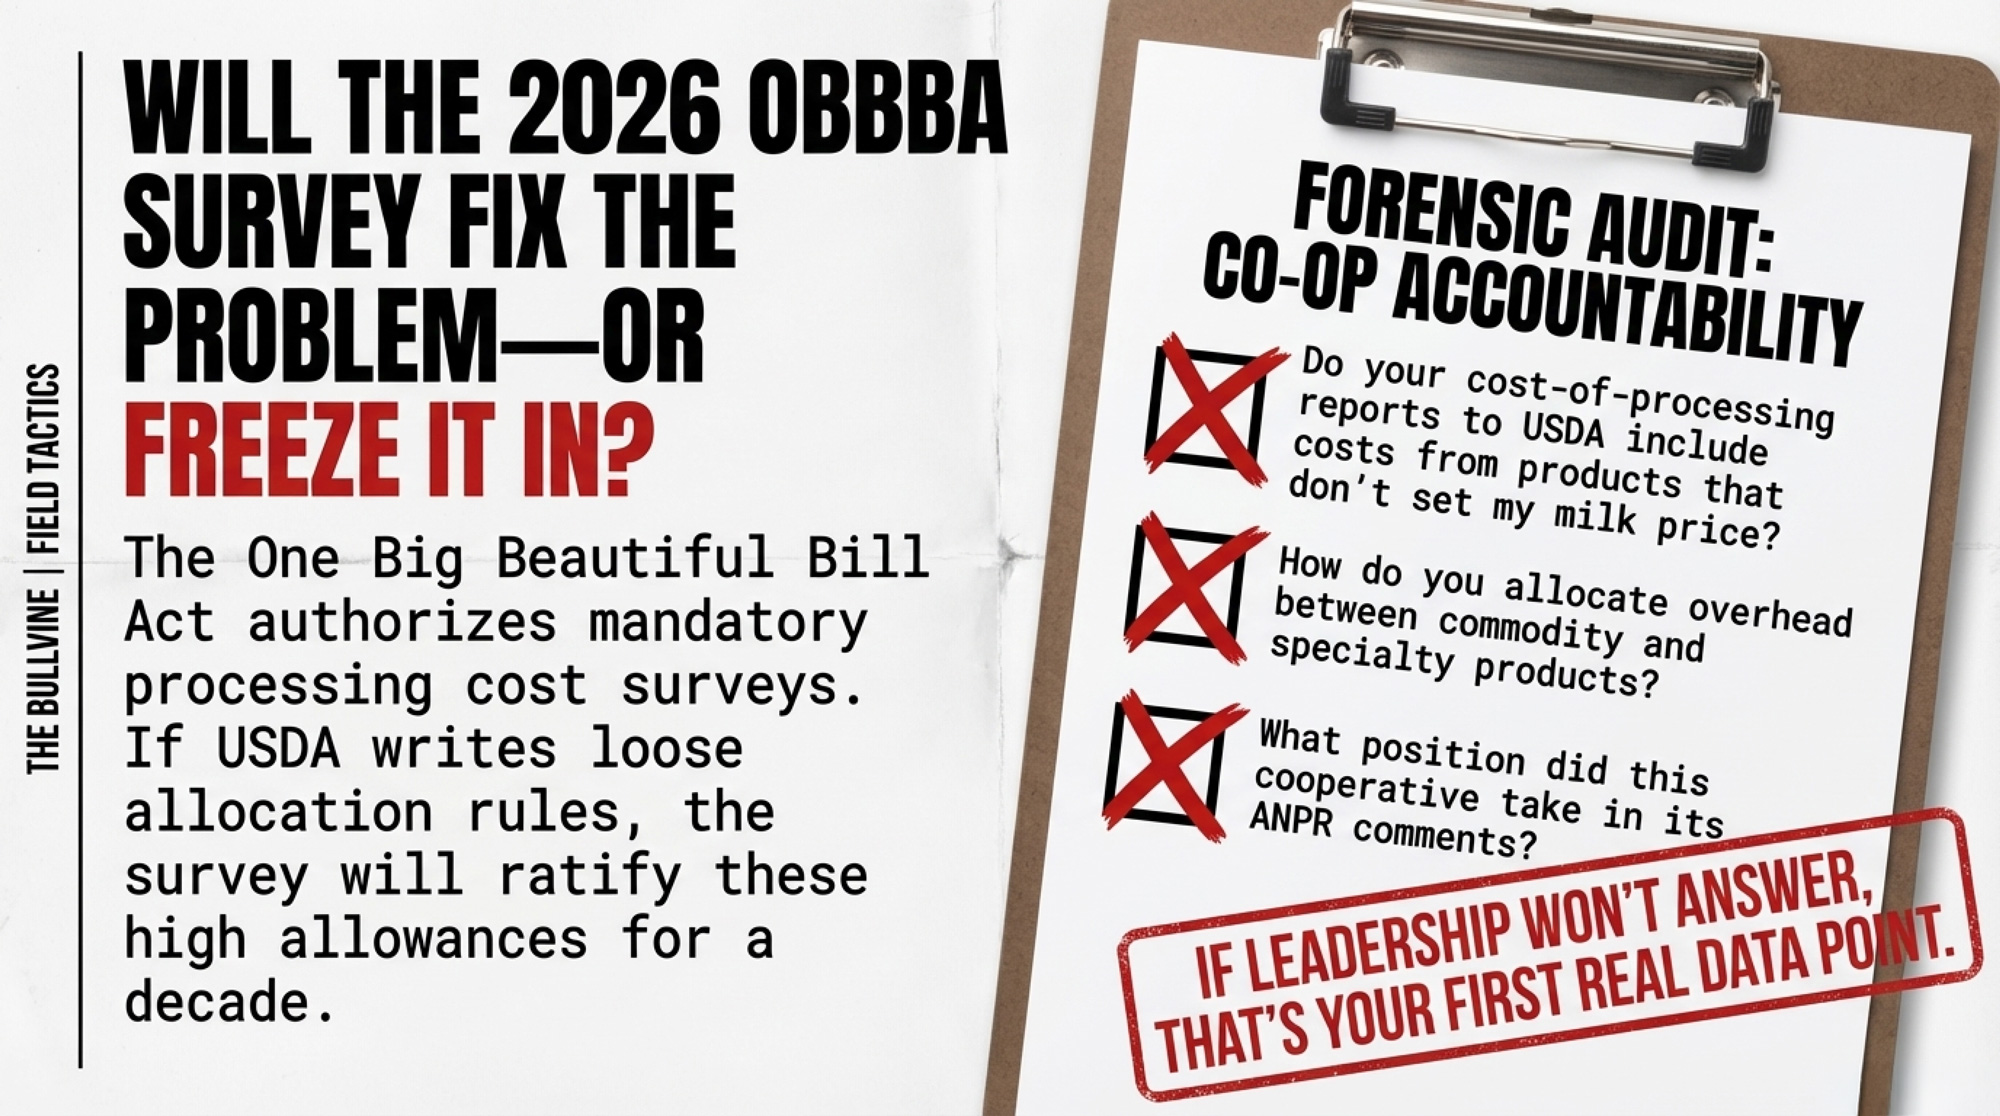
Will the OBBBA Survey Fix the Make Allowance Problem — or Freeze It In?
The One Big Beautiful Bill Act authorized mandatory surveys of dairy processing costs and yields under Section 10314. According to AFBF’s Munch, those surveys are supposed to be biennial to prevent another 17‑year gap between major resets.
In February 2026, AMS published an Advance Notice of Proposed Rulemaking in the Federal Register to outline the survey design. ADC requested a 60‑day extension; AMS didn’t grant it. Fischer’s team filed formal comments by the March deadline.
Producer groups want a narrow scope: physical conversion costs for four formula products, clear product‑line cost separation, and standardized allocation rules. Processors argue they need flexibility to reflect varied plant types and product mixes. “There is a real expectation that this survey will provide transparency,” Fischer says. “USDA needs to ensure that the expectation is met.”
If the categories and allocation rules come out too loose, the survey could ratify those high allowances and give them fresh, “audited” cover. That’s the real battleground of 2026.
Three Questions to Put in Front of Your Co‑Op Board
Many of the cost‑allocation choices that matter most occur within organizations that still call themselves farmer‑owned. For a 400‑cow member already $105,000 lighter from the formula change, your co‑op’s processing margin and your milk check draw from the same pool.
Ask — in writing:
- “Do your cost‑of‑processing reports to USDA include costs from products that don’t set my milk price?”
- “How do you allocate overhead between commodity and specialty products, and can members see that schedule?”
- “What position did this cooperative take in its ANPR comments?”
If leadership won’t answer clearly, that’s your first real data point.
What Should Your Dairy Do in the Next 30, 90, and 365 Days?
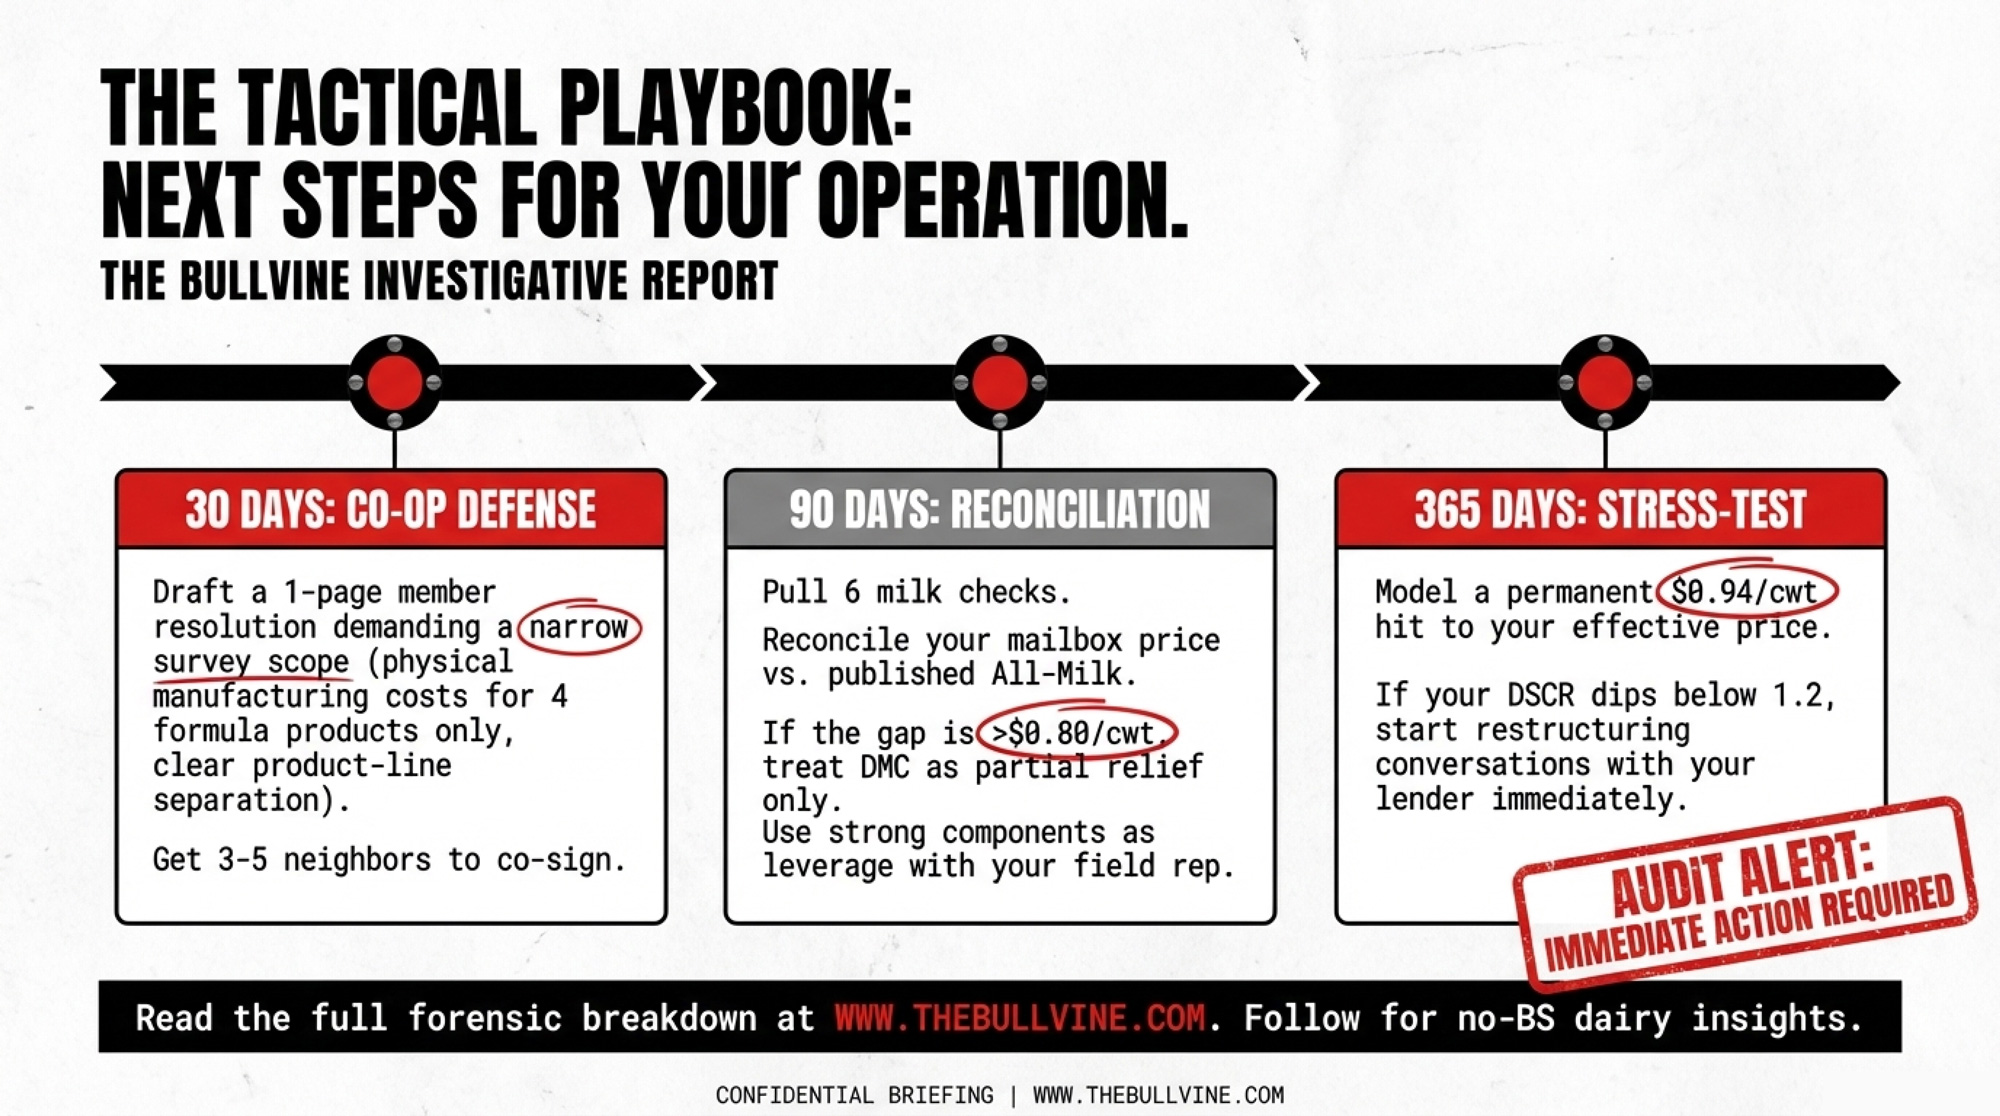
Next 30 Days
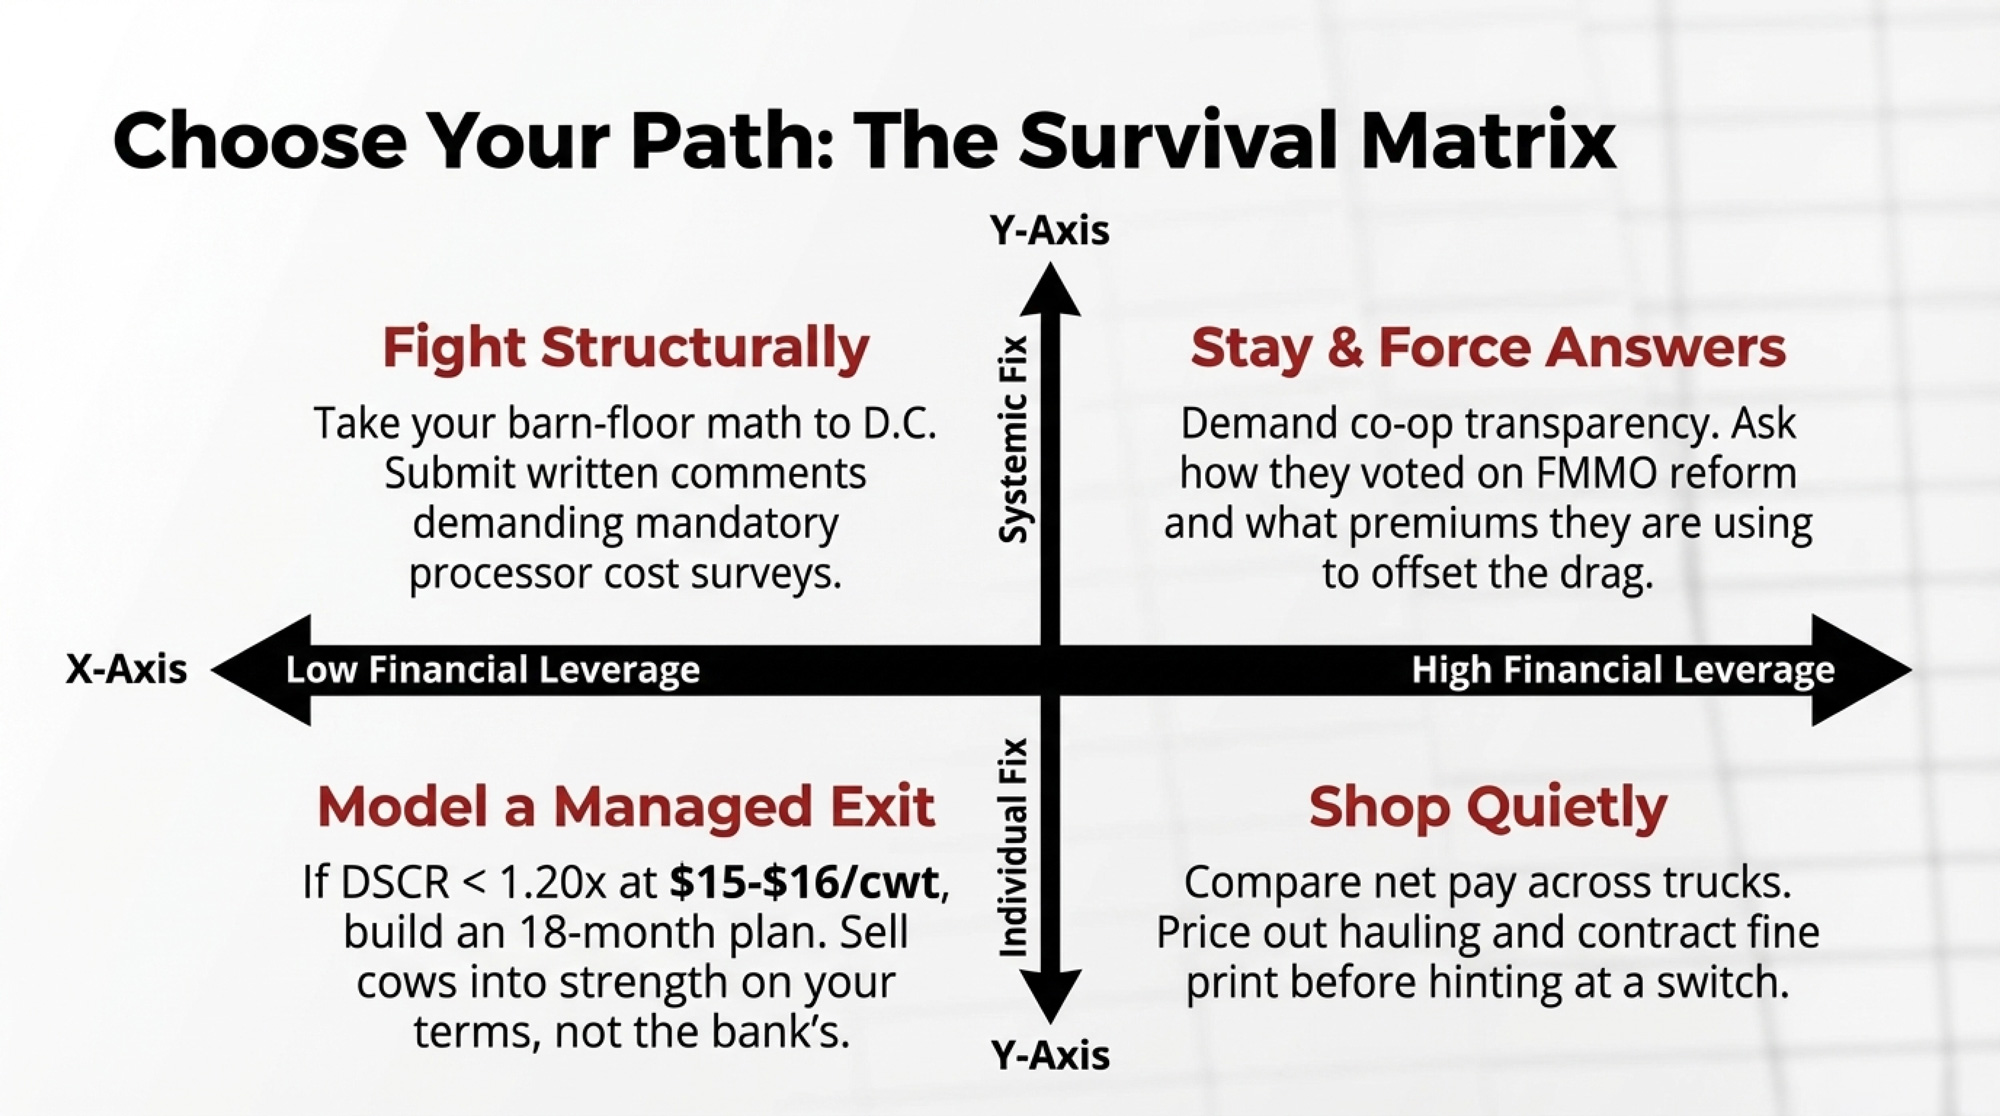
- Draft a one‑page member resolution calling for a narrow survey scope — physical manufacturing costs for four formula products only, clear product‑line separation, and standardized allocation methods. Get three to five neighbors to co‑sign and push your board to adopt it.
- Ask for your co‑op’s ANPR position in writing. If management won’t share it, that tells you something.
Next 90 Days
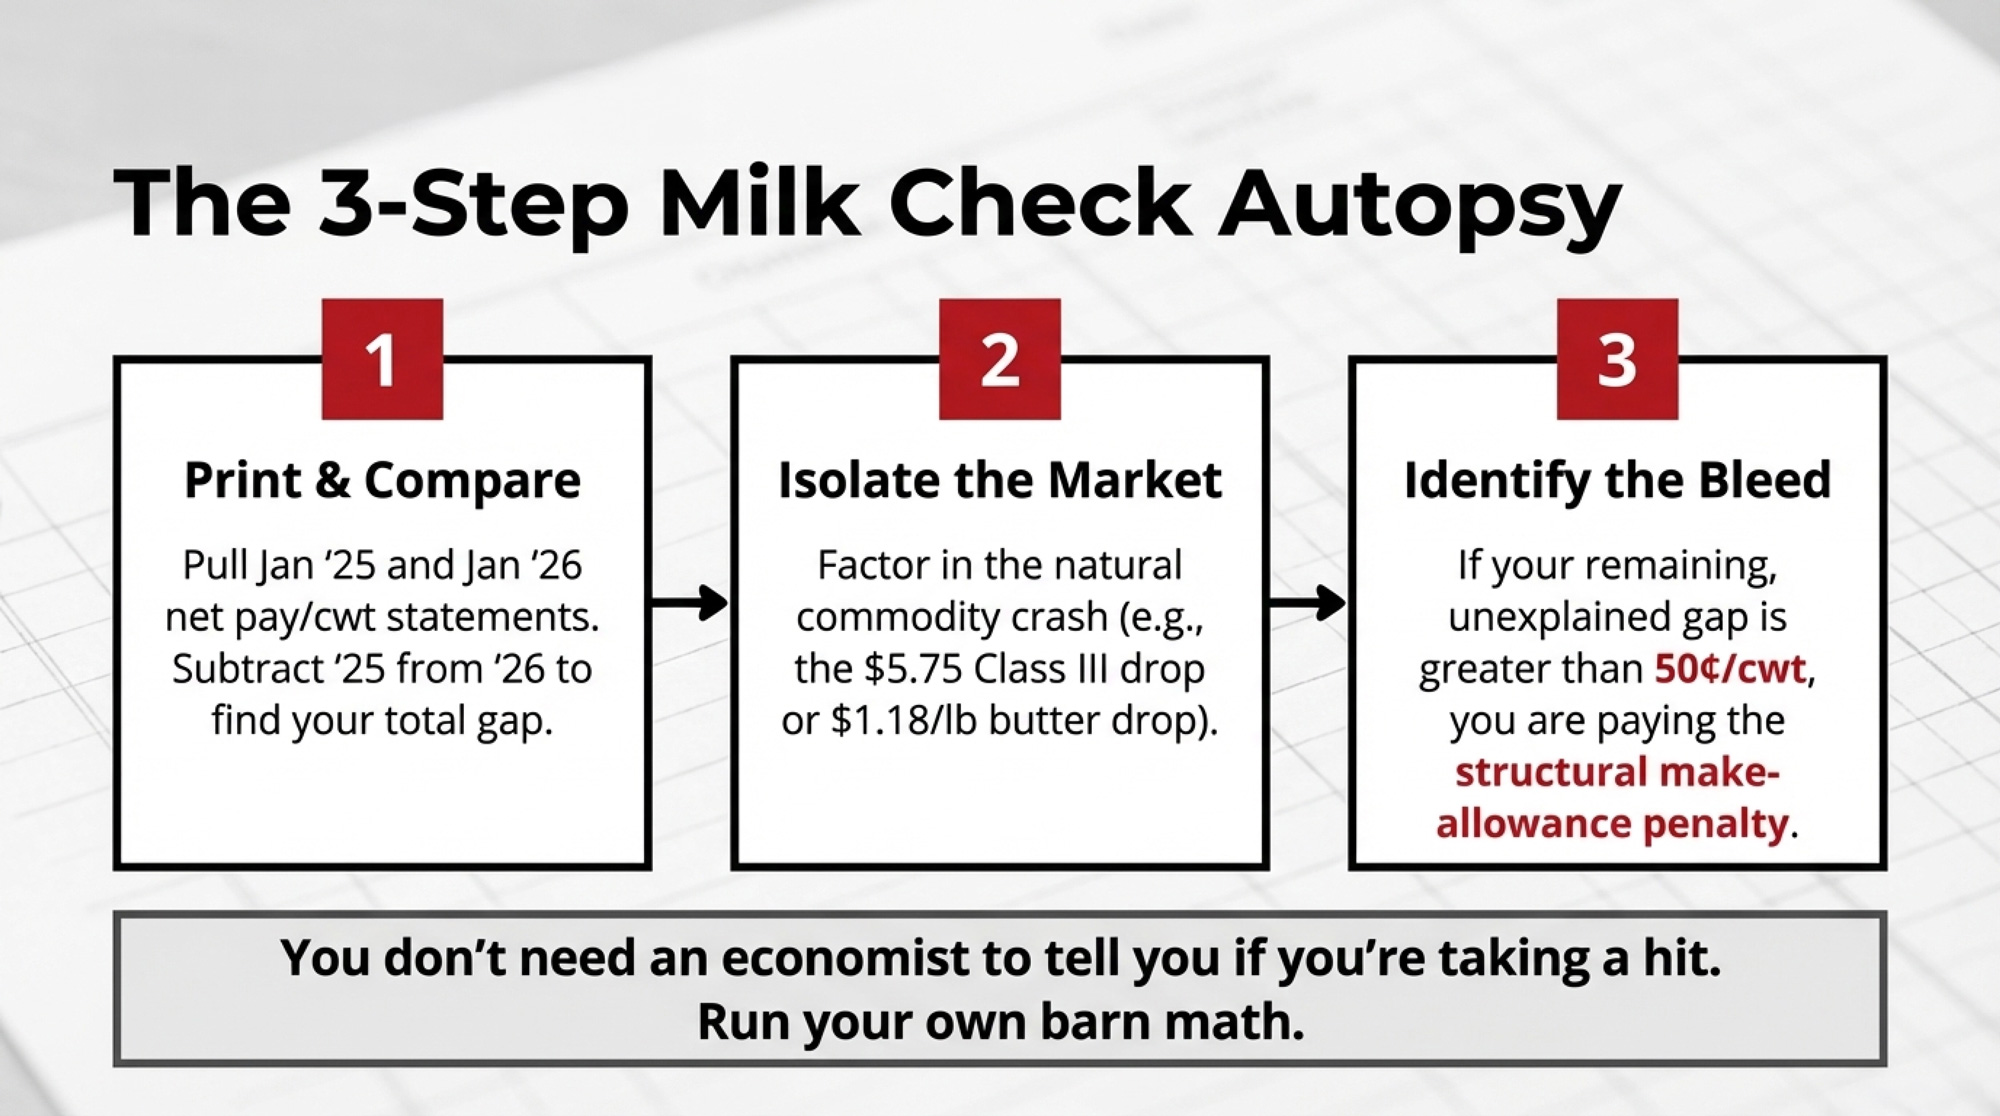
- Run your own All‑Milk/mailbox reconciliation. Pull six checks and compare your mailbox to the published All‑Milk for your state. If the gap averages more than $0.80/cwt, treat DMC as partial relief, not a margin backstop — and walk your lender through the math. If they’ve never heard the term “make allowance,” that conversation itself is the point.
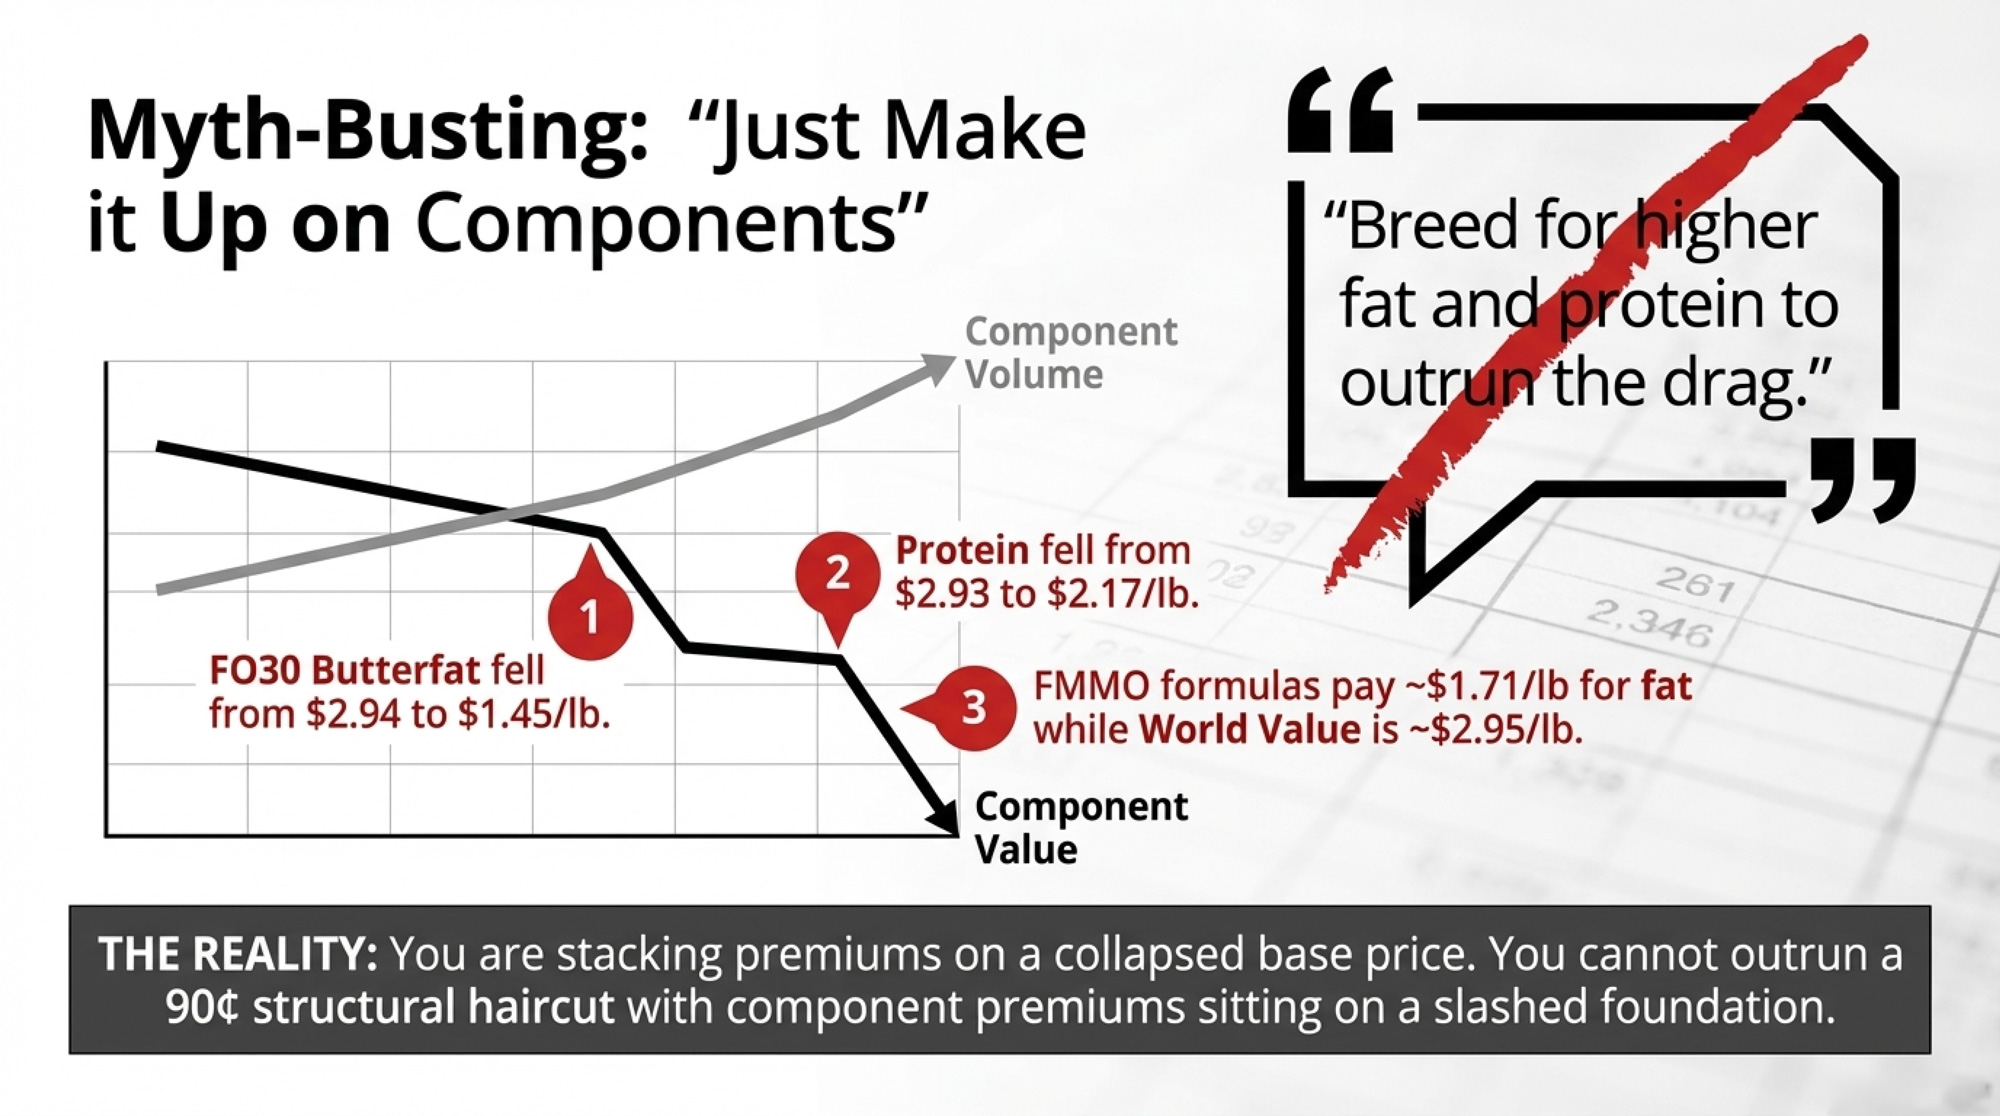
- Use strong components as leverage. If your butterfat and protein run well above pool, the make allowance bite is proportionally bigger — but so is your ability to negotiate component premiums. Bring those numbers to your next field‑rep meeting.
Next 365 Days
- Stress‑test with your banker. What happens to your DSCR if your effective milk price drops another $0.94/cwt from structural deductions, even with decent futures? Below 1.2, start restructuring conversations now.
- Be careful what you build on. If you’re penciling big projects on today’s over‑order premiums, stress‑test against a world where premiums get trimmed but structural deductions stay. Premiums are discretionary. Make allowance deductions held from 2008 to 2025.
What This Means for Your Operation
- Make allowances are a structural risk line, not background noise. They reset your pricing base for years. You can’t hedge them with futures or negotiate them with your field rep.
- The DMC printout doesn’t match your bank account. If your All‑Milk/mailbox gap is near $1.00/cwt, that gap needs to show up in every capital, coverage, and hiring decision you make.
- Your co‑op voice matters right now. Once the OBBBA survey categories lock in, you live with those numbers in your milk check for the next cycle.
- Get your lender on the same page early. A banker who understands the make allowance drag is more likely to work with you than one who only sees DMC margins on paper.
Key Takeaways
- If your DSCR falls below 1.2 when you model a $0.94/cwt structural hit, you’re in the danger band — and lender conversations shouldn’t wait for the next survey round.
- If your All‑Milk/mailbox gap has averaged $0.80/cwt or more over the last six months, your DMC coverage is quietly under‑insuring the margin you actually live with.
- If your co‑op runs commodity and specialty lines, you have a direct financial stake in how it allocates overhead in survey responses — and a right to see that logic in writing.
Pull your last six milk checks. Find your mailbox price. Compare it to the All‑Milk number USDA published for those same months. That gap — not the futures board, not the co‑op newsletter, not the DMC margin printout — is the number that tells you how much of your income sits on the other side of formulas you didn’t write and still can’t fully audit.
Complete references and supporting documentation are available upon request by contacting the editorial team at editor@thebullvine.com.
Learn More
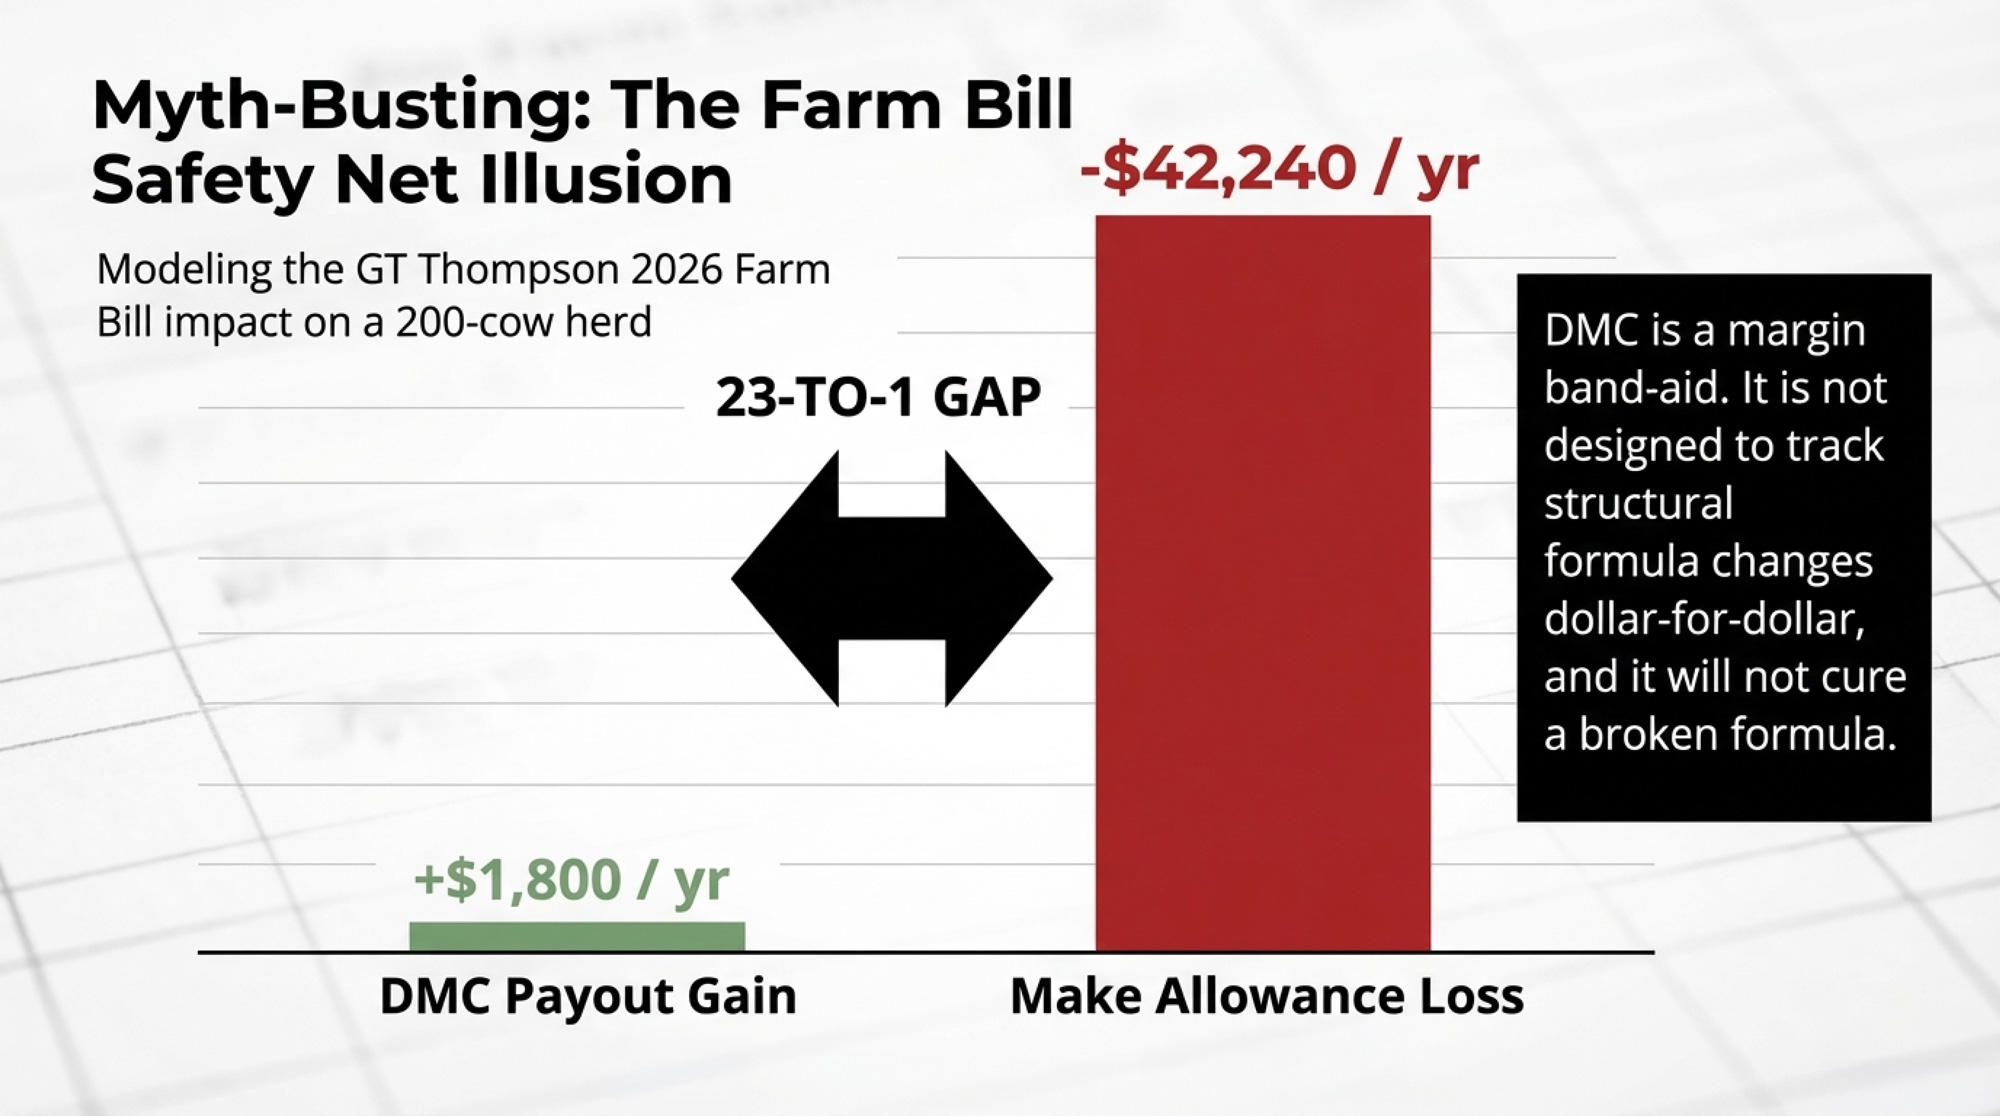
- GT Thompson’s 2026 Farm Bill Math: DMC Pays Your 200‑Cow Dairy $1800, Make Allowances Cut $42240 – a 23 to 1 Hit – This breakdown reveals the staggering 23-to-1 imbalance between government support and regulatory deductions. It arms you with the exact math needed to re-evaluate your 2026 DMC enrollment before the February deadline locks in your strategy.
- Why Dairy Markets Can’t Self-Correct Anymore: The Hidden Forces Reshaping the Dairy Industry’s Future – I expose the structural “rigidity” that has permanently broken traditional price cycles. This analysis delivers the strategic blueprint for surviving a decade where half the global milk supply no longer responds to market signals.
- FMMO Pays $1.71/lb for Butterfat Worth $2.95: What USDA’s December Report Tells You About Your Milk Check in 2026 – This article uncovers the massive “export gap” where processors capture global premiums while your check stays anchored to stale CME prices. It identifies the $3.68/cwt value leak that is quietly draining your component revenue.
 The Sunday Read Dairy Professionals Don’t Skip.
 The Sunday Read Dairy Professionals Don’t Skip.
Every week, thousands of producers, breeders, and industry insiders open Bullvine Weekly for genetics insights, market shifts, and profit strategies they won’t find anywhere else. One email. Five minutes. Smarter decisions all week.