


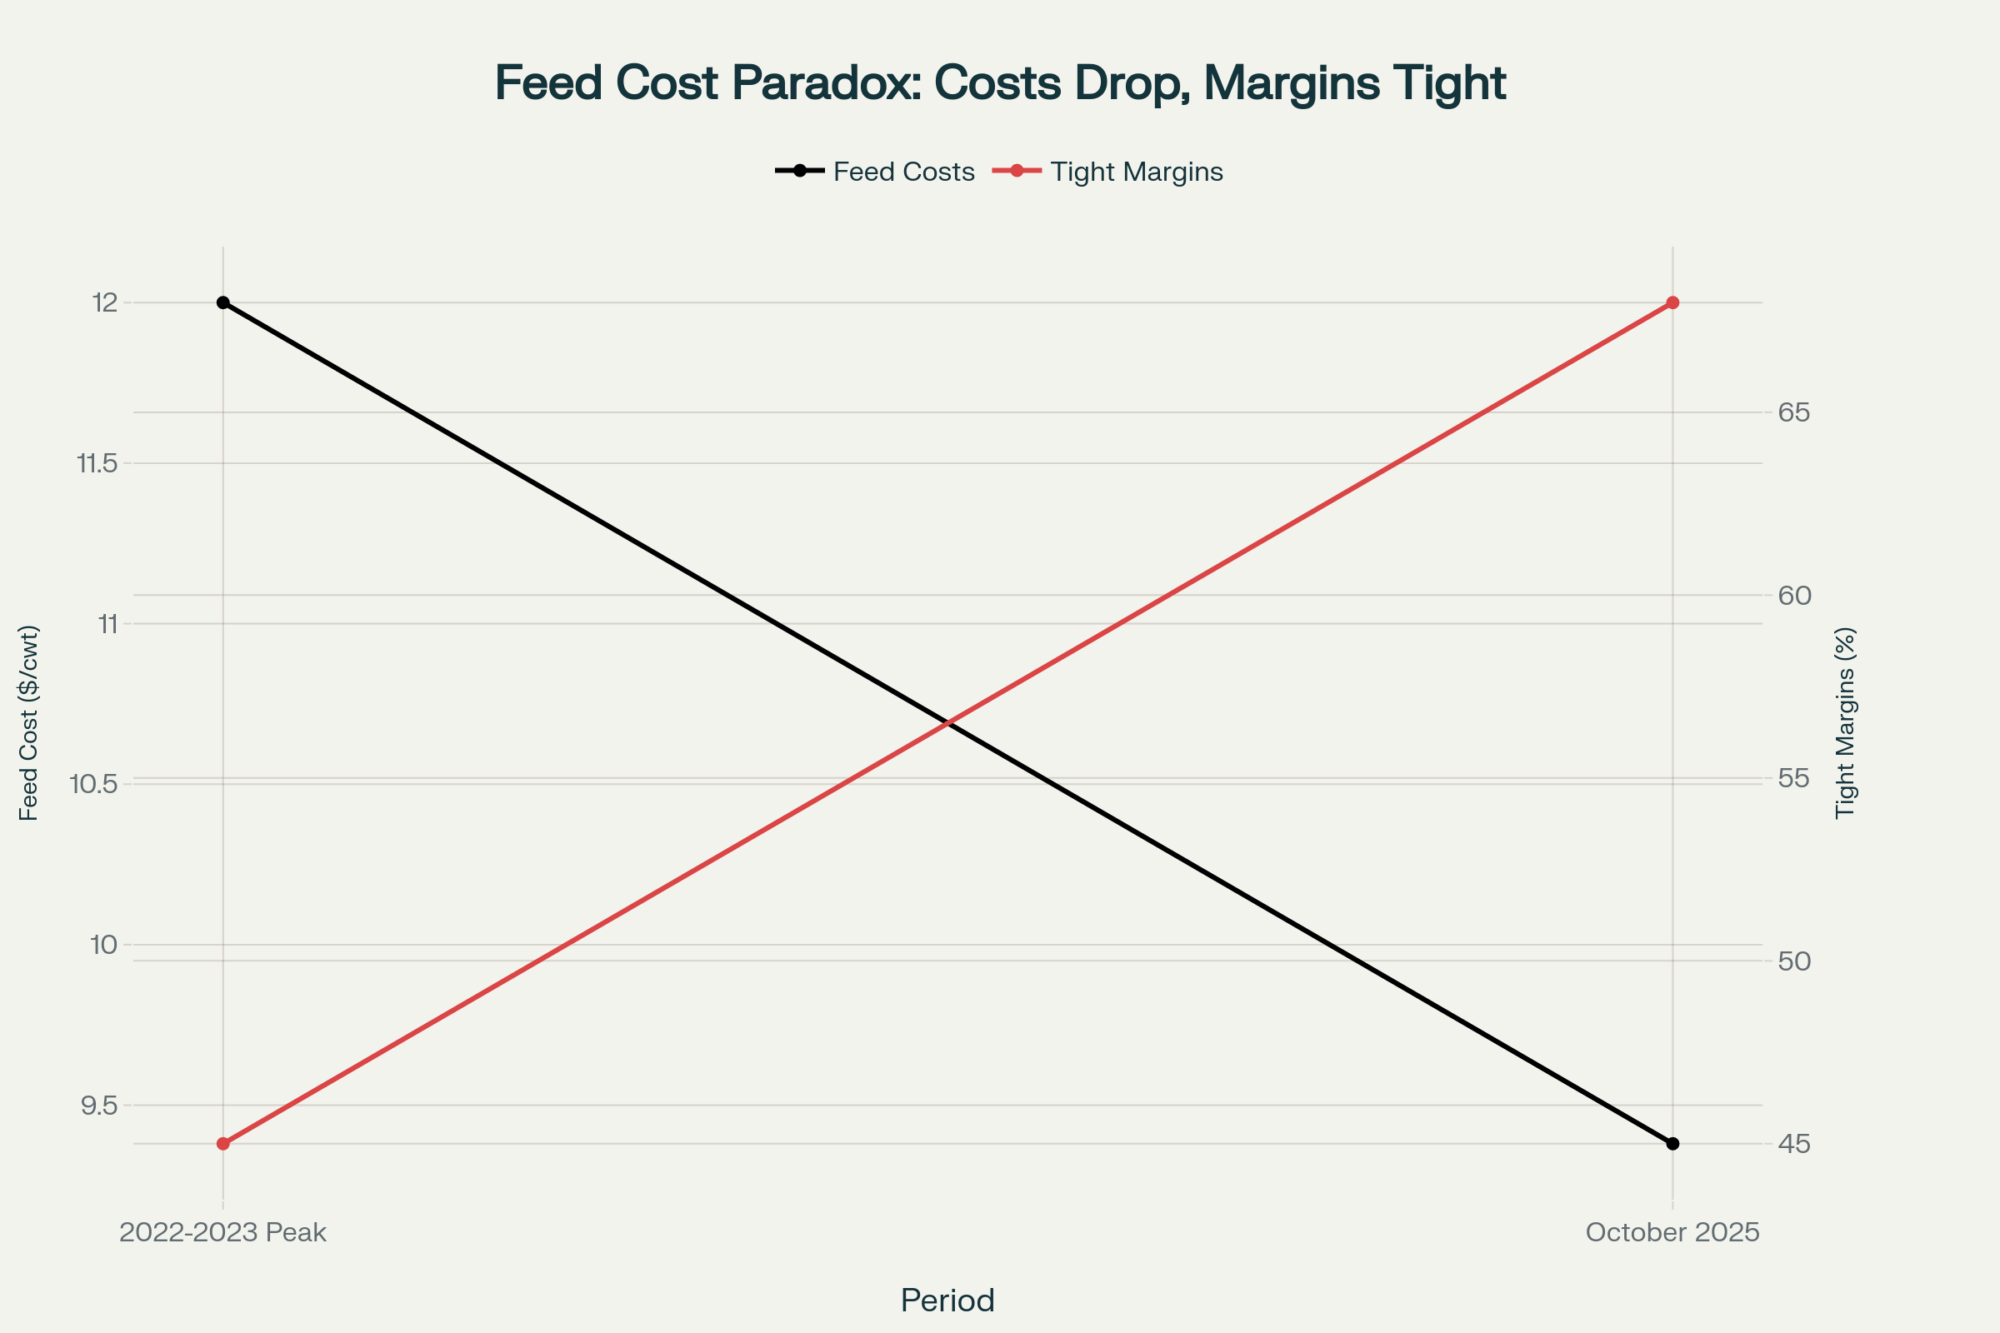
Feed costs dropped 23% since the 2023 peaks, yet 68% of dairy operations report tighter margins than ever
EXECUTIVE SUMMARY: What farmers are discovering across the country is that despite feed costs retreating from their 2022-2023 peaks, actual profitability remains stubbornly elusive—and the reasons go well beyond traditional input calculations. USDA data from October 2025 shows feed costs averaging $9.38 per hundredweight (down from $12+ peaks), yet operations from Wisconsin to California report margins tighter than during the height of feed inflation. The culprit? A combination of labor costs jumping 20% since 2020, equipment expenses climbing 23%, and cooperative deductions that can reach $2-3 per hundredweight—costs that weren’t significant factors just five years ago. Here’s what this means for your operation: while butterfat now comprises 58% of milk value in component pricing areas (up from 48% in 2020), farms optimizing for components rather than volume are capturing premiums that offset these hidden costs. Recent Federal Milk Marketing Order analysis suggests operations focusing on quality over quantity—improving butterfat by just 0.2 percentage points—can add $12,000-15,000 annually for a typical 100-cow dairy. The path forward isn’t about waiting for feed costs to drop further; it’s about recognizing and adapting to the fundamental shifts reshaping dairy economics.

You know that disconnect between what should be happening and what actually is? Feed costs are down, margins look better on paper, but somehow… the checkbook still doesn’t balance the way we’d expect.
Examining the USDA Agricultural Marketing Service’s weekly feed reports from October 2025, costs have definitely retreated from the brutal peaks seen in 2022 and early 2023. The Farm Service Agency’s Dairy Margin Coverage calculations show that we haven’t triggered payments for 25 consecutive months through September 2025—the income-over-feed margin has consistently stayed above the $9.50 threshold. Should be great news, right?
Well, yes and no. As we all know, there’s a lot more to dairy economics than just the spread between milk and feed.
The Evolution of Operating Costs
What farmers are finding is that while feed costs have moderated, everything else seems to be climbing. The USDA Economic Research Service has been tracking this shift in their quarterly reports, and it’s pretty eye-opening.
Labor’s become a real challenge across the country. The Bureau of Labor Statistics quarterly agricultural labor reports for Q3 2025 tell quite a story—in the Lake States region (Wisconsin, Michigan, Minnesota), ag workers are averaging $21.40 per hour, up from $17.80 just three years ago. Pacific region operations in California and Washington? They’re seeing an average hourly rate of $24.50. And that’s if you can find workers at all.

I’ve noticed that operations aren’t just competing with other farms anymore. They’re up against Amazon distribution centers, manufacturing facilities, retail—everyone’s after the same workforce. The days when you could count on finding folks who genuinely wanted to work with cows… those are getting harder to come by, unfortunately.
Equipment costs represent another significant shift. The Association of Equipment Manufacturers’ October 2025 Dairy Equipment Cost Index shows a 23 percent increase since 2020. Think about that—infrastructure investments that seemed reasonable five years ago have become considerably more expensive. A typical double-12 parlor renovation that ran $300,000 in 2020? You’re looking at $370,000 or more today. And these aren’t luxury items. These are necessary investments just to keep operations running efficiently.
Understanding Today’s Cooperative Economics
The relationship between cooperatives and their member-owners has always been complex, but recent years have added some interesting dimensions.
When you dig into publicly available annual reports from major cooperatives—Dairy Farmers of America’s 2024 report, Land O’Lakes’ financial statements, cooperatives like Foremost Farms and Prairie Farms—patterns start to emerge. Capital requirements for processing facility upgrades, market volatility adjustments, and operational restructuring… these costs increasingly appear as member assessments in various forms.

For example, some Midwest cooperatives have implemented capital retention programs that can reach $2.00 to $3.00 per hundredweight during facility expansion periods. Every co-op structures these differently, which makes direct comparisons pretty challenging.
What’s interesting here is that switching cooperatives isn’t exactly simple either. Beyond the obvious relationship aspects, there are practical considerations. Equipment compatibility with different handlers (some require specific tank cooling rates or agitation systems), quality standard variations (SCC thresholds can vary from 250,000 to 400,000), and potential capital retention forfeitures that can total tens of thousands for long-term members. The complexity can be significant.
It’s worth thinking about your own situation. Are you clear on all the deductions coming out of your milk check? Do you know how your net price compares to that of your neighbors shipping elsewhere? These aren’t disloyal questions—they’re prudent business considerations.
Component Values: Where the Real Opportunity Lies
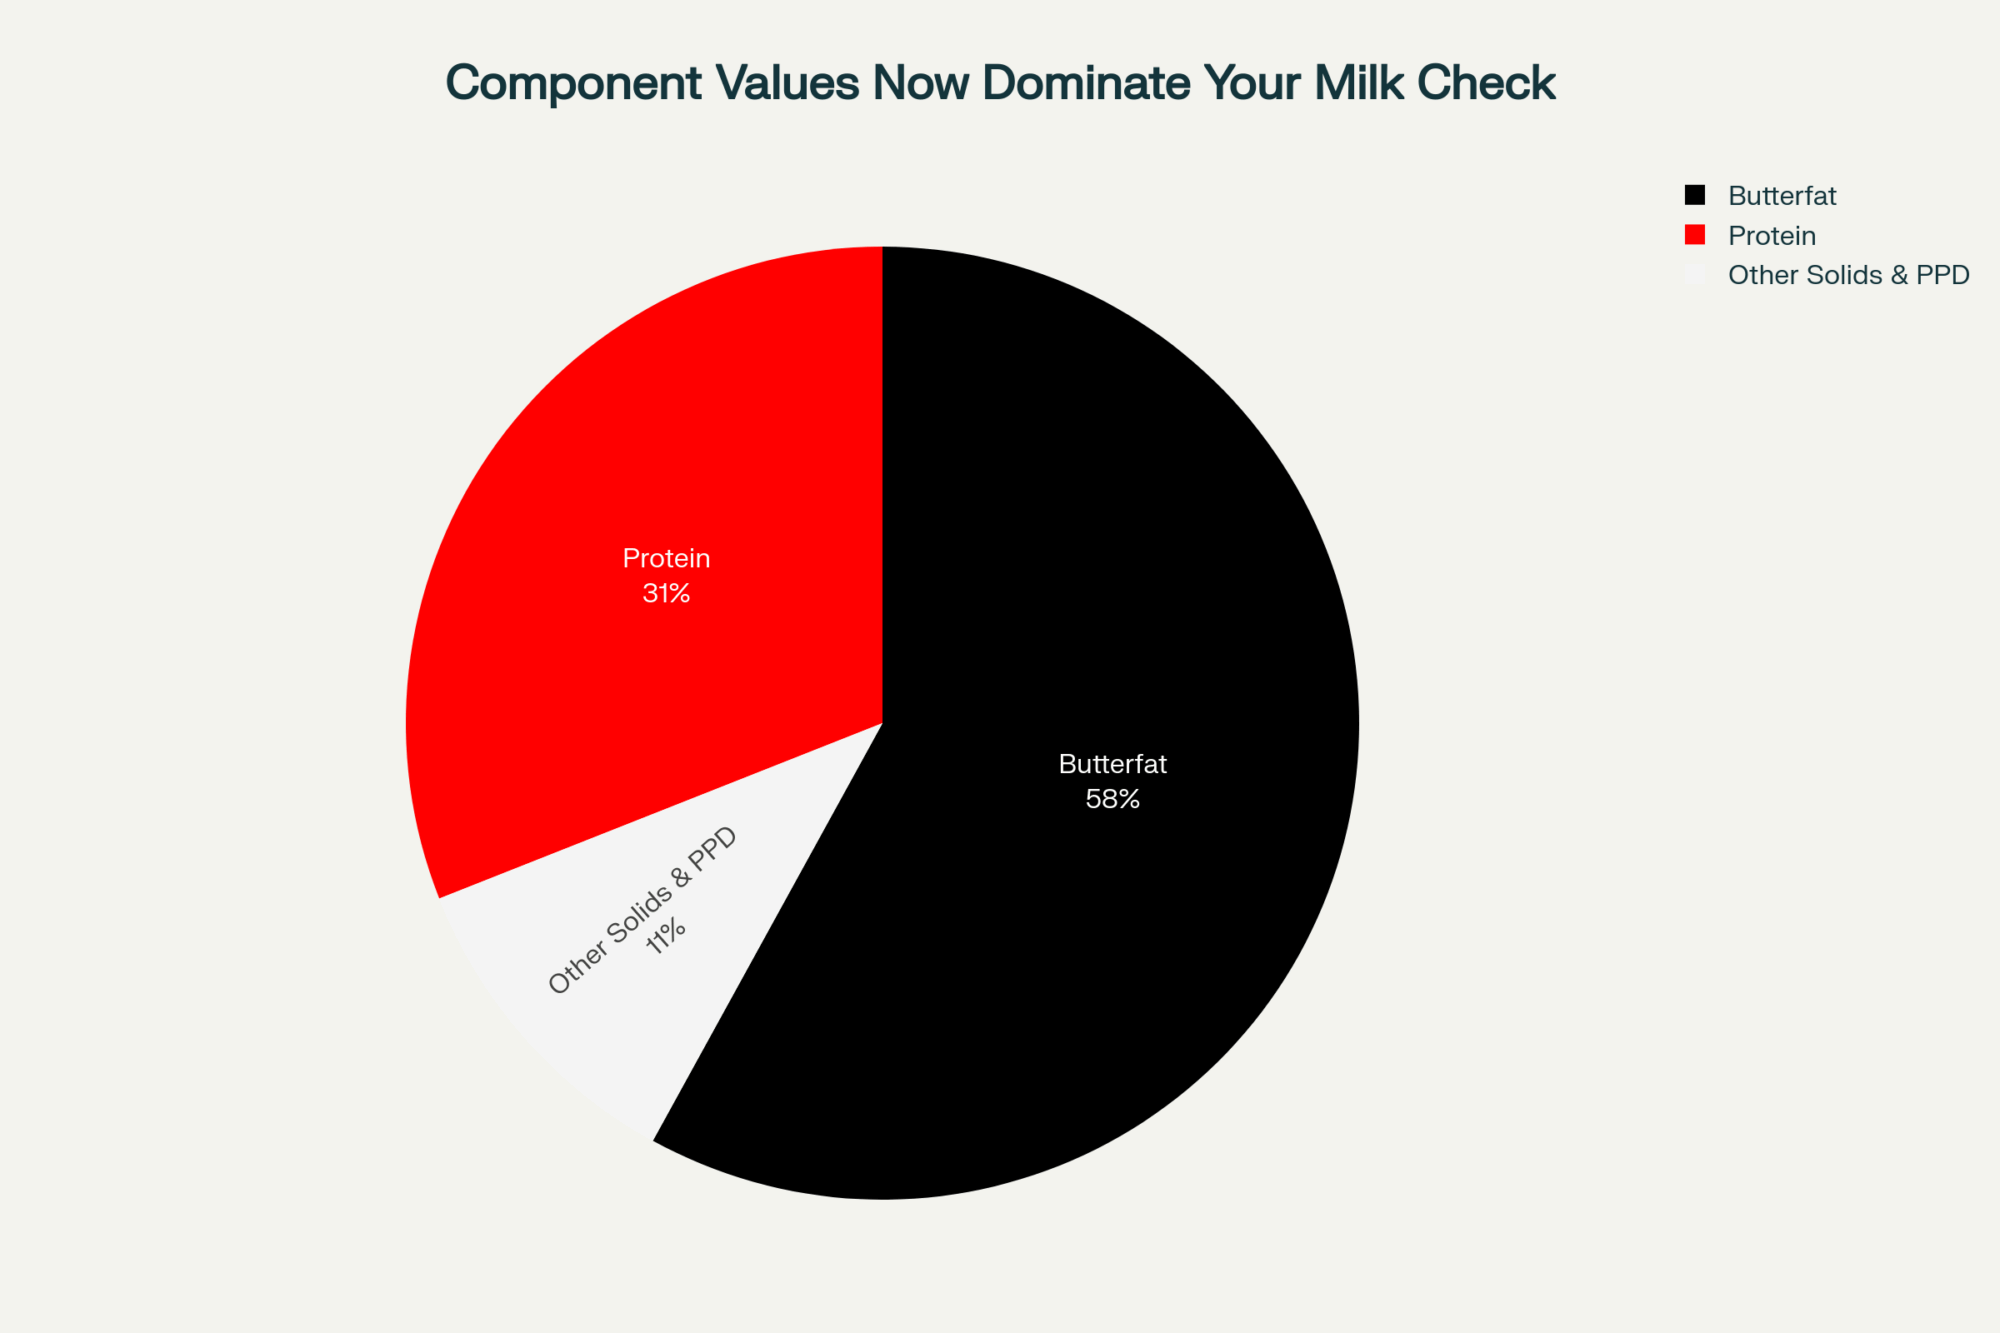
Here’s what’s particularly encouraging for those paying attention—the Federal Milk Marketing Order statistical reports from September 2025 show butterfat now comprises 58 percent of milk value in component pricing areas. Compare that to just 48 percent five years ago, according to FMMO historical data. That’s a huge shift in how we need to think about production.
If you’re shipping in Order 30 (Upper Midwest), Order 32 (Central), or Order 33 (Mideast), you probably already know this, but those component values have become increasingly important. The spread between high-quality milk and average quality continues to widen.
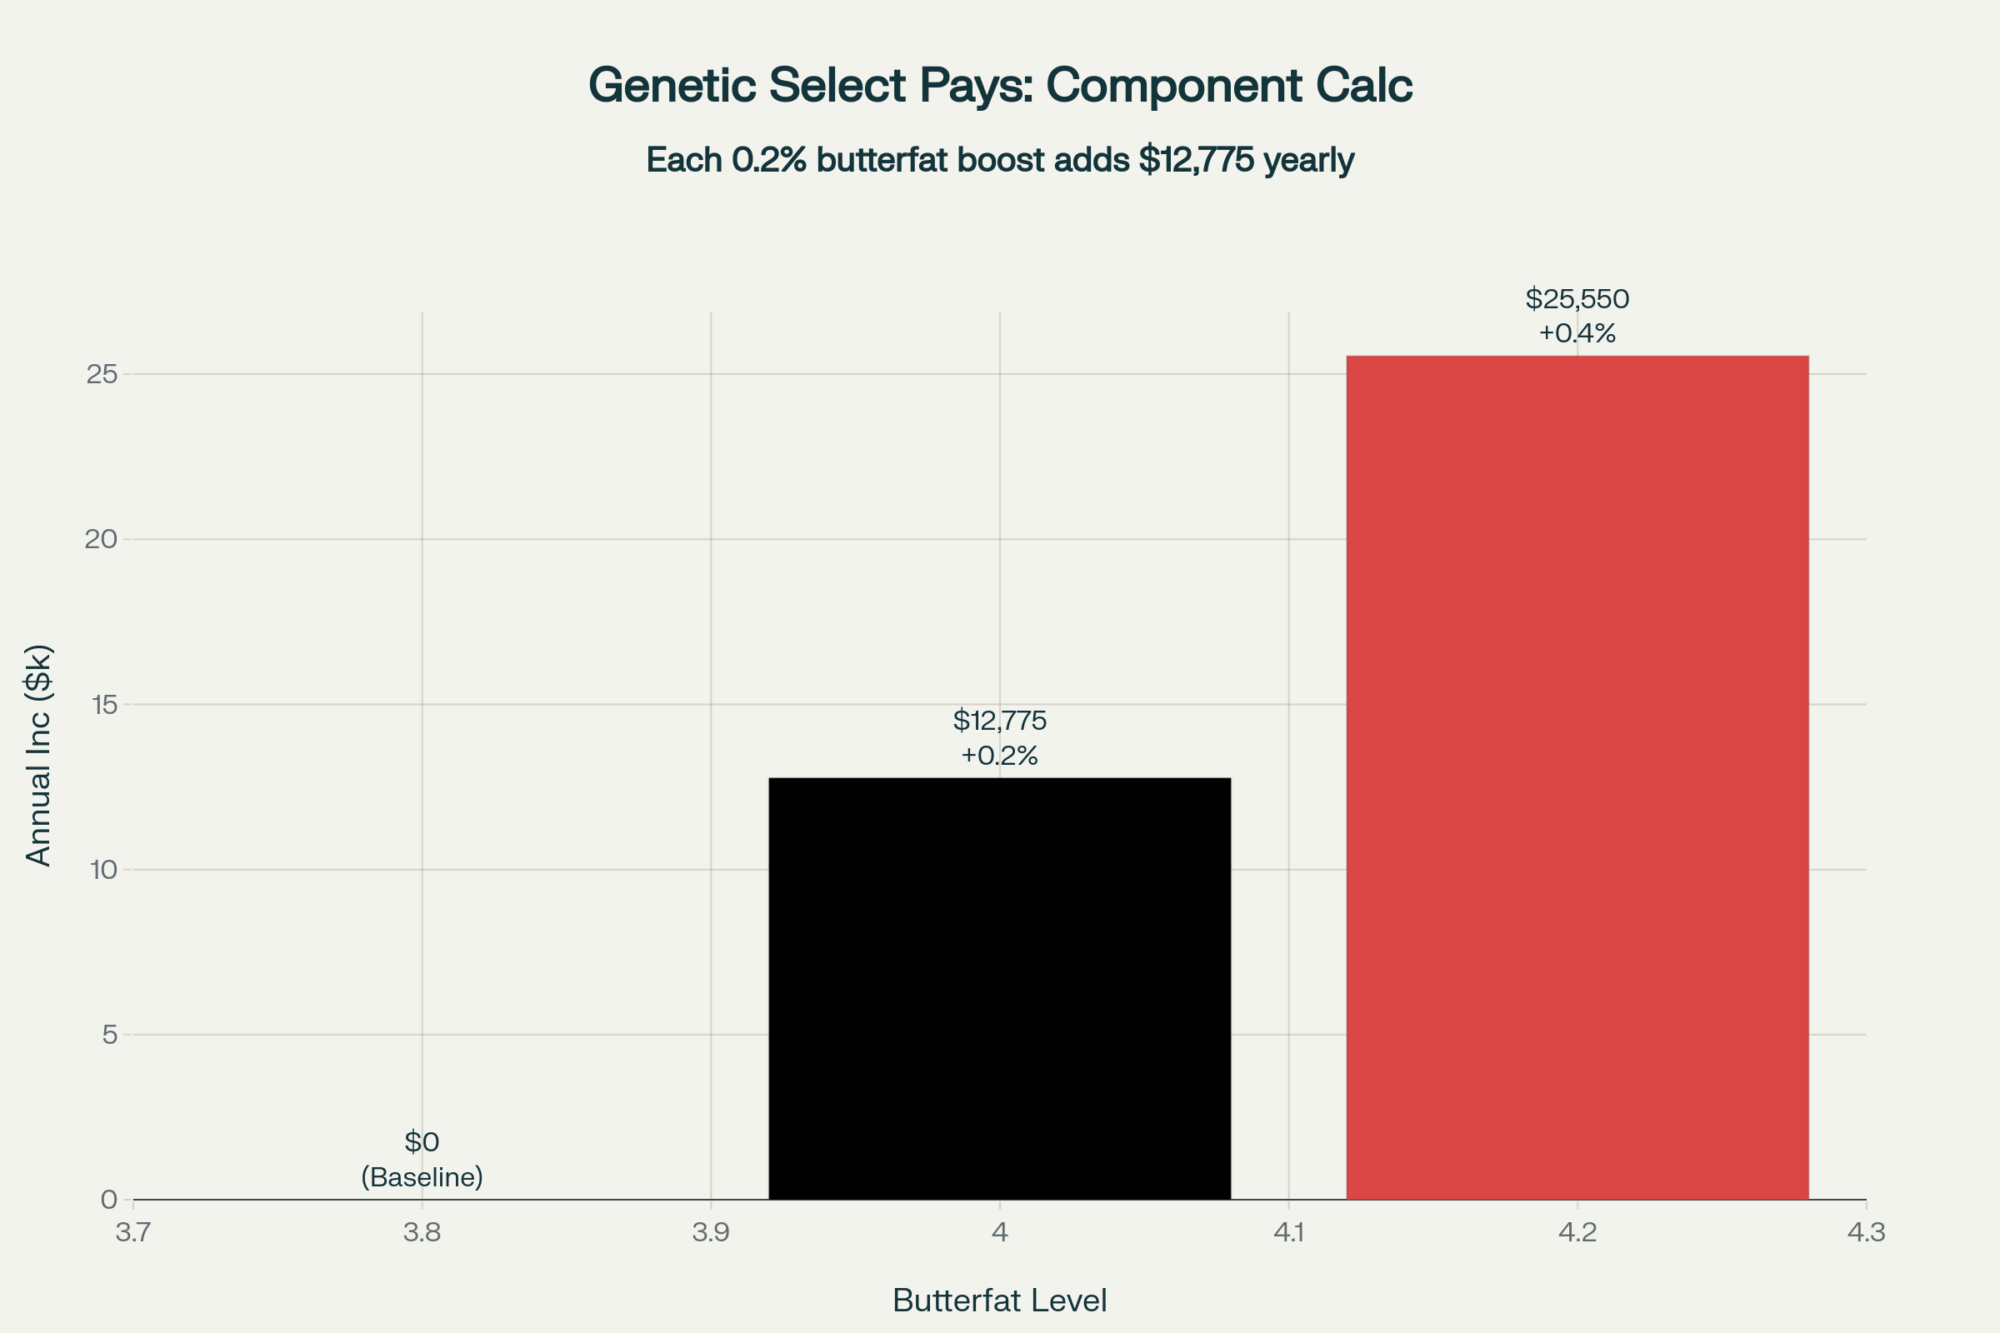
The Council on Dairy Cattle Breeding released their April 2025 genetic trend report, documenting industry-wide shifts. Holstein breed averages for butterfat have increased from 3.83% to 3.96% over the past five years. Even modest improvements—we’re talking 0.15 to 0.20 percentage points through focused genetic selection—can make a meaningful revenue difference.
Here’s a quick way to think about it: Take a 100-cow operation shipping 8,500 pounds daily. Moving butterfat from 3.8% to 4.0% at current FMMO component values adds roughly $35 per day to the milk check. That’s $12,775 annually from the same number of cows.
Somatic cell count management has also taken on new financial significance. Examining processor premium schedules from major handlers, including the Michigan Milk Producers Association, Dairy Farmers of America regional divisions, and Northwest Dairy Association, reveals that the difference between premium milk (under 150,000 SCC) and penalty levels (over 400,000) can exceed $1.00 per hundredweight. Are you tracking your bulk tank SCC trends? Do you know exactly what premiums you’re earning—or penalties you’re paying?
Building Financial Resilience in Uncertain Times
| Metric | DMC Formula | Real Farm Costs | Gap Impact |
| Feed Costs | $9.38/cwt | $11.50/cwt | $2.12/cwt |
| Labor Costs | Not included | $2.50/cwt | $2.50/cwt |
| Equipment Costs | Not included | $1.20/cwt | $1.20/cwt |
| Co-op Deductions | Not included | $2.50/cwt | $2.50/cwt |
| Total Coverage | $9.38/cwt | $17.70/cwt | $8.32/cwt |
The brief October 2025 government shutdown—just eight days, from October 1 to 8—served as an unexpected stress test. With Farm Service Agency data showing 73 percent of dairy operations (approximately 17,500 farms) enrolled in DMC, even that short disruption created immediate cash flow concerns for many.
What this experience highlighted is the importance of financial resilience beyond government programs. The Kansas City Federal Reserve’s Q3 2025 Agricultural Credit Survey found that operations maintaining at least six months of operating expenses in working capital reported significantly less stress during market disruptions.
Risk management tools have evolved considerably. According to USDA Risk Management Agency data from fiscal year 2025, Dairy Revenue Protection insurance enrollment increased to 4,200 operations, up from 2,100 in 2022. Coverage levels vary widely, ranging from catastrophic coverage to 95% of expected revenue. Now, it’s not right for every operation, but these tools provide options beyond traditional government programs.
I’ve been thinking about this quite a bit lately. How many months of operating expenses do you have in reserve? If DMC payments were to stop tomorrow, or your milk check were delayed by two weeks, how long could you manage? These aren’t comfortable questions, but they’re necessary ones.
The Heifer Supply Challenge Nobody Saw Coming
This one still amazes me. USDA National Agricultural Statistics Service reported 3.91 million replacement heifers in their January 31, 2025, cattle inventory—the lowest since 1998, when they counted 3.89 million. Yet, the October 2025 milk production report shows the national milking herd at 9.43 million head, up 66,000 from the previous year. How’s that math work?
Operations are keeping cows longer. Plain and simple. Research from the University of Wisconsin’s dairy management program shows average lactation numbers have increased from 2.8 to 3.3 over the past five years. Many herds are pushing cows through fourth, even fifth, lactations that would’ve been culled after two or three in previous market cycles.
When quality replacement heifers command the prices we’re seeing—USDA Agricultural Marketing Service reports from major auction markets show Holstein springers averaging $2,800-$3,500 in the Midwest, over $4,000 in water-stressed Western markets—the economics shift dramatically.
There are real trade-offs here. Penn State Extension’s 2025 dairy herd health surveys indicate extended lactations correlate with higher bulk tank SCC (averaging 285,000 for herds with 3.5+ average lactations versus 220,000 for herds under 3.0), increased lameness prevalence (28% versus 19%), and higher veterinary costs per cow ($185 versus $145 annually).
What’s your average lactation number right now? Has it changed over the past two years? If you’re like most operations, it probably has increased by 0.3 to 0.5 lactations, and that shift has implications for everything from breeding programs to facility needs.
Market Dynamics and Our Global Position
Examining price comparisons reveals an interesting story. CME Group spot butter closed at $2.33 per pound on October 8, 2025, while the European Milk Market Observatory reported EU butter at €3.52 per kilogram (roughly $3.75 per pound) for the same week. Might suggest we have a competitive advantage, right?
But dig deeper into the USDA Economic Research Service consumption data from their September 2025 Dairy Outlook. Americans consume 5.1 pounds of butter per capita annually. Europeans? 8.2 pounds according to EU agricultural statistics. That consumption gap means we’re producing beyond domestic demand, making us dependent on export markets for price discovery.
The Foreign Agricultural Service’s August 2025 Dairy Export Report is particularly revealing—40 percent of U.S. cheese exports go to Mexico (472 million pounds annually), 18 percent to South Korea, and 12 percent to Japan. For whey products, China accounts for 31 percent of the market share, despite ongoing trade tensions. This geographic concentration creates both opportunity and vulnerability.
This development suggests we need to think differently about market risk. Are you considering export market dynamics in your planning? A 10 percent shift in Mexican demand has a greater impact on U.S. cheese prices than a 5 percent change in domestic consumption.
Practical Strategies for Today’s Environment
So what’s actually working out there? Based on Federal Milk Marketing Order pricing formulas and what successful operations are implementing…
First, component optimization has shifted from a “nice to have” to an essential requirement. The September 2025 FMMO Class III price formula shows butterfat at $3.23 per pound and protein at $2.31 per pound. A 0.2 percentage point improvement in butterfat (achievable through genetic selection according to Holstein Association USA genomic data) adds approximately $0.25 per hundredweight to your milk check.
Here’s a practical starting point: Review your milk quality reports from the last three months. What’s your average butterfat? Protein? SCC? Now look at your processor’s premium schedule. Calculate the difference between your current level and the next premium level. Often, the investment required (better genetics, refined feeding protocols, enhanced milking procedures) pays back in 6-12 months.
Second, understanding your true net price matters more than ever. After all deductions—cooperative assessments, hauling charges (averaging $0.35-0.50 per hundredweight according to University of Minnesota Extension surveys), quality adjustments—what’s actually hitting your bank account? That’s the number that drives real decision-making.
Third, operational flexibility often trumps pure efficiency. Cornell’s Program on Dairy Markets and Policy Analysis, released in August 2025, indicates that the optimal herd size varies significantly depending on local labor markets, land availability, and environmental regulations. Sometimes a well-managed 650-cow dairy in Wisconsin outperforms a 1,500-cow operation in Texas when you factor in water costs, labor availability, and market access.
Looking Ahead with Clear Eyes
The traditional model—maximize volume at minimum cost—served the industry well for decades. But current market structures reward different priorities. The data from USDA reports, Federal Reserve agricultural lending surveys, and university research all point toward similar conclusions.
What patterns are you seeing in your area? Because operations that thrive increasingly share certain characteristics. They understand their true costs, including all those hidden deductions. They optimize for net returns rather than gross production. They maintain financial flexibility with adequate working capital. And they adapt quickly to market signals rather than hoping things return to “normal.”
The feed cost paradox—lower input costs not translating directly to better margins—reflects the complexity of modern dairy economics. But within that complexity lies opportunity for those willing to look beyond traditional metrics.
As many of us have learned, probably the hard way, those “good old days” when feed costs determined profitability aren’t coming back. The fundamentals have shifted permanently. But dairy farming remains a viable business for those who understand and work with the new economics rather than against them.
The key is recognizing these changes and adapting accordingly. Because at the end of the day, we’re all trying to build sustainable operations that can weather whatever comes next—whether that’s another government shutdown, export market disruption, or the next unexpected challenge.
What’s your take on all this? Are you seeing similar trends in your region? Because I believe that the more we share these observations and strategies, the better equipped we will all be to navigate this changing landscape. The industry’s evolving faster than ever, but there’s definitely a path forward for those willing to evolve with it.
KEY TAKEAWAYS:
- Component optimization delivers immediate returns: Improving butterfat from 3.8% to 4.0% adds approximately $35 daily ($12,775 annually) for operations shipping 8,500 pounds—achievable through targeted genetics and feeding adjustments that typically pay back in 6-12 months
- Understanding your true net price changes everything: After deductions, hauling charges ($0.35-0.50/cwt), and quality adjustments, your actual deposited price might be $2-3 below announced rates—tracking this monthly helps identify whether staying with your current handler makes financial sense
- Labor strategy matters more than scale: With agricultural wages exceeding $21/hour in the Midwest and $24 in Western states, a well-managed 650-cow operation often outperforms 1,500-cow dairies when factoring in management intensity, component quality maintenance, and operational flexibility
- Financial resilience beats government dependency: Operations maintaining six months of working capital weathered the October shutdown without crisis, while the 73% enrolled in DMC discovered how quickly federal safety nets can disappear—private tools like Dairy Revenue Protection now cover 4,200 farms, double the 2022 enrollment
- Extended lactations are reshaping herd dynamics: With quality replacements hitting $4,000 in Western markets, pushing average lactations from 2.8 to 3.3 makes economic sense despite higher SCC and health management needs—but requires adjusting expectations for bulk tank quality and veterinary protocols
Complete references and supporting documentation are available upon request by contacting the editorial team at editor@thebullvine.com.
Learn More:
- When Butterfat Isn’t Enough: Adapting Your Dairy to New Market Realities – This tactical guide reveals how to adjust your genetic and feeding protocols to capture protein premiums, which increasingly drive revenue. It provides key management questions and specific ROI thresholds, helping you decide if technology investments make sense for your herd size and local cooperative structure.
- CME Dairy Market Report: June 3rd, 2025 – Modest Weakness Signals Caution Ahead of Summer Flush – Stop relying on surface-level milk price reports. This strategic analysis breaks down complex CME trading patterns, bid-ask spreads, and FMMO reform impacts, offering actionable intelligence that can uncover profit opportunities worth over $1.00/cwt that traditional reporting misses.
- The Digital Dairy Revolution: How IoT and Analytics Are Transforming Farms in 2025 – Discover how embracing IoT and analytics provides a necessary countermeasure to rising labor and equipment costs. This article details how precision monitoring systems deliver 15-20% productivity gains and significant health cost reductions through proactive detection, making your operation more resilient.
 The Sunday Read Dairy Professionals Don’t Skip.
 The Sunday Read Dairy Professionals Don’t Skip.
Every week, thousands of producers, breeders, and industry insiders open Bullvine Weekly for genetics insights, market shifts, and profit strategies they won’t find anywhere else. One email. Five minutes. Smarter decisions all week.


