










The calf buyer wanted more. The spreadsheet said cap it at 35%. ERS forecasts 25.31B lbs of beef in 2027 and heifers near $3,800. The lever’s on your breeding sheet right now.
Editor’s Note: The following case study is a composite scenario modeled from multiple Eastern U.S. herds reviewed by The Bullvine and its consulting sources in Spring 2026.
The breeding meeting was a kitchen table, three coffees, and a stack of October calf tickets the buyer had been calling about for weeks. A 500-cow Eastern dairy was about to push beef semen from 45% of services up to 55%. Day-old beef-on-dairy calves were clearing roughly $1,200 a head. The math for “more beef” looked like free money.
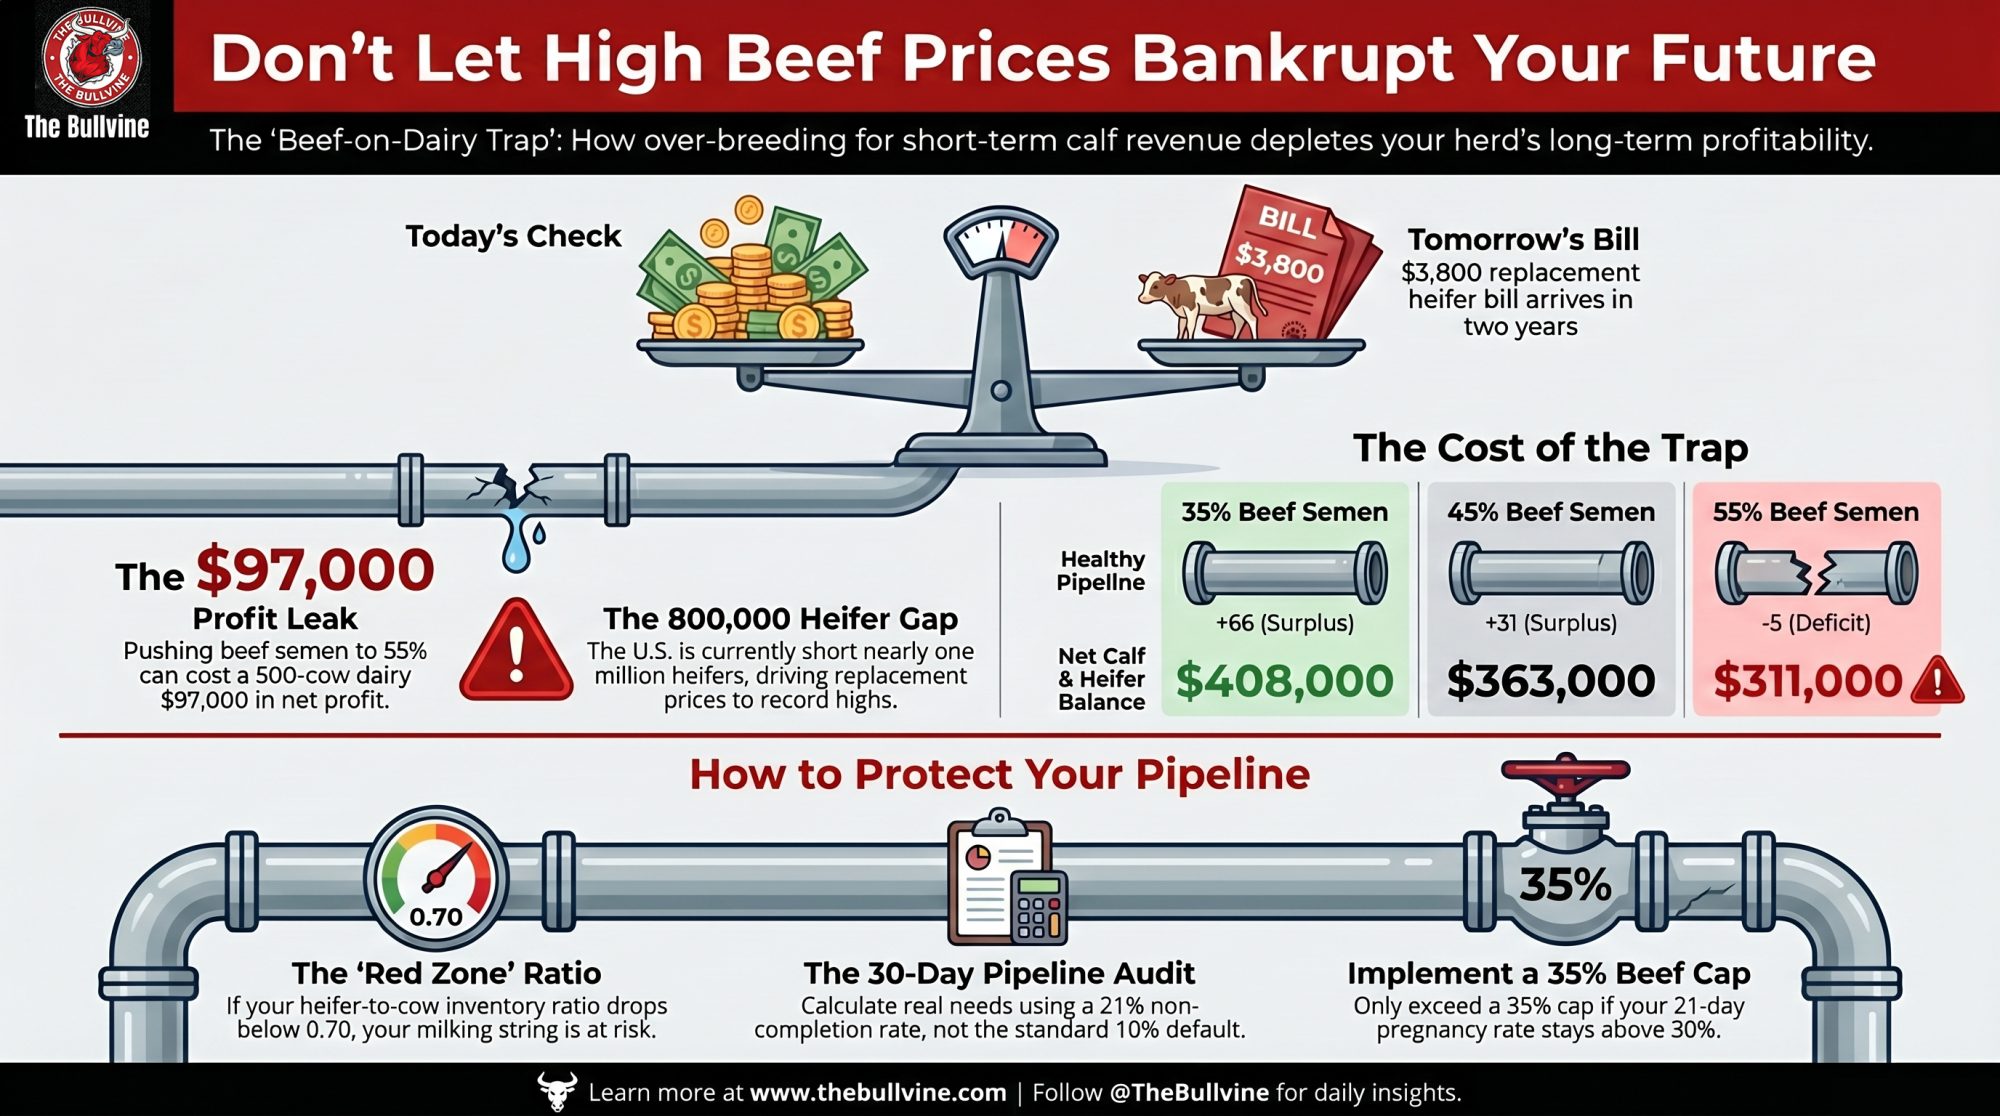
By the end of the meeting, beef was capped at 35%. That single line on the consultant’s spreadsheet — going from 45% to 55% beef — carried roughly $97,000 a year in net profit risk under the herd’s real assumptions. That’s the beef-on-dairy economics 2026 story most spreadsheets aren’t catching.
What USDA Just Told Both Sides of the Barn
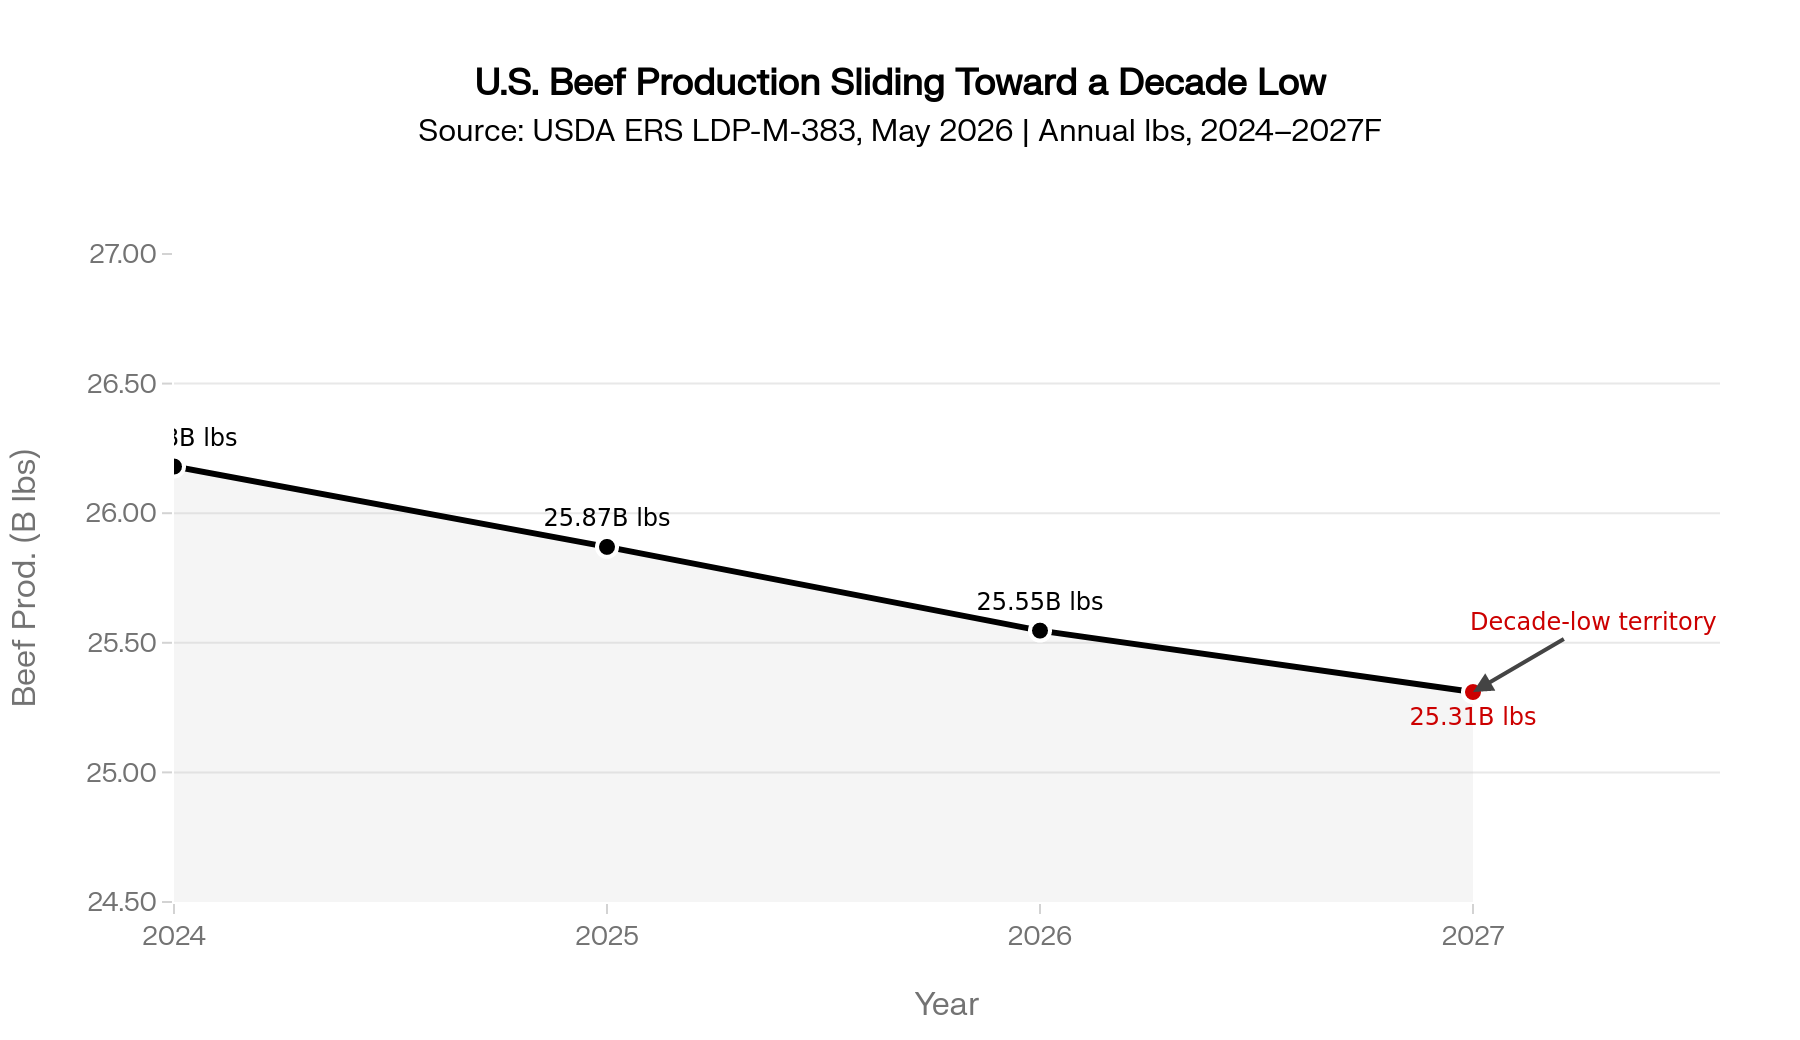
USDA’s Economic Research Service released its May 2026 Livestock, Dairy, and Poultry Outlook (LDP-M-383) in mid-May. The cattle headlines are loud. ERS forecasts U.S. beef production at 25.547 billion pounds in 2026 — down 243 million pounds from April’s projection — and 25.310 billion pounds in 2027, a 0.9% year-over-year decline and one of the lowest annual U.S. beef production figures of the past decade.
Feeder steers in the 750–800 lb range at the Oklahoma City National Stockyards traded near record territory the first week of May 2026, with reported daily averages around $388/cwt in the AMS Oklahoma City weekly summary. Slaughter steers ran in the same neighborhood, in the $258/cwt range on the AMS 5-Area Weekly Weighted Average for the same window. ERS expects new highs across feeder, slaughter, and cull cattle through 2027.
Then there’s the line dairy operators should read twice. ERS notes dairy cow slaughter is running at multi-year lows, partly because beef-cross calf returns are keeping marginal cows in the parlor longer.
That’s a feedback loop, not a coincidence. More beef-on-dairy calves means tighter beef supply means stronger cattle prices means even more beef-on-dairy calves. It also masks how thin your replacement pipeline has become.
The Other USDA Report Nobody’s Putting on the Same Page
Flip to NASS and CoBank, and the picture inverts. The January 30, 2026 NASS Cattle Inventory shows roughly 3.90 million dairy replacement heifers as of January 1, 2026 — the lowest count in the recent NASS historical series. CoBank Knowledge Exchange’s Q1 2026 dairy quarterly modeling has the U.S. short about 800,000 heifers through 2026, with 2027 adding back only around 285,000.
National replacement heifer prices sit near $3,010/head in current AMS National Dairy Market News reporting. Tight regional markets — Equity Cooperative Livestock Sales Association at Reedsville, Wisconsin and Northeast dairy auctions through April and May 2026 — have been clearing $3,800–$4,800/head. That’s the 2027 heifer pen showing up early.
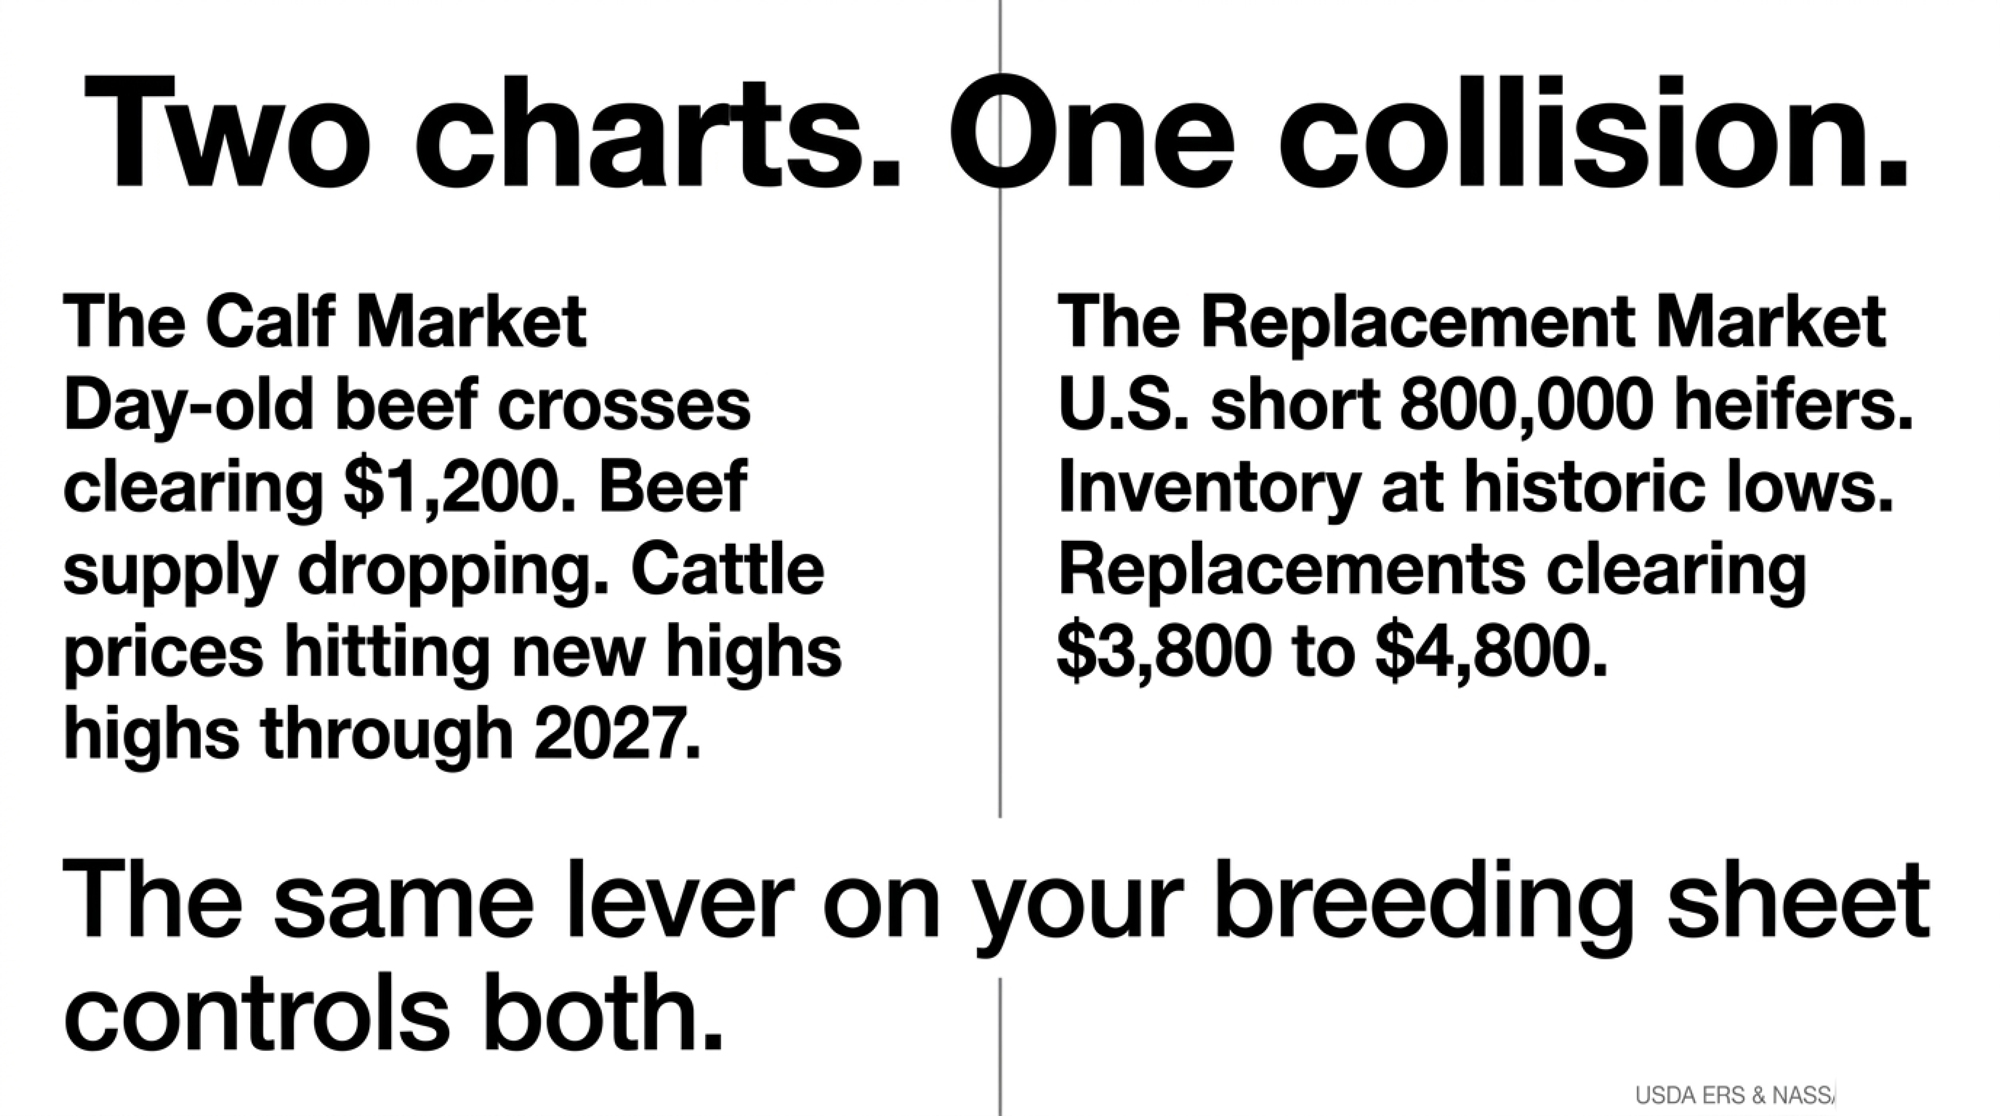
Two charts. One collision. Beef-on-dairy calf revenue has rarely paid better. The dairy replacement pipeline has rarely been thinner. The same lever on your breeding sheet — beef semen percentage — controls both numbers, and the cost of getting it wrong is bigger in both directions than it was even two years ago.
Running the Numbers: 35% vs 55% Beef on a 500-Cow Eastern Dairy
| Scenario | Heifers to First Calving | Net Heifer Status | Beef Calf Revenue | Net Calf+Heifer Balance |
|---|---|---|---|---|
| 35% Beef | ~231 | +66 Surplus | $210,000 | $408,000 |
| 45% Beef | ~196 | +31 Surplus | $270,000 | $363,000 |
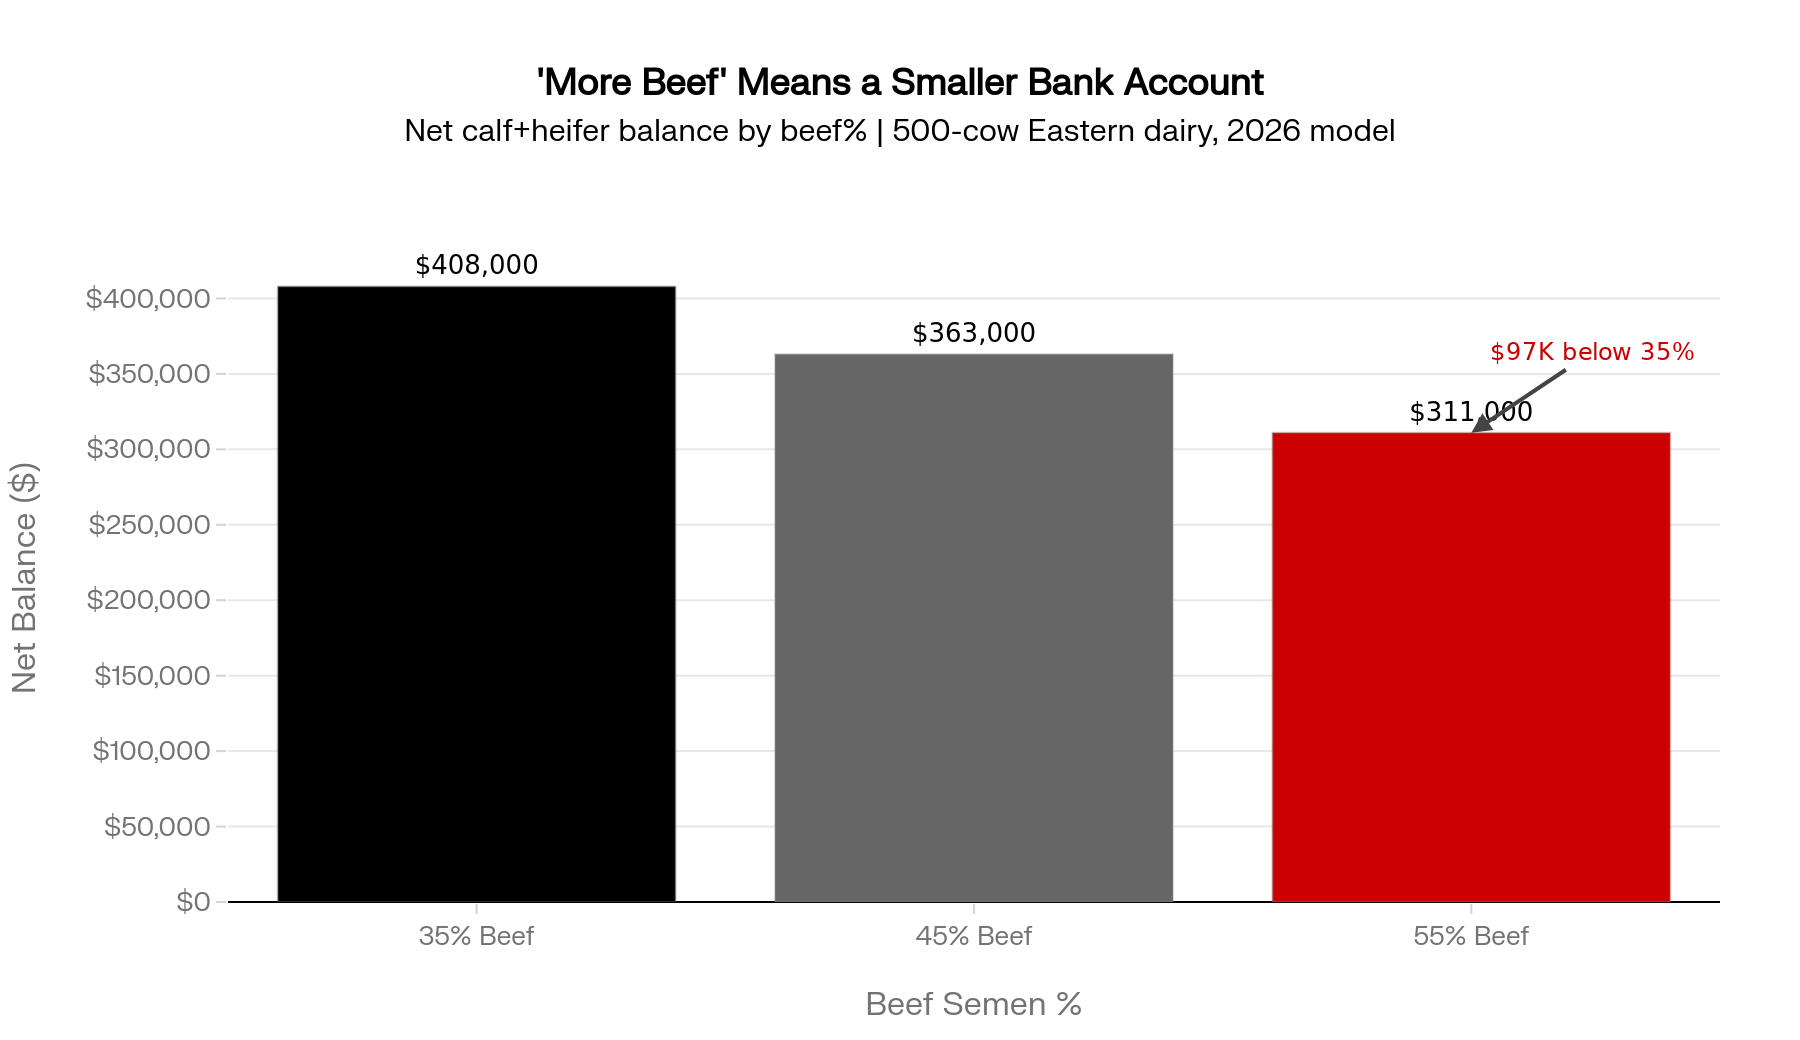
| 55% Beef | ~160 | -5 Deficit | $330,000 | $311,000 (–$97K vs 35%) |
This is the spreadsheet that ended the meeting. Every figure here reflects the herd’s stated assumptions, not a regional benchmark. Plug your own numbers in and watch what happens.
The consultant who chaired the meeting summed up the cap this way: when the calf market is hot and the heifer market is hotter, you don’t pick the percentage that maximizes today’s revenue — you pick the one your 2028 milking string can survive. That’s the rule that landed beef at 35%.
The inputs:
- 500 cows, 30% cull rate
- Age at first calving (AFC): 24-month target, 26-month actual
- Heifer non-completion (born to first calving): 21% (79% completion), consistent with USDA NAHMS Dairy mortality and culling commentary
- Beef-cross day-old calf value: $1,200/head
- Replacement heifer purchase price: $3,800/head
- Surplus heifer sale price: $3,000/head
- Sexed dairy semen: 42% conception, 90% heifer ratio, 79% rearing-completion, drawn from the 85-herd commercial Holstein dataset associated with Dr. Michael Overton’s published Zoetis work
- Beef semen conception: 57%
- Services-per-pregnancy: 2.4 sexed dairy / 1.8 beef, consistent with the consultant’s economic matrix
The Forward Replacement formula every operator should know by heart:
Replacements Needed = Herd Size × (Actual AFC ÷ 24) × Cull Rate × (1 + Non-Completion Rate)
Plug it in: 500 × (26/24) × 0.30 × 1.21 ≈ 197 heifers/year to hold herd size at this herd’s actual AFC and non-completion. Note the gap. The herd’s original spreadsheet baseline was 165 heifers, built off a 24-month AFC and a 10% non-completion default. The scenarios below run against that 165 figure — the same number the consultant’s spreadsheet used the day of the meeting. Run yours against your own real-world AFC and non-completion before quoting any of this as your own.
The table that ended the meeting
| Scenario | Heifers to First Calving | Net Heifer Status | Beef Calf Revenue | Net Calf-and-Heifer Balance |
| 35% Beef | ~231 | +66 (Surplus) | $210,000 | $408,000 |
| 45% Beef | ~196 | +31 (Surplus) | $270,000 | $363,000 |
| 55% Beef | ~160 | –5 (Deficit) | $330,000 | $311,000 |
Net-net: 55% beef adds $120,000 in calf cheques and quietly costs $97,000 once the replacement bill arrives. Bigger top line. Smaller bottom line.
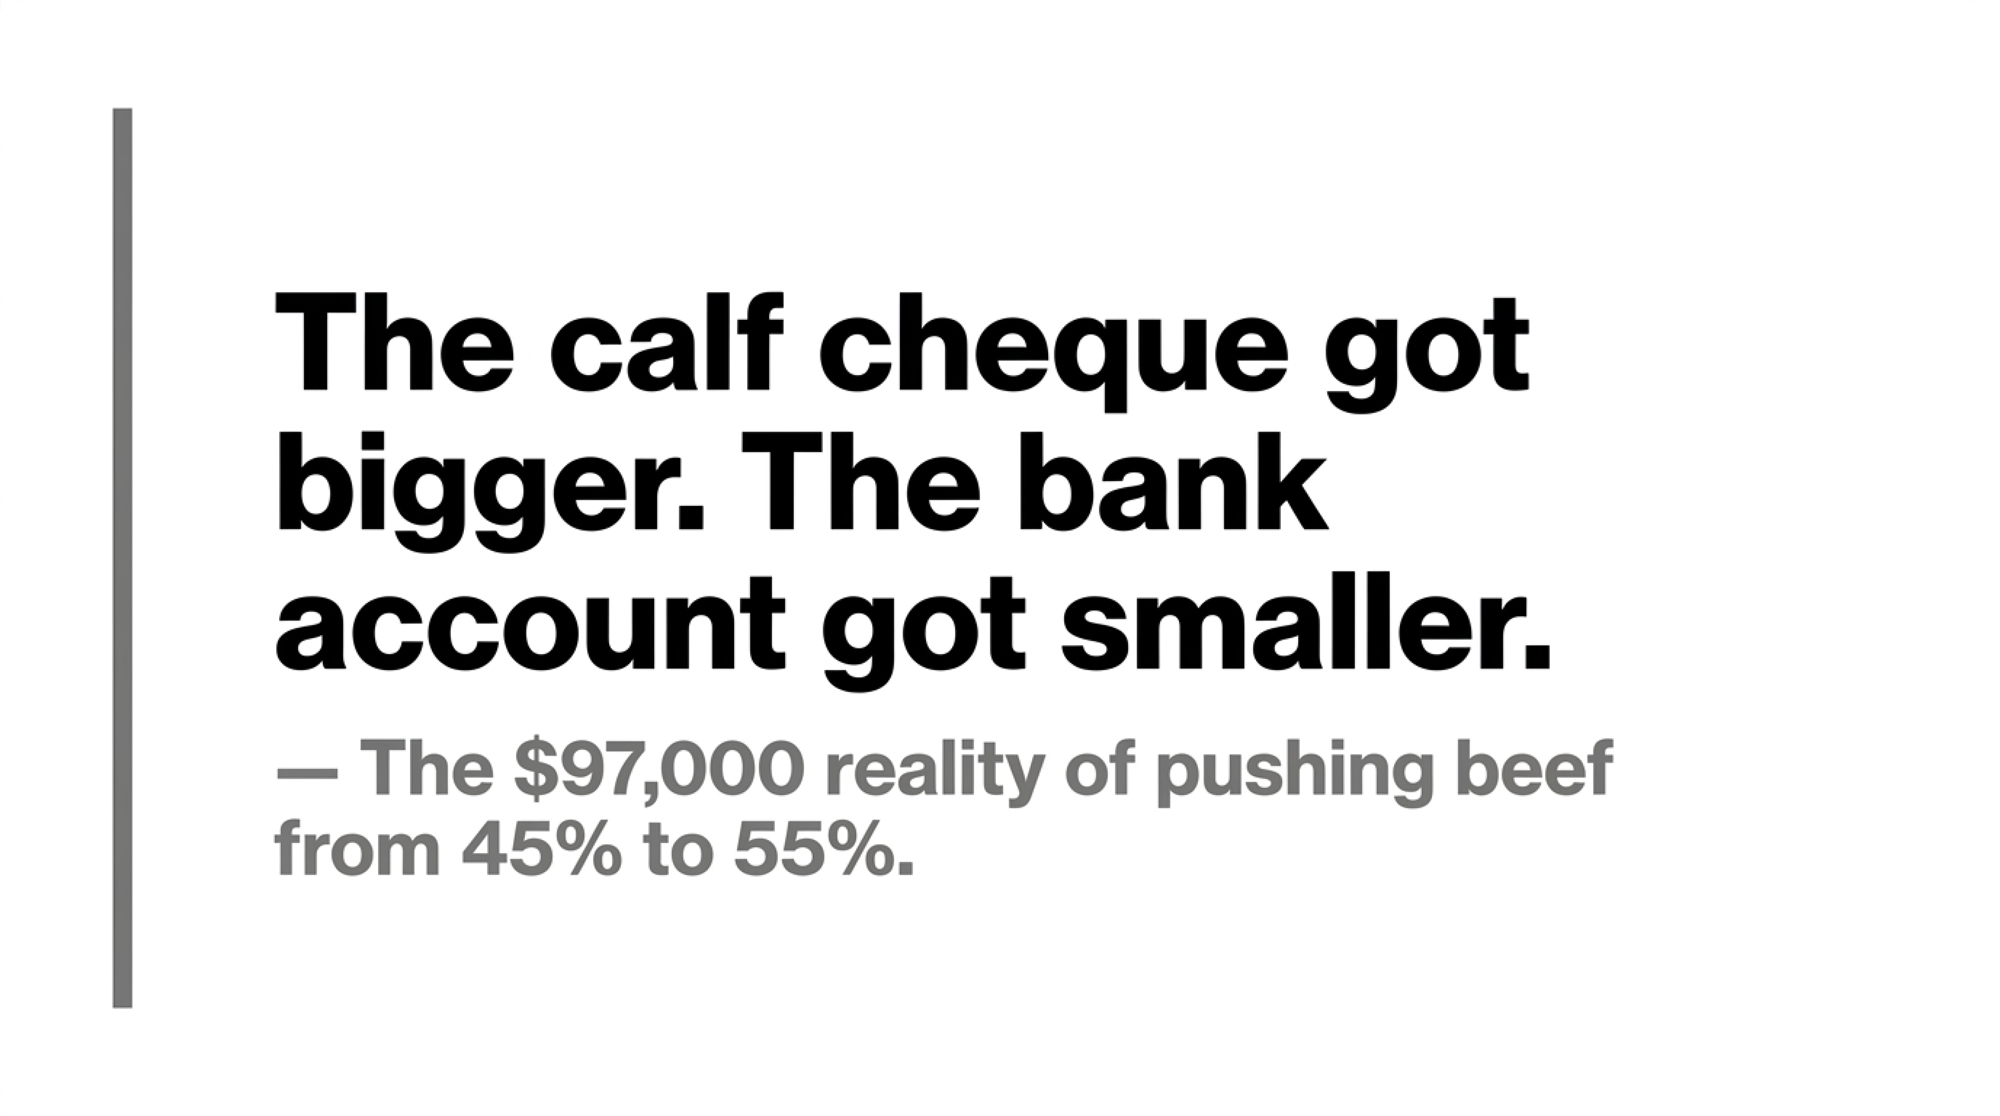
“The calf cheque got bigger. The bank account got smaller.”
What’s the Trap Hiding Inside a $1,200 Calf?
Timing. The calf cheque shows up tomorrow. The replacement bill shows up two breeding seasons from now.
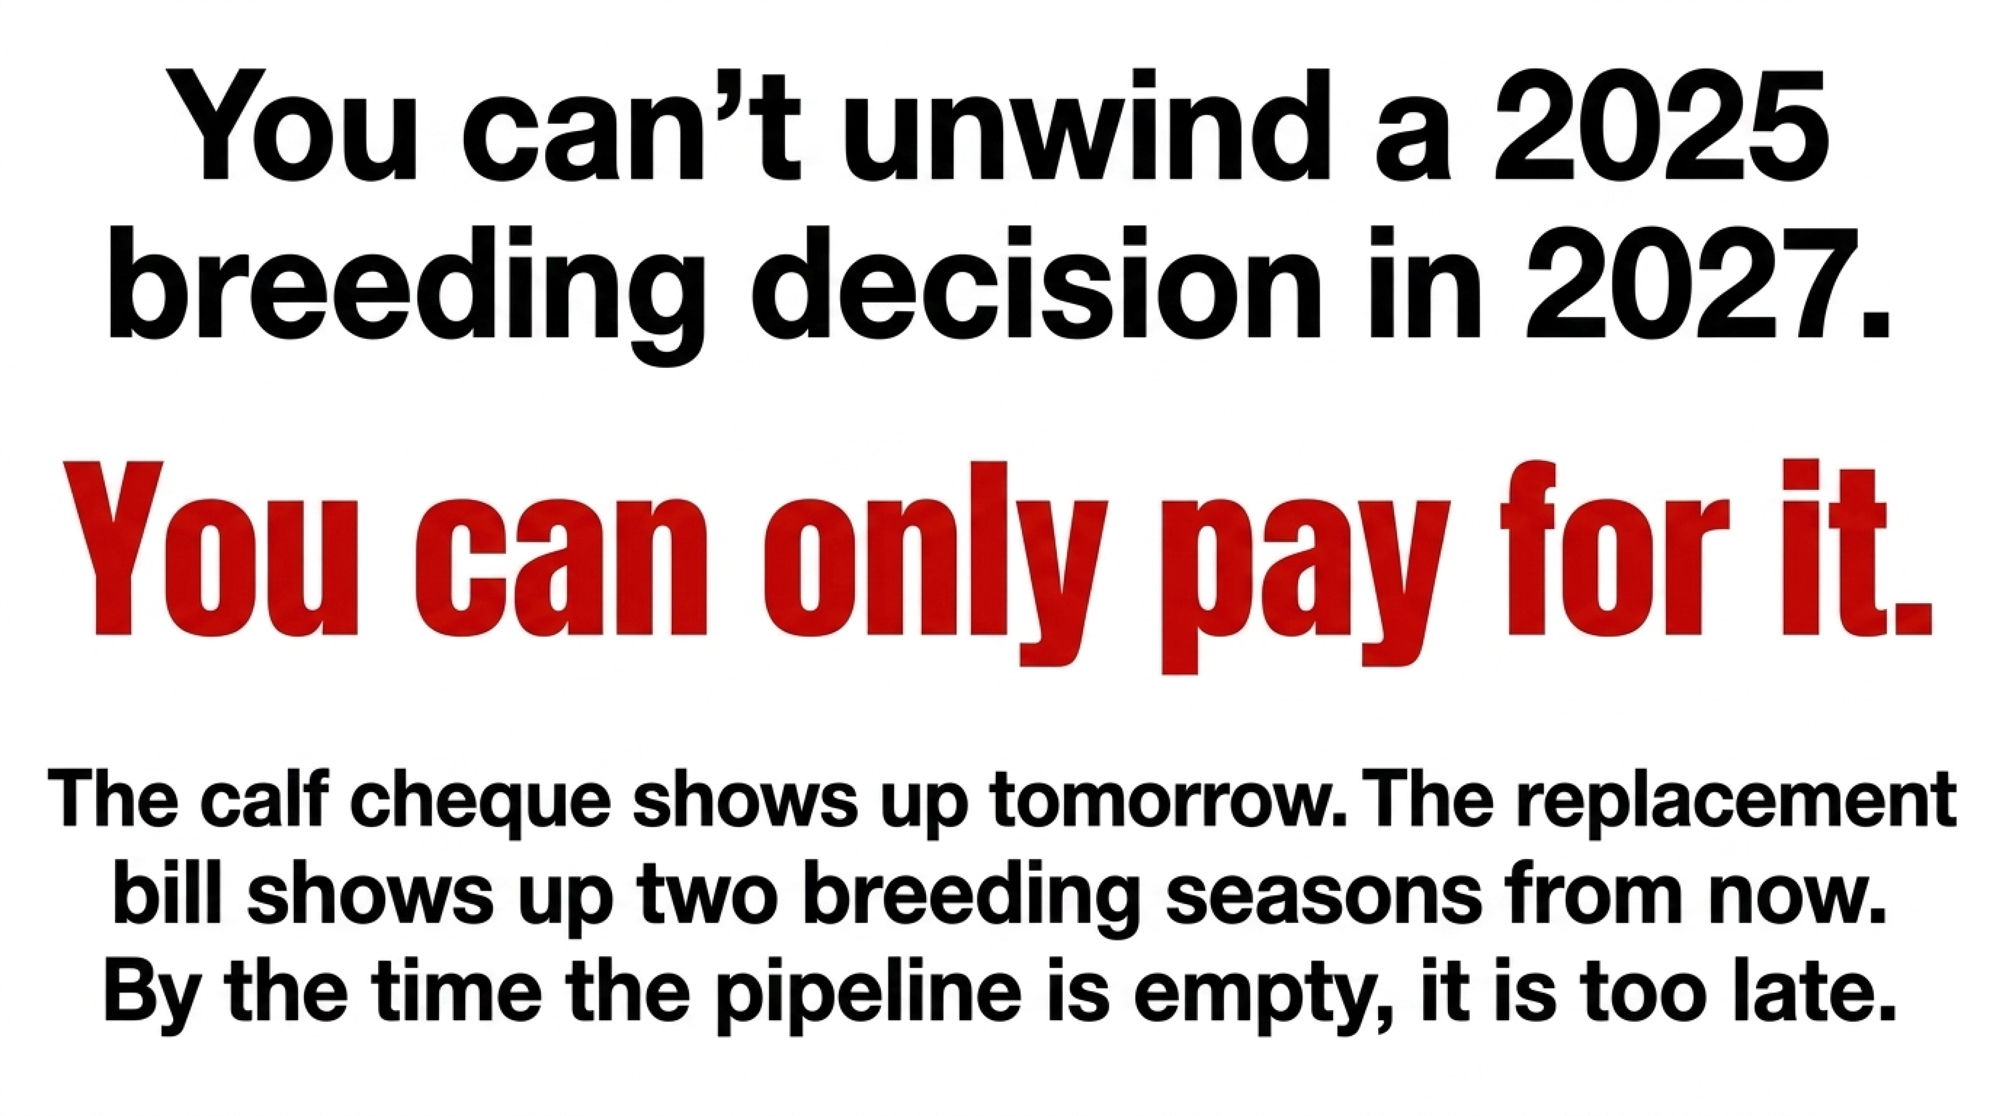
That’s the whole trap. There’s no way to make it disappear. The biology runs on a 24-to-30-month clock, so by the time a thin pipeline shows up empty in the parlor, the cows that should have been bred to sexed dairy are dry, sold, or already gone. You can’t unwind a 2025 breeding decision in 2027. You can only pay for it.
Everyone assumed the calf cheque was pure upside. The math says it’s a loan against your 2028 milking string, and the interest rate depends on what replacements cost when the bill arrives.
Scaling Up: What This Looks Like at 1,200 Cows
Run the same Eastern-herd inputs at a 1,200-cow operation and the modeled gap between 35% and 55% beef widens to roughly $235,000 in net calf-and-heifer balance. Drop the calf price toward $900 — within the range U.S. markets have hit before — and the gap widens further, because the lost calf revenue inside the 55% scenario can no longer cover the locked-in heifer purchase exposure.
The October 2025 Warning Shot
AMS regional calf reporting in mid-October 2025 described day-old beef-on-dairy calf values dropping in the $150-plus per-head range over roughly two weeks of trade. Anyone running a breeding program built on top-of-cycle calf prices got an unwelcome stress test, fast.
What Does Your Calf Have to Clear to Beat a Sexed Dairy Service?
The right comparison isn’t calf price. It’s expected value per service. Here’s the cleanest version of the math.
Using the Overton/Zoetis 85-herd Holstein assumptions (42% sexed-dairy conception, 90% heifer ratio, 79% rearing-completion, 95% pregnancy survival), gross expected value per sexed-dairy service comes to roughly $854 at $3,010 replacements, ~$993 at $3,500, and ~$1,163 at $4,100. These are gross EV figures before rearing and opportunity-cost adjustments. Apply your own cost stack to land on a net EV for your operation. Beef-on-dairy at a $1,200 calf and 57% conception comes in around $650/service after a small marketing-and-mortality adjustment.
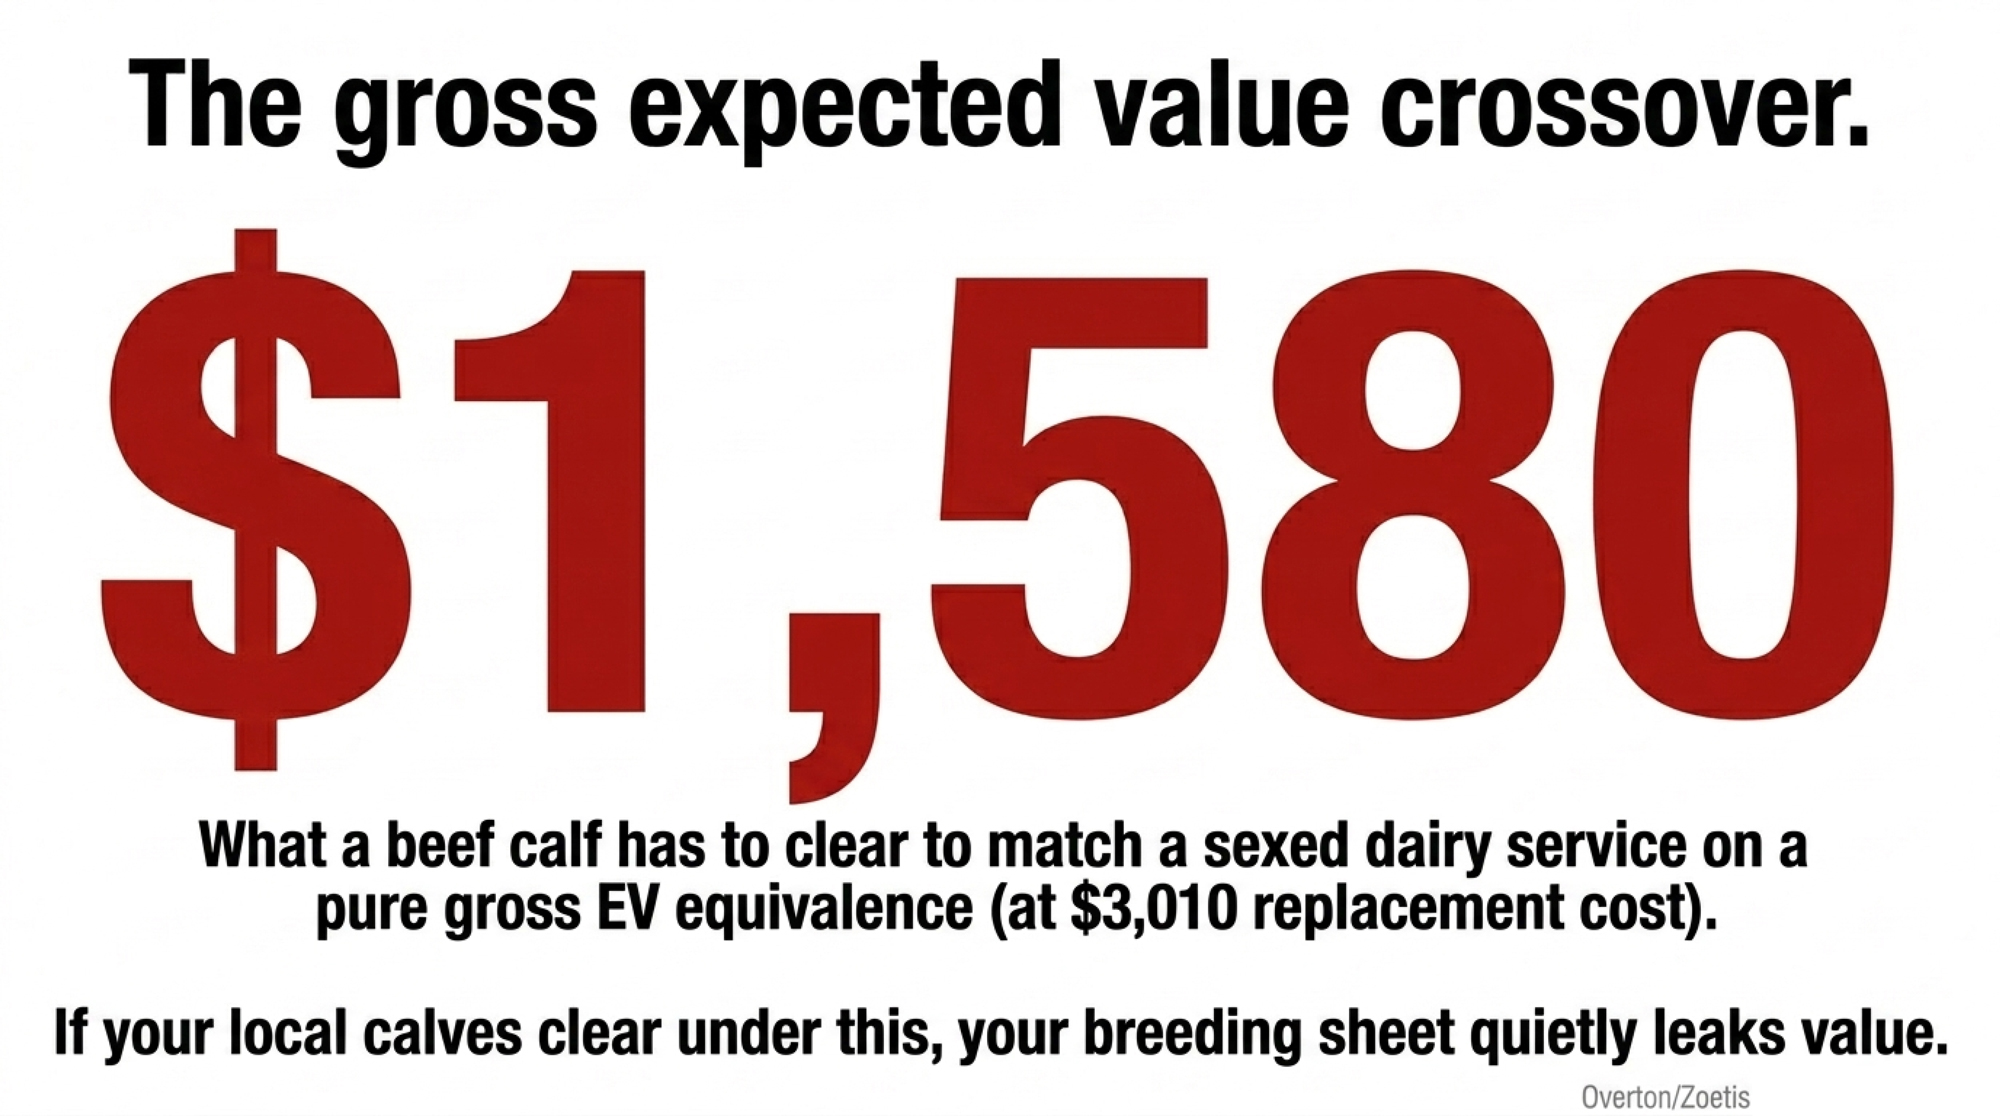
That sets the crossover — the day-old beef calf value where beef finally matches sexed dairy on EV. On a pure gross-EV equivalence (EV ÷ 0.57 conception), the crossovers come in at roughly $1,498 / $1,742 / $2,040 at $3,010 / $3,500 / $4,100 replacements. Layering in rearing and opportunity-cost terms — heifers cost real money to grow, and a sexed dairy service forecloses a beef calf that day — pushes the crossovers to roughly $1,580 / $1,931 / $2,262 in the consultant’s full cost-adjusted matrix.
| Replacement Heifer Price | Gross EV Crossover ($/calf) | Full Cost-Adjusted Crossover ($/calf) | Typical Regional Market (May 2026) | Below Crossover? |
|---|---|---|---|---|
| $3,010/head | $1,498 | $1,580 | ~$1,200 | Yes — $380 below |
| $3,500/head | $1,742 | $1,931 | ~$1,200 | Yes — $731 below |
| $4,100/head | $2,040 | $2,262 | ~$1,200 | Yes — $1,062 below |
| $3,800 (AMS tight mkts) | $1,895 | $2,100 | ~$1,200 | Yes — $900 below |
The exact crossover dollar varies by which cost stack you use. The conclusion doesn’t: most regional U.S. calf markets we’ve reviewed are clearing well below either set of numbers. A lot of breeding sheets look profitable on the calf invoice and quietly leak value on the replacement side.
Is Your Heifer Pipeline Already Telling You Something Your Spreadsheet Isn’t?
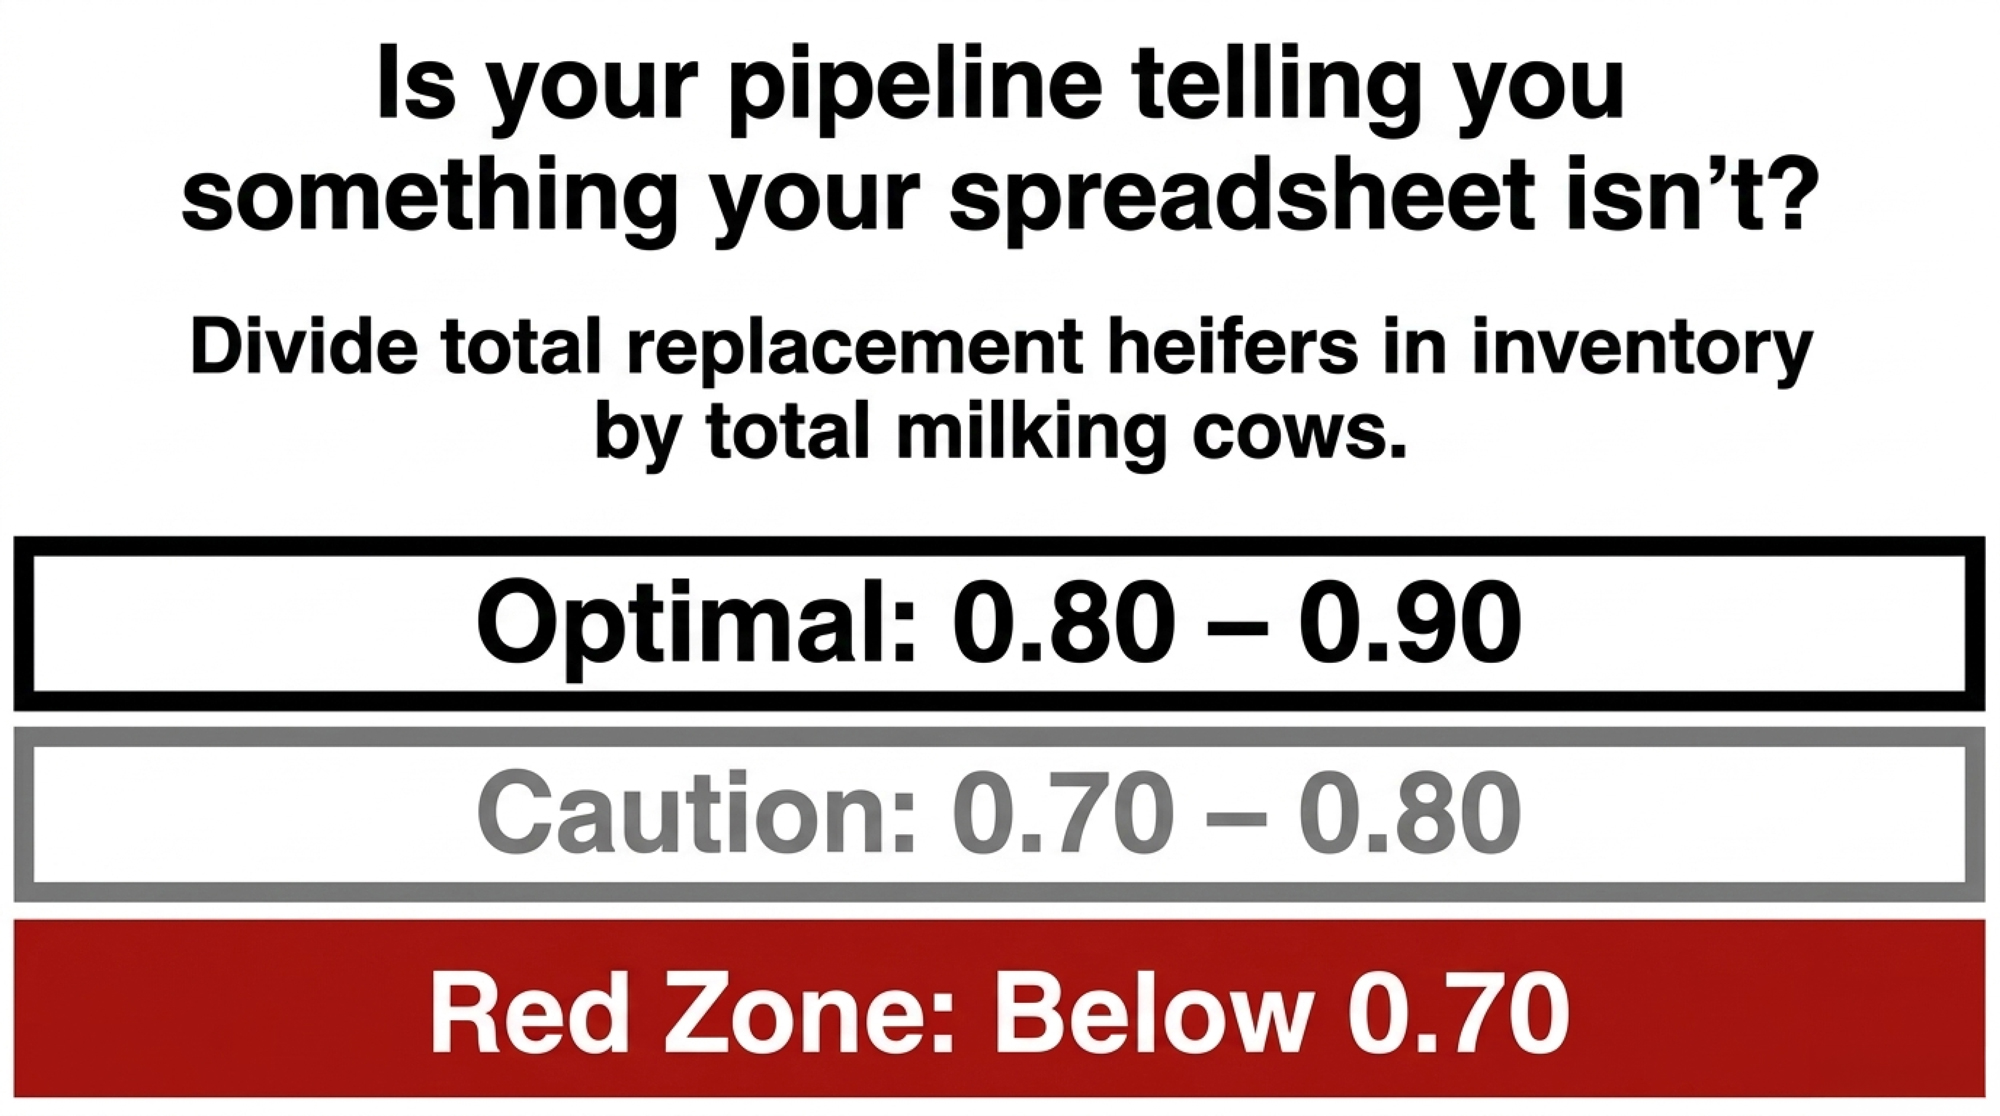
The metric most operators don’t track monthly: total replacement heifers in inventory divided by total milking cows. Treat it as a Bullvine planning framework consistent with Penn State Extension replacement-economics commentary.
- 0.80–0.90 = Optimal
- 0.70–0.80 = Caution
- Below 0.70 = Red
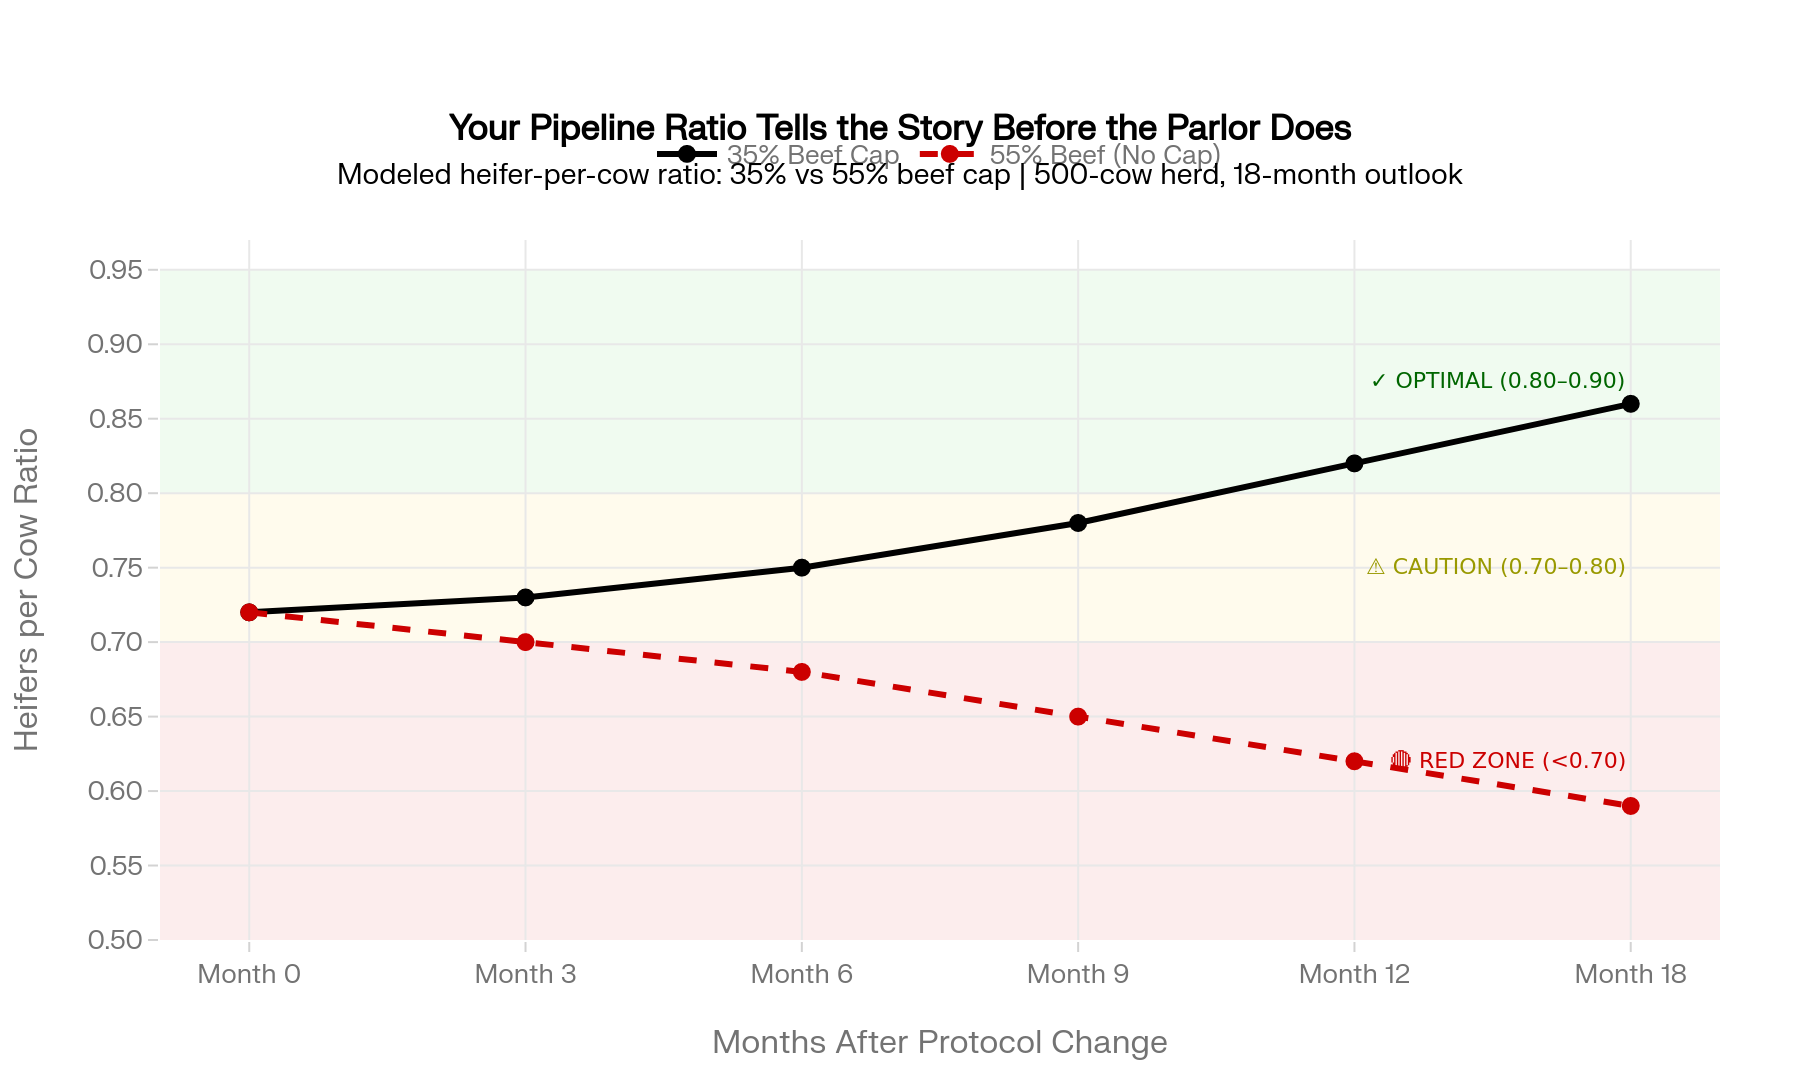
In the 500-cow Eastern model this article is built on, the pipeline ratio sat at 0.70–0.75 when the breeding meeting started. Eighteen months out, with the modeled 35% beef cap and sexed dairy locked onto the top genomic and high-fertility cows, the projected ratio climbs into the mid-0.80s. That’s a model projection from the consultant’s spreadsheet — not a measured outcome — and the phase pattern is what’s worth borrowing even if your numbers don’t match.
Pregnancy mix typically shifts within ~90 days of a protocol change. Heifer birth pattern shifts at roughly six months.
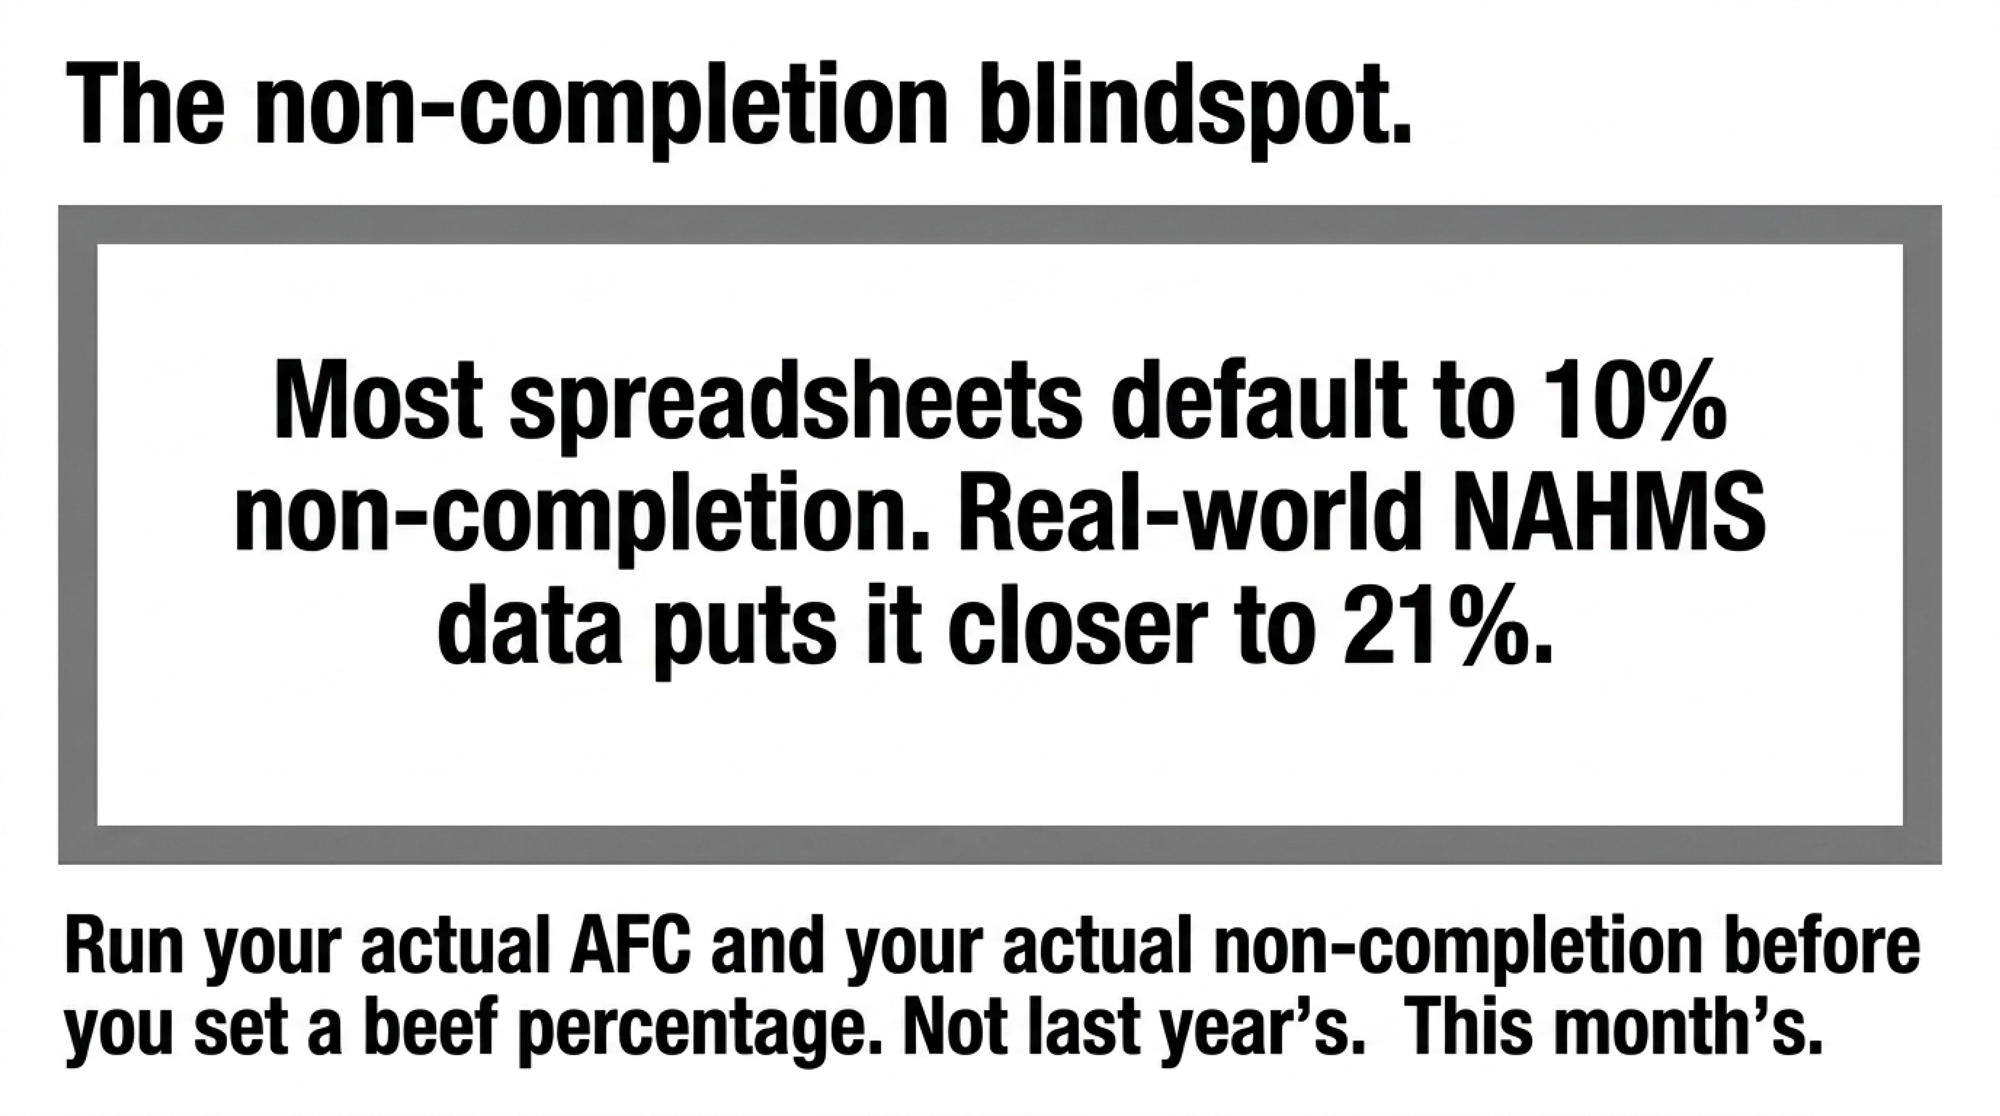
The pipeline ratio itself doesn’t catch up until ~9 months out. It often lands behind the spreadsheet because real-world non-completion (closer to 21% than the 10% most working spreadsheets default to) and AFC drift take bigger bites than projected.
That gap — between NAHMS-documented heifer non-completion and the assumptions sitting inside most working spreadsheets — is the one most often catching operators by surprise. Run your own Forward Replacement formula with your actual AFC and your actual non-completion before you set a beef percentage. Not last year’s. This month’s.
Options and Trade-Offs for Farmers
Action 1: Execute the 30-Day Pipeline Audit
Pull your last 12 months of heifer births, multiply by 0.79 to estimate completions (that’s 1 minus the 21% non-completion rate), and stack it against your (herd size × cull rate). Calculate your heifers-per-cow ratio and your real annual replacement need. If your ratio drops below 0.80, your beef percentage is already too high — no matter what the calf buyer is promising today. Requires clean DHIA or on-farm records, two to four hours depending on how clean those records are, and the willingness to act on the answer. Where it backfires: sloppy birth or AFC records produce false confidence in either direction. Forward-looking signal: if ERS’s 2027 forecast holds and replacement prices stay firm into 2028, this audit is the cheapest defense against a 2028 milking-string shortage.
Action 2: Implement a Dynamic Breeding Band
Stop treating beef percentage as a static number. Base it at 35% only when your 21-day pregnancy rate stays above 30% and your pipeline ratio sits comfortably between 0.80–0.90. If either metric slips, aggressively choke beef back to 25–30%. Pull beef entirely if dairy pregnancies drop below 42% of weekly total for three consecutive weeks. Requires weekly repro reporting and someone with veto authority who can hold the cap when the calf market argues against it. Let the metrics run the cap, not the calf market.
Action 3: Enforce Strict Genomic Quartiles
Lock sexed dairy onto your top 25–30% cows by GTPI/NM$ and components. Beef goes on the bottom genomic quartile, repeat breeders, and old parities. Period. No “she looks good” overrides. That’s how the protocol collapses by month three.
What this requires in practice: genomic testing on every heifer (commercial Holstein testing runs $40–$50 per animal, varying by lab and CDCB nomination fees), a written eligibility rule, and an exception protocol that forces a one-for-one heifer trade rather than a one-way override. If average GTPI on your fresh 2-year-old string ticks up materially over 18 months, the protocol is working before the pipeline ratio fully catches up.
Action 4: Stress-Test the Plan at $900 Calves
If the math only works at $1,200, you don’t have a strategy. You have a bet on the top of the cycle. Build a scenario column at $1,200, $900, and $700 calves. Trigger: if 55% beef only beats 35% beef at $1,200+ calves, the cap stays at 35%. Pair it with USDA RMA’s Livestock Risk Protection coverage on feeder cattle and slaughter cattle if your calf marketing pattern fits the LRP coverage windows under current RMA program rules.
Key Takeaways
- If your heifers-per-cow ratio is below 0.80, cap beef tighter than the calf market is asking — your 2028 milking string is already getting short.
- If your 55% beef scenario only beats your 35% beef scenario at $1,200+ calves, your beef percentage stays at 35%. Don’t let the calf cheque run the breeding sheet.
- If your AFC is 26 months instead of 24, you need about 8% more replacements per year to hold herd size. Real non-completion at 21% instead of 10% adds another 10% on top.
- Your top genomic quartile getting beef semen because she’s a repeat breeder? She’s the first cow to move back to sexed dairy — not the last.
- If your local calves are clearing under your crossover price, beef belongs capped tighter than your calf buyer is suggesting.
What’s Your Move?
ERS is telling you cattle prices stay strong through 2027. NASS and CoBank are telling you replacements stay short and expensive. So what does your breeding sheet actually say about heifers per cow, AFC, and real non-completion this month — and what does your calf buyer’s contract look like 18 months from now if you keep your beef percentage exactly where it is today?
Learn More
- The $3,000 Heifer Hangover: How Beef-on-Dairy Emptied Your Pipeline and Left the U.S. 800,000 Head Short— Arms you with a macro-level breakeven playbook showing how multi-year heifer deficits devour milk margins, mapping out a 30-day structural response strategy for multi-thousand-dollar replacement spikes.
- Beef-on-Dairy’s $6,215 Secret: Why 72% of Herds Are Playing It Wrong — Exposes why a 20% reproductive cushion dictates your crossbreeding viability, breaking down field metrics that prove a 30% pregnancy rate shifts monthly beef-dairy cash flow threefold over mid-tier competitors.
- Heifer calf mortality: the $40,000 barn math – The Bullvine — Delivers a strict hutch-level financial framework to prevent thousand-dollar genetic investments from dying young, proving that shaving two mortality points safeguards over $27,000 in locked-in pipeline value.
The Sunday Read Dairy Professionals Don’t Skip.

Every week, thousands of producers, breeders, and industry insiders open Bullvine Weekly for genetics insights, market shifts, and profit strategies they won’t find anywhere else. One email. Five minutes. Smarter decisions all week.
