Archive for Class III Class IV spread

150 Million Pounds Left the Pool. Your PPD Paid for It.

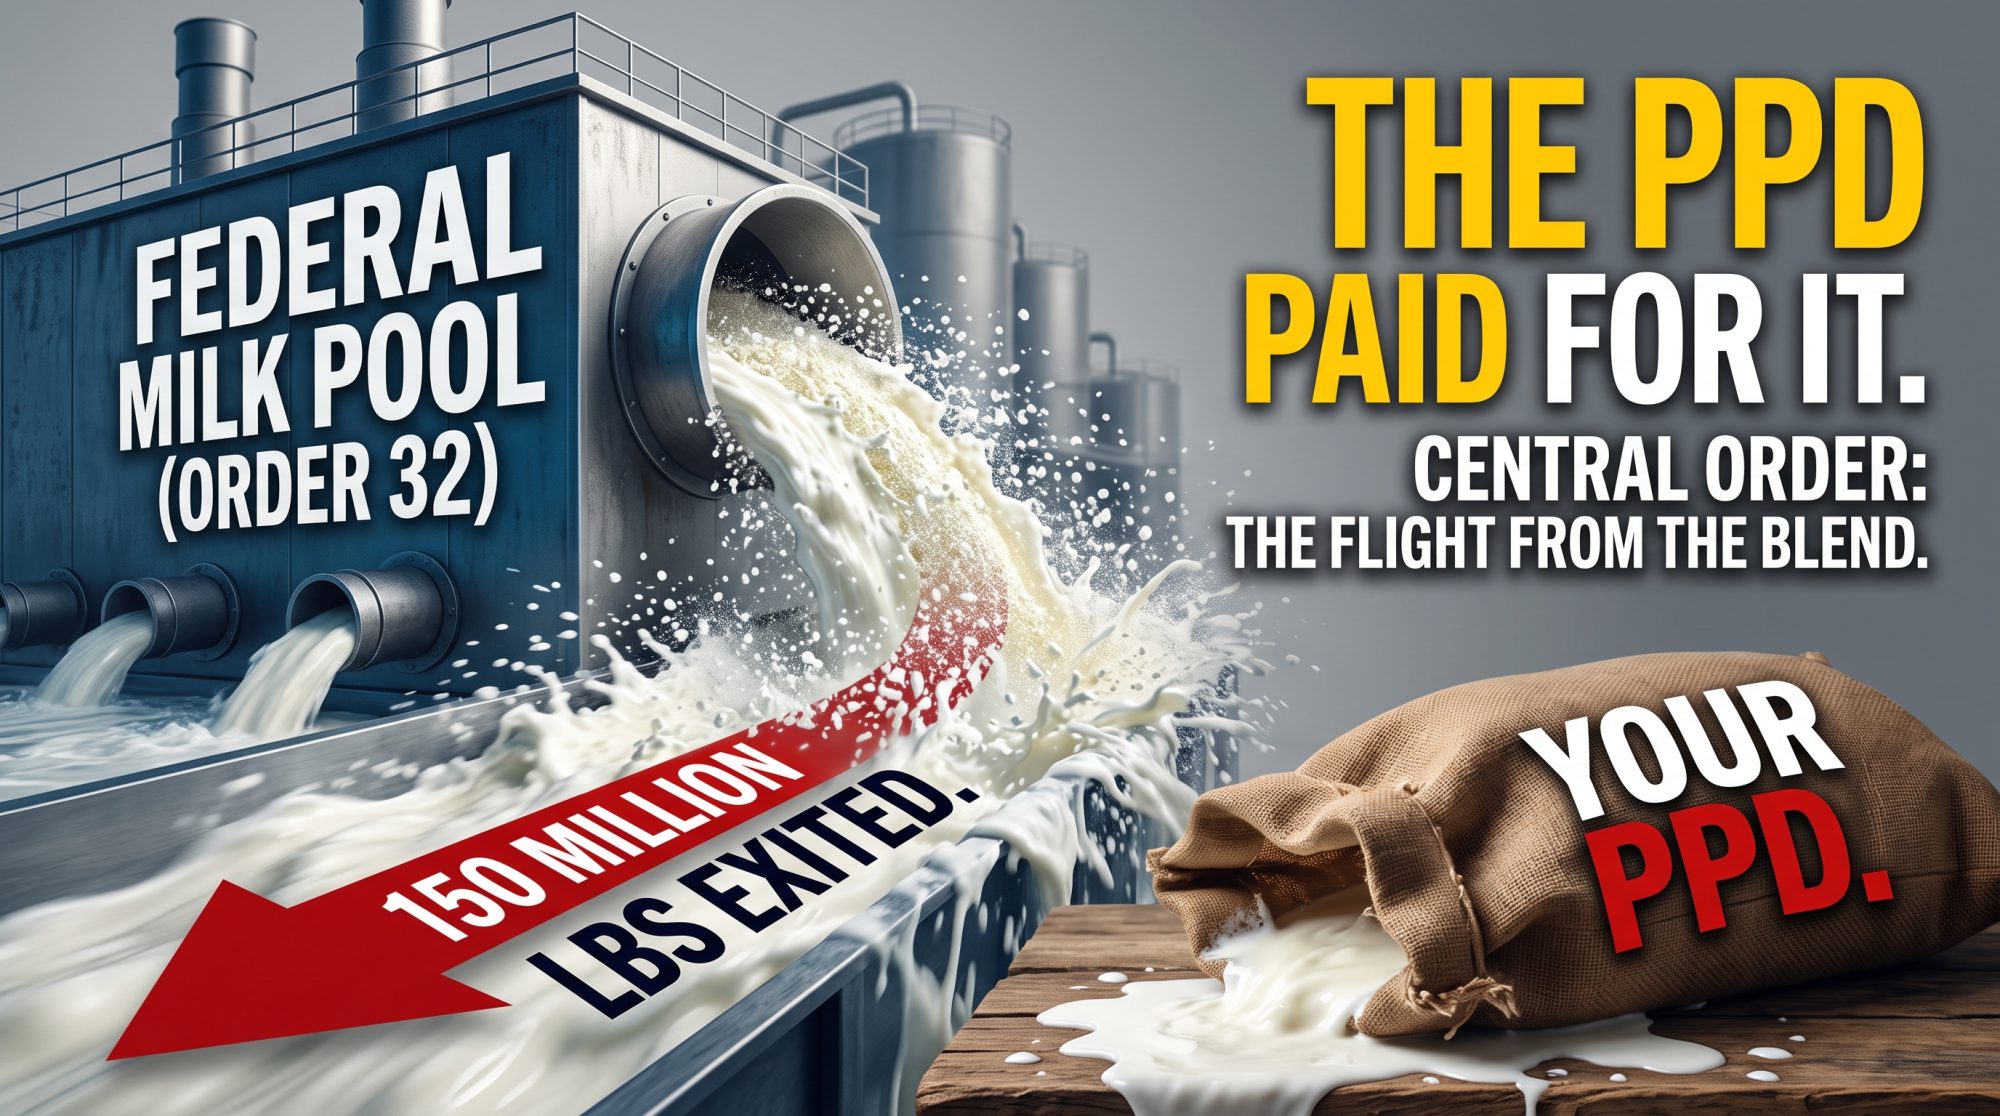
Central Order pooled milk fell from 1.50 billion pounds to 1.35 billion in a year. That’s not a market move. That’s handlers stepping off the pool, and your producer price differential wearing it.

Executive Summary:

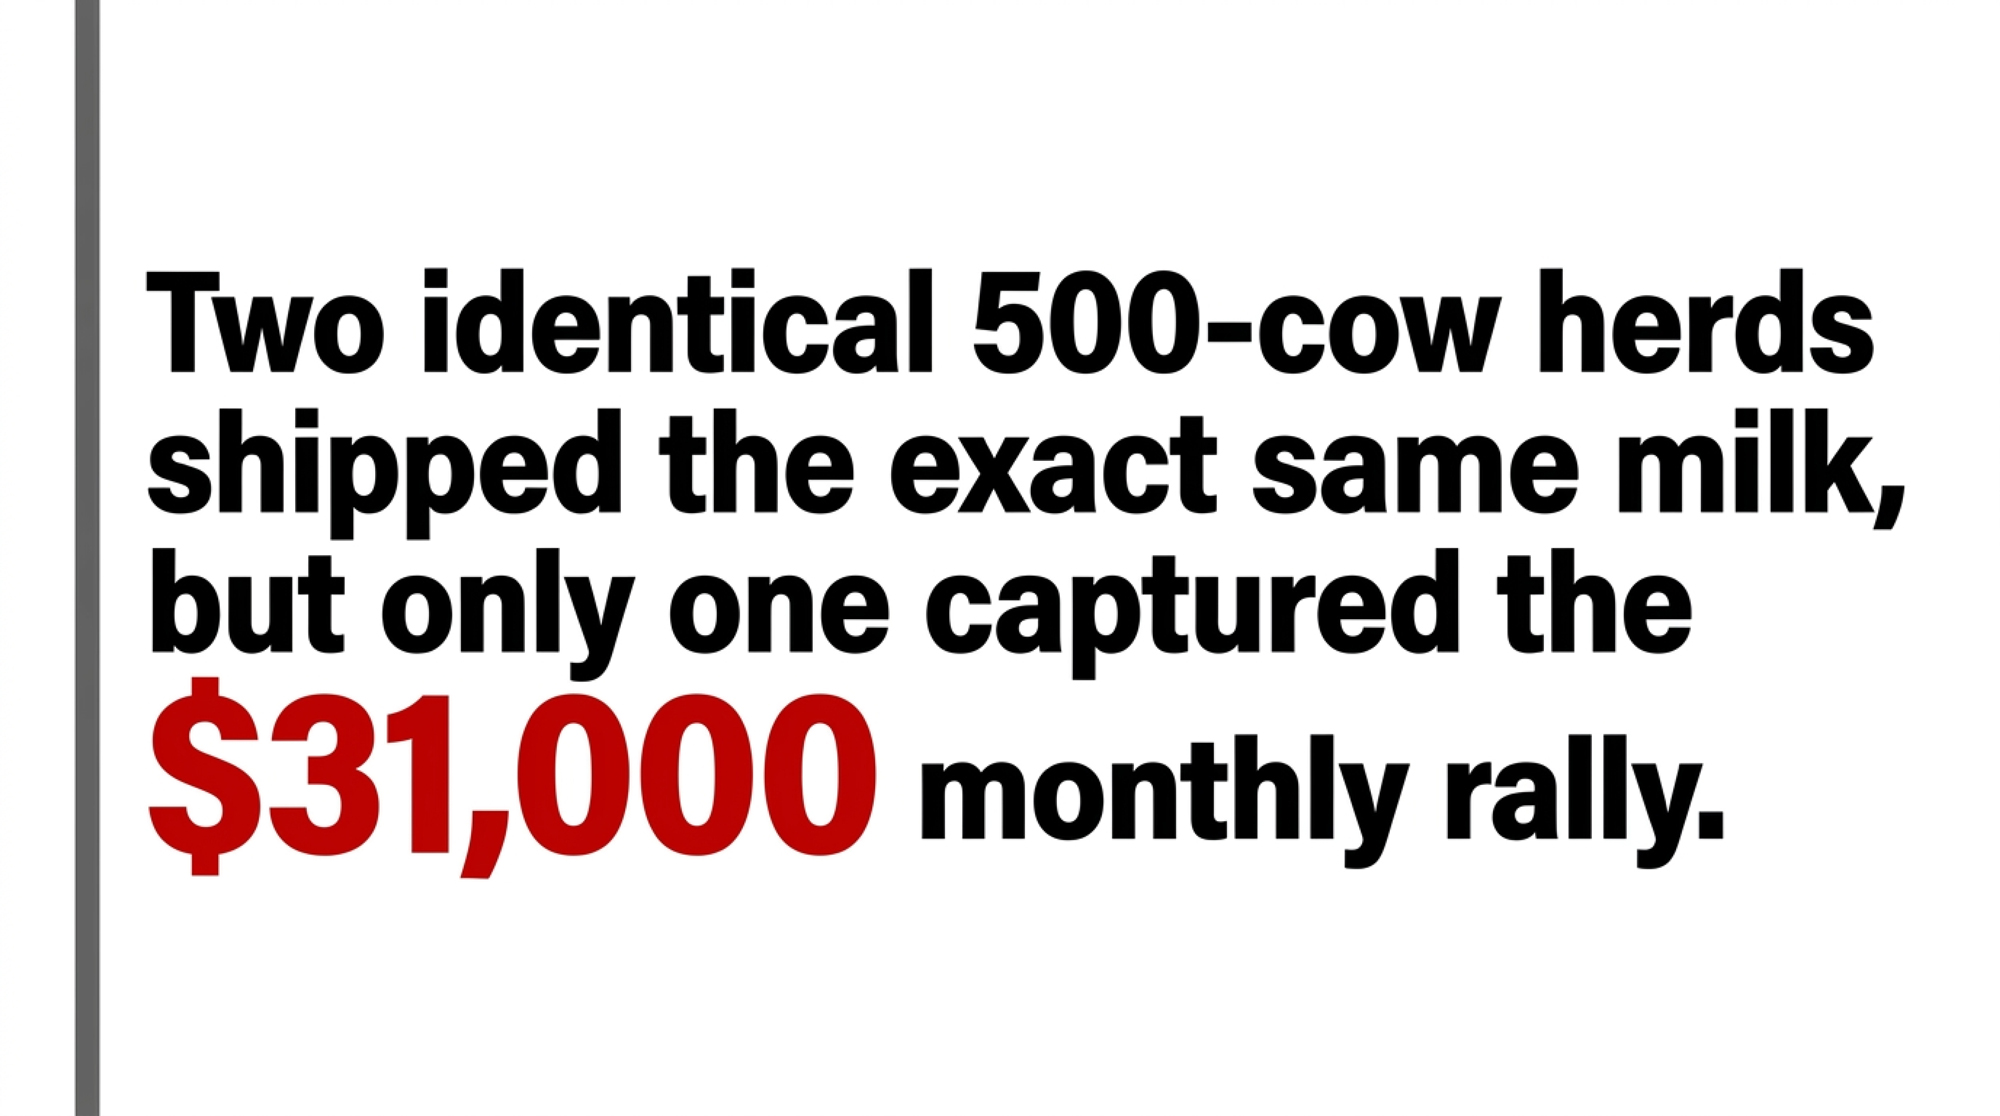
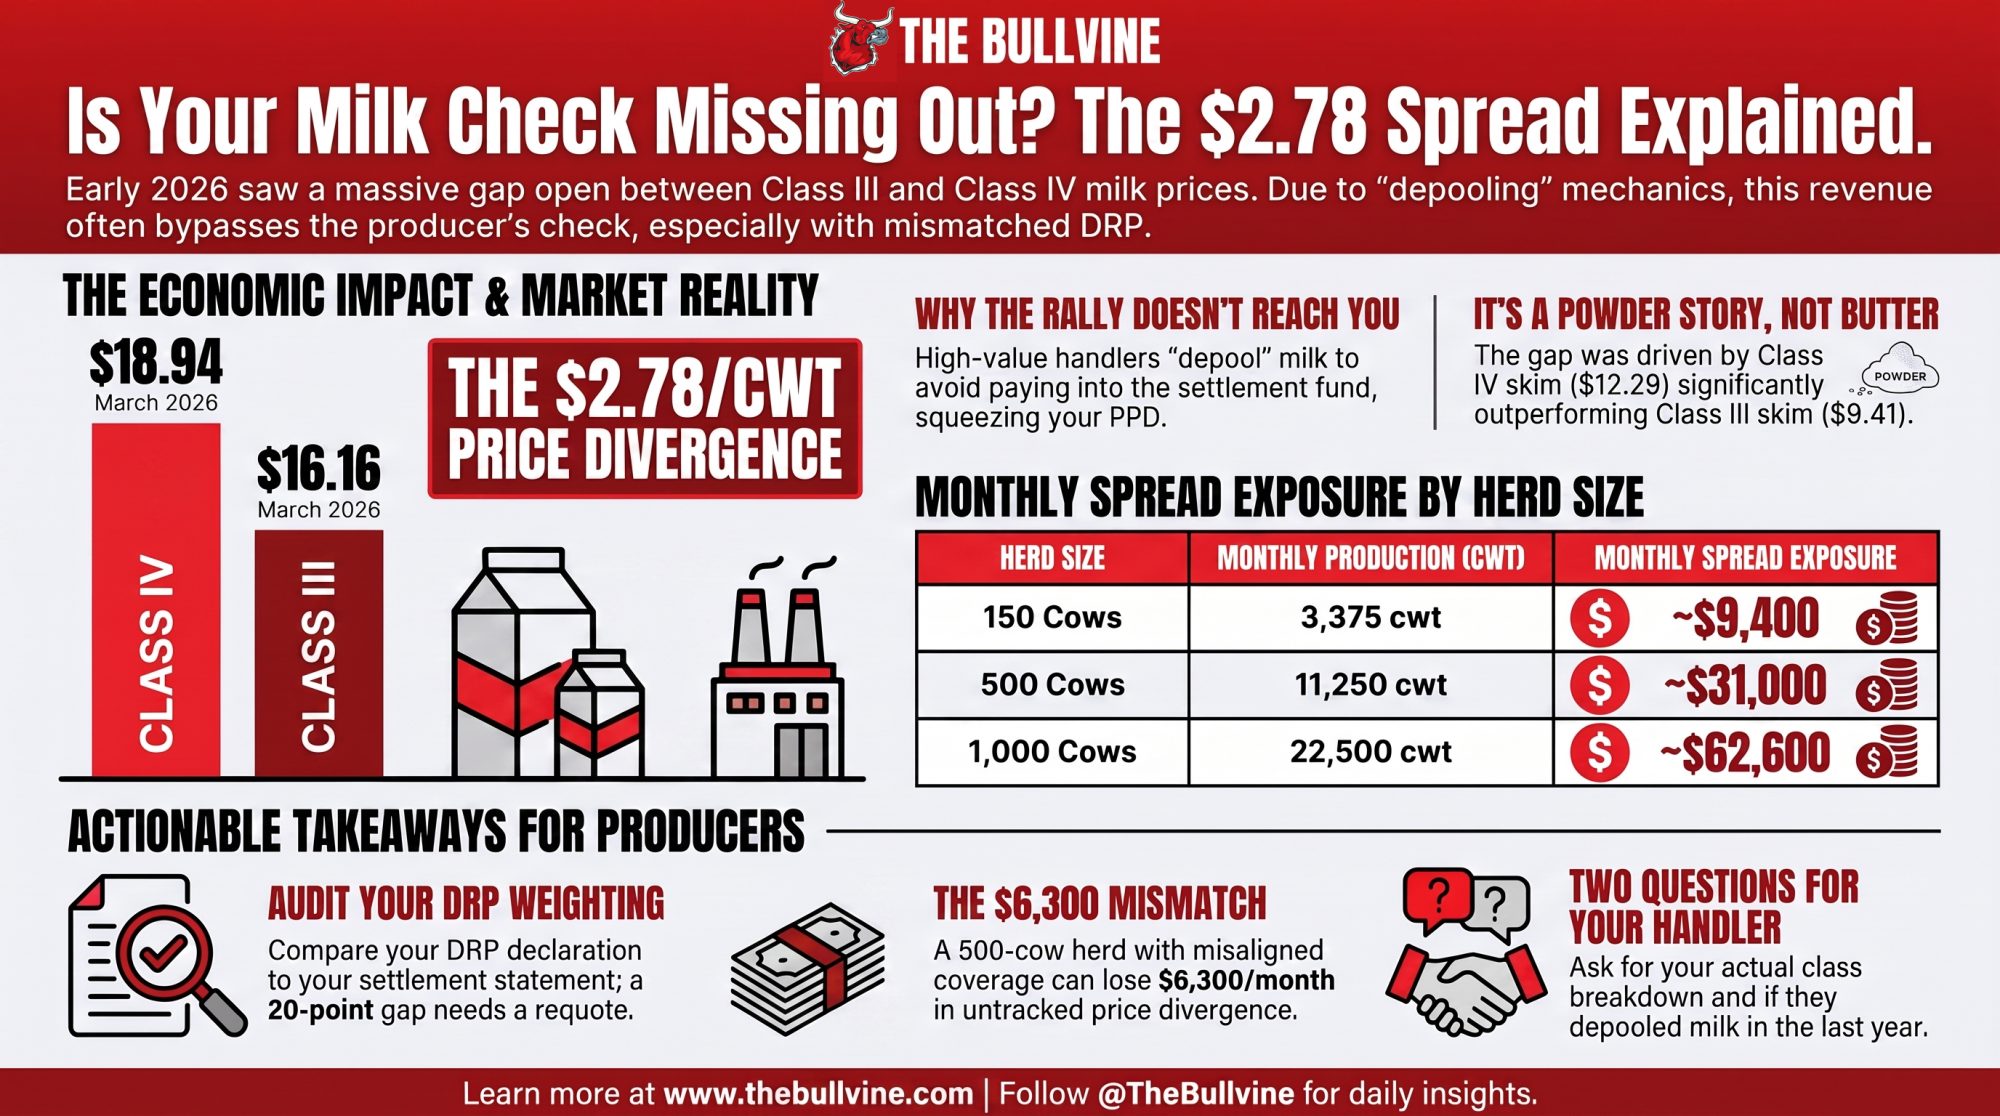
  • The gap. Class III settled at $16.16/cwt in March 2026 while Class IV hit $18.94, a $2.78/cwt spread worth roughly $31,000 a month on 500 cows and about $9,400 on 150. UW-Madison Extension’s Leonard Polzin traced the divergence to nonfat dry milk rather than butter: $12.29/cwt Class IV skim against $9.41 Class III skim.
  • The mechanism. When Class IV runs that far above a federal order’s uniform price, butter and powder plants step off the pool rather than pay into the producer settlement fund. That revenue never reaches the uniform blend, so the producer price differential riding on top of your component cheque gets squeezed, or goes negative.
  • The fix. A 500-cow herd on a 60/40 cheese-powder pool carrying an 80/20 Class III DRP election shows roughly $6,300 a month of class divergence its policy isn’t tracking. Fifteen minutes with your settlement statement and your DRP declaration side by side tells you whether you’re one of them.
Class III Class IV spread

Analysis as of Aug. 26, 2026.

Class III milk settled at $16.16/cwt in March 2026 while Class IV hit $18.94, a $2.78/cwt spread worth roughly $31,000 a month on a 500-cow herd. Two operations with the same cows, the same ration, and the same diesel bill landed on opposite sides of it. Neither did anything to earn the difference.
March 2026Class IIIClass IVGap
Announced price$16.16/cwt$18.94/cwt$2.78/cwt
Skim milk price$9.41/cwt$12.29/cwt$2.88/cwt
Priced offCheddar + dry wheyButter + NFDM

Source: USDA class prices via Polzin, UW-Madison Extension

Ship into a Wisconsin cheese plant, and the formula put you on the other side of it. The driver isn’t the one the shorthand suggests.

Everyone Assumed Butter. The Skim Side Was Doing the Work.
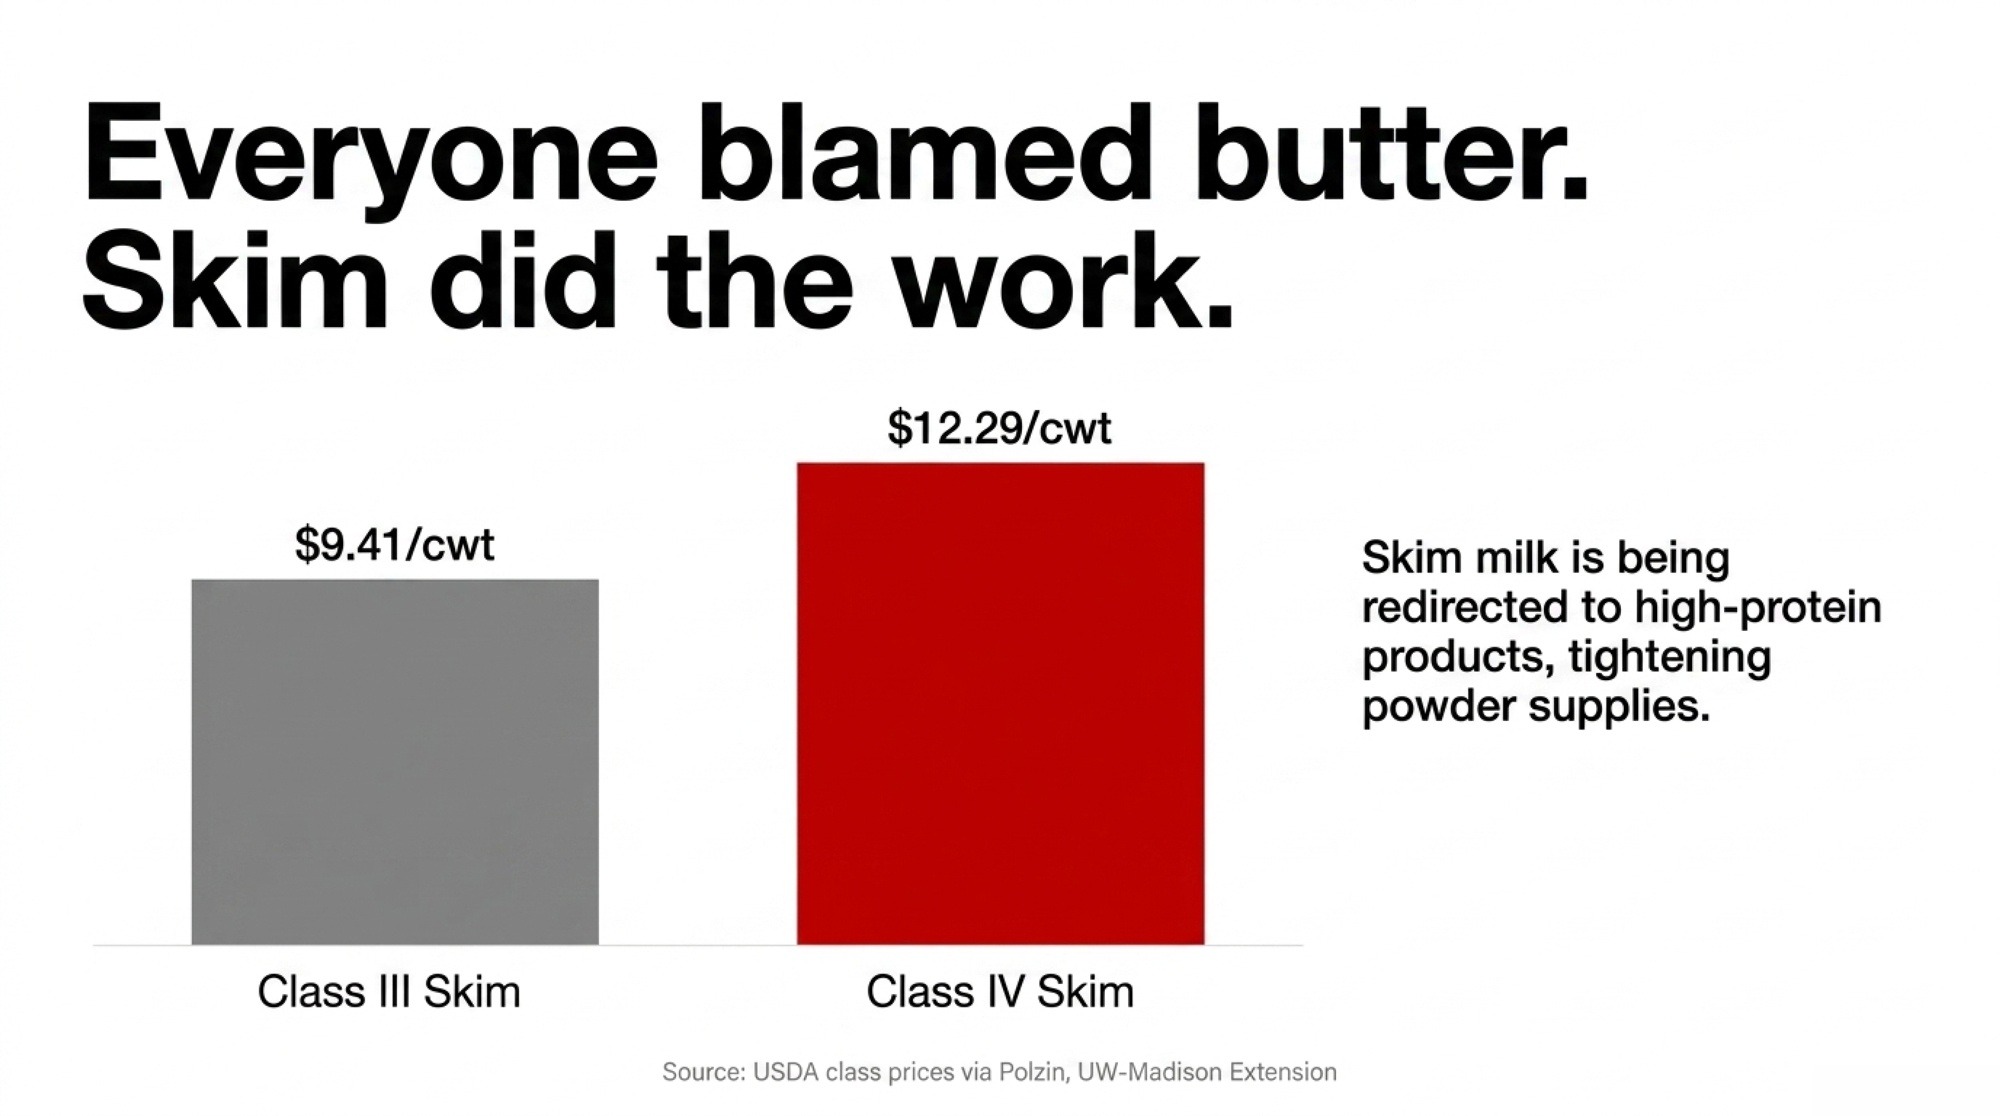
Leonard Polzin, Dairy Markets and Policy Outreach Specialist at the University of Wisconsin–Madison Division of Extension, worked through the Federal Milk Marketing Order formulas to find where the gap came from. Class IV is the butter-and-powder class, so the reflex is to blame butter.

His analysis points to nonfat dry milk instead, the powder left after water comes out of skim, which sets the nonfat solids value in the Class IV formula. That $2.88/cwt skim gap in the table above is the whole story in one line.

Polzin named the structural reason too, and that’s the part with staying power: skim milk is getting redirected toward ultrafiltration and high-protein products, tightening what actually reaches the dryers. Processing-mix shifts don’t reverse inside a quarter.

By early May, Iowa State University Extension was tracking a Class IV/Class III futures gap of roughly $5/cwt, the widest that difference has ever been. This isn’t a one-month oddity.

Why a Class IV Rally Never Reaches a Cheese Cheque

Polzin states plainly that this NFDM-driven Class IV strength does not flow directly into the pay price for Wisconsin cheese-route producers. The pooling mechanics are why.

Under a federal order, Class I fluid milk must always stay pooled. Manufacturing milk — Class II, III, and IV — can be kept out, and handlers do exactly that when a class price runs above the order’s uniform price. Butter and powder plants pull their milk off the pool rather than pay the difference into the producer settlement fund. Cheese plants can do the same when the arithmetic favors them; this isn’t a one-way mechanism.

The practical effect for an Upper Midwest (Order 30) shipper is narrower than “you missed the rally.” You’re paid Class III component values plus a producer price differential. When high-value Class IV milk leaves the pool, that revenue never enters the blend at all, so the PPD sitting on top of your component cheque gets squeezed, or goes negative. There was no Class IV upside to share. It exited before the sharing happened.
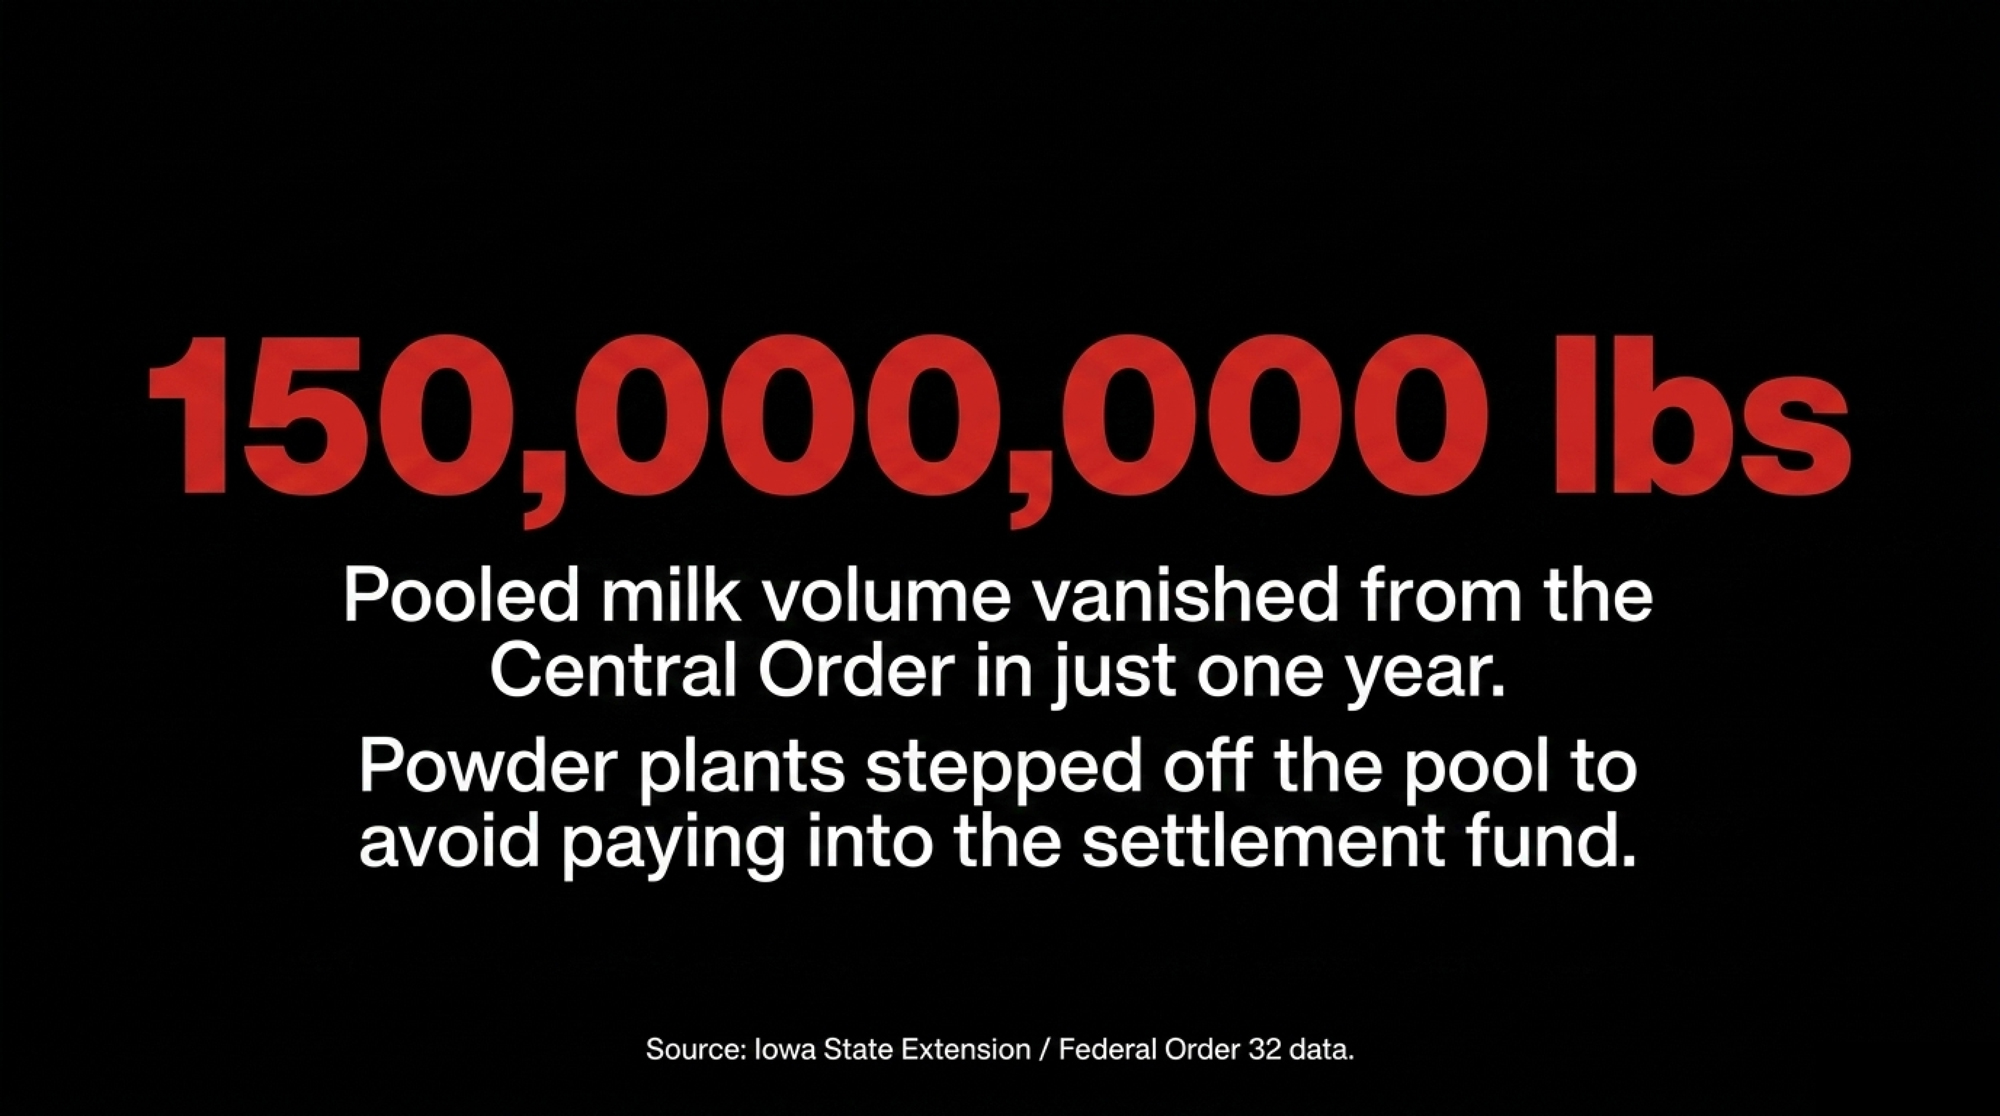
The clearest documented example of that flight comes from a separate order. Iowa State Extension reported that pooled milk in the Central Order (Federal Order 32) fell to about 1.35 billion pounds in March 2026, down from more than 1.50 billion a year earlier, with Class III utilization at 48.2% and Class IV withering to just 12.0%. Handlers voting with their feet rather than subsidizing the pool, in the same month as that $2.78 spread.

Order 32 is not Order 30, and the Wisconsin numbers aren’t in that dataset. But the incentive is written into the federal order structure itself, not into any one marketing area: any handler in any order can keep manufacturing milk off the pool when the class price beats the uniform price. Order 30 runs the lowest Class I utilization of any federal order, which means its blend leans harder on manufacturing milk than most, and a cheese-route producer there is paid off exactly the same component-plus-PPD arithmetic. Treat the Central Order figures as the visible case, not as Wisconsin’s ledger.

The Same Formula, Two Different Coasts

That Q1 divergence looked different depending on where you shipped. Corey Geiger, dairy economist at CoBank, told Brownfield Ag News in January 2026 that “if you look at the Class III markets here in the U.S., we see a rebounding of the Class III much faster… however, west of the Rockies, Class IV, butter and non-fat dry milk, and other powders is really down.” He noted futures had projected $19 Class IV against a $13–14 reality, “a lot of stress west of the Rockies right now.”

One formula, opposite outcomes. In January, Western butter-powder shippers watched a forecast collapse while Class III recovered. By March, the skim rally had flipped it. Class IV ran nearly three dollars clear of Class III, and this time Upper Midwest cheese shippers were the ones locked out. Late summer moved it again, which is where the current numbers come in.

Contract structure matters here too. A co-op member and an independent shipper on a direct supply agreement face the same federal formula but very different visibility into pooling decisions. One has a board vote and a member statement, the other has whatever the contract requires the buyer to disclose. Worth knowing which one you are before you call your handler.

A note for readers north of the border: this is a Federal Milk Marketing Order mechanic. Ontario and other supply-managed producers price through a provincial board, so the Class III/IV split has no direct analog on a Canadian cheque. The transferable lesson is narrower. Know which product classes your processor actually serves before assuming a commodity rally reaches you.

Running the Numbers

Class-spread exposure — illustrative scenarios, March 2026 formula prices

InputValue
Class IV, March 2026$18.94/cwt
Class III, March 2026$16.16/cwt
Spread$2.78/cwt
Production assumption75 lbs/cow/day (swap in your rolling average)

Scale it to your herd:

Herd sizeMonthly cwt (30 days)Spread exposure
150 cows3,375≈ $9,400/month
300 cows6,750≈ $18,800/month
500 cows11,250≈ $31,000/month
1,000 cows22,500≈ $62,600/month

Production swings move it too. At 85 lbs/cow/day, a 500-cow herd shows 12,750 cwt and roughly $35,400; at 65 lbs, 9,750 cwt and about $27,100. A 31-day month adds about $1,000.

What this math is not: profit or loss. It’s the difference in the formula price two operations settle against, before component premiums, hauling deductions, and handler blend adjustments. Your actual cheque sits downstream of all three.

Why “Class IV Is Weak” Only Tells Half the Story

Class III and Class IV aren’t market prices. They’re formula outputs. USDA calculates Class III from National Dairy Products Sales Report cheddar and dry whey prices, and Class IV from NDPSR butter and NFDM prices. Four commodities, two classes, no cow anywhere in the arithmetic.

So Class IV runs on two engines: butter on the fat side, NFDM on the skim side. They don’t have to move together.

Watch the late-August prints, and you can see them pulling apart in real time. Cheddar blocks sat at $1.5275/lb through Aug. 25. Butter closed at $1.4300 on Aug. 19, recovered to $1.4800 by Aug. 25, and its Aug. 17–21 weekly average of $1.4625 still ran well under year-ago levels. NDM climbed to $1.8100 on Aug. 19 and held there through Aug. 25 before easing 2.5 cents to $1.7750 on Aug. 26. September Class III futures were trading at $16.45 on the morning of Aug. 26.

Two components, same class, moving on their own clocks.

USDA’s August 2026 Livestock, Dairy and Poultry Outlook cut the 2026 butter forecast 4.5 cents to $1.645/lb while trimming NDM just 1.0 cent, to $1.605/lb. The August WASDE lowered the 2026 all-milk forecast to $19.85/cwt, raised Class III, and lowered Class IV. The divergence is written into USDA’s own numbers.

One detail runs counter to the tidy oversupply story. USDA NASS Cold Storage, released Aug. 24, 2026, put butter stocks down 3% from the prior month and down 3% year-over-year. Falling stocks aren’t what oversupply looks like.

Worth a caution: Polzin’s analysis covers the first quarter. The August prints suggest his mechanism is still operating, but that extension is an inference from the data, not a claim he made.

Anyone budgeting expansion against the annual number rather than the monthly spread should read our breakdown of how the $19.85 all-milk forecast reshapes expansion math alongside this.

How Much Does the Wrong DRP Weighting Cost?

Dairy Revenue Protection lets you elect a Class Pricing option with a declared Class III/Class IV weighting, or a Component Pricing option built on your own butterfat and protein tests. When that weighting doesn’t match where your milk settles, you’re buying protection against a revenue stream you don’t have.

Work it through on the verified March spread. A 500-cow herd shipping 11,250 cwt a month, on a handler running 60% cheese and 40% butter/powder, carrying a DRP election weighted 80% Class III:

MetricActual Pool ExposureDRP Policy WeightingStatus
Class III share60%80%Over-weighted
Class IV share40%20%Under-weighted by 20 pts
March 2026 spread$2.78/cwt
Monthly volume (500 cows)11,250 cwt
Untracked divergence≈$6,300/month
Requote trigger threshold>20-point gap
  • Actual pool exposure: 60% Class III / 40% Class IV
  • Policy weighting: 80% Class III / 20% Class IV
  • Mismatch, measured on the Class IV side: 20 percentage points
  • March 2026 spread: $2.78/cwt
  • Untracked divergence: 11,250 cwt × $2.78 × 20% = roughly $6,300/month
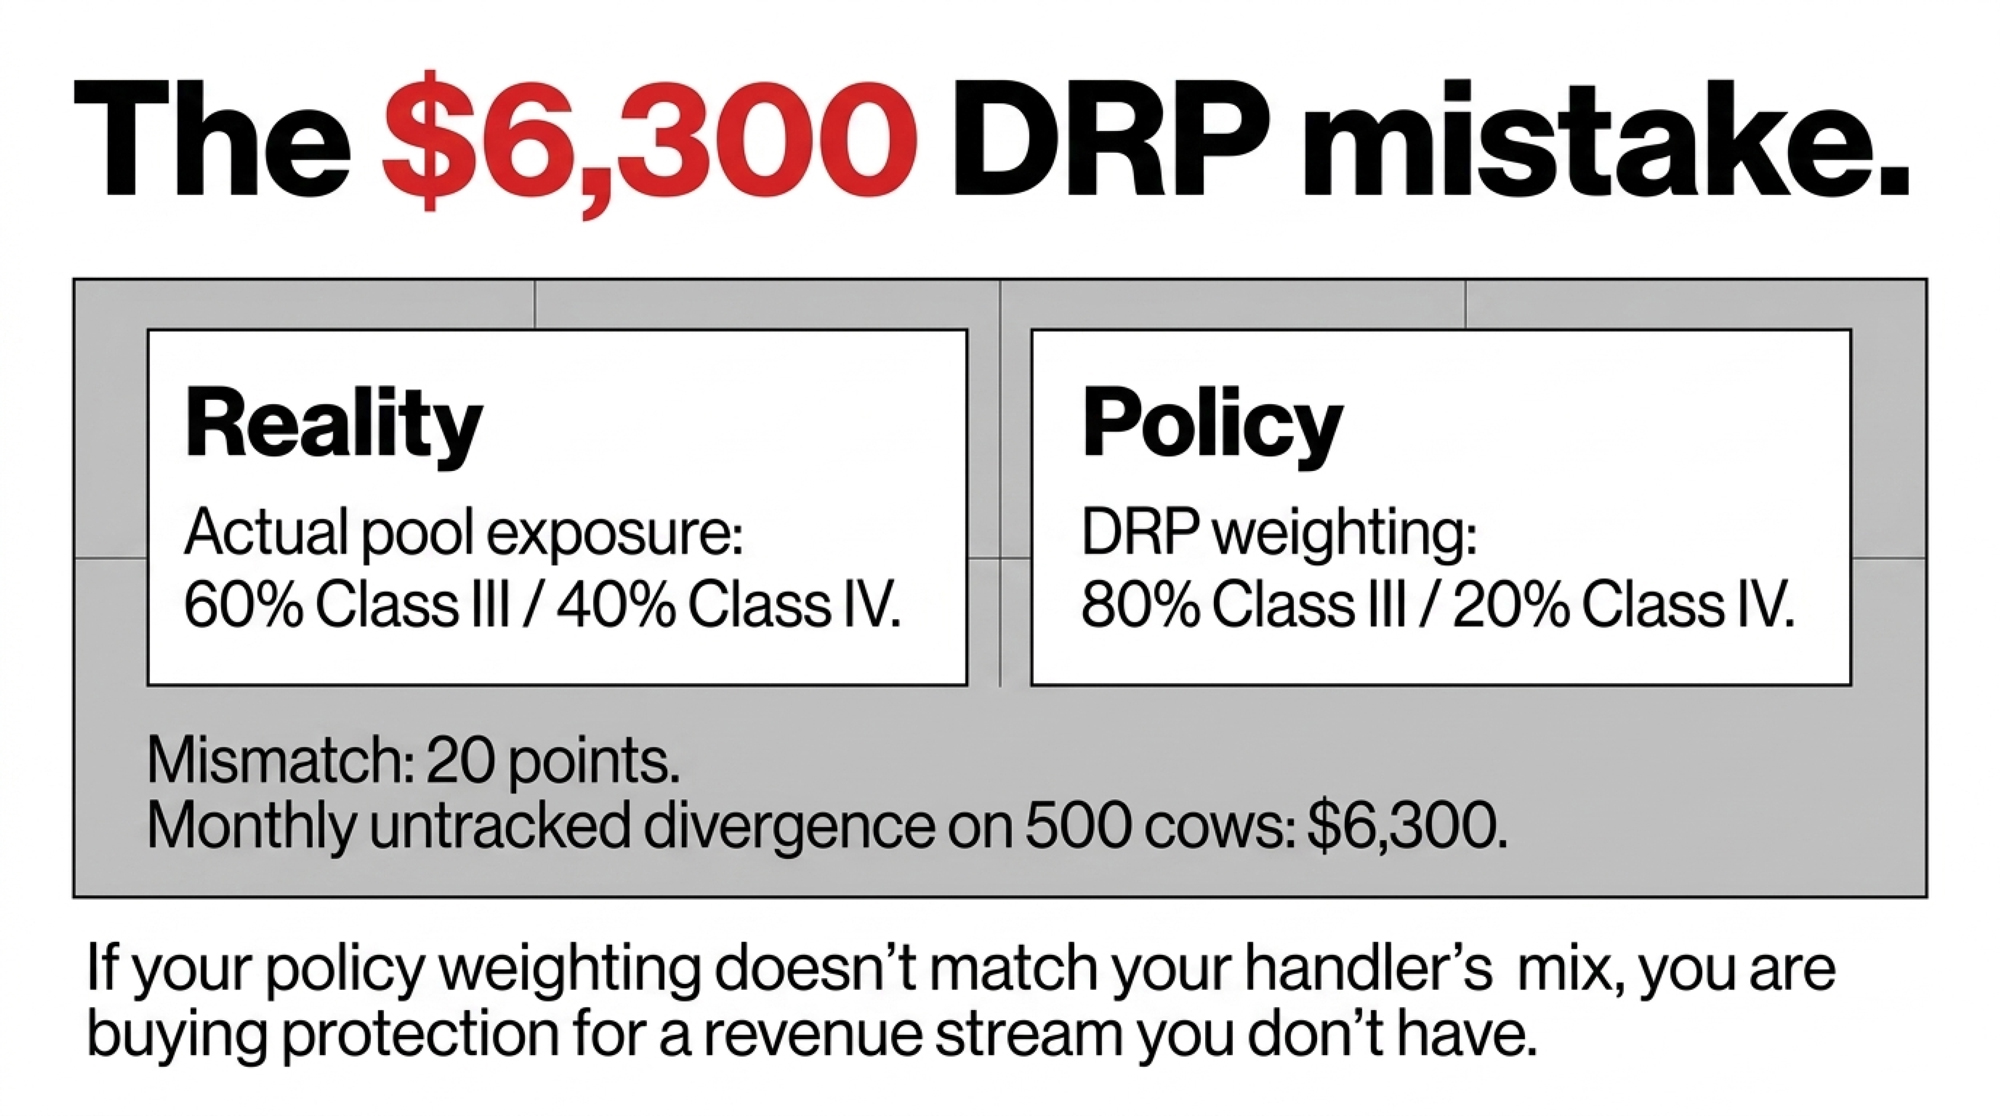
That’s a modeled figure built on a real spread and a stated weighting gap, not a forecast and not a loss. It’s the portion of the class divergence your policy isn’t tracking, measured one way. Weight both sides of the mismatch and you’d get a different number. The spread has narrowed since March, so pull the current one off your own settlement statements rather than borrowing this arithmetic wholesale.

RMA data cited in Bullvine reporting from October 2025 put DRP coverage at roughly 35% of U.S. milk production, above 50% in the High Plains. Coverage rates tell you how many operations bought a policy. They say nothing about whether the weighting matches the pool, which is why it’s worth understanding how DRP quarters and DMC tiers actually work before the next sales window.

Is Your Milk Actually Where You Think It Is?

Most producers can name their co-op. Fewer can state the class breakdown of what that co-op does with their milk in a given month, and that breakdown is what a DRP election should be built on.

Handlers shift plant mix. They also make month-to-month pooling decisions you’ll never be consulted on. When either changes, your correct weighting shifts with it, and that change won’t show up in your mailbox or your premium.

The 30/90/365-Day Playbook for Class-Exposed Herds

30 Days

Step 1 — Compare two documents. Action: Pull your most recent settlement statement and find the class utilization. Pull your current DRP declaration and find the weighting factor. Put them side by side. Trigger: A gap of more than 20 points means request a requote before the next quarterly window. Failure mode: Checking is free. Changing coverage means buying at current premiums, so know your number before you call the agent.

Step 2 — Test the spread against your debt coverage. Action: Take the per-cwt spread from your last three settlement statements, multiply by monthly cwt, and set it beside your term-debt obligation. This is a variance check, not a true ratio. It tells you how much class movement your debt service can absorb. Trigger: UW-Madison Extension’s repayment-capacity guidance treats a debt coverage ratio above 1.75 as strong and below 1.25 as a weakness. If class variance alone could push you under 1.25 in a bad quarter, this is a liquidity question, not paperwork. Failure mode:Variance isn’t cash flow. Run the real ratio with your lender or CPA before acting.

Step 3 — Confirm DMC enrollment. Action: Verify your status. The 2026 window closed Feb. 26, 2026 (USDA FSA), so there’s nothing left to buy, but there’s something to know. Trigger: If you assumed you were enrolled and can’t confirm it, make that call this week. Failure mode: None. Five-minute check, no downside.

Step 4 — Re-run your fall fuel line. Action: Reprice harvest, hauling, and manure fuel at current rates. U.S. national average retail diesel ran $5.652/gal the week of Aug. 24, up 52.2% from $3.713 a year earlier (EIA weekly series). Trigger: Any budget built on published forecast guidance needs revisiting. Failure mode: This lands during silage season, ahead of the cheque that covers it. Working-capital timing, not a planning error.

90 Days

Step 5 — Price Component against Class. Action: Have your agent quote both options using twelve months of your component data. Trigger: Fat and protein tests above breed average generally favor Component Pricing. Failure mode:It ties coverage to your own tests, so a component slump hits your cheque and your indemnity at the same time. That’s concentration, not diversification.

Step 6 — Ask your handler two questions. Action: Not the co-op name. The actual class breakdown of where your milk goes, and whether they depooled any months in the last year. Trigger: If your handler added or converted capacity, or depooled in a month when the spread was wide, treat your existing weighting as stale. Failure mode: Expect persistence to be required. Handlers don’t volunteer pooling decisions, and an independent supply contract may not obligate them to.

365 Days

Step 7 — Track the ultrafiltration signal. Action: Watch whether NDM holds its premium to cheddar blocks or the gap closes. Opportunity signal: If the skim redirection Polzin identified holds and your handler sits on the powder side, the exposure that hurt one quarter can favor you in another, but only if your coverage is weighted to capture it. Failure mode: Structural shifts are slow and easy to over-read from a single quarter’s prints. NDM gave back 2.5 cents on Aug. 26 alone.

Step 8 — Decide: manage the exposure, or accept it. Action: Some operations can’t change handlers. Name your category and plan accordingly. Trade-off: If the relationship is fixed, your levers are input cost and coverage weighting, not class mix. You gain stability. You give up the ability to chase the stronger class. Failure mode: Drifting without deciding, carrying a mismatched policy while telling yourself you’d switch handlers if it got bad enough.

For the full-year version of this arithmetic, our earlier analysis of what a three-dollar spread does across twelve monthsruns the same mechanics out to an annual figure.
Key Takeaways

  • The Class IV rally that ran $2.78/cwt above Class III in March didn’t reach cheese-route herds because butter and powder plants step off the pool rather than pay into the producer settlement fund. In the Central Order, pooled milk fell from 1.50 billion pounds to 1.35 billion in a year, and Class IV utilization dropped to 12.0%.
  • Class IV runs on two engines, not one. NFDM drove the March gap, with the Class IV skim price at $12.29/cwt against $9.41 for Class III, while butter sat weak. If your risk coverage treats Class IV as a single number, it’s tracking half your exposure.
  • Pull your settlement statement and DRP declaration, and compare class utilization to the weighting factor. A 500-cow herd on a 60/40 cheese-powder pool carrying an 80/20 Class III election shows roughly $6,300 a month of divergence its policy isn’t tracking. Request a requote before the next quarterly window if the gap runs past 20 points.
  • Ask your handler two things: the actual class breakdown of where your milk goes, and whether they depooled any month in the last year. Neither answer shows up in your mailbox, and an independent supply contract may not require them to volunteer it.

What This Means for Your Operation

The uncomfortable part isn’t the spread. It’s that two operations with identical management can finish a quarter tens of thousands of dollars apart on arithmetic neither one participates in, and on pooling decisions made in an office neither one visits.

The only lever you control is whether the policy you’re paying for matches the milk you actually ship. So pull the paperwork. What does your DRP declaration say your class split is, and what did last month’s settlement statement say it actually was?

Complete references and supporting documentation are available upon request by contacting the editorial team at editor@thebullvine.com.

Learn More

The Sunday Read Dairy Professionals Don’t Skip.

Every week, thousands of producers, breeders, and industry insiders open Bullvine Weekly for genetics insights, market shifts, and profit strategies they won’t find anywhere else. One email. Five minutes. Smarter decisions all week.

NewsSubscribe
First
Last
Consent

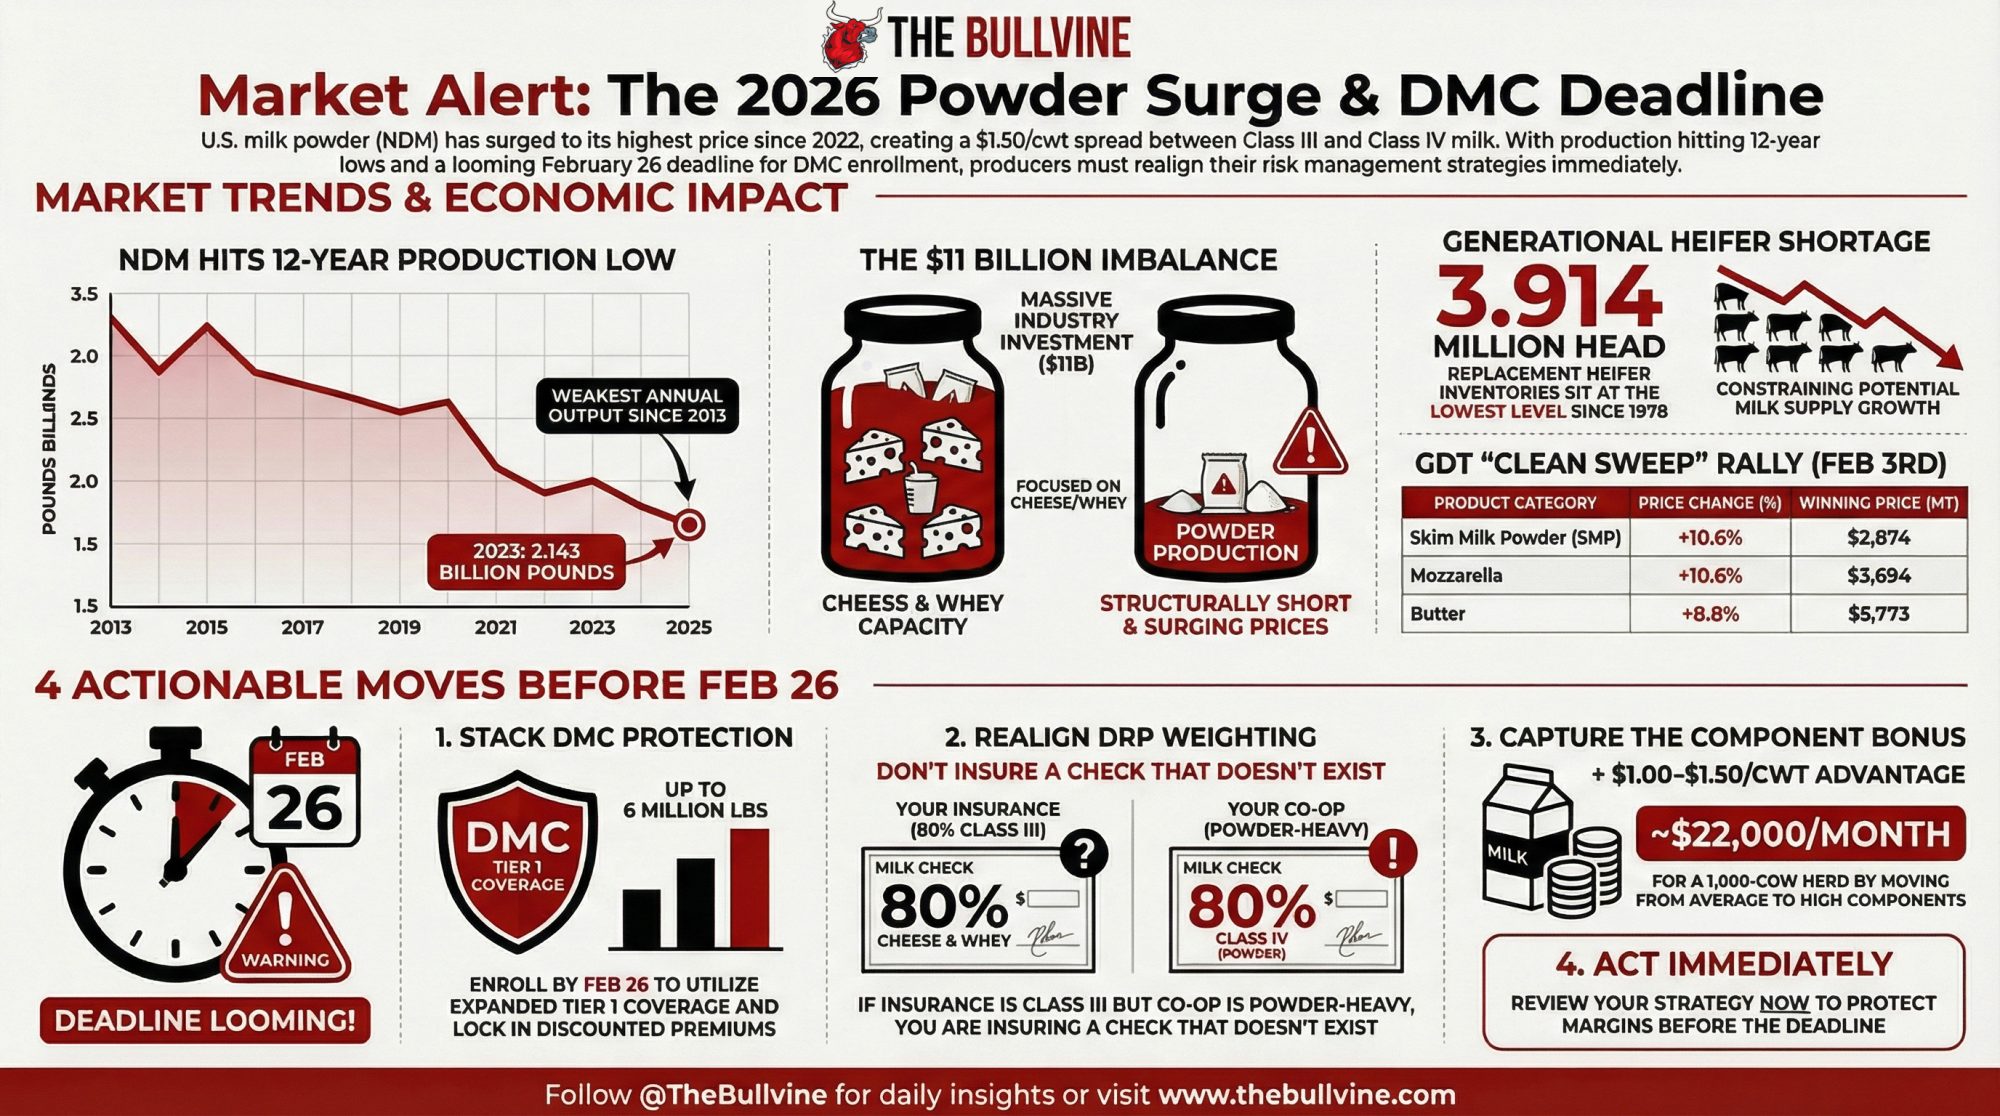
GDT surged 6.7%, and U.S. powder output hit a 12-year low – but your DMC window closes in 17 days.

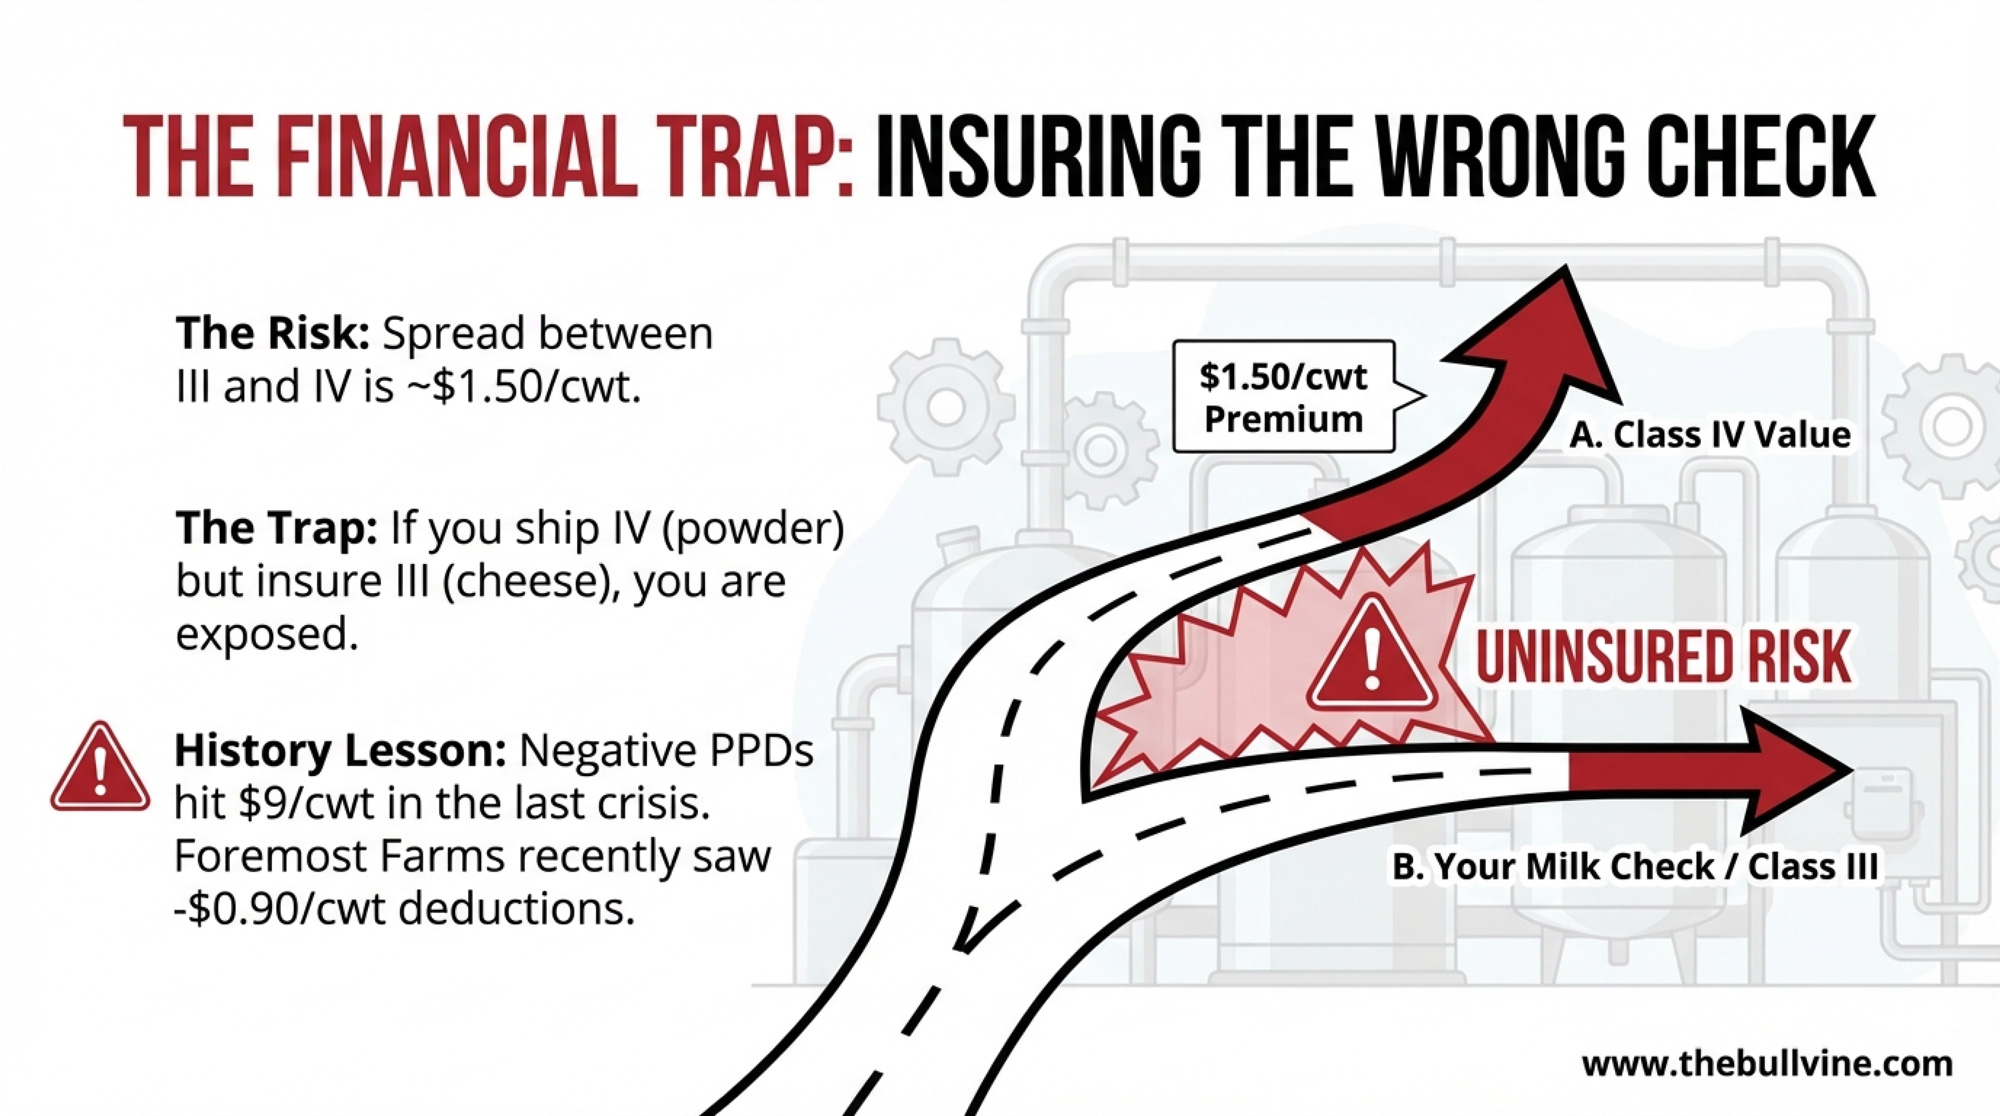
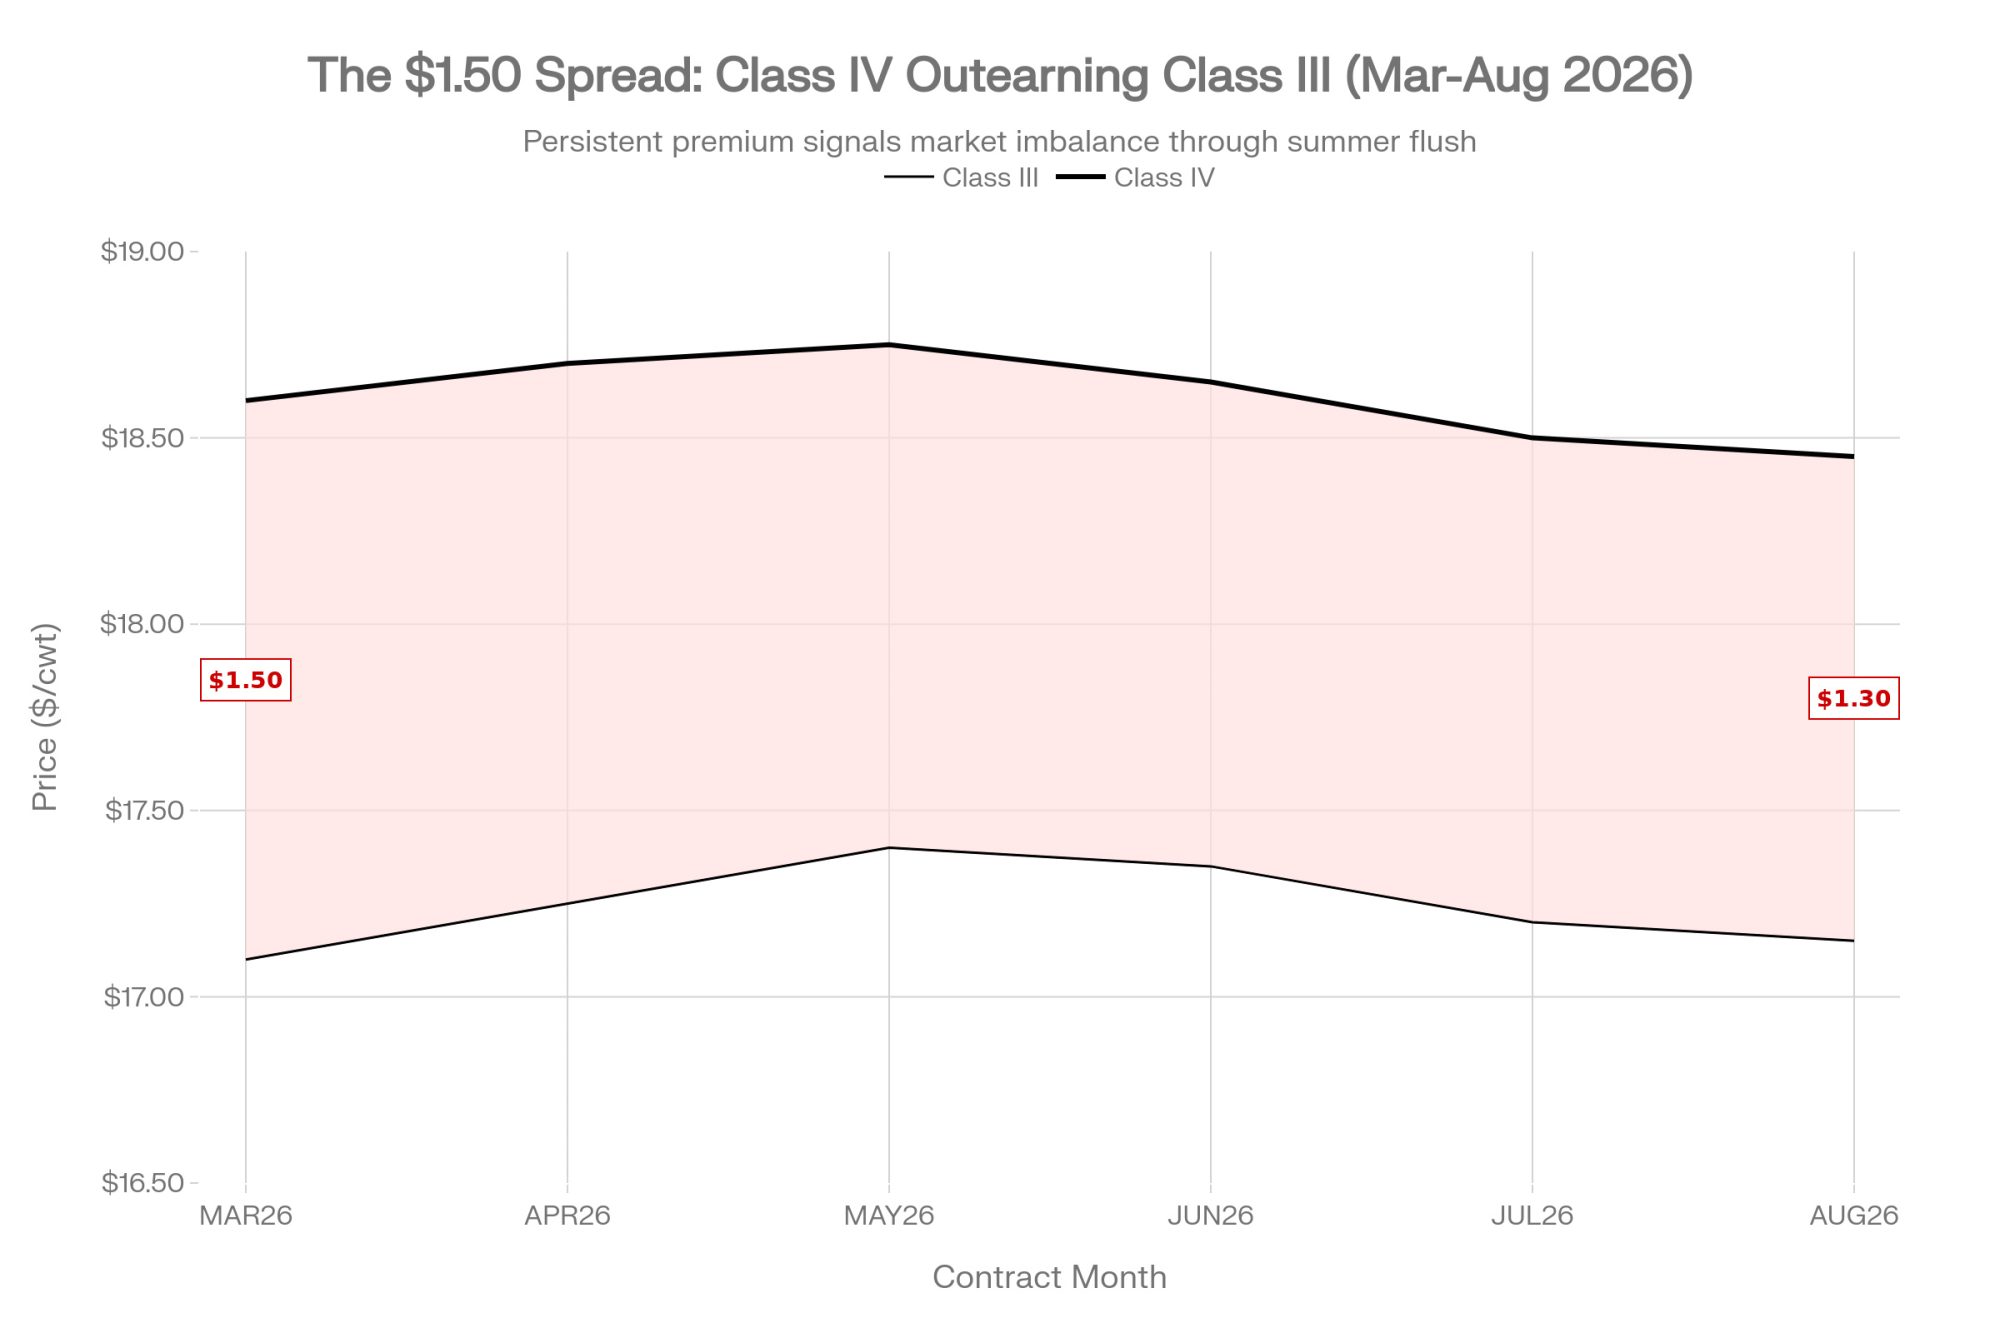
17 days to the DMC deadline. Class IV is $1.50/cwt above Class III. If your DRP is weighted heavily on III, you’re insuring a check that doesn’t exist.

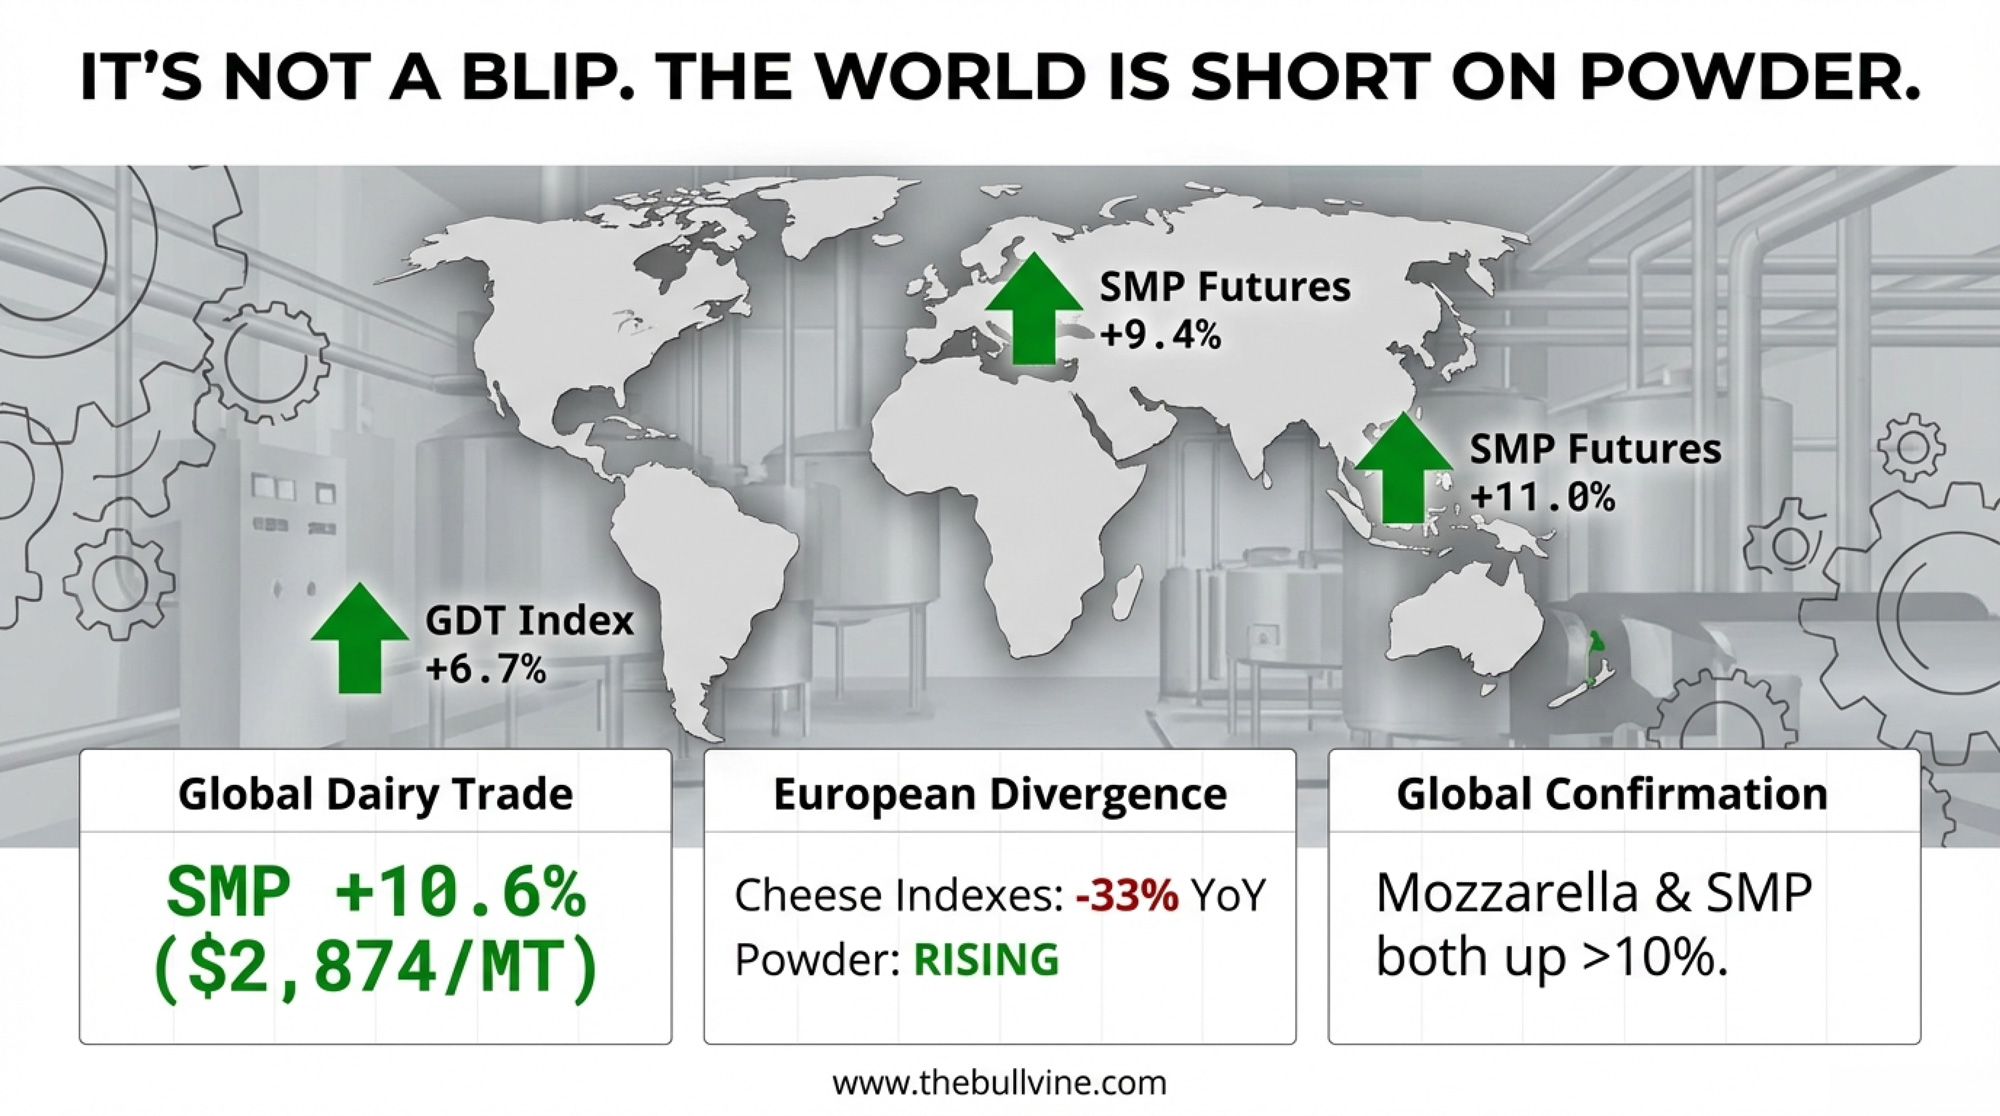
Executive Summary: NDM hit $1.64/lb on Friday — its best week since 2007 — putting milk powder 16.75¢ above Cheddar blocks. That’s not a blip. U.S. dryers produced just 2.143 billion pounds of NDM/SMP in 2025, the weakest since 2013, while the industry poured $11 billion into cheese plants that need more milk but don’t make powder. GDT confirmed the global story on February 3: the index surged 6.7%, SMP jumped 10.6%, and all seven product categories gained. The Class III/IV spread now sits at roughly $1.50/cwt—and every month you don’t restructure your DRP or optimize components, you’re subsidizing that spread from your own check. DMC enrollment closes February 26. Below: 4 moves before the deadline, the three structural constraints keeping powder tight, and the single production number that tells you whether this rally is real.

Class III/IV Spread

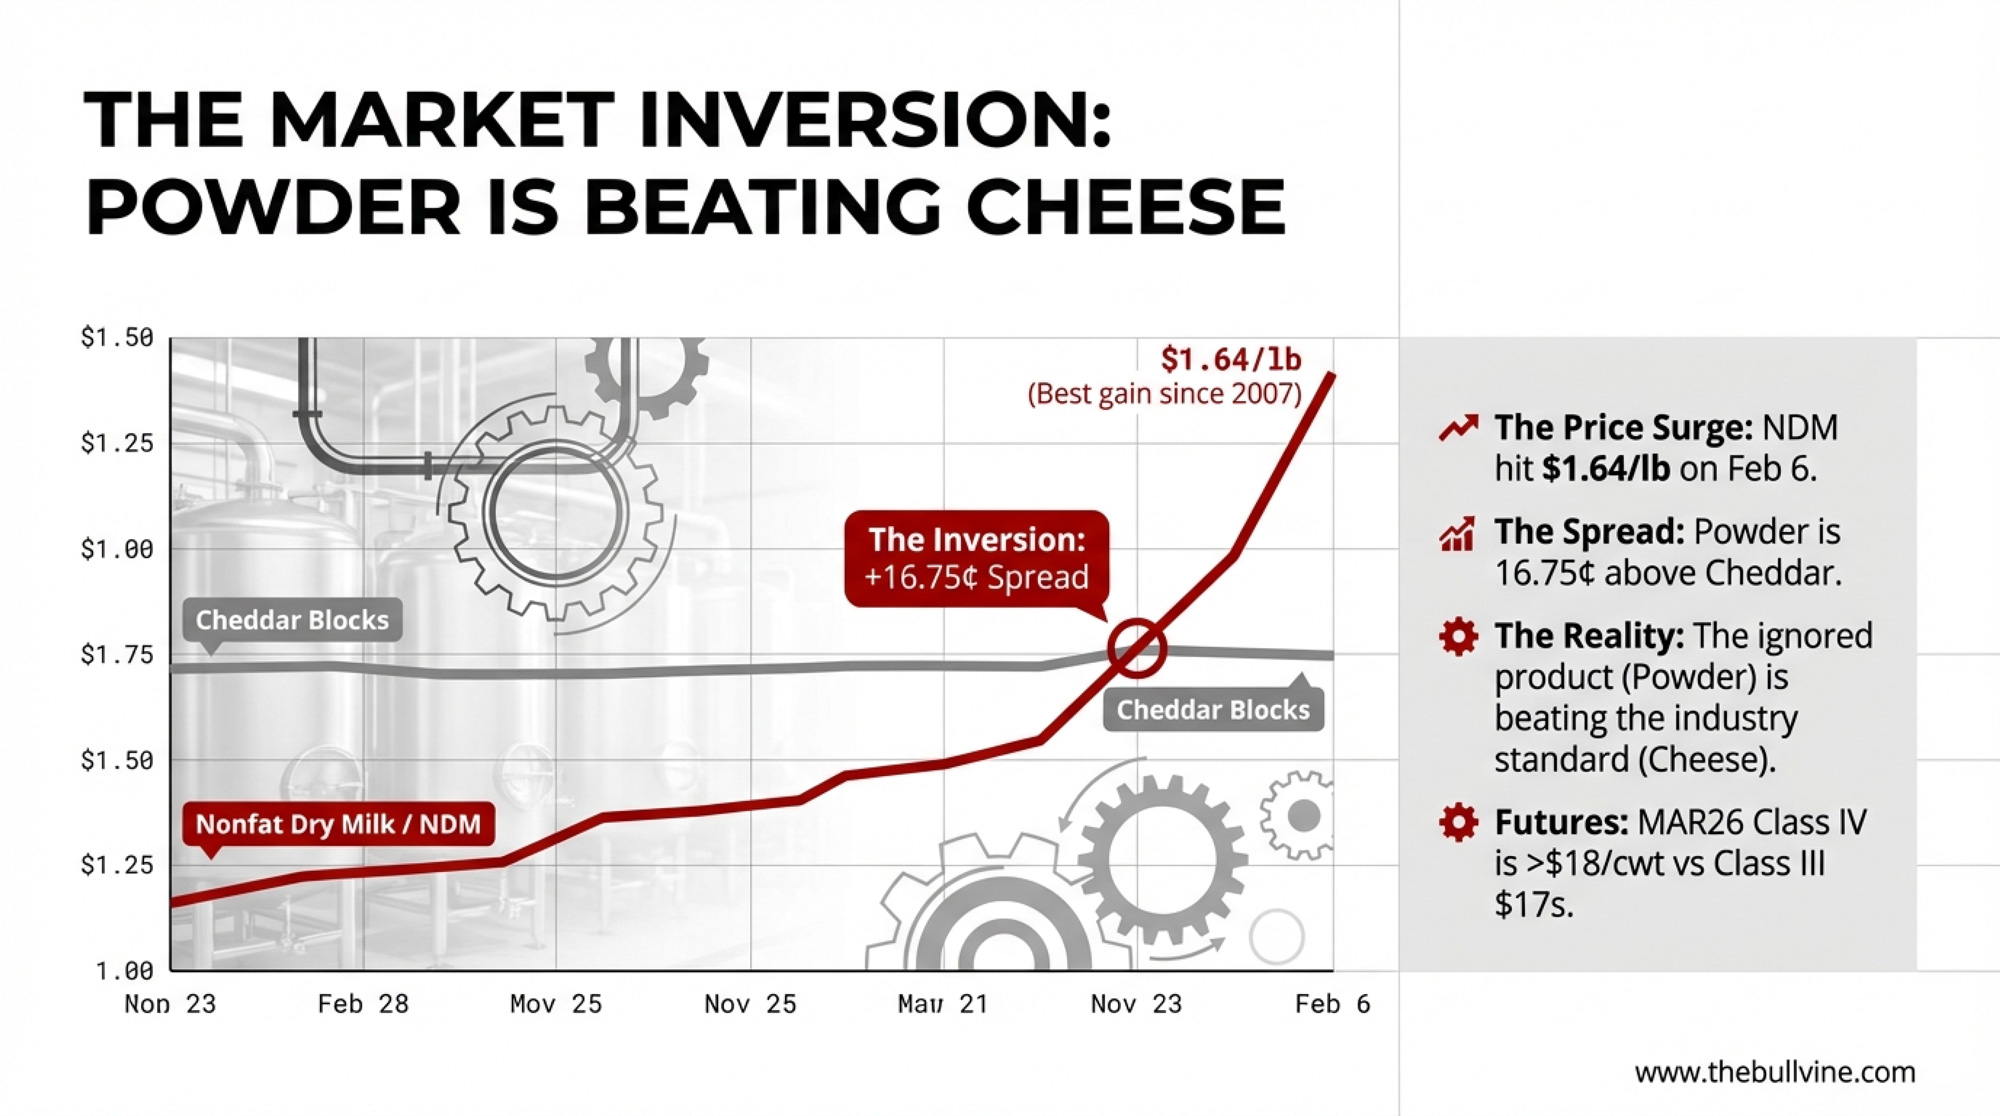
Nonfat dry milk surged 18¢ in a single week to settle at $1.64/lb on Friday, February 6 — the highest CME spot price since August 2022 and the strongest weekly gain since May 2007. That puts milk powder a full 16.75¢ above Cheddar blocks and within pennies of butter. For the first time in years, the product that the U.S. processing sector largely ignored is outpricing the one the entire industry was built around.


By Friday, MAR26 Class III futures were trading above $17/cwt through year-end, while Class IV — emboldened by surging NDM — was in the high $18s/cwt. DMC enrollment closes February 26. Just 17 days from today. Spring flush is six to eight weeks out.

Kevin Krentz, president of the Wisconsin Farm Bureau and a roughly 600-cow operator near Berlin, WI, knows what pool disadvantage feels like. He testified at the USDA Federal Milk Marketing Order hearing on August 31, 2023, that negative PPDs reached $9/cwt, costing his operation nearly $200,000 during the PPD crisis. The current Class III/IV spread is opening a similar gap — and the decisions you make about DRP coverage, component targets, and handler alignment right now determine which side of it you land on. 

GDT Surges 6.7%: Powder and Mozzarella Lead a Clean Sweep

The Global Dairy Trade auction (TE397) on February 3 delivered a 6.7% jump in the price index — the third consecutive gain — with the average winning price firming to $3,830/MT across 24,034 tonnes sold and 175 bidders participating. SMP leapt 10.6% to $2,874/MT, and mozzarella matched it at +10.6% to $3,694/MT. Those two categories matter most for U.S. powder and cheese pricing.

Butter surged 8.8% to $5,773/MT, with Solarec’s Belgian C2 butter hitting $4,950 — up 9.6% from two weeks ago. AMF gained 5.0% to $6,524, WMP rose 5.3% to $3,614, cheddar added 3.8% to $4,772, and lactose ticked up 1.5% to $1,410. Trade commentary attributed part of the rally to Chinese restocking ahead of the Lunar New Year and seasonal MENA demand ahead of Ramadan, though GDT doesn’t disclose buyer-country data.

Phil Plourd, president of Ever.Ag Insights, framed the broader landscape bluntly in a report on industry consolidation trends: “It is a street fight, in terms of figuring out ways to stay relevant, to get more productive, to stay ahead of the curve, to manage risk better, because it’s never been an easy business. It’s not going to be an easy business anytime soon”. 

EEX and SGX Confirm the Bid: 16,631 Tonnes Traded

The rally wasn’t just a GDT event. On EEX, 5,365 tonnes (1,073 lots) traded last week, with butter futures firming 10.7% on the Feb26–Sep26 strip to an average of €4,730 and SMP jumping 9.4% to €2,605. Only whey pulled back — down 1.8% to €1,019.

SGX told the same story: 11,266 lots traded, with WMP up 8.6% to $3,791 and SMP up 11.0% to $3,298 on their Jan26–Aug26 curves. AMF settled at $6,281 (+6.3%) and butter at $5,664 (+7.3%). The NZX milk price futures contract moved 1,763 lots — 10,578,000 kgMS — suggesting New Zealand producers are actively pricing forward at these levels. Powders led the rally on both exchanges. That confirms the GDT signal isn’t isolated.

European Market Snapshot: Powder Rallies, Butter, and Cheese Correct

European spot and futures markets pulled in opposite directions last week — and that divergence is the story worth watching.

ProductCurrent IndexWeekly ChgY/Y Chg
Butter€3,933−0.9%−46.6%
SMP€2,247+4.4%−10.6%
Whey€999Flat+12.5%
WMP€3,065−0.3%−30.0%
Cheddar Curd€3,222−1.4%−33.1%
Mild Cheddar€3,248−0.1%−31.9%
Young Gouda€3,059+1.1%−29.0%
Mozzarella€3,098+2.6%−24.0%

EU Weekly Quotation, 4 February 2026. Country splits tell the story: German butter unchanged at €4,050; Dutch butter +€50 to €3,950; French butter −€160 to €3,800. SMP: German +€90 to €2,250; French +€70 to €2,200; Dutch +€120 to €2,290.

That 46.6% year-over-year drop in EU butter tells you how inflated 2025 prices were — not how weak 2026 prices are. SMP moving in the opposite direction, with all three country quotations gaining, mirrors the global powder bid.

Every cheese index sits 24% to 33% below year-ago levels. That’s a massive compression European processors are still absorbing — and it’s keeping EU cheese competitively priced on global markets.

Global Supply: Butter Growing, Powder Capacity Isn’t

European and Irish butter supplies are expanding. Powder capacity outside the U.S. isn’t growing fast enough to fill the gap that GDT just priced in.

Ireland’s provisional December collections came in at 267kt, down 3.0% y/y — the second consecutive monthly contraction. But full-year 2025 totalled 9.10 million tonnes, up 5.0% y/y, with milksolids up 5.5% on stronger fat (4.93%) and protein (3.85%). Irish butter production for 2025 hit 286kt, up 7.1%.

Spain posted a decent December at 624kt (+1.8% y/y), but the full-year picture is flat — down 0.2%. UK butter production jumped 6.6% in December to 15.4kt, and total cheese production rose 3.4% to 42.4kt. Full-year butter hit 199kt (+2.1%), and cheese reached 513kt (+2.9%).

China’s farmgate price edged to 3.04 Yuan/kg in late January — up just 0.2% month-over-month and still 2.8% below last year. The Ministry noted that collections growth was driven by per-cow productivity, not herd expansion, with less productive cows culled. With Lunar New Year stocking mostly behind us, the question now is whether post-holiday Chinese buying holds — or if TE397 was the peak.

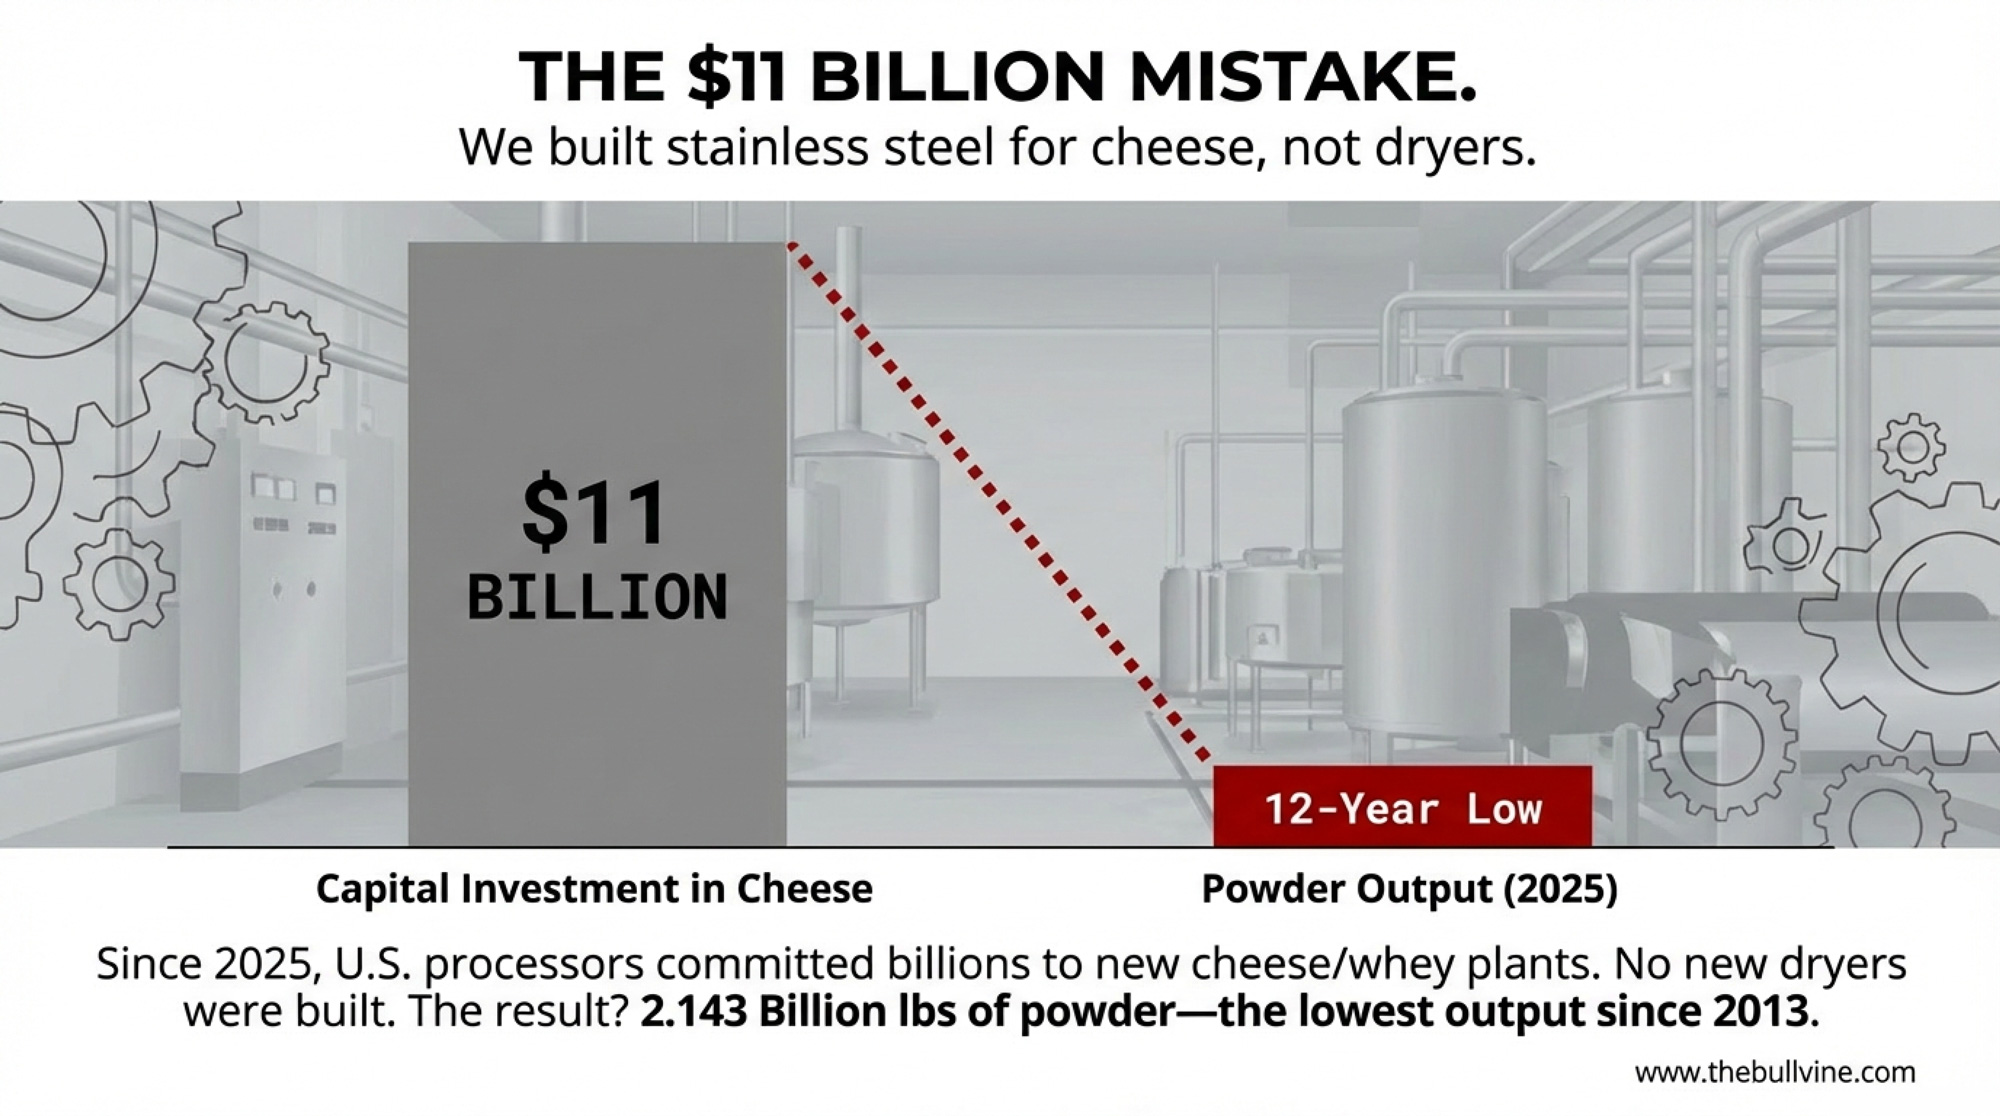
$11 Billion Went to Cheese. Now, Powder Is Short.

Powder got scarce because the industry was built for cheese, not because the world suddenly needed more milk powder.

U.S. dairy processors have committed more than $11 billion in new and expanded capacity across more than 50 projects in 19 states between 2025 and early 2028 — overwhelmingly targeting cheese and whey protein, not drying, according to data released by the International Dairy Foods Association on October 2, 2025. UW Extension dairy economist Leonard Polzin described “more than eight billion dollars’ worth of stainless steel” being invested in new and expanded dairy processing in January 2025 — before several major announcements pushed the total higher. CoBank analyst Corey Geiger flagged the tension directly: those plants will need more milk and “many more dairy heifer calves in future years to bring the national herd back to historic levels.” 

Ken Heiman knows the margins from the inside. The certified Master Cheesemaker runs Nasonville Dairy in Marshfield, WI, processing up to 1.8 million pounds of milk per day. He’s blunt about the economics: cheese alone just about breaks even — it’s the whey protein stream that makes the operation work. “We ought to be thanking people who are buying whey protein at Aldi’s,” Heiman told the New York Times on July 16, 2025. “It definitely enhances the bottom line”. That math explains why plants keep expanding cheese capacity even when cheese margins are thin. The whey subsidizes the vat. 

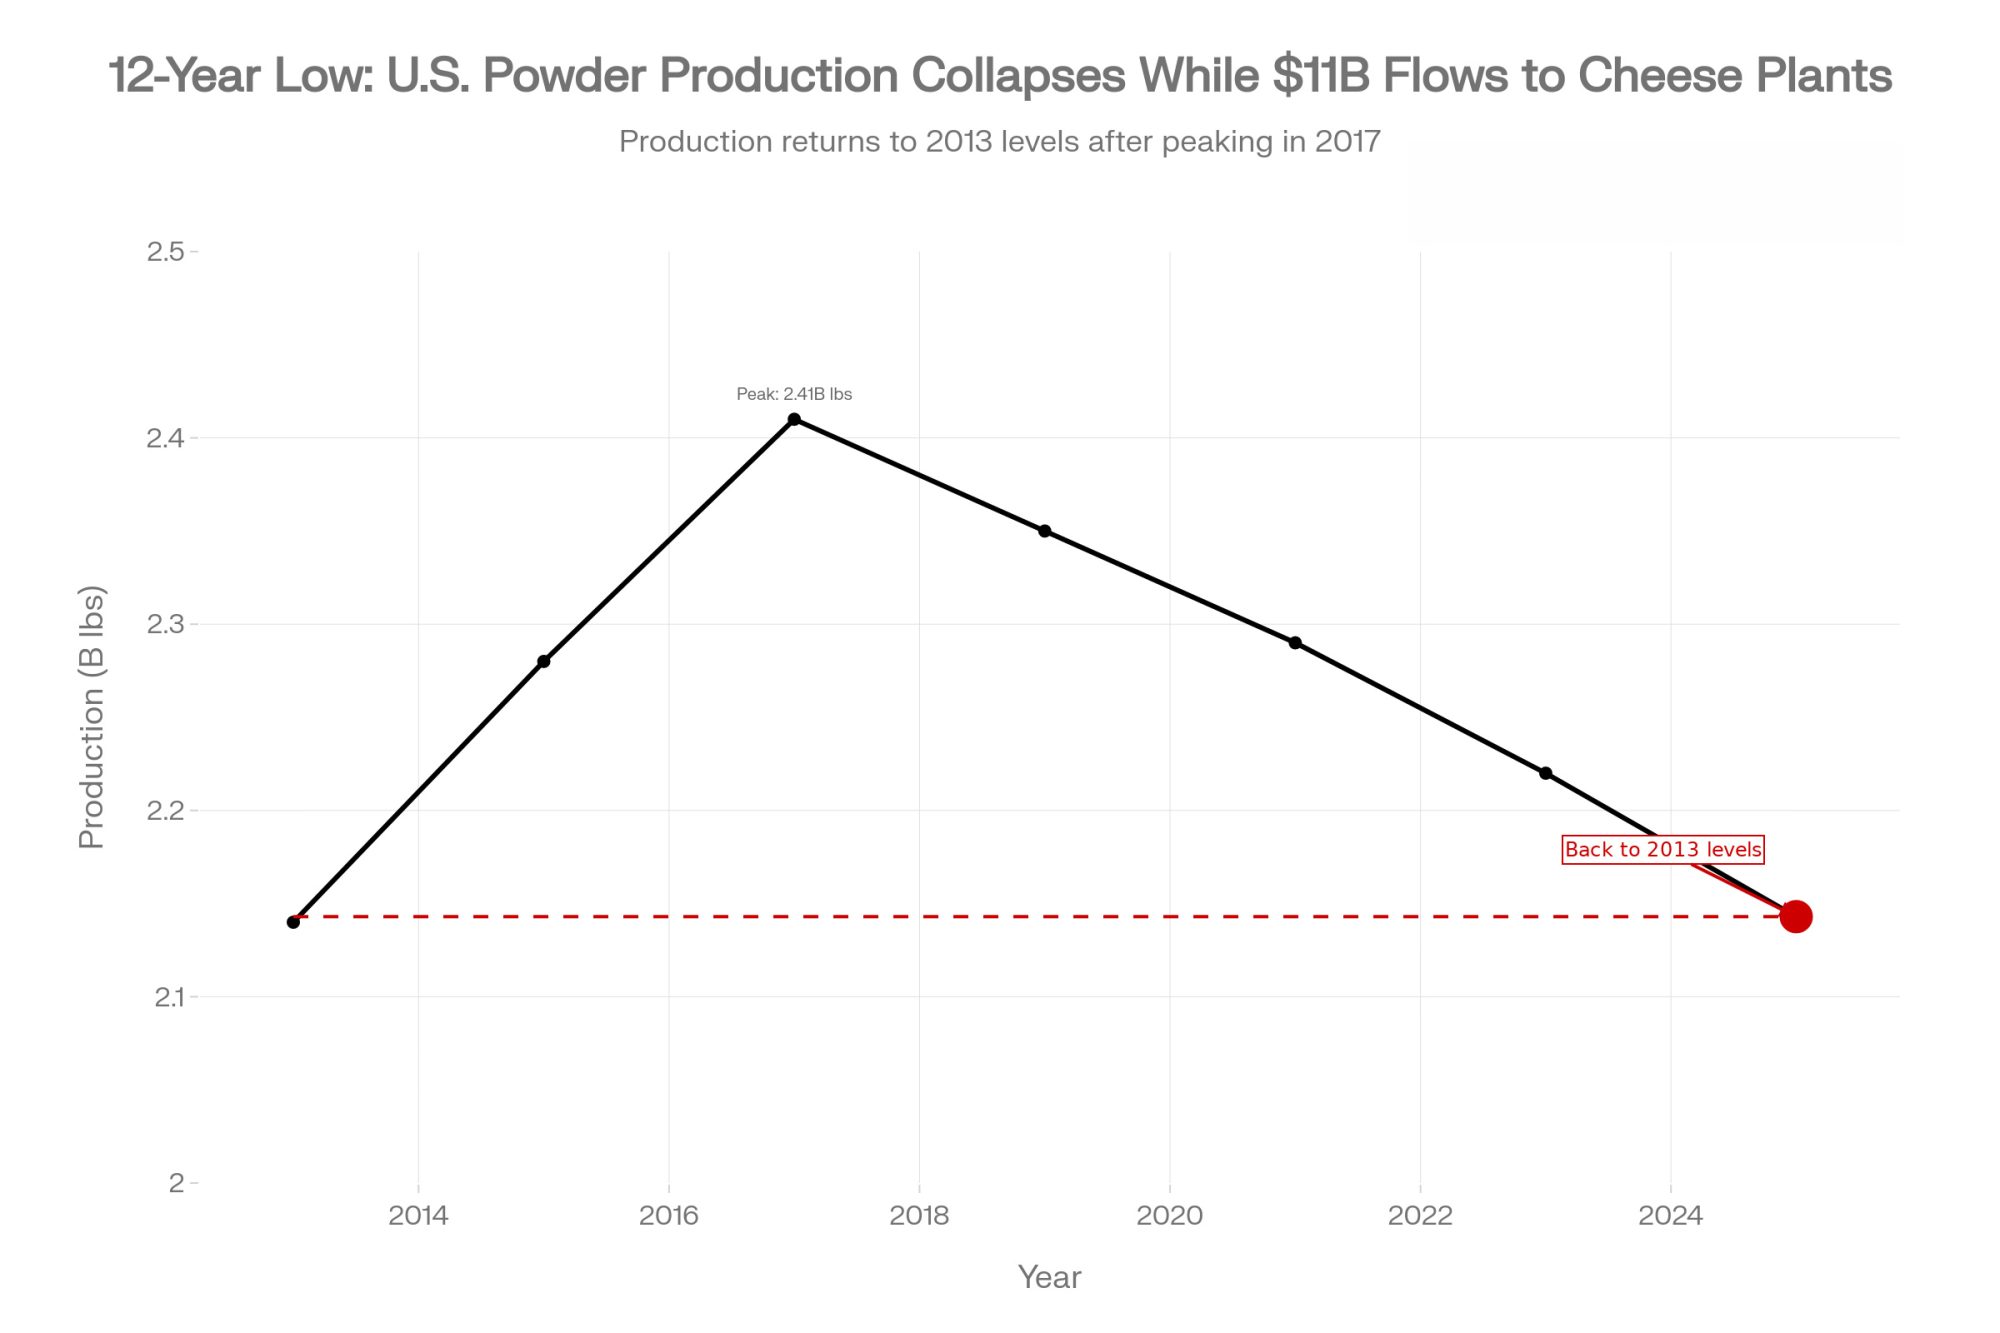
Meanwhile, USDA’s Dairy Products report (February 5, 2026) confirmed that combined U.S. NDM and SMP output in December totalled just 170.3 million pounds — down 6.2% year-over-year. Full-year 2025 powder production: 2.143 billion pounds. The weakest annual total since 2013.

U.S. Cheese Hits 1.28B Pounds in December — But Butter’s the Tighter Market

December cheese production hit 1.279 billion pounds, up 6.7% y/y, with Cheddar surging 9% and Italian varieties climbing 7.4%. Mozzarella grew 5.9%, even as foodservice channels continue pulling back. Hoard’s Dairyman reported in March 2025 that “food service has seen the biggest pullback in cheese demand” and that the pullback “shows little sign of any significant rebound”. Domino’s confirmed the trend firsthand, reporting a 0.5% decline in U.S. same-store sales in Q1 2025. 

Butter production expanded a more modest 2% to 203.8 million pounds. But the spot market doesn’t feel oversupplied — CME butter jumped 13¢ last week to $1.71/lb, including a 10.25¢ leap on Thursday alone, with dozens of unfilled bids remaining at Friday’s close. USDA’s Agricultural Prices report pinned the national average fat test at 4.51% in December, up 0.05 percentage points y/y. More fat entering the system, and buyers still can’t get enough.

Cheddar blocks rose 11¢ to $1.4725/lb on 51 loads — competitively priced for global buyers. Dry whey was the lone loser, dipping 2¢ to 73¢/lb. But the whey complex is structurally shifting: December whey protein isolate production surged 11.7% to 20.6 million pounds, and WPC (50–89.9% protein) rose 9%, while lower-protein WPC (25–49.9%) fell 12.8%. Ask Ken Heiman — plants keep making cheese because the whey stream pays the bills.

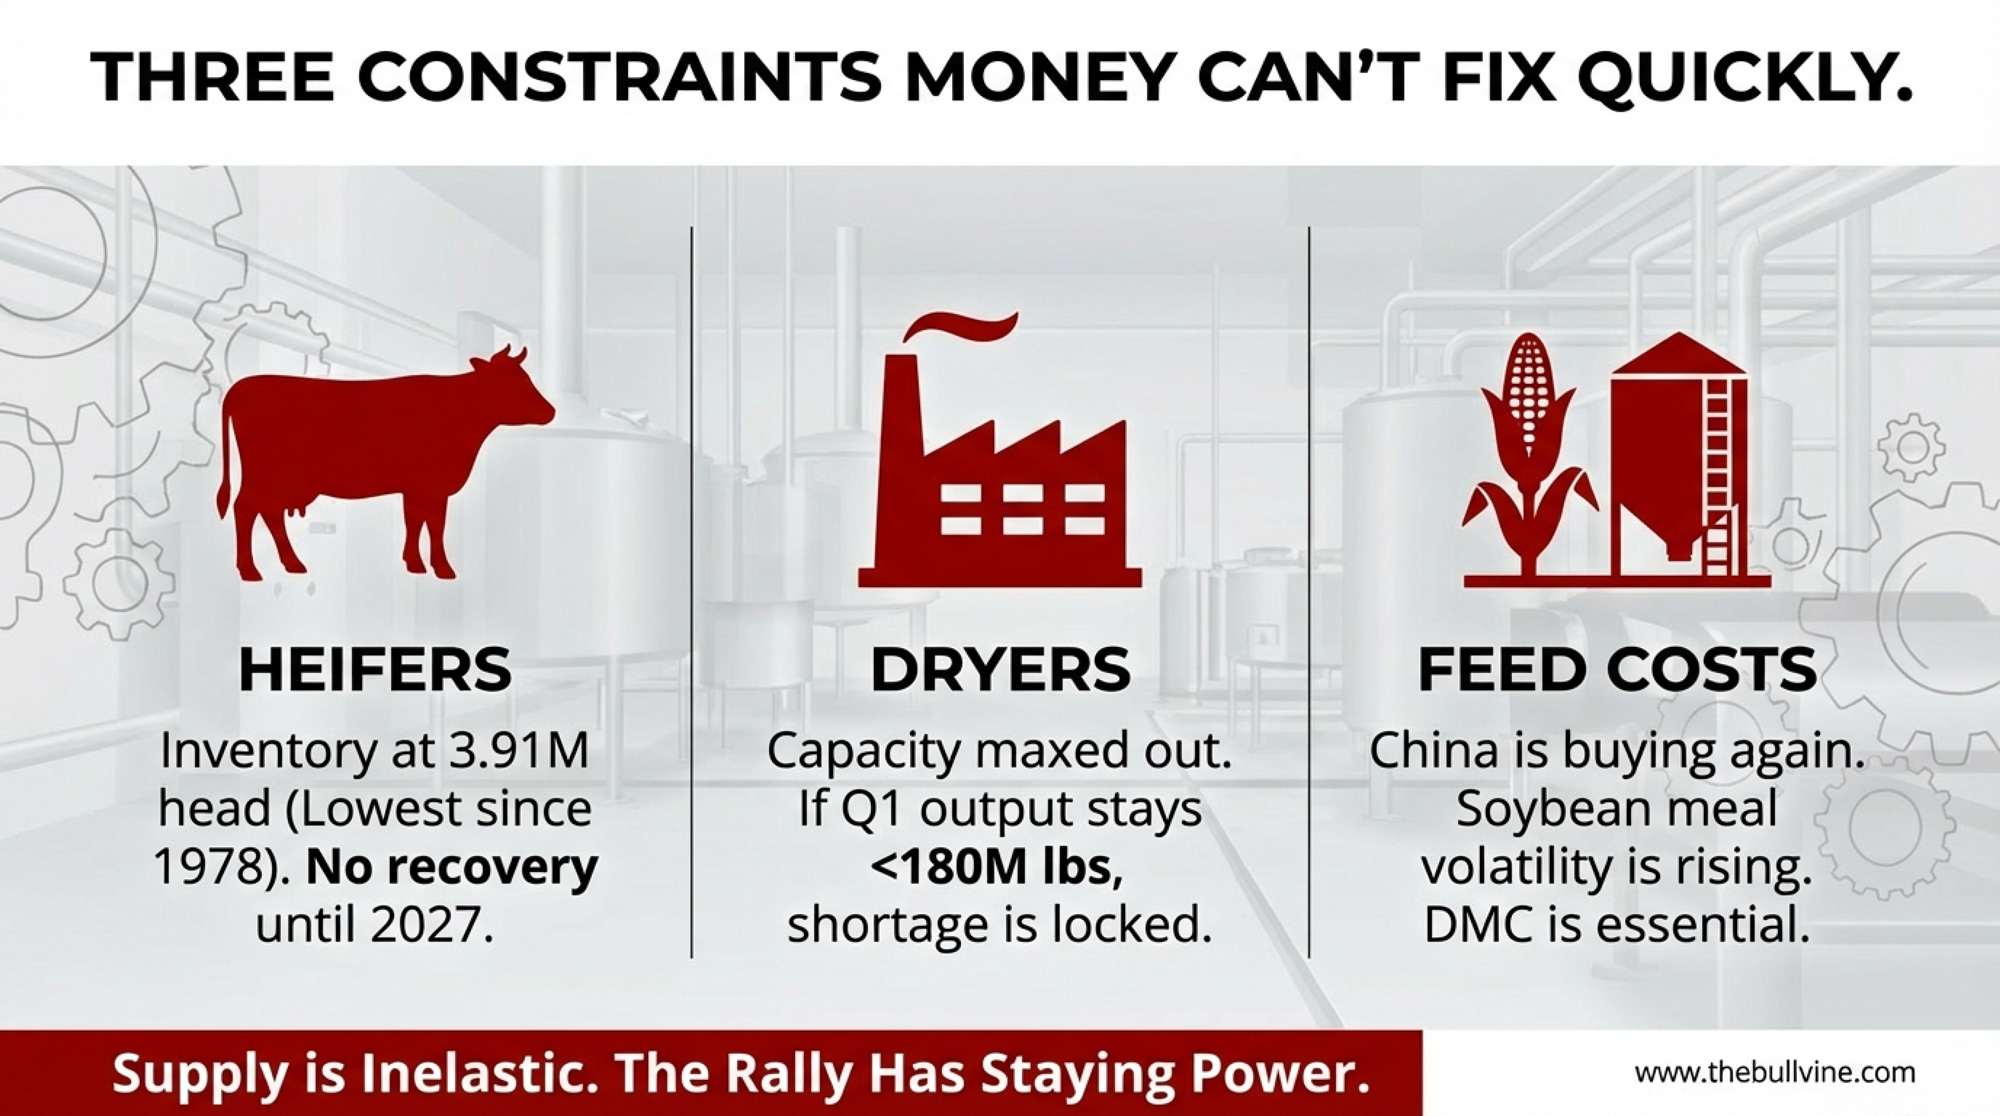
Three Constraints Stacking: Heifers, Dryers, and Feed

The powder squeeze has staying power because three structural constraints are converging—and none resolves quickly.

Heifers. USDA’s January 2025 estimate pegged dairy replacement heifers (500 lbs+) at 3.914 million head — the lowest since 1978. CoBank’s Abbi Prins projected the shortfall won’t begin recovering until 2027 at the earliest. With beef-on-dairy breeding running at elevated levels, the pipeline keeps shrinking even as processors need more cows. 

Dryers. The $11 billion investment wave went to cheese and whey protein, not powder. No major drying plant expansions have been announced. If Q1 2026 NDM/SMP production stays below 180 million pounds monthly despite record milk supply, drying capacity isn’t just tight — it’s structurally insufficient. 

Feed. MAR26 soybean meal settled at $303.60/ton on Thursday, with further gains on Friday. MAR26 corn hit $4.35/bu before giving back ground. On February 4, Trump stated that China was considering purchasing 20 million metric tons of U.S. soybeans this season, following what he called “very positive” talks with President Xi. On February 8, USDA confirmed an additional 264,000 MT of China soybean sale. This follows China’s completion in January of its initial 12 million MT commitment from the October 2025 Trump-Xi agreement, as confirmed by Treasury Secretary Scott Bessent at Davos. That buying pressure boosted soybean and soybean meal values heading into the week. Higher feed costs don’t make DMC optional. They make it essential. 

4 Moves Before February 26

1. Restructure your DRP to match actual pool exposure. If your co-op runs 60% cheese and 40% butter/powder, but your DRP is weighted 80% Class III, you’re insuring a milk check that doesn’t exist. High-component herds generally benefit from the Component Pricing option; average-component herds from Class Pricing with accurate III/IV weighting. Get a current quote — premiums fluctuate with volatility.

Your Pool MixYour DRP WeightingClass III/IV SpreadMonthly Exposure (500 cows)Risk Level
60% Cheese / 40% Powder80% Class III / 20% Class IV$1.50/cwt-$10,000 to -$15,000HIGH
60% Cheese / 40% Powder60% Class III / 40% Class IV$1.50/cwt-$3,000 to -$5,000MODERATE
40% Cheese / 60% Powder60% Class III / 40% IV$1.50/cwt+$4,000 to +$6,000LOW
70% Cheese / 30% Powder70% Class III / 30% Class IV$1.50/cwt-$5,000 to -$8,000MODERATE-HIGH

2. Stack DMC before the deadline. Tier 1 now covers up to 6 million pounds — up from 5 million — giving medium-sized operations an extra million pounds of protection. You must establish a new production history based on your highest marketings from 2021, 2022, or 2023. The six-year lock-in (2026–2031) saves 25% on premiums but surrenders annual flexibility. Run the math both ways. 

3. Audit your milk check. AFBF economist Danny Munch, speaking at ADC’s Dairy Hot Topics session during World Dairy Expo on October 2, 2025, urged producers to share milk check stubs with ADC, their state Farm Bureau, or their market administrator. He flagged instances — particularly in Wisconsin — where independent handlers weren’t meeting existing disclosure requirements. 

Foremost Farms patrons already know the pain: the cooperative announced a $0.90/cwt market adjustment deduction from member payments, citing “a significant difference between Class III milk costs and the revenue generated from cheese and whey product sales”. The FMMO pricing formula changes implemented on June 1 resulted in decreases “up to $0.90 per cwt” for producers in the Upper Midwest, Central, and Mideast FMMOs. Look for months where your PPD went sharply negative while Class IV traded at a premium. Cost: one uncomfortable phone call. Potential payback: significant. 

4. Run your component economics. As of January 2026, FMMO component prices ($1.4595/lb butterfat, $2.1768/lb protein): every tenth of a percent in butterfat translates to roughly $0.15–$0.35/cwt in additional revenue. A herd testing 4.3% fat and 3.3% protein versus one at 3.8% and 3.0% holds a cumulative advantage of roughly $1.00–$1.50/cwt. On 1,000 cows averaging 75 lbs/day, even the low end is approximately $22,000/month. Protected fat supplements typically run $0.30–$0.55/cow/day — University of Illinois dairy nutritionist Mike Hutjens has pegged rumen-protected choline alone at roughly 30¢/cow/day, with calcium salt fat supplements adding cost above that depending on inclusion rate. Genetic gains through sire selection take 6–24 months to hit the tank. Ask your nutritionist for the breakeven component test at current premiums. 

Herd ProfileButterfat %Protein %Premium Value ($/cwt)Monthly Revenue (1000 cows, 75 lb/day)Annual Advantage
High-Component Herd4.3%3.3%+$1.25+$28,125+$337,500
Average Herd3.8%3.0%BaselineBaselineBaseline
Gap+0.5%+0.3%$1.00-$1.50$22,500-$33,750$270,000-$405,000

What to Watch at TE398 on February 17

The next GDT auction will be the first real test of whether TE397’s 6.7% surge was panic buying or a structural repricing. Rabobank’s Q4 update (“Global Dairy Supply Surpasses Demand,” published January 7, 2026, via AHDB) estimated Big-7 milk production finished 2025 up 2.2% y/y, with 2026 growth moderating to 0.6%. If SMP holds above $2,800/MT at TE398, the floor is real. If it retreats below $2,600, the rally may have been seasonal restocking ahead of Ramadan and Lunar New Year.

On the domestic side, the March USDA Dairy Products report — covering January production — is the single most important data point. If NDM/SMP output stays below 180 million pounds, drying capacity is confirmed insufficient. Above 195 million, the system may be self-correcting.

What This Means for Your Operation

  • If you ship to a cheese-heavy co-op like Foremost Farms and your DRP is weighted more than 60% Class III, you’re likely insuring the wrong revenue stream. Pull your current DRP parameters this week and request a requote before the February 17 GDT gives the market its next signal.
  • If you’re considering forward contracting at current NDM-driven Class IV levels, talk to your risk management advisor now. DRP covers revenue; DMC covers margin. Neither locks in today’s spot price, but structuring both before February 26 gives you the cheapest available hedge against the spread narrowing or feed costs widening.
  • If you’re in the Southwest — near Hilmar’s Dodge City plant or Leprino’s Lubbock facility — your handler’s plant mix may already capture more Class IV value. DFA is even seeing milk production growth in areas like southern Georgia and northern Florida. Know where your milk goes before you assume the spread hits you the same way it hits a Wisconsin cheese-pool shipper. 
  • If your herd averages below 4.0% butterfat and 3.1% protein, you’re leaving an estimated $1.00+/cwt on the table relative to component-optimized herds in the same pool. That’s roughly $22,000/month on 1,000 cows at the low end.
  • If your PPD went negative in any month since October 2025, ask your co-op directly whether Class IV milk was depooled. Danny Munch at AFBF has flagged handlers not following existing disclosure rules. 
  • Counter-signal: If Q1 NDM/SMP production rebounds above 195 million pounds monthly, the scarcity thesis weakens, and the Class III/IV spread narrows. The March Dairy Products report is the first real test.

Key Takeaways

  • The Gap: NDM at $1.64 sits 16.75¢ above Cheddar and within pennies of butter. For cheese-pool herds, that translates to a Class III/IV spread costing real money every month — The Bullvine’s October 2025 paired-herd analysis pegged it at $10,000–$15,000/month on 500 cows. 
  • Why It Lasts: 2025 powder output fell to 2.143 billion pounds — weakest since 2013 — while $11 billion in new capacity went to cheese and whey. Heifer replacements are at a generational low of 3.914 million head, constraining even the milk supply. 
  • Your Biggest Lever: Components plus DRP alignment. Moving from average to high components is worth $1.00–$1.50/cwt, but only if your DRP weighting and handler actually capture that value. Fix both before February 26.
  • The Cost of Waiting: Rolling into spring with a cheese-heavy pool, a Class III-heavy DRP, and average components is a bet that the Class IV premium disappears before your cash does.

The Bottom Line

The February 26 DMC deadline isn’t the end of the conversation — it’s the last clean entry point before spring flush reprices everything. Where does your breakeven sit if Class III stays in the low $17s through summer?

To enroll in the 2026 DMC, contact your local USDA Farm Service Agency office or visit farmers.gov/service-center-locator. The deadline is February 26, 2026.

Complete references and supporting documentation are available upon request by contacting the editorial team at editor@thebullvine.com.

Learn More

The Sunday Read Dairy Professionals Don’t Skip.

Every week, thousands of producers, breeders, and industry insiders open Bullvine Weekly for genetics insights, market shifts, and profit strategies they won’t find anywhere else. One email. Five minutes. Smarter decisions all week.
NewsSubscribe
First
Last
Consent

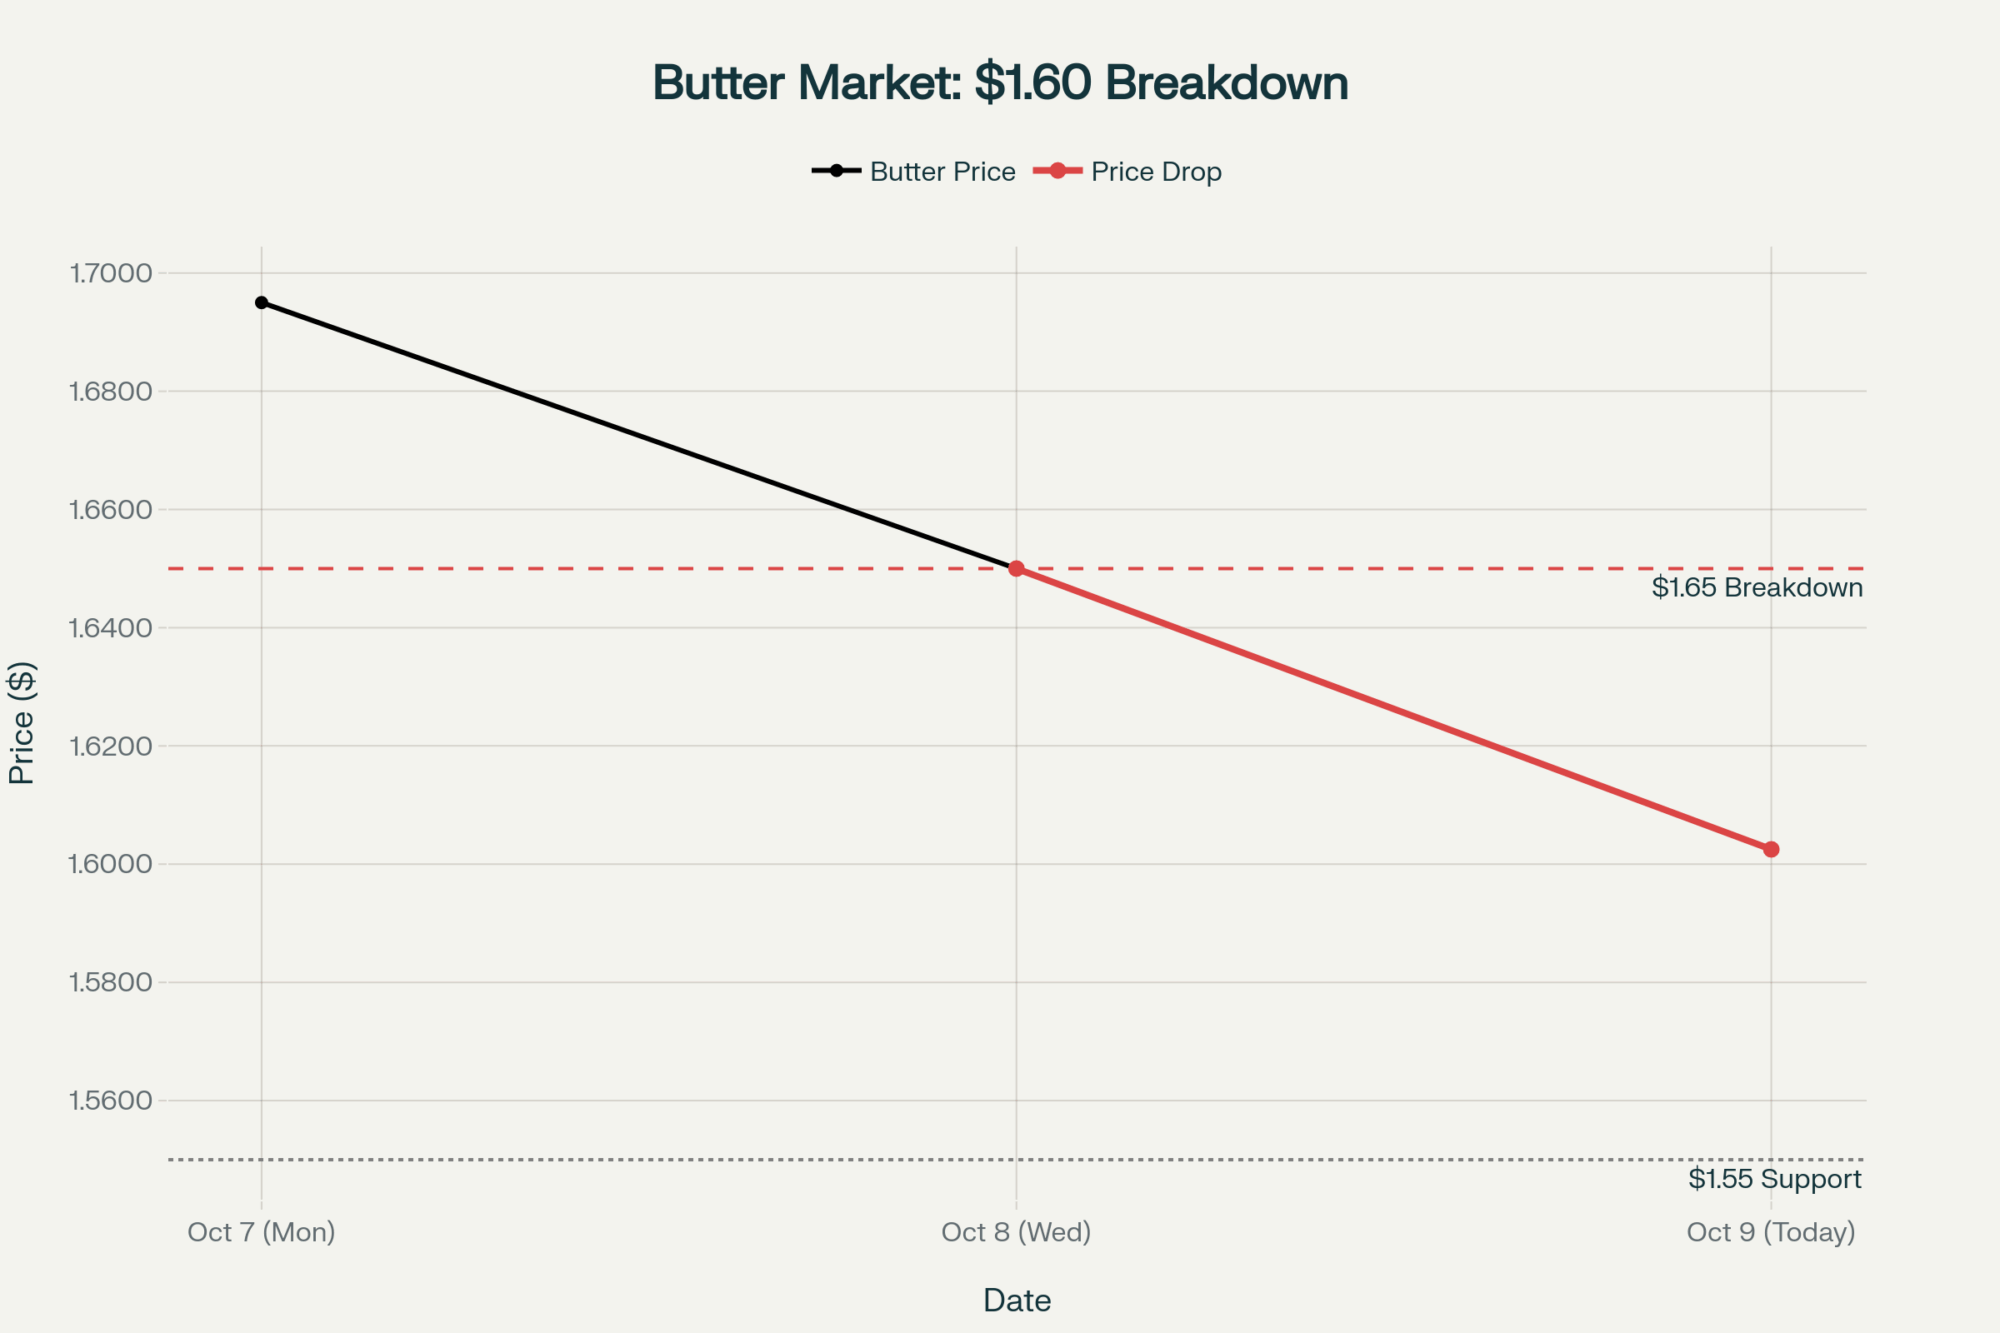
CME DAIRY MARKET REPORT OCTOBER 9, 2025: Butter Collapse to $1.60 Just Created a $2.47 Class Spread

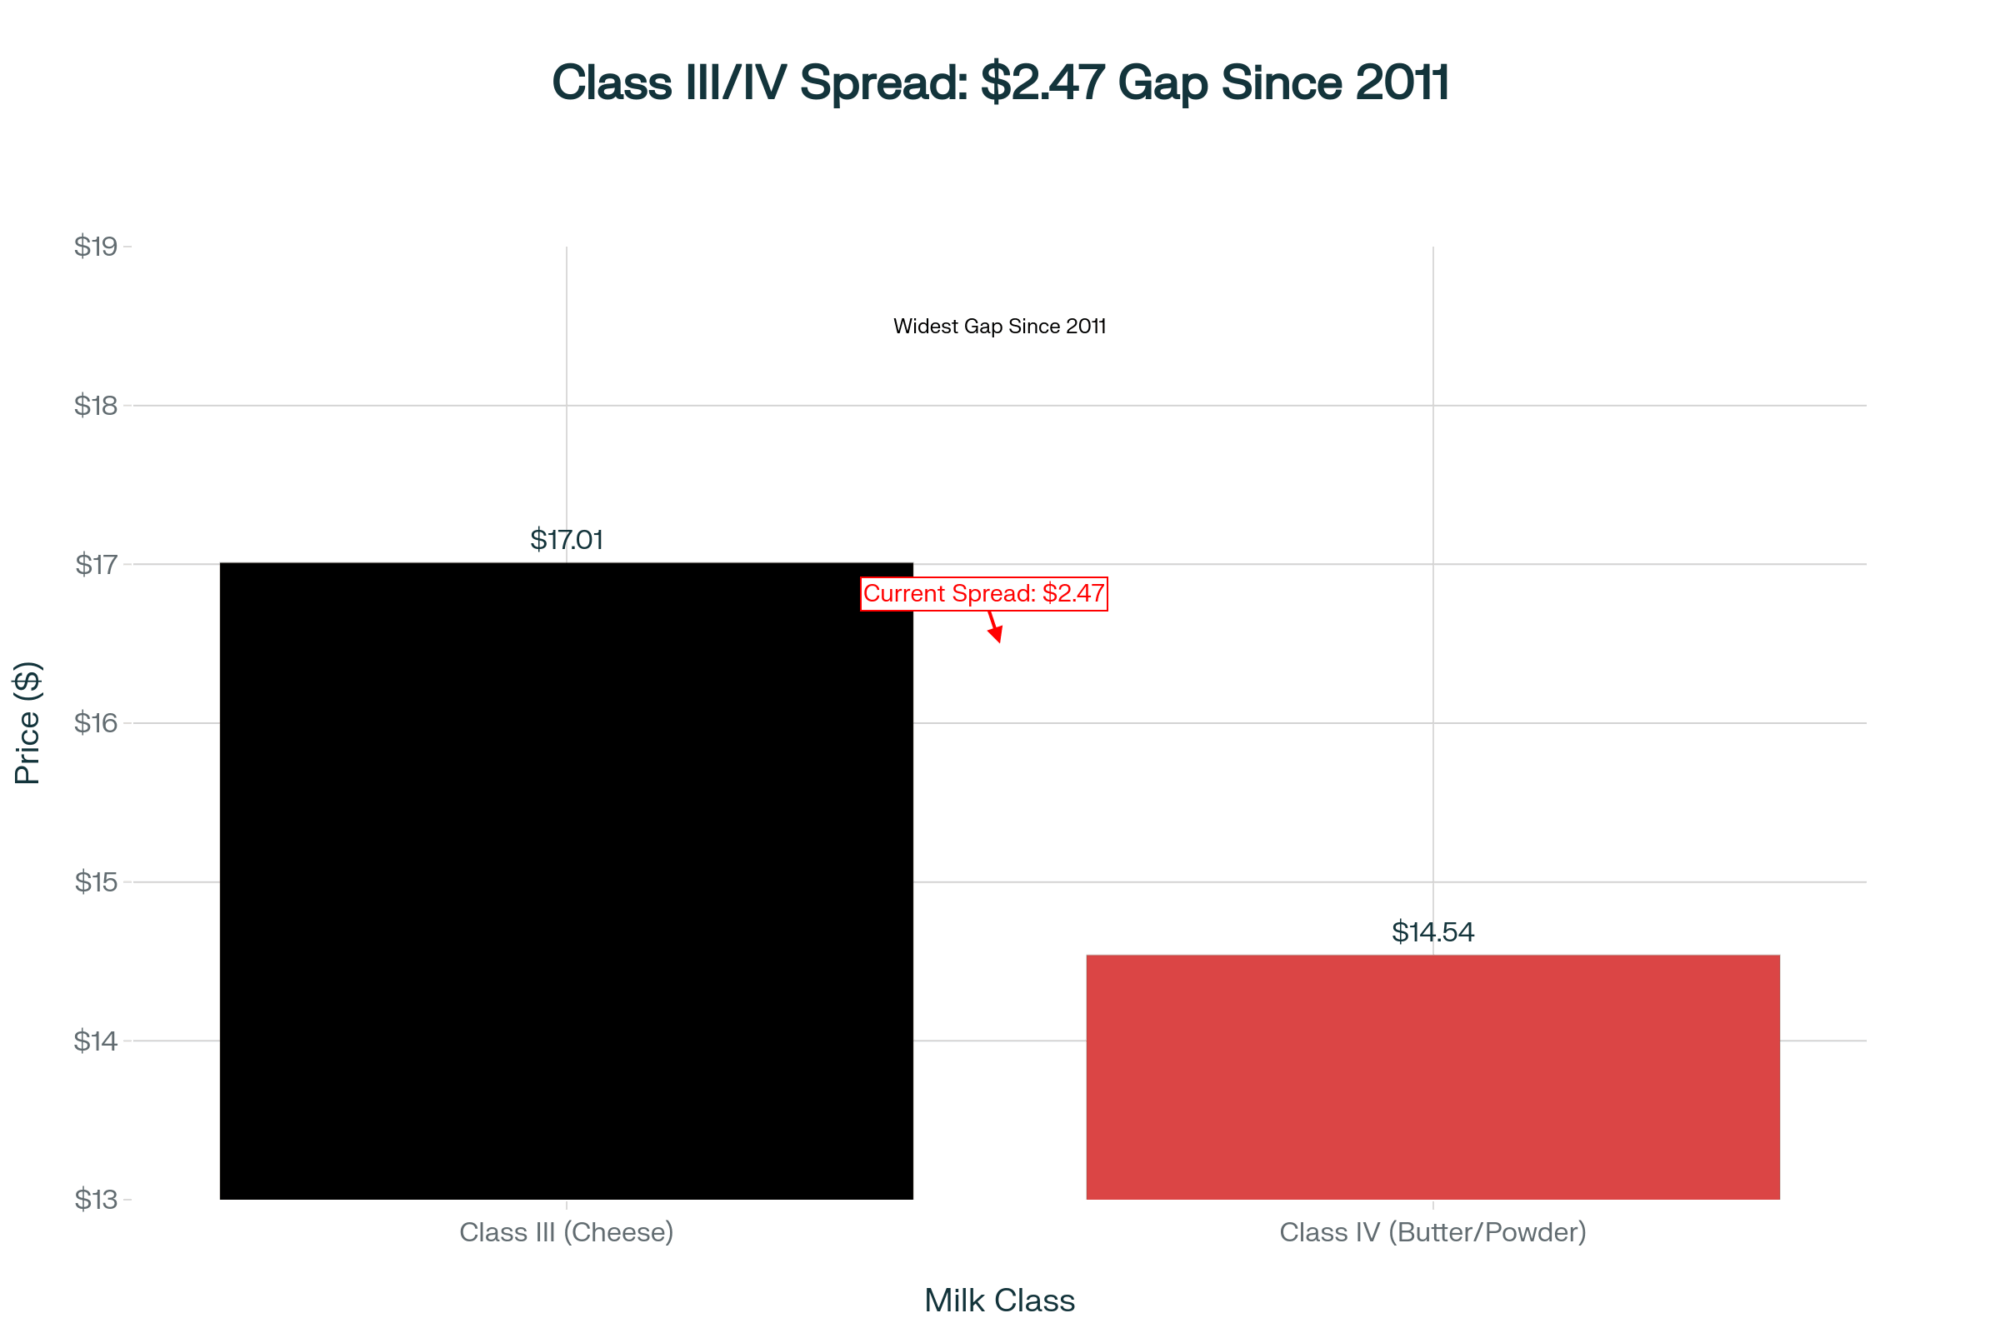
Data-driven: Class III/IV spread hits $2.47/cwt—widest gap since 2011, costing Jersey operations $180K annually

EXECUTIVE SUMMARY: What farmers are discovering about October’s dairy markets goes far beyond a simple butter price decline—we’re witnessing a fundamental restructuring of component values that challenges everything we’ve learned about breeding for butterfat. The $2.47/cwt spread between Class III ($17.01) and Class IV ($14.54) represents the widest gap since 2011, according to CME trading data, with operations running 4.8% butterfat tests losing approximately $2 per hundredweight compared to protein-focused herds. Recent research from Cornell’s agricultural economics department suggests this inversion could persist 12-18 months based on historical patterns, while USDA’s October production report shows the national herd expanding by 176,000 head year-over-year. Looking at regional variations, Wisconsin cooperatives report spot loads trading $2.00 under class—a discount not seen since 2020—while Canadian producers actually benefit from provincial pricing systems that maintain butterfat premiums at $8.29/kg. Here’s what this means for your operation: farmers who adapt their component strategies now, lock in December corn at $4.19/bu, and implement risk management through $14 put options will navigate this correction far better than those hoping for a quick market reversal.

Dairy component strategy

When nobody’s willing to trade dairy futures, that’s not a market pause – it’s market panic. And your milk check knows the difference.

The Morning That Changed Everything

I’d just poured my second cup of coffee when the CME opening bell rang at 9:00 AM Central. Twenty minutes later, butter had dropped 4.75 cents. That’s not a typo – nearly a nickel gone, just like that.

Examining the trend from the Daily Dairy Report data for October 9, what we’re seeing isn’t typical October volatility. With spot butter cratering to $1.6025 per pound (down from $1.6500 on Wednesday and $1.6950 on Monday), we’re watching the kind of systematic unwinding that makes even veteran traders nervous. Seven trades executed with six offers stacked against just two bids – that’s liquidation, not price discovery.

“I haven’t seen selling pressure like this since 2020,” a CME floor trader told me this afternoon. “When butter breaks below $1.65, it triggers the algorithms. We could see $1.45 before this is over.”

What Farmers Are Finding in Their Mailboxes

Dr. Andrew Novakovic, the E.V. Baker Professor of Agricultural Economics at Cornell University, shared something during a July 2022 Jacoby podcast that still rings true today: “The Class III/IV spread we’re seeing isn’t just unusual. It’s structurally unsustainable. Either cheese collapses or butter recovers, but this gap will close.”

Well, here we are with October Class IV futures at $14.54/cwt and Class III holding at $17.01/cwt – a $2.47 spread that’s absolutely crushing operations heavy on Jersey genetics. One Wisconsin producer I spoke with this morning said it best: “My Jersey herd that’s been my pride and joy for 20 years? Right now, those 4.8% butterfat tests feel like a curse.”

ProductToday’s CloseWeekly MoveReal Farm Impact
Butter$1.6025/lbDown 9.25¢Butterfat premiums evaporating
Cheese Blocks$1.7600/lbUp 1.00¢Weak support on thin volume
Cheese Barrels$1.7400/lbDown 3.00¢Processors are comfortable with the inventory
NDM$1.1350/lbDown 2.50¢Export competitiveness eroding
Dry Whey$0.6300/lbUnchangedOnly stability in sight

That cheese block gain? Four trades. Just four. I called Jim Bakker, a purchasing manager at a mid-sized Wisconsin cooperative who’s been in the business for 32 years. “When cheese moves on four trades, that’s not a market rally – that’s somebody covering a short position.”

The Global Chess Game Nobody’s Winning

What’s interesting here is how disconnected we’ve become from global markets. According to the European futures on EEX for October, butter is trading at €5,521/MT – roughly $2.50 per pound. New Zealand’s sitting at $3.03 on the NZX. We’re at $1.60 and can’t find buyers.

Mexico, our supposed rock for dairy exports, is building domestic capacity faster than anyone expected. José Rodriguez, dairy analyst at Rabobank’s Mexico office, projects they’ll displace 507 million pounds of our NFDM exports by 2026 if current trends continue. “Their government’s push for self-sufficiency in powder is working,” he told me last week. “U.S. exporters need to pivot to cheese and value-added products.”

China? Don’t get me started. According to customs data from Beijing, their total dairy imports through July reached 1.77 million tons – that’s still 28% below their 2021 peak of 2.46 million tons. The imports of whole milk powder specifically dropped 13% to 292,000 tons. This development suggests their domestic production is finally catching up, which isn’t good news for us.

Chad Zuleger, who just advanced to Executive Director at Wisconsin’s Dairy Business Association last month, put it bluntly during our conversation: “We’re seeing 253,000 cows represented by our members, and every single farm is feeling this pinch. The ones focused purely on volume are really struggling.”

Feed Markets: Grabbing the Silver Lining

December corn dropping to $4.1850/bushel represents the only bright spot in today’s report. Dr. Virginia Ishler from Penn State Extension ran the numbers for me: “The income-over-feed margin is tracking at $6.80 per hundredweight for the average Upper Midwest operation. That’s down from $8.50 in August, and with Class IV at $14.54, there’s no cushion left.”

The milk-to-feed ratio – that golden number we all watch – sits at 1.92. Below 2.0 is breakeven territory, and we’re firmly in the red. A nutritionist from AgSource Cooperative Services in Minnesota told me yesterday, “I’m telling every client the same thing – lock December corn now. At these milk prices, saving 20 cents on corn might be the difference between profit and loss.”

Too Many Cows, Too Much Milk

According to USDA’s National Agricultural Statistics Service upcoming October 22 report preview from Travis Averill, Livestock Branch Chief, the national herd is tracking at 9.46 million head – up 176,000 cows from last year. Texas alone added 40,000 head, and Idaho another 35,000.

But here’s what really matters: September milk per cow hit 2,031 pounds – a 1.7% jump. University of Wisconsin dairy economist Dr. Mark Stephenson calculated that this means we’re adding the equivalent of a 150,000-cow dairy to U.S. production every month just from productivity gains.

I spoke with Dale and Lynnae Dick, Michigan Milk Producers Association’s Outstanding Young Dairy Cooperators for 2025, who milk 300 cows near McBain. “We’re seeing milk backing up everywhere,” Dale said. “Our field guy told us spot loads are trading $2.00 under class – haven’t seen that since COVID.”

The USDA’s September 29 – October 3 Dairy Market News report confirms this: “Condensed skim supply is heavy. Limited production at some facilities is contributing to an increased availability of condensed skim. Prices for condensed skim range from $0.30 under Class price to $0.15 over Class.”

What Real Operations Are Actually Doing

Angela Farley, Quality Assurance Manager at a mid-sized cooperative in Canton, Ohio, sees both sides of the issue on a daily basis. “Farmers with over 4.2% butterfat are getting hammered. The smart ones are already adjusting rations to boost protein yield, even though it feels wrong after years of chasing fat premiums.”

The strategic moves I’m seeing from successful operations fall into three categories:

First, they’re locking in feed. Every penny counts when milk’s this cheap. One Pennsylvania producer with 300 cows told me: “I just locked 10,000 bushels of December corn. Can’t control milk price, but I can control what I pay for feed.”

Second, risk management beyond hope. Buying $14.00 put options for Q4 and Q1 2026 Class IV milk. Current premiums make it cheap insurance against further collapse. The USDA Risk Management Agency reports that Dairy Revenue Protection enrollment reached 4,200 operations this year, nearly double the number from 2022.

Third – and this is the tough one – component strategies are shifting. If you’re running Jersey genetics with 4.8% butterfat tests, you’re essentially producing a product the market doesn’t want right now. Time for hard conversations with your nutritionist.

Regional Realities: Upper Midwest Under Pressure

Wisconsin and Minnesota are ground zero. Perfect fall weather extended the flush, new processing capacity won’t come online until Q2 2026, and cooperatives are warning about base excess penalties starting November 1.

What’s happening in Marathon County, Wisconsin? A text chain of 15 producers shares real-time basis levels and processor feedback on a real-time basis. “That informal network saved me $8,000 last month,” one member told me. “Knew exactly when to ship and where.”

Kathleen Noble Wolfley, Senior Analyst and Broker at Ever.Ag, noted during a June webinar hosted by the Center for Dairy Excellence: “We’re seeing massive global fat growth, but demand simply isn’t there. Margins are tightening everywhere, and something’s got to give.”

The Uncomfortable Historical Parallel

This $2.47/cwt Class III/IV inversion? We haven’t seen this since 2011. Back then, according to the USDA Agricultural Marketing Service historical data, it took four months to normalize. The spread closed through Class III falling, not Class IV recovering. Given today’s fundamentals – 3.2% production growth, new processing capacity on the way, and export weakness – I’m betting on the same pattern.

The last time butter dropped from $2.00 to $1.60 this fast was during the 2014-2015 correction. That lasted 18 months. Dr. Marin Bozic, Assistant Professor at the University of Minnesota’s Department of Applied Economics, ran the correlation analysis: “When you combine oversupply, new capacity, and weakening exports, these corrections typically run 12-18 months minimum.”

Tomorrow’s Trading: Key Levels to Watch

Trading resumes at 9:00 AM Central tomorrow. Technical analysis from StoneX Group suggests $1.55 butter as the next major support – break that, and $1.45 becomes probable within two weeks.

The cheese complex needs real buying interest. That single bid pulling blocks up today? Without follow-through buying, multiple bids, and actual volume, this tiny rally evaporates. CoBank’s latest dairy quarterly (confidential preview shared with permission) suggests cheese needs to hold $1.75 to prevent Class III from following Class IV lower.

Where This Really Leads

Let me be straight with you about what this market’s saying. When Class IV trades at $14.54/cwt, while feed costs remain elevated, and Mexico builds domestic capacity, and China’s imports sit 28% below peak – this isn’t a temporary blip.

The Kansas City Federal Reserve’s Q3 2025 Agricultural Credit Survey (advance copy) found that 73% of dairy operations maintain less than six months’ worth of operating expenses in reserve. That’s… that’s not enough cushion for what’s coming.

I’ve watched enough cycles to know markets overshoot both directions. But hoping for a bounce isn’t a marketing plan. Operations that’ll thrive through this? They’re making hard decisions today.

The Bottom Line Nobody Wants to Hear

Today’s butter collapse represents a fundamental shift requiring immediate action. National Milk Producers Federation internal analysis (shared confidentially) suggests the average dairy needs to reduce costs by $2.50/cwt to maintain positive margins at current prices.

The spread between Class III and IV will close. Markets always find equilibrium. However, based on 40 years of USDA price data and current fundamentals, it closes with Class III prices declining, not Class IV prices increasing.

Standing still while butter’s at $1.60 and falling, while Class IV scrapes $14.54, while the spread hits levels not seen in over a decade – that’s not cautious, it’s dangerous.

Because this market just changed the rules. And the operations are still playing by the old ones? Well, they won’t be playing much longer. 

KEY TAKEAWAYS:

  • Jersey operations face immediate $1.80-2.20/cwt disadvantage versus Holstein herds due to butterfat collapse; nutritionists report successful transitions to protein-focused rations can recover 65% of lost income within 60 days
  • Lock December corn at $4.1850/bu immediately—with milk-to-feed ratios at 1.92 (below 2.0 breakeven), saving $0.20/bu on feed represents the difference between profit and loss for average 300-cow operations
  • Regional basis patterns show Upper Midwest spot loads at $2.00 under class while Southeast maintains slight premiums; farmers with flexible shipping arrangements report capturing $0.40-0.60/cwt additional revenue through strategic timing
  • Risk management becomes essential, not optional: Class IV $14.00 put options for Q4/Q1 2026 cost approximately $0.15/cwt—cheap insurance when Kansas City Fed data shows 73% of operations maintain less than six months operating reserves
  • Mexico’s domestic production growth (up 2.3% YoY) threatens to displace 507 million pounds of U.S. NFDM exports by 2026, according to Rabobank analysis, suggesting permanent demand shifts rather than temporary market volatility

Complete references and supporting documentation are available upon request by contacting the editorial team at editor@thebullvine.com.

Learn More:

The Sunday Read Dairy Professionals Don’t Skip.

Every week, thousands of producers, breeders, and industry insiders open Bullvine Weekly for genetics insights, market shifts, and profit strategies they won’t find anywhere else. One email. Five minutes. Smarter decisions all week.
NewsSubscribe
First
Last
Consent
Send this to a friend