










Central Order pooled milk fell from 1.50 billion pounds to 1.35 billion in a year. That’s not a market move. That’s handlers stepping off the pool, and your producer price differential wearing it.
Executive Summary:
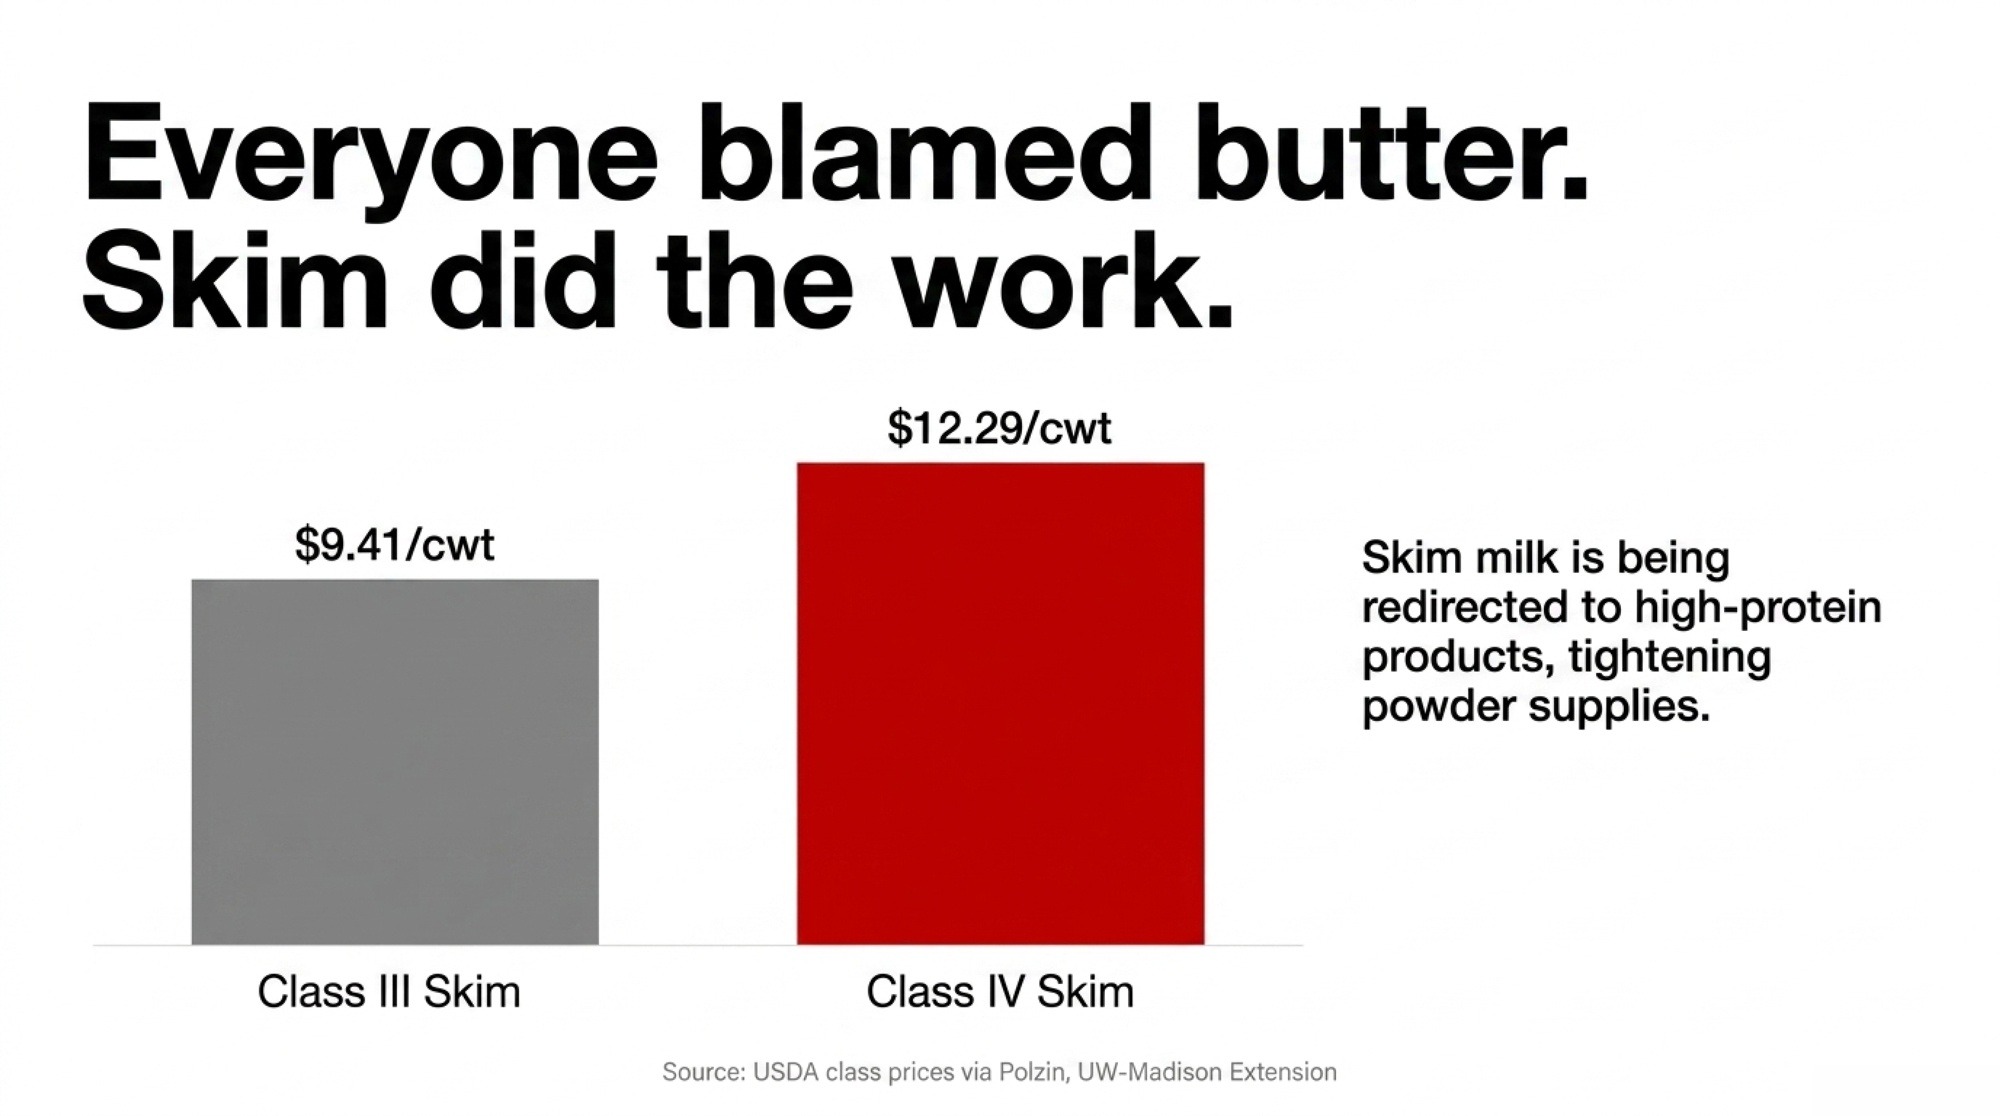
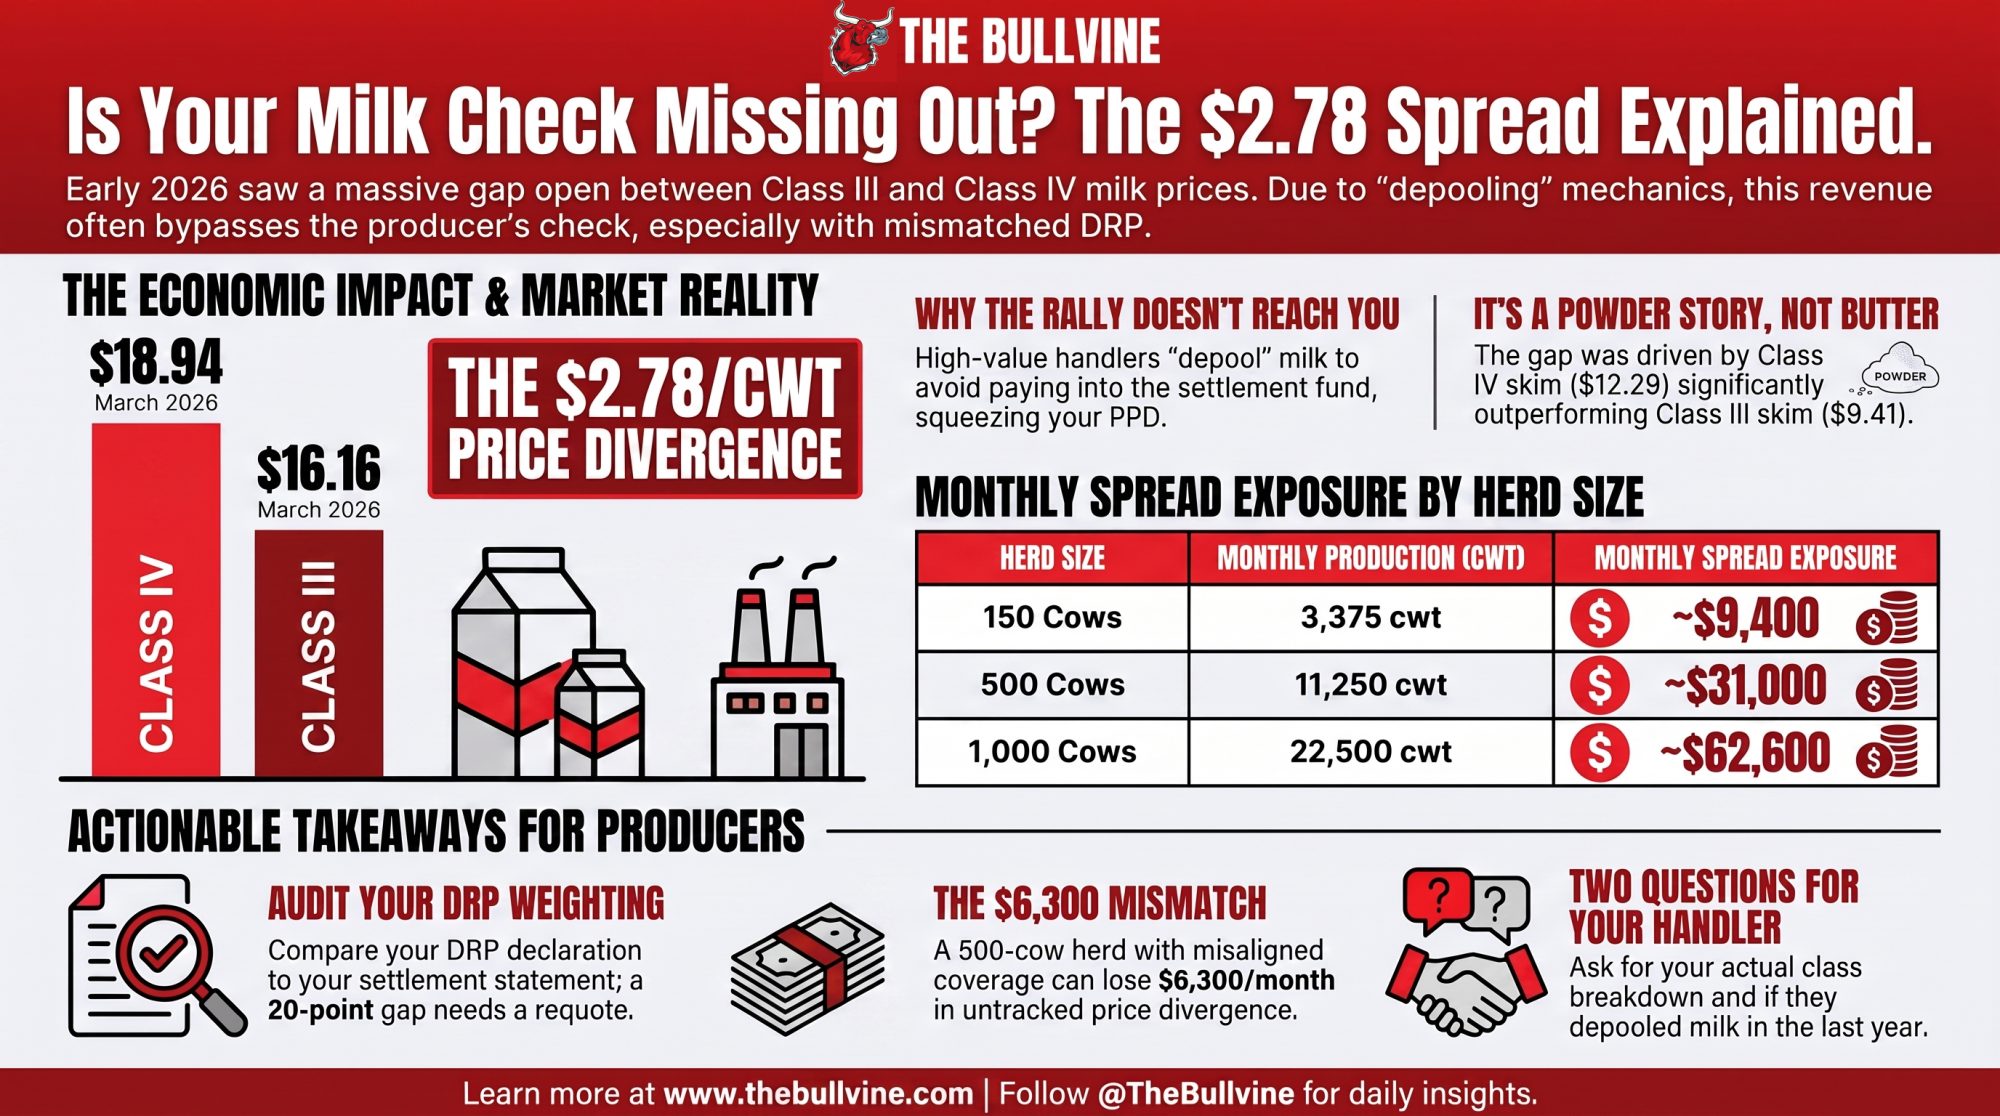
- The gap. Class III settled at $16.16/cwt in March 2026 while Class IV hit $18.94, a $2.78/cwt spread worth roughly $31,000 a month on 500 cows and about $9,400 on 150. UW-Madison Extension’s Leonard Polzin traced the divergence to nonfat dry milk rather than butter: $12.29/cwt Class IV skim against $9.41 Class III skim.
- The mechanism. When Class IV runs that far above a federal order’s uniform price, butter and powder plants step off the pool rather than pay into the producer settlement fund. That revenue never reaches the uniform blend, so the producer price differential riding on top of your component cheque gets squeezed, or goes negative.
- The fix. A 500-cow herd on a 60/40 cheese-powder pool carrying an 80/20 Class III DRP election shows roughly $6,300 a month of class divergence its policy isn’t tracking. Fifteen minutes with your settlement statement and your DRP declaration side by side tells you whether you’re one of them.
Analysis as of Aug. 26, 2026.
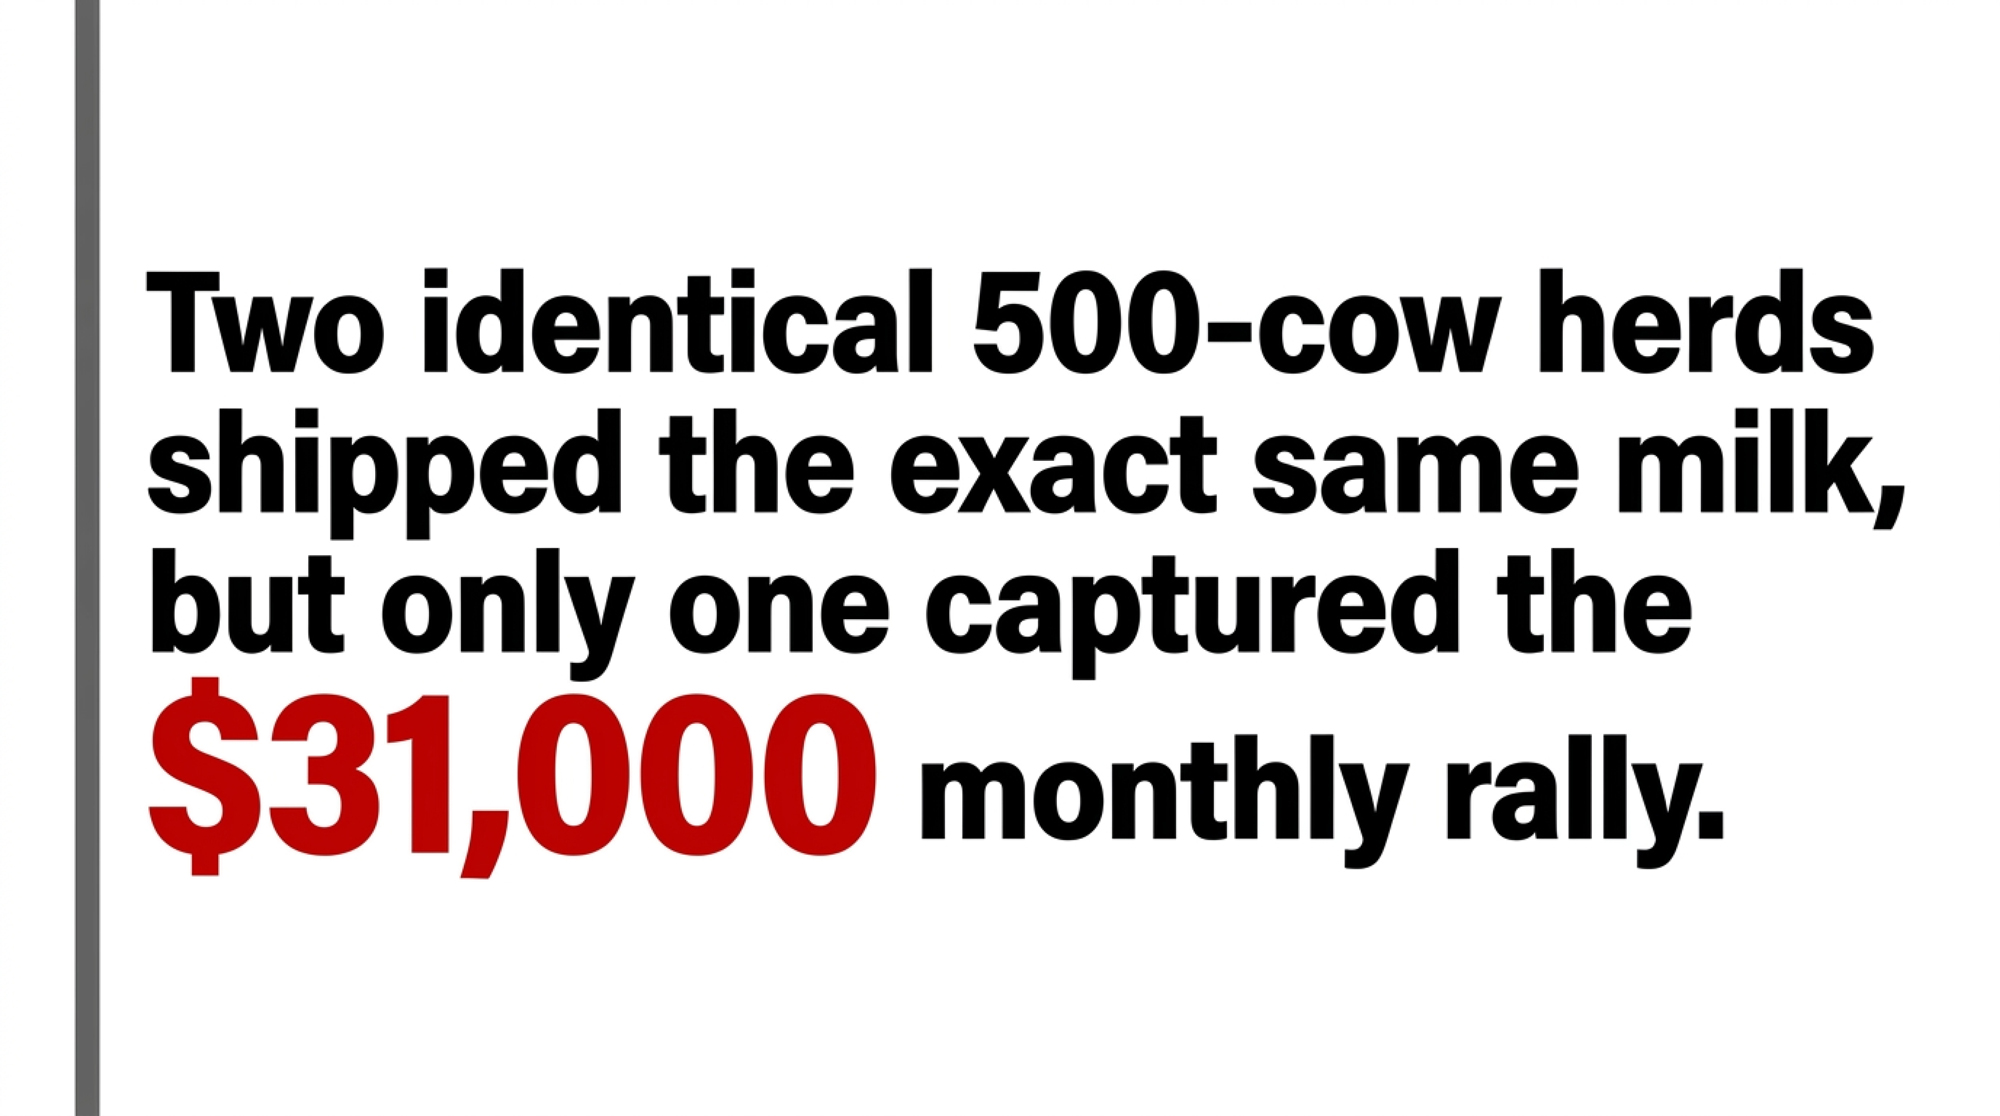
Class III milk settled at $16.16/cwt in March 2026 while Class IV hit $18.94, a $2.78/cwt spread worth roughly $31,000 a month on a 500-cow herd. Two operations with the same cows, the same ration, and the same diesel bill landed on opposite sides of it. Neither did anything to earn the difference.
| March 2026 | Class III | Class IV | Gap |
| Announced price | $16.16/cwt | $18.94/cwt | $2.78/cwt |
| Skim milk price | $9.41/cwt | $12.29/cwt | $2.88/cwt |
| Priced off | Cheddar + dry whey | Butter + NFDM | — |
Source: USDA class prices via Polzin, UW-Madison Extension
Ship into a Wisconsin cheese plant, and the formula put you on the other side of it. The driver isn’t the one the shorthand suggests.
Everyone Assumed Butter. The Skim Side Was Doing the Work.
Leonard Polzin, Dairy Markets and Policy Outreach Specialist at the University of Wisconsin–Madison Division of Extension, worked through the Federal Milk Marketing Order formulas to find where the gap came from. Class IV is the butter-and-powder class, so the reflex is to blame butter.
His analysis points to nonfat dry milk instead, the powder left after water comes out of skim, which sets the nonfat solids value in the Class IV formula. That $2.88/cwt skim gap in the table above is the whole story in one line.
Polzin named the structural reason too, and that’s the part with staying power: skim milk is getting redirected toward ultrafiltration and high-protein products, tightening what actually reaches the dryers. Processing-mix shifts don’t reverse inside a quarter.
By early May, Iowa State University Extension was tracking a Class IV/Class III futures gap of roughly $5/cwt, the widest that difference has ever been. This isn’t a one-month oddity.
Why a Class IV Rally Never Reaches a Cheese Cheque
Polzin states plainly that this NFDM-driven Class IV strength does not flow directly into the pay price for Wisconsin cheese-route producers. The pooling mechanics are why.
Under a federal order, Class I fluid milk must always stay pooled. Manufacturing milk — Class II, III, and IV — can be kept out, and handlers do exactly that when a class price runs above the order’s uniform price. Butter and powder plants pull their milk off the pool rather than pay the difference into the producer settlement fund. Cheese plants can do the same when the arithmetic favors them; this isn’t a one-way mechanism.
The practical effect for an Upper Midwest (Order 30) shipper is narrower than “you missed the rally.” You’re paid Class III component values plus a producer price differential. When high-value Class IV milk leaves the pool, that revenue never enters the blend at all, so the PPD sitting on top of your component cheque gets squeezed, or goes negative. There was no Class IV upside to share. It exited before the sharing happened.
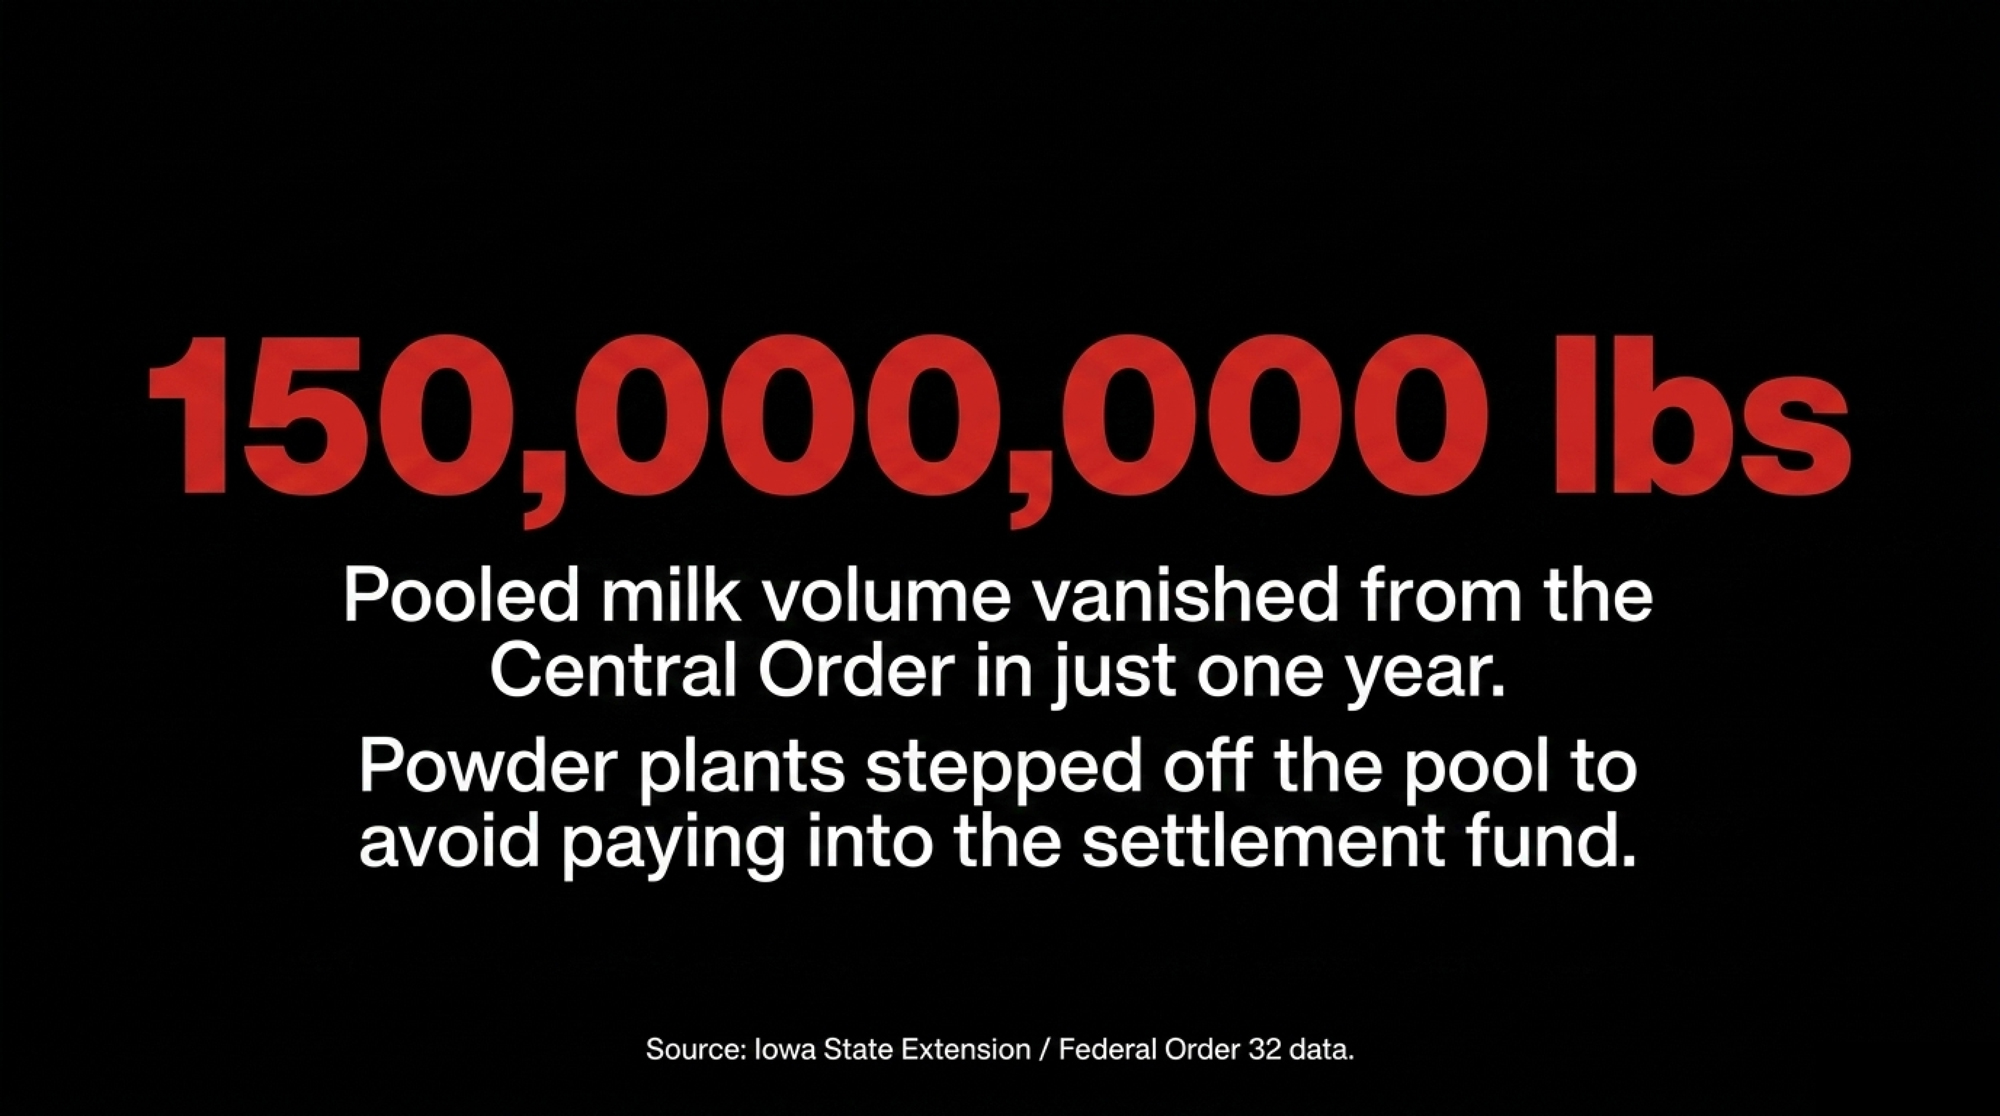
The clearest documented example of that flight comes from a separate order. Iowa State Extension reported that pooled milk in the Central Order (Federal Order 32) fell to about 1.35 billion pounds in March 2026, down from more than 1.50 billion a year earlier, with Class III utilization at 48.2% and Class IV withering to just 12.0%. Handlers voting with their feet rather than subsidizing the pool, in the same month as that $2.78 spread.
Order 32 is not Order 30, and the Wisconsin numbers aren’t in that dataset. But the incentive is written into the federal order structure itself, not into any one marketing area: any handler in any order can keep manufacturing milk off the pool when the class price beats the uniform price. Order 30 runs the lowest Class I utilization of any federal order, which means its blend leans harder on manufacturing milk than most, and a cheese-route producer there is paid off exactly the same component-plus-PPD arithmetic. Treat the Central Order figures as the visible case, not as Wisconsin’s ledger.
The Same Formula, Two Different Coasts
That Q1 divergence looked different depending on where you shipped. Corey Geiger, dairy economist at CoBank, told Brownfield Ag News in January 2026 that “if you look at the Class III markets here in the U.S., we see a rebounding of the Class III much faster… however, west of the Rockies, Class IV, butter and non-fat dry milk, and other powders is really down.” He noted futures had projected $19 Class IV against a $13–14 reality, “a lot of stress west of the Rockies right now.”
One formula, opposite outcomes. In January, Western butter-powder shippers watched a forecast collapse while Class III recovered. By March, the skim rally had flipped it. Class IV ran nearly three dollars clear of Class III, and this time Upper Midwest cheese shippers were the ones locked out. Late summer moved it again, which is where the current numbers come in.
Contract structure matters here too. A co-op member and an independent shipper on a direct supply agreement face the same federal formula but very different visibility into pooling decisions. One has a board vote and a member statement, the other has whatever the contract requires the buyer to disclose. Worth knowing which one you are before you call your handler.
A note for readers north of the border: this is a Federal Milk Marketing Order mechanic. Ontario and other supply-managed producers price through a provincial board, so the Class III/IV split has no direct analog on a Canadian cheque. The transferable lesson is narrower. Know which product classes your processor actually serves before assuming a commodity rally reaches you.
Running the Numbers
Class-spread exposure — illustrative scenarios, March 2026 formula prices
| Input | Value |
| Class IV, March 2026 | $18.94/cwt |
| Class III, March 2026 | $16.16/cwt |
| Spread | $2.78/cwt |
| Production assumption | 75 lbs/cow/day (swap in your rolling average) |
Scale it to your herd:
| Herd size | Monthly cwt (30 days) | Spread exposure |
| 150 cows | 3,375 | ≈ $9,400/month |
| 300 cows | 6,750 | ≈ $18,800/month |
| 500 cows | 11,250 | ≈ $31,000/month |
| 1,000 cows | 22,500 | ≈ $62,600/month |
Production swings move it too. At 85 lbs/cow/day, a 500-cow herd shows 12,750 cwt and roughly $35,400; at 65 lbs, 9,750 cwt and about $27,100. A 31-day month adds about $1,000.
What this math is not: profit or loss. It’s the difference in the formula price two operations settle against, before component premiums, hauling deductions, and handler blend adjustments. Your actual cheque sits downstream of all three.
Why “Class IV Is Weak” Only Tells Half the Story
Class III and Class IV aren’t market prices. They’re formula outputs. USDA calculates Class III from National Dairy Products Sales Report cheddar and dry whey prices, and Class IV from NDPSR butter and NFDM prices. Four commodities, two classes, no cow anywhere in the arithmetic.
So Class IV runs on two engines: butter on the fat side, NFDM on the skim side. They don’t have to move together.
Watch the late-August prints, and you can see them pulling apart in real time. Cheddar blocks sat at $1.5275/lb through Aug. 25. Butter closed at $1.4300 on Aug. 19, recovered to $1.4800 by Aug. 25, and its Aug. 17–21 weekly average of $1.4625 still ran well under year-ago levels. NDM climbed to $1.8100 on Aug. 19 and held there through Aug. 25 before easing 2.5 cents to $1.7750 on Aug. 26. September Class III futures were trading at $16.45 on the morning of Aug. 26.
Two components, same class, moving on their own clocks.
USDA’s August 2026 Livestock, Dairy and Poultry Outlook cut the 2026 butter forecast 4.5 cents to $1.645/lb while trimming NDM just 1.0 cent, to $1.605/lb. The August WASDE lowered the 2026 all-milk forecast to $19.85/cwt, raised Class III, and lowered Class IV. The divergence is written into USDA’s own numbers.
One detail runs counter to the tidy oversupply story. USDA NASS Cold Storage, released Aug. 24, 2026, put butter stocks down 3% from the prior month and down 3% year-over-year. Falling stocks aren’t what oversupply looks like.
Worth a caution: Polzin’s analysis covers the first quarter. The August prints suggest his mechanism is still operating, but that extension is an inference from the data, not a claim he made.
Anyone budgeting expansion against the annual number rather than the monthly spread should read our breakdown of how the $19.85 all-milk forecast reshapes expansion math alongside this.
How Much Does the Wrong DRP Weighting Cost?
Dairy Revenue Protection lets you elect a Class Pricing option with a declared Class III/Class IV weighting, or a Component Pricing option built on your own butterfat and protein tests. When that weighting doesn’t match where your milk settles, you’re buying protection against a revenue stream you don’t have.
Work it through on the verified March spread. A 500-cow herd shipping 11,250 cwt a month, on a handler running 60% cheese and 40% butter/powder, carrying a DRP election weighted 80% Class III:
| Metric | Actual Pool Exposure | DRP Policy Weighting | Status |
|---|---|---|---|
| Class III share | 60% | 80% | Over-weighted |
| Class IV share | 40% | 20% | Under-weighted by 20 pts |
| March 2026 spread | $2.78/cwt | — | — |
| Monthly volume (500 cows) | 11,250 cwt | — | — |
| Untracked divergence | — | — | ≈$6,300/month |
| Requote trigger threshold | — | — | >20-point gap |
- Actual pool exposure: 60% Class III / 40% Class IV
- Policy weighting: 80% Class III / 20% Class IV
- Mismatch, measured on the Class IV side: 20 percentage points
- March 2026 spread: $2.78/cwt
- Untracked divergence: 11,250 cwt × $2.78 × 20% = roughly $6,300/month
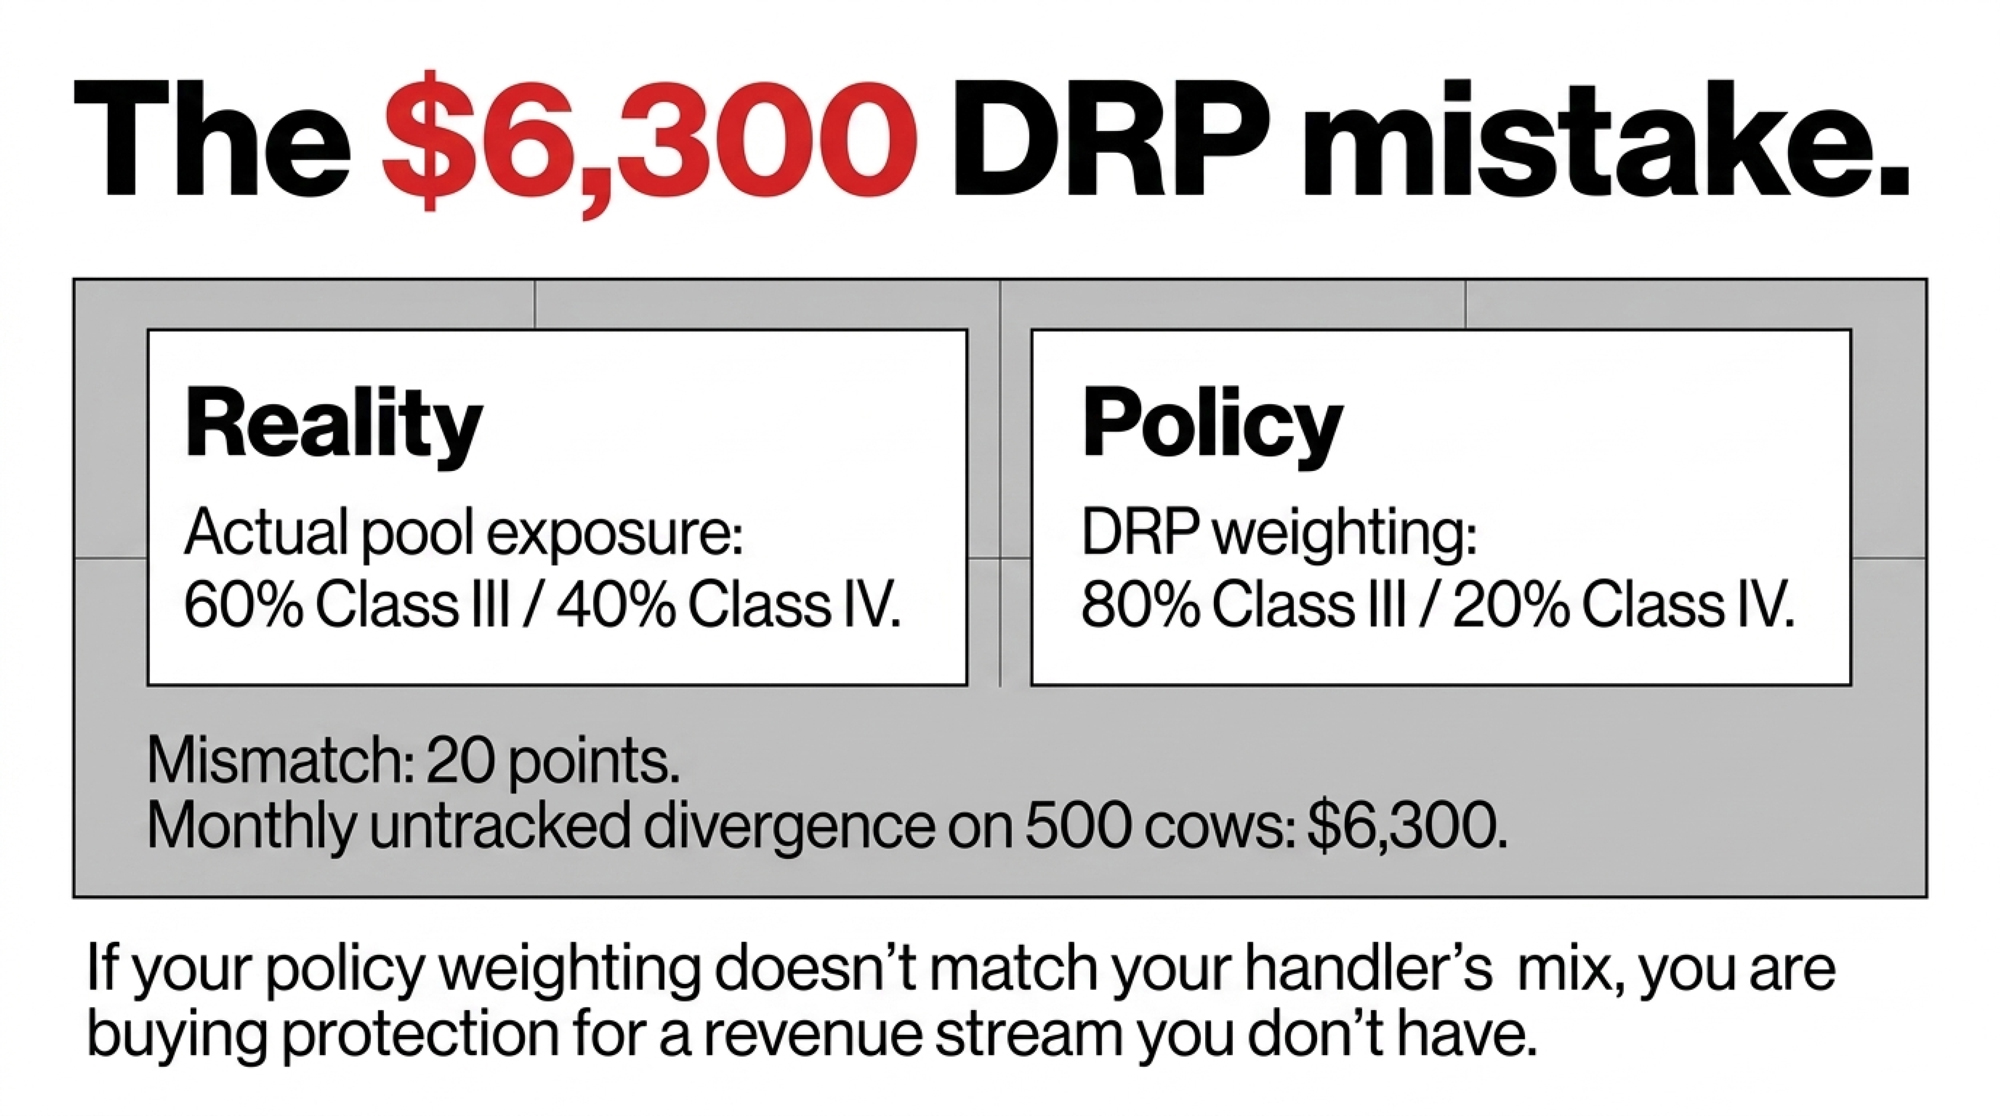
That’s a modeled figure built on a real spread and a stated weighting gap, not a forecast and not a loss. It’s the portion of the class divergence your policy isn’t tracking, measured one way. Weight both sides of the mismatch and you’d get a different number. The spread has narrowed since March, so pull the current one off your own settlement statements rather than borrowing this arithmetic wholesale.
RMA data cited in Bullvine reporting from October 2025 put DRP coverage at roughly 35% of U.S. milk production, above 50% in the High Plains. Coverage rates tell you how many operations bought a policy. They say nothing about whether the weighting matches the pool, which is why it’s worth understanding how DRP quarters and DMC tiers actually work before the next sales window.
Is Your Milk Actually Where You Think It Is?
Most producers can name their co-op. Fewer can state the class breakdown of what that co-op does with their milk in a given month, and that breakdown is what a DRP election should be built on.
Handlers shift plant mix. They also make month-to-month pooling decisions you’ll never be consulted on. When either changes, your correct weighting shifts with it, and that change won’t show up in your mailbox or your premium.
The 30/90/365-Day Playbook for Class-Exposed Herds
30 Days
Step 1 — Compare two documents. Action: Pull your most recent settlement statement and find the class utilization. Pull your current DRP declaration and find the weighting factor. Put them side by side. Trigger: A gap of more than 20 points means request a requote before the next quarterly window. Failure mode: Checking is free. Changing coverage means buying at current premiums, so know your number before you call the agent.
Step 2 — Test the spread against your debt coverage. Action: Take the per-cwt spread from your last three settlement statements, multiply by monthly cwt, and set it beside your term-debt obligation. This is a variance check, not a true ratio. It tells you how much class movement your debt service can absorb. Trigger: UW-Madison Extension’s repayment-capacity guidance treats a debt coverage ratio above 1.75 as strong and below 1.25 as a weakness. If class variance alone could push you under 1.25 in a bad quarter, this is a liquidity question, not paperwork. Failure mode:Variance isn’t cash flow. Run the real ratio with your lender or CPA before acting.
Step 3 — Confirm DMC enrollment. Action: Verify your status. The 2026 window closed Feb. 26, 2026 (USDA FSA), so there’s nothing left to buy, but there’s something to know. Trigger: If you assumed you were enrolled and can’t confirm it, make that call this week. Failure mode: None. Five-minute check, no downside.
Step 4 — Re-run your fall fuel line. Action: Reprice harvest, hauling, and manure fuel at current rates. U.S. national average retail diesel ran $5.652/gal the week of Aug. 24, up 52.2% from $3.713 a year earlier (EIA weekly series). Trigger: Any budget built on published forecast guidance needs revisiting. Failure mode: This lands during silage season, ahead of the cheque that covers it. Working-capital timing, not a planning error.
90 Days
Step 5 — Price Component against Class. Action: Have your agent quote both options using twelve months of your component data. Trigger: Fat and protein tests above breed average generally favor Component Pricing. Failure mode:It ties coverage to your own tests, so a component slump hits your cheque and your indemnity at the same time. That’s concentration, not diversification.
Step 6 — Ask your handler two questions. Action: Not the co-op name. The actual class breakdown of where your milk goes, and whether they depooled any months in the last year. Trigger: If your handler added or converted capacity, or depooled in a month when the spread was wide, treat your existing weighting as stale. Failure mode: Expect persistence to be required. Handlers don’t volunteer pooling decisions, and an independent supply contract may not obligate them to.
365 Days
Step 7 — Track the ultrafiltration signal. Action: Watch whether NDM holds its premium to cheddar blocks or the gap closes. Opportunity signal: If the skim redirection Polzin identified holds and your handler sits on the powder side, the exposure that hurt one quarter can favor you in another, but only if your coverage is weighted to capture it. Failure mode: Structural shifts are slow and easy to over-read from a single quarter’s prints. NDM gave back 2.5 cents on Aug. 26 alone.
Step 8 — Decide: manage the exposure, or accept it. Action: Some operations can’t change handlers. Name your category and plan accordingly. Trade-off: If the relationship is fixed, your levers are input cost and coverage weighting, not class mix. You gain stability. You give up the ability to chase the stronger class. Failure mode: Drifting without deciding, carrying a mismatched policy while telling yourself you’d switch handlers if it got bad enough.
For the full-year version of this arithmetic, our earlier analysis of what a three-dollar spread does across twelve monthsruns the same mechanics out to an annual figure.
Key Takeaways
- The Class IV rally that ran $2.78/cwt above Class III in March didn’t reach cheese-route herds because butter and powder plants step off the pool rather than pay into the producer settlement fund. In the Central Order, pooled milk fell from 1.50 billion pounds to 1.35 billion in a year, and Class IV utilization dropped to 12.0%.
- Class IV runs on two engines, not one. NFDM drove the March gap, with the Class IV skim price at $12.29/cwt against $9.41 for Class III, while butter sat weak. If your risk coverage treats Class IV as a single number, it’s tracking half your exposure.
- Pull your settlement statement and DRP declaration, and compare class utilization to the weighting factor. A 500-cow herd on a 60/40 cheese-powder pool carrying an 80/20 Class III election shows roughly $6,300 a month of divergence its policy isn’t tracking. Request a requote before the next quarterly window if the gap runs past 20 points.
- Ask your handler two things: the actual class breakdown of where your milk goes, and whether they depooled any month in the last year. Neither answer shows up in your mailbox, and an independent supply contract may not require them to volunteer it.

What This Means for Your Operation
The uncomfortable part isn’t the spread. It’s that two operations with identical management can finish a quarter tens of thousands of dollars apart on arithmetic neither one participates in, and on pooling decisions made in an office neither one visits.
The only lever you control is whether the policy you’re paying for matches the milk you actually ship. So pull the paperwork. What does your DRP declaration say your class split is, and what did last month’s settlement statement say it actually was?
Complete references and supporting documentation are available upon request by contacting the editorial team at editor@thebullvine.com.
Learn More
- 11 Proven Strategies to Lower Feed Costs and Boost Efficiency on Your Dairy — Arms you with operational ration adjustments, shrink reduction tactics, and feed-management protocols to protect herd cash margins this week against rising baseline input expenses.
- $19.85 milk price forecast 2026: your base year decides — Exposes how cooperative fixed-base programs and federal make allowances turn top-line milk price forecasts into a $204,765 purchasing power drain on expanding herds.
- Dairy Technology 2026: Robotics, Sensors, AI and Real-World ROI — Breaks down total cost of ownership across automated milking systems, precision feeding robotics, and sensor APIs, pinpointing actual payback timelines from 55 to 1,000 cows.
The Sunday Read Dairy Professionals Don’t Skip.

Every week, thousands of producers, breeders, and industry insiders open Bullvine Weekly for genetics insights, market shifts, and profit strategies they won’t find anywhere else. One email. Five minutes. Smarter decisions all week.
