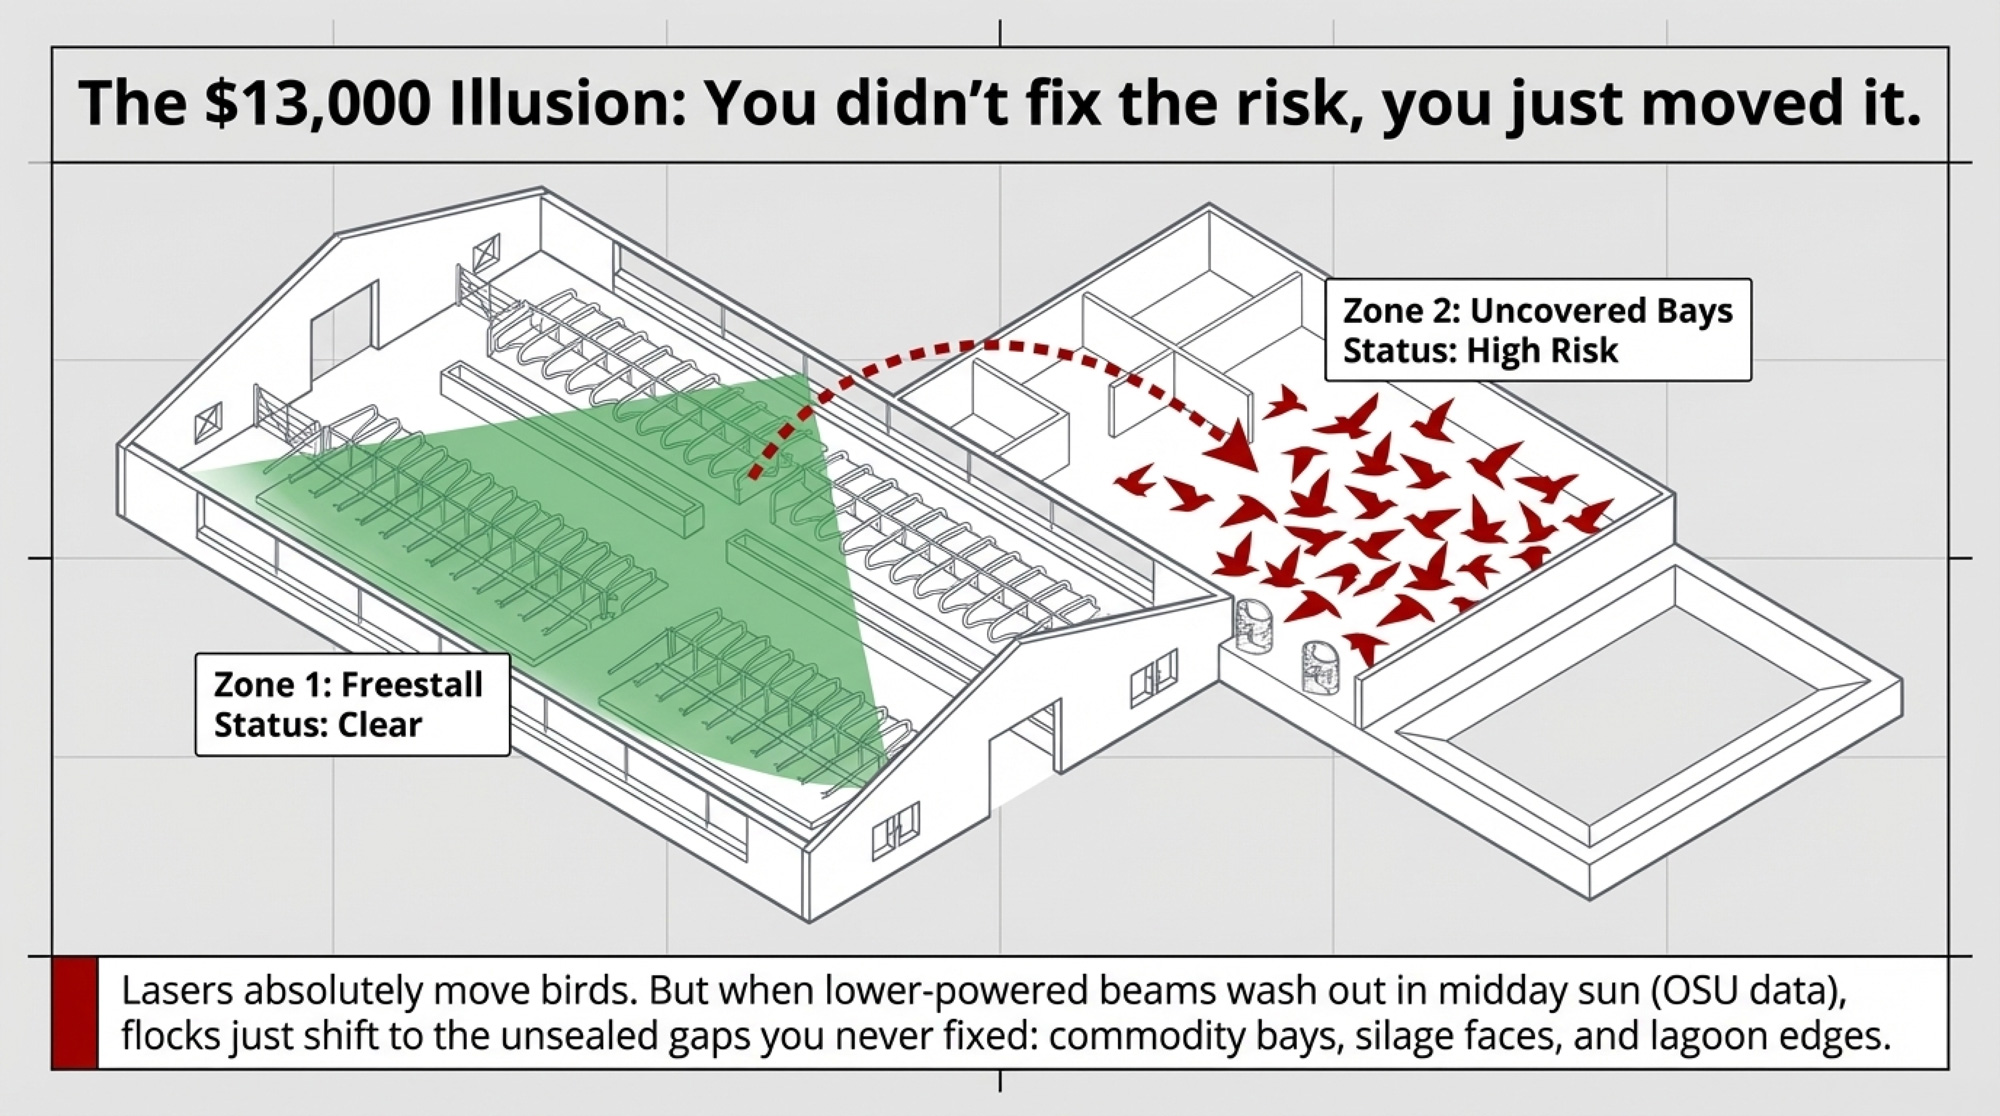
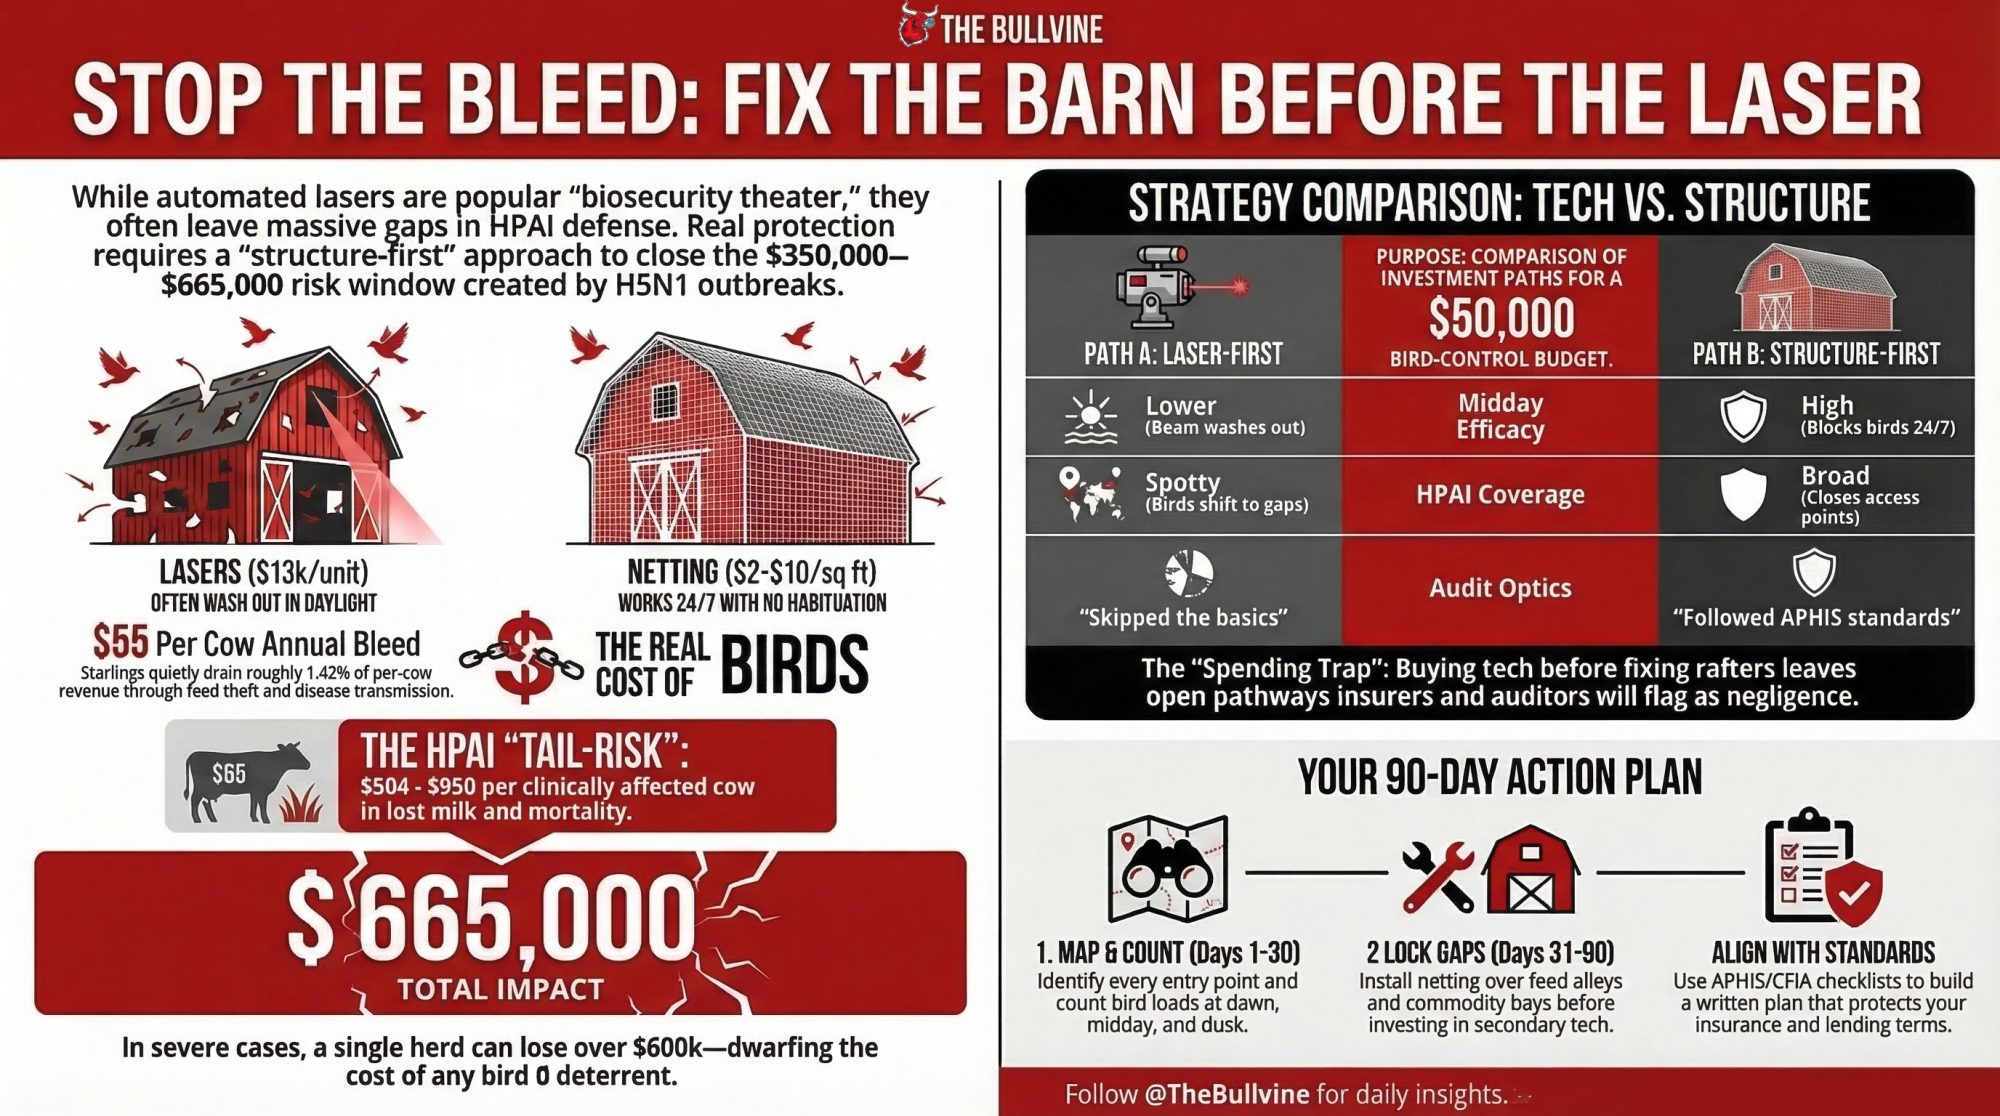
A $13,000 laser vs a $665,000 HPAI hit. If your rafters are still open, that beam is just expensive biosecurity theater.
Executive Summary: HPAI just turned bird control from a frustrating starling problem into a $350,000–$665,000 tail‑risk decision for your herd. On one side, the data says starlings quietly drain about $55/cow/year from feed and health; on the other, recent US H5N1 outbreaks have cost $504–$950 per clinically affected cow, with some herds losing nearly 40% of those cows within two months. Lasers run $12,500–$13,104 per unit and absolutely move birds — but only where the beam hits, and OSU tests show performance drops fast in full daylight and uncovered areas. USDA APHIS and CFIA/ProAction both put netting, curtains, sealed feed, and bunk hygiene ahead of gadgets, which is the opposite of the “laser‑first” sales pitch you’re hearing right now. This feature walks through the barn math on a $50,000 bird‑control budget, showing how a structure‑first plan closes real HPAI pathways while a laser‑first plan mostly shifts birds to the gaps you never fixed. You also get concrete negotiation scripts for processors, insurers, and lenders, plus 30/90/365‑day checks you can run off your own bird counts, feed‑shrink, and herd size. The blunt takeaway: if you buy the $13,000 laser before you buy the netting, you didn’t fix HPAI risk — you just made it more expensive.
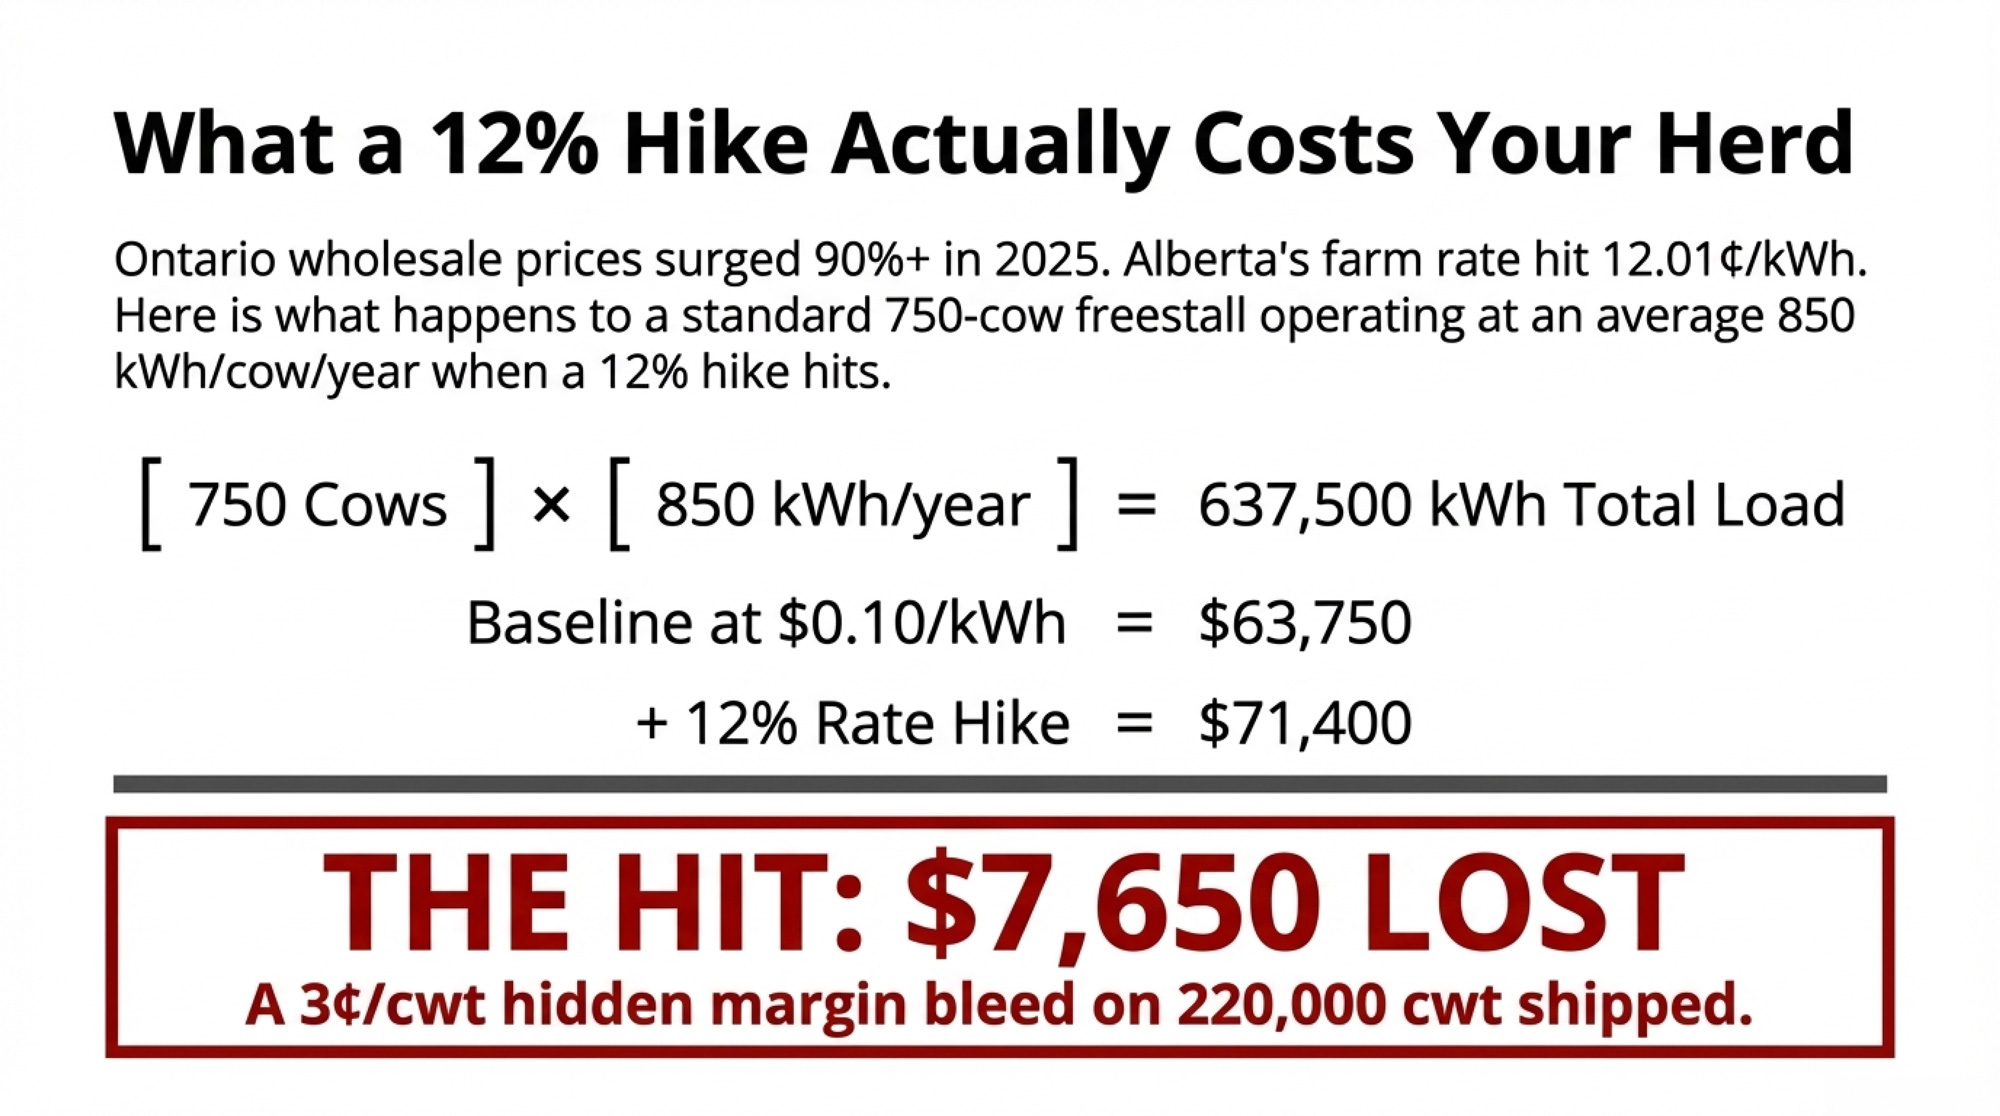
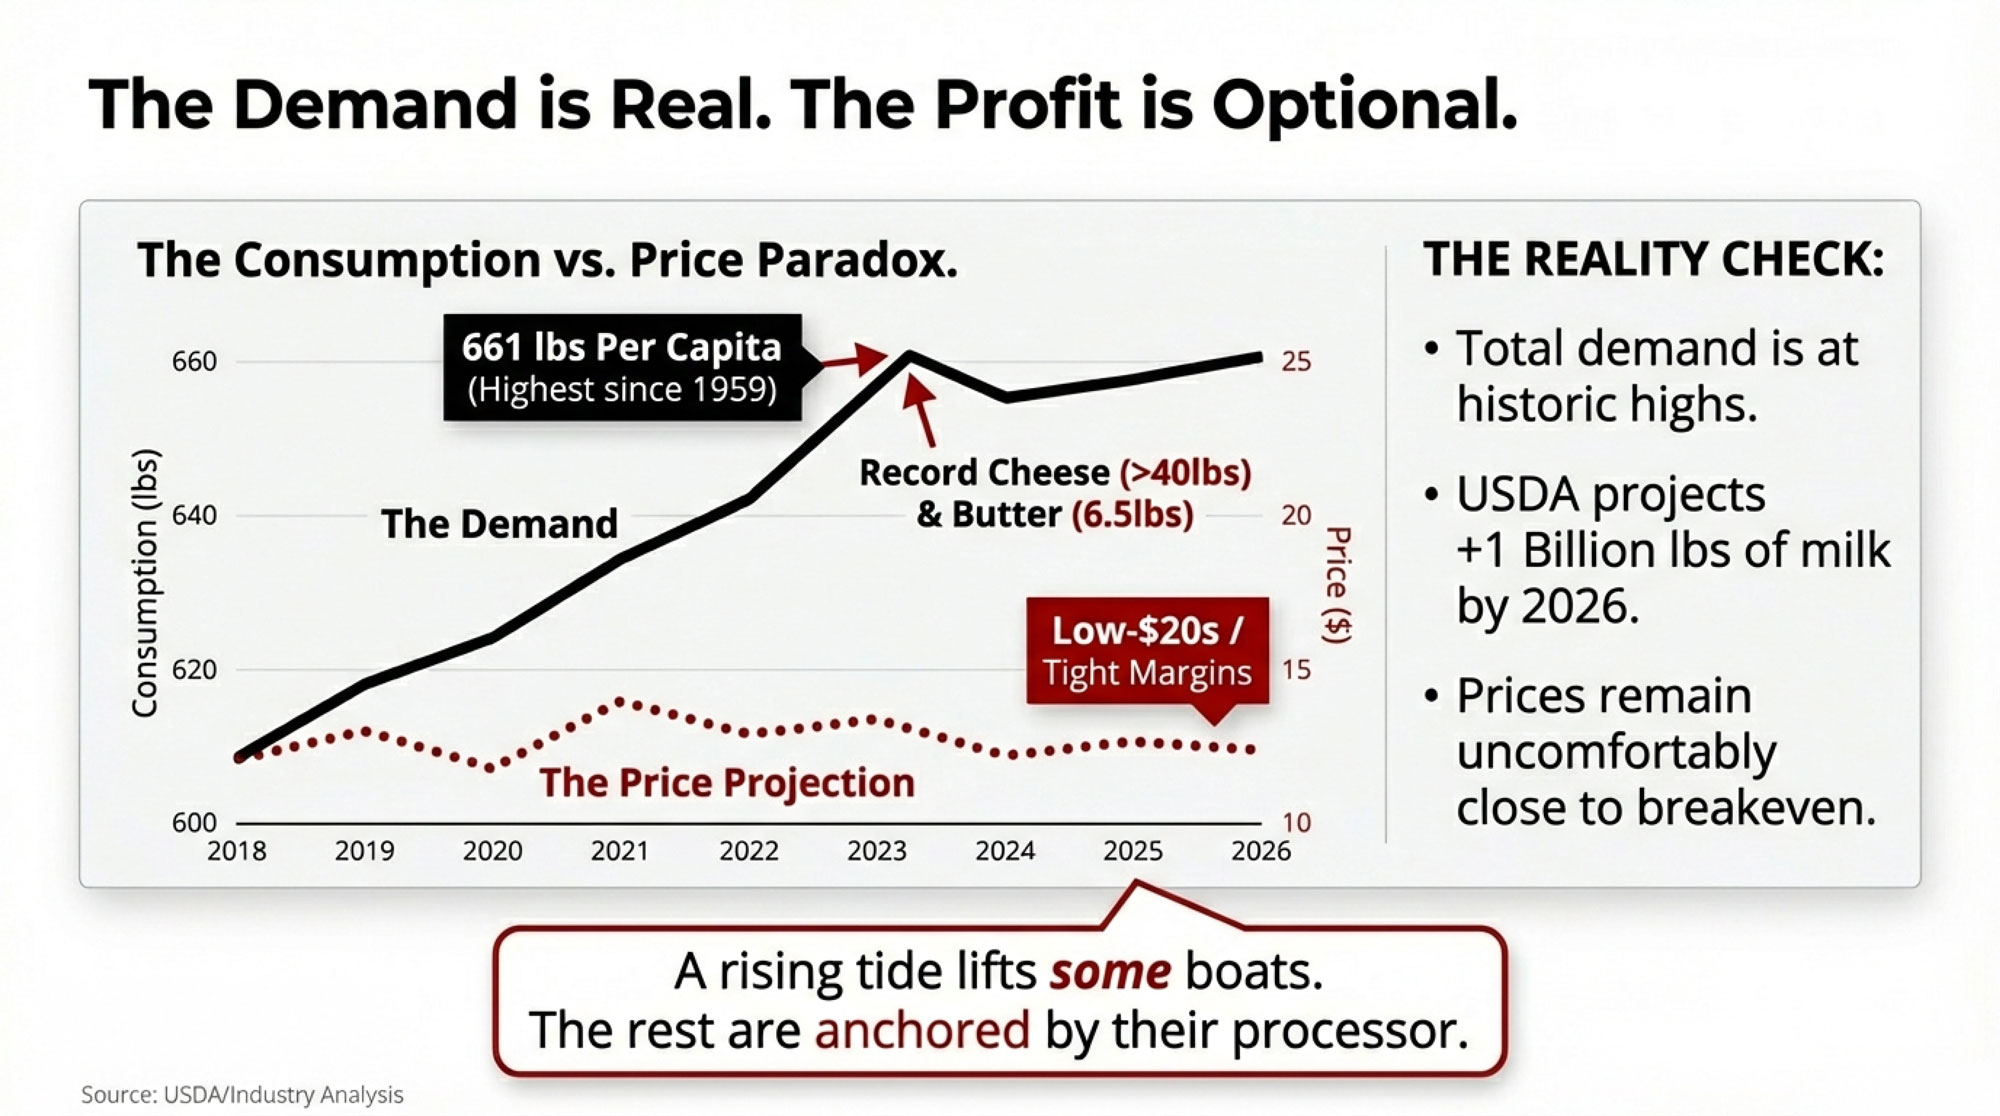
In 2026, a green laser sweeping through your freestall looks like a biosecurity win. It impresses visitors, makes a great social clip, and ticks the ‘technology’ box on someone’s checklist. But if the rafters over your feed alley are still open and your commodity bay isn’t sealed, that same beam could leave a 0,000–5,000 hole in your HPAI defense plan — the range of losses when roughly 700 cows are clinically affected at 4–0 per head.
The technology isn’t the problem. The spending order is.
Bird Control Group’s most-watched dairy video tells part of the story. An anonymous Idaho operation was bleeding an estimated $150,000 to $200,000 per year to starlings — feed eaten and fouled, milk suppressed across the herd. They installed an AVIX Autonomic laser in the stables; the green beam swept once, and thousands of birds exploded from the rafters while the cows barely flicked an ear. It looks like a $200,000 problem fixed in 30 seconds.
That clip is doing a lot of selling right now. As HPAI has turned wild birds from a nuisance into an existential biosecurity risk, more dairies are signing five‑figure laser quotes while leaving barn doors open, commodity bays unsealed, and feed hygiene stuck where it’s always been. The question isn’t whether the laser works. It’s whether following that Idaho playbook actually protects your margin — or makes your biosecurity look good on paper.
The $55 Per Cow Bleed You Never See on the Milk Check
That Idaho dairy sits at the ugly end of the spectrum. Most herds aren’t losing $200,000 a year to starlings. But the slow bleed is way more common than your milk check shows.
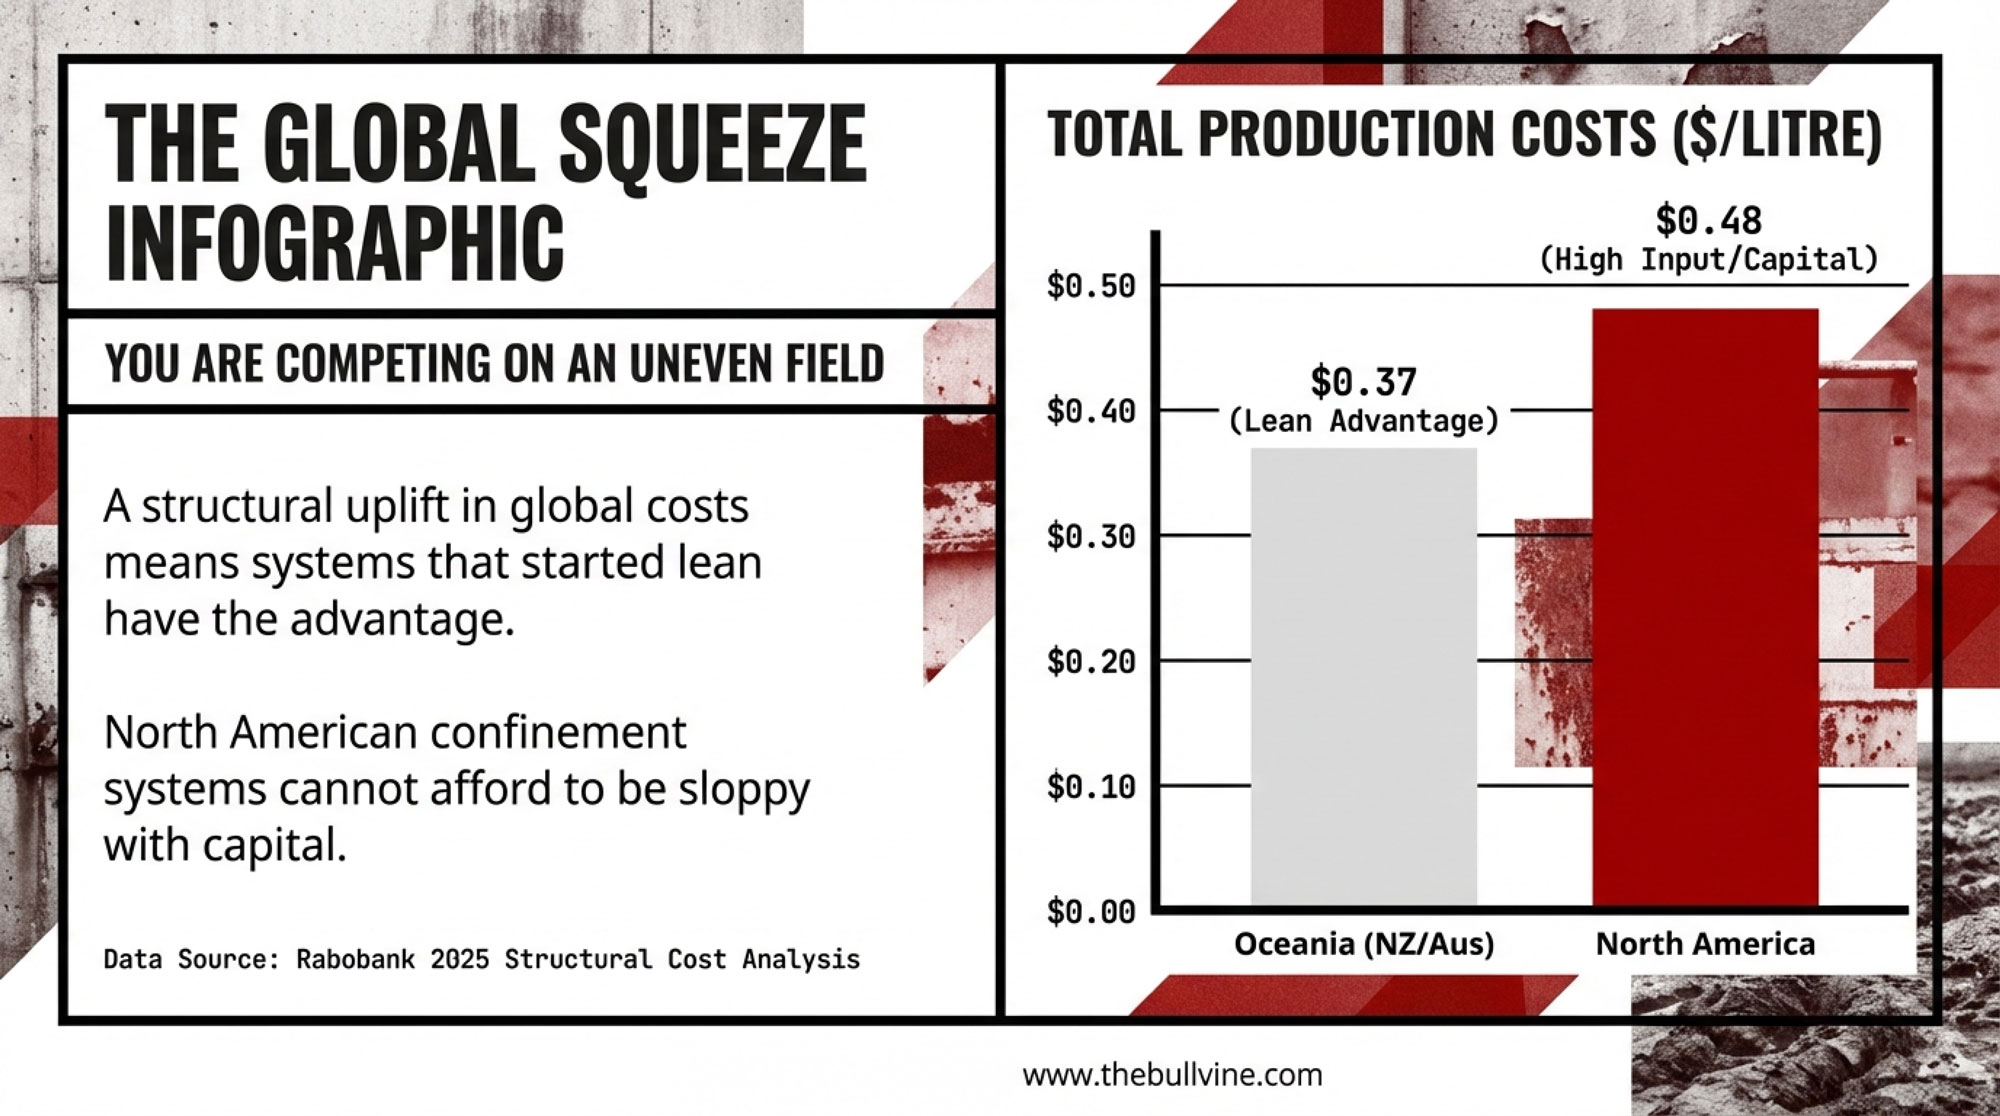
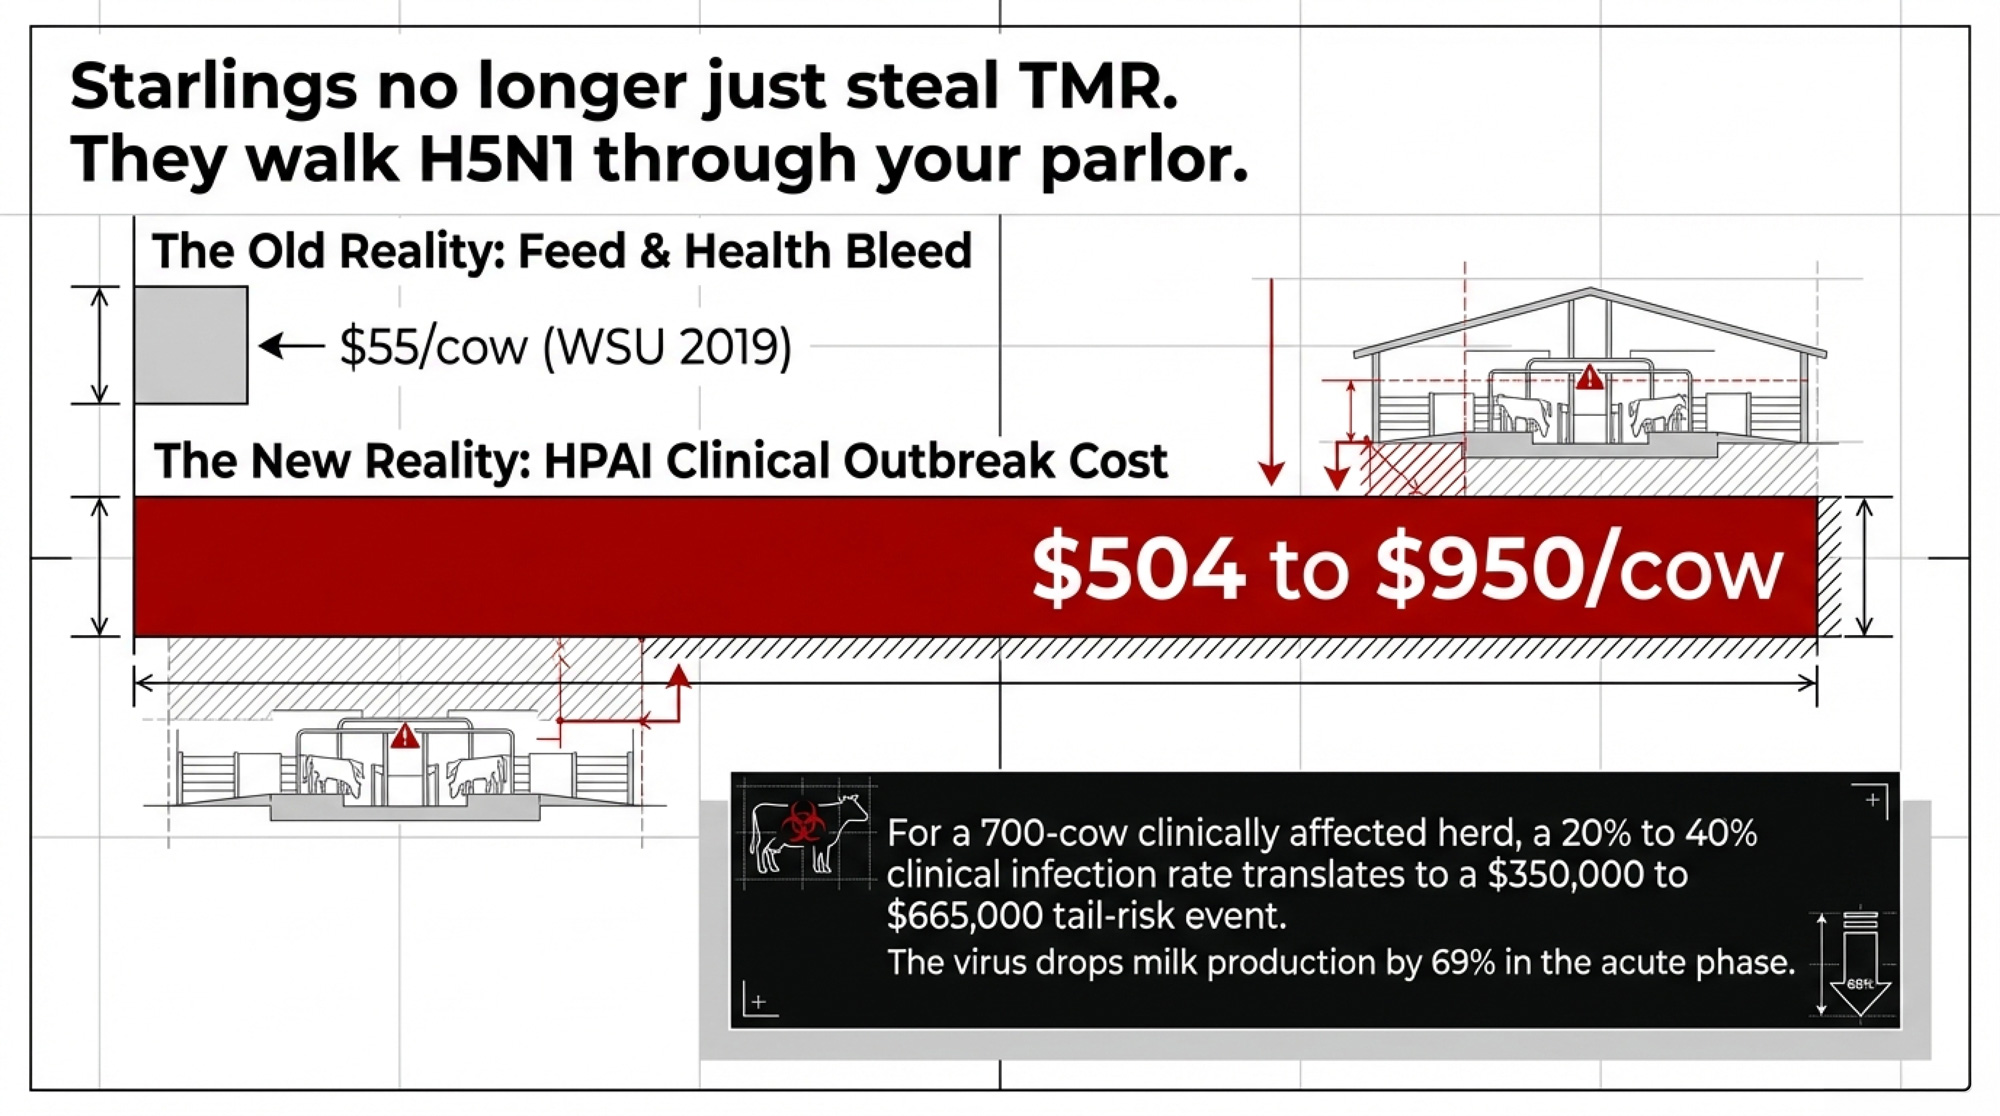
A 2019 Washington State University survey of dairy operators — published in PLOS ONE — put average bird-related losses at about .90 per cow per year, roughly 1.43% of per‑cow revenue, not a worst‑case number. A 3,000‑cow herd is closer to $164,700. It’s not “barn on fire” money on any single day. It’s constant margin erosion that never gets its own line item.
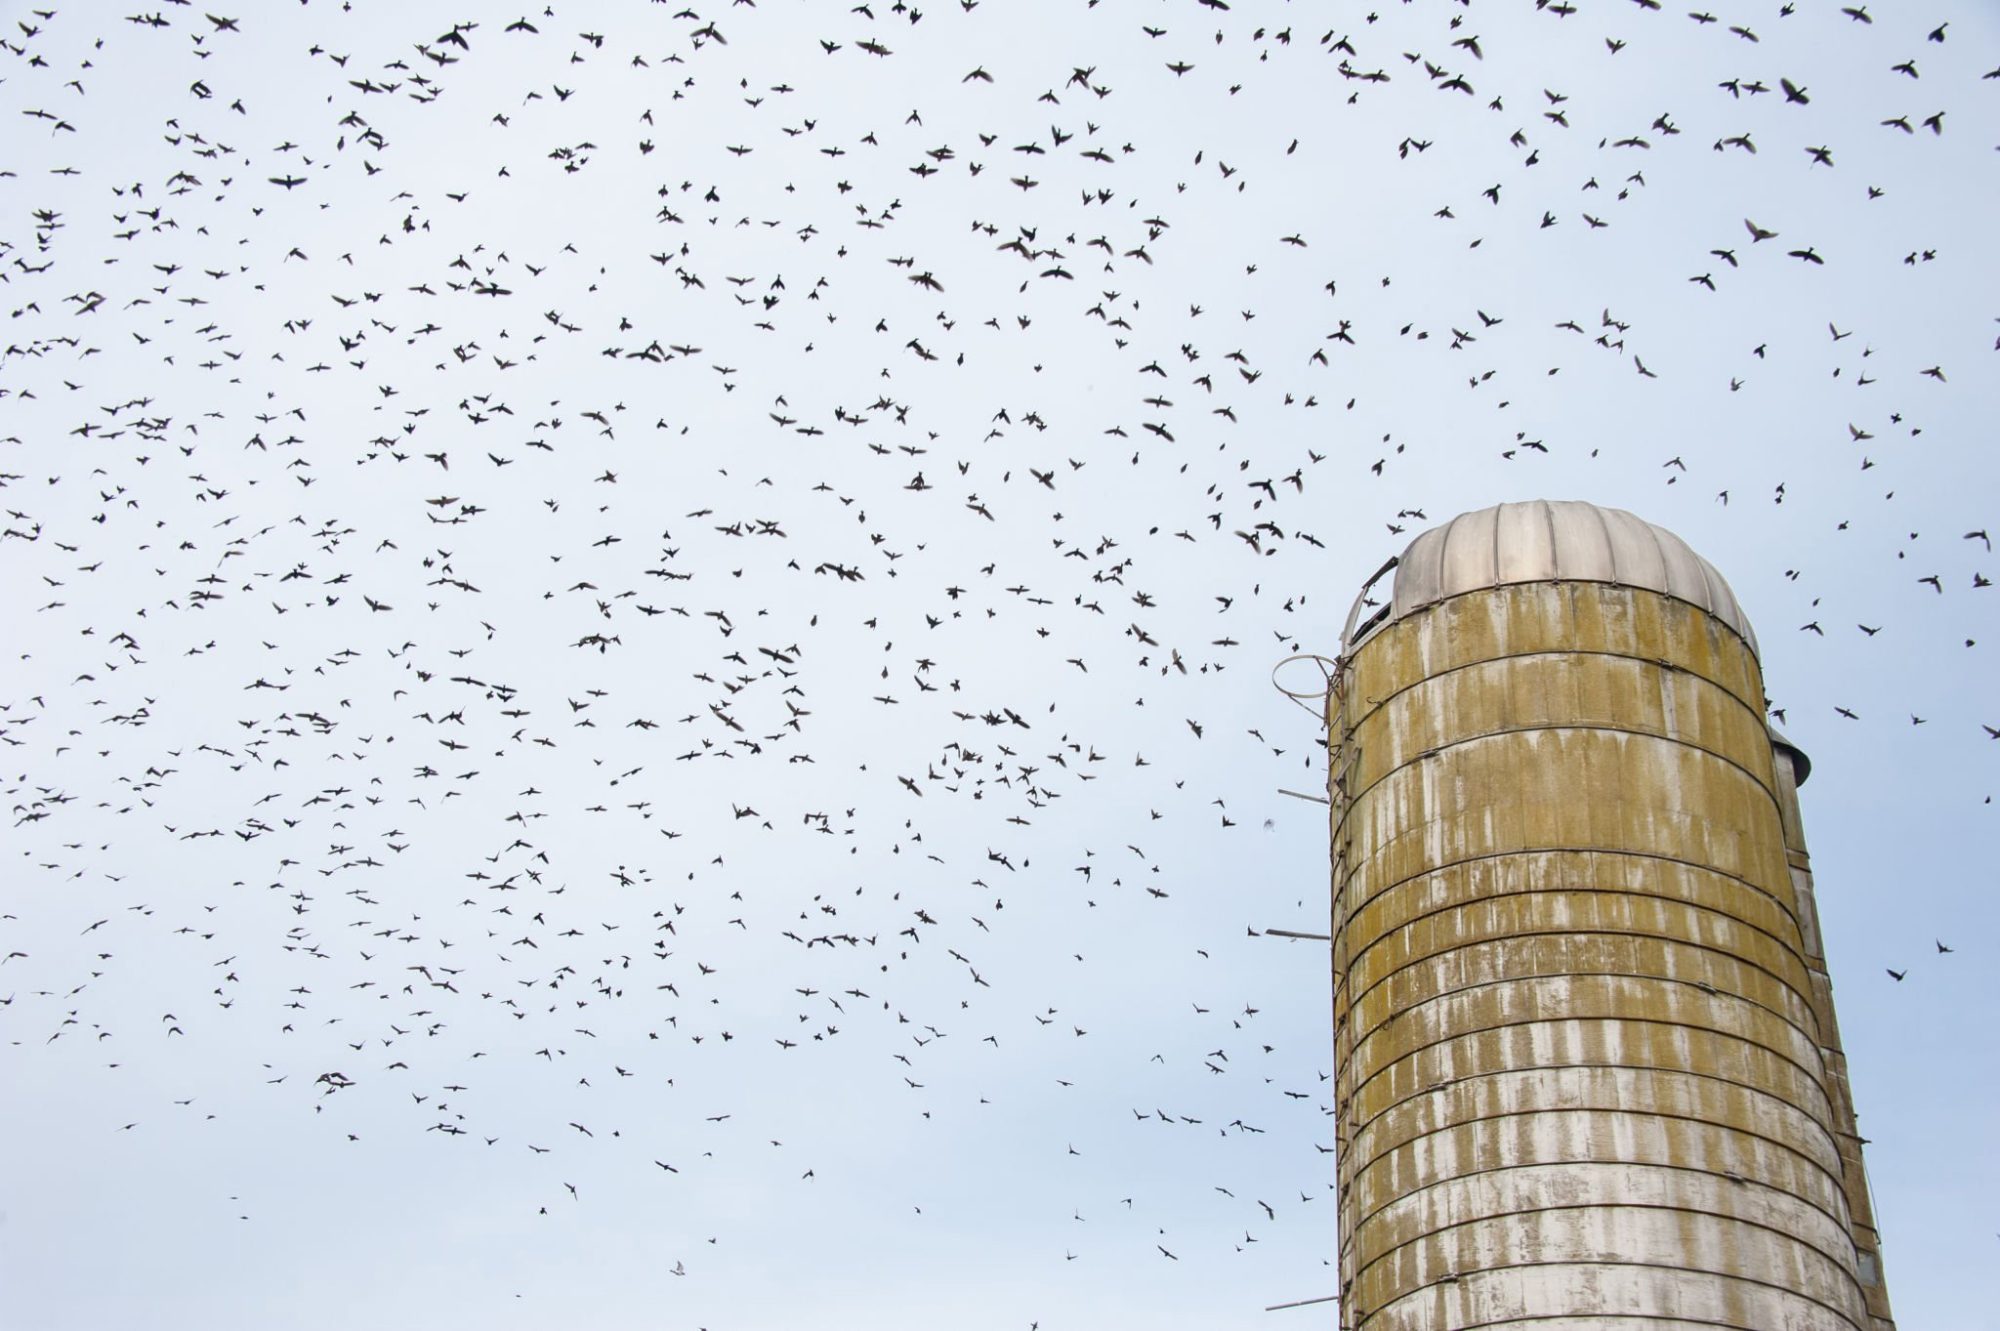
The same survey tied daily bird counts above 10,000 birds to higher self‑reported rates of Johne’s disease and Salmonella on those dairies. The researchers pointed directly to European starlings as vectors that move fecal material and pathogens among feed, water, and cattle. Starlings aren’t just stealing your TMR. They’re walking pathogens from bunks to troughs to parlor approaches — and through every pen in between.
That’s the background bleed. Then HPAI came along and changed the math entirely.
What an HPAI Outbreak Actually Costs a Herd
If lasers were just about feed loss, you could argue about payback and move on. H5N1 in dairy cows is a different conversation.
Armin Elbers and his team at Wageningen University & Research ran one of the strongest independent tests on automated laser bird deterrents. On a Dutch free‑range poultry farm in a high‑risk avian influenza zone, they ran a laser system for 28 days and saw 98.2% overall reduction in wild bird visits — 99.7% for waterfowl and 96.1% for passerines like starlings and sparrows, with no habituation in that window. For a poultry site, that’s a serious result — and a best‑case outcome in a very controlled, non‑dairy context.
But the HPAI math that matters to you lives in the dairy studies that followed.
A 2025 Journal of Dairy Science “growing risk” analysis estimated H5N1 losses at about 4 per clinically affected cow (90% credible interval: 2–7), including milk reduction, replacement, treatment, and reduced feed intake. For a modeled 500‑cow herd with about 32% of cows affected over a 45‑day outbreak, they estimated total losses around $79,145, or about $158 per cow averaged across the entire herd, with 92.3% of losses due to reduced milk yield.
A Nature Communications paper from Cornell’s College of Veterinary Medicine in July 2025 looked at a roughly 3,900‑cow Ohio herd that experienced a real H5N1 outbreak. Their economic model came back much uglier: about $950 per clinically affected cow, and about $737,500 in total outbreak costs for that one herd. On the milk side, clinically affected cows lost a cumulative 901.2 kg over the 60 days post‑diagnosis, compared with a typical loss of up to 18 kg from common bacterial mastitis — roughly 50 times as much.
Cornell’s team documented 777 clinically affected cows in that Ohio herd and found that “almost 40% (298) left the herd in the first two months following the outbreak, either through death or early removal.” CIDRAP’s summary of the same study notes that clinically affected cows dropped from roughly 77 lb/day to about 24 lb/day during the acute phase — a 69% decline — with lower production persisting over the full 60‑day analysis window.
In that Ohio case, about 20% of the herd’s cows were clinically affected. Early reports from Michigan outbreaks suggest cumulative clinical incidence may be higher in some herds, possibly around 30%, but peer‑reviewed data there are still thin, and herd responses vary.
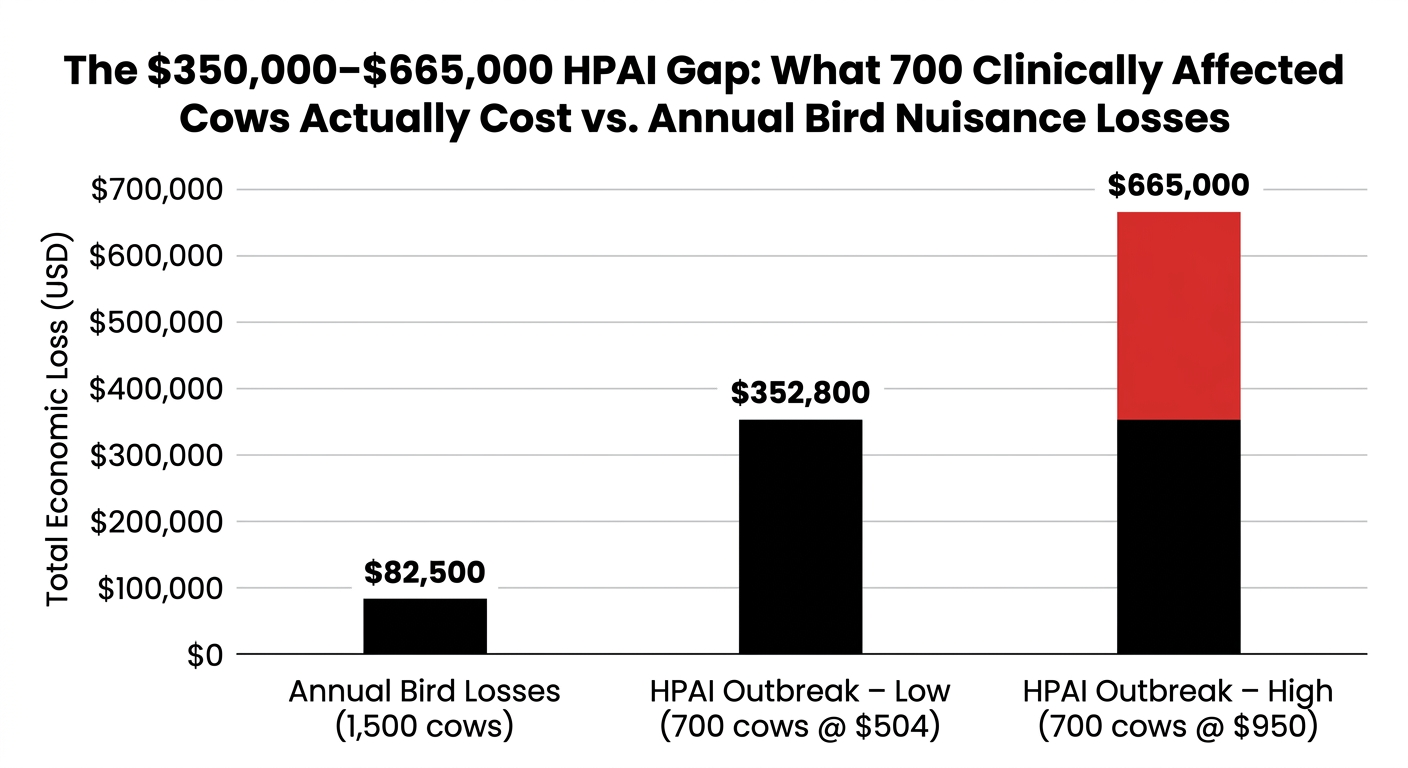
The gap between $504 and $950 per cow is real. It reflects different herds, methods, and severity. But even the low end is devastating. To show what this looks like in real dollars, take a hypothetical 700 clinically affected cows. Using the JDS figure, that’s 700 × $504 = $352,800. Use Cornell’s number, and you’re at 700 × $950 = $665,000.
That range — roughly $350,000 to $665,000 — is what should frame every bird‑control decision you make right now. Not “does the laser work?” but “what happens to my farm when the virus gets through anyway?
And that $665,000 ceiling? It’s actually a floor. Cornell’s $950 figure explicitly tracks direct losses — milk reduction, mortality, and early culling — over a 67‑day window. It doesn’t count breeding setbacks, lost quality premiums, or the genetic value of high‑genomic animals you’re forced to cull because a quarter dried off. When Cornell’s own researchers flag those exclusions, it’s reasonable to assume the true per‑cow cost in severe cases could approach $1,700 or more in total economic impact, which would push the tail risk on 700 clinically affected cows from $665,000 to well north of $1.2 million.
Who Actually Pays for Dairy HPAI Biosecurity?
A single AVIX Autonomic Mark II unit retails for $12,500-$13,104 from US distributors, based on 2024–2025 listings. Most dairies don’t have just one pressure point. Covering barns, feed alleys, commodity approaches, and lagoon edges usually means two to four units — roughly $25,000 to $52,000 in hardware, plus mounting, installation, wiring, and replacement bulbs over time.
iChase, whose AI‑driven system layers camera detection and automated targeting on top of a green laser, says typical dairy customers see $20,000–$35,000 in annual savings with a 7–12-month payback, based on its 2025 marketing ahead of IPPE 2026. That’s their claim, not a peer‑reviewed result, but it’s part of the sales pitch you’re hearing.
Here’s the part that doesn’t show up in the brochures.
Your processor doesn’t call to say “thanks for the laser.” They call to say they need HPAI test results before Tuesday — and their supplier manual reserves the right to suspend pickup if you don’t meet whatever standard they’ve set this month. Your lender prices disease risk into your interest rate and covenants, but isn’t offering to split the cost of netting or deterrents. Your insurer benefits from lower claim probability but keeps full discretion to deny or trim payouts if “recommended biosecurity measures” weren’t maintained — language APHIS and provincial frameworks keep expanding.
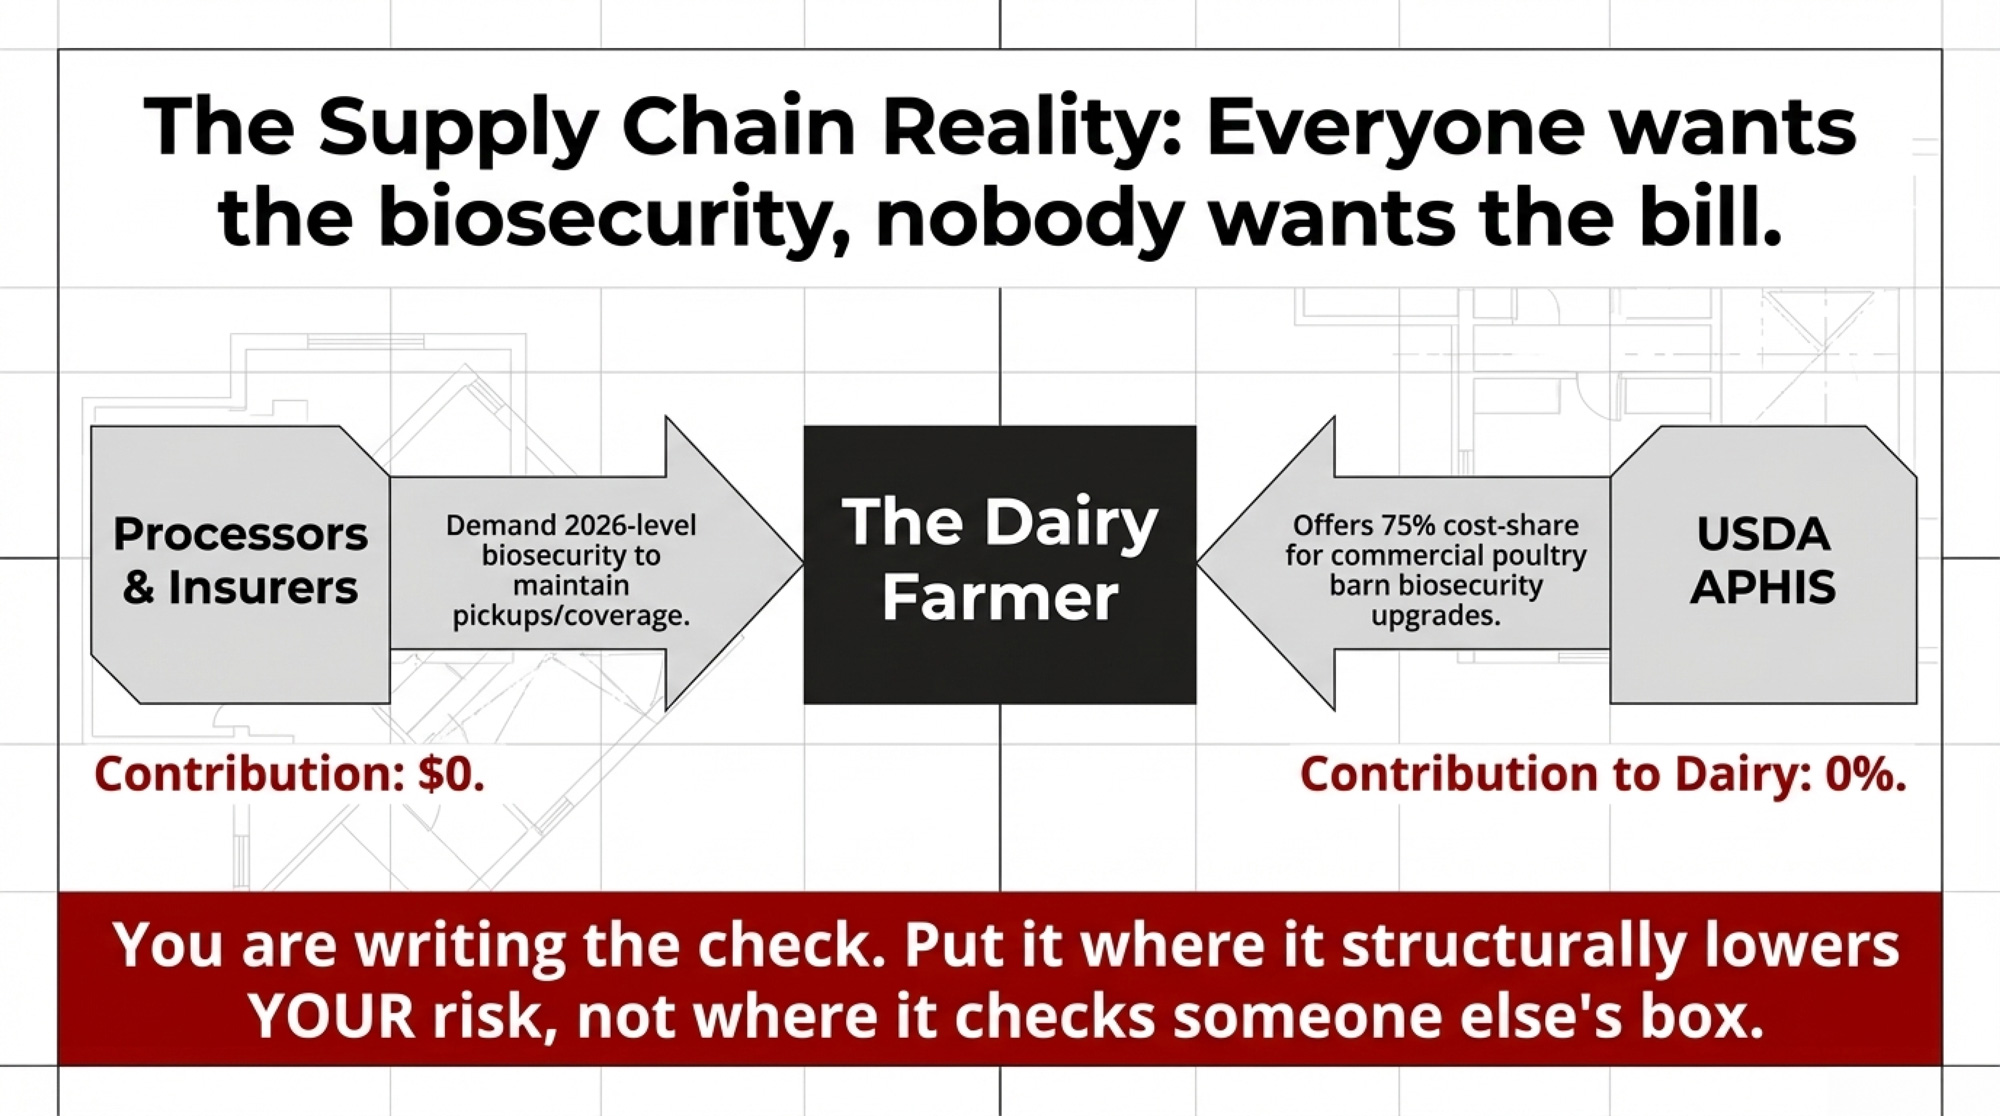
USDA APHIS offers free, voluntary biosecurity assessments for poultry operations and, in its current HPAI programs, will share up to 75% of the costs to fix the highest‑risk biosecurity concerns identified on those farms — including structural improvements. Those cost‑share dollars are aimed squarely at commercial poultry barns, not dairy; APHIS’ own FAQ on the program explicitly says dairies are not included in the 75% cost‑share.
You’re the one writing the check. Everyone else keeps the lever.
The Assumption the Laser Quote Needs You to Skip
Here’s the uncomfortable angle: birds are a structural problem first and a technology problem second. A lot of farms are being nudged to flip that order — often by marketing that starts with tech and works backwards.
Ryan Slaughter, a Research Assistant at Ohio State University South Centers, has tested laser bird deterrents across OSU research centers and commercial vineyards. His team’s summary of why lasers outperform static deterrents is blunt: the constantly moving beam matters. The “randomness of the oscillation means birds are unable to notice a pattern, which otherwise would render it useless.” That’s a real advantage over scarecrows, reflective tape, and noise cannons.
But their work also exposes something vendors tend to gloss over. The system only works where the beam actually hits — and their 2023 update noted that lower‑powered green lasers “may not be visible enough during the daytime,” which leads to uneven results when you need coverage in full sun.
Lasers don’t reach every rafter, every open door, every ledge above a commodity bay where birds roost between feedings. When a flock is spooked out of one illuminated zone, they don’t leave your property. They move to the part of your site where there’s still feed and no laser: commodity bays, silage faces, lagoon edges, and unsealed entries.
Go back to that Idaho dairy. The laser cleared the stables. Great. But those birds still needed somewhere to sit and something to eat. Was the commodity bay screened? Were rafters netted in other barns? Did the farm already have feed hygiene dialed in?
Those details are missing from the video. They’re not missing from your risk.
USDA APHIS dairy H5N1 guidance and CFIA’s National Standard both hammer the same basics: keep wild birds away from feed and water, close structural gaps, and tighten traffic and hygiene — with deterrent tech as a layer on top, not a substitute. Dairy Farmers of Canada built its mandatory proAction biosecurity module on that national standard in 2019. The alignment across both countries is consistent: reduce attractants, block access, then deter what’s left.
Laser marketing often flips that sequence — starting with gadgets and treating structure as an optional add‑on.
Netting, curtains, sealed storage, daily bunk cleanup — that’s the boring stuff everyone tries to skip. It also works at noon in July the same way it does at dusk in January. No habituation. No subscription. No beam path.
What a $50,000 Bird‑Control Budget Can (and Can’t) Do About HPAI
Here’s where the barn math separates the “laser‑first” story from a “structure‑first” strategy.
Start with the baseline feed and health bleed from birds, using the WSU average:
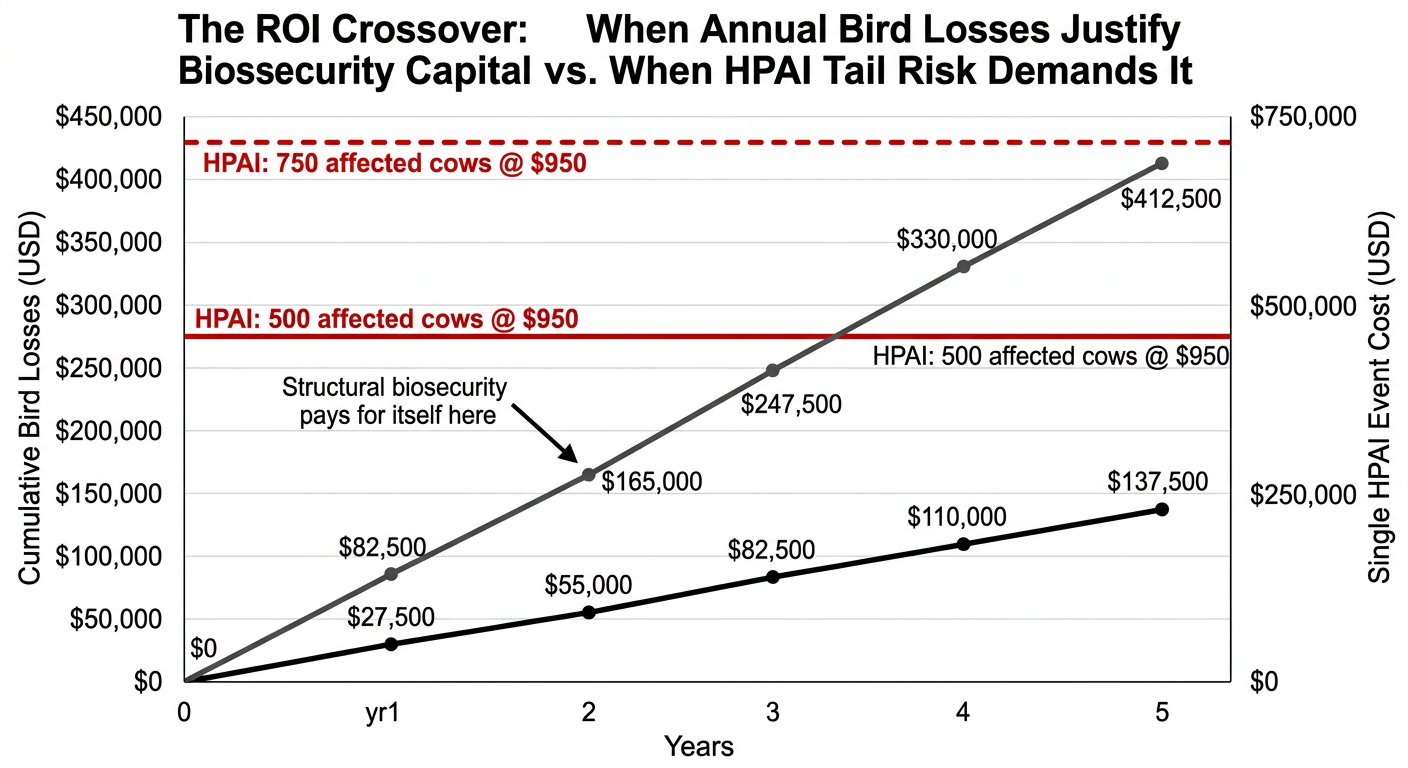
Annual bird‑loss baseline (herd size × $55/cow/year):
- 500 cows → $27,500/year
- 1,500 cows → $82,500/year
- 3,000 cows → $165,000/year
Now overlay the HPAI tail risk, using both the conservative JDS number and the higher Cornell number:
HPAI tail‑risk scenarios (affected cows × per‑cow loss estimate):
| Clinically affected cows | At $504/cow (JDS 2025) | At $950/cow (Cornell 2025) |
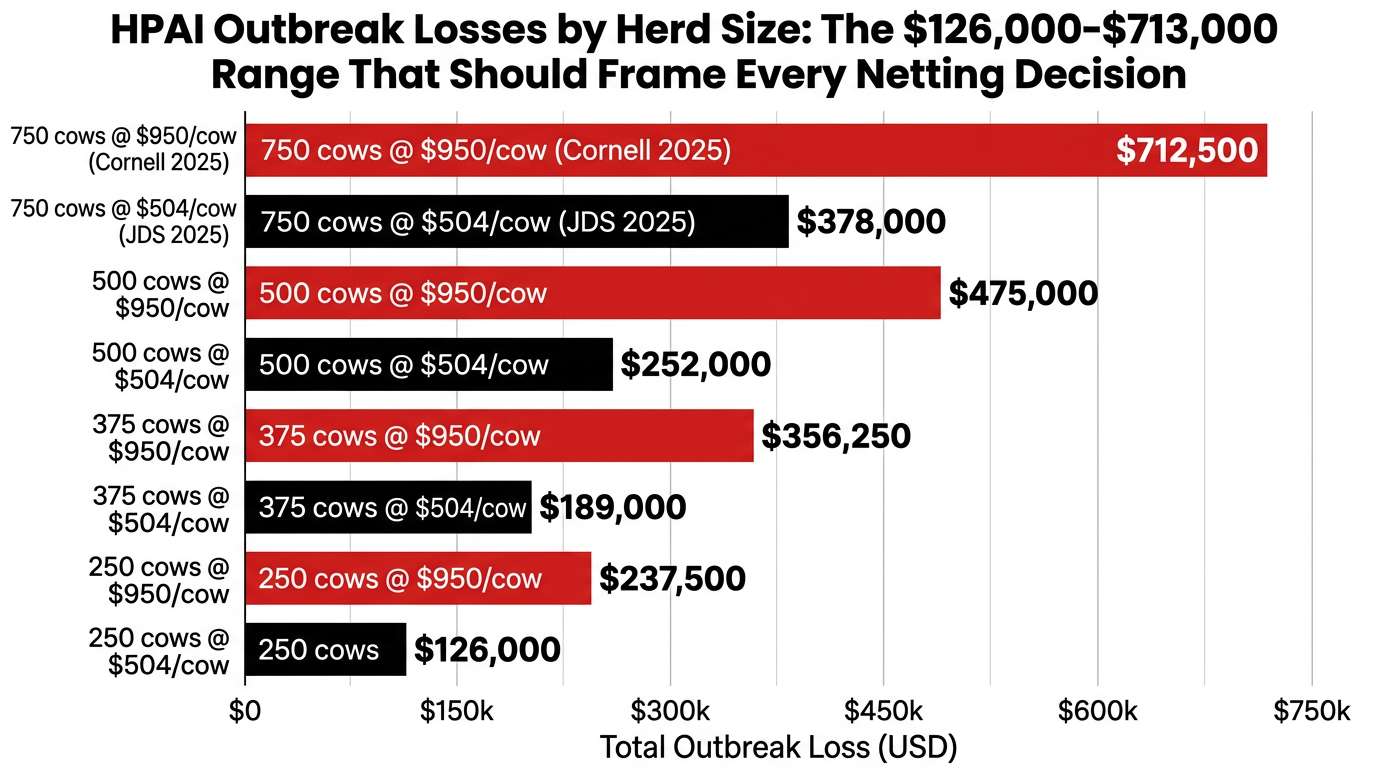
| 250 | $126,000 | $237,500 |
| 500 | $252,000 | $475,000 |
| 750 | $378,000 | $712,500 |
Even the conservative JDS number is several times larger than your likely bird‑control budget. To make it concrete, say you’re milking 1,500 cows and assume 25% might be clinically affected in a bad outbreak. That’s 375 cows.
- Low end (JDS): 375 × $504 = $189,000.
- High end (Cornell): 375 × $950 = $356,250.
That’s one event. One unlucky intersection between your herd and a migratory flock looking for feed or water.
Now put that against two ways to spend $50,000 on birds.
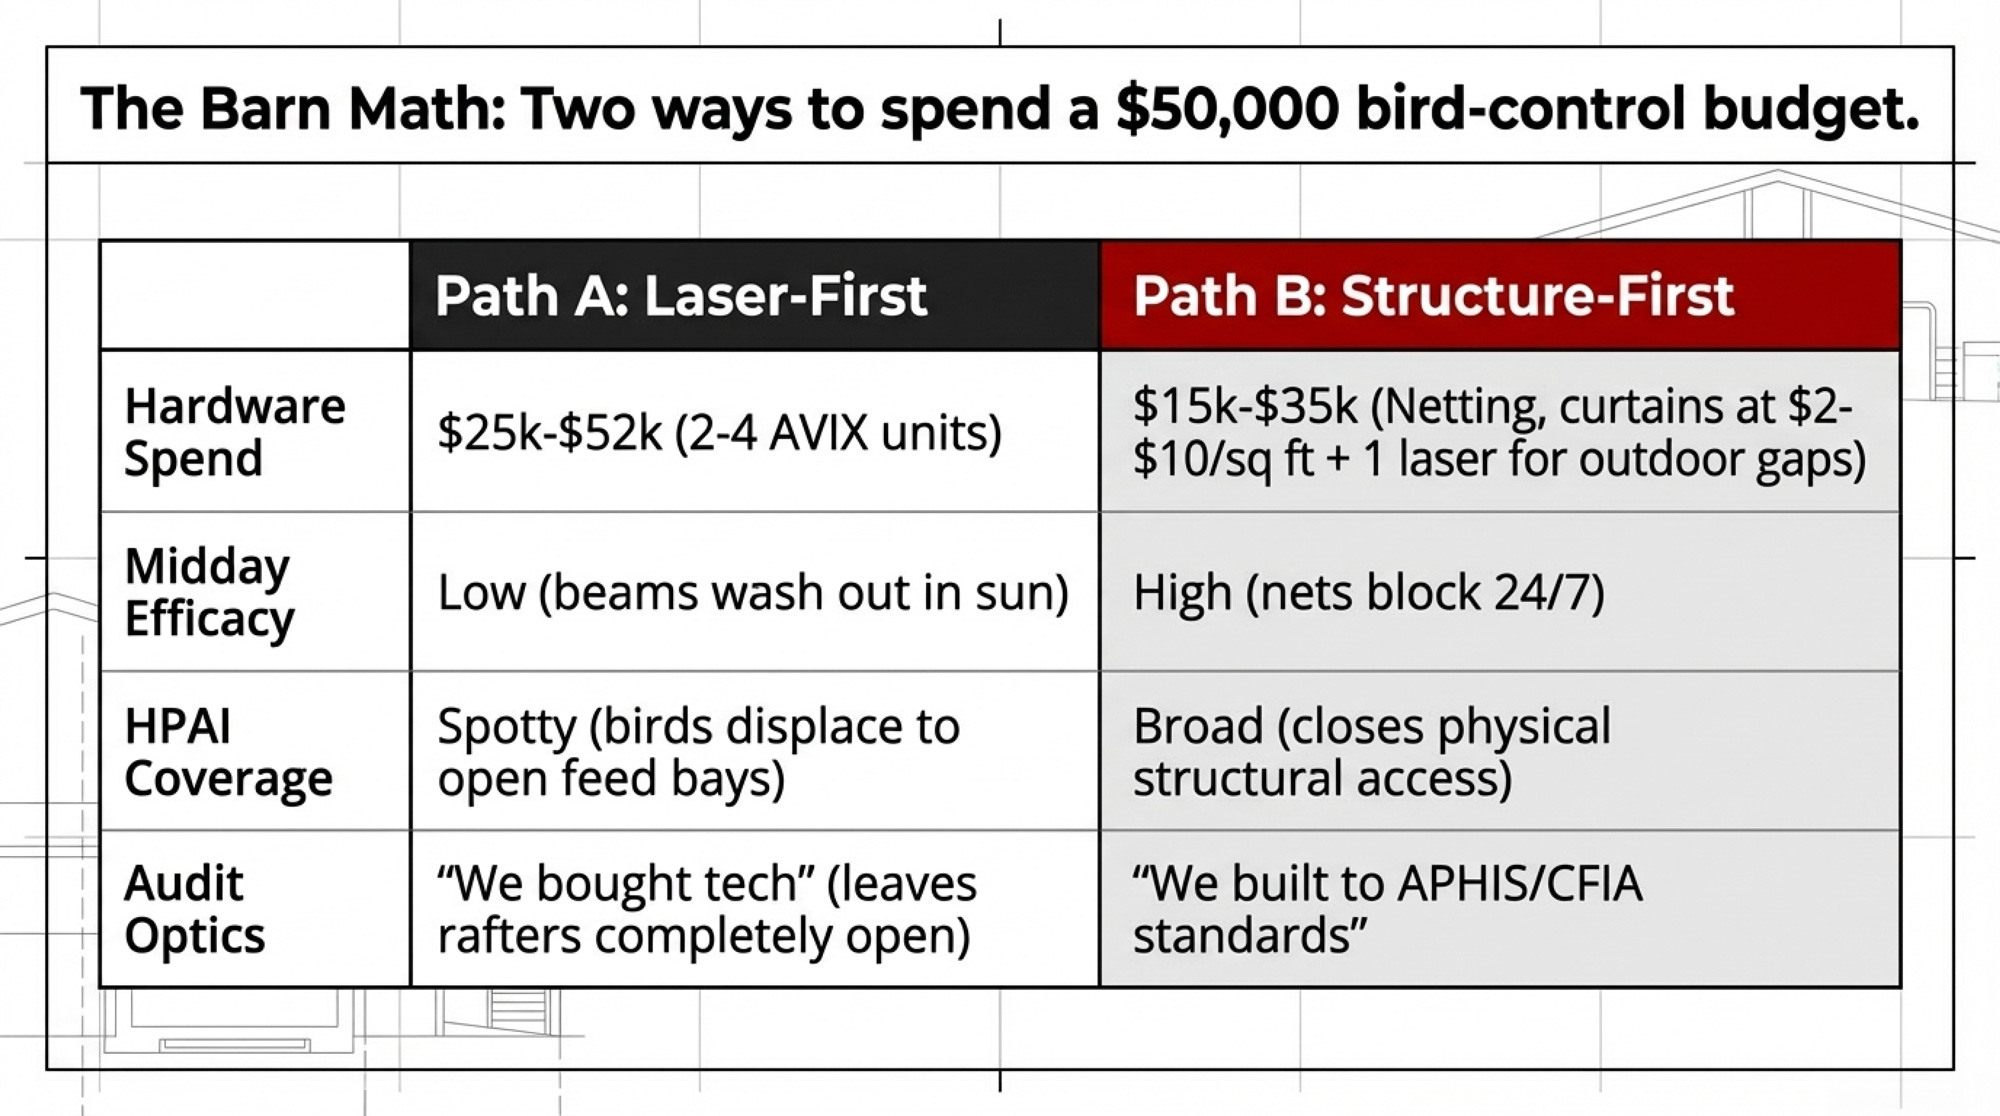
Path A: Laser‑First
- Hardware: 2–4 AVIX units at $12,500–$13,104 each → $25,000–$52,000 plus install.
- Coverage: Strong impact where the beam hits, but green light washes out in bright sun; OSU’s experience with lower‑powered units shows mixed midday results.
- Risk: Birds shift to non‑illuminated areas — commodity bays, open entries, lagoon edges — where they can still bring H5N1 in or foul feed.
- Optics: Visibly “high‑tech.” But open rafters with droppings behind a laser head are hard to explain to an investigator.
Path B: Structure‑First
- Hardware: Netting, curtains, and sealed storage on the highest‑risk zones — rafters over feed alleys, commodity bay faces, open parlor approaches. Real‑world installed costs typically range from $2 to $10 per square foot,depending on ceiling height and complexity.
- At that range, $15,000–$35,000 can meaningfully close big gaps in a typical freestall and commodity area.
- Coverage: Works 24/7 in any weather or light. No habituation. No blind spots where birds can sit directly over feed or cows.
- Layering: Use the remaining $15,000–$35,000 (if any) on one laser to cover outdoor zones such as lagoons or silage faces, where structure is more challenging.
- Optics: When APHIS or CFIA auditors walk in, you can point to standards and say, “We built to your book.”
Side by side, it looks like this:
| Factor | Path A: Laser‑First | Path B: Structure‑First |
| Initial hardware spend | $25,000–$52,000 (2–4 AVIX units + install) | $15,000–$35,000 (netting/curtains/SOPs) plus one laser with remaining budget |
| Midday efficacy | Lower — beam less visible in bright sun; birds can still work non‑illuminated feed | High — netting/curtains block birds 24/7 regardless of light |
| HPAI risk coverage | Spotty — depends on where beam reaches at dawn/dusk | Broad — closes structural access points across footprint |
| Bird displacement | Birds move to open areas: bays, lagoons, outside feed; feed loss and virus pathways persist there | Birds lose primary roost/feed spots; laser covers remaining outdoor pressure points |
| Audit / investigation optics | “We bought tech” but left rafters/bays open; easy for others to argue basics were skipped | “We followed APHIS/CFIA standards” and then added tech; much stronger story if HPAI hits |
On this math, structure first comes out ahead on every line that matters — total cost, feed recovery, HPAI exposure, and negotiating position if something goes wrong.
What Happens When HPAI Hits a Laser‑First vs. Structure‑First Farm
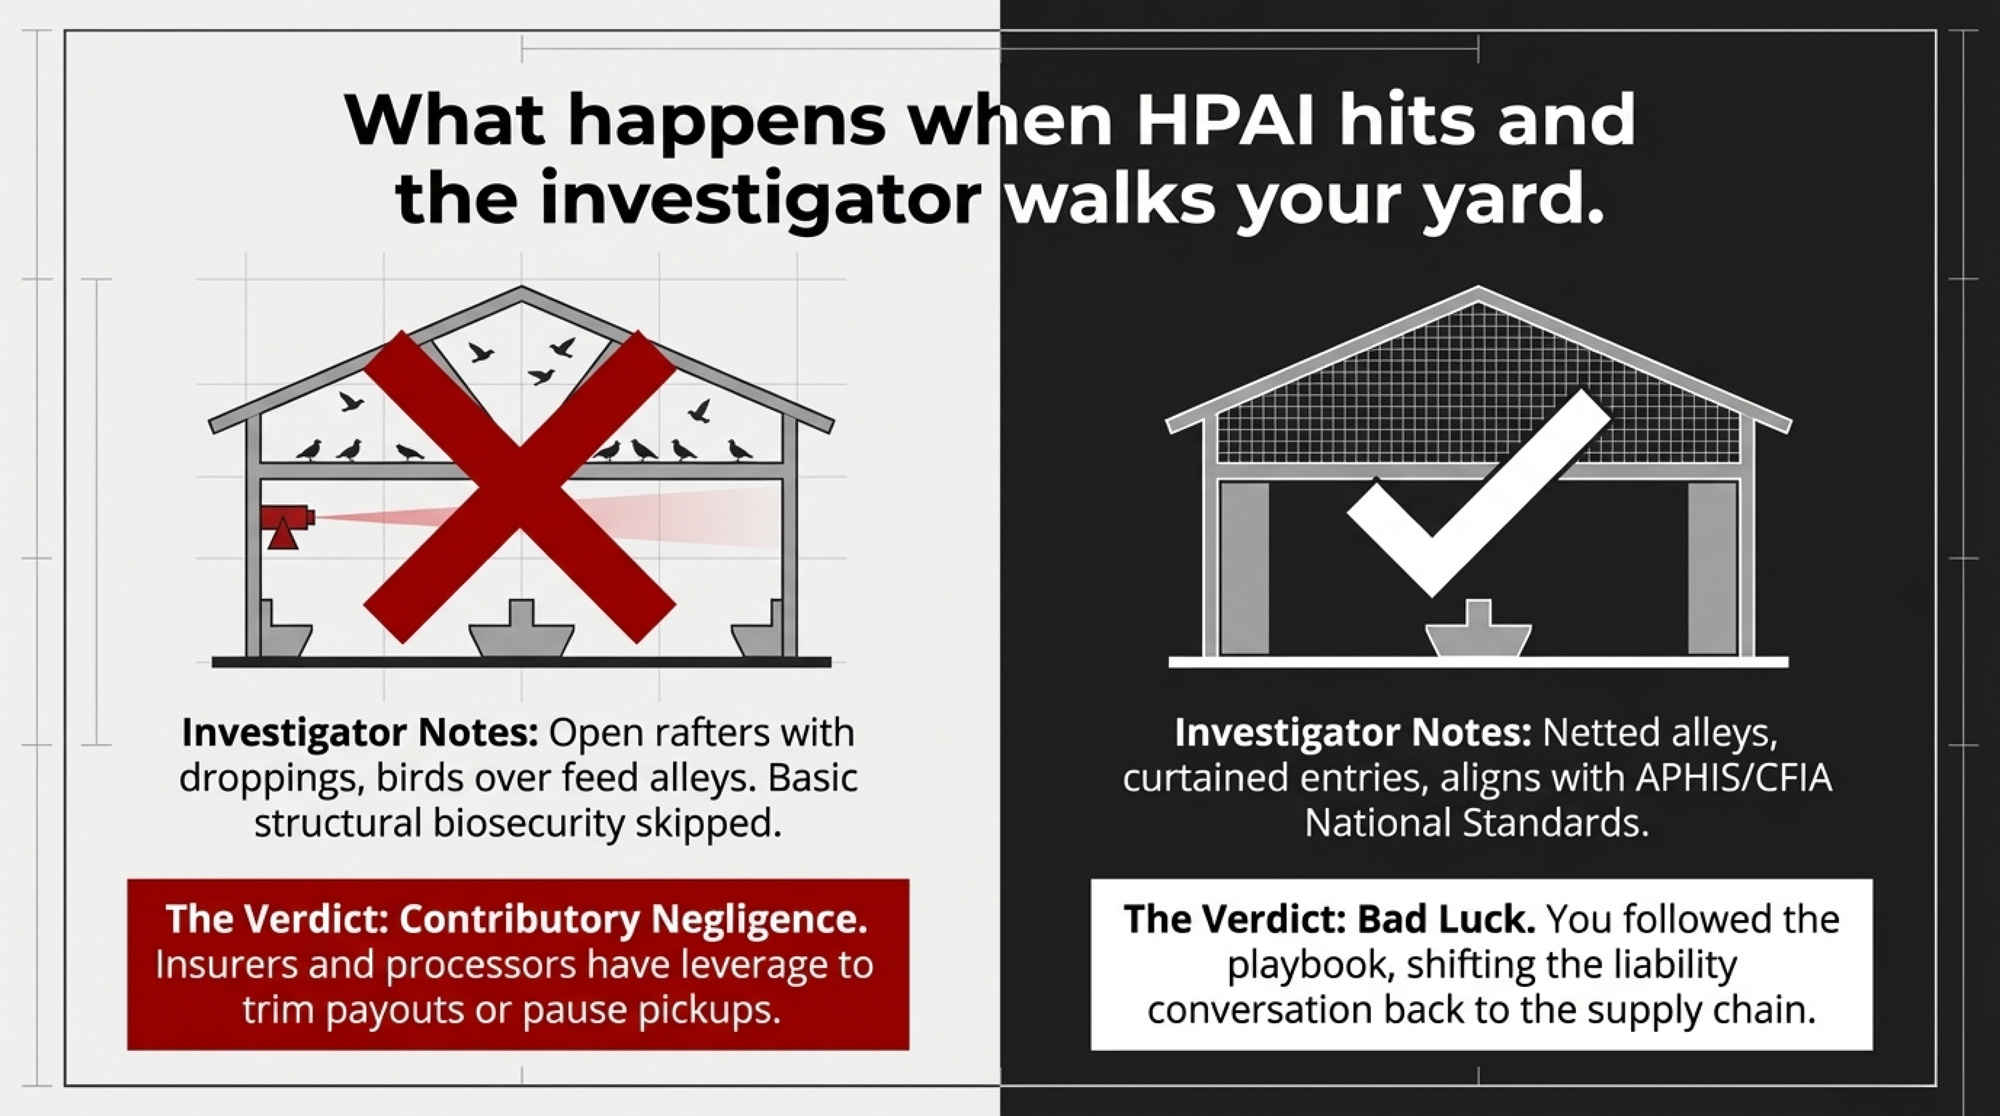
Both farms can still get hit. Wild birds don’t read SOP binders. But what investigators find when they walk your yard determines everything that happens next.
Structure‑first farm. Inspectors see netted rafters, curtained entries, clean bunks, covered ingredient storage, and controlled water sources. It aligns with the wildlife‑exclusion and feed‑hygiene measures emphasized in USDA APHIS dairy H5N1 guidance and the CFIA National Standard. The storyline is, “you were unlucky, despite doing the right things.” That farm can sit across from its processor and insurer and say, “We followed your playbook. If you want more technology layered on top, that’s a shared‑investment conversation.”
Laser‑first farm. Inspectors see open rafters with droppings, birds roosting over feed alleys, exposed commodity faces, and one or two laser heads sweeping obvious paths. The conclusion writes itself: basic structural biosecurity wasn’t prioritized. That perception makes it easier for insurers to argue contributory negligence, for processors to tighten terms or pause pickups, and for lenders to question management judgment.
Same virus. Same type of herd. Similar per‑cow milk losses. The difference is whether your capital choices make HPAI look like bad luck — or like an avoidable management gap.
| Stakeholder | Who Pays for Upgrades? | Who Benefits if Risk Drops? | What Leverage Do You Have? |
| Dairy Producer (You) | 100% of capital cost — netting, curtains, lasers, labor, feed SOPs | Lower outbreak risk; reduced insurance claims; continued processor contracts | Demand cost-sharing — if processor/insurer wants higher biosecurity, show them Path B math and ask how it shows up in premiums/contracts/rates |
| Processor / Co-op | $0 — but reserves right to suspend pickups or tighten terms if HPAI hits your county | Uninterrupted supply; avoid PR crisis; lower testing/audit costs; maintain export access | Zero contractual obligation — can mandate biosecurity standards without contributing capital |
| Insurer | $0 — premiums price in disease risk, but no cost-share for mitigation | Lower claim probability; stronger defense against “contributory negligence” arguments if outbreak occurs | Discretion to deny claims if “recommended biosecurity measures” (APHIS/CFIA guidance) weren’t followed |
| Lender / Ag Bank | $0 — biosecurity capex may affect your loan covenants and cash-flow projections | Lower default risk; stronger collateral value; easier to defend loan portfolio to regulators | Can price risk into interest rates without sharing mitigation costs |
| USDA (Poultry Ops) | Poultry gets 75% federal cost-share for structural biosecurity fixes identified in APHIS assessments | Lower national HPAI prevalence; reduced indemnity payouts; trade-partner confidence | Dairy excluded from cost-share — APHIS FAQ explicitly says dairy not eligible for 75% program |
How to Talk to Your Processor, Insurer, and Lender About Bird Control
When your processor’s field rep or your lender’s ag banker brings up bird control — and more of them are — the conversation usually goes one way: “Have you looked into lasers?” Sometimes that’s honest advice. Often, it’s someone else’s risk department checking a box with your money.
Here’s how you flip that conversation without sounding defensive.
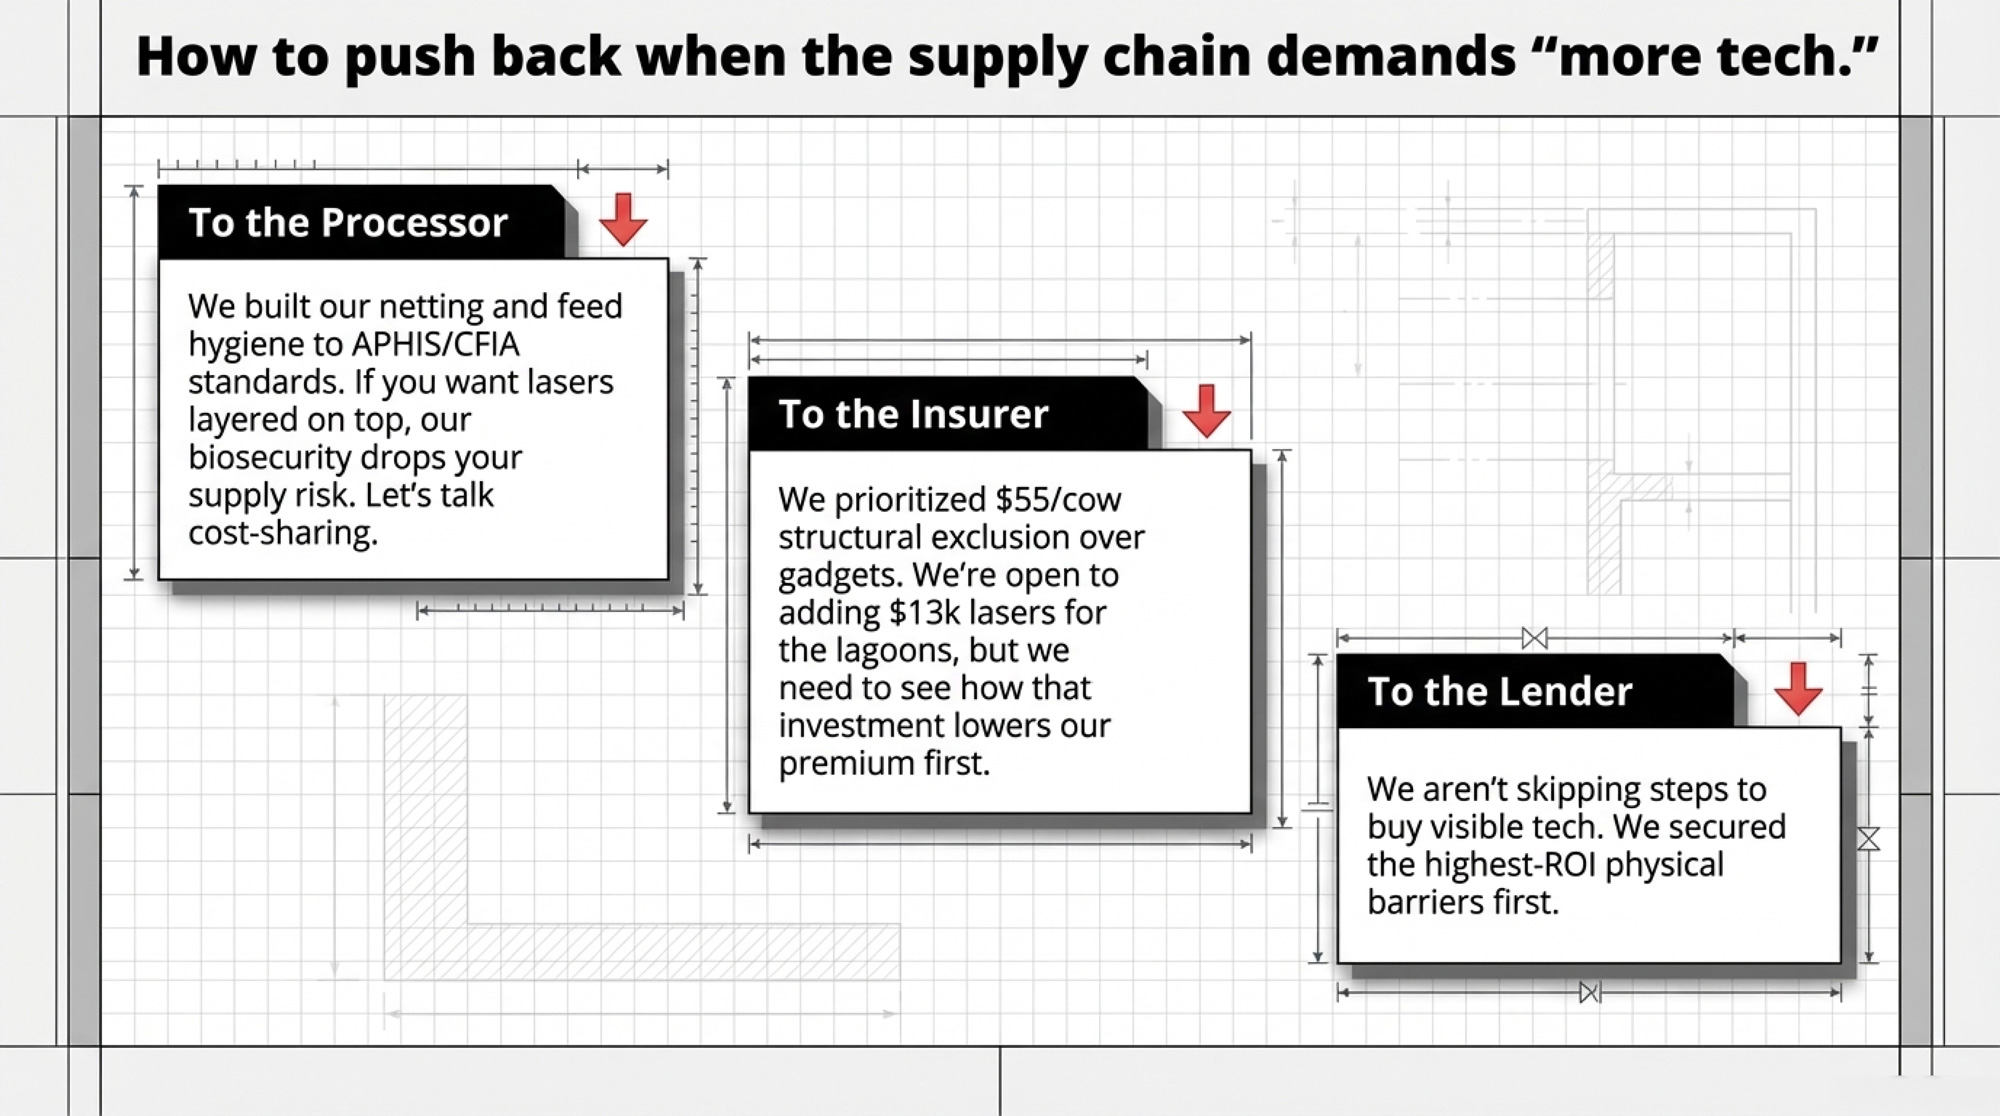
If the processor raises biosecurity expectations:
We’ve invested in structural exclusion and feed hygiene aligned with USDA APHIS dairy H5N1 guidance and the Canadian National Biosecurity Standard: netting over feed alleys, curtained entries, daily bunk cleanup, covered ingredient storage. We’re documenting with photos and bird counts. If you’d like us to add laser technology on top of that, we see that as a shared investment — your supply risk drops when our biosecurity improves, and we think the capital should reflect that.”
If the insurer asks about bird‑control measures:
“We can show you a written biosecurity plan built around structural exclusion — netting, sealed entries, feed hygiene SOPs, and regular bird counts — aligned with the wildlife‑exclusion measures in APHIS dairy H5N1 guidance.” We’re open to adding automated deterrents for outdoor zones, but those units are a $12,500–$13,104 per‑head investment that reduces your claims risk as much as it protects our herd. We want to talk about how that gets shared or shows up in our premium.”
If the lender questions biosecurity capex:
“We started bird‑control spending with the highest‑ROI items — netting and tighter feed management — that directly reduce our $55/cow annual bird‑loss exposure and line up with national standards. Laser units are on the roadmap for outdoor zones once that foundation is in place. We’re not skipping steps to buy the most visible technology first.”
You’re not refusing tech. You’re putting it in the right order and asking others who benefit from lower risk to participate in the cost.
What Dairies Should Do Before Fall Migration
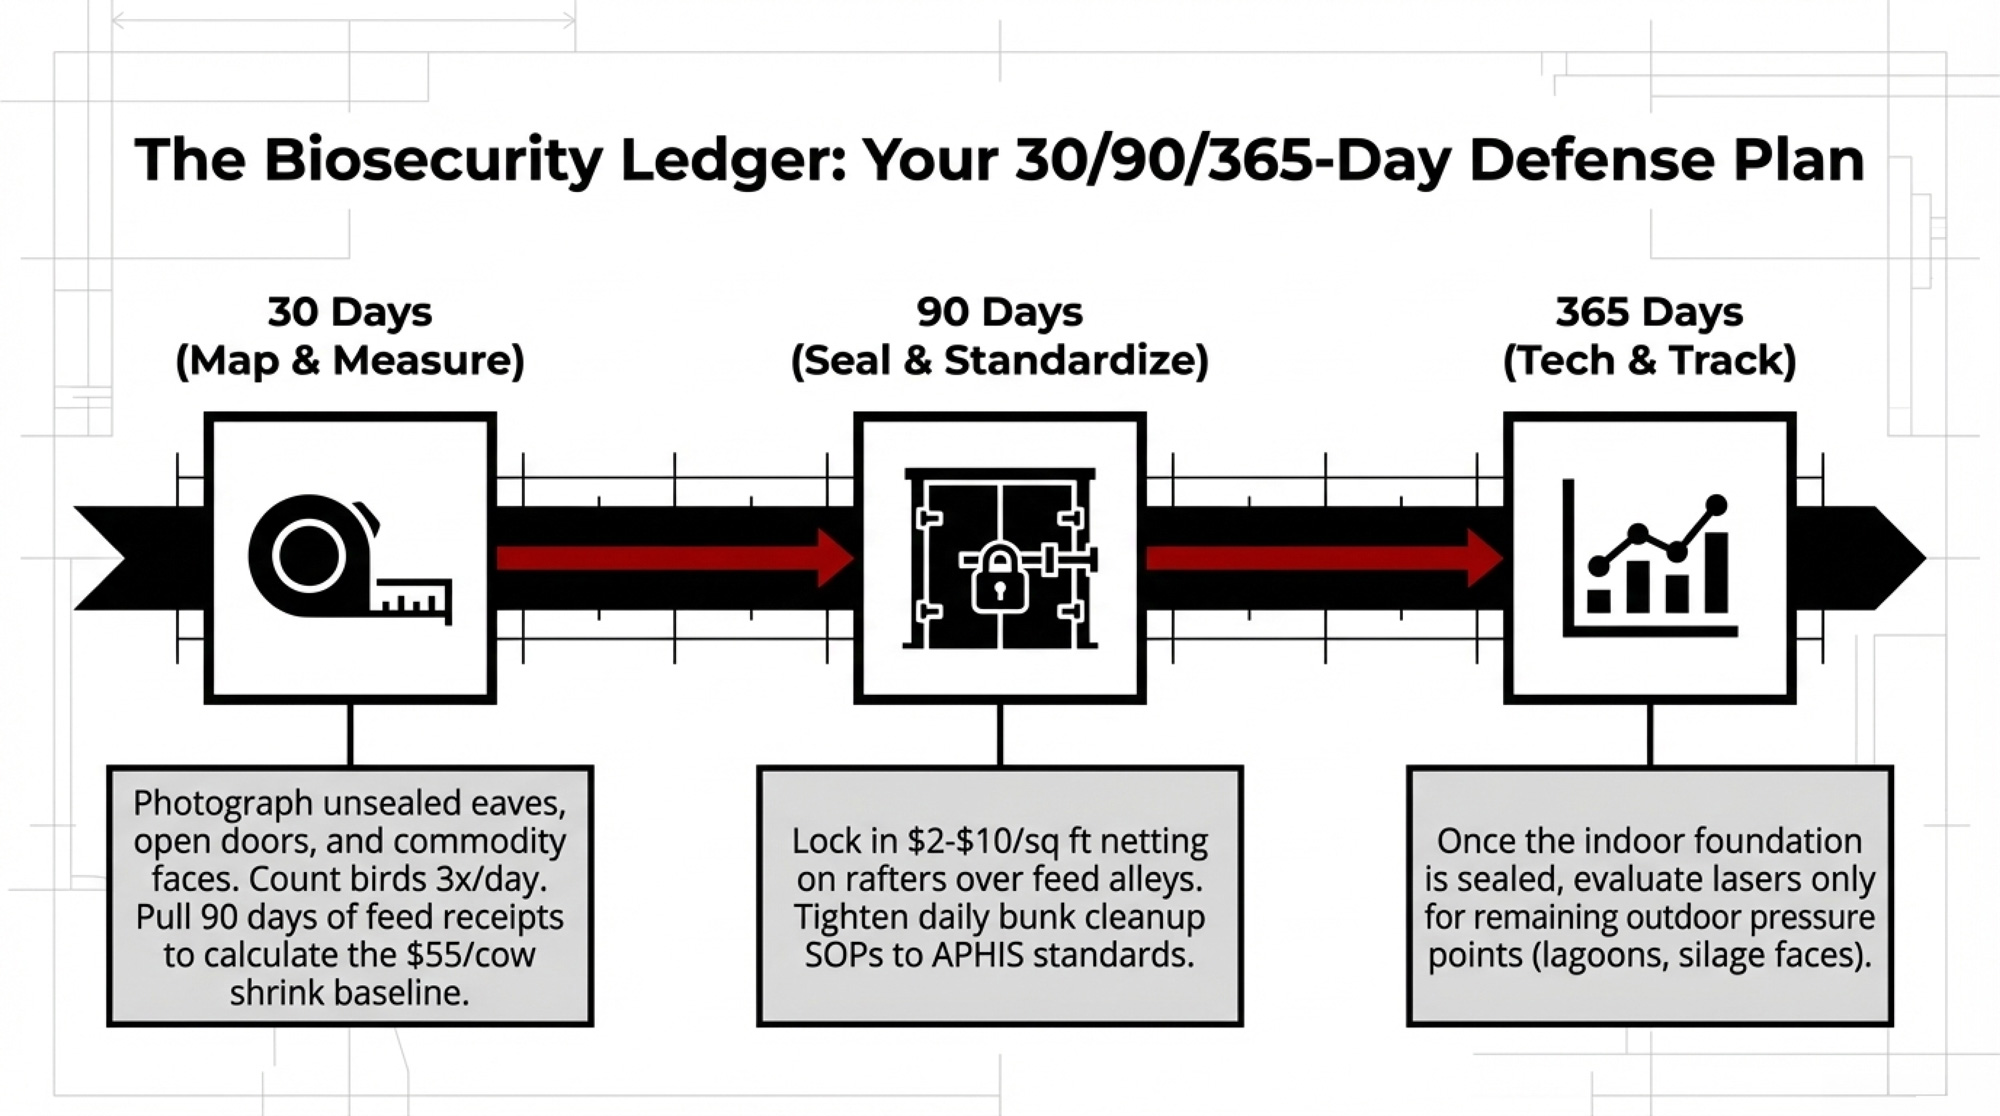
In the next 30 days
- Map every structural entry point. Walk your barns and bays. Doors that stay open, unsealed eaves, rafter cavities, exposed commodity faces — photograph each one. That’s your real bird‑control problem, not the number on a laser quote.
- Count your birds three times a day. Dawn, midday, and dusk for five straight days. Note species, rough counts, and exactly where they land and feed. If you can’t describe your worst day in numbers, you don’t have a purchasing decision. You have a guess.
- Pull 90 days of feed receipts and do the shrink math. Compare delivered vs. what actually went in front of cows. If your gap sits much above 3–5% and you’re watching flocks on the bunk, you’ve just put a dollar tag on your baseline bird cost.
🚩 Red flag: If your processor or lender is pushing you to “do something about birds” and you can’t answer those three questions, that conversation is being driven more by their risk checklists than by your numbers.
In the next 90 days
- Lock in netting and curtains on the worst zones. Start with rafters over feed alleys, commodity bay faces, and open parlor approaches. Installed bird‑exclusion netting typically runs $2–$10 per square foot, depending on height, structure, and region — use that range to sanity‑check quotes, but prioritize coverage and durability over the very lowest bid.
- Tighten feed hygiene SOPs. End‑of‑day bunk cleanup, refusal removal, covered ingredient storage, and a simple photo log of problem spots. APHIS guidance and national standards both highlight this as core, not optional — and this is exactly what insurers and regulators will look at if H5N1 is in your county.
- Align your written plan with published standards. Use USDA APHIS dairy H5N1 biosecurity checklists and CFIA’s National Standard (or ProAction in Canada) as your templates. Being able to put those documents on the table and say “we built to this” changes the tone of every tough conversation.
✅ Opportunity: Once you can show your processor and insurer that you’ve aligned with published dairy biosecurity guidance on structure and management, it’s a lot easier to say, “We’ve done the foundational work. If you want lasers added, let’s talk about cost‑sharing.”
Over the next 12 months
- Evaluate lasers after you’ve closed the obvious gaps. Once you’ve netted the rafters, sealed entries, and tightened feed hygiene, look at where birds still congregate — lagoons, open lots, silage faces. That’s where an AVIX head or an AI‑aimed system like iChase actually adds incremental coverage instead of replacing common sense.
- Benchmark and document your progress. Re‑count birds at 6 and 12 months. Re‑run your shrink. Keep before/after photos. That record becomes your leverage in every future premium discussion, renewal, and claim.
What This Means for Your Operation
- Don’t start with the gadget. Your first decision isn’t “Which laser?” It’s “Where are birds actually roosting and feeding, and which of those spots can I close with netting, curtains, or steel?”
- Use $55/cow as your baseline loss check. Multiply your herd size by $55. If the capex you’re considering is bigger than two years of that baseline and you still have open rafters and bays, you’re out over your skis.
- Run the HPAI worst‑case using your own herd size. Take a realistic clinically affected‑cow count — 20–30% of your herd, based on the Ohio and early Michigan experience — and multiply by both $504 and $950. If the low end doesn’t get your attention, check your math.
- Separate the foundation from the extras. Netting, curtains, sealed feed, and hygiene are the foundations. Lasers are extra coverage. If anyone tries to reverse that, slow the decision down until your structural list is done.
- If you already bought lasers, backfill the basics. A laser in your yard isn’t wasted. But if you skipped structural work to get it, your next dollar belongs in netting, sealing, and feed hygiene so the virus doesn’t just land where the beam doesn’t reach.
- In the next 30 days, make one phone call. Ask your processor, insurer, or lender one specific question: “If we invest in structural biosecurity upgrades tied to APHIS/CFIA guidance, how does that show up in our premiums, contracts, or rates?” Their answer tells you how much of this risk they’re willing to share.
Key Takeaways
- If you’re about to spend $25,000–$52,000 on bird control, the first two‑thirds of that budget should be in nets, curtains, doors, and feed hygiene. Lasers belong on top of that, not instead of it.
- HPAI losses modeled between $504 and $950 per clinically affected cow dwarf the annual $55/cow bird‑loss bleed — which is exactly why you need your bird‑control spend anchored in structural biosecurity, not just tech that looks impressive.
- Poultry barns can tap 75% federal cost‑share on some biosecurity upgrades; dairy barns cannot. That’s all the signal you need on who the supply chain expects to pay for your risk mitigation.
The Bottom Line
Your best leverage after an HPAI event is a paper trail showing you followed APHIS/CFIA structural and management guidance — not a single video of a green beam clearing a feed alley.
If processors want to mandate 2026-level biosecurity, they need to stop offering 1990-level contracts. It’s time to move bird control from the ‘producer expense’ column to the ‘supply chain security’ column.
Processors, lenders, and insurers all benefit when your bird load drops and your HPAI risk goes down. But until someone else starts writing a cheque, you need to put every dollar where it actually lowers your tail risk, not just where it checks a box.
The next time you look at a laser quote, the real question isn’t “Can I afford this?” It’s “What am I not fixing if I buy this first?”
Complete references and supporting documentation are available upon request by contacting the editorial team at editor@thebullvine.com.
Methodology Note HPAI loss estimates come from a 2025 Journal of Dairy Science modeling paper on H5N1 in US dairy herds and a 2025 Nature Communications case study of a 3,900-cow Ohio herd, using their reported per-cow and total economic impact ranges. Bird-loss estimates use a 2019 PLOS One survey of Washington State dairy producers on starling damage. Laser performance and pricing references draw on Wageningen UR laser trials in poultry, Ohio State University laser field work and extension summaries, and 2024–2025 AVIX and iChase distributor pricing/marketing materials, which are treated as vendor claims, not independent evidence. USDA APHIS dairy H5N1 guidance, CFIA’s National Standard, and Dairy Farmers of Canada’s proAction biosecurity module provide the structural-biosecurity standards cited here. All per-cow and herd-level math is illustrative and based on the ranges in those sources; your numbers will vary with herd size, management, region, and severity.
Learn More
- H5N1’s Second Bill: The 90-Day, 0.5-SPC Fertility Hit Most Herds Miss – This guide reveals the hidden $10,000/quarter reproductive drain that follows the initial milk crash, arming you with tactical breeding management shifts to protect your conception rates when subclinical infections linger in your herd.
- Beyond Efficiency: Three Dairy Models Built to Survive $14 Milk in 2026 – This strategic analysis exposes why volume-only growth is a dead end in the current market, delivering three proven operating models that prioritize liquidity and risk-diversification to keep your equity safe through the next price cycle.
- The Biosecurity Myth: Journal of Dairy Science Reveals Why Enhanced Protocols Failed Against H5N1 – This deep dive breaks down innovative research on how H5N1 actually moves through a parlor, challenging conventional wisdom and providing a 240% ROI roadmap for modernizing your facility’s environmental controls and worker protocols.
 The Sunday Read Dairy Professionals Don’t Skip.
 The Sunday Read Dairy Professionals Don’t Skip.
Every week, thousands of producers, breeders, and industry insiders open Bullvine Weekly for genetics insights, market shifts, and profit strategies they won’t find anywhere else. One email. Five minutes. Smarter decisions all week.