Archive for mastitis control

The $152,820 “BLV Tax” Hiding in a 1,200‑Cow Herd

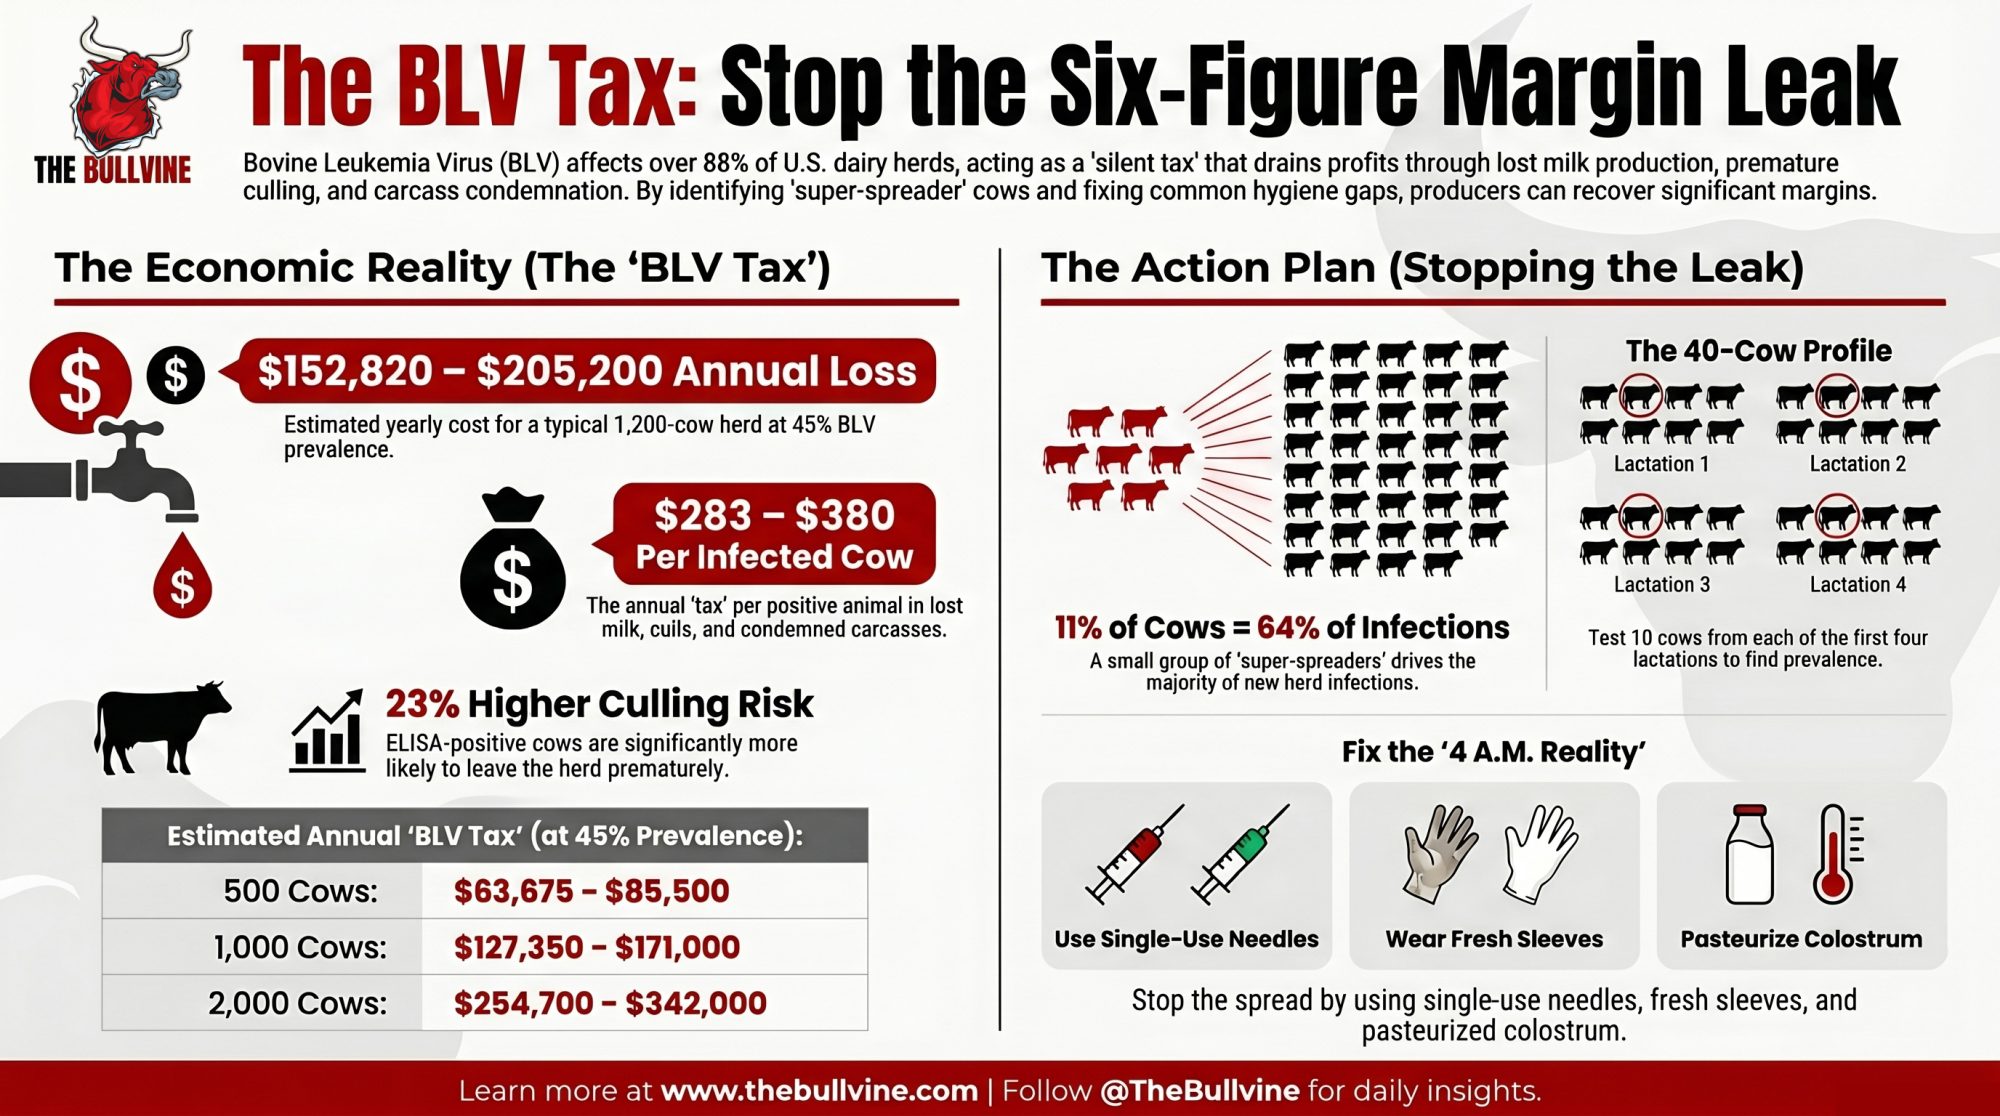
Run Michigan State’s 40‑cow BLV test on a 1,200‑cow herd at 45% prevalence and the math lands on $152,820–$205,200 a year — quietly, in milk, early culls, and condemned carcasses.

Executive Summary: Run Michigan State’s 40‑cow BLV profile on a 1,200‑cow herd at 45% prevalence and the annual loss lands at $152,820–$205,200 — roughly $283–$380 per infected cow in lost milk, early culls, and condemned carcasses. BLV now sits in 88.6–94.2% of U.S. dairy herds, and MSU’s 2015–2016 study of 103 herds across 11 states pegs animal‑level prevalence at 46.5%, up from 40.8% in 1996. Bartlett et al. (J. Dairy Sci. 96:1591–1597, 2013) found ELISA‑positive cows are about 23% more likely to leave the herd, and every 10‑point jump in prevalence costs roughly 209 lb of milk per cow per year. The real leverage isn’t blanket culling — in one herd, 11% of positives drove 64% of new infections, and in another, two cows carried 26% of the total proviral load. Fix the usual leaks (single‑use needles and sleeves, pasteurized or frozen colostrum, qPCR on older positives to tag the top 10–15% super‑spreaders) and a realistic 25–30% recovery is worth about $38,000–$62,000 a year on that same 1,200‑cow herd. If your 40‑cow profile comes back at or above 30–40%, BLV belongs on your P&L as a structural cost, not a footnote. The full piece walks through the Tax Table, the 30/90/365‑day playbook, and where this lands in The Silent Tax series.
BLV tax

Most of the data here comes from Michigan State University’s BLV research program (Bartlett, Erskine, Norby, Coussens, Kendrick, Durst and colleagues) and Dr. Tasia Kendrick’s March 2026 interview on The Dairy Health Blackbelt Podcast (Episode 38). No individual dairies are profiled by name; the “typical 1,200‑cow herd” example is a representative case built from published BLV research and MSU field descriptions. Cross‑reference any numbers here with your own herd’s test results and your vet’s recommendation before acting.

Picture the kind of 1,200‑cow Southeast freestall the Michigan State University BLV team has worked with repeatedly: solid rolling herd average, decent components, nothing on the monthly reports that screams crisis. According to MSU’s BLV research program, many of these herds don’t engage on BLV until their vet pushes for a baseline test, usually because the same older cows keep showing up on hospital lists.
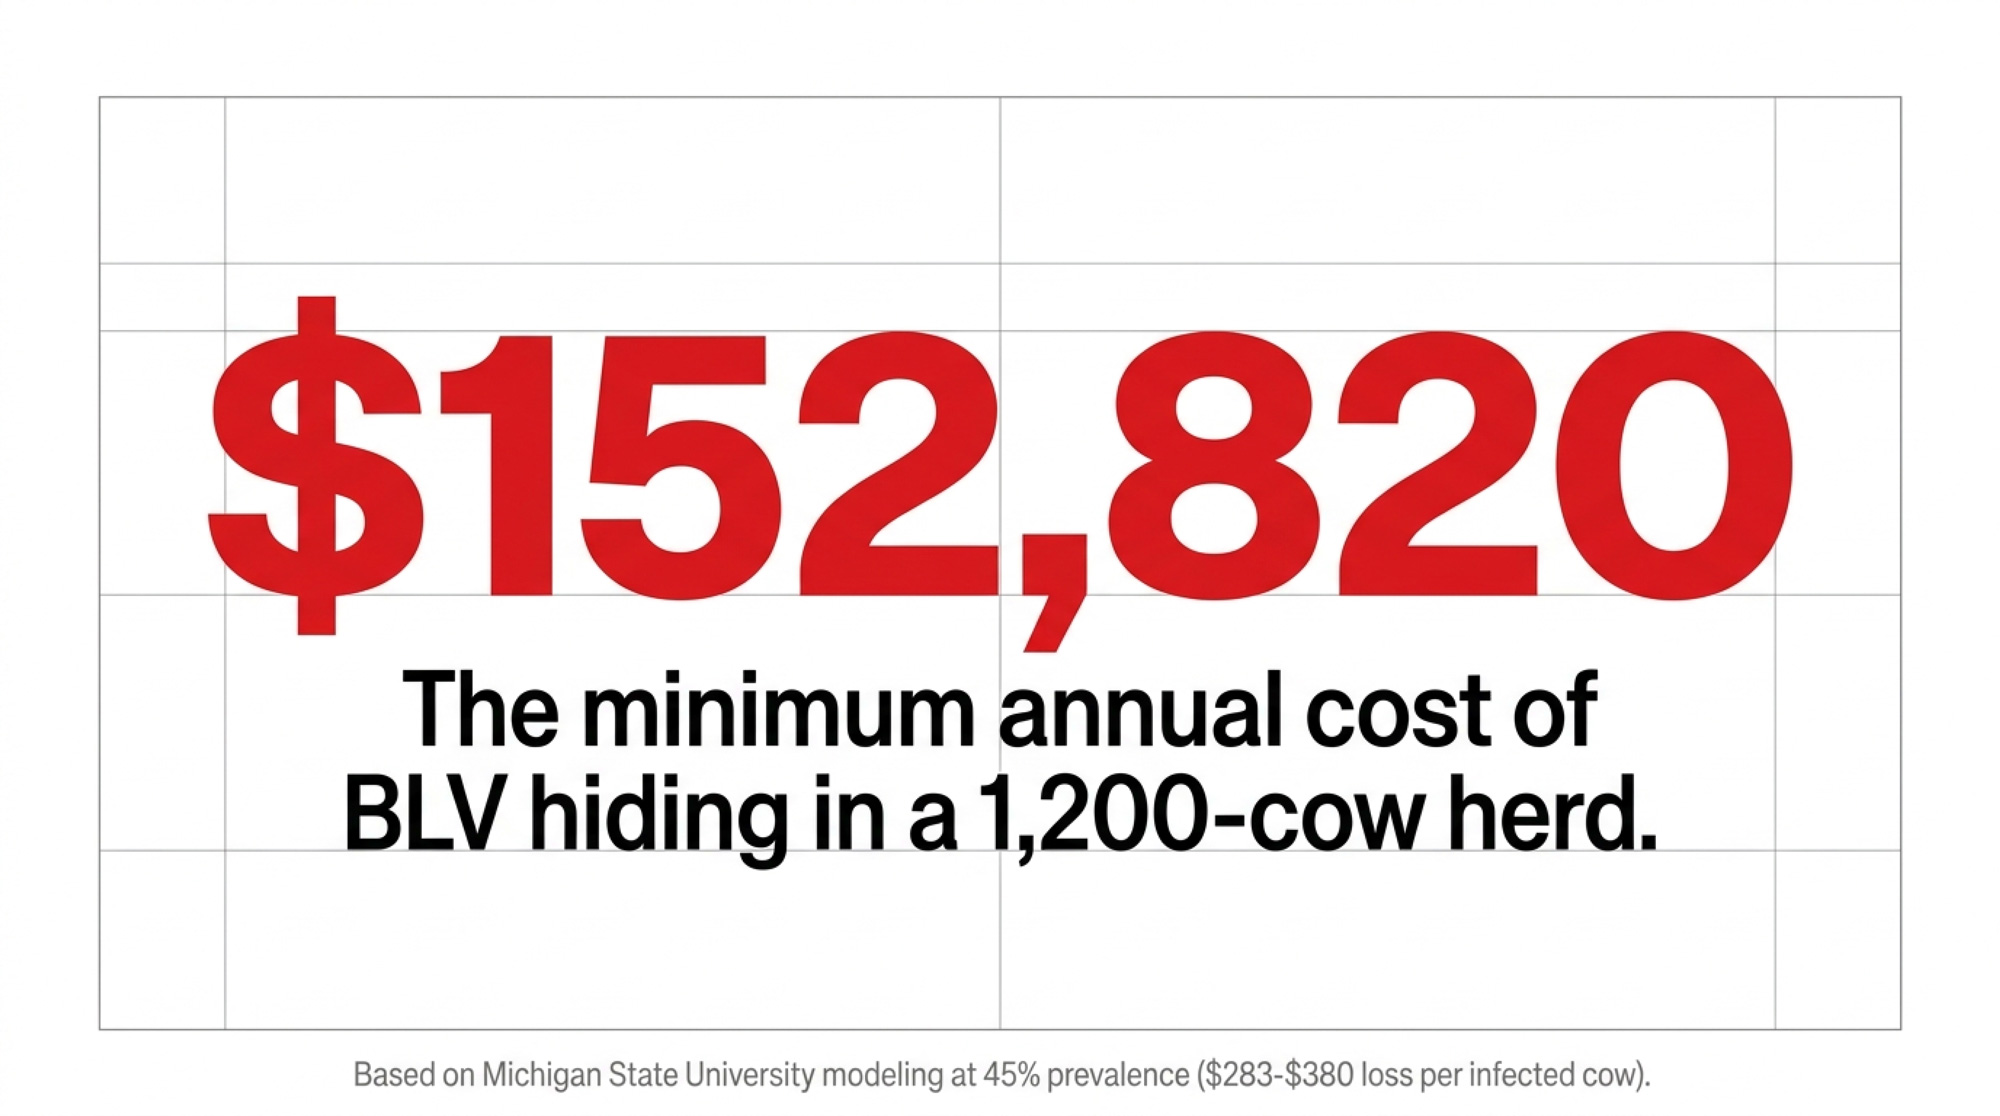
When one of those herds runs MSU’s 40‑cow bovine leukemia virus (BLV) profile and comes back at roughly 45% infected, the cost range the BLV research points to — $283–$380 per infected cow per year — translates to about $152,820–$205,200 a year in lost milk, early culls, and condemned carcasses on a 1,200‑cow herd. That’s not a prediction. It’s money those herds are already paying out, quietly, every year.

“BLV is often present long before it becomes an issue. So if you’re not looking for it on the farm, chances are it’s there.” — Dr. Tasia Kendrick, Associate Professor, MSU Department of Animal Science, on The Dairy Health Blackbelt Podcast (Episode 38, March 2026)

The Silent Margin Leak in 9 Out of 10 U.S. Herds

For years, BLV lived in the “slaughterhouse surprise” category — the disease you only thought about when a carcass came back condemned for lymphoma. That story doesn’t fit anymore.
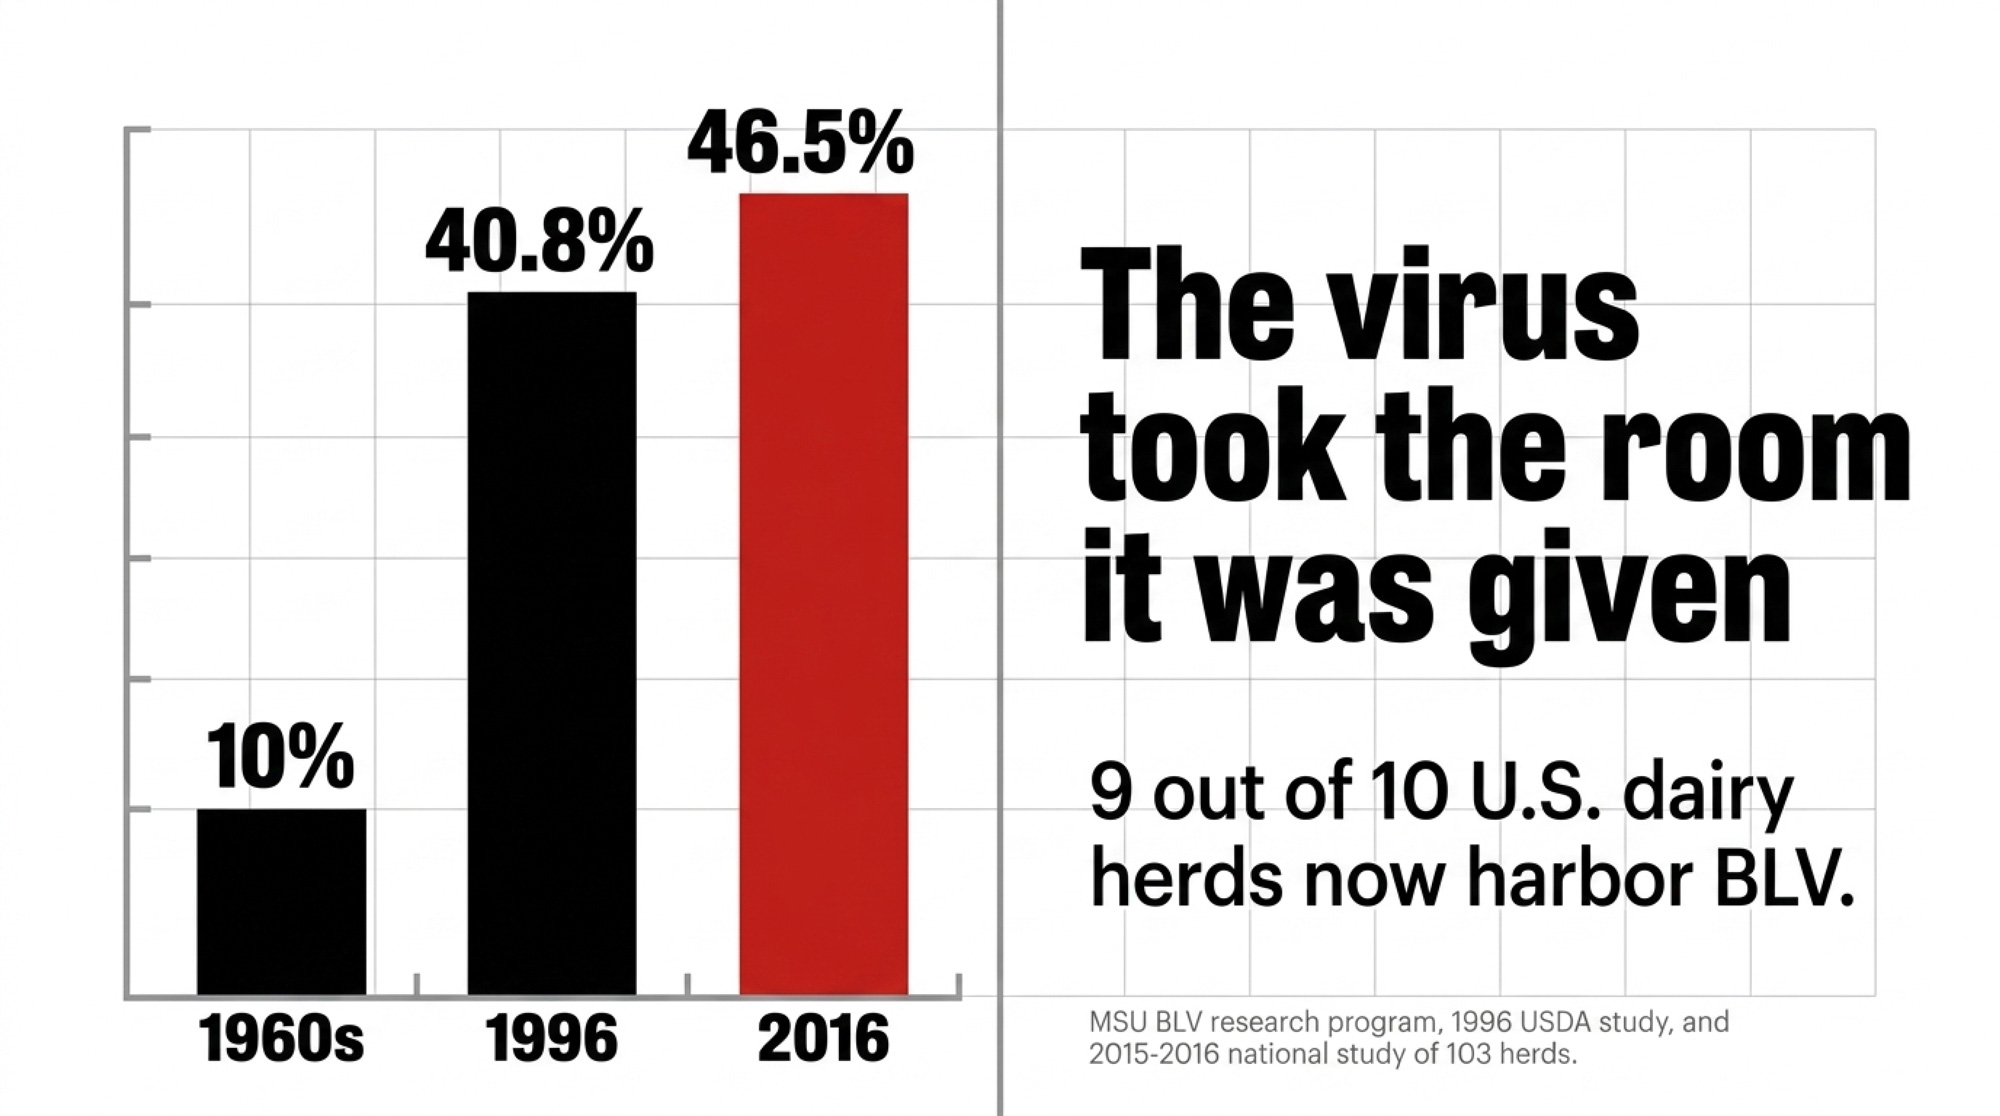
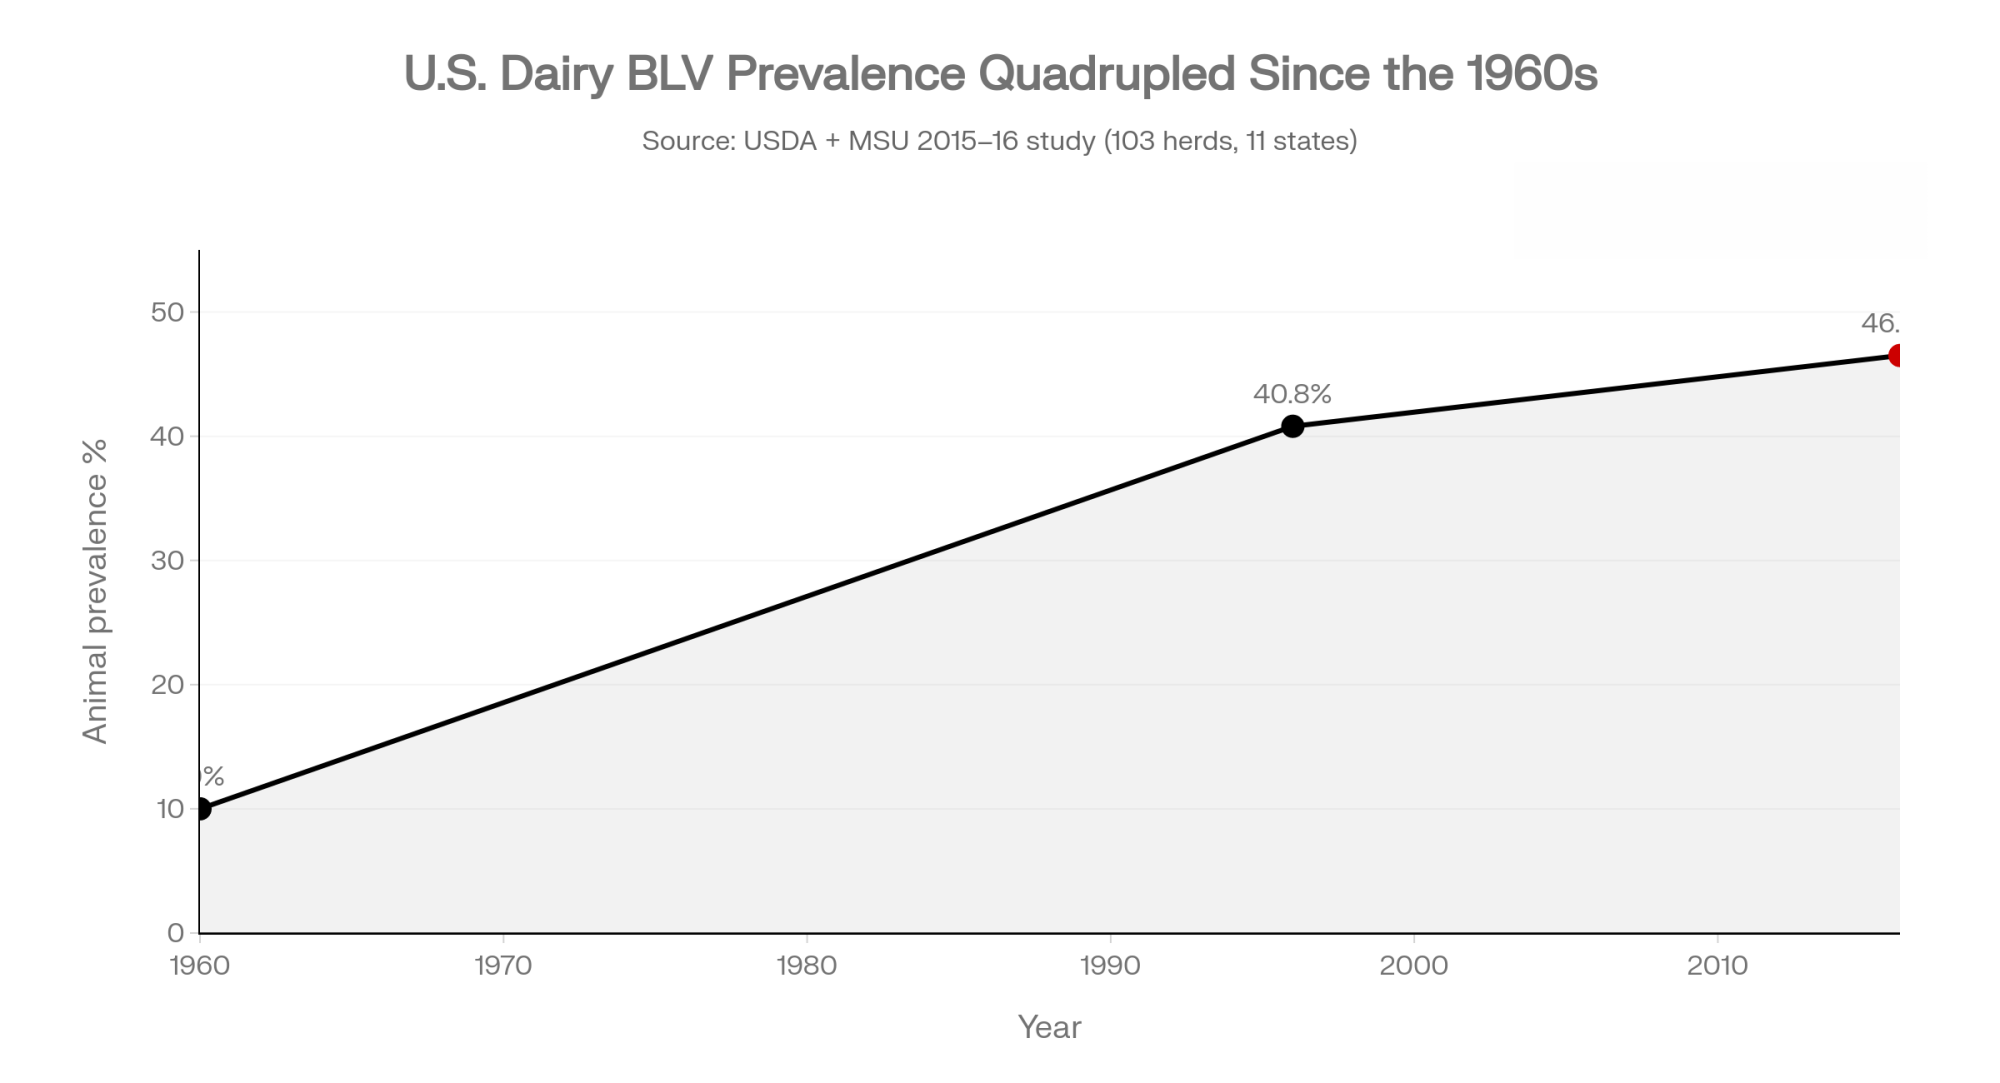
National work summarized by MSU’s BLV program shows 88.6–94.2% of U.S. dairy herds now have at least one BLV‑positive cow, with typical within‑herd prevalence in the 40–50% range. Animal‑level infection climbed from about 10% in the 1960s to 40.8% in a 1996 USDA study and around 46.5% in a 2015–2016 MSU national study of 103 herds across 11 states — the most recent national anchor point published by the team. In some high‑pressure regions, individual herds sit close to 100% positive.
Several European countries hit BLV early with coordinated test‑and‑cull programs and wiped it out while herd prevalence was still under 5%. The U.S., Canada, Japan, Argentina, and others largely did not, and the virus took the room it was given.

Kendrick, who works with the MSU BLV research team, put it plainly on The Dairy Health Blackbelt Podcast: infected cows “have lower milk production, decreased longevity” and a weaker immune system, even when they look normal in the pen.

Economic modeling using U.S. data from the mid‑1990s through the 2010s estimates that at around 50% prevalence, BLV costs roughly ,400 per 100 milking cows per year in unrealized milk, shortened productive life, and lost salvage value. On a national scale, MSU reports BLV losses of about $525 million in 1996, with more recent figures suggesting an annual deficit of up to $2.7 billion.

You’ll never see “BLV” on your milk cheque. You feel it as 200–300 lb less milk from certain cows, more mastitis and respiratory cases that never quite clear, older cows dying instead of shipping, and condemnation slips that turn a lifetime of investment into zero salvage at the plant.

What BLV Is Quietly Doing Inside Your Cows

BLV is a deltaretrovirus, closely related to human T‑cell leukemia virus, that targets B‑lymphocytes — especially those expressing CD5 and CD21 markers. It integrates its DNA (the provirus) into those cells and turns them into long‑term virus factories. Your cows’ immune systems still work, but they work with a constant handicap.

Researchers and field programs see three big knock‑on effects:

  • Weaker vaccine response. BLV‑infected cows often mount a reduced antibody response, so the vaccines you buy don’t deliver full protection.
  • Higher disease burden. Positive animals show higher rates of mastitis, respiratory issues, and lameness, especially as they get older.
  • Chronic inflammation. Studies in BLV‑positive heifers, particularly during transition, have found elevated haptoglobin and fibrinogen — markers of ongoing inflammation that quietly drain energy and resilience.

Clinically, about 70% of infected cows are aleukemic carriers with no obvious signs, around 30% develop persistent lymphocytosis, and fewer than 5% go on to full enzootic bovine leukosis with visible tumors. From a business point of view, that 70% matters more than the 5%, because those “normal‑looking” cows still cost you milk and lifetime production.
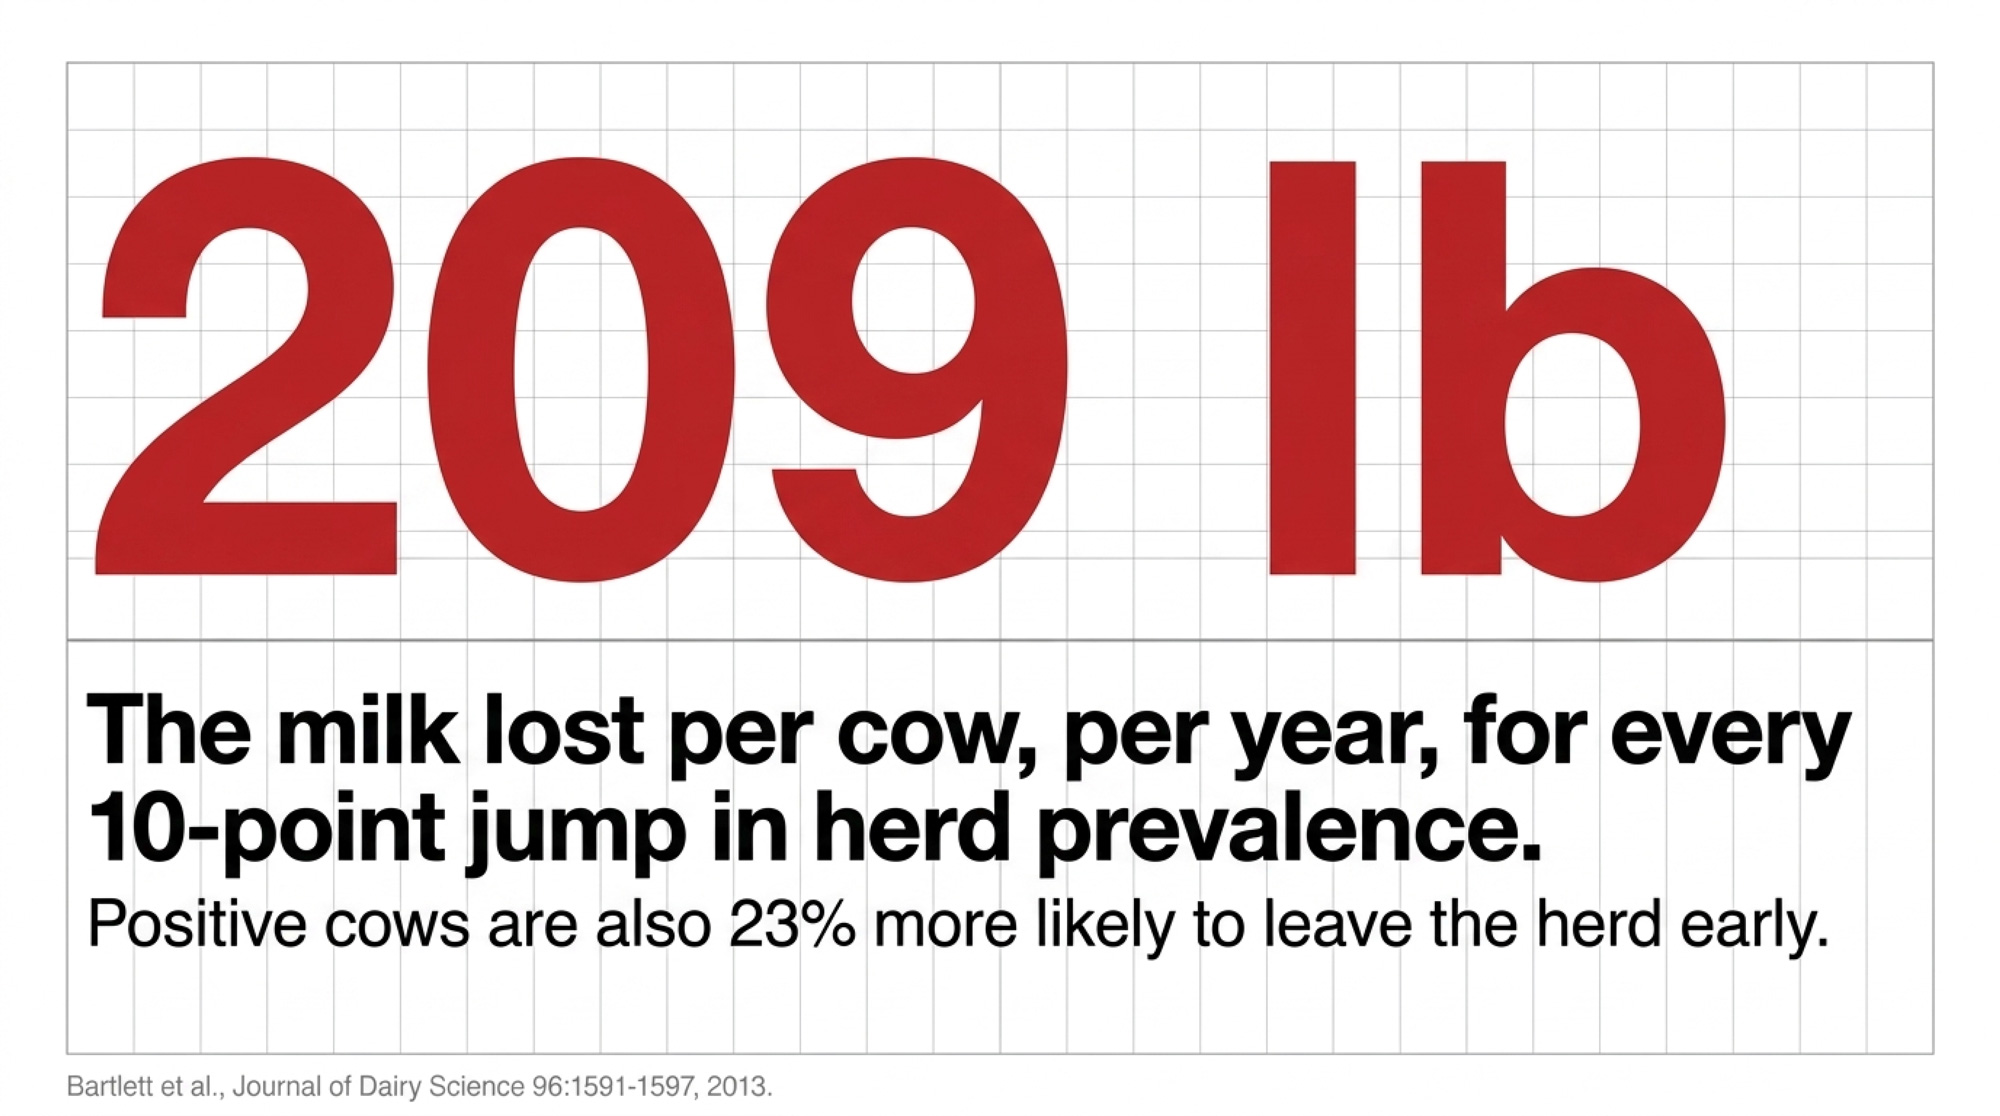
MSU work led by Bartlett, Erskine and colleagues links every 10‑point increase in BLV prevalence to about 209 lb less milk per cow per year, with a corresponding hit to the rolling herd average. A follow‑up MSU survival analysis tracking 3,849 animals across 112 herds for roughly 19 months found ELISA‑positive cows were about 23% more likely to leave the herd through culling or death, with the effect growing as antibody levels rose (Bartlett et al., Journal of Dairy Science 96:1591–1597, 2013). BLV‑related lymphoma is now the number one reason for U.S. dairy cow carcass condemnation, accounting for 26.9% of dairy condemnations and 13.5% in beef cows, per USDA FSIS data summarized in the MSU materials.

Worst of all, those extra deaths and condemnations cluster in older cows, right when they should be printing margin — peak lactations plus a final salvage cheque. BLV quietly “prunes” those cows out of your herd early. Less lifetime milk. Less salvage. Less room for mistakes elsewhere.

What a BLV Herd Looks Like on Paper

The typical pattern MSU and other BLV teams describe in 40–50% prevalence herds is a year of records that never quite add up — nothing that screams BLV, but a persistent background of repeat mastitis cases, hard‑to‑resolve respiratory episodes, and non‑calving deaths in 3rd‑plus lactation cows.
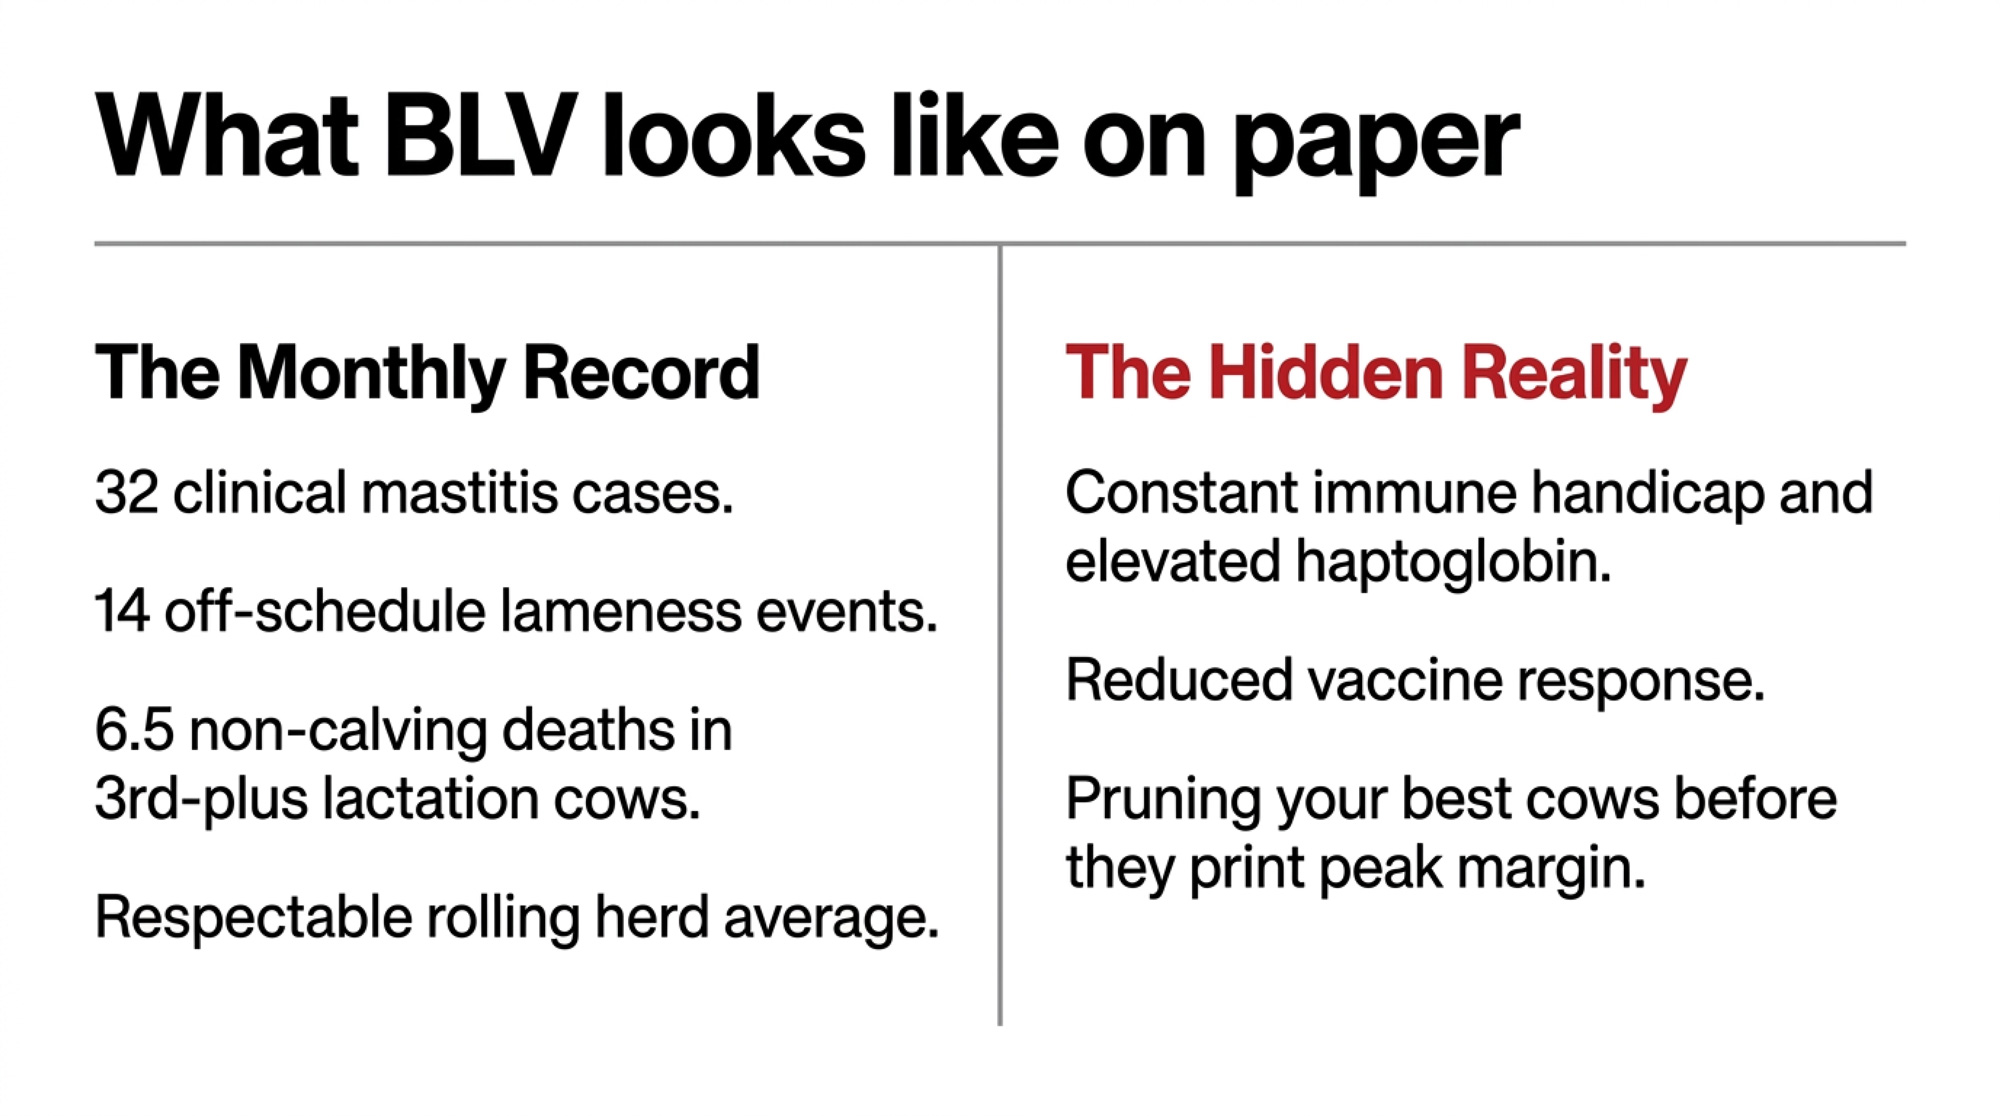
Per 100 milking cows, a herd at that prevalence often shows a pattern like this in the records (illustrative numbers stitched from MSU research and field observations, not a single farm’s dataset): around 32 clinical mastitis cases, with a handful of older cows making repeat appearances; roughly 9 respiratory or “fever of unknown origin” episodes; about 14 lameness events outside the normal trim schedule; and just under 6.5 non‑calving deaths or euthanasias, many in 3rd‑plus lactation cows. Rolling herd average? Respectable. BLV? Never discussed at the monthly meeting.

Find Your Herd on the BLV Tax Table

Using MSU’s modeled $283–$380 per infected cow per year at a typical 45% within‑herd prevalence, estimated annual losses scale with herd size. Actual losses on a given operation will vary with milk price, cull value, and management:
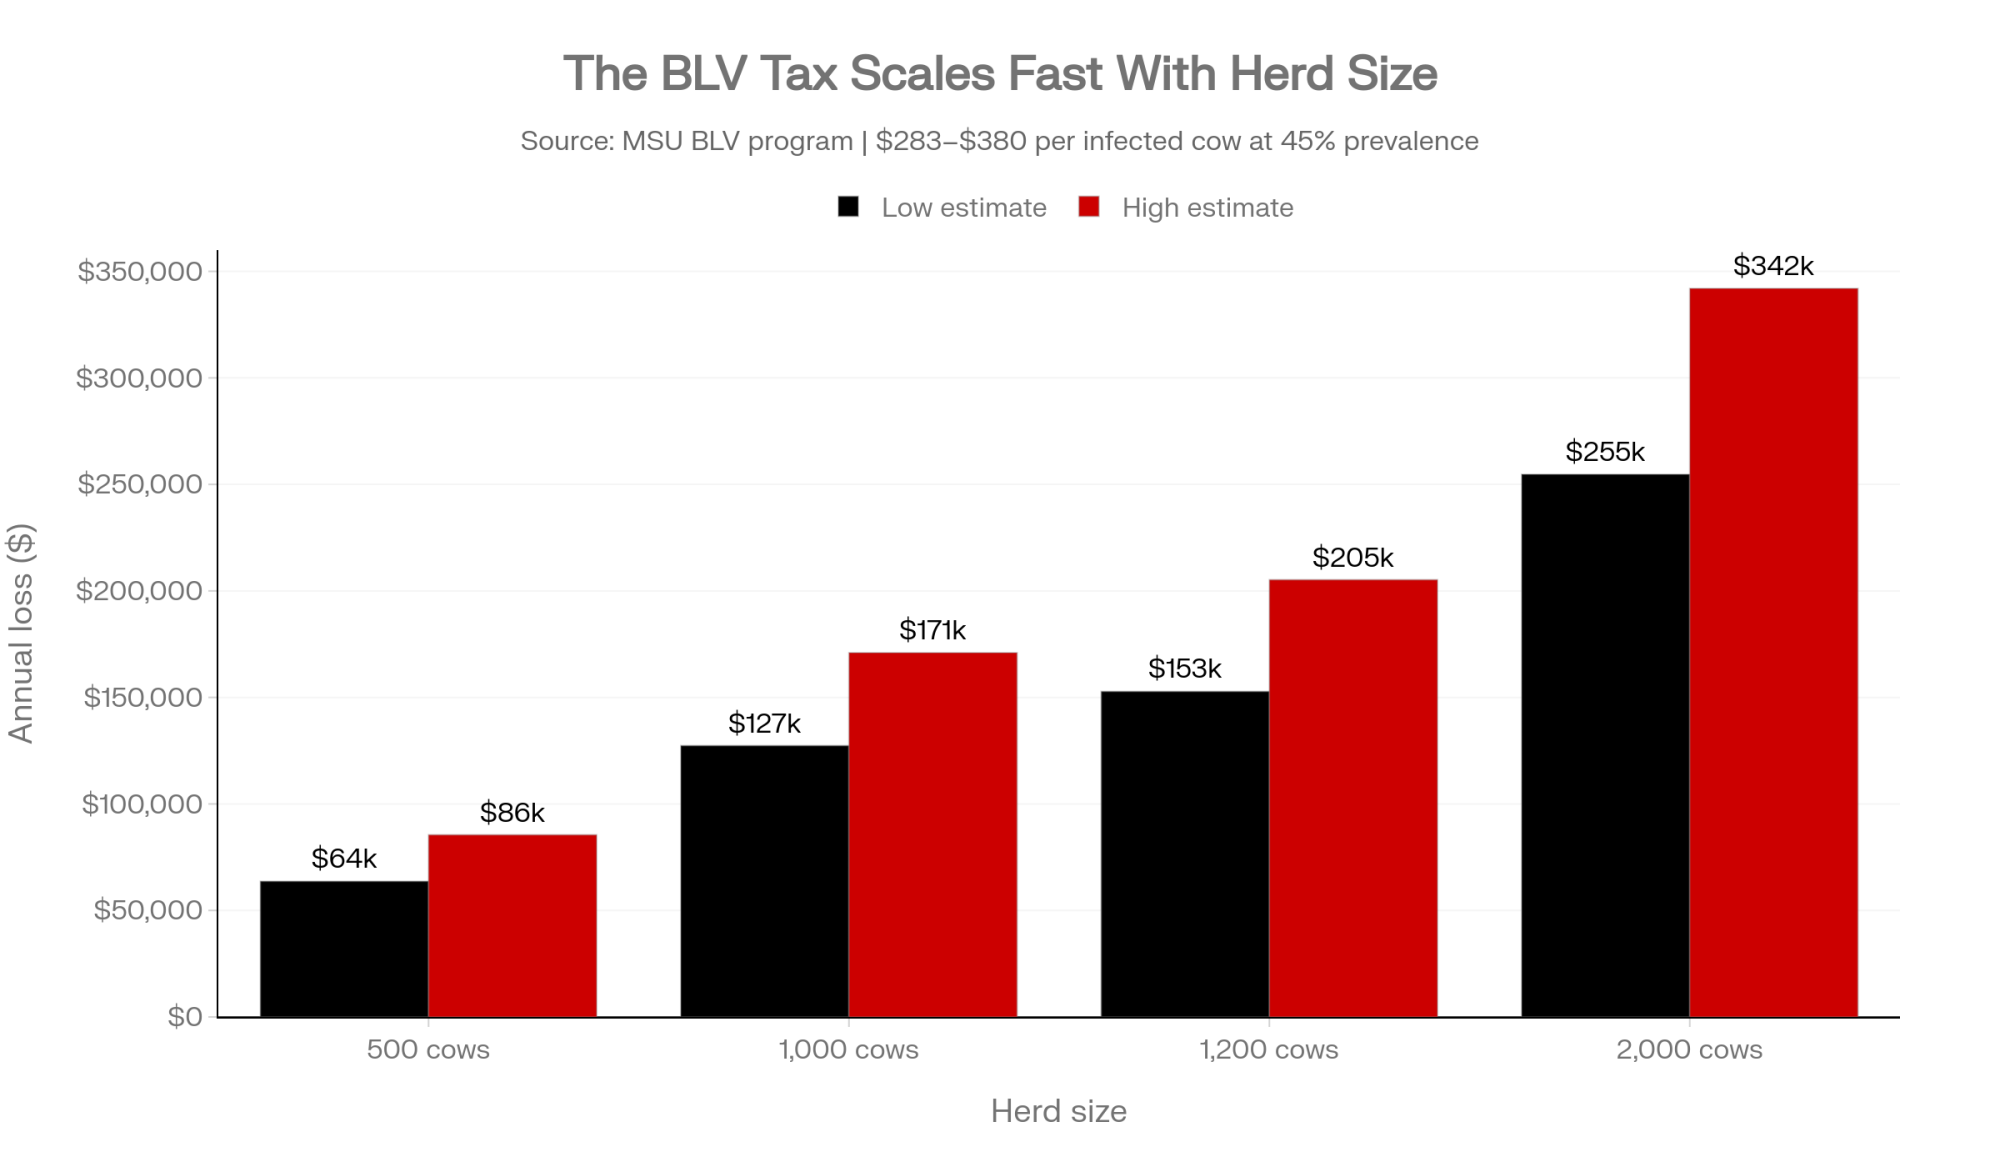
Herd SizePrevalenceInfected CowsAnnual “BLV Tax” (Est.)
500 cows45%225$63,675 – $85,500
1,000 cows45%450$127,350 – $171,000
1,200 cows45%540$152,820 – $205,200
2,000 cows45%900$254,700 – $342,000

Once those numbers hit the kitchen table, BLV stops being a “we should look at that someday” topic and becomes a six‑figure line item you either accept or start clawing back.

The 4 A.M. Reality: Where Your SOPs Are Failing

If you’re going to fight something, you need to know how it travels. BLV moves with infected lymphocytes — mostly in blood, but also in colostrum and milk. On the ground, that turns into a few familiar trouble spots.

MSU’s BLV program and Dr. Kendrick’s work point to these high‑risk routes:

  • Needles and syringes. Reusing needles, or leaving one “barn needle” stuck in a multi‑dose bottle all day, is a very efficient way to share infected blood.
  • Palpation sleeves. Even when a rectal sleeve looks clean, micro‑tears in the rectal mucosa can carry blood from one cow to the next.
  • Surgical and hoof‑trimming tools. Gouge‑type dehorners, tattoo pliers, and hoof‑trimming equipment that aren’t disinfected between animals become mechanical BLV buses.
  • Biting flies. Flies act like dirty syringes, picking up infected blood on their mouthparts and injecting it into the next cow they bite.

Vertical and calf routes matter as well. BLV can cross the placenta in roughly 4–18% of pregnancies. More damaging for your future herd is what happens in the calf barn: in some herds, about 12% of young stock are already BLV‑positive before they ever enter the parlor, mainly through raw colostrum or waste milk from infected dams. If BLV‑positive milk is feeding your replacements, you’re essentially seeding your future herd with the virus.

The good news: colostrum is one area where you can win big with straightforward management. Pasteurizing colostrum at 60°C for 60 minutes or freezing and thawing it correctly will inactivate BLV while preserving the antibodies calves need. That’s one of the fastest ways to stop loading new animals into the BLV column.

Go deeper: the colostrum protocols that actually protect replacements — our Tier 2 calf‑management pillar.

How Much Is Your Herd Really Paying to Wait?

If you haven’t tested for BLV in years — or ever — it’s easy to assume your herd is “probably average.” Michigan State’s 40‑cow protocol exists to replace that guess with an actual number.

Here’s the method:

  • Test 40 cows — 10 in each of four lactation groups: 1st, 2nd, 3rd, and 4th‑plus.
  • Choose the most recent fresh cows in each group, making sure they’re at least 3 days in milk.
  • Don’t cherry‑pick “good” or “bad” animals — take them in order.

Once you know that prevalence number, your BLV tax math is two steps:

  1. Milking cows × prevalence = number of infected cows.
  2. Infected cows × $283–$380 ≈ annual BLV tax range.

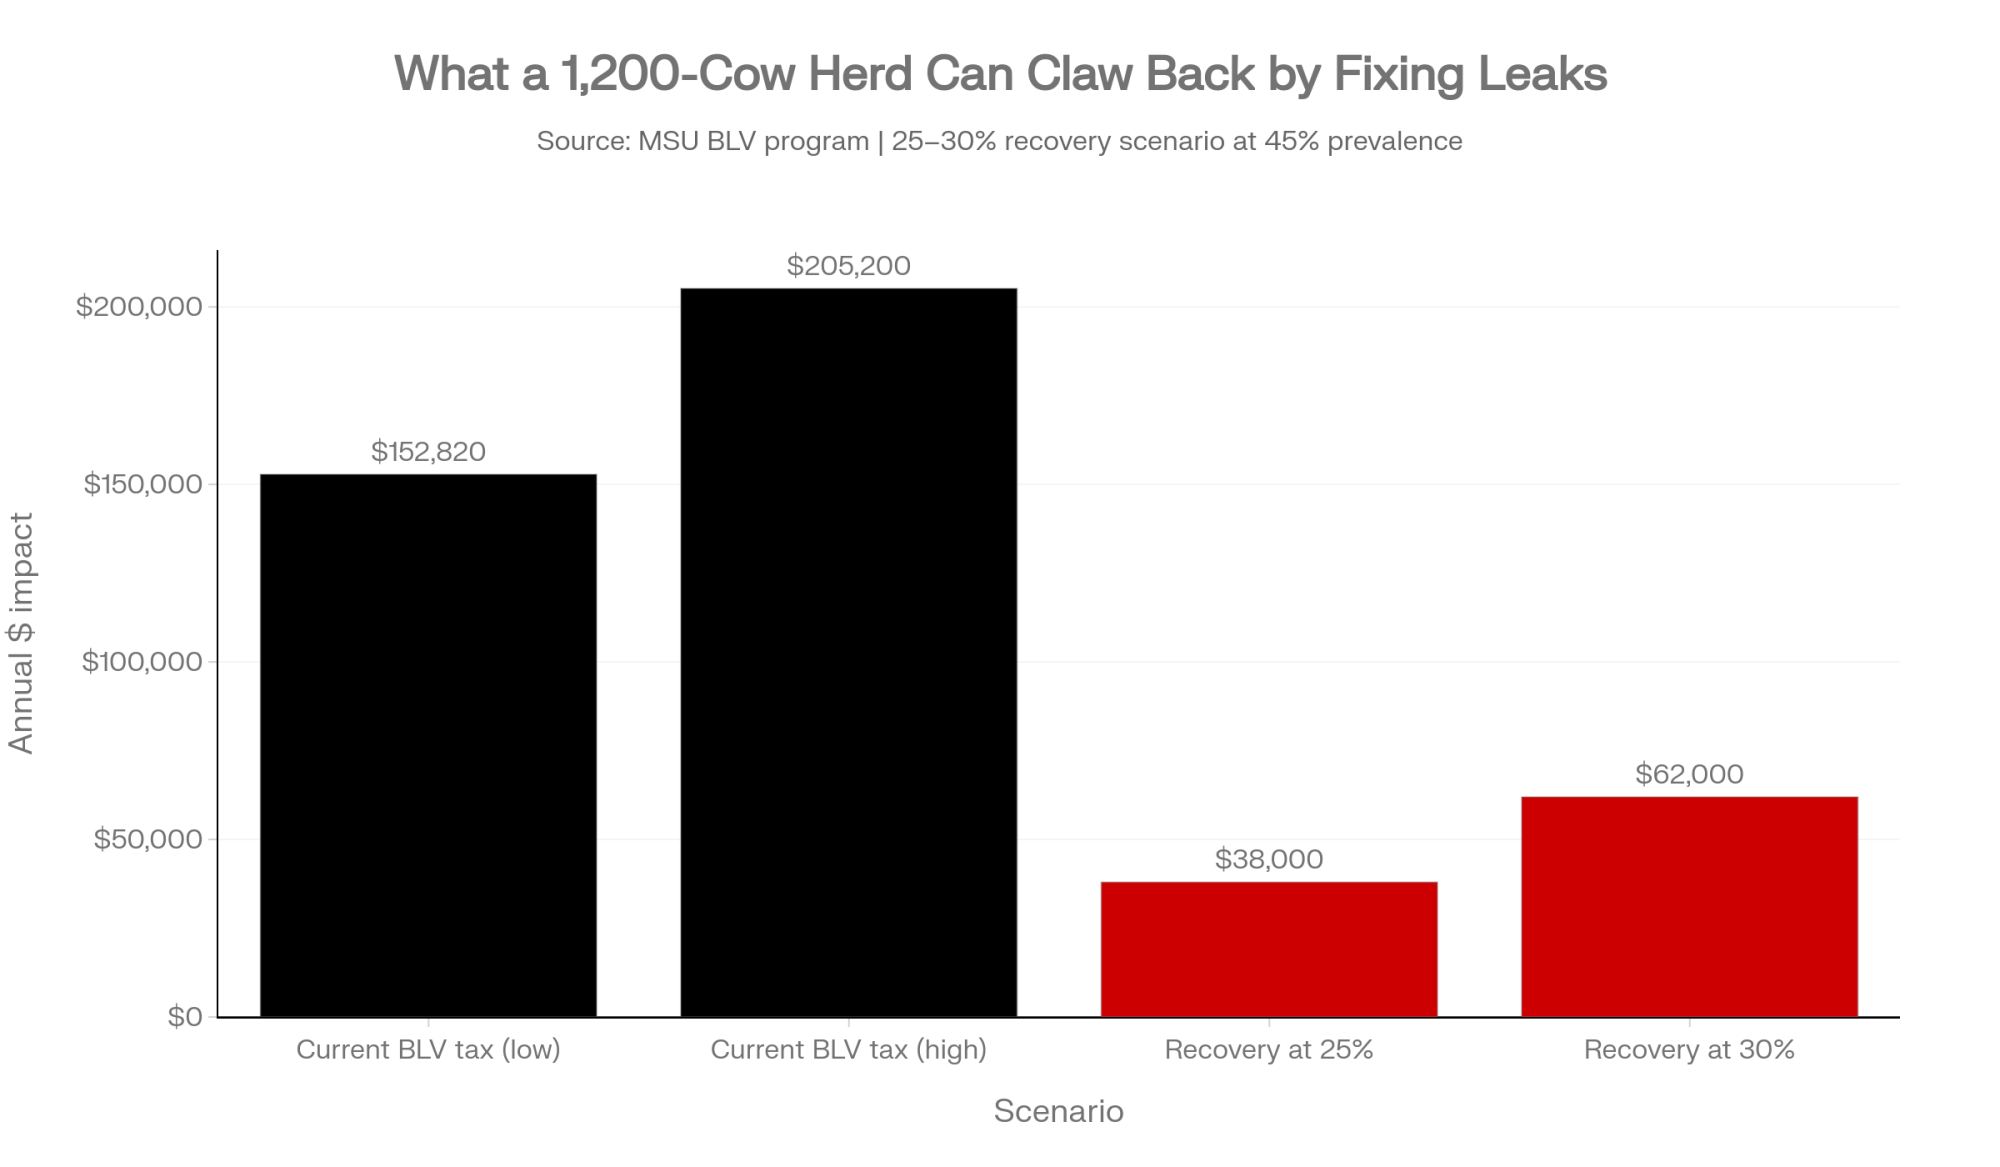
On a 1,200‑cow herd at 45% prevalence, that formula gives 540 infected cows and the $152,820–$205,200 range in the table above. It’s not perfect to the dollar, but it’s good enough to answer two questions. First, are you willing to keep paying that BLV tax? Second, if not, how much of it do you realistically want back over the next few years?

Even a conservative 25–30% recovery — by tightening the obvious leaks and dealing with the highest‑risk cows — can put roughly $38,000–$62,000 a year back into a 1,200‑cow herd at that prevalence. That’s not lottery money. It’s the difference between replacing equipment on schedule and nursing it through one more breakdown season.
The Super‑Spreader Problem: Why 11% of Cows Drive 64% of New Infections

Once you’ve seen your number, the uncomfortable part is looking in the mirror. Where is BLV still hitching rides in your routines? When herds run the 40‑cow test, make changes, then re‑test 12–18 months later, the BLV teams keep finding the same pattern. BLV prevalence drops a little, then stalls. When you dig into why, the answers usually fall into three buckets.
1. The “paper SOP vs. 4 a.m. reality” gap. BLV researchers describe a common pattern across many farms: a single needle left in a multi‑dose bottle for half the day, or a used syringe grabbed in a rush when someone is catching up. The same thing can happen in the repro line when a sleeve gets rinsed and reused “just this once.” Your protocol binder may say “new needle for every cow,” but those shortcuts are exactly the gaps BLV uses to move.

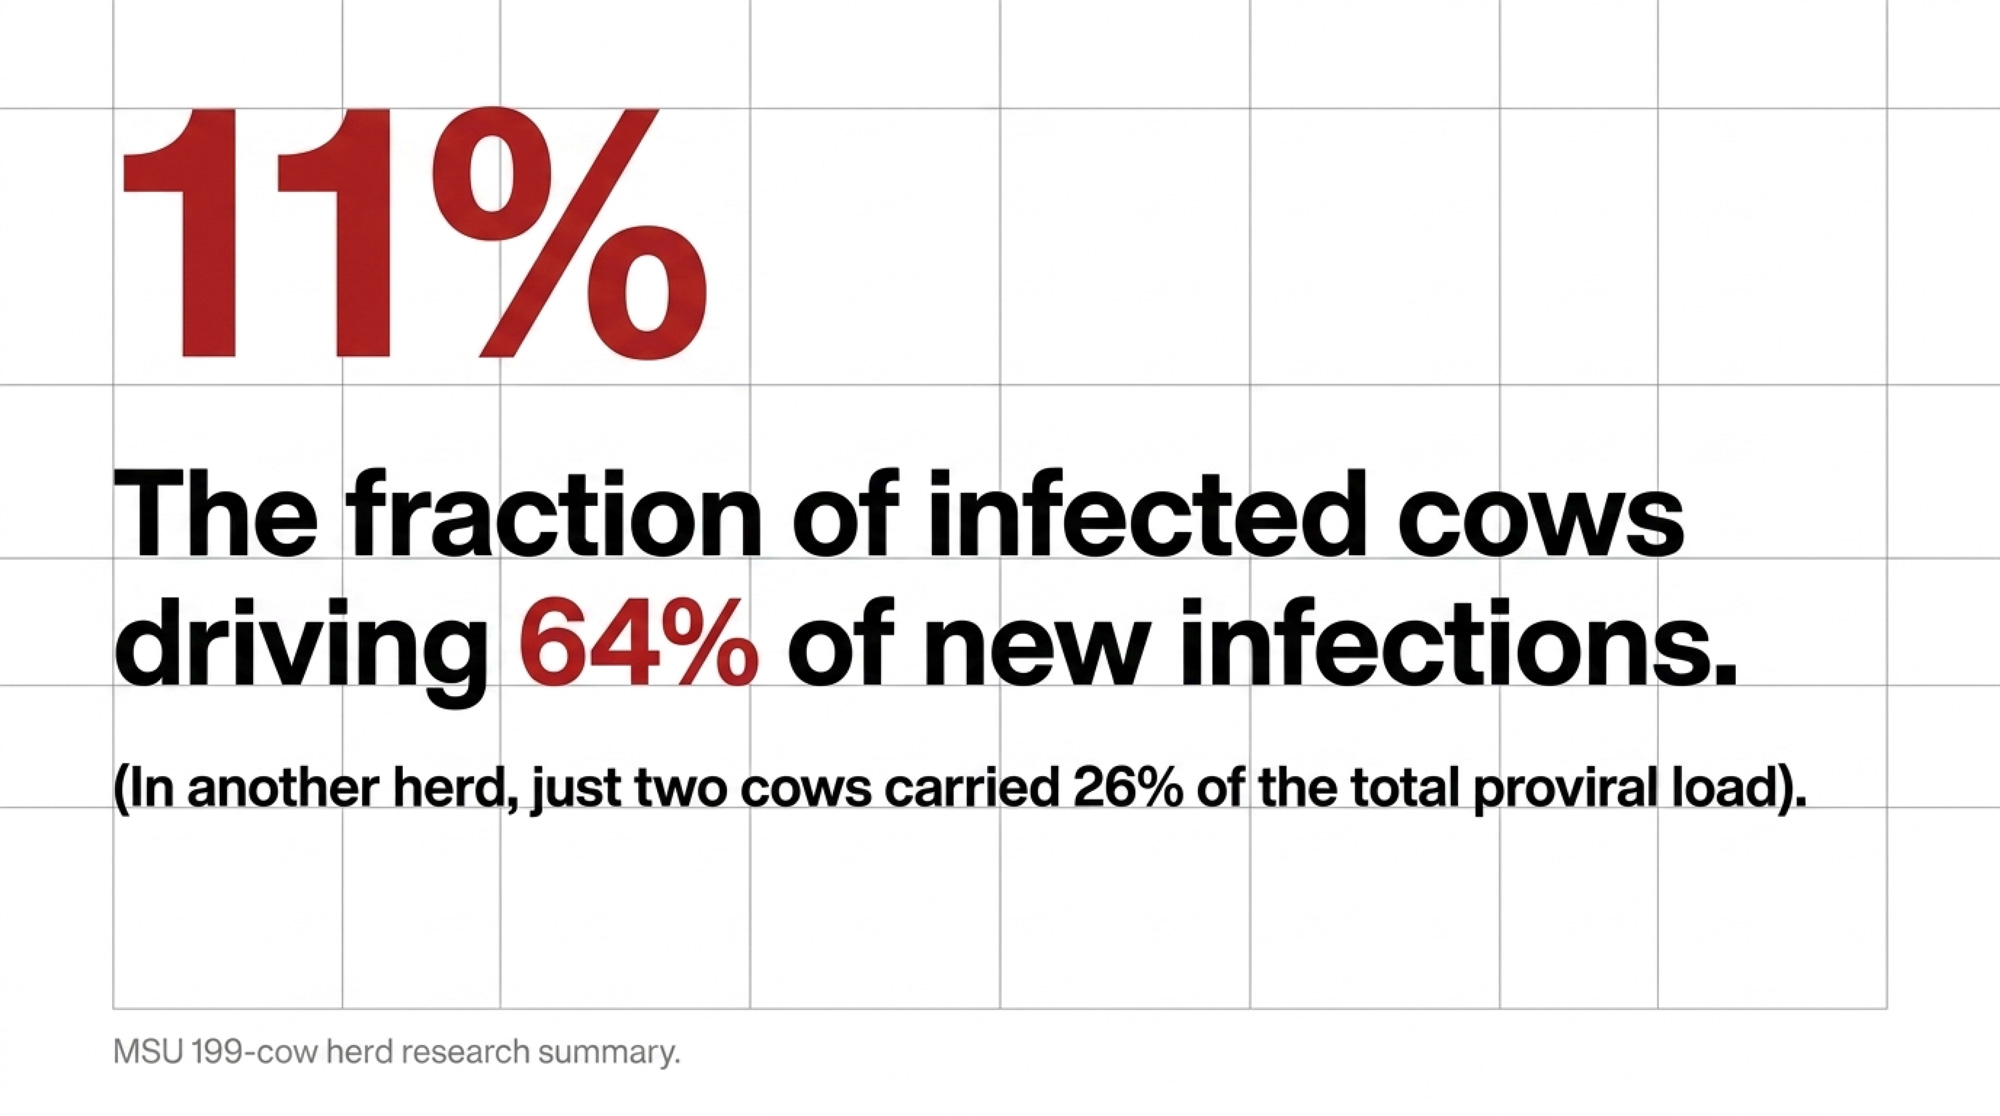
2. Super‑spreaders still living in high‑traffic pens. BLV doesn’t spread evenly across positives. In one 199‑cow herd summarized in MSU’s research, 11% of ELISA‑positive cows were responsible for about 64% of new infections. In another herd, just two cows carried 26% of the total proviral load (PVL). If those highest‑PVL cows are still in the fresh group, still donating colostrum, and still getting “one more chance” when they crash, you’re trying to drain the pool while the fire hose is still wide open.

Pro‑Tip: ELISA tells you who’s infected. qPCR tells you who’s dangerous. A standard ELISA test gives you a yes/no on exposure — good for herd‑level prevalence, but it treats every positive cow the same. Quantitative PCR (qPCR) goes further: it measures each cow’s proviral load (PVL) and reports a cycle threshold (Ct) value. The lower the Ct, the more virus in that cow’s blood, and the more likely she’s a super‑spreader. That’s how you move from “half my herd is positive” (which feels hopeless) to “these 10–15% of cows are driving most of my new infections” (which is a management plan).

3. A calf program that keeps re‑loading the virus. If your heifers are getting raw colostrum or waste milk from BLV‑positive or unknown cows, that ≈12% infected youngstock figure from MSU research is probably happening in your pipeline. The fix that works on real farms is blunt but manageable: colour‑code colostrum jugs (green for BLV‑negative, yellow for cows whose colostrum must be pasteurized, red for high‑PVL or unknown cows whose colostrum never goes to calves), keep a dedicated “calf‑approved” fridge, and make it a hard rule that calf feeders don’t grab anything else.
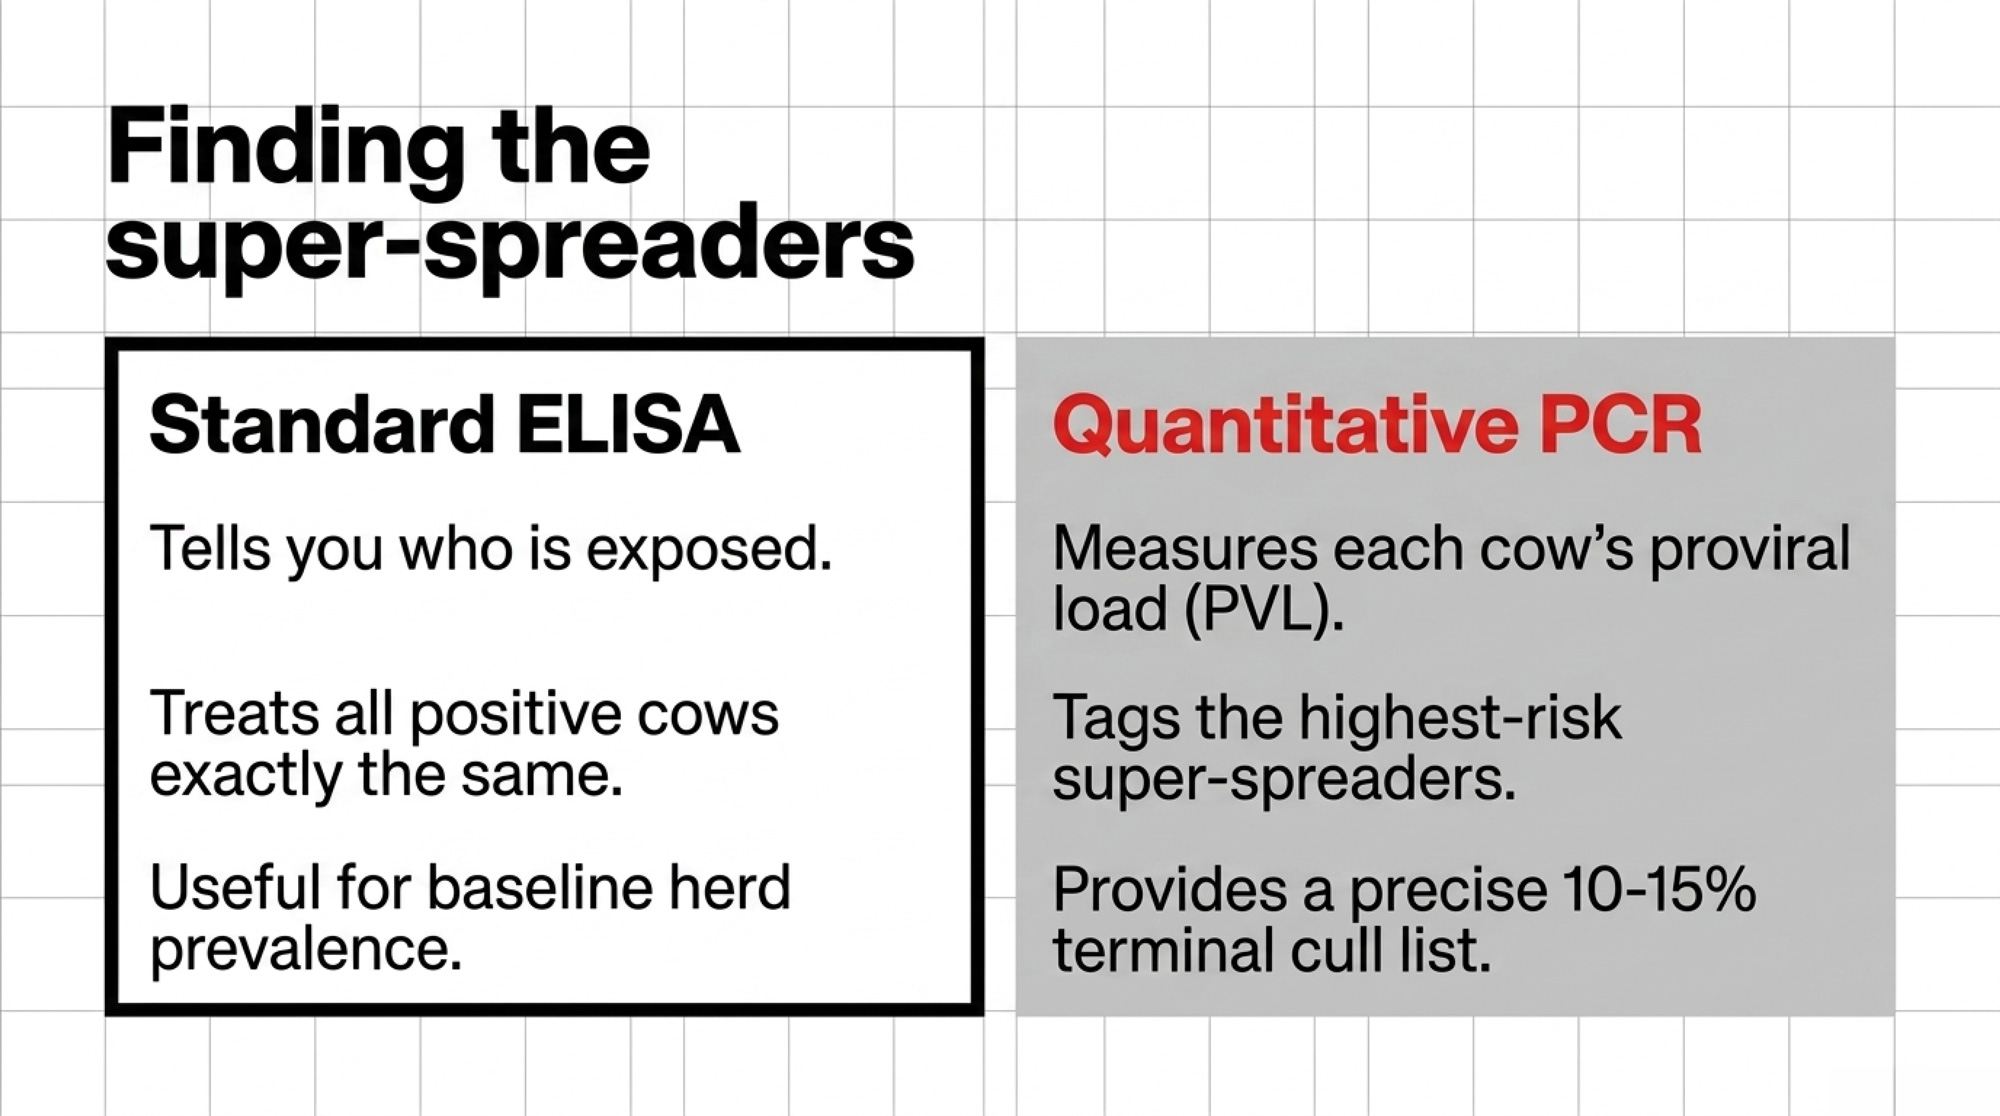
DimensionELISA (antibody test)qPCR (proviral load test)
What it measuresAntibody presence (yes/no exposure)Quantitative virus copies per cell (Ct value)
Best use caseHerd-level prevalence baseline, MSU 40-cow profileIdentifying the top 10–15% super-spreaders
Resolution on riskTreats every positive cow the sameSeparates low-risk carriers from high-PVL spreaders
Management output“Half my herd is positive” (feels hopeless)“These 10–15% of cows drive most new infections”
Typical cost tierLower per sampleHigher per sample, targeted subset
Action it unlocksPrevalence tracking, trend monitoringTerminal-cull list, colostrum colour-coding, beef-semen assignment

None of that’s glamorous. It’s sleeves, needles, tools, flies, and colostrum. But that’s where BLV actually moves — and where you can actually stop it.

Go deeper: why your best cows keep leaving too early — a closer look at BLV’s quiet effect on longevity.

Options and Trade‑Offs for Farmers

30‑Day Action: Run the 40‑Cow Test and Audit the Obvious

When it makes sense: You haven’t profiled BLV in the last few years, or have never tied BLV status to real dollars.

Your 30‑day checklist:

  • ✅ Book the MSU 40‑cow BLV profile through your vet or lab.
  • ✅ Pull the right cows: 10 most recent fresh animals in each lactation group, all at least 3 days in milk.
  • ✅ Spend one week spot‑checking how injections, preg checks, dehorning, hoof trimming, fly control, and colostrum actually happen — not how they’re written down.
  • ✅ Walk your crew through the BLV Tax Table using your own herd size and a realistic prevalence range.

Risks and limits: You may not like the prevalence number. You may also find your real‑world routines don’t match your SOPs. But staying blind is usually more expensive than finding out.

90‑Day Action: Protect Calves and Tag the Super‑Spreaders

When it makes sense: Your 40‑cow profile comes back at or above roughly 30–40% prevalence, and you expect to be milking in five years.

What it requires: Put a colour‑coded colostrum system in place and commit to pasteurizing or freezing any colostrum from BLV‑positive or unknown cows before it goes to heifers. Work with your vet to run qPCR on a subset of ELISA‑positive cows — usually older, high‑antibody animals — to identify the highest‑PVL individuals. Mark those cows in your herd software and in the parlor as terminal BLV cows: they get beef semen only, their colostrum never goes to replacements, you don’t spend on heroics when they crash, and they go to the top of the cull list as soon as they’re saleable.

Risks and limits: You’ll discard some colostrum and lean harder on frozen stores. You may ship a few older, good‑milking cows earlier than you’d prefer. You’re trading a bit of short‑term milk from a small group for lower infection pressure and healthier replacements over the long term.

Forward‑looking signal: As research into BoLA‑DRB3 alleles and BLV resilience matures, expect to see sires marketed not just for components or fertility but for keeping daughters at lower PVL even when infected. That’ll be another lever — but it won’t replace sleeves, needles, and colostrum work.

365‑Day Check: Re‑Test, Re‑Score, and Decide How Hard to Push

When it makes sense: You’ve made changes and want proof they’re working.

HorizonTrigger to actCore actionRequired investmentCost of skipping
30 daysHaven’t profiled BLV in years, or never tied status to dollarsMSU 40-cow ELISA profile + one-week SOP audit (needles, sleeves, colostrum, flies)Lab fees for 40 tests; 1 week of walkaround timeContinuing to pay $152,820–$205,200/yr blind on a 1,200-cow herd
90 daysProfile returns ≥30–40% prevalenceColour-coded colostrum system + qPCR on older high-antibody cows + terminal-cull list for top 10–15% PVLPasteurizer/freezer capacity; qPCR subset; beef semen on flagged cows~12% of heifers entering parlor already BLV-positive via raw colostrum
365 days12 months post-interventionRe-run 40-cow profile, compare hospital pen, non-calving deaths, drug spend, cull ageSecond round of ELISA tests; vet/nutritionist/bookkeeper review meetingNo evidence trail — can’t defend the investment or tune the plan
OngoingPrevalence stuck at ~same level after 12 monthsDiagnose the leak: super-spreaders in fresh pens, slipped single-use needle rule, red-tag colostrum reaching calf fridgeManagement attention, not capital2–3 point drift feels like “progress” while BLV tax keeps compounding

What it requires: Re‑run the MSU 40‑cow BLV profile 12 months after your first test, using the same selection rules. Sit down with your vet, nutritionist, and bookkeeper and compare BLV prevalence then vs now, mastitis and respiratory cases per 100 cows, non‑calving deaths, drug spend, and cull patterns — especially in older cows. If prevalence has moved down meaningfully — say, in the range of 5–10 points, alongside a cleaner hospital pen and fewer old‑cow deaths — you have real evidence you’re clawing back part of the BLV tax.

Risks and limits: If prevalence only moves 2–3 points, it’s not a failure — it’s feedback. It’s your cue to look harder at where BLV is still moving: are super‑spreaders still parked in fresh pens, did single‑use needles quietly slide back, are red‑tag colostrum jugs sneaking into the calf fridge at 2 a.m.? BLV control is a multi‑year project, not a one‑and‑done shot.
Key Takeaways

  • If your 40‑cow profile comes back at or above roughly 30–40% BLV prevalence, treat BLV as a structural cost on your P&L, not just a lab result to file away.
  • If you can’t honestly say every cow gets a new needle and a new rectal sleeve every time, assume BLV is still catching rides and fix that before you spend big on extra testing or culling.
  • If your non‑calving deaths and chronic mastitis cases cluster in older BLV‑positive cows, talk with your vet about high‑PVL qPCR testing and a terminal culling rule for roughly the worst 10–15% of positives — the small group most likely to behave like super‑spreaders in your herd.
  • If raw colostrum or waste milk from BLV‑positive or unknown cows is feeding your heifers, treat that as your fastest leak to plug: move to pasteurized or frozen colostrum from BLV‑negative or low‑risk cows and keep “red‑flag” jugs out of the calf room.
  • If you decide to invest in BLV control, put a 12‑month re‑test date on the calendar now and commit to measuring change in black and white instead of guessing.

You already know the “mystery” cows in your barn — the ones that eat up time in the hospital pen, come back on the list a month later, or die right when you expect one last lactation and a salvage cheque. The hidden question is whether BLV is quietly pulling more of those strings than you’d like to admit.

If you ran your own herd through the BLV Tax Table above, where would your number land — $63,000, $150,000, $300,000‑plus a year? And if you saw that figure in black and white, what would it take for you to cut a third of it over the next three years?

In our next segment of The Silent Tax series, we’ll dive into the specific ROI of high‑PVL culling — exactly how fast a herd can expect to see a return on its testing investment, and how the cost curve shifts at 30%, 45%, and 60% prevalence. For now, the first move is simple: run the 40‑cow test, watch your own barn for a week, and decide how much longer you’re willing to pay the BLV tax without a plan.

Complete references and supporting documentation are available upon request by contacting the editorial team at editor@thebullvine.com.

Learn More

The Sunday Read Dairy Professionals Don’t Skip.

Every week, thousands of producers, breeders, and industry insiders open Bullvine Weekly for genetics insights, market shifts, and profit strategies they won’t find anywhere else. One email. Five minutes. Smarter decisions all week.

NewsSubscribe
First
Last
Consent

Cornell Hit 93%. Your 400-Cow Retrofit Won’t: The McLanahan SMS12 Payback That’s Really 4.5 Years, Not 2.5

Cornell’s Teaching Dairy and SwissLane’s Oesch family built their sand-separator success inside facilities designed around the system. For a 400-cow retrofit, the same $85K quote carries a very different set of risks — including one Klebsiella cow you can’t afford to lose.

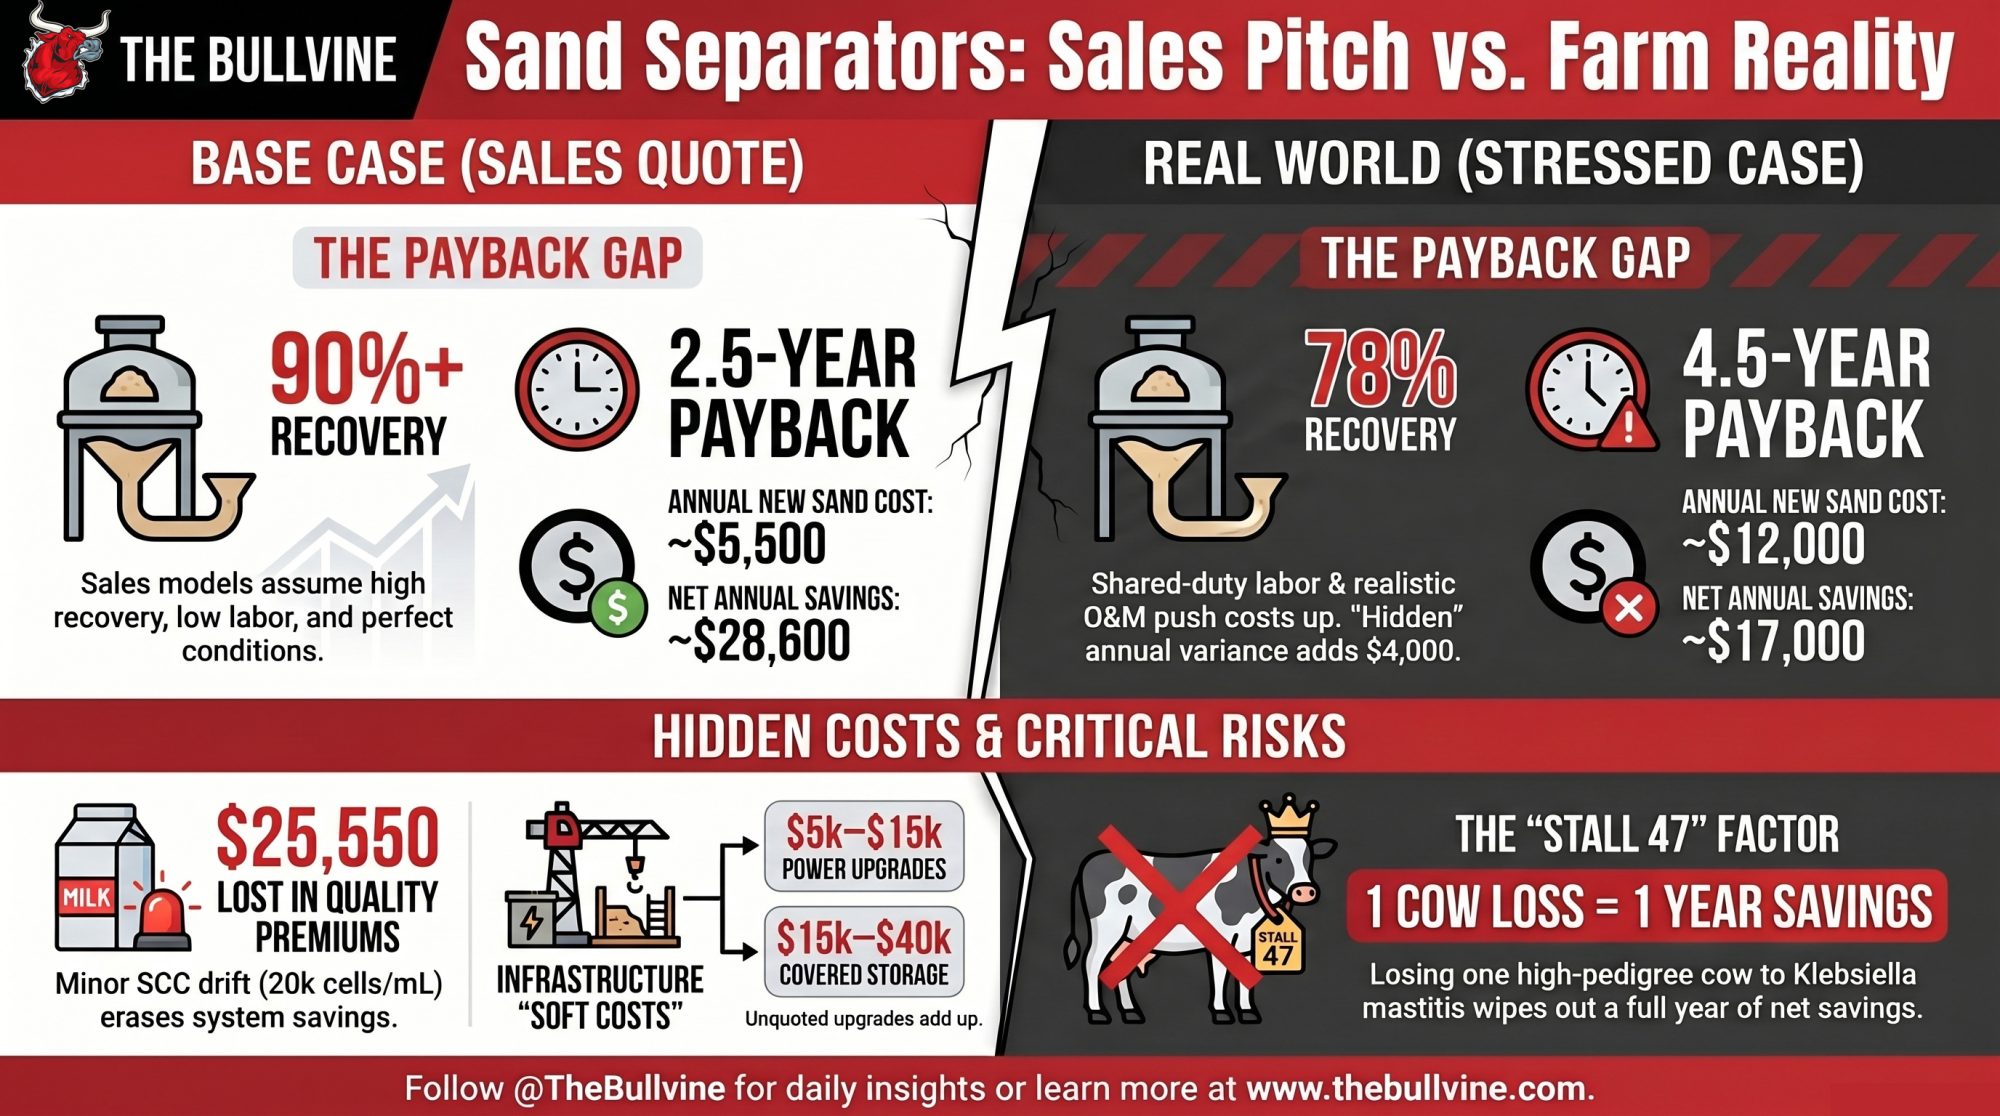
Executive Summary: The McLanahan SMS12 quote says 2.5-year payback on $85K — the honest math on a 400-cow retrofit says 4.5, once you put depreciation back in and haircut recovery from 90% to 78%. Cornell’s Teaching Dairy hits 93% separation because the facility was built around the system; SwissLane’s Oesch family hits 90% because they’ve got the scale and internal labor to run it right. Your retrofit, with a shared-duty feeder running behind by 7 a.m., isn’t either of those. A 20,000 cells/mL SCC drift on commissioning costs a 400-cow herd roughly $25,550/year in lost quality premium — larger than the stressed-case net savings — and one preventable Klebsiella cull on a pedigree cow in Month 3 erases a full year of separator savings before her daughters are counted. In the Midwest at $12–15/ton contract sand this is an ROI play; in the Northeast at $18+/ton with single-supplier exposure, it’s an insurance play against a trajectory that SARE already documented rising 70% in real dollars between 2003 and 2013. Read the full piece if you’re re-bedding this year, staring at a dealer quote, or if your 400-cow herd carries any pedigree value you can’t afford to lose in commissioning.

McLanahan SMS12 payback

It’s mid-April. Coffee going cold on the kitchen table, an iPad open beside a paper dealer quote, the parlor pump cycling steady in the background. The producer staring at the McLanahan SMS12 quote could be in Lancaster County, Clinton County, or Addison County — this decision is on 400-cow kitchen tables across three regions right now — and the quote says 2.5-year payback in base-case spreadsheet optimism.

McLanahan engineered the SMS12 for dairies with 500 or fewer cows. Using the company’s own published 500-cow example — 50 lbs of sand per cow per day, $12/ton delivered, electricity at $0.07/kWhr — the pre-separator sand bill runs $54,750, and the system claims to cut roughly $40,000 a year off that bill while recovering more than 90% of the bedding. Base-case projections are standard practice across dairy capital equipment, from robotic milkers to heat recovery. The question isn’t whether the base case is optimistic. It’s how it holds up against your barn, your labor, and the cow in stall 47.

Figures in this article are illustrative, drawn from published case studies and model inputs. Actual costs, savings, and payback periods depend on herd size, regional sand pricing, barn design, labor, and site conditions.

What Cornell’s Teaching Barn Actually Proved — and What It Didn’t

Cornell University’s Teaching Dairy Barn in Ithaca, New York — a 150-cow facility built around best-practice demonstration — installed the SMS12 and published its results through McLanahan’s February 2025 case study. Their stated goal was 90% sand separation. The long-term average has come in at roughly 93%. Weeks hitting 97% or better happen regularly.

“One of the nice surprises we’ve had is how well it does the sand separation for us,” Jennette, the Teaching Dairy’s manager, said in McLanahan’s published Cornell case study. Before installation, the Teaching Dairy was trucking in about 30 tons of new sand every week. Today they buy a few tons at a time.

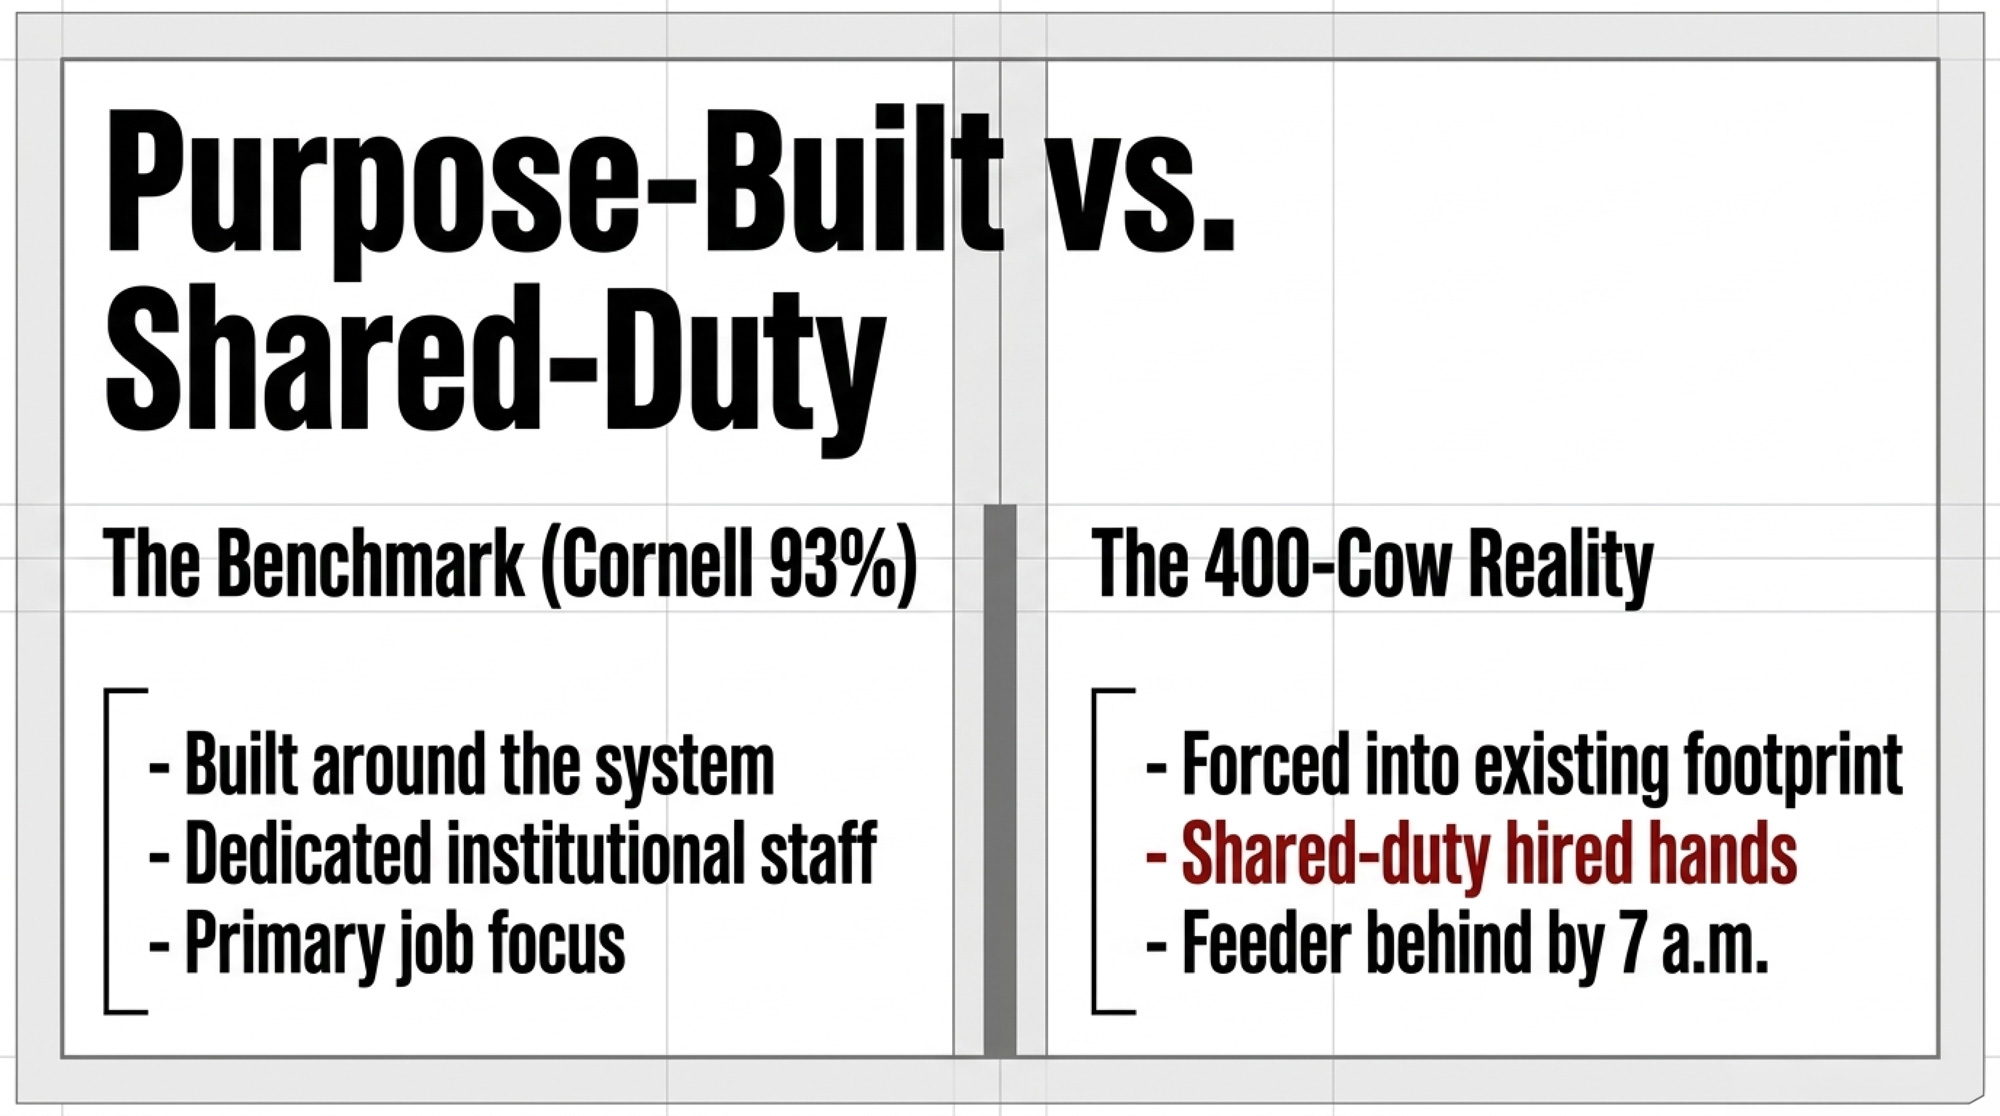
That’s a legitimate success story. But it’s a ceiling, not a benchmark. The Teaching Dairy Barn was purpose-built around the system, staffed by people whose primary job is to manage and document it. Institutional backing. No shared-duty labor problem. A 400-cow retrofit with two hired hands and a feeder who’s already running behind by 7 a.m. is a different animal entirely.

Scale up and the same tension shows up in a different form.

SwissLane Dairy in Alto, Michigan — a 2,000-cow, fourth-generation operation under the Oesch family — ran headlong into the real-world version of that gap before McLanahan solved it mechanically for them. Per McLanahan’s SwissLane case study, switching to sand bedding added roughly 8 lbs/cow/day to the herd average, and SwissLane cows now produce around 90 lbs/cow. Sand-laden manure was wrecking equipment, compacting fields, and stacking maintenance bills. Their McLanahan Sand-Manure Separation System now recovers up to 90% of the sand depending on sand size and water quality. “We are recycling up to 90 percent of the sand, which cuts back on our need for new sand,” Matt Oesch, the fourth-generation financial controller, said in that same case study. “Also, there is much less wear and tear on our equipment.”

Both systems work, but for different reasons. Cornell’s works because it was purpose-designed. SwissLane’s works because the Oesches have the scale and internal infrastructure to run it properly. That variable is missing from the base-case model — and it’s exactly the variable a 400-cow retrofit is most exposed to.

System / Herd TypeDesign & Labor RealityRisk if Copied to 400‑Cow Retrofit
Cornell Teaching Dairy150 cows; barn purpose-built around SMS12; dedicated staff tracking sand daily93% recovery becomes 75–80% when shared-duty labor replaces dedicated ops
SwissLane (2,000+ cows)Large-herd scale; in-house maintenance; strong internal infrastructureAssumes capital, infrastructure, and uptime most 400‑cow barns don’t have
400‑Cow Retrofit (spec)Existing barn geometry; limited fall; 2–3 hired hands with full chore listsDesign constraints and labor load push recovery below spec by 10–15 points
400‑Cow Retrofit (drift)Shared-duty “separator manager”; protocols erode after 90 days; reactive maintenanceKlebsiella or SCC drift can erase a full year of savings in Month 3

What a Klebsiella Event Actually Costs You on a Pedigree Cow

The payback math assumes a commissioning SCC event is a one-time quality-premium hit. It isn’t — not in a Bullvine reader’s barn.

Rowbotham and Ruegg’s 2016 Journal of Dairy Science study (“Bacterial counts on teat skin and in new sand, recycled sand, and recycled manure solids used as bedding in freestalls”) documented that primiparous Holsteins bedded on new sand had longer survival times to first culture-positive subclinical mastitis case than cows on recycled sand. Read “survival time” as what it actually is on a breeder’s herd: the difference between a second-lactation EX classification and a cull tag at Day 95.

Commissioning drift on a recycled-sand system opens the door specifically to environmental coliforms — Klebsiella, E. coli, Enterobacter — the organisms Leite et al. tied in a 2023 Pathogens study to higher clinical mastitis incidence when bedding moisture and coliform counts climbed. A Klebsiella mastitis case on a high-genomic or deep-pedigree cow isn’t a $250 treatment bill. It’s a cow you lose.

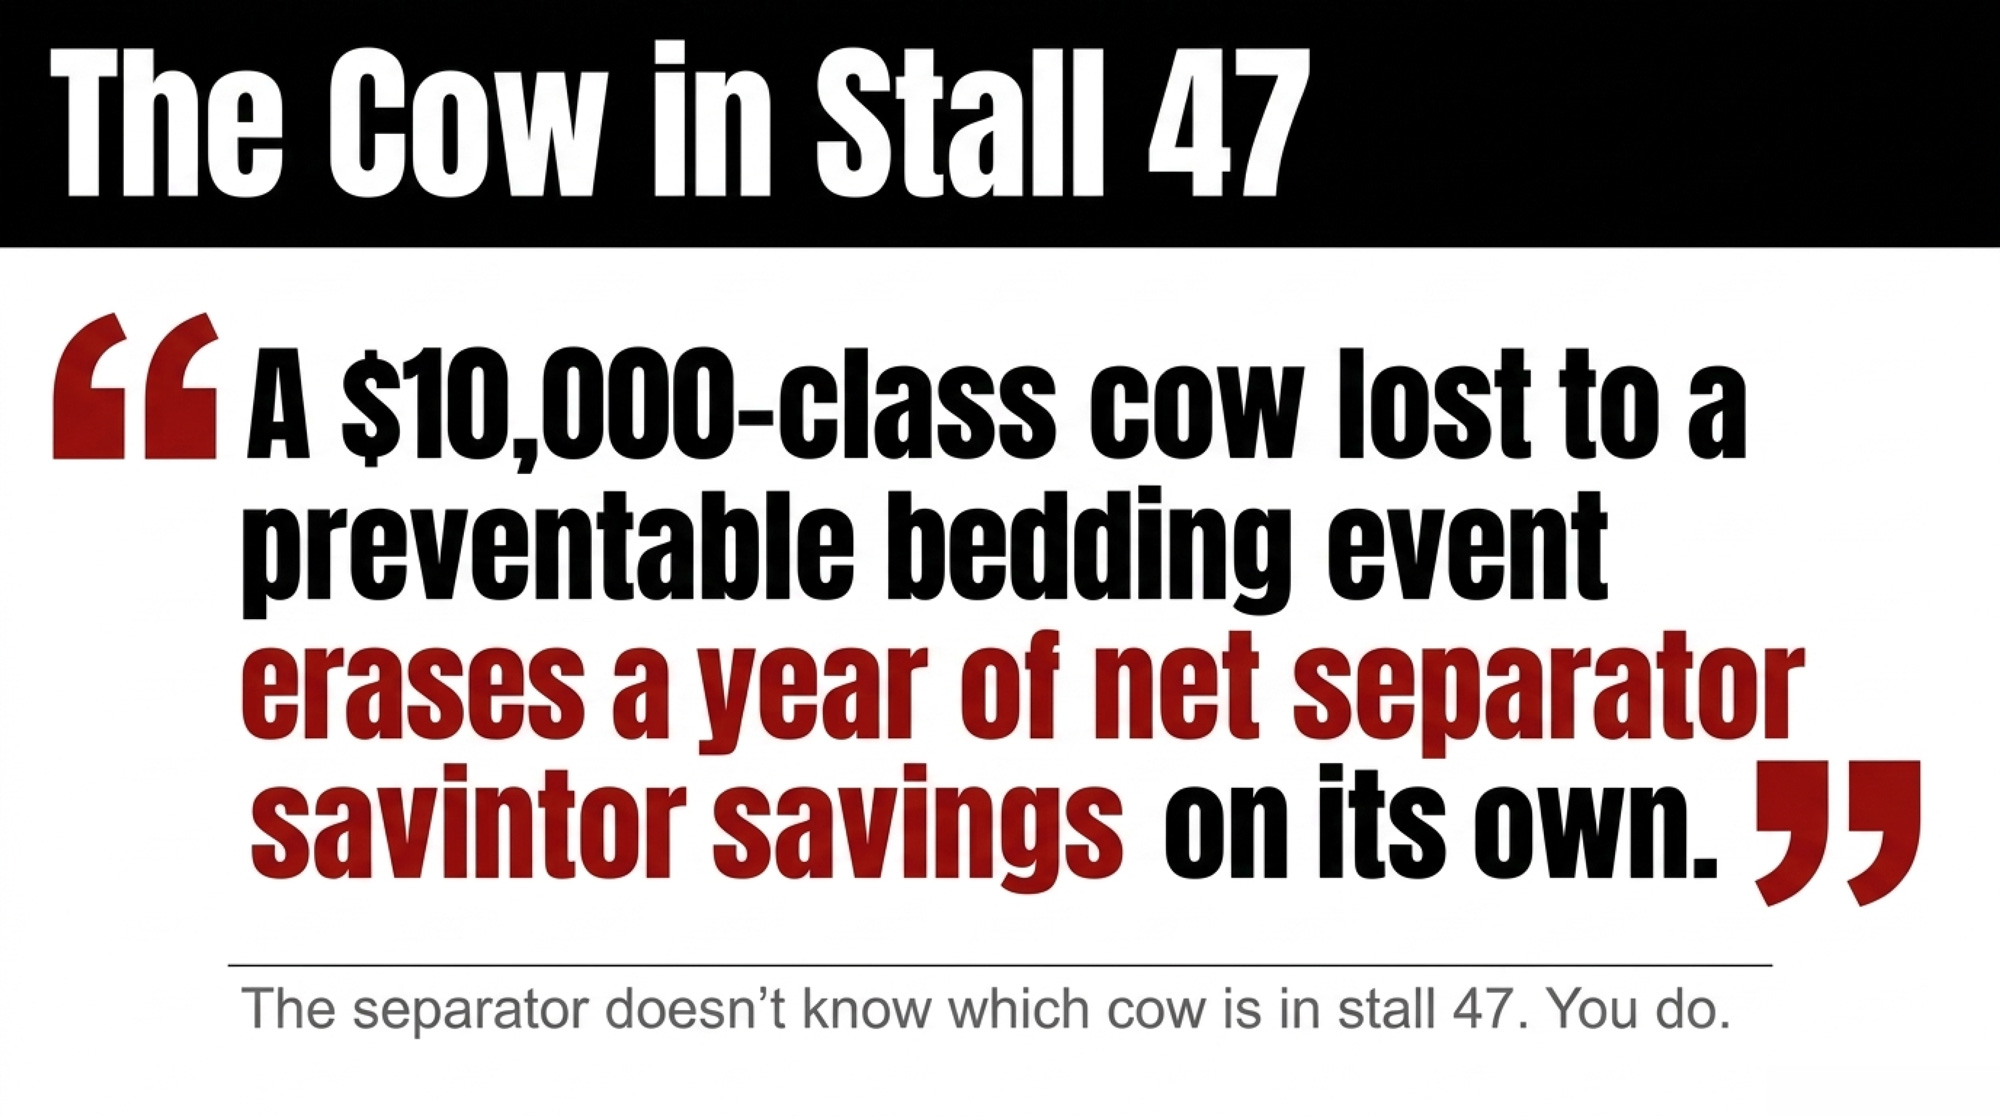
On a 400-cow herd carrying even a small nucleus of breeder-value animals, the 4.5-year payback math flips the moment one of those cows goes down in Month 3. A $10,000-class cow lost to a preventable bedding event erases a year of net separator savings on its own — before you count what her daughters were supposed to contribute. The separator doesn’t know which cow is in stall 47. You do.

Can a 400-Cow Retrofit Hit Spec When Cornell and SwissLane Were Purpose-Built for It?

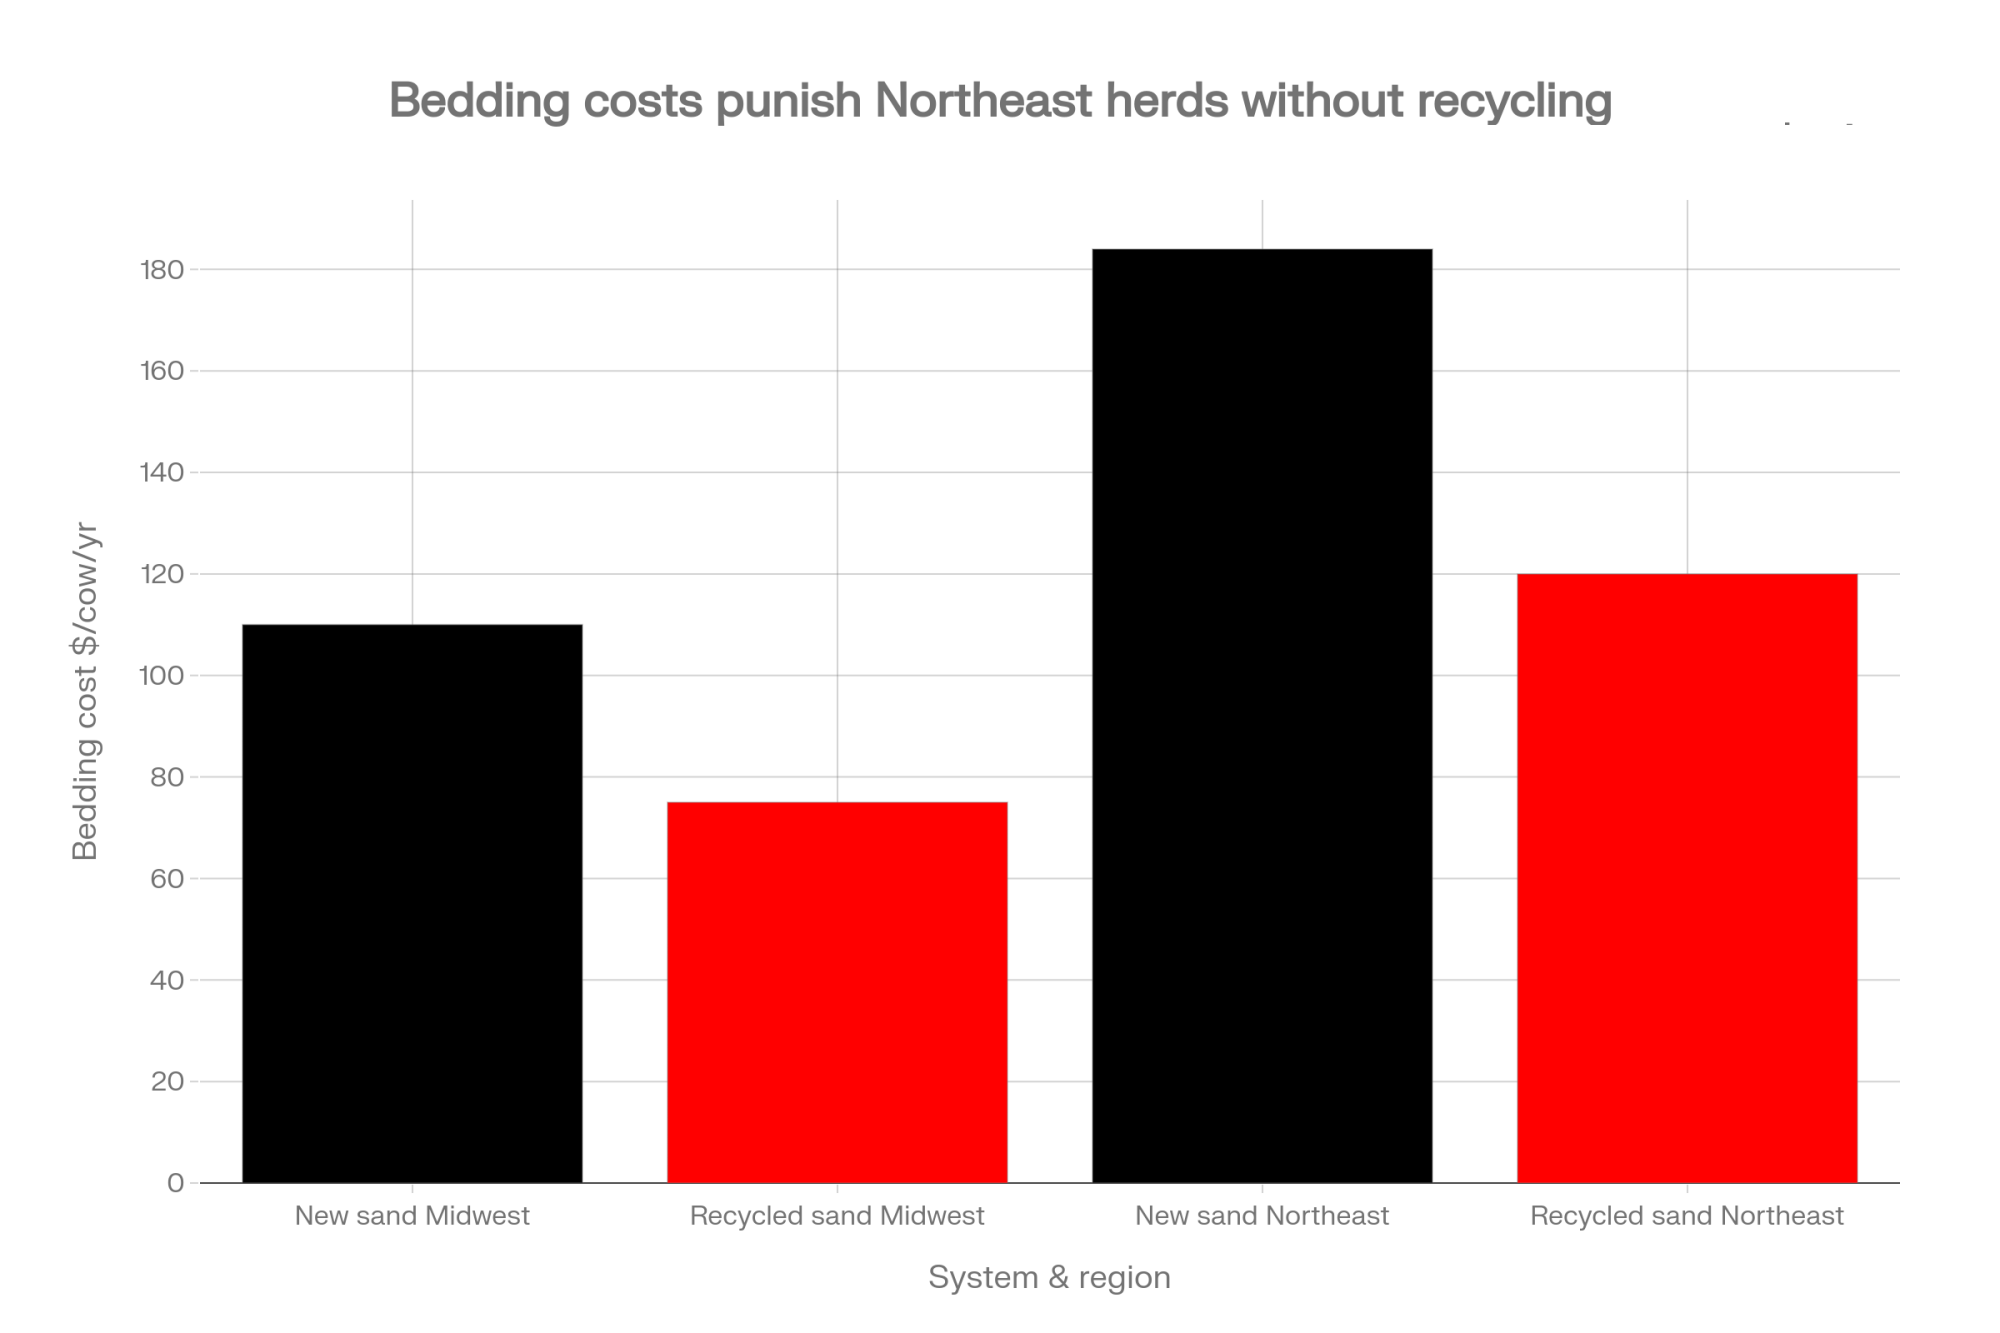
Run the barn math honestly. A 400-cow herd at 50 lbs of sand per cow per day burns through about 3,650 tons of sand a year. At $15/ton delivered — a reasonable 2025 Midwest contract band, though regional pricing varies by supplier — that’s $54,750 in new sand, or roughly $137 per cow per year in bedding alone.

Run the design-spec math honestly. Makeup sand at 10% of 3,650 tons ($5,475), O&M at $15,000, and straight-line depreciation on $85,000 of capital over 15 years ($5,667/yr) totals about $26,000 all-in. That’s $65/cow. Gross cash savings against the all-new baseline — new sand avoided minus O&M — come to $34,275. That’s the number the dealer spreadsheet divides into $85,000 to get its 2.5-year payback. Put depreciation back into the denominator, and simple payback stretches to roughly 3 years even at design spec. Add interest on the loan ($3,000–$5,000/year, depending on term), and the headline number softens more.

Now haircut it. Recovery drifts from 90% to 78%. Makeup sand climbs toward 22% of pre-separator volume — about $12,000. O&M runs $4,000 over projection, a routine Year-1 variance on any new dairy capital equipment. Tack on one Year-1 commissioning SCC event ($3,000–$5,000) and one mid-range mechanical intervention ($7,500), amortized into Year 1 rather than buried. Net savings compress to roughly $17,000. Simple payback stretches to roughly 4.5 years. Still positive. Just no longer a runaway case.

Base Case vs. 80% Performance — 400-Cow Herd, $15/Ton Sand

MetricBase Case (100%)Real World (80% + Year-1 Adders)
Sand Recovery90%78%
Annual New Sand Cost (makeup)~$5,500~$12,000
Annual O&M$15,000$19,000
Net Annual Savings~$28,600~$17,000
Simple Payback2.5 yrs (3.0 with depreciation)4.5 yrs

The Year-1 column amortizes one commissioning SCC event ($3,000–$5,000) and one mid-range mechanical intervention ($7,500) into the first operating year; recurring O&M is shown separately.

On a 400-cow operation with working capital and a stable milk-quality baseline, a 4.5-year payback is manageable. On a 250-cow operation at $12/ton sand — the number McLanahan itself runs for the SMS12 — it’s tighter. The fixed-cost burden doesn’t scale down the way gross savings do. That’s why McLanahan positions the SMS12 “for dairies with 500 cows or less” but emphasizes site design requirements right alongside herd size.

The $85K Lie: What the Dealer Quote Actually Leaves Off

The $85,000 capital figure is the illustrative anchor for a 400-cow-class SMS12 installation. On most retrofits, it’s also the number that dies first.

Separator quotes cover the unit and often the dewatering screen. They frequently don’t cover the things that let the unit actually run. On a 400-cow retrofit, the soft costs that show up between “signed quote” and “commissioning day” routinely include:

  • Three-phase power at the manure stack. Single-phase service at that end of the yard means either a rotary phase converter or a utility line extension. Realistic band: $5,000–$15,000, site-dependent. 
  • Covered sand storage. The 12% moisture target McLanahan specs after the dewatering screen doesn’t hold if the stockpile sits under an open sky through a wet October. A roof and pad for recovered sand storage runs roughly $15,000–$40,000 depending on footprint and whether an existing commodity bay can be repurposed.
  • Alley fall and gravity conveyance modifications. Systems designed around four feet of fall need exactly that. Retrofits into flatter barns may require a reception pit, transfer pump, or plumbing rework.
  • Water supply for the sand-lane flush cycle. On farms already running at well capacity in August, this is a real engineering conversation, not a line item.
  • Electrical panel upgrade. A dewatering screen, transfer pumps, and the separator can push an older service past rated capacity.
  • Permits, engineering, and nutrient management plan updates. State rules vary. A separator changes manure-solids chemistry, which can trigger plan revisions before it triggers anything in the bulk tank.

A realistic “all-in” anchor for a 400-cow retrofit isn’t $85,000. It’s $85,000 plus whatever your site needs to actually run the equipment. Anchor your lender model to a live, anonymized vendor quote that prices electrical, storage, and civil work separately. If any of those lines come back as “TBD,” treat “TBD” as the upper end of the ranges above until proven otherwise.

Should You Switch From New Sand to Recycled Sand on a 400-Cow Herd?

Rowbotham and Ruegg’s 2016 work also documented that new sand generally carries fewer Gram-negative bacteria than recycled sand, and that clinical mastitis incidence rates across bedding types didn’t differ significantly — at least when management held steady.

That “when management held steady” clause is doing a lot of work.

What “In Spec” Actually Looks Like vs. What “Drifted” Looks Like

McLanahan’s own dewatering screen specifications give you a concrete measuring stick.

ParameterRaw Recycled Sand (Pre-Screen)In-Spec After Dewatering ScreenDrifted / Red-Flag
Moisture content~20%~12%>15%
Organic matter contentElevated<1%>1.5%
Visible characterDamp, darker, organic finesGranular, lighter, sand-likePack-y, stains the hand, sour smell
Stall behaviorCompacts, holds moistureGrooms like new sandCows bed short, rear legs stay wet

The in-spec column is what the equipment can deliver. The drifted column is what shared-duty labor often delivers three months in. The middle column isn’t automatic. It’s the output of someone owning the process.

A 2021 Wisconsin microbiota study in Animals (“Assessing the microbiota of recycled bedding sand on a Wisconsin dairy farm”) found bacterial community composition in recycled sand shifts significantly with both season and recycling stage. Leite et al. tied bedding moisture to clinical mastitis incidence and coliform counts to subclinical mastitis prevalence.

When moisture rises and organic content climbs, the bacterial envelope in the stall shifts with it. The separator’s still working. The auger still turns, sand still comes out. Working and working correctly are not the same thing — and a 400-cow operation running shared-duty labor is the most exposed to the gap between them.

What a 20,000 Cells/mL SCC Drift Actually Costs You

The Day 90 commissioning check specifies bulk-tank SCC staying within about 20,000 cells/mL of the pre-commissioning baseline. That sounds small. On a 400-cow herd, it isn’t.

Working with round but honest inputs: 400 cows averaging roughly 87.5 lbs/day ships 35,000 lbs (350 cwt) of milk per day. If an SCC drift costs that herd a $0.20/cwt quality premium step on a processor’s tiered schedule — a common band in published mailbox premium — the arithmetic is direct:

That’s $25,550 of premium lost, every year the drift persists — against a stressed-case net savings of roughly $17,000. The lost premium alone is larger than the Year-2 net savings. It doesn’t just stretch the payback period. It inverts it.

And that’s before a single Klebsiella cow goes down, before a single treatment cost, before a single withheld-milk day.

Plug in your own $/cwt step when you run this for your operation. The arithmetic doesn’t change. What changes is how quickly the separator stops being an asset on your balance sheet.

Is This an ROI Play — or an Insurance Play?

That’s the framing shift Northeast producers have to make before they run the same math a Midwest operation does.

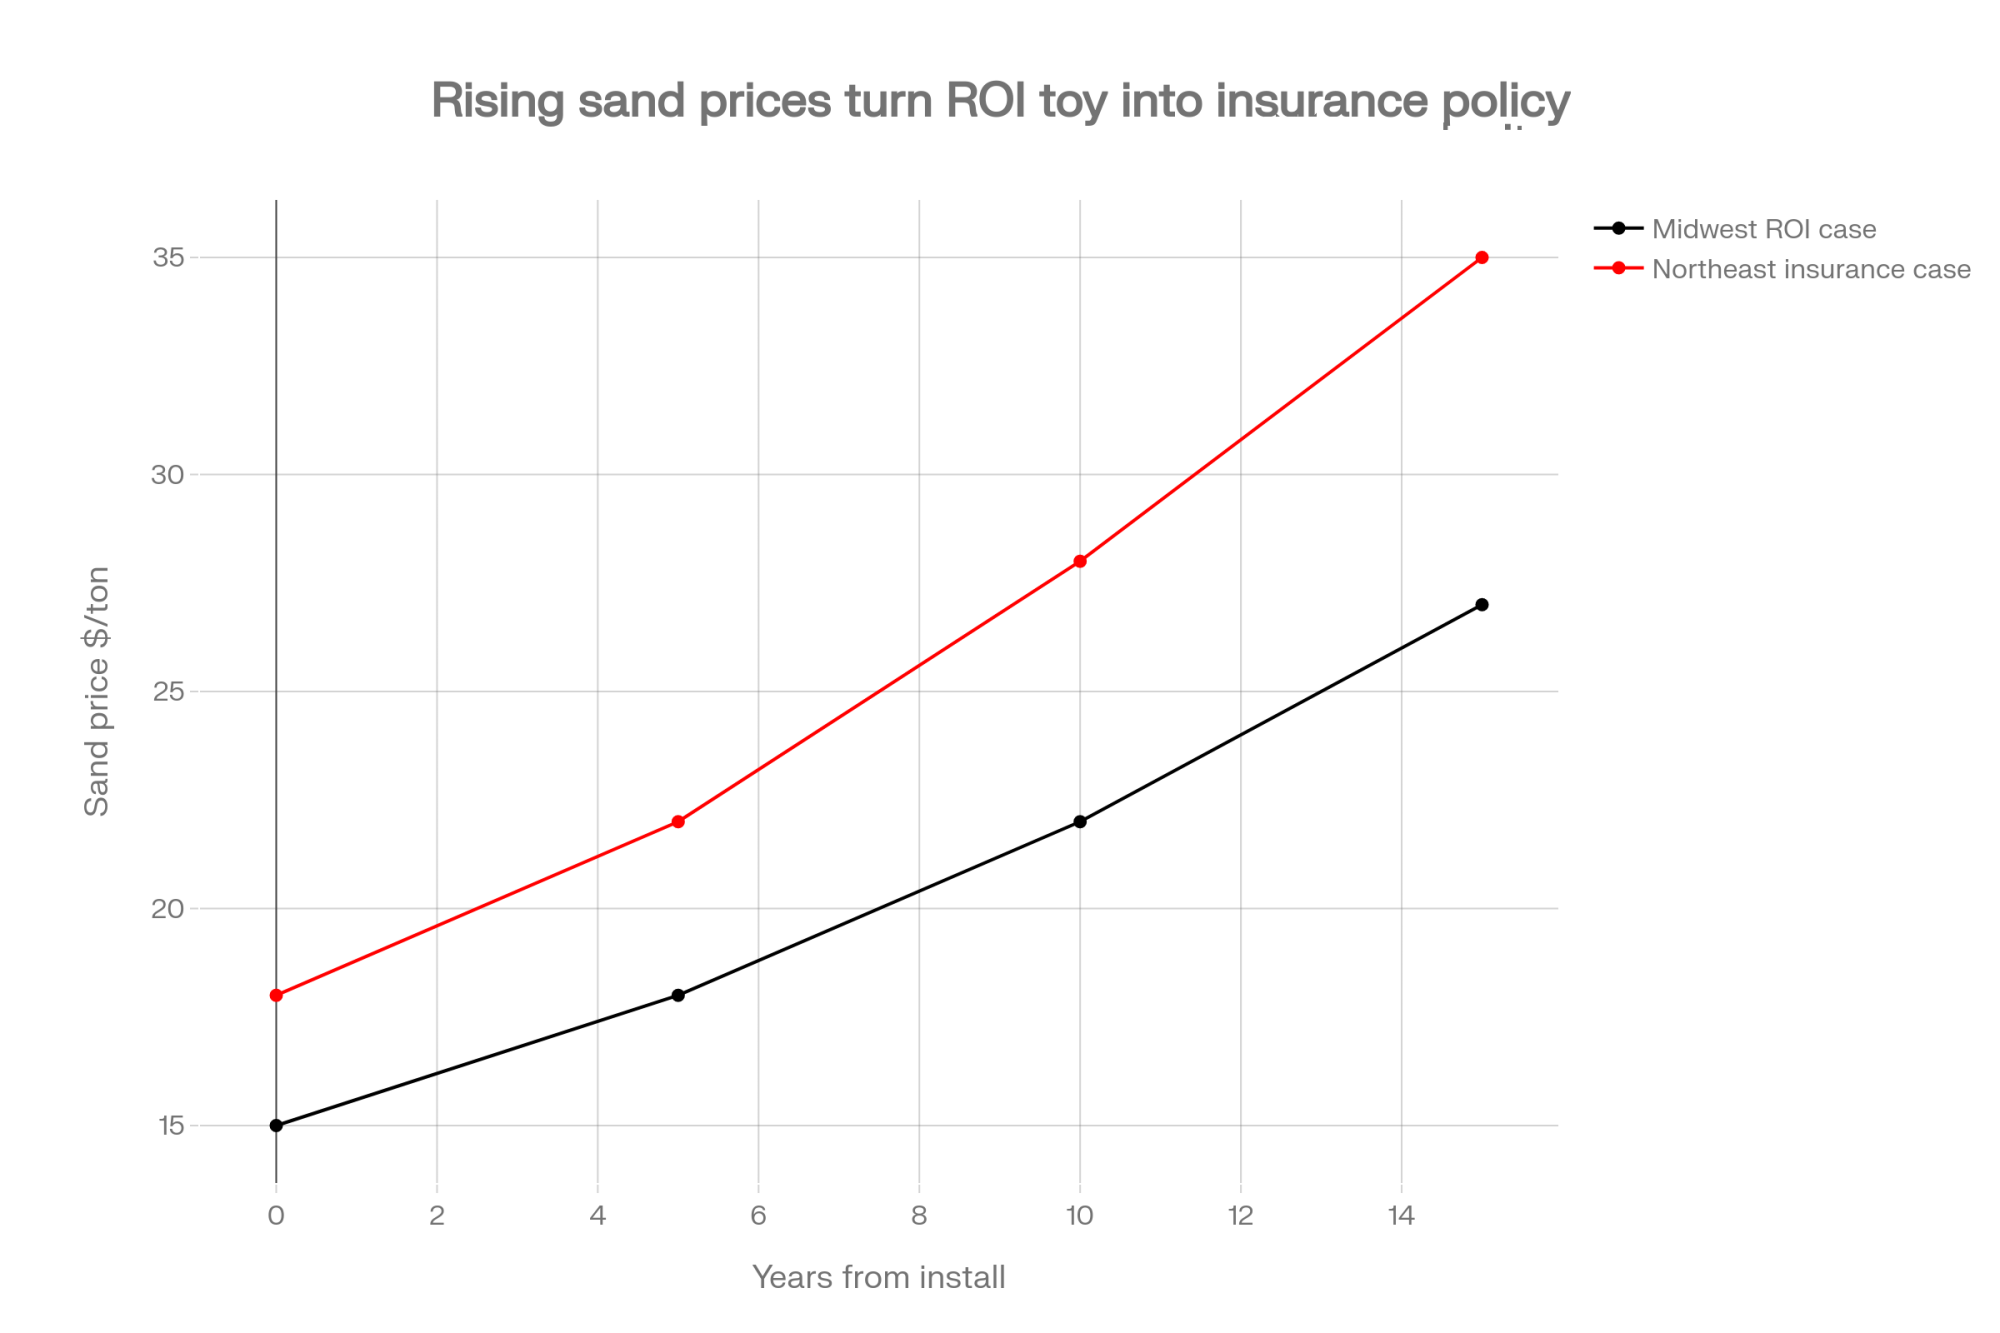
In the Midwest, the SMS12 is usually an ROI play: a capital investment that pays back through reduced new-sand purchases, evaluated against a relatively stable regional sand market. In the Northeast, it’s increasingly an insurance play: capital that hedges a structural supply problem, evaluated against a rising input price trajectory. Same equipment. Different thesis. Different lender conversation.

The 2017 SARE-funded bedding study by Smith, Simms, and Aber (“Case Study: Animal bedding cost and somatic cell count across New England dairy farms”) surveyed 129 producers and documented a 70% real-dollar increase in bedding costs between 2003 and 2013 — conventional dairy costs rose from /cow/year to 4/cow/year, and organic operations from to 5. That trajectory hasn’t reversed. Quarry consolidation, construction demand, and 30×50 silica sand specifications keep pinching supply.

Some Northeast producers find themselves dependent on a single quarry relationship, and a closure or disruption pushes them quickly into the spot band.

Against a conservative 4% annual sand-price inflation from $18/ton — and the SARE numbers are anything but alarmist by that standard — the separator’s Year 10 economics shift sharply in its favor. That case has to be made explicitly to the lender. A base-case payback model isn’t built to carry a 15-year rising-input assumption. If you can’t justify the SMS12 as an ROI play at today’s contract prices, you may still be able to justify it as an insurance play against the next decade of them.

THE HARD TRUTH

If your morning feeder is also your “Separator Manager,” your recovery rate is 75%, not 93%. The machine is automated. The consistency isn’t. If you don’t have someone on the payroll who treats sand dryness like a religion, stay with new sand.

The 30/90/365 Commissioning Playbook

Every separator investment should come with three audit dates baked into the loan conversation before commissioning day. Not after.

Day 30 — Is the Machine Working?

Three cheap measurements. None requiring a consultant.

  • Dry matter of recovered sand: target 35–40%
  • Organic matter content: target below 1.5%; McLanahan’s spec with a dewatering screen is below 1%
  • Sand recovery rate: target 90–95%, per NRCS Practice Standard 632

Day 90 — Is the System Working?

This is where commissioning drift shows up in the data.

  • Bacterial counts on fresh recovered sand and on used bedding from the back third of occupied stalls. Extension management guidance and Cornell field research point to a 300,000 cfu/g target and a 1,000,000 cfu/g red-flag line. 
  • Testing cost (2025 Cornell AHDC): BEDID1 environmental bacterial quantification at $48 per sample plus an $8 accession fee — roughly $50–$75 per sample all-in.
  • Bulk tank SCC check: within about 20,000 cells/mL of the pre-commissioning baseline. Drift beyond that at Day 90 is a management or mechanical signal, not a commissioning artifact — and on a 400-cow herd, it’s the $25,550/year problem from the section above until you fix it.

Day 365 — Is the Investment Working?

This is the conversation you want with your lender — not a surprise at refinancing.

  • Reconcile actual new sand purchased, actual O&M costs, and actual milk quality premium capture against the loan application projections.
  • Within 15% of projection: healthy; stay the course.
  • Shortfall of 25% or more: systematic problem requiring management intervention, not an assumption that Year 2 will be better on its own.

Operations that only run Day 30 informally tend to miss the drift that shows up between months three and six. That’s where the gap between projection and reality opens up. Cornell’s long-term performance came out of a facility where the system was the dedicated focus of staff. On a shared-duty operation, that focus erodes in inches.

Four Paths and What They Each Actually Cost You

Path / StrategyWhen It Actually WorksTypical Bedding Cost Band ($/cow/yr)Red-Flag Situation (Don’t Do This)
New sand, optimize what you haveDelivered sand under ~$12/ton; barn not designed for recycling; tight labor~80–110Installing SMS12 just to “keep up with neighbors”
Recycled sand, purpose-designed system400+ cows; $16+/ton sand; dedicated separator operator and good ventilation~65–90Retrofits with <4 ft fall or no covered storage
Recycled sand as supply hedgeNortheast herds at $18–24/ton with single quarry dependence~90–120Treating it as a 2.5‑year ROI play instead of insurance
Wait, stay on new sand until renovationCurrent barn geometry wrong; renovation or expansion already on the horizon~100–140Sinking capex into separator before fixing the barn design

Path 1: New sand, optimize what you have. Works when delivered sand is under $12/ton, the barn lacks adequate fall or ventilation for recycling, or the labor structure can’t absorb a dedicated daily protocol. If you’re already under $100/cow in bedding, separator capex probably doesn’t survive honest stress-testing.

Path 2: Recycled sand, purpose-designed integration. Works when sand is $16+/ton, herd size is 400+, and you can assign dedicated operator time — not bolt it onto someone’s morning route. Requires written daily protocols, monthly bacterial testing at Cornell AHDC 2025 rates, and a backup supplier relationship locked in before commissioning day. Where it backfires: retrofits into barns with under four feet of fall, curtain-sided structures with weak summer ventilation, and indoor covered sand storage that traps moisture in the pile.

Path 3: Recycled sand as a supply hedge, not a cost savings play. The Northeast case. At $18–24/ton with single-supplier risk, evaluate the separator as a 15-year input supply investment, with the math running against a rising price trajectory rather than today’s contract price.

Path 4: Keep buying new sand until the barn catches up. Works when current infrastructure isn’t suited to recycling but a renovation or expansion is already on the horizon. Cornell’s 93% came from a facility designed around the system, not retrofitted into one. Waiting, doing the renovation right, and then buying the separator isn’t a failure of ambition. Sometimes it’s the sharper capital sequence.

Your Next 30 Days

Pull your sand delivery invoices for the last 24 months and calculate your actual per-cow bedding cost. Compare it to the $110–$137 band typical at $12–15/ton delivered. Then pull your last two bulk-tank SCC reports and your last DHI cull reason summary, and mark the cows in stalls 1–10 that you cannot afford to lose to a bedding event. That single hour tells you which of the four paths is yours before a dealer sets foot on the place.

What This Means for Your Operation

  • Before you call a dealer: if this system runs at 80% of projected performance for two years, can your operation absorb that financially and still say yes? If the answer makes you flinch, the more defensible decision is to stay with new sand and harden your supplier relationships.
  • Run your actual delivered sand price against the threshold bands: under $10/ton, almost certainly no; $10–14/ton, only with dedicated labor and a strong milk quality premium structure; $16+/ton, the economics work if the barn supports it.
  • Audit three fixed barn factors before any other conversation: alley fall, ventilation design, and covered storage location. These predetermine the bacterial envelope your recycled sand lives inside before the operator ever touches it.
  • Price the soft costs separately: three-phase power, covered storage, alley fall modifications, permits, panel capacity. If any sit on “TBD,” assume the upper end of published ranges in your lender model.
  • Price the genetic exposure separately: a single Klebsiella cull on a high-pedigree cow in Month 3 can cost more than the first year of net separator savings. Account for it in your stressed case, not your base case.
  • Build the lender conversation around a stressed-case cash flow model — 78% recovery, one commissioning SCC event, $4,000 O&M overage — not the base case. Post-2020 agricultural lending practice has tightened DSCR floors and rate-sensitivity assumptions; confirm specifics with your Farm Credit branch or equivalent before signing.
  • If separator management will be an “added duty” rather than a primary assignment, haircut your projected net savings by 20% before comparing payback. 

Key Takeaways

  • If delivered sand is under $12/ton and your barn wasn’t designed for recycling, the separator probably doesn’t pencil honestly — regardless of what the base case says.
  • If you’re in the Northeast at $18+/ton with single-supplier risk, evaluate the SMS12 as an insurance play, not an ROI play. The SARE 2003–2013 data already showed a 70% real-dollar cost increase. Nothing about the last decade suggests that direction has changed.
  • If your barn has under four feet of fall, curtain-sided summer ventilation, or indoor covered sand storage, fix the barn first. Cornell’s 93% and SwissLane’s 90% both came from facilities designed to support the system. No operator skill compensates for the wrong infrastructure.
  • If separator operation will be an added duty on top of an existing workload, haircut projected savings by 20% in your own model. It’s not pessimism — it’s what the commissioning record shows.
  • If your 400-cow herd carries a pedigree nucleus, one preventable Klebsiella cull in commissioning can erase a full year of separator savings — and the genetic progress behind the cow you just put on the trailer.
  • If you can’t answer the 80% question with a clear yes, keep the $85,000 and buy three years of new sand instead. Sometimes that’s the sharper capital decision.

The spreadsheet on your kitchen table shows the base case. Cornell’s team didn’t just run the base case — they built the system, staffed it, measured it at 30 days, 90 days, and every week for years. That’s why their long-term average is 93%. The question for your operation isn’t whether McLanahan builds a system that performs. They do. The question is whether your barn, your labor, and your balance sheet are set up to capture that performance — and what happens to your milk cheque, and the cow in stall 47, in Year 1 if they aren’t. Does your current payback model have a cell for that answer?

This article draws on McLanahan’s published Cornell and SwissLane case studies, the cited peer-reviewed research, and public technical material. McLanahan, Cornell Teaching Dairy Barn, and SwissLane Dairy were not interviewed directly for this piece.

Learn More

  • What Type of Bedding is Best for Cows? — Evaluate the microbial thresholds and cost-per-cow shifts that signal it is time to pivot your bedding strategy. Arms you with the benchmarks to decide if sand still pencils against rising regional commodity prices.
  • Why Cow Comfort is a Competitive Advantage — Position your dairy for the next decade by leveraging stall environment as a strategic production asset. Exposes how superior comfort secures cow longevity and maximizes the genetic potential of your elite herd.
  • How to Make Sand Bedding Work in Your Robotic Dairy — Bridge the gap between sand comfort and robotic milking hardware without risking machine downtime. Delivers the technical blueprints for managing silica’s abrasive wear while maintaining the gold standard in cow cleanliness.

The Sunday Read Dairy Professionals Don’t Skip.

Every week, thousands of producers, breeders, and industry insiders open Bullvine Weekly for genetics insights, market shifts, and profit strategies they won’t find anywhere else. One email. Five minutes. Smarter decisions all week.
NewsSubscribe
First
Last
Consent

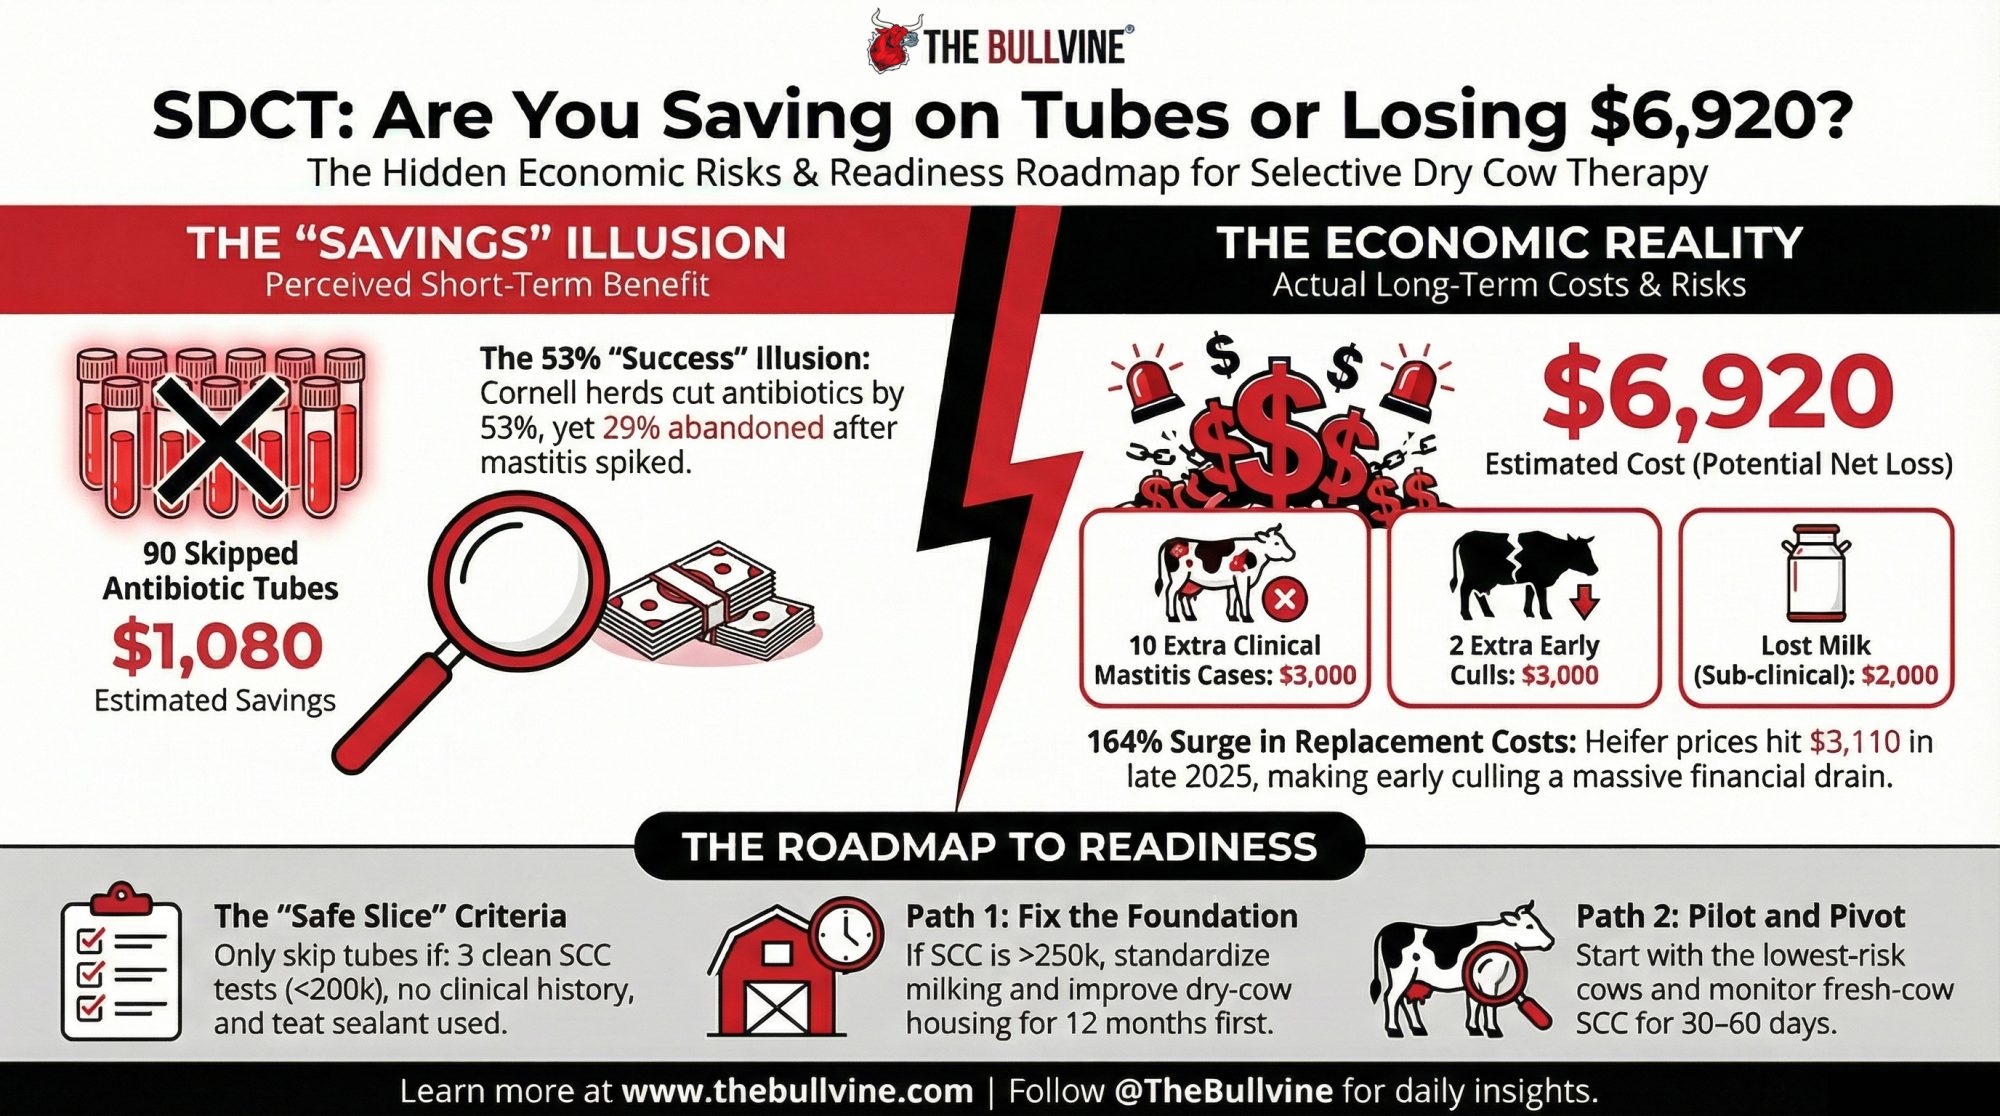
Selective Dry Cow Therapy at 240,000 SCC: Are You Saving on Tubes or Losing $6,920?

Seven of Cornell’s 24 SDCT herds bailed on the program once their fresh‑cow mastitis numbers hit the fan. Before you join them, you’d better know which group you’re in.

Executive Summary: Herds trying selective dry cow therapy at 240,000 SCC can easily turn “antibiotic savings” into a $6,920 loss on 300 cows once extra mastitis, culls, and lost milk are in the math. Cornell’s 24‑herd SDCT project cut dry‑cow antibiotic use 53% on average, but 7 herds still abandoned SDCT when fresh‑cow mastitis and milk quality slipped. Dutch data shows dairy can cut antimicrobial use roughly 47% without wrecking udder health, but only after years of tightening SCC, housing, and protocols. This piece lays out three realistic paths for higher‑SCC herds under processor pressure: fix infections first, pilot SDCT on the safest slice only, or use that SDCT letter as leverage for a 12–18‑month runway. You’ll see the exact SCC thresholds, AABP readiness criteria, and barn‑math assumptions so you can plug in your own DHIA and cull numbers. If your bulk tank’s been north of 200,000 and your mastitis records are patchy, you’ll likely walk away treating SDCT as a future goal, not a box to tick this dry‑off season.

selective dry cow therapy

When The Bullvine first profiled Mystic Valley Dairy’s move to selective dry cow therapy, one detail jumped off the page: a bulk tank somatic cell count around 78,000 cells/mL and a decision to start skipping dry‑cow tubes on some cows anyway.

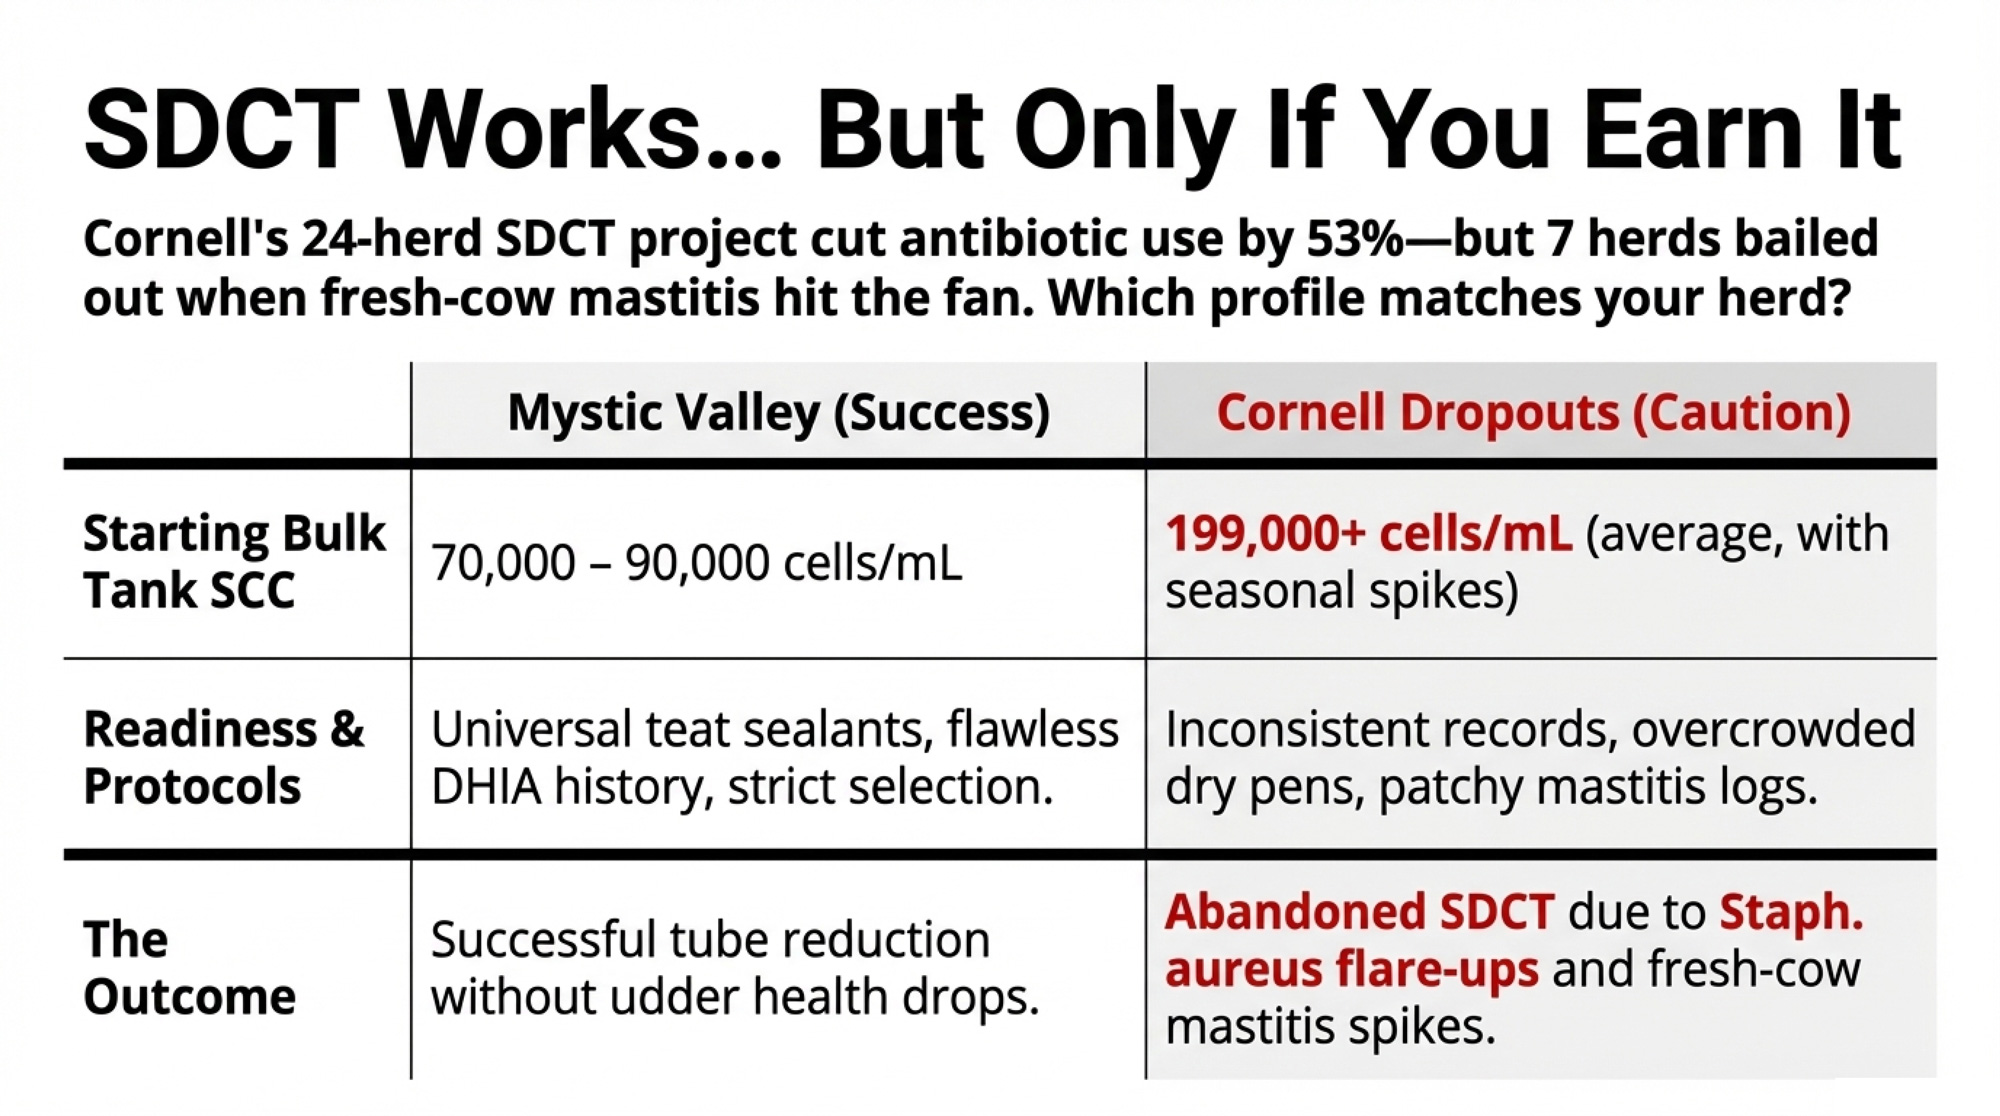
Around the same time, Cornell’s Quality Milk Production Services team was quietly tracking 24 New York herdsthrough their own SDCT transition. Those farms averaged 199,000 cells/mL SCC going in and still managed to cut dry‑cow antibiotic use by 53% on average (range: 32–78%) without wrecking udder health. Put those two stories beside a 240,000‑SCC herd with a processor letter on the kitchen table, and the contrast gets real fast.

Mystic Valley’s SDCT Story: Low SCC, High Scrutiny

Mystic Valley Dairy, Sauk City, Wisconsin, milks about 450 registered Holsteins, with a bulk tank SCC typically ranging from 70,000 to 90,000 cells/mL. In The Bullvine’s earlier coverage, owner Mitch Breunig laid out why a herd with that kind of SCC profile would even consider cutting dry‑cow tubes.

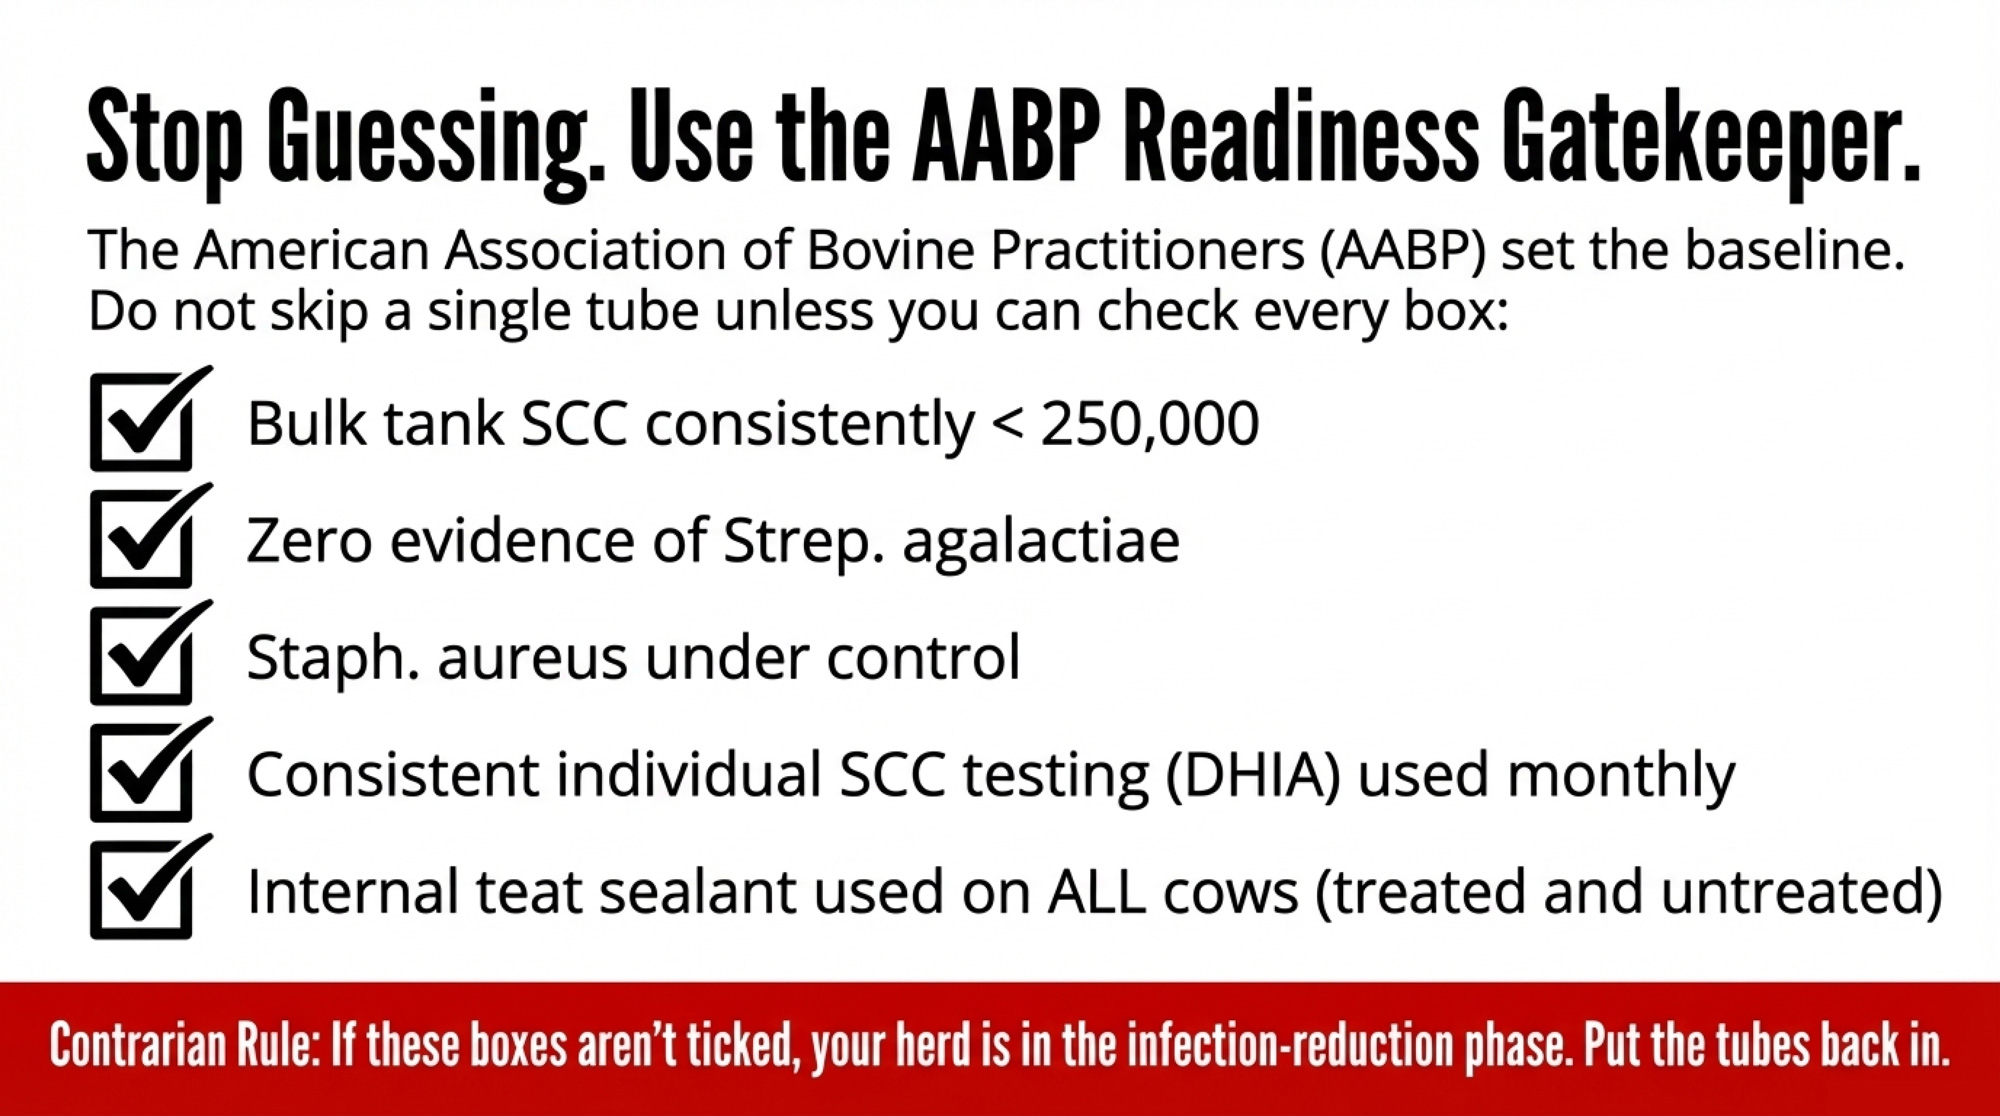
Mystic Valley already ticked every box in the 2024 AABP SDCT readiness guidelines and then some: bulk tank SCC regularly less than 250,000; no evidence of Streptococcus agalactiae; Staphylococcus aureus under control; consistent individual SCC testing; written milking and dry‑off SOPs; and internal teat sealant at dry‑off for all cows. On paper, they looked a lot like the 12 Flemish herds in Lipkens, Piepers, and De Vliegher’s 2023 trial, which had a geometric mean bulk tank SCC of 145,000 cells/mL at enrollment (range: 84,000–195,000; median 157,000) and used teat sealants on every dry cow.

Mystic Valley’s criteria were conservative from the start: cows needed three straight SCC tests under 200,000, no clinical mastitis during the lactation, no flagged problem quarters, and a good‑eyes‑on udder check at dry‑off before they were considered for sealant‑only treatment. Everyone else stayed on full dry‑cow therapy plus sealant.

Even in that low‑SCC, well‑run context, Mystic Valley still saw some early‑lactation cows whose performance raised eyebrows. Those early outcomes led the farm and its vet to tighten criteria further and pay closer attention to which cows truly belonged in the sealant‑only column.

The point isn’t that SDCT was easy for them. It’s that they were operating from a starting point — and with protocols — most 240,000‑SCC herds don’t have yet.

Cornell’s 24 SDCT Herds: 53% Fewer Tubes, Not for Everyone

If Mystic Valley shows what SDCT looks like on a very low‑SCC herd, Cornell’s New York project shows what happens when you put it into a broader mix of operations.

Readiness factorMystic Valley Dairy240,000‑SCC herd under pressure
Bulk tank SCC (cells/mL)70,000–90,000; long‑term <150,000240,000+; bounces 230,000–280,000
Individual SCC data3 consecutive tests <200,000 required for SDCT cowsPatchy DHIA; high‑SCC cows not consistently flagged
Contagious pathogensNo Strep. ag; Staph. aureus under controlStaph. aureus “suspected” or intermittently cultured
Dry‑off protocolWritten SOP; one named dry‑off lead; sealant for all cowsShared between milkers; protocol drift between shifts
Teat sealant use100% of dry cows receive internal teat sealantUsed on “problem cows” only or inconsistently
Housing & dry pensStocking density and bedding managed; low overcrowding (implied by low SCC)Overcrowded, wetter pack; limited capital for upgrades
AABP 2024 SDCT checklistTicks every box and moreFails multiple criteria; SDCT pushed by processor, not data

Potter, Forrestal, Capel, and Nydam’s 2022 AABP paper followed 24 commercial dairy farms across New York State. Herd sizes ranged from 65 to 3,774 cows, averaging 985 cows, with a starting bulk tank SCC of 199,000 cells/mL. Farms worked with veterinarians to use individual cow SCC and mastitis history to decide who received full dry‑cow therapy plus sealant and who received sealant only, and then monitored bulk tank SCC, fresh‑cow SCC, and clinical mastitis as they transitioned.

Across those 24 herds:

  • 53% average reduction in dry‑cow antimicrobial use (individual herds ranged from 32% to 78%).
  • No consistent herd‑level spikes in fresh‑cow SCC or mastitis when SDCT was implemented inside the project’s framework.
  • 17 of the 24 farms still used SDCT at the end of the study period.
  • 7 farms stopped SDCT, citing seasonal milk‑quality challenges, more dry‑period clinical mastitis, or flare‑ups of contagious pathogens such as Staph. aureus.

Cornell didn’t treat SDCT as a universal good or an obvious mistake. They treated it as a tool that fit most of those herds — but not all — even with structured support and monitoring. For a 240,000‑SCC herd being pushed toward SDCT, that nuance matters more than the headline number.

When Selective Dry Cow Therapy (SDCT) Helps — and When It Bites

The published science lines up with what Mystic Valley and Cornell saw.

A 2000–2021 systematic review and meta‑analysis found that selective dry cow therapy can deliver udder‑health outcomes similar to blanket dry cow therapy (BDCT) while reducing antibiotic use — but only in herds with low bulk tank SCC, good mastitis control, and consistent use of internal teat sealants in untreated quarters. Winder et al. (2019, Animal Health Research Reviews) concluded that SDCT increases the risk of intramammary infection at calving compared with BDCT unless internal teat sealants are used; with sealants, IMI risk is similar across strategies.

The Lipkens trial offers a clean real‑world comparison. In those 12 Flemish herds (466 cows; 244 BDCT, 222 SDCT), all cows received an internal teat sealant at dry‑off. Total antimicrobial consumption for udder health between dry‑off and 100 DIM dropped from 1.25 defined course doses (DCD) per cow in the BDCT group to 1.06 DCD per cow in the SDCT group — a 22% reduction — with no significant differences in test‑day SCC, clinical mastitis incidence, milk yield, or culling hazard. Only 33.8% of SDCT‑group cows actually skipped antibiotic tubes at dry‑off, and that share varied widely between herds (6.2–73.9%).

At the national scale, the Dutch experience shows how far antibiotic use can fall when an entire system commits to it. The Netherlands set mandatory reduction targets starting in 2009 and banned preventive antimicrobial use — including blanket dry‑cow treatment — beginning in 2012–2013. Across all Dutch livestock, the result was a 70.8% reduction in kilograms of antimicrobials sold since 2009 (Moura et al., 2022, Frontiers in Veterinary Science). Within the dairy sector specifically, Lam et al. (2020, Pathogens) reported a 47% decline in total antimicrobial usage from 2009 to 2015, after which usage stabilized at around 3 DDDA per cow per year.

Critically, Santman‑Berends et al. (2020, Journal of Dairy Science) monitored approximately 17,000 Dutch dairy herds (about 1.67 million cows) from 2013 through 2017 and found that the ban on blanket dry‑cow therapy drove a 63% drop in dry‑cow antimicrobial usage and a 15% reduction in intramammary treatment overall — with no deterioration in udder health at the herd level. An increase in new high‑SCC cases during the dry period was expected, but as their census data showed, it was not observed.

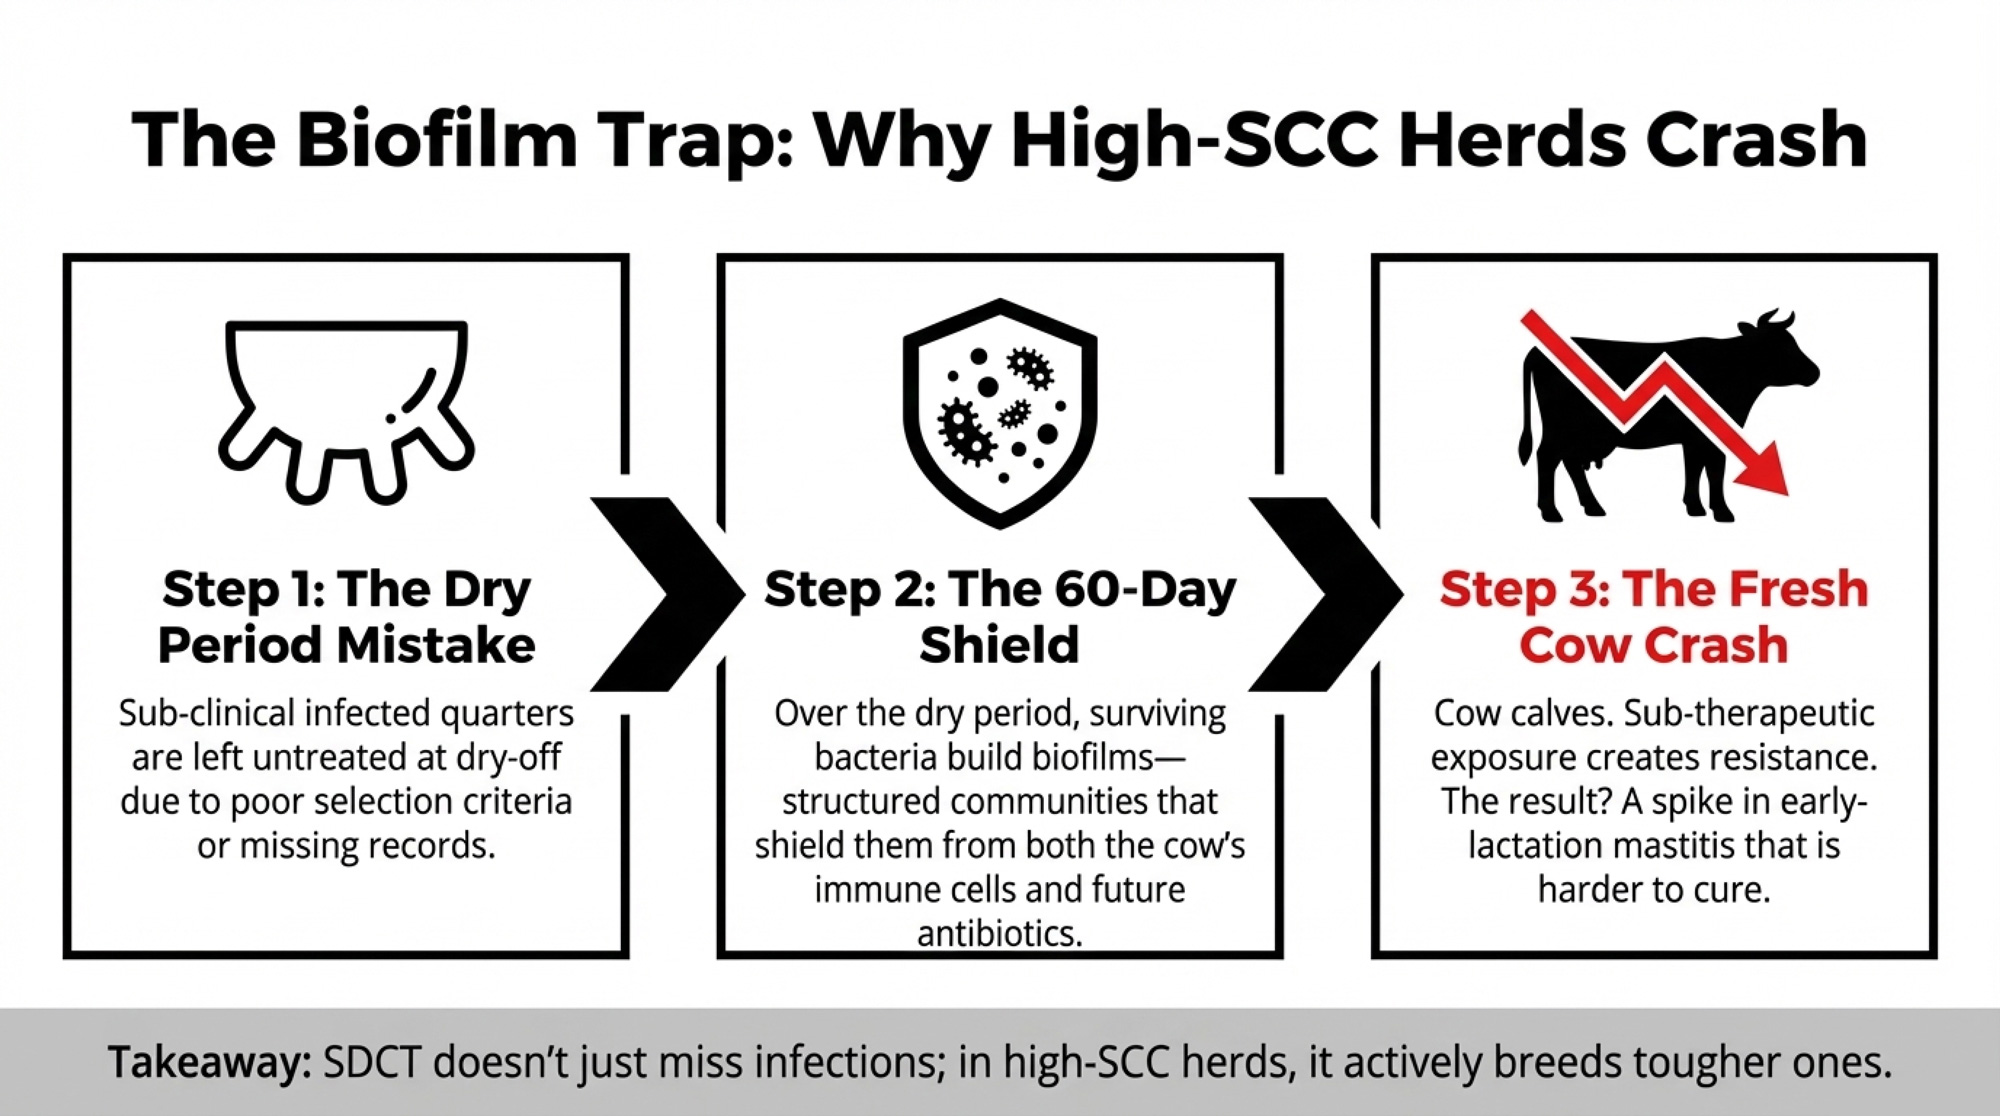
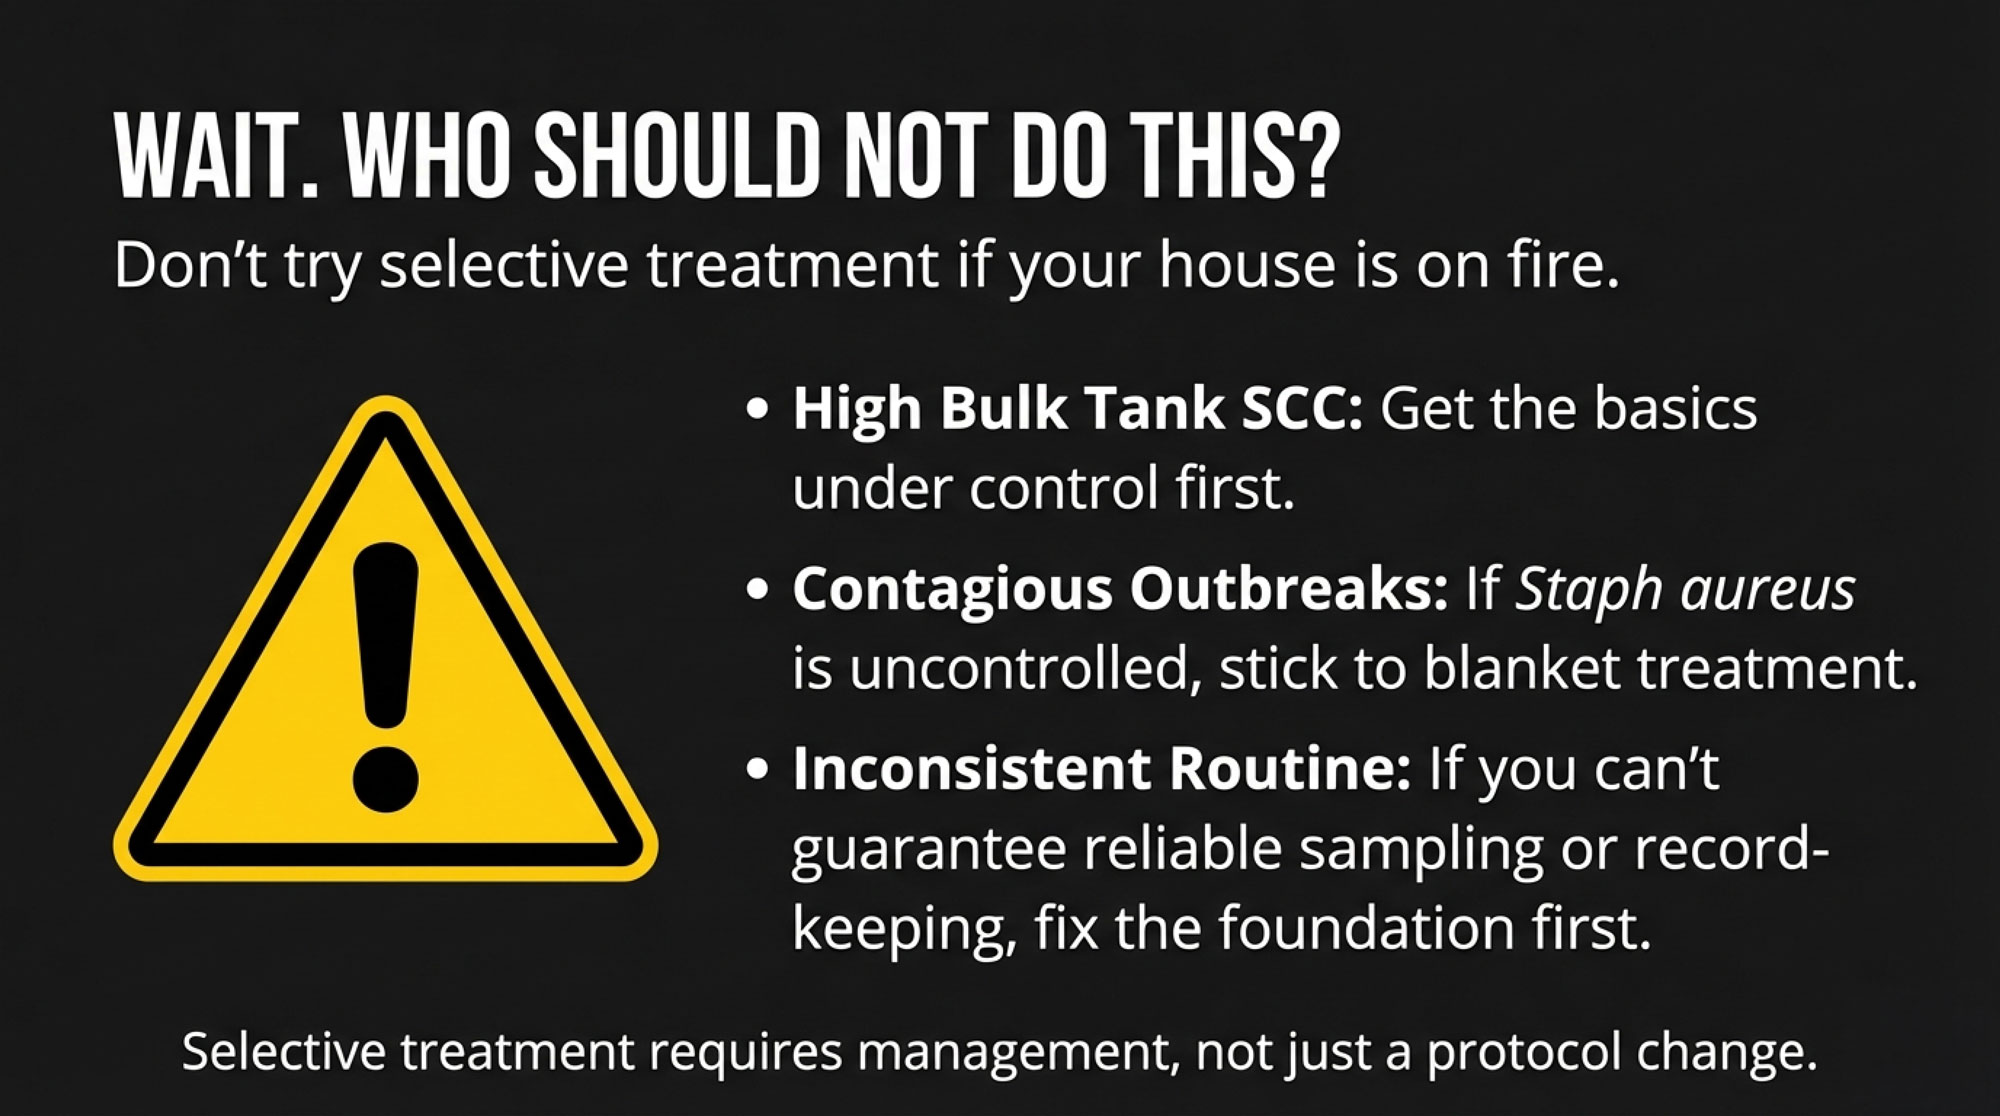
But those same studies underscore a risk that doesn’t appear in tube‑count dashboards: the biofilm and resistance trap. If infected quarters aren’t treated at dry‑off, bacteria have the entire dry period to build biofilms — structured communities that shield them from antibiotics and immune cells. Within those biofilms, resistance genes can move between bacteria more easily via plasmids and mobile DNA elements. When those cows calve and receive intermittent or incomplete lactation treatments, sub‑therapeutic exposure becomes a selection program for resistance.

For low‑SCC herds with solid protocols, that risk is manageable. For a 240,000‑SCC herd with inconsistent records or overcrowded dry pens, it’s a much easier trap to fall into.

Can a 240,000‑SCC Herd Really “Save” on SDCT?

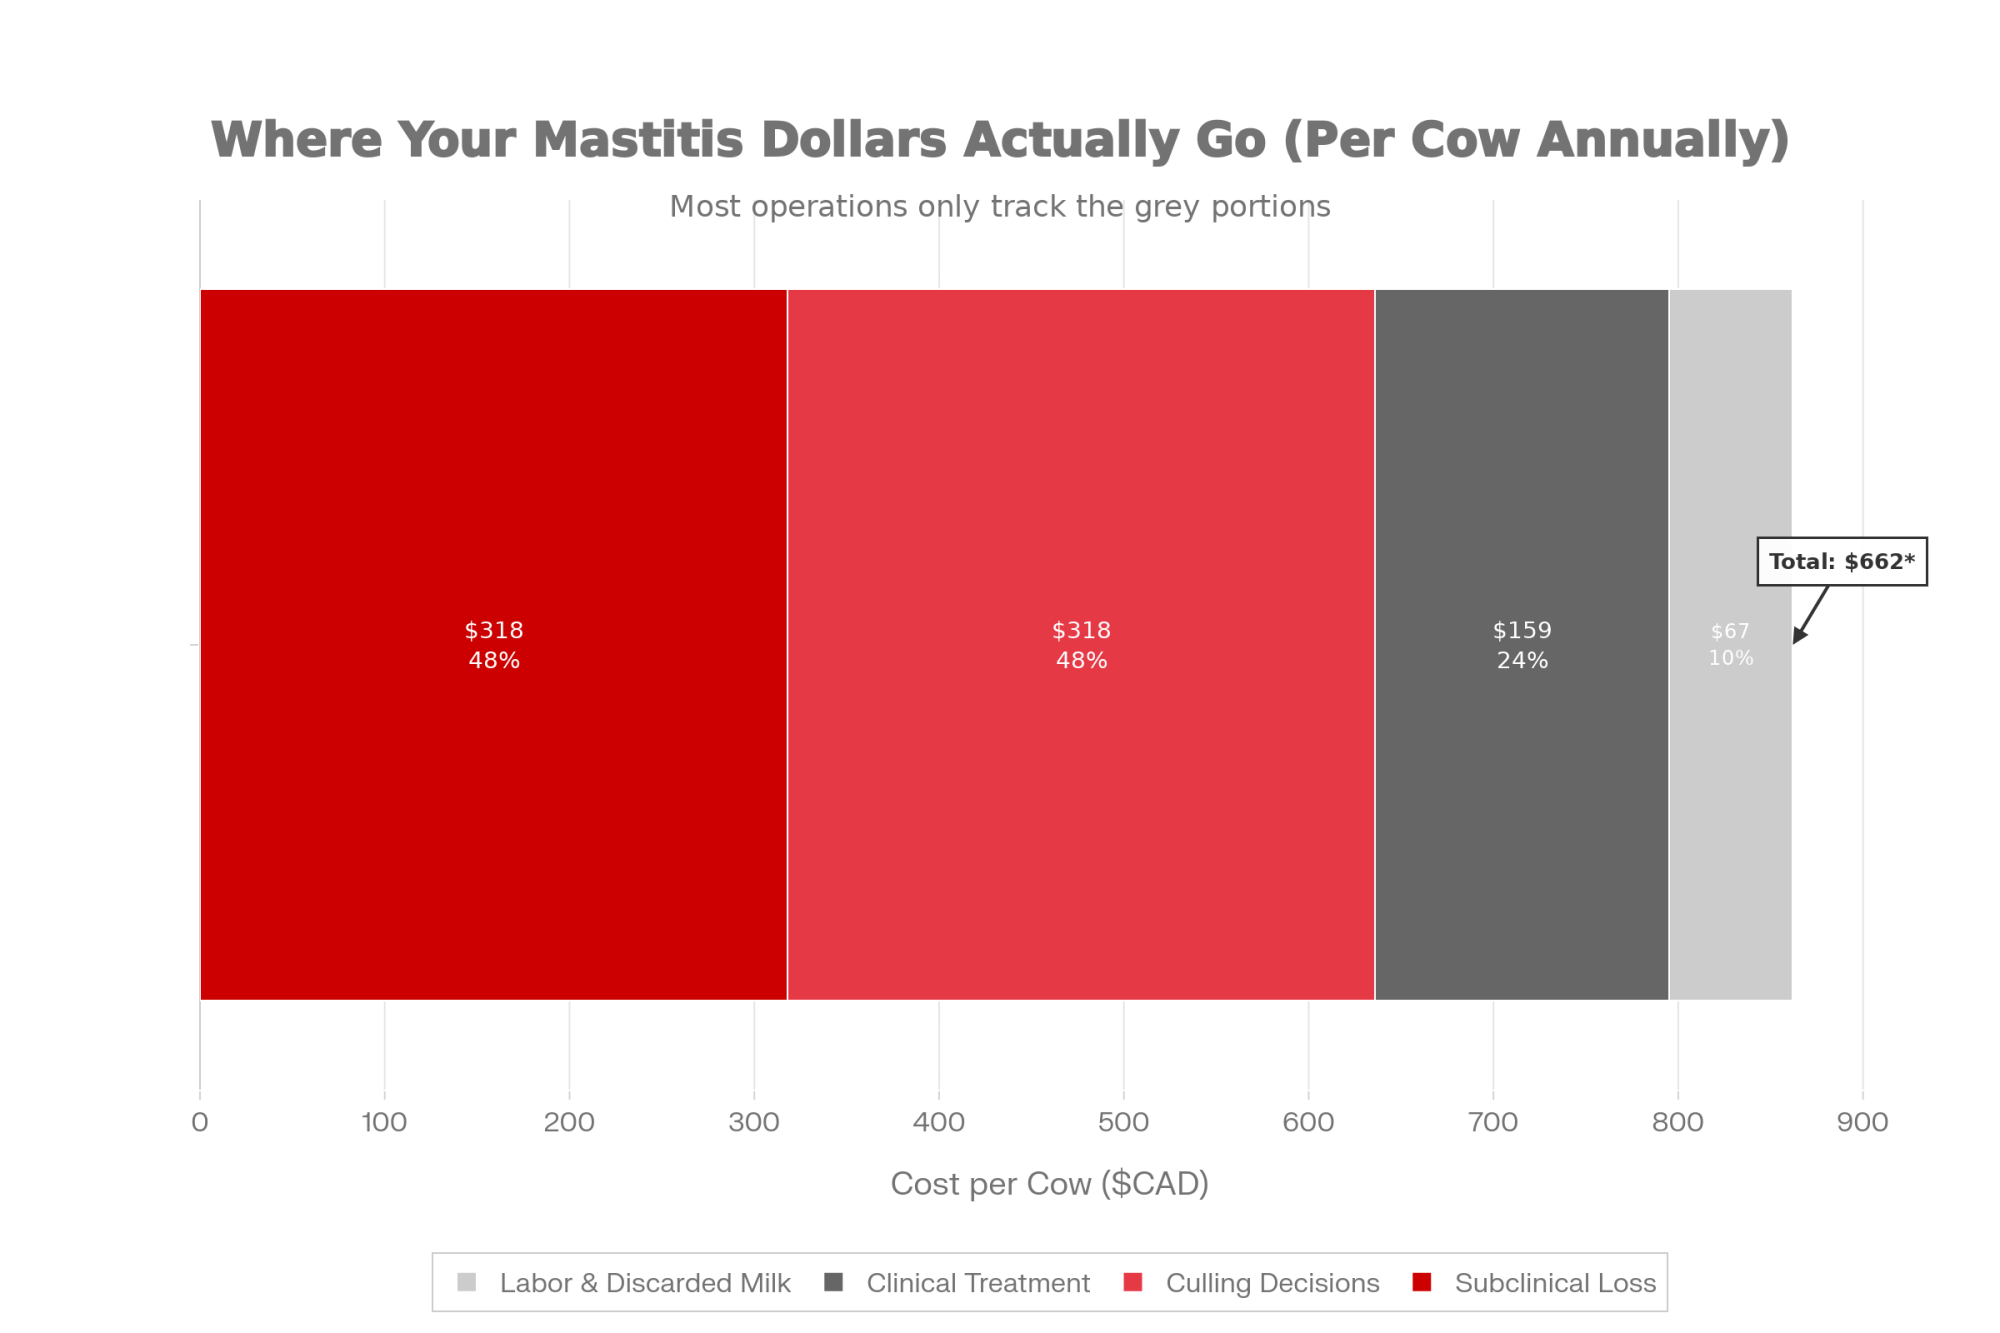
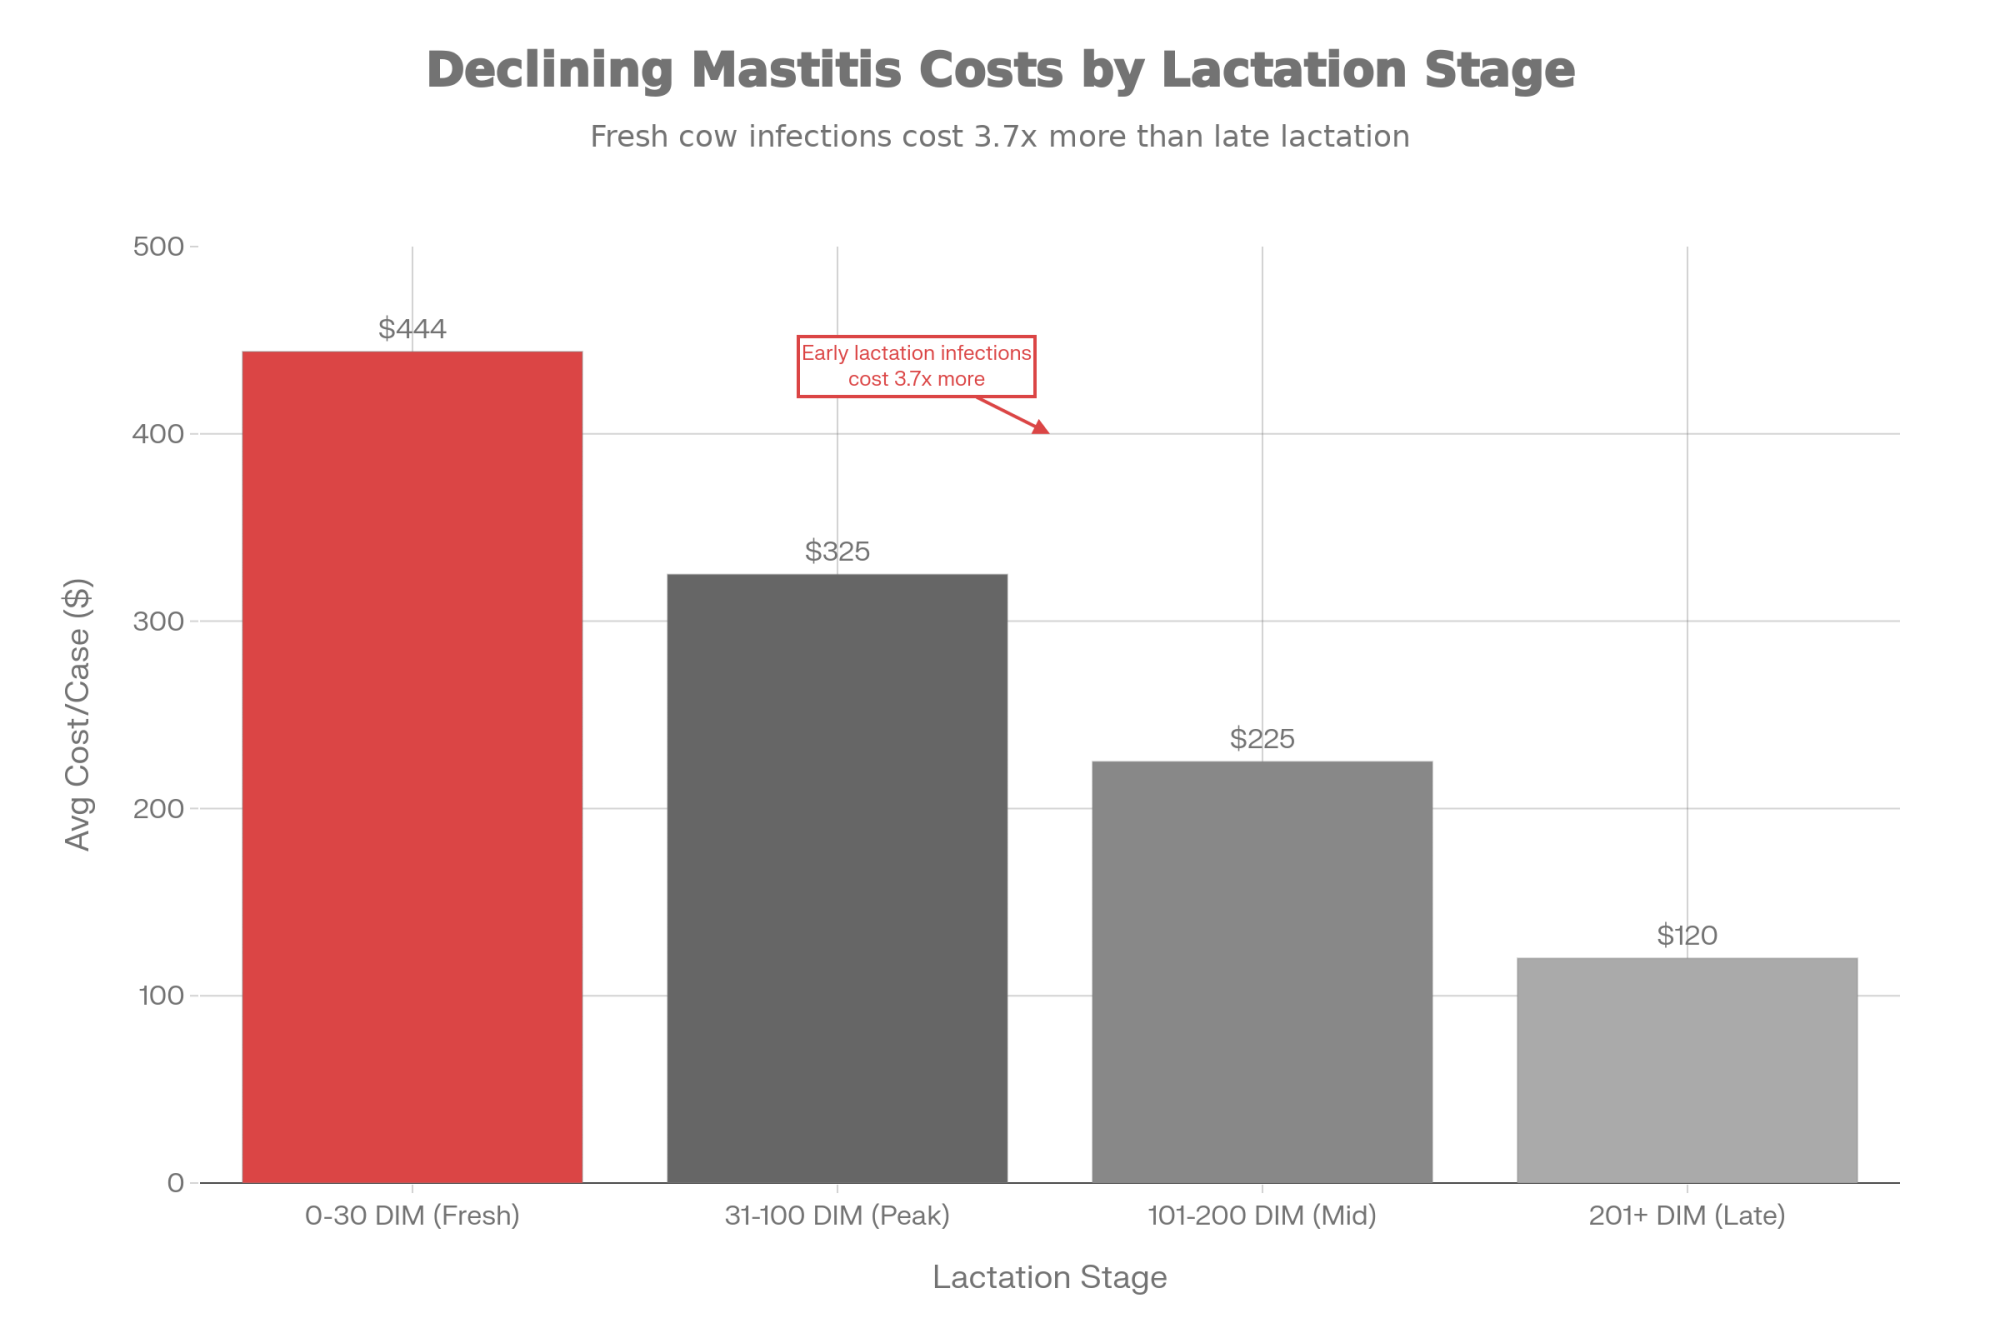
Rollin, Dhuyvetter, and Overton (2015, Preventive Veterinary Medicine) estimated the total cost of a single clinical mastitis case in the first 30 DIM at approximately $444 per case, including lost production, treatment, discarded milk, labour, and culling risk. Other work puts direct costs closer to $120 per case, making a $120–$444 range across studies reasonable.

Replacement economics have shifted just as sharply. CoBank and USDA data show:

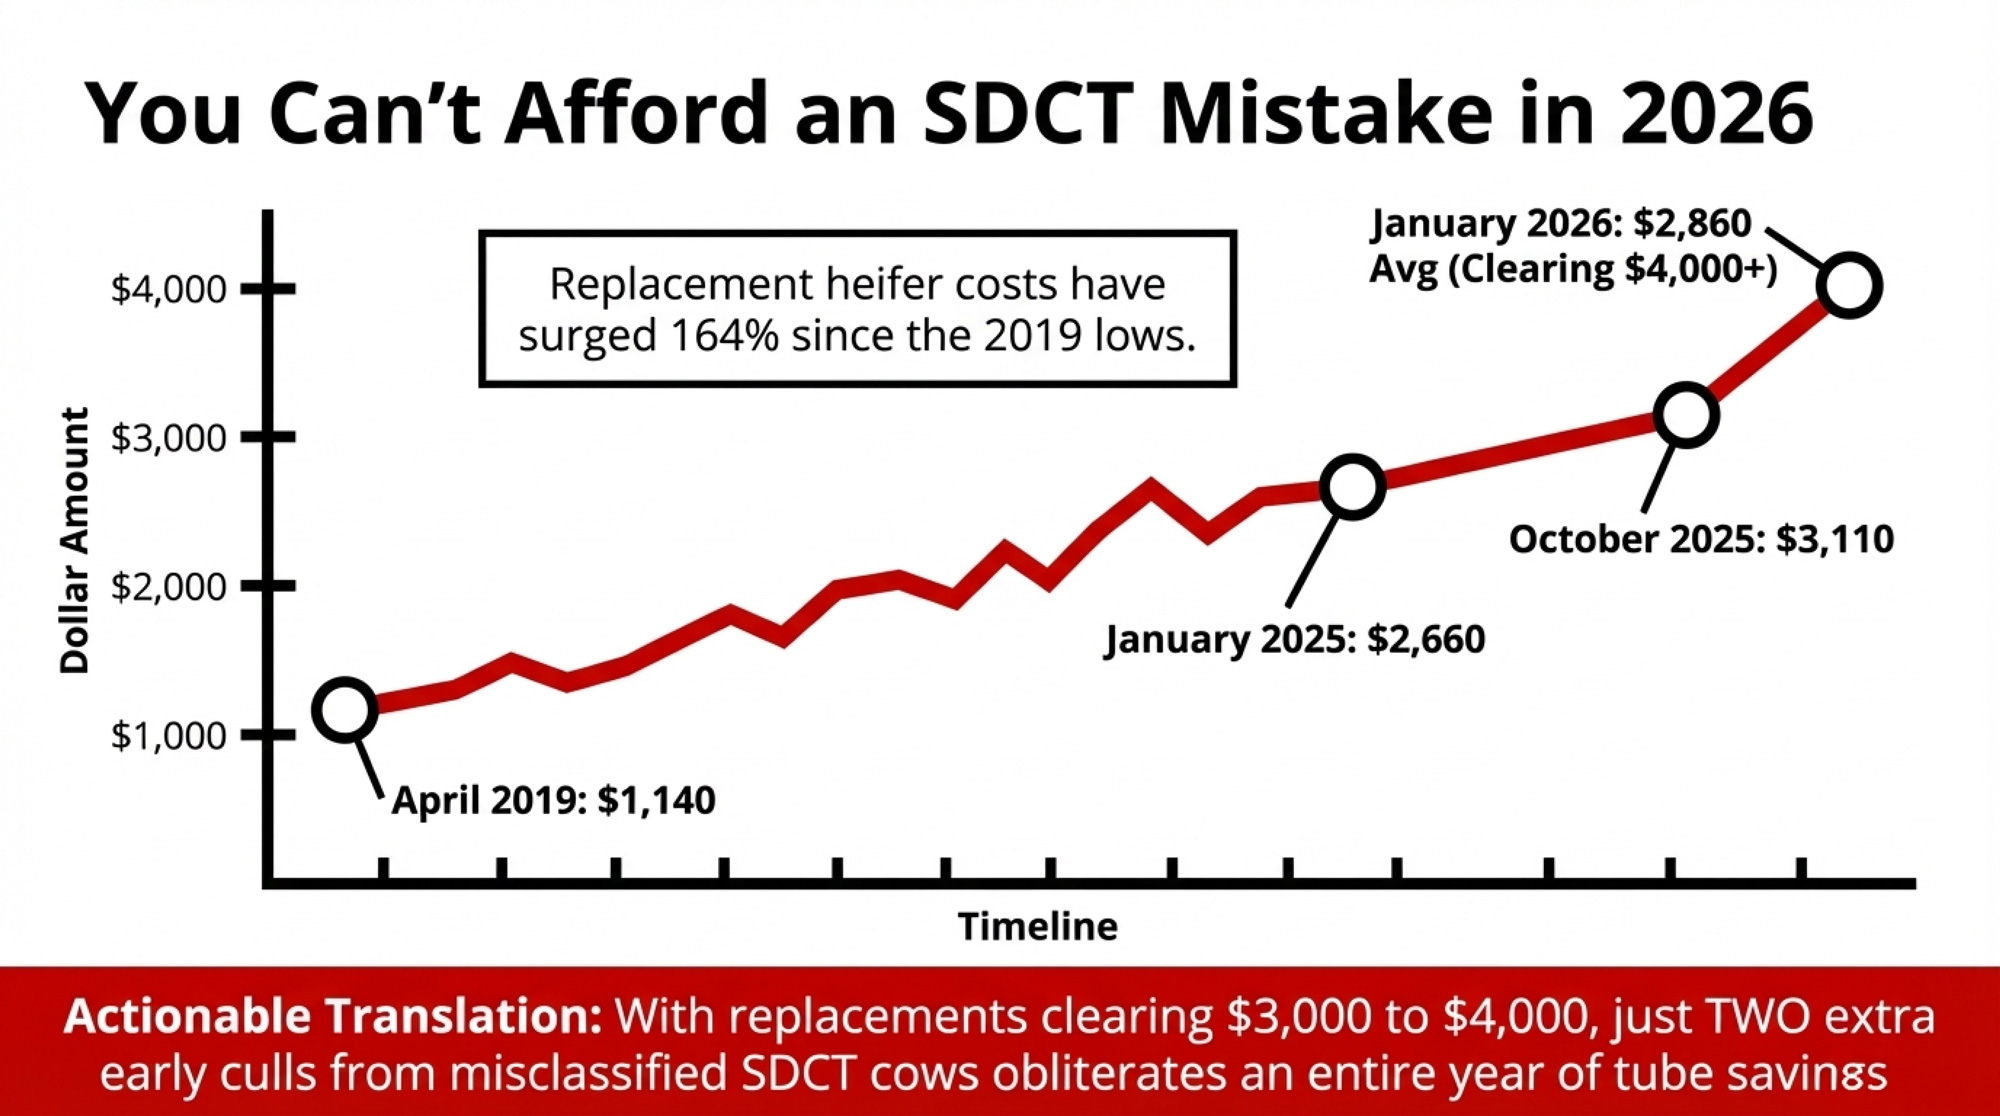
  • October 2014: dairy replacement heifers at $2,120 per head.
  • April 2019: down to $1,140.
  • January 2025: back up to $2,660.
  • July 2025: $3,010.
  • October 2025: $3,110 — about a 164% increase from the 2019 low.
  • January 2026: USDA average around $2,860, with individual Holstein springers clearing $4,000+ in some California and Midwest auctions.
Cost itemConservative valueCost vs. $1,080 tube “savings”
Clinical mastitis case (first 30 DIM)$300 per case (mid‑range of $120–$444)image.jpg4 cases = $1,200 (already exceeds tube savings)
Sub‑clinical mastitis over lactation~$200 lost milk/premiums per cowimage.jpg6 cows = $1,200 in hidden loss
Net replacement heifer (Jan 2026 avg)$2,860 − ~$1,400 cull value ≈ $1,500 per headimage.jpg+11 early cull = 1.4× tube savings; 2 culls = 2.8×
High‑end Holstein springer (auction)$4,000+ per head in some marketsimage.jpg+11 cull on premium cow = 3.7× tube savings
90 tubes skipped at dry‑off$12 per tube; total $1,080 “saved”image.jpgBest‑case upside, before any mastitis or cull penalties

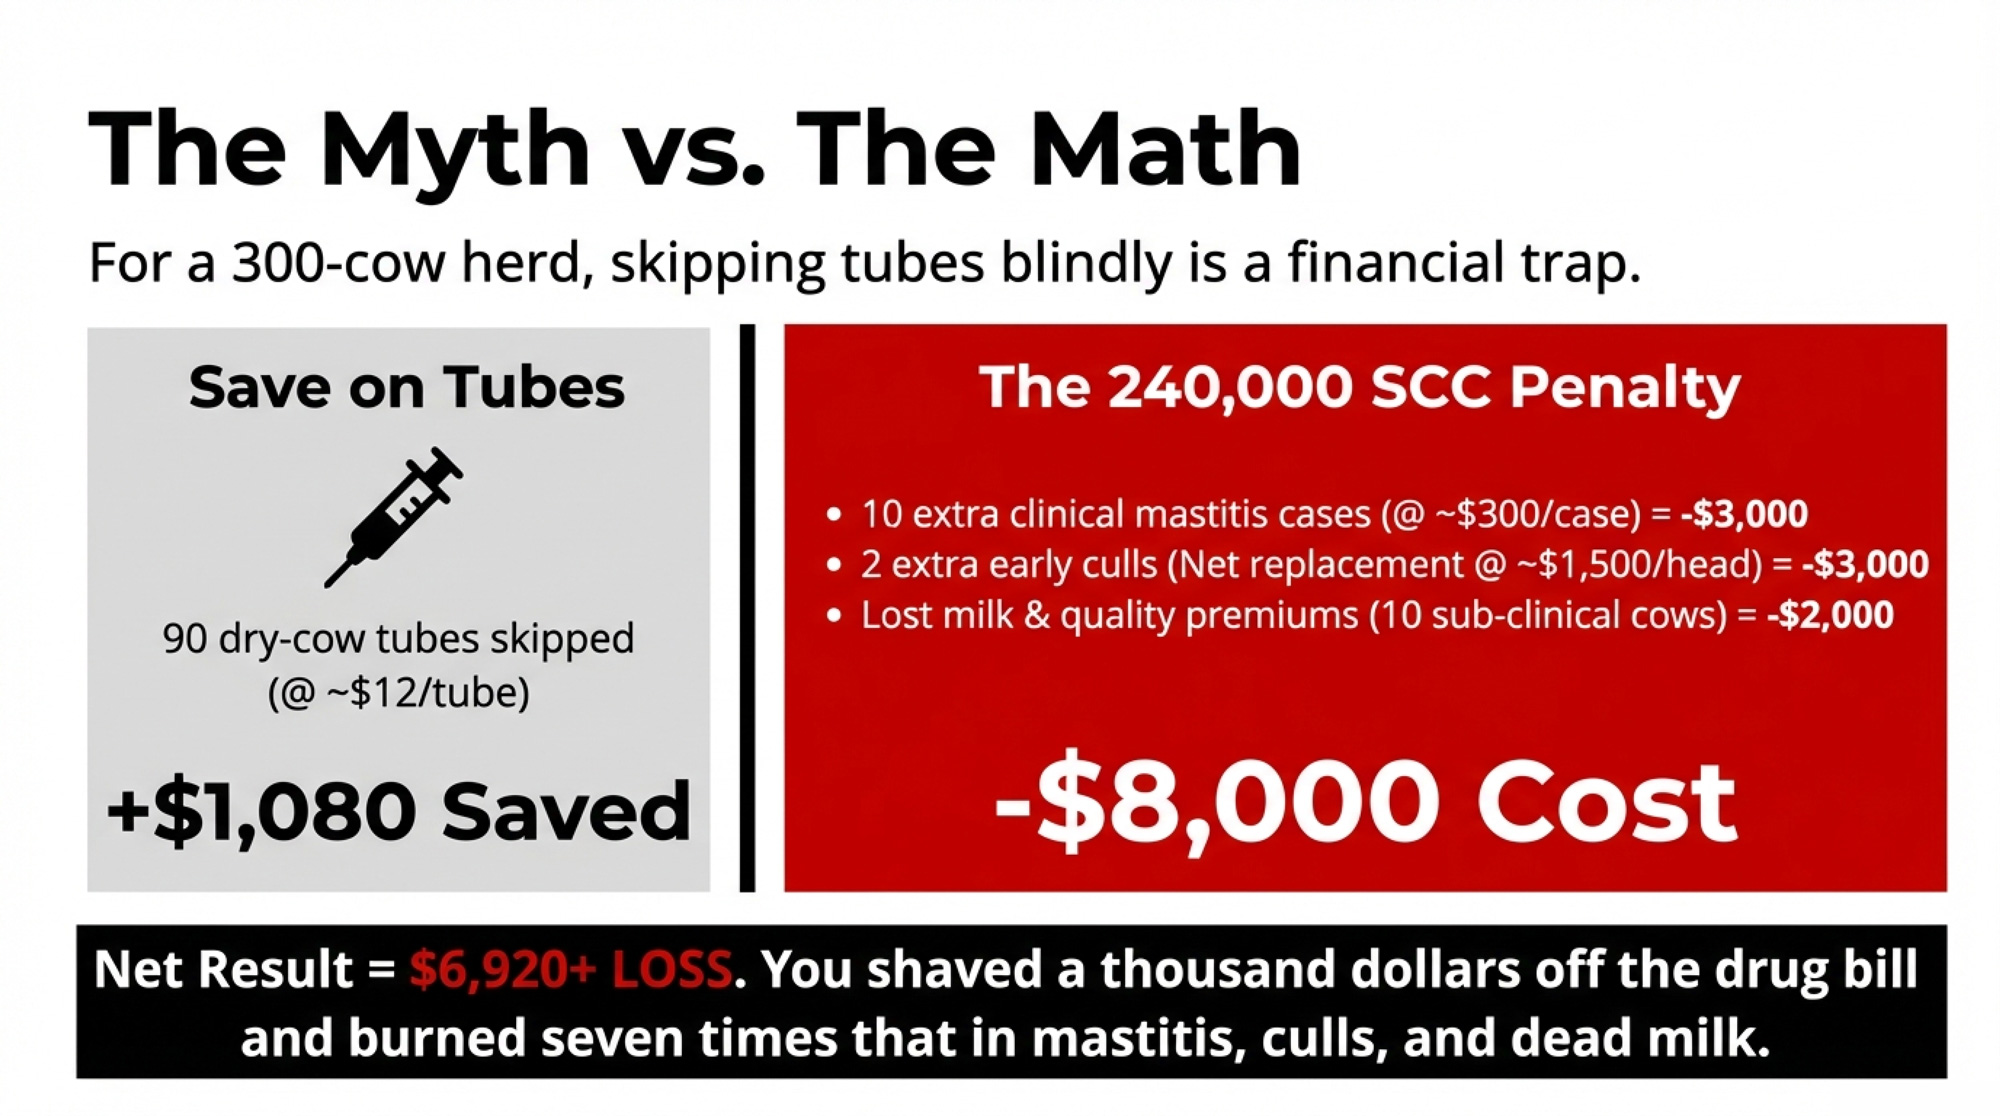
Now put that together on a 300‑cow herd with a BMSCC around 240,000 that jumps into SDCT before its infection pressure, and records are ready. If your dry‑off person is also your night milker and calf feeder, SDCT will show every crack in that schedule. And if selection criteria or follow‑through miss even a modest number of quiet infections, you can see a bump in early‑lactation mastitis, a couple of cows pushed into earlier culls, and several sub‑clinical cases dragging SCC and milk across the whole lactation.

Here’s what that looks like, using conservative assumptions:

ItemSavingsCost
90 dry‑cow tubes skipped (@ ~$12/tube)$1,080
10 extra clinical mastitis cases (@ ~$300/case)$3,000
2 extra early culls (net replacement @ ~$1,500/head after cull credit)$3,000
Lost milk from 10 sub‑clinical cows (a few hundred dollars per cow across the lactation)≈$2,000
Net result ≈$6,920+ loss

Assumptions: tubes $8–$15 each (long‑acting dry‑cow products) with $12 used here; mastitis cost $120–$444/case, $300 mid‑range; net replacement cost $2,860 USDA Jan 2026 average minus roughly $1,400 cull cow value ≈ $1,500; sub‑clinical cows losing a few hundred dollars worth of milk and quality premiums per cow across a full lactation.

You’ve shaved about a thousand dollars off your dry‑cow drug bill. You’ve potentially burned seven times that in mastitis, culls, and dead milk.

Mystic Valley’s low SCC, universal sealant use, and disciplined selection meant it could adjust early and keep that risk in check. The Cornell herds that stuck with SDCT had similar structures and data feedback loops. A 240,000‑SCC herd without those pieces is betting $6,920+ a year that its infection status and records are better than they really are.

Three SDCT Paths: Matching the Science to Your Herd

The Mystic Valley and Cornell stories don’t say “don’t do SDCT.” They say “do it on the right herds, with the right prep, and be ready to stop if the data turns.”

For a 240,000‑SCC herd with a processor letter, you’ve got three realistic paths forward.

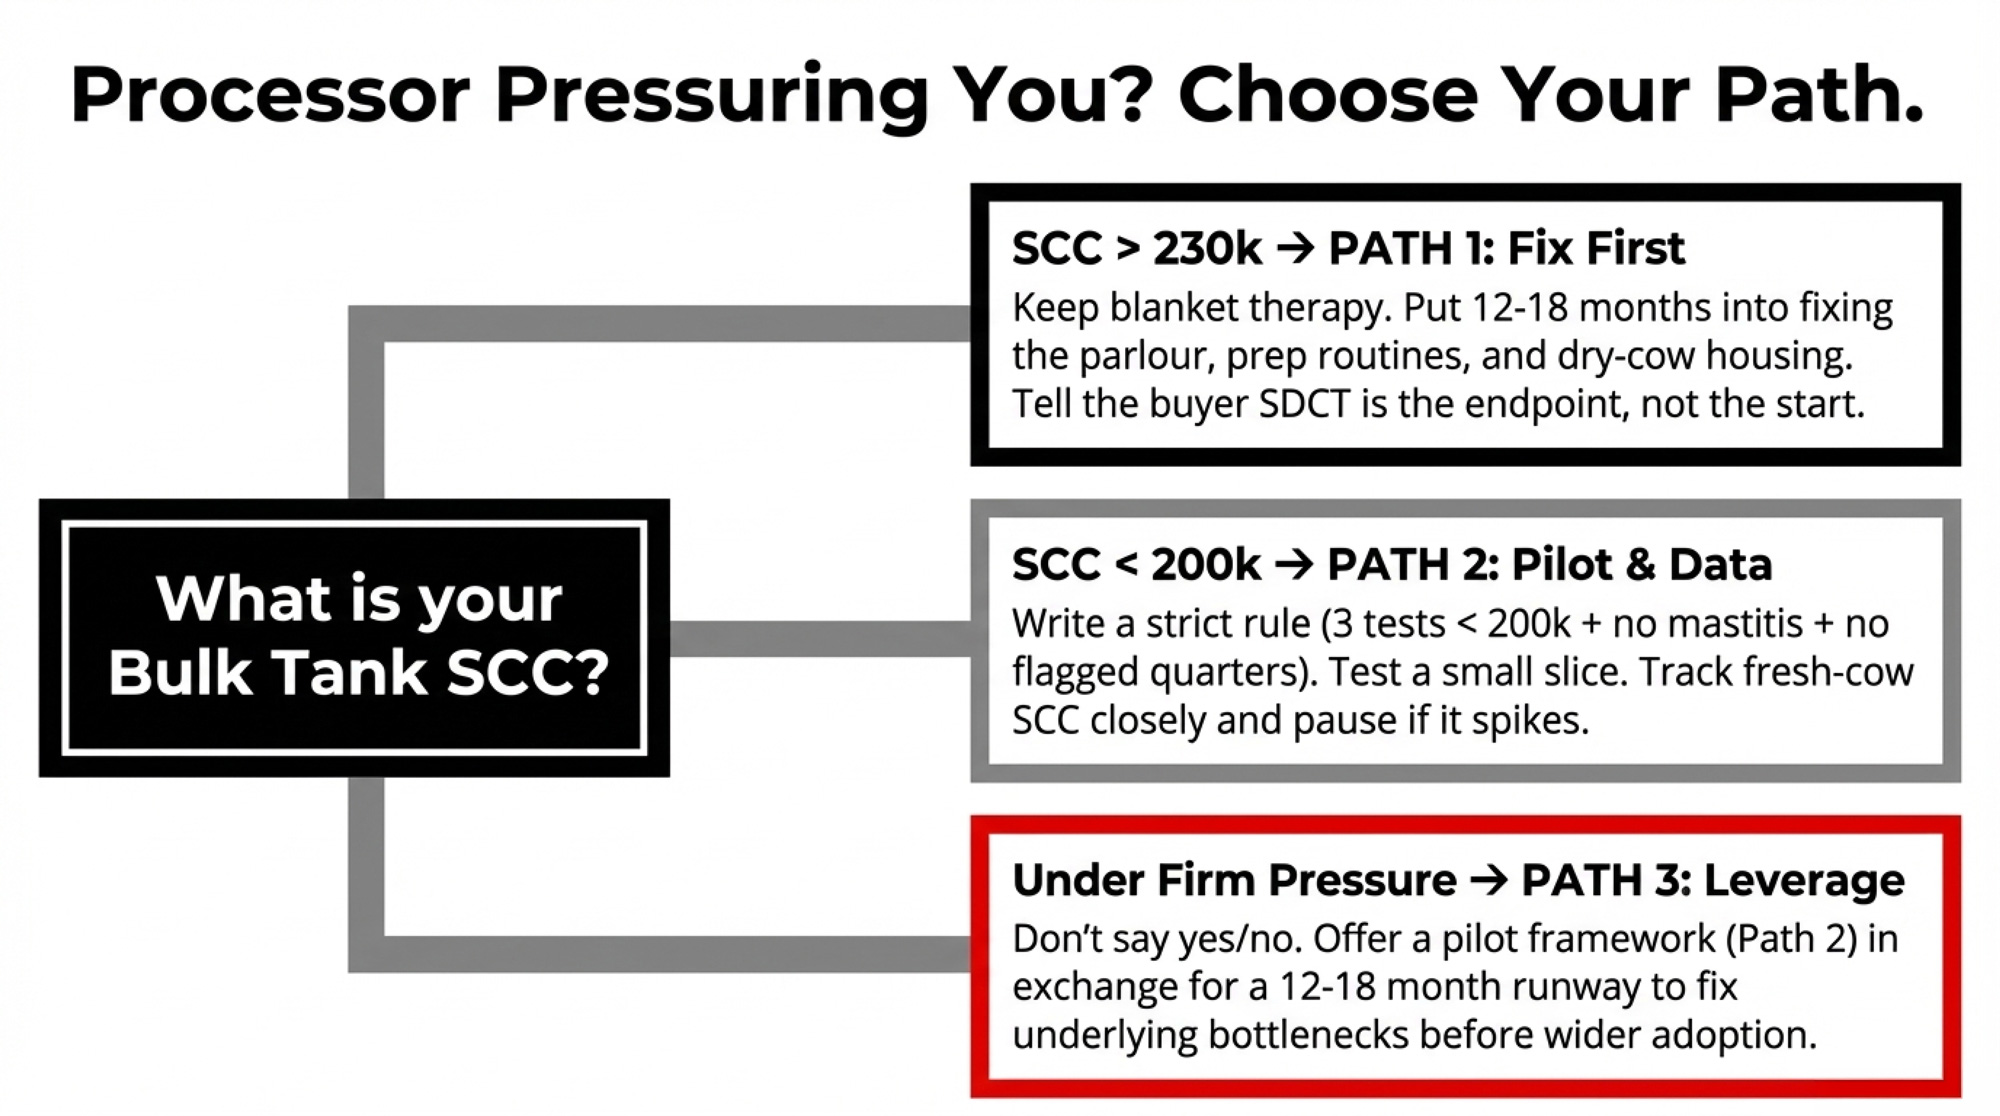
1. Infection‑First: Fix the Foundation Before You Touch Tubes

This fits herds with BMSCC regularly above 230,000–250,000, chronic high‑SCC cows you already know by number, and dry pens that are too full or too wet.

You tell your buyer SDCT is the endpoint, not the starting point. Then you put 12–18 months into:

  • Standardizing milking routines: consistent prep, lag time, and post‑dip across every shift; fix drift in technique between employees.
  • Tuning the parlour: vacuum levels, pulsation, liners, unit alignment.
  • Improving dry‑cow housing: stocking density, bedding, drainage, airflow.
  • Culling or segregating chronics instead of carrying them through another lactation.

You stay on blanket dry‑cow therapy plus internal teat sealant for all cows while you do that work. That’s exactly how the AABP 2024 SDCT guidelines recommend sequencing for herds that don’t yet meet readiness criteria. You’re trading short‑term antimicrobial‑use “wins” for long‑term udder‑health and economic stability.

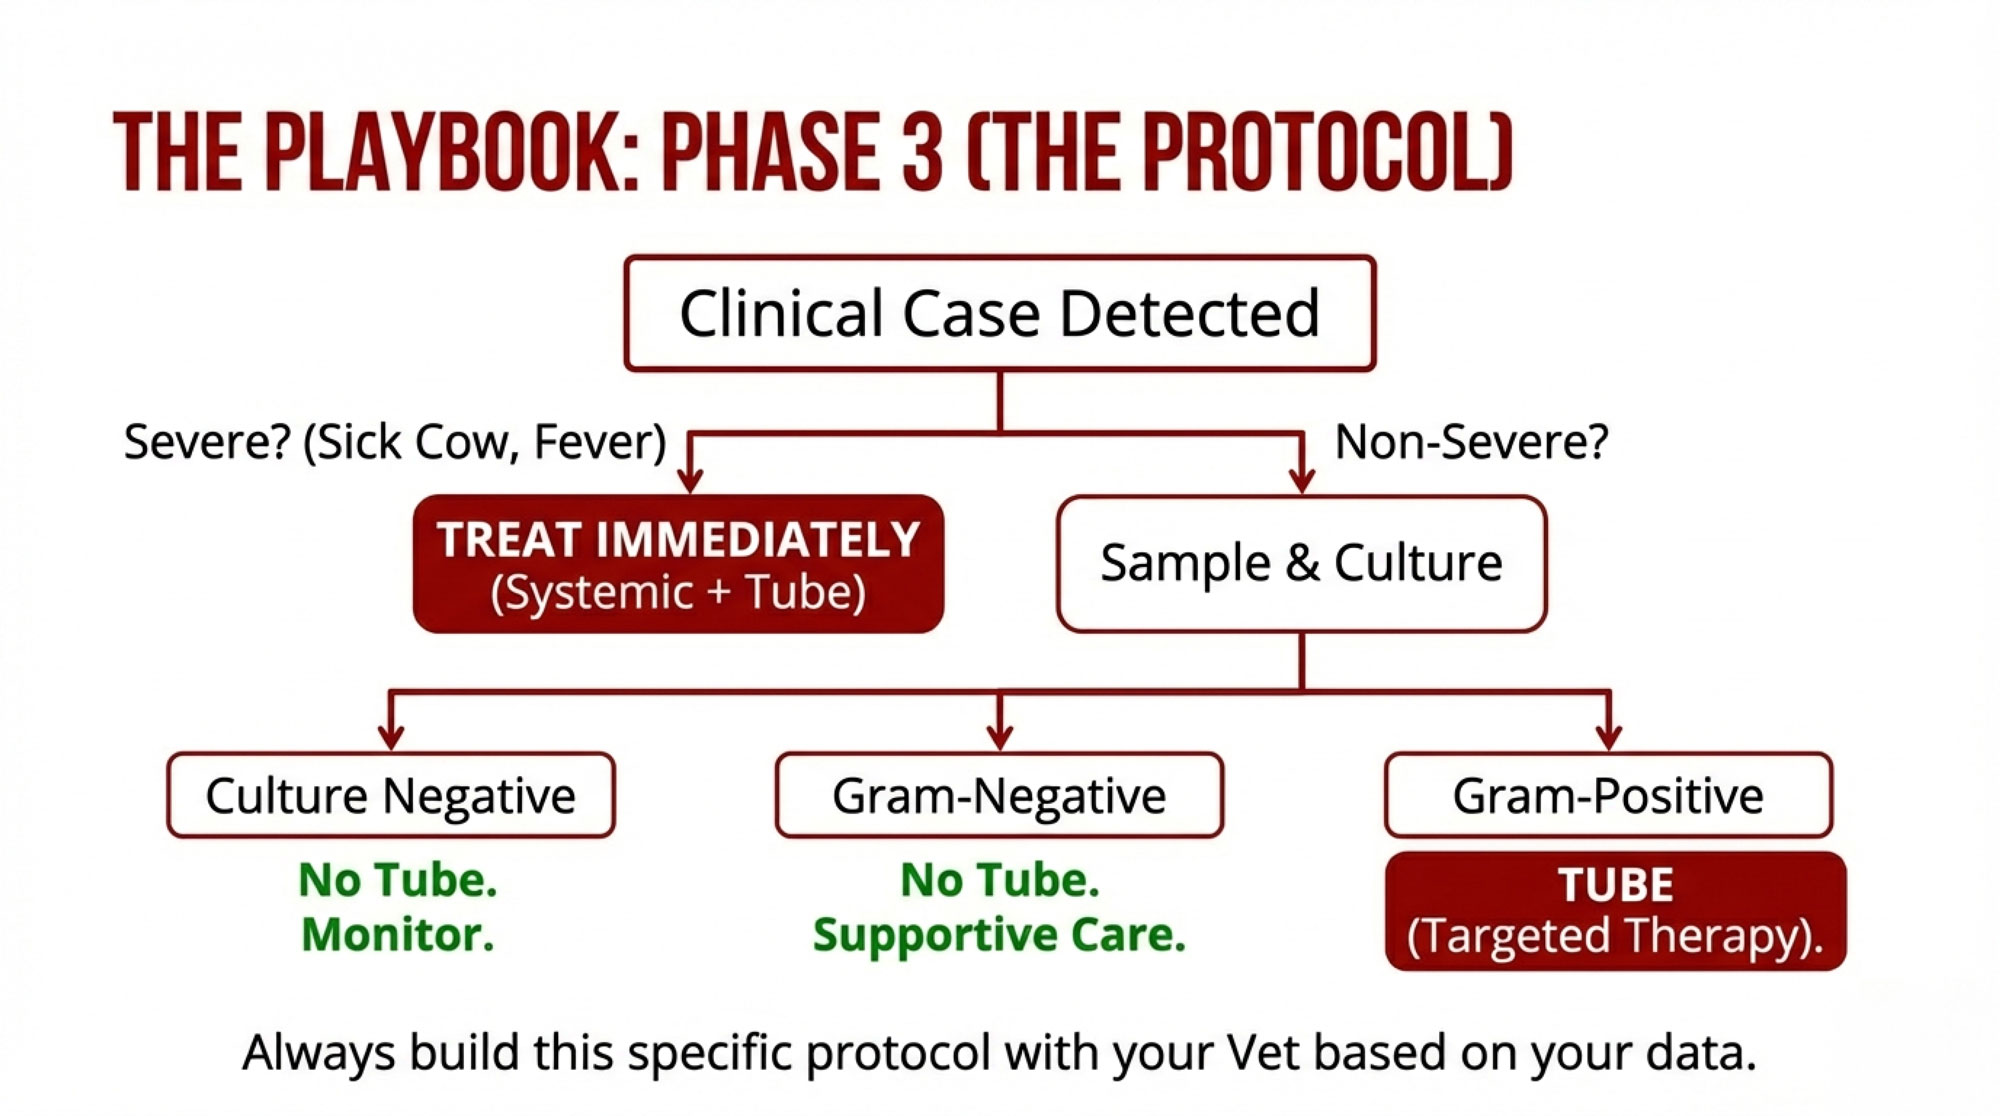
2. Pilot SDCT on the Safest Slice — and Let the Data Decide

This fits herds with BMSCC trending toward 200,000 or below, reasonably clean records, and a willingness to course‑correct.

With your vet, you write a short, strict rule:

  • Last three SCC tests all under 200,000.
  • No clinical mastitis this lactation.
  • No known problem quarters or chronic flags.

Cows that pass become eligible for sealant‑only at dry‑off. Eligibility isn’t a guarantee — if anyone on the crew has doubts about a cow, she stays on full treatment.

Then you monitor:

  • Fresh‑cow SCC at first test (5–45 DIM), focusing on the percentage over 200,000.
  • Clinical mastitis in the first 60 DIM, clearly tagged by dry‑off treatment group.

The AABP guidelines include specific DairyComp setups to track this. University of Minnesota Extension’s SDCT resources walk through herd‑level readiness and monitoring in plain language. Cornell used similar metrics to sort their 24 herds into “stayed in” and “opted out.”

If your graphs look like the Lipkens and Cornell success herds — stable SCC, no disproportionate mastitis spike among sealant‑only cows — you can cautiously widen eligibility. If they start to look like the seven Cornell herds that stopped, close the gate and go back to Path 1.

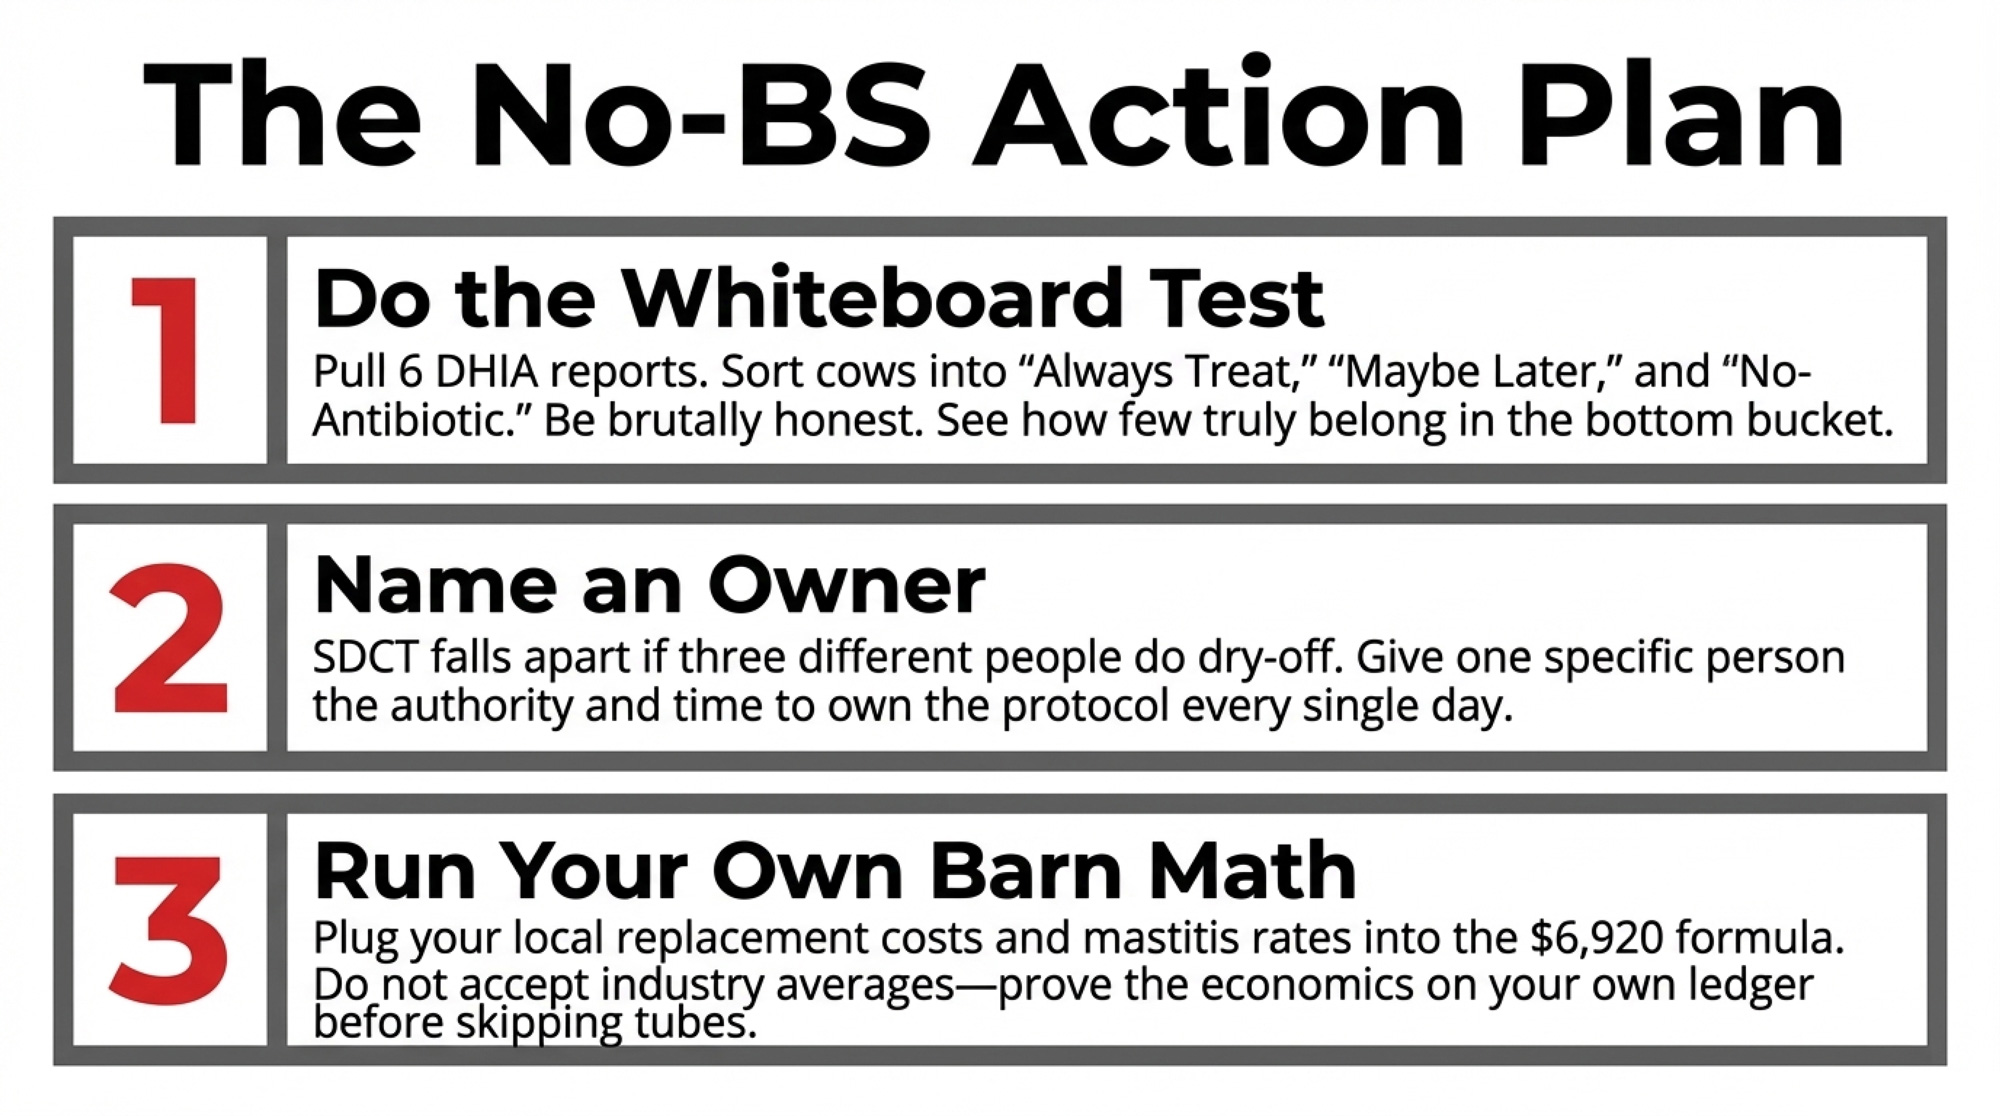
Do this within 30 days: Pull your last six DHIA reports and your current dry‑off list. On a whiteboard, make three columns:

  • “Always treat”
  • “Maybe selective later.”
  • “Pilot no‑antibiotic candidate”

Fill it in honestly. That one exercise will show you how many cows truly belong in the lowest‑risk bucket — and how far your herd sits from one that looks like Mystic Valley or the Lipkens group.

3. Turn the Processor Letter Into Leverage, Not a Deadline

This fits herds that need time and capital to fix underlying issues while facing firm SDCT language from buyers.

Go back to the processor with a framework instead of a yes/no:

  • You’ll pilot SDCT only on the safest slice (as in Path 2) this coming dry‑off season.
  • You’ll report quarterly on the bulk tank SCC trend, the percentage of fresh cows with SCC over 200,000, and the first‑60‑day mastitis incidence.
  • In return, you ask for a 12–18‑month runway to hit agreed improvements in SCC and mastitis, and to address facility bottlenecks, before any push toward wider SDCT.

The Dutch experience backs you up: that 47% dairy‑sector antimicrobial reduction happened over years, not months, and required simultaneous work on management, housing, and monitoring — not just a ban on tubes. A buyer who can show auditors your plan and your numbers is better off than one who forced SDCT onto a high‑SCC herd and then watched the metrics wobble.

What This Means for Your Operation

  • Start with your own SCC curve, not the industry average. If your bulk tank has lived under 200,000 for the last 6–12 months and you can pull a trustworthy mastitis and SCC history for each cow, you’re in the same readiness zone as the Lipkens herds and Cornell’s average SDCT adopter. If you’re swinging 230,000–280,000, you’ve still got infection work ahead of you.
  • Decide who owns dry‑off — by name. SDCT falls apart when three different people “kind of” handle it. One person needs to own that protocol and have enough time and authority to stick to it every day.
  • Use the AABP checklist as your gatekeeper, not your processor’s email. Bulk tank SCC regularly less than 250,000; no Strep. agStaph. aureus under control; individual SCC data; written SOPs; sealant for all cows. If those boxes aren’t ticked, your herd is still in the infection‑reduction phase.
  • Run your own barn math before you skip tubes. At a USDA average of $2,860 per replacement heifer — with individual animals clearing $4,000+ — even two extra early culls from mis‑classified SDCT cows can blow past a full year of tube savings. Put your own numbers into the $6,920 example; don’t just accept the model.
  • Within 90 days: Sit down with your vet and put your last six months of SCC and mastitis data beside the AABP SDCT criteria. Wherever your herd fails on that checklist, that’s where your next management or capital dollar should go.
  • Within 12 months: If you stay on BDCT while fixing management, re‑run your fresh‑cow SCC and first‑60‑day mastitis plots against last year’s. A noticeable step change does more to prove you’re SDCT‑ready than any pledge about tube counts.

Key Takeaways

  • If your herd’s SCC isn’t consistently under ~200,000 and your records can’t reliably sort truly low‑risk dry cows from the rest, SDCT is a future objective, not a current target.
  • If you pilot SDCT, every cow that skips tubes should have three consecutive SCC tests under 200,000, no mastitis this lactation, no problem quarters, and still receive a teat sealant — and you need to track her fresh‑cow outcomes separately from full‑treated cows.
  • If fresh‑cow SCC or first‑60‑day mastitis in your SDCT group climbs above your own baseline, that’s your cue to pause or narrow and invest harder in infection control rather than hoping the numbers settle.
  • If your processor is pushing a hard SDCT timeline, bring them a plan with a pilot cohort, monitoring metrics, and 12–18‑month milestones — not blanket SDCT on a 240,000‑SCC herd that isn’t structurally ready.

The Bottom Line

The herds that will be least stressed by the next round of antimicrobial stewardship rules aren’t the ones bragging about cutting the most tubes. They’re the ones whose data can prove their cows do fine without them.

When you pull up your last year of SCC curves, mastitis logs, and cull codes, do those numbers honestly look like a Mystic Valley‑style foundation for selective dry cow therapy — or are they telling you to keep the tubes while you fix what’s underneath?

Complete references and supporting documentation are available upon request by contacting the editorial team at editor@thebullvine.com.

Learn More

The Sunday Read Dairy Professionals Don’t Skip.

Every week, thousands of producers, breeders, and industry insiders open Bullvine Weekly for genetics insights, market shifts, and profit strategies they won’t find anywhere else. One email. Five minutes. Smarter decisions all week.

NewsSubscribe
First
Last
Consent

They Lost Cows and Still Cut Tubes: Mystic Valley’s Selective Dry Cow Therapy Math

Lose cows, save $277 on tubes, risk $2,220 in mastitis. Mystic Valley ran that math and still chose selective dry cow therapy. Would your herd?

Executive Summary: Mystic Valley Dairy tried selective dry cow therapy with all the “right” prerequisites—low SCC, Food Armor, strong records—and still lost cows in the first 60 days. Instead of reverting to blanket dry-cow therapy, they changed how they used teat sealant, tightened fresh‑cow monitoring, and kept SDCT in the protocol. This article pairs that real‑world experience with 2021–2024 research showing that algorithm‑guided SDCT can deliver average net returns of about 7–8 USD per cow at dry‑off and culture‑guided SDCT around 2 USD per cow, assuming udder health stays comparable to blanket therapy. It also draws on a 37‑herd Wisconsin cost study showing typical dry‑off product costs of about 19.57 USD per cow, with modeled SDCT protocols trimming partial direct costs by roughly 1–5 USD per cow, depending on product mix and how many cows still receive treatment. A simple barn‑math example for a 300‑cow herd (about 277 USD saved on tubes versus 2,220 USD in potential mastitis costs) turns SDCT from a philosophical debate into a concrete risk‑reward decision. Genetics aren’t an afterthought: health traits like mastitis resistance, livability, and DPR are positioned as the long‑term lever that makes SDCT safer and more scalable. The piece closes with a 90‑day playbook—paper‑testing an SDCT algorithm on last year’s dry‑offs, tightening records, and piloting one low‑risk group—plus clear “go/no‑go” signals on SCC, compliance, and mastitis trends so owners and herd managers can decide when SDCT makes sense and when it doesn’t.

In 2018, Mystic Valley Dairy in Sauk City, Wisconsin, was already an outlier — treating fewer than 20% of cows with antibiotics at dry‑off. Owner Mitch Breunig’s 450 registered Holsteins averaged just over 30,000 pounds of milk per cow, with a bulk tank somatic cell count sitting at 78,000 cells/mL. He’d already gone through the Food Armor antimicrobial stewardship program and was confident enough in his selective dry cow therapy (SDCT) system to change something most dairies still considered untouchable.

The results didn’t cooperate.

In published interviews, Breunig said the herd lost a couple of cows in the first 60 days of SDCT, likely due to toxic gram‑negative mastitis. He could’ve gone straight back to blanket dry cow therapy. Instead, he changed the way his team handled dry‑off — and doubled down on SDCT anyway.

Quick Stats: Mystic Valley and SDCT

  • Herd: ~450 registered Holsteins, Sauk City, Wisconsin 
  • Milk: Just over 30,000 lb per cow per year (2018) 
  • Bulk tank SCC: ~78,000 cells/mL 
  • BAA: 105.2, ranked 7th in the U.S. for herds >300 cows at the time 
  • Dry‑off antibiotics: <20% of cows treated when SDCT began 
  • Energy‑corrected milk (2025): ~125 lb ECM/cow/day, 4.5% fat, 3.4% protein 

Why Blanket Dry Cow Therapy Is Under Pressure

For decades, the default was simple: every cow, every quarter, every dry‑off got an antibiotic tube. Blanket dry cow therapy cured existing infections and helped prevent new ones during the dry period. It was effective and, honestly, easy.

That’s changing.

The EU’s Farm to Fork strategy targets a 50% reduction in antimicrobial sales for farmed animals and aquaculture by 2030, which directly pressures routine blanket treatments. In the U.S., the FDA’s Guidance for Industry #263 — which pulled all over‑the‑counter medically important antibiotics under veterinary oversight — took full effect in June 2023. In states like New York, lawmakers have introduced bills targeting routine or prophylactic antimicrobial use in food animals, adding another layer of scrutiny to practices such as blanket dry cow therapy.

A Wisconsin study of 37 large herds found the average dry‑off product cost under blanket therapy was 19.57 USD per cow, with a range of 8.72–24.04 USD depending on the product mix. When researchers modeled a standard SDCT algorithm with fixed tube prices, the average modeled cost dropped from 18.68 USD per cow under blanket DCT to 17.69 USD per cow under SDCT, while observed farm‑specific antibiotic costs alone averaged 11.54 USD per dried cow (range 8.72–15.44 USD). There’s real spread between herds — and between products — in what dry‑off actually costs, which is why your per‑cow savings may land anywhere from “about a buck” to several dollars.

Not everyone thinks those dollars are a good enough reason to switch. Larry Fox at Washington State University has argued that there’s no solid evidence that blanket dry cow therapy has selected for resistant mastitis pathogens, and that, for many herds, the established protocol remains the safest default. That tension — between regulatory pressure, economics, and herd health reality — is exactly where selective dry cow therapy sits.

Algorithm vs. Culture: Two Selective Dry Cow Therapy Paths

A lot of the SDCT debate boils down to how you decide who gets a tube.

Side‑by‑Side: Algorithm vs. Culture‑Guided SDCT

FeatureAlgorithm‑Guided SDCTCulture‑Guided SDCT
Core inputDHIA SCC history, mastitis treatment records, sometimes milk at dry‑offQuarter milk samples cultured before dry‑off on on‑farm media
Typical ruleAny SCC >200,000 cells/mL or clinical mastitis = antibiotic + sealant; others = sealant onlyTreat based on what grows; high‑risk pathogens get antibiotic, low/no growth may get sealant only
Antibiotic reductionCuts dry‑off antibiotic use by roughly half in trial and field settings when protocols are followedSimilar magnitude of reduction when implemented correctly
Average economic impact+7.85 USD per cow vs blanket (5–95%: 3.39–12.90 USD; 100% of iterations ≥0 USD) +2.14 USD per cow vs blanket (range −2.31 to 7.23 USD; 75.5% of iterations ≥0 USD)
StrengthsCheaper, faster, easy to implement where records are strongMore pathogen‑specific info that can improve mastitis control beyond dry‑off
Weak pointsRelies heavily on SCC and mastitis records being accurate and completeMore labor, supplies, and training; practical fit for fewer herds

Rowe, Godden, Nydam, and colleagues’ 2021 partial budget analysis in the Journal of Dairy Science showed that when SDCT is implemented properly, both algorithm‑guided and culture‑guided programs can be economically favorable compared with blanket therapy, with algorithm‑guided SDCT delivering more consistent positive returns. The algorithm approach produced a mean net cash impact of +7.85 USD per cow, with every modeled scenario at or above break‑even, while culture‑guided SDCT averaged +2.14 USD per cow but included some scenarios with a small net loss.

In applied projects, including Cornell‑linked implementation efforts across New York dairies, farms tended to gravitate toward algorithm‑based SDCT because it fit better with their existing labor and record systems. Culture‑guided SDCT demanded more time, equipment, and training than many herds could justify. Health outcomes can be equivalent when the fundamentals are solid — but the logistics and risk tolerance aren’t the same across herds.

Inside Mystic Valley: The Criteria, the Crash, and the Turn

Breunig didn’t land on SDCT by accident. He came in through the Food Armor program, which forced his team to look hard at every antimicrobial they were using.

By 2018, his herd’s public record looked like this: 450 registered Holsteins, herd average just over 30,000 lb of milk per cow, bulk tank SCC around 78,000 cells/mL, and a BAA of 105.2, ranking the herd seventh in the U.S. for herds over 300 cows at the time. To decide which cows could skip antibiotics at dry‑off, he used four specific criteria: last SCC of the lactation, second‑to‑last SCC, peak SCC during the lactation, and any treatment for clinical mastitis. If any test was well above 200,000 cells/mL, or she’d been treated for mastitis, she still got antibiotic dry cow therapy; if not, she was a teat‑sealant‑only candidate.

On paper, that’s a textbook algorithm‑guided SDCT. The results didn’t match.

Breunig said the herd lost a couple of cows in the first 60 days, likely due to toxic gram‑negative mastitis. For any herd, losing cows in the first two months of a new protocol raises an immediate question: Is the system wrong, or the execution?

Breunig was initially using internal teat sealant on all cows — treated and untreated — at dry‑off. After those early losses, he changed course: Mystic Valley now uses internal teat sealant only on cows that also receive antibiotic dry cow treatment. That’s a departure from many published SDCT protocols, which typically recommend teat sealant on all cows, and it reflects Mystic Valley’s specific experience and veterinary guidance — not a one‑size‑fits‑all recipe.

He also tightened monitoring. The herd moved to weekly SCC checks at freshening to catch subclinical spikes before they became clinical mastitis or necessitated culling.

Over time, the system held. A later Bullvine profile reported Mystic Valley averaging about 125 pounds of energy‑corrected milk per cow per day with roughly 4.5% fat and 3.4% protein. Breunig has publicly attributed the progress to a lot of small management decisions lining up over time, and selective dry cow therapy was one of those decisions.

Can Your Records Actually Support This?

The science is the easy part. The messy part is your records.

Among 11 early‑adopter Italian dairy farms studied by Guadagnini, Moroni, and colleagues, a specific slice of SDCT non‑compliance emerged: 21% of cows that should have received antibiotic treatment at dry‑off were instead given only internal teat sealant. Those non‑compliant cows were 3.77 times more likely to have subclinical mastitis at their first DHI test post‑calving compared with cows that received the recommended antibiotic plus sealant.

The research team reported that both veterinarians and farmers were unaware of the compliance deviation until data analysis was performed. When they dug into why it happened, 10 of the 11 herds attributed the problem to a lack of any monitoring system for whether the dry‑off protocol was actually being followed. There wasn’t malice or laziness. There just wasn’t a feedback loop, which is exactly how you end up with one in five high‑risk cows slipping through without the antibiotic the protocol calls for and a 3.77‑times higher risk of subclinical mastitis at first test.

A Cornell‑linked implementation project across New York dairies ran into the same kind of friction. The biggest barrier wasn’t herd health — it was recording and consistency. Some farms only started documenting mastitis events when they began SDCT, which made it look like mastitis was suddenly increasing when, in reality, they were finally writing everything down. A couple of herds pulled the plug on SDCT early, convinced it was causing extra mastitis in the dry period, and later review suggested that at least one of those spikes was part of a broader herd event unrelated to SDCT.

Compliance Failure PointWhat Happened in ResearchRisk MultiplierFix Before You Start SDCT
No monitoring system10 of 11 Italian herds had no way to verify dry-off protocol was followed3.77x mastitis riskCreate dry-off checklist + weekly compliance audit
Incomplete mastitis recordsNY herds only started logging clinical events when SDCT began; looked like spikeFalse alarm, protocol pauseBackfill 12 months of mastitis/treatment history
Crew turnover/training gapsHigh-risk cows received sealant-only when algorithm called for antibiotic21% non-compliance rateWritten protocol + hands-on demo for every person doing dry-off
Seasonal pressure ignoredSome herds ran SDCT through peak heat; environmental mastitis spikedNot quantified, but protocol pausedPilot SDCT in lowest-risk season (fall/winter in most climates)
Blame the wrong variableHerds attributed mastitis increases to SDCT when broader herd event was occurringEarly protocol abandonmentTrack 0–90 DIM mastitis separately; compare to baseline by dry-off group

Then there’s Jean Amundson — a veterinarian and co‑owner of Five Star Dairy near Elk Mound, Wisconsin. She and her partners milk about 1,000 cows and ship around 90 pounds of milk per cow per day. Amundson enrolled her herd in a University of Minnesota SDCT research trial and reported that the trial reduced dry‑cow antibiotic use by about half, thereby validating their approach. But her herd had been running on‑farm cultures and tight treatment records for years before the trial; selective dry cow therapy didn’t strengthen their data, strong data made SDCT possible.

The Genetics Angle: Why Health Traits Matter for SDCT

SDCT lives at the intersection of management and genetics.

The Council on Dairy Cattle Breeding (CDCB) publishes a mastitis resistance evaluation (MAST PTA) expressed as percentage points above or below the breed average, and these evaluations are favorably correlated with lower somatic cell scores, longer productive life, and better livability and fertility. That matters for SDCT because the herds that do best with selective dry‑off are the ones with consistently low SCC, good cure rates, and fewer chronic cows — exactly the profile you build when you lean harder on mastitis resistance and health traits in sire selection.

As you put more selection pressure on health traits — including mastitis resistance, livability, and fertility — in your breeding program, you’re gradually building a herd with fewer high‑risk animals at dry‑off and more cows that legitimately qualify as “low risk” in an SDCT algorithm. Over time, that shrinks the gap between what the algorithm recommends and what you’re actually comfortable doing.

The published SDCT studies in Italy, Belgium, and North America mostly focus on protocols, economics, and compliance rather than dissecting the role of genetic evaluations in those herds. But the direction is clear: genetics and management are beginning to work together to address mastitis, and herds that lean into both will have more room to pull tubes without paying for it in the fresh pen.

Does the SDCT Math Actually Pencil Out on Your Farm?

So what does the math look like when you actually take the tubes out of the cart?

Leite de Campos and Ruegg’s 37‑herd Wisconsin study provides a real‑world benchmark for direct product costs, assuming udder health remains comparable between blanket DCT and SDCT. That’s the starting point before you ask what happens if mastitis creeps up:

  • Average blanket‑therapy dry‑off cost (observed): 19.57 USD per cow (range 8.72–24.04 USD) 
  • Average cost per dried cow when only intramammary antibiotic DCT was considered: 11.54 USD, with a range from 8.72 to 15.44 USD across herds 
  • Modeled cost using fixed prices for intramammary products: 18.68 USD per cow for blanket DCT vs 17.69 USD per cow for selective DCT — about 0.99 USD per cow savings at those standard prices 

Other modeled scenarios in that dataset and related work show that, depending on product choices and how aggressively you pull tubes, partial direct cost reductions can reach roughly 5 USD per dry cow in some herds, but be closer to 1 USD in others. The per‑cow savings on tubes can range from “a noticeable line item” to “pretty modest,” depending on your current products and how aggressively you already use them.

If you’re running a 300‑cow herd and drying off about 280 cows a year, a 0.99 USD per‑cow savings at dry‑off is roughly:

280 cows × 0.99 USD ≈ = 277 USD in tube savings per year at standardized prices.

If your current protocol uses higher‑priced tubes and extensive sealant, your actual product savings under SDCT could exceed the modeled figure; if you already run a lean protocol, your savings could be smaller.

Year one is messier. You’ll spend money and time on veterinary consults to set up a herd‑specific algorithm, cleaning up mastitis and SCC records, writing a protocol people can actually follow at 4:30 p.m. in the parlor, and training the crew that does the dry‑off work. There isn’t a clean, published “X USD per herd” setup figure for this, but you should plan on meaningful first‑year overhead in vet time, staff time, and management attention that might eat most of the savings in year one.

And if your execution is sloppy, it can eat more than that. Rollin and colleagues estimated the total economic cost of a clinical mastitis case in the first 30 days of lactation at approximately 444 USD per case on U.S. dairy farms, including direct costs and lost future milk. Turn five extra fresh‑cow mastitis cases loose because you misclassified cows or botched dry‑off hygiene, and you’ve just burned 5 × 444 USD = 2,220 USD — easily more than a year’s worth of SDCT tube savings for a 300‑cow herd under many product‑cost scenarios.

Your quick math: take the number of cows you dry off per year and multiply by a realistic, herd‑specific per‑cow savings number — which might be around 1 USD per cow if your current drugs and sealant use look like the modeled Wisconsin herds, and potentially more if you’re using higher‑priced tubes. Then set that against the cost of a handful of extra mastitis cases at roughly 444 USD each.

Now ask yourself what one bad dry‑off month — with a half‑dozen explosive mastitis cases — would do to that balance.

What This Means for Your Operation

These aren’t talking points. They’re checks you can run on your own herd.

  • Can you pull a complete SCC and mastitis treatment history for every cow in your current lactation? If the answer is “sort of” or “not really,” SDCT should wait; your first 30 days should go into fixing the records, not the tubes. 
  • Do you know your pathogen mix? At minimum, confirm your herd is clear of Streptococcus agalactiae and has Staphylococcus aureus under control before you pull antibiotics at dry‑off, because SDCT is a bad place to discover a chronic contagious mastitis problem. 
  • Who actually does dry‑off on your farm? The more people involved, the more ways the protocol can drift, and European work on dry‑off routines and the Cornell experience both found that technique — not theory — was often the weak link, which is why checklists and monitoring systems matter. 
  • Is your dry pen ready for cows without antibiotic safety nets? Stocking density, bedding, ventilation, and transition management all matter more when more quarters head into the dry period with only a teat sealant barrier. 
  • When would you start? Some New York herds in that implementation work paused SDCT during peak heat when environmental mastitis pressure spiked; if you’re going to experiment, start in your lowest‑risk season. 
  • Are you tracking fresh‑cow mastitis separately? If your 0–90 DIM mastitis rate climbs more than about two percentage points above your pre‑SDCT baseline for two consecutive dry‑off groups, that’s a loud signal to pause and audit before continuing. 
  • Can your software help? Herd software like DairyComp 305 and others can run SDCT‑style classifications off DHIA data or at least help you pull the logic together in reports; if you’re not on a full‑featured platform, even a simple spreadsheet with cow IDs, SCC history, and mastitis events can get you close as long as the data’s real. 
  • Is your breeding program moving in the right direction? If you’re already pushing health traits tied to mastitis resistance and cow longevity in your AI matings — including CDCB mastitis resistance, livability, and DPR where available — you’re quietly building a herd that should be a better SDCT candidate five years from now than it is today. 
  • Where do you want to be in a year? Within 12 months of your first pilot, you should be able to decide — based on your own mastitis and SCC data — whether SDCT is a permanent protocol, a seasonal tool, or something you park for now. 

What to Do in the Next 90 Days

You don’t need to change a tube or buy a culture plate to learn something useful.

First 30 days

  • Pull your last 12 months of DHIA records and export the SCC history for every cow you dried off in that period. 
  • Run a simple SDCT algorithm on paper: for each dry‑off, ask “Did this cow ever test over 200,000 SCC this lactation, or receive clinical treatment for mastitis?” and mark which cows would’ve been “sealant‑only.” 
  • Compare your “sealant‑only” list to fresh‑cow outcomes: which of those cows had mastitis in the first 30 days of lactation, and which ones were clean all the way through? 

If that paper exercise makes you sweat, that’s useful information; it shows you where your protocol or your confidence is weak before you risk the cows.

Days 30–90

  • Sit down with your vet and walk through the results from the paper exercise: where do your records have gaps, where does the algorithm agree with what you already suspected, and where does it surprise you? 
  • If the paper exercise looked promising, pilot SDCT on one dry‑off group during your lowest environmental mastitis pressure window, monitor 0–90 DIM outcomes for that group against your baseline, and track compliance from day one. 
  • At the same time, pull your last two proof runs and look at how strongly you’re actually selecting for health traits tied to mastitis risk and longevity — including mastitis resistance and related CDCB health traits where available — and adjust your mating plan before you treat SDCT as your new normal if those traits are an afterthought. 

Key Takeaways

  • If your bulk tank SCC isn’t consistently under about 250,000 cells/mL, your mastitis records aren’t rock solid, or you haven’t cleaned up contagious pathogens like Strep agalactiae and Staph aureus, SDCT isn’t your next move; tighten those fundamentals and fix the bugs first. 
  • Algorithm‑guided SDCT can deliver savings on tubes — but the per‑cow number is often modest, and the real money is made or lost in mastitis cases, not boxes of product; a few extra fresh‑cow mastitis cases can easily erase a year’s worth of tube savings. 
  • Compliance isn’t a detail, it’s the whole ballgame: those Italian early‑adopter herds saw one in five high‑risk cows miss the antibiotic they should’ve received, and those cows were 3.77 times more likely to show up with subclinical mastitis at first test. 
  • Genetic selection for health traits is now real and measurable: CDCB health traits — including mastitis resistance — and their favorable correlations with somatic cell score, productive life, and fertility give you a way to breed cows that fit SDCT better over time instead of relying on management alone. 
  • The safest way to start is on paper: running the algorithm on last year’s dry‑offs gives you a real‑world stress test of your data and your cows’ behavior without risking this year’s dry pen. 

The Bottom Line

Mystic Valley’s first 60 days on SDCT included cow losses that would’ve sent most herds back to blanket therapy, but Breunig changed his sealant protocol, tightened monitoring, and kept going. Amundson’s herd at Five Star Dairy got there after years of building a culture‑and‑records foundation, and the University of Minnesota trial basically confirmed they were on the right track.

The tubes you pull — or don’t — on your farm will sit on top of your own system, not theirs. If your system can’t spit out clean mastitis data and your dry‑off crew can’t follow a checklist on a busy Friday, pulling tubes is the wrong place to start. So before you put down the dry cow gun, here’s the real question: if you ran a selective dry cow therapy algorithm on your last 100 dry‑offs tomorrow, would you trust what it told you?

Complete references and supporting documentation are available upon request by contacting the editorial team at editor@thebullvine.com.

Learn More

The Sunday Read Dairy Professionals Don’t Skip.

Every week, thousands of producers, breeders, and industry insiders open Bullvine Weekly for genetics insights, market shifts, and profit strategies they won’t find anywhere else. One email. Five minutes. Smarter decisions all week.
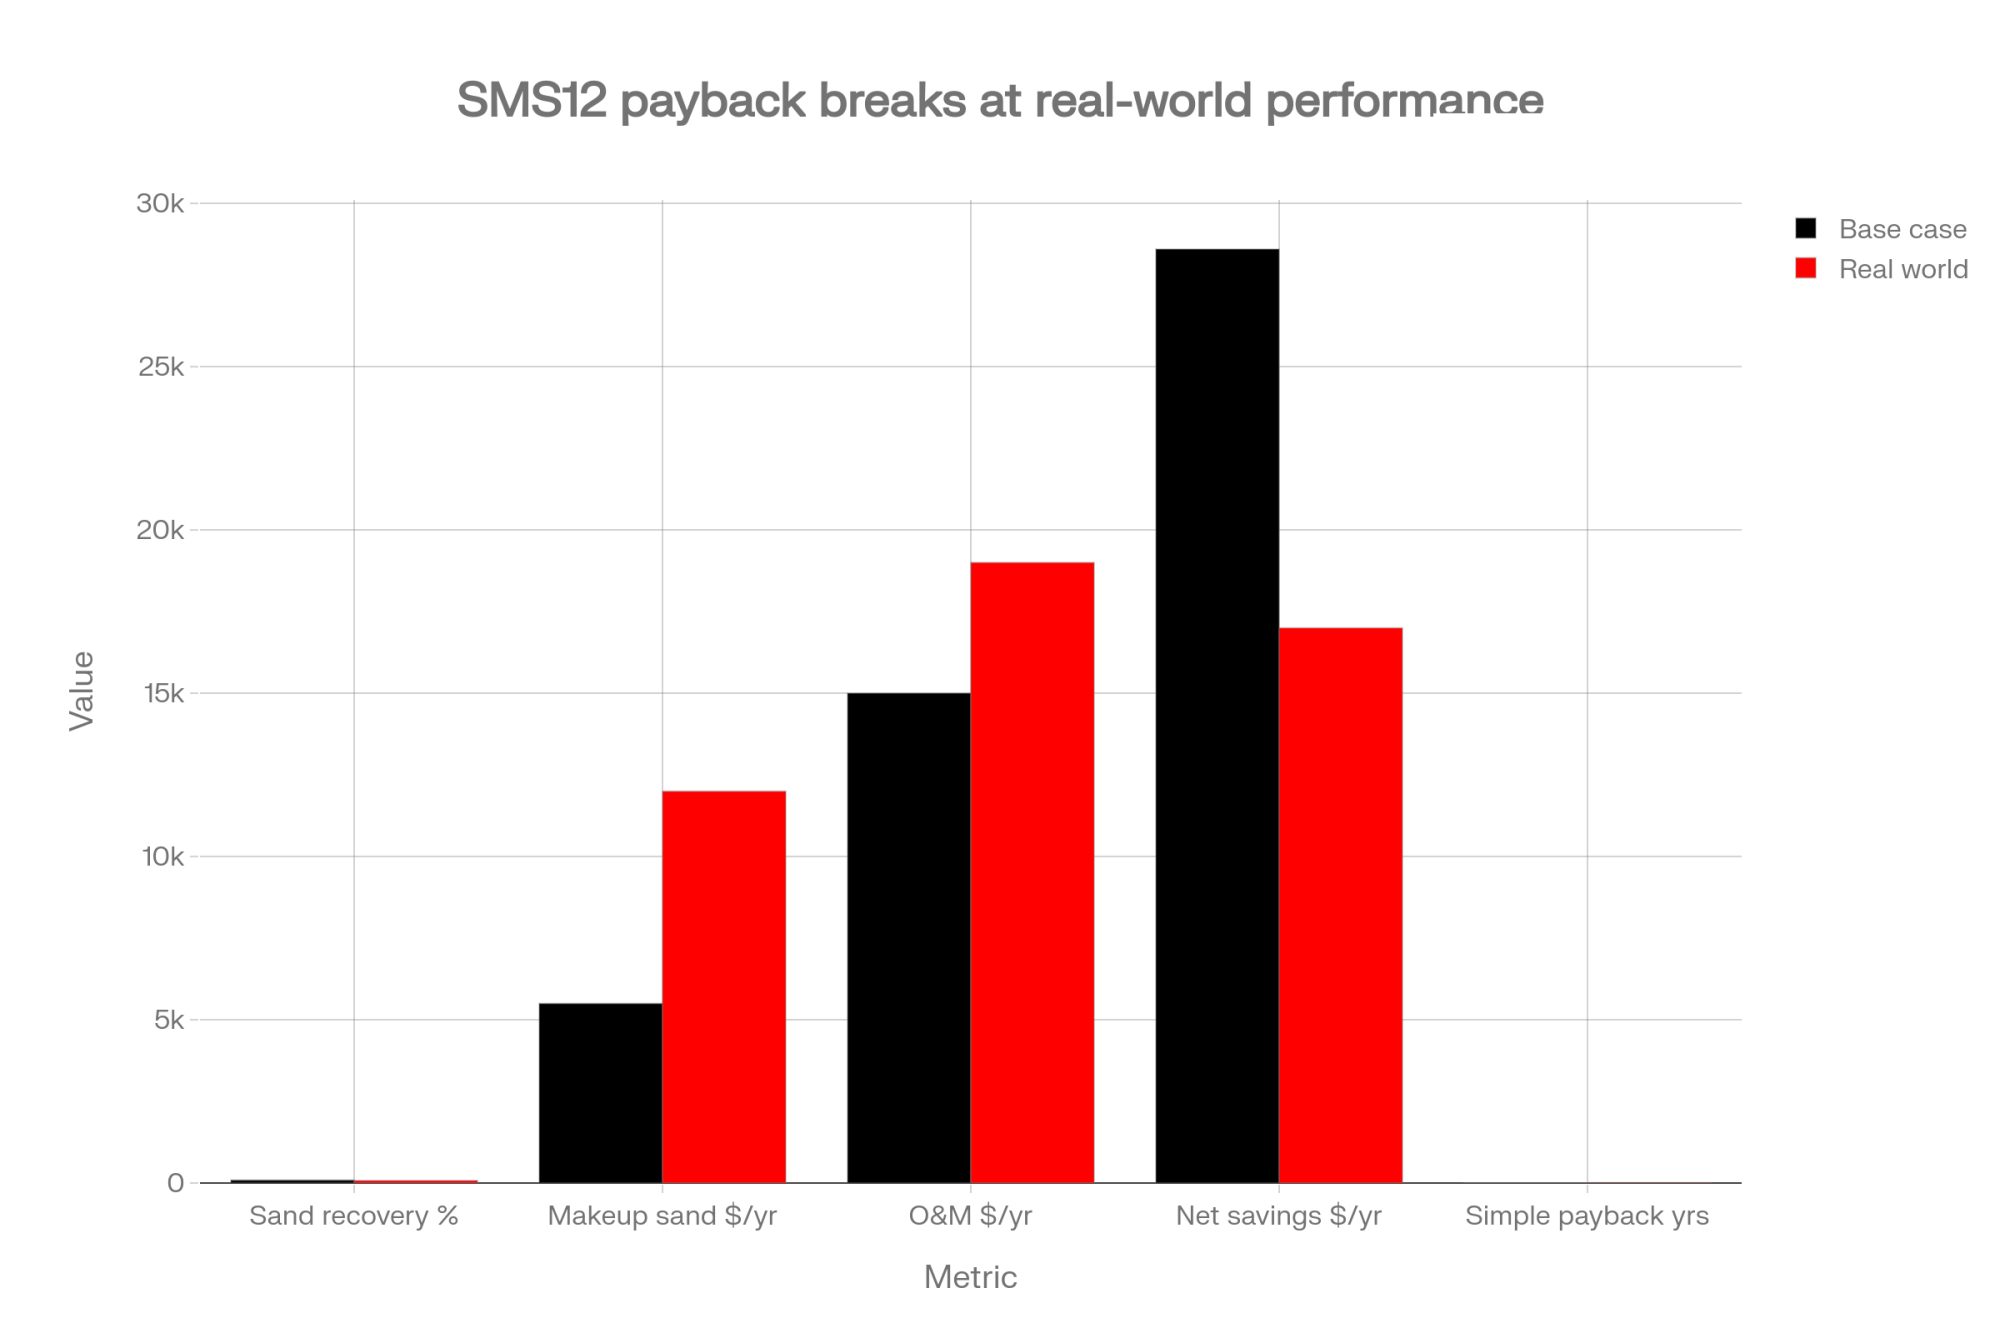
NewsSubscribe
First
Last
Consent

Udder Edema Hits 86% of Fresh Heifers – A $3,500-$16,000 Hit in a $3,000–$4,000 Heifer Market (And a $40/Head Fix)

86% of fresh heifers have udder edema. That’s not a cosmetic issue — it’s $3,500–$16,000 a year walking out your door.

That rock-hard, swollen udder on your fresh heifer isn’t just “how it is.” It’s a disease process with a measurable price tag — and in 2025–2026, that price just got a lot steeper.

Work by Emma Morrison and colleagues, published in the Journal of Dairy Science in 2018 using data from three commercial freestall herds, found udder edema in 86% of first-lactation heifers and around 56% of second-lactation cows in early lactation. When you apply conservative economics — recent U.S. milk prices, realistic assumptions for extra mastitis, slow-milking heifers, and earlier culling — Bullvine’s 2025 modeling puts herd-level losses at roughly $3,500–$16,000 a year on a 100-cow operation. The fix? About $40 per heifer in targeted vitamins and ration adjustments.

If you’re raising replacements at $3,000–$4,000 a head — and that’s where the U.S. market sits right now — watching even a few of them leave early isn’t just frustrating. It’s a serious hit to your balance sheet.

The Fresh-Heifer Problem You’re Underpricing

Morrison’s 2018 JDS paper scored udder edema on 1,346 cows across three North American freestall herds during the first three weeks in milk. The pattern held across all three operations:

  • 86% of first-lactation heifers had udder edema
  • About 56% of second-lactation cows showed edema, with prevalence dropping in older animals

Michigan veterinarian Dona Barski called udder edema “a disease, not just a cosmetic swelling.” She linked it directly to increased mastitis risk and subclinical ketosis in early lactation.

Here’s the milk math. Using Morrison’s health and performance associations and Bullvine’s 2025 fresh-cow economic modeling, a conservative estimate of the direct milk loss per affected heifer is around 316 lb per lactation. At roughly $20/cwt — a reasonable working average for recent U.S. Class III/IV prices — that’s about $63 per heifer in milk alone.

But that’s just the opening act. Morrison’s data shows cows with edema are more likely to:

  • Have clinical mastitis in the first 30 days (approximately 5% vs 2% in non-edema cows)
  • Show higher BHBA levels and more subclinical ketosis in week 2

Those are the heifers that burn through treatment dollars, waste saleable milk, slow down your parlor or robots, and hit the cull pen a lactation earlier than their clean-uddered herdmates.

The Herd-Level Economics

Take a 100-cow herd, with 40 replacement heifers freshened per year. If your incidence looks anything like Morrison’s study herds, 80–90% of those heifers show edema at some level — that’s about 34 affected animalsannually.

Annual Udder Edema Cost (100-Cow Herd, 40 Heifers/Year)

Cost CategoryRate/QuantityDollar ImpactNotes
Heifers affected34 of 40 (86%)Morrison et al. 2018 JDS
Direct milk loss~316 lb/heifer~$63 eachAt ~$20/cwt
Total milk loss34 × 316 lb~$2,149Milk only
Extra mastitis~2.5× higher odds~$300–$350/caseTreatment + discarded milk
Mastitis cases1–3/year~$300–$1,050Field estimate
Slow-outs & dermatitis5–10 heifers~$500–$2,000Labor, robot issues
Early culling1–2 heifers$3,000–$4,000+ eachAt 2025 replacement prices

Bullvine’s 2025 modeling — which treats these components as scenario-based ranges, not precise accounting — puts annual losses at $3,500/year on the low end (minimal mastitis, no early culling) to $8,000–$16,000/year in more realistic scenarios that include mastitis complications, slow-milking heifers, and one or two early culls.

Your mileage will vary based on your actual edema rates, how quickly you catch problems, and what replacements cost in your market. But the pattern holds: edema isn’t free.

Why the Stakes Are Higher in 2026

The heifer shortage is real, it’s historic, and it’s not going away soon.

According to CoBank’s August 2025 heifer inventory outlook, which draws on USDA data, U.S. dairy replacement heifer inventory sat at approximately 3.9 million head in January 2025 — the lowest level since the late 1970s and roughly 18% below 2018 levels. CoBank’s projections show heifer numbers continuing to tighten through 2026, with recovery not expected until 2027 at the earliest.

USDA’s Agricultural Prices series and market reports show average replacement heifer prices climbing from around $1,700 in 2023 to roughly $3,000 by mid-2025, with many auction lots bringing $4,000 or more for top genetics.

That’s not a typo. Replacement costs have nearly doubled in about two years.

Why the squeeze? Beef-on-dairy worked. Day-old crossbred calves now bring $800–$1,000 in many U.S. markets, compared to around $100 for straight Holstein bull calves just a few years back. As Mike North with Ever.Ag shared in early 2025: “If I’ve got an opportunity to make a thousand dollars on a calf without having to feed it for a year and a half, that’s a fantastic opportunity.”

The math made sense — until the replacement pipeline dried up.

CoBank’s 2025 report notes that producers have responded by “hoarding cows” and delaying culls, but warns that “this historic pullback cannot be sustained long-term” as cull cow values and herd health pressures build.

The bottom line: Any heifer you lose early — whether edema is the main driver or part of a bigger transition train wreck — likely means spending $3,000–$4,000 to replace an animal that cost far less a few years ago. Even one or two extra heifers leaving early on a 100-cow herd can add $6,000–$8,000 a year in replacement costs, before you count the milk and health losses that led up to that decision.

The Opportunity Cost You’re Not Counting

Here’s an angle that doesn’t get enough attention: the opportunity cost isn’t just about buying replacements. It’s about the sales you’ll never make.

If you were positioned to sell surplus heifers into this $3,000–$4,000 market, every heifer that leaves early to edema complications is revenue that evaporates. You don’t just pay more to replace her — you lose the check you would have banked from selling one of her herdmates.

For herds running tight on replacements, that math is bad enough. For herds that built their beef-on-dairy strategy around selling a few extra dairy heifers each year at premium prices, it’s a double hit.

Why Fresh Heifers Get Hammered

First-calf heifers don’t have the same mature vascular network as older cows. Their milk veins are still developing, so they’re less equipped to handle the surge of blood flow and fluid that comes with calving and ramping up production.

Meanwhile, we ask them to:

  • Finish their own skeletal growth
  • Carry and calve their first calf
  • Jump straight into a high-yield first lactation — often because we bred them off impressive genomic proofs

Then we compound the problem with nutrition that was never designed for them.

Classic JDS trials on sodium and potassium showed that high-salt anionic diets significantly increased edema scores and slowed recovery in heifers. Cora Okkema with MSU Extension advised that heifers should not receive the same strong DCAD ration as older dry cows.

You see it every day in the barn: tight, shiny quarters with a disappearing cleft. Heifers standing wide, flinching at the unit, or kicking. Quarters that won’t empty properly for the first several days.

When swelling lingers, it stretches ligaments, predisposes cows to pendulous udders, and creates a moist, damaged skin environment where udder cleft dermatitis takes hold. A 2020 review links chronic swelling and compromised skin to long-term udder problems and higher culling rates.

“A bit of swelling” isn’t cosmetic. It’s the front door to a shorter career.

Three Levers That Can Move the Needle

You don’t need robots or a new barn to make progress here. Field reports from herds that get serious about edema management — implementing all three levers below and tracking results over 12–24 months — suggest it’s realistic to push incidence from the 70–90% range down toward 30–40%, and hold severe cases under 10–15%.

Results will vary by herd, and edema is one of several transition issues competing for your time and capital. But it’s one of the cheaper levers to move because the fixes are more about feed allocation and fine-tuning premixes than buying new steel.

Lever 1: Nail Body Condition

Overconditioned heifers repeatedly appear as higher-risk animals. Extra fat around the udder and brisket increases tissue pressure and makes it harder to move fluid out.

StageTarget BCSWhy It Matters
2–3 weeks pre-calving3.25–3.5Enough reserve, not over-fat
At calving3.25–3.5Sweet spot for transition
60 DIM2.75–3.0Controlled loss, no crash

If most of your heifers are calving at 3.75–4.0, you’re pre-buying edema and transition risk.

Lever 2: Stop Feeding Heifers Like Old Dry Cows

This is where good herds get burned — not from laziness, but logistics. One close-up pen. One mixer. Everybody eats the same high-salt, strong-anionic ration designed for multiparous cows.

That’s a recipe for swollen heifers.

Top herds handle it differently:

  • Separate late-gestation heifer ration wherever possible
  • Lower sodium and potassium than the cow prefresh ration
  • Neutral to only slightly negative DCAD — not the deep negative aimed at older cows

If you’ve only got one mixer, use headlocks to feed a heifer-specific load into one row twice a day. Pull free-choice salt blocks out of heifer prefresh pens. Something is better than nothing.

Decision rule: If heifers and cows are on the same prefresh ration, and more than 60% of fresh heifers show any edema with more than 15% severe, separating diets moves from “nice to have” to “this month.”

Lever 3: Tune Vitamin E and Selenium

Oxidative stress spikes at calving. If tissues are inflamed and antioxidant capacity is low, more damage and slower healing follow.

NASEM’s 2021 Nutrient Requirements of Dairy Cattle update reinforces the importance of adequate vitamin E and selenium in close-up diets for both cows and heifers. Selenium supplementation levels remain constrained by FDA limits and didn’t change in the 2021 update — yet many herds are still using premix formulations from years ago.

High-performing herds:

  • Compare heifer vitamin E levels against current recommendations — not a premix label from 2015
  • Audit selenium intake from forage, premix, and injectables — adequate but not excessive, especially in high-Se regions

You’re not going to vitamin-shot your way out of bad BCS or wrong DCAD. But you can reduce tissue damage while you fix those fundamentals.

LeverWhat Good Looks LikeWhat Risky Looks LikeCost per HeiferTime to Results
Body ConditionBCS 3.25–3.5 at calving; controlled gain through transitionBCS >3.75 at calving; over-fat heifers crowding udder with tissue pressure (red text)~$0–$10 (monitoring only)6–12 months (requires earlier heifer program changes)
Heifer-Specific Prefresh RationSeparate heifer diet with lower Na/K; neutral to slightly negative DCAD; no free-choice saltHeifers eating same strong-anionic cow ration; shared mixer loads; salt blocks in pen (red text)~$15–$20 per heifer (ration cost, not capital)2–4 months (immediate once ration separated)
Vitamin E / SeleniumPrefresh levels match NASEM 2021 targets; premix formulation reviewed in last 2 yearsUsing premix formulation from 2015+; selenium “adequate” but never audited (red text)~$10–$15 per heifer (premix upgrade)3–6 months (tissue response builds over time)

What This Means for Your Operation

  • If more than 60% of your fresh heifers score ≥1 for edema, and more than 15% hit scores 2–3, you’ve got a transition risk that belongs in the same conversation as DAs and metritis.
  • On a 100-cow herd with 40 heifers freshening annually, Bullvine’s modeling suggests at least $3,500/year in edema-related losses on the low end — and more realistically $8,000–$16,000/year once you factor in mastitis, slow-milkers, and early culls at current replacement prices.
  • With U.S. replacements at $3,000–$4,000+ and inventory at 20-year lows per CoBank’s 2025 outlook, any heifer that leaves early is an asset you can’t easily replace. The opportunity cost of surplus sales you’ll never make adds to the sting.
  • Run a simple cost comparison: $40 per heifer for your top management changes vs the combined cost of one extra early cull plus a replacement at current prices. If the replacement side is bigger — and at $3,000–$4,000, it almost certainly is — edema work moves up your list.
  • Score your next 30–40 fresh heifers using a simple 0–3 scale. Not what you think edema looks like — what it actually is. Compare your baseline to Morrison’s research benchmarks.
  • Audit your prefresh program with your nutritionist: Are heifers actually on a different ration, or just a different pen eating the same feed? Get real Na, K, and DCAD numbers on paper.
  • Check BCS at close-up and calving. If most heifers are over 3.5, talk with your team about heifer growth rates and age at first calving.
Edema ScoreWhat It Looks LikeHerd-Level Threshold (40 Heifers/Year)Decision Rule
0No visible swelling; normal udder contourBaseline — track your percentageMonitor; this is your target for >40% of heifers
1Mild swelling; slight puffiness but udder cleft still visibleIf <60% of heifers: Keep monitoringContinue current program; fine-tune as needed
1Mild swelling; slight puffiness but udder cleft still visibleIf >60% of heifers: ACTAudit BCS and prefresh ration — you’ve got a systemic issue
2–3Moderate to severe; tight, shiny quarters; cleft disappearing or gone; heifer standing wide or kickingIf <15% of heifers: Monitor closelyWatch for progression; tighten BCS and vitamin protocols
2–3Moderate to severe; tight, shiny quarters; cleft disappearing or gone; heifer standing wide or kickingIf >15% of heifers: ACT NOWSeparate heifer prefresh ration immediately; review BCS and premix with your team this week

The Bottom Line

Udder edema hits 86% of fresh heifers in Morrison’s published research, with direct and downstream costs that Bullvine’s modeling places at $3,500–$16,000/year on a 100-cow herd at current U.S. prices. Replacement heifer costs have nearly doubled since 2023, with inventory at historic lows and no relief expected until 2027, according to CoBank. That makes every heifer that leaves early more expensive to replace — and every surplus heifer you can’t sell a missed opportunity in a seller’s market.

Three management levers — heifer BCS, heifer-specific prefresh rations, and tuned vitamin E/Se programs — can significantly reduce edema incidence when applied consistently over 12–24 months. About $40 per heifer in targeted changes gives you a realistic shot at cutting the edema penalty on animals that now cost four grand to replace.

You can keep treating this as “just fresh-heifer stuff” and quietly tax your best genetics every year. Or you can invest $40 per heifer and give yourself a realistic shot at cutting that penalty.

Score your next 30–40 fresh heifers. Separate their diet from the older cows as best you can. Tighten body condition. Fix the vitamins. Then look at your own numbers and decide: are you done paying the edema tax—or is this the transition change you finally make stick?

Key Takeaways

  • Udder edema hits 86% of fresh heifers (Morrison 2018 JDS), costing $3,500–$16,000/year on a 100-cow herd when you add up milk loss, mastitis, and early culls.
  • With heifers at $3,000–$4,000 and U.S. inventory at 20-year lows, every edema-related early exit is a high-dollar loss you can’t easily replace — and a surplus sale you’ll never make.
  • Three levers move the needle: heifer body condition, heifer-specific prefresh rations, and updated vitamin E/selenium — all for about $40 per heifer.
  • Know when to act: if more than 60% of fresh heifers show edema and more than 15% score severe, separating diets is no longer optional.

Executive Summary: 

Udder edema hits 86% of fresh heifers in Morrison’s 2018 JDS study, and, when you stack up milk loss, mastitis, slow‑milkers, and extra culls, Bullvine’s 2025 modeling puts the bill at $3,500–$16,000 a year on a 100‑cow herd. In a 2025–2026 U.S. market where replacement heifers cost $3,000–$4,000, and inventories sit at 20‑year lows, every heifer who leaves early because edema derails her transition is now a high‑dollar asset gone. The piece walks through how edema links to higher early mastitis and ketosis, udder damage, and earlier culling, so you can see how it’s taxing both your best young cows and your labor. It then lays out three practical levers — heifer body condition targets, heifer‑specific prefresh rations, and updated vitamin E/selenium programs — that field reports show can significantly cut edema over 12–24 months. On most herds, those changes work out to roughly $40 per heifer, which is inexpensive risk management on an animal worth $3,000–$4,000. Finally, you get a simple edema‑scoring system, clear thresholds (60%+ incidence, 15%+ severe), and a 60‑day on‑farm trial so you can run your own numbers and decide where this fits in your transition priorities right now.

Complete references and supporting documentation are available upon request by contacting the editorial team at editor@thebullvine.com.

Learn More

The Sunday Read Dairy Professionals Don’t Skip.

Every week, thousands of producers, breeders, and industry insiders open Bullvine Weekly for genetics insights, market shifts, and profit strategies they won’t find anywhere else. One email. Five minutes. Smarter decisions all week.

NewsSubscribe
First
Last
Consent

Stop Tubing Every Mastitis Cow: The $15 Strip Cup Playbook That Beats Blanket Treatment – and Your Robot Alerts – on Cost and Cure

Your robot’s mastitis alerts aren’t gospel. A $15 strip cup plus selective treatment beat blanket tubes on cost, antibiotics, and cow survival.

Selective Mastitis Treatment

Executive Summary: Most dairies still tube every mastitis cow “just to be safe,” but a 2023 Journal of Dairy Science meta‑analysis of thirteen trials found that selective treatment of non‑severe cases based on bacterial diagnosis can maintain cure, SCC, milk yield, and culling while cutting antimicrobial use. One 500‑cow Holstein herd in southern Brazil, for example, dropped its clinical mastitis treatment costs from US$27,559.97 to US$17,884.34 in a year—a 24% reduction, roughly US$6,000—after switching from blanket treatment to on‑farm culture–guided selective therapy. At the same time, a Bavarian field study showed that robot mastitis alerts have only 61–78% sensitivity and 79–92% specificity, depending on the brand, which means AMS systems are great at generating “cows to check” lists but shouldn’t be deciding which quarters automatically get tubes. This article pulls those threads together into a three‑phase playbook: tighten detection with strip cups, run a six‑ to eight‑week on‑farm culture “learning phase,” then build a vet‑driven selective protocol that fits your pathogen mix and labour reality. The focus is squarely on lowering mastitis costs and antibiotic use while protecting milk, SCC, and butterfat levels in real freestalls, tie‑stalls, and robot barns. The bottom line is that if your SOP still says “treat every case,” you’re probably spending more than you need to on tubes and discarded milk—and this gives you a practical path to test that on your own farm.

Outcome MeasuredSelective Treatment (Diagnosis-Guided)Blanket Treatment (All Non-Severe Cases Tubed)Statistically Significant Difference?Key Insight
Bacteriological Cure Rate✓ Maintained✓ MaintainedNOBoth protocols achieve cure; diagnosis-guided doesn’t lose ground
Clinical Cure Rate✓ Maintained (slightly longer time-to-normal: ~0.5 days)✓ MaintainedMinor trade-offOne more day to visual recovery is negligible vs. cost savings
Bulk Tank SCC✓ Maintained / Improved✓ MaintainedNOSelective treatment does NOT compromise herd SCC
Milk Yield (kg/day)✓ Maintained✓ MaintainedNONo yield penalty; both manage production equally
Recurrence Rate✓ Maintained✓ MaintainedNOFuture mastitis risk is identical between groups
Culling Rate✓ Maintained✓ MaintainedNOSelective treatment does NOT increase forced culls
Antibiotic Use (volume & exposure)↓ Significantly Lower✓ HighYES – Selective WinsFewer cows receive tubes; direct reduction in farm-level antibiotic footprint
Treatment Cost (relative)Base: 100%Base: 131%YES – Selective Wins24–31% cost savings in real herds (see Visual 2)

Picture us at a winter dairy meeting, coffee on the table, and someone says, “We treat every ropey quarter the same way—grab a tube and go.” A lot of heads still nod at that. It’s familiar. It feels safe.

Here’s what’s interesting. A 2023 meta‑analysis in the Journal of Dairy Science, led by Dutch and Canadian researchers, including Ellen de Jong, pulled together results from 13 studies that compared selective treatment of non‑severe clinical mastitis to blanket treatment, in which every mild case receives intramammary tubes. The data suggests that when treatment decisions are based on bacterial diagnosis, selective protocols did not worsen bacteriological cure, clinical cure, somatic cell count, milk yield, recurrence, or culling compared with treating every non‑severe case automatically. The only clear trade‑off they picked up was a very small difference—on the order of half a day—in how long it took cows to look clinically normal again.

So that old reflex—tube every non‑severe case “just to be safe”—made sense in a world with less information and less pressure on antimicrobial use. But what this newer work is telling us is that on many farms in 2025, that reflex is quietly draining money in drugs and discarded milk, and it’s not necessarily buying you better udder health.

What I’ve found, walking barns in Ontario, Wisconsin, and across the Northeast, is that the herds making selective treatment work aren’t just university herds or fancy show strings. They’re regular freestalls, tie‑stall barns, and some well‑managed dry lot systems that have tightened up detection, put simple on‑farm culture plates on a bench, and started making more targeted treatment calls. And at the centre of that shift, there’s usually a strip cup that cost about fifteen dollars.

Looking at This Trend: What’s Actually in That Mastitis Quarter?

To make sense of selective treatment, it helps to start with what’s actually going on in the quarter when you see a clinical case.

Herd CategoryCulture-Negative (%)Gram-Negative (E. coli, Coliforms) (%)Gram-Positive (Strep, Staph, Lacto) (%)Sample Size / Source
Typical North American Herds (Meta-analysis range)20–40%25–35%30–50%13 trials, meta-analysis
Modern European Dairy (mixed systems)18–35%28–40%35–52%Frontiers Vet Sci, JDS reviews
High-SCC Problem Herds10–20%20–25%60–70%Contagious mastitis-dominant
Well-Managed Low-SCC Herds25–45%30–40%25–45%Environmental mastitis-dominant

Recent reviews on mastitis in journals like Frontiers in Veterinary Science and Journal of Dairy Science describe how milk from clinical mastitis is usually grouped into three broad categories in research trials and on‑farm diagnostics work:

  • Culture‑negative cases, where no growth appears on routine culture media
  • Gram‑negative infections, often Escherichia coli and related coliforms
  • Gram‑positive infections, like Streptococcus uberisStreptococcus dysgalactiae, and various staphylococci

Across modern datasets from North American and European herds, researchers often report that a substantial share—commonly in the 20 to 40 percent range—of clinical mastitis samples are culture‑negative when they hit the plate. You know how that goes: by the time you see clots or watery milk, and you grab a sample, the cow’s own immune system may already have knocked bacterial numbers down below the detection limit of the culture system.

And here’s where the math starts to matter.

In the non‑severe clinical mastitis trials that fed into that 2023 meta‑analysis, culture‑negative cases were either treated with intramammary antibiotics or left without intramammary therapy, with both groups monitored closely and supported as needed. When researchers pulled those results together, they didn’t see worse bacteriological or clinical cure, SCC, or recurrence in the culture‑negative cows that were managed without intramammary antibiotics, compared with those that received tubes. In plain terms, a lot of those culture‑negative, non‑severe cases were going to get better either way.

For non‑severe gram‑negative cases—especially E. coli—the story is similar in many of the better‑controlled studies. Several trials, including work from Brazil and Europe, show that mild and moderate E. coli mastitis has a relatively high spontaneous cure when cows are otherwise healthy and well monitored. When you look at the numbers in those trials, intramammary tubes don’t always give you a big extra jump in cure compared with careful observation and supportive care, as long as you’re ready to move fast with systemic treatment if a cow spikes a fever, goes off feed, or otherwise starts looking systemically ill.

That’s where good fresh cow management during the transition period and overall environment really start pulling their weight. In herds where cows come into early lactation in good condition, with clean, dry stalls or well‑drained lots and minimal stress, it’s a lot easier for the immune system to do its part in these milder environmental mastitis hits.

Gram‑positive infections are trickier. For years, most of us have felt that these “pay” for a tube, and some work backs that up. Trials are showing that certain gram‑positive pathogens, especially some streptococci and staphylococci, respond better to intramammary antibiotics than to no treatment. At the same time, a 2024 randomized trial in JDS Communications that followed non‑severe gram‑positive mastitis cases identified by on‑farm culture—many of them Lactococcus—found no significant difference in bacteriological cure between several intramammary regimens and no treatment during a 21‑day follow‑up.

So the honest summary is this:

  • For non‑severe culture‑negative and many gram‑negative clinical mastitis cases, there’s good evidence that you can withhold intramammary antibiotics and lean on careful monitoring and supportive care without harming overall udder‑health outcomes—provided you still treat severe cows aggressively.
  • For non‑severe gram‑positive cases, the evidence is mixed. Some pathogens and situations clearly benefit from targeted intramammary therapy; others, like the Lactococcus‑dominated cases in the 2024 trial, don’t show a big difference in cure either way.

And that’s exactly why just looking at a ropey strip on the floor doesn’t get you very far. As mastitis specialists at places like Minnesota and Penn State keep reminding people, foremilk appearance and udder feel by themselves simply don’t tell you which pathogen group you’re dealing with. If you want a true selective treatment program—not just a dressed‑up version of “treat everything”—you need some sort of diagnostic information, usually from an on‑farm culture plate or a rapid lab test.

A Real‑World Case: A 500‑Cow Herd That Ran the Numbers

Let’s ground this in a real farm.

MetricBlanket Treatment YearSelective Therapy YearDifference% Reduction
Total CM Treatment Cost (USD)$27,559.97$17,884.34$9,675.6324.23%
Number of CM Cases361238123 fewer34% case reduction
Cost per Case (USD)$76.35$75.17$1.181.5% per-case efficiency
Antibiotic Spend Component (est.)$15,200$8,900$6,30041% reduction
Discarded Milk Cost (est.)$12,360$8,984$3,37627% reduction

A 2023 Brazilian study in Revista Brasileira de Saúde e Produção Animal followed a commercial Holstein herd of about 500 lactating cows in Rio Grande do Sul as it transitioned from blanket clinical mastitis treatment to selective therapy based on on‑farm pathogen identification. They ran it for two full years: one year before the new protocol and one year after.

During those two years:

  • They recorded 599 clinical mastitis cases361 in the blanket‑treatment year (period one) and 238 in the first selective‑therapy year (period two).
  • They calculated the full cost of treating CM, including antibiotics and discarded milk. Across both years, CM treatment cost the farm US$45,444.31.
  • In the blanket year, costs were US$27,559.97.
  • In the first year with selective therapy, costs dropped to US$17,884.34.

That’s a 24.23 percent reduction in total CM treatment costs from year one to year two—around US$6,000 saved in that first selective‑therapy year—while also reducing antibiotic use and the volume of milk discarded because of treatment.

It’s worth noting that this wasn’t some disinfected research station. This was a compost‑bedded pack herd, milking twice a day with mechanical parlour equipment, producing roughly 14,000 litres of milk per day at the time of the study. In other words, a big, normal, working dairy.

Now, your milk price and drug costs aren’t going to match that dollar for dollar. But that kind of shift—24% lower CM treatment costs while maintaining udder health—is exactly the kind of “big math” that makes people sit up and ask, “Are we tube‑happy on our farm too?”

You Know This Step Already: Forestripping Still Matters

We can’t talk about selective treatment without talking about detection, because the whole program falls apart if you only find mastitis when the quarter is hard, and the cow is obviously miserable.

National Mastitis Council guidelines, along with extension programs from places like Wisconsin and Minnesota, still place a lot of emphasis on foremilk stripping into a strip cup or onto a dark surface, and on actually looking at that foremilk before you attach the unit. Reviews on on‑farm mastitis diagnostics have pointed out that subtle changes—slightly watery milk, a few fine flakes, a mild shift in colour—often show up before you feel heavy swelling or heat in the udder.

On the ground, in parlours from Ontario to Wisconsin, as many of us have seen, this step can quietly slip. In some operations, it becomes one quick squirt on the floor with barely a glance, and mastitis effectively doesn’t show up on the radar until things are already severe. In others, who’ve decided to do selective treatment or just take udder health seriously, you’ll see strip cups in every milker’s hand and people actually looking at what’s in them.

What’s encouraging is that it doesn’t take a big technology investment to tighten this up. A strip cup is cheap, and retraining people to use it mostly comes down to attention and habit. Once you’re catching more mild cases early, the idea of waiting 18–24 hours to see what grows on a plate in a non‑severe case doesn’t feel as risky as it does when every case you see is already advanced.

Robots and Sensors: Great Assistants, Not Autopilots

A lot of you are milking with robots now, especially in Western Canada, parts of Ontario, the Upper Midwest, and northern Europe. Whether it’s Lely, DeLaval, GEA, or another brand, your automatic milking system is already collecting a ton of data every milking: electrical conductivity, quarter yield, milking interval, flow curves, and in some setups, colour, blood, and somatic cell count.

The natural question is, “If the robot sees all this, do we still need strip cups and culture plates, or can we just let the system decide?”

A 2022 study out of Bavaria, published in the journal Animals, took a close look at that question. Researchers there evaluated four major AMS manufacturers on commercial Bavarian dairy farms and calculated the sensitivity and specificity of each system in detecting clinical mastitis under real‑world conditions.

AMS ManufacturerSensitivity (% of true mastitis detected)Specificity (% of non-mastitis correctly ruled out)What This Means in Plain LanguageFalse Positive Rate (approx.)Field Notes
Lely MQC / MQC-C~78%~86%Catches 78 of 100 real mastitis cases; flags ~14% of normal cows as mastitic~14%Colour, EC, temp; somatic cell if MQC-C enabled. Best sensitivity.
DeLaval MDi~61%~89%Misses ~39 of 100 mastitis cases; very conservative alerting (fewer false alarms, more missed cases).~11%Conductivity + blood detection + interval. Lowest sensitivity; flag for high-risk quarters.
GEA DairyMilk M6850~76%~79%Catches 76 of 100; flag rate on false positives is highest among the four (~21%).~21%Permittivity-based SCC categories; no reagents. Good yield of data; more labour on false checks.
Lemmer-Fullwood / Other~68%~92%Moderate detection; lowest false-positive rate. Conservative alerts, fewer wasted checks.~8%Specialty systems; strong on ruling out false mastitis. Slower to escalate.
Theoretical “Perfect” System99%+99%+Would catch nearly all real cases, rarely flag false alarms.<1%Not commercially available; cutting-edge machine learning in development labs.

They found that:

  • The Lely systems in the study showed sensitivity around 78% and specificity around 86%.
  • DeLaval systems came in with a sensitivity of around 61% and a specificity of around 89%.
  • GEA units had a sensitivity of around 76% and a specificity of around 79%.
  • Lemmer‑Fullwood systems showed sensitivity around 68% and specificity around 92%.

The authors described detection performance as “satisfactory,” which is fair. But they also pointed out that none of the systems achieved the 99% specificity needed to eliminate false alarms nearly, and that low specificity can mean more milk unnecessarily discarded and more staff time spent checking cows that ultimately aren’t truly mastitic.

It’s worth knowing what those alerts actually mean.

  • Lely’s Milk Quality Control (MQC) system tracks quarter‑level electrical conductivity, colour, and temperature. Farms that bolt on MQC‑C also get real‑time somatic cell count readings, a big step up in monitoring udder health.
  • DeLaval’s Mastitis Detection Index (MDi) combines conductivity, blood detection, and milking interval into a single score. Somatic cell counts are handled separately in the DelPro system.
  • GEA’s DairyMilk M6850 uses electrical permittivity to give quarter‑level SCC categories without needing reagents, which is attractive for some robot herds that want frequent SCC information.

And in the research world, people are layering machine‑learning approaches on top of SCC data and other signals to improve detection performance beyond these simple thresholds. Those systems have shown they can approach very high sensitivity and specificity when built and trained well, although they’re not yet standard on most commercial farms.

So, if we’re being practical, AMS data is powerful, but it’s not magic. Sensitivity in the 60–70‑something percent range means some mastitis cows are missed. Specificity below the mid‑90s means you’ll get some false positives. That’s fine, as long as you use the system for what it’s good at.

On better managed robot herds I’ve visited—from two‑robot setups in Quebec to larger systems in northern Europe—the farms getting the most out of the technology tend to use the alerts like this:

  • The robot generates an “attention list” based on MDi, MQC, conductivity jumps, yield changes, and milking intervals.
  • Staff treat that list as “cows to check,” not “cows to tube automatically.” They strip those cows, feel the udder, and decide whether it really looks like clinical mastitis or just a funky day.
  • If a quarter truly looks like non‑severe mastitis, they take a clean sample before treating and let their selective protocol, plus the culture result, guide whether they use an intramammary product.

When you treat AMS data as a list generator, not as an autopilot, you get the benefit of the technology without turning it into an expensive random‑number generator for mastitis treatments.

Key Numbers That Are Worth Putting a Pencil To

If you’re like most producers, you probably want to see what this looks like in numbers before you consider changing anything.

A few data points are worth having in your back pocket:

  • That 2023 meta‑analysis on non‑severe CM treatment found that, across thirteen studies, selective treatment based on bacterial diagnosis did not worsen bacteriological or clinical cure, SCC, milk yield, recurrence, or culling compared with blanket treatment, aside from a small increase in time to clinical cure.
  • In the 500‑cow Brazilian Holstein herd, clinical mastitis treatment costs dropped from US$27,559.97 in the blanket‑treatment year to US$17,884.34 in the first year of on‑farm culture–guided selective therapy—about a 24.23% reduction, roughly US$6,000 in that one year—while CM cases fell from 361 to 238, and overall CM treatment across the two years totalled US$45,444.31.
  • The Bavarian AMS study showed sensitivity values in the 61–78% range and specificity from just under 80%to the low 90s, depending on the manufacturer, with the authors warning that lower specificity increases labour and discarded‑milk costs due to false alarms.

Those numbers aren’t your herd, of course. Milk price, mastitis incidence, labour costs, and your payment system will change the exact dollars per cow or per hundredweight. But the pattern across these very different situations is pretty consistent: when you’re able to decide which quarters truly need intramammary treatment, and you stop tubing the ones that don’t, you usually see a meaningful drop in antibiotic use and CM treatment costs without wrecking udder health.

A Simple Three‑Phase Playbook That’s Working on Real Farms

What I’ve found is that the herds that make selective treatment work don’t usually jump straight from “treat everything” to a complicated new protocol overnight. They roll it in over time.

Phase 1: Tighten Up Detection

This is the lowest‑cost, lowest‑risk step, and it pays off whether you ever go fully selective or not.

  • Place a strip cup with a dark insert at each milking unit or in each AMS mastitis‑check area.
  • Build deliberate foremilk checks back into your milking SOP, not just in your head.
  • Use your own herd’s milk—jars of abnormal foremilk, photos, short parlour demos—as training material so everyone sees what “normal,” “borderline,” and “this is mastitis” actually look like in your barn.

In Ontario and Wisconsin operations that do this well, I’ve seen vets and milk quality advisors walk the parlour with staff, looking into strip cups together. You strip some cows, talk through which quarters you’d culture, which you’d treat on sight, and which you’d flag for monitoring. Those conversations often show you that people aren’t always reading the same cow the same way.

Phase 2: Run a 6–8 Week “Learning Phase” With On‑Farm Culture

Once you’re actually catching non‑severe cases early and consistently, the next step is to figure out what bugs you’re dealing with.

For six to eight weeks:

  • Pick a validated on‑farm culture system with your vet—something like the Minnesota Easy Culture System or another kit backed by a university.
  • Set up a simple incubator and a clean spot for plates, and train one or two key people in aseptic sampling and reading plates using extension resources.
  • Culture every clinical mastitis case you reasonably can, but don’t change your treatment protocol yet.

At the end of this “learning phase,” you’ll know:

  • What proportion of your CM cases are culture‑negative?
  • How many are gram‑negative versus gram‑positive.
  • Whether your current habit of tubing every non‑severe case is actually aligned with the kinds of infections that benefit most from intramammary therapy.

In many Midwest and Canadian herds that have done this, people are surprised by how many CM cases are either culture‑negative or mild gram‑negative infections with good spontaneous cure. In other herds, particularly where contagious mastitis is still an issue, they find more gram‑positive problems than they realized. In both cases, the conversation shifts from “studies say” to “this is what our plates are showing.”

Phase 3: Build a Written Selective CM Protocol With Your Vet

If your culture results and your comfort level say it’s a good idea, then it’s time to sit down with your herd vet and map out a selective treatment protocol that fits your reality.

The protocols that travel well between herds usually look something like this:

  • Severe CM cases—cows with fever, depression, or other systemic signs—are always treated aggressively and promptly with appropriate systemic therapy and, when indicated, intramammary products. No waiting for culture there.
  • Non‑severe cases—abnormal milk with possibly mild udder changes, but no systemic illness—should be sampled aseptically before any intramammary treatment. Often, they’ll also get an anti‑inflammatory for comfort while you’re waiting for results.
  • Culture‑negative non‑severe cases are typically managed without intramammary tubes, with clear monitoring instructions for the next several days.
  • Non‑severe gram‑negative cases are often managed with observation and supportive care, with systemic treatment ready to go if the cow deteriorates.
  • Gram‑positive cases receive intramammary treatment where evidence and experience suggest there’s a reasonable benefit, with product choice and duration agreed on with your vet.

In Canada, Dairy Farmers of Canada and the Canadian Dairy Network for Antimicrobial Stewardship and Resistance have highlighted this kind of selective, diagnosis‑based CM treatment as one of the key opportunities to reduce antimicrobial use without sacrificing udder health, and it lines up neatly with proAction’s expectations on protocols, veterinary involvement, and responsible drug use. In the U.S. and Europe, major mastitis reviews and one‑health antimicrobial guidelines are making the same point: selective treatment of non‑severe CM is one of the more practical levers farms can pull.

PhaseDurationKey Task(s)Main DeliverableCost & EffortExpected Payoff by End of PhaseSuccess Signal
Phase 1: Tighten DetectionWeeks 1–4 (parallel to normal ops)– Place strip cup at every unit 
– Retrain staff on foremilk checks 
– Use herd’s own milk as training reference 
– Spot-check compliance weekly
Written SOP for forestripping; trained staff; strip cups in use~$50 (strip cups) + 2–3 h management timeCatch 20–30% more non-severe cases early; catch cases beforeudder swelling severeForemilk checks are daily habit; staff can name “normal vs. mastitis” by look
Phase 2: Learning Phase (On-Farm Culture Pilot)Weeks 5–12 (8-week pilot)– Select culture system with vet (e.g., Minnesota Easy Culture) 
– Set up incubator & clean bench 
– Train 1–2 key staff on aseptic sampling & plate reading 
– Culture every CM case (continue normal treatment SOP) 
– Log & analyze results at weeks 4 and 8
Culture database of your herd’s pathogen breakdown: % culture-negative, % gram-neg, % gram-pos; cost per case baseline~$300–500 (kit, incubator, supplies) + 1–2 h/week staff time (reading plates)Know your herd’s pathogen mix; baseline CM costs; early confidence in “we can do this”% culture-negative cases, pathogen ratios, and staff competence confirmed; no major surprises
Phase 3: Build & Implement Selective ProtocolWeeks 13–24 (parallel ramp, then full protocol)– Sit down with vet; review phase 2 culture results 
– Draft written selective CM protocol (severe vs. non-severe; thresholds for tube vs. observe) 
– Train staff on new decision tree 
– Run first 4–6 weeks as “soft launch” (staff practice; vet checks calls) 
– Adjust protocol based on early feedback; go full by week 20 
– Measure outcome (SCC, cases, costs) at weeks 12, 24
Written, vet-approved selective CM protocol; staff trained & confident; data showing cost drop & SCC maintained~$0–200 (any consumables; mostly vet & management time) + 1–2 h/week for first 6 weeks (ramp)15–25% reduction in CM treatment costs (based on real herd data) 
Antibiotic use down 20–30% 
SCC & cure rates stable or improved
Herd costs drop $5,000–15,000 (scaled to size); staff confidence high; vet sees fewer auto-tube calls

People and Training: Where It Either Sticks or Slides Back

It’s worth noting—and you’ve probably seen this yourself—that nothing in mastitis management sticks just because it’s written down once.

Reviews of milking routines and mastitis risk keep coming back to the same thing: herds that combine written SOPsactual staff training, and periodic feedback tend to have better udder health than herds that just have “the way we do it” floating around in people’s heads.

In practice, on farms that make selective CM treatment part of their culture, you see things like:

  • An initial team meeting where someone walks through the herd’s CM numbers and costs, shows some culture results, and explains why the protocol is changing.
  • Short “toolbox talks” every few weeks in the parlour or robot room, going over a couple of recent CM cases and what was learned.
  • Occasional observation of milking and culture work by the herdsperson or manager, followed by specific, friendly feedback.
  • A yearly sit‑down with the vet—and sometimes the nutritionist—to review CM incidence, bulk tank SCC, mastitis‑related culls, antibiotic use, and the economics, then adjust the protocol if needed.

In many Wisconsin and Midwest operations, this kind of rhythm already exists for fresh cow checks or repro programs. Selective CM treatment just gets folded into that same cycle of “plan, do, check, adjust.”

When Selective Treatment Makes Sense—and When It Might Need to Wait

Selective CM treatment isn’t the right first move for every herd, and that’s okay.

It tends to work best on farms that:

  • Have bulk tank SCC at least under moderate control
  • Keep udders reasonably clean and dry in their freestalls or well‑managed dry lots
  • Have fairly stable milking routines across shifts
  • And have at least one or two people who can reliably handle sampling, culture plates, and record‑keeping

If your bulk tank SCC is high, contagious mastitis problems like uncontrolled Staph aureus are still walking the barn, or staff turnover is so high that basic milking routines aren’t consistent, then your best return in the short term is probably on the fundamentals: stalls, bedding, teat prep, fresh cow management through the transition period, and dealing with chronic high‑cell cows.

If your SCC is on fire, it usually makes more sense to put your energy into the basics first and treat it selectively as a second‑phase project once the house is more in order.

The research base is still growing, too. Most CM-selective treatment trials have been conducted in herds with at least reasonable monitoring and mastitis control. Newer studies are starting to tackle different pathogens and management systems, and we’re seeing some differences, like that 2024 gram‑positive RCT with Lactococcus. That’s why it’s helpful to treat the published data as a strong guide, but still test things against your own herd’s results.

So What’s the Take‑Home in 2025?

If you zoom out and look at this through a 2024–2025 lens—with more talk about antimicrobial stewardship, labour that’s not getting cheaper, and milk cheques that depend more than ever on SCC and butterfat levels—the idea of selective treatment for non‑severe clinical mastitis stops being a theoretical exercise and starts looking like a practical tool.

For a 100‑cow herd shipping on components, pulling even a few fewer high‑SCC cows out of the bulk tank over the year can be the difference between hanging onto a quality premium and watching it slip. For that 500‑cow Brazilian herd, a 24‑percent drop in CM treatment costs was worth about US$6,000 in one year—enough to matter for anyone’s budget.

If you don’t change anything else in your mastitis program this year, four moves are worth your time:

  1. Put real numbers on your mastitis costs. Work with your vet or advisor to tally up what CM is costing you in drugs, discarded milk, and mastitis‑related culls—per cow and per hundredweight—so you know what your current reflex is actually costing.
  2. Make strip cups and foremilk checks non‑negotiable again. Get strip cups into everyday use, retrain people as needed, and spot‑check that forestripping and visual checks are happening at every milking, whether you’re in a parlour or running robots.
  3. Run a six‑ to eight‑week on‑farm culture pilot. Culture every CM case you can without changing your treatment protocol yet, then sit down with your vet to look at what percentage of your cases are culture‑negative, gram‑negative, and gram‑positive.
  4. Use your own herd’s data to decide on a selective protocol. Don’t just copy the Brazilian farm or a university script. Use your culture results, your cost numbers, and your vet’s judgement to decide if selective treatment of non‑severe CM makes sense for your herd right now—and if it does, write it down and train people on it.

You know as well as I do that doing nothing usually means you keep spending on tubes that don’t always change outcomes, while other herds slowly move those dollars into genetics, better fresh cow programs, improved housing, and lower SCC.

In the end, the question isn’t simply “treat or not treat.” It’s: Which quarters actually pay to treat—and how do you figure that out reliably on your farm?

From that 500‑cow compost‑barn herd in southern Brazil to AMS barns in Europe and North America, the gap between guessing and knowing in mastitis treatment has turned out to be worth a lot more than the price of a strip cup. And quite often, the very first step in closing that gap isn’t new software or a new sensor. It’s a cheap strip cup in a milker’s hand and a small, intentional decision, right in the middle of a busy shift, to pause for a couple of seconds, really look at what’s coming out of each teat, and start letting that information guide where your tubes—and your mastitis dollars—actually go.

Key Takeaways

  • The blanket‑treatment reflex is costing you. A 2023 meta‑analysis of 13 trials found that selective treatment of non‑severe mastitis—guided by on‑farm culture—maintained cure, SCC, milk yield, and cow survival while cutting antibiotic use.
  • Real‑farm math: 24% lower mastitis costs. One 500‑cow Holstein herd dropped CM treatment spending from US$27,559 to US$17,884 in a single year—about US$6,000 freed up for genetics, transition‑cow programs, or equipment upgrades.
  • Your robot’s mastitis alerts aren’t gospel. Field data show that AMS systems achieve only 61–78% sensitivity and 79–92% specificity—great for building a “cows to check” list, but terrible for auto‑tubing decisions.
  • Start with a $15 strip cup, not new software. Restore real foremilk checks, run a 6–8 week on‑farm culture pilot, then build a vet‑approved selective protocol matched to your herd’s actual pathogen mix.
  • Not every herd is ready today—and that’s okay. If SCC is on fire, contagious mastitis is loose, or staff turnover is constant, lock down the basics first; selective treatment pays best when the foundation is solid.

Complete references and supporting documentation are available upon request by contacting the editorial team at editor@thebullvine.com.

Learn More

The Sunday Read Dairy Professionals Don’t Skip.

Every week, thousands of producers, breeders, and industry insiders open Bullvine Weekly for genetics insights, market shifts, and profit strategies they won’t find anywhere else. One email. Five minutes. Smarter decisions all week.
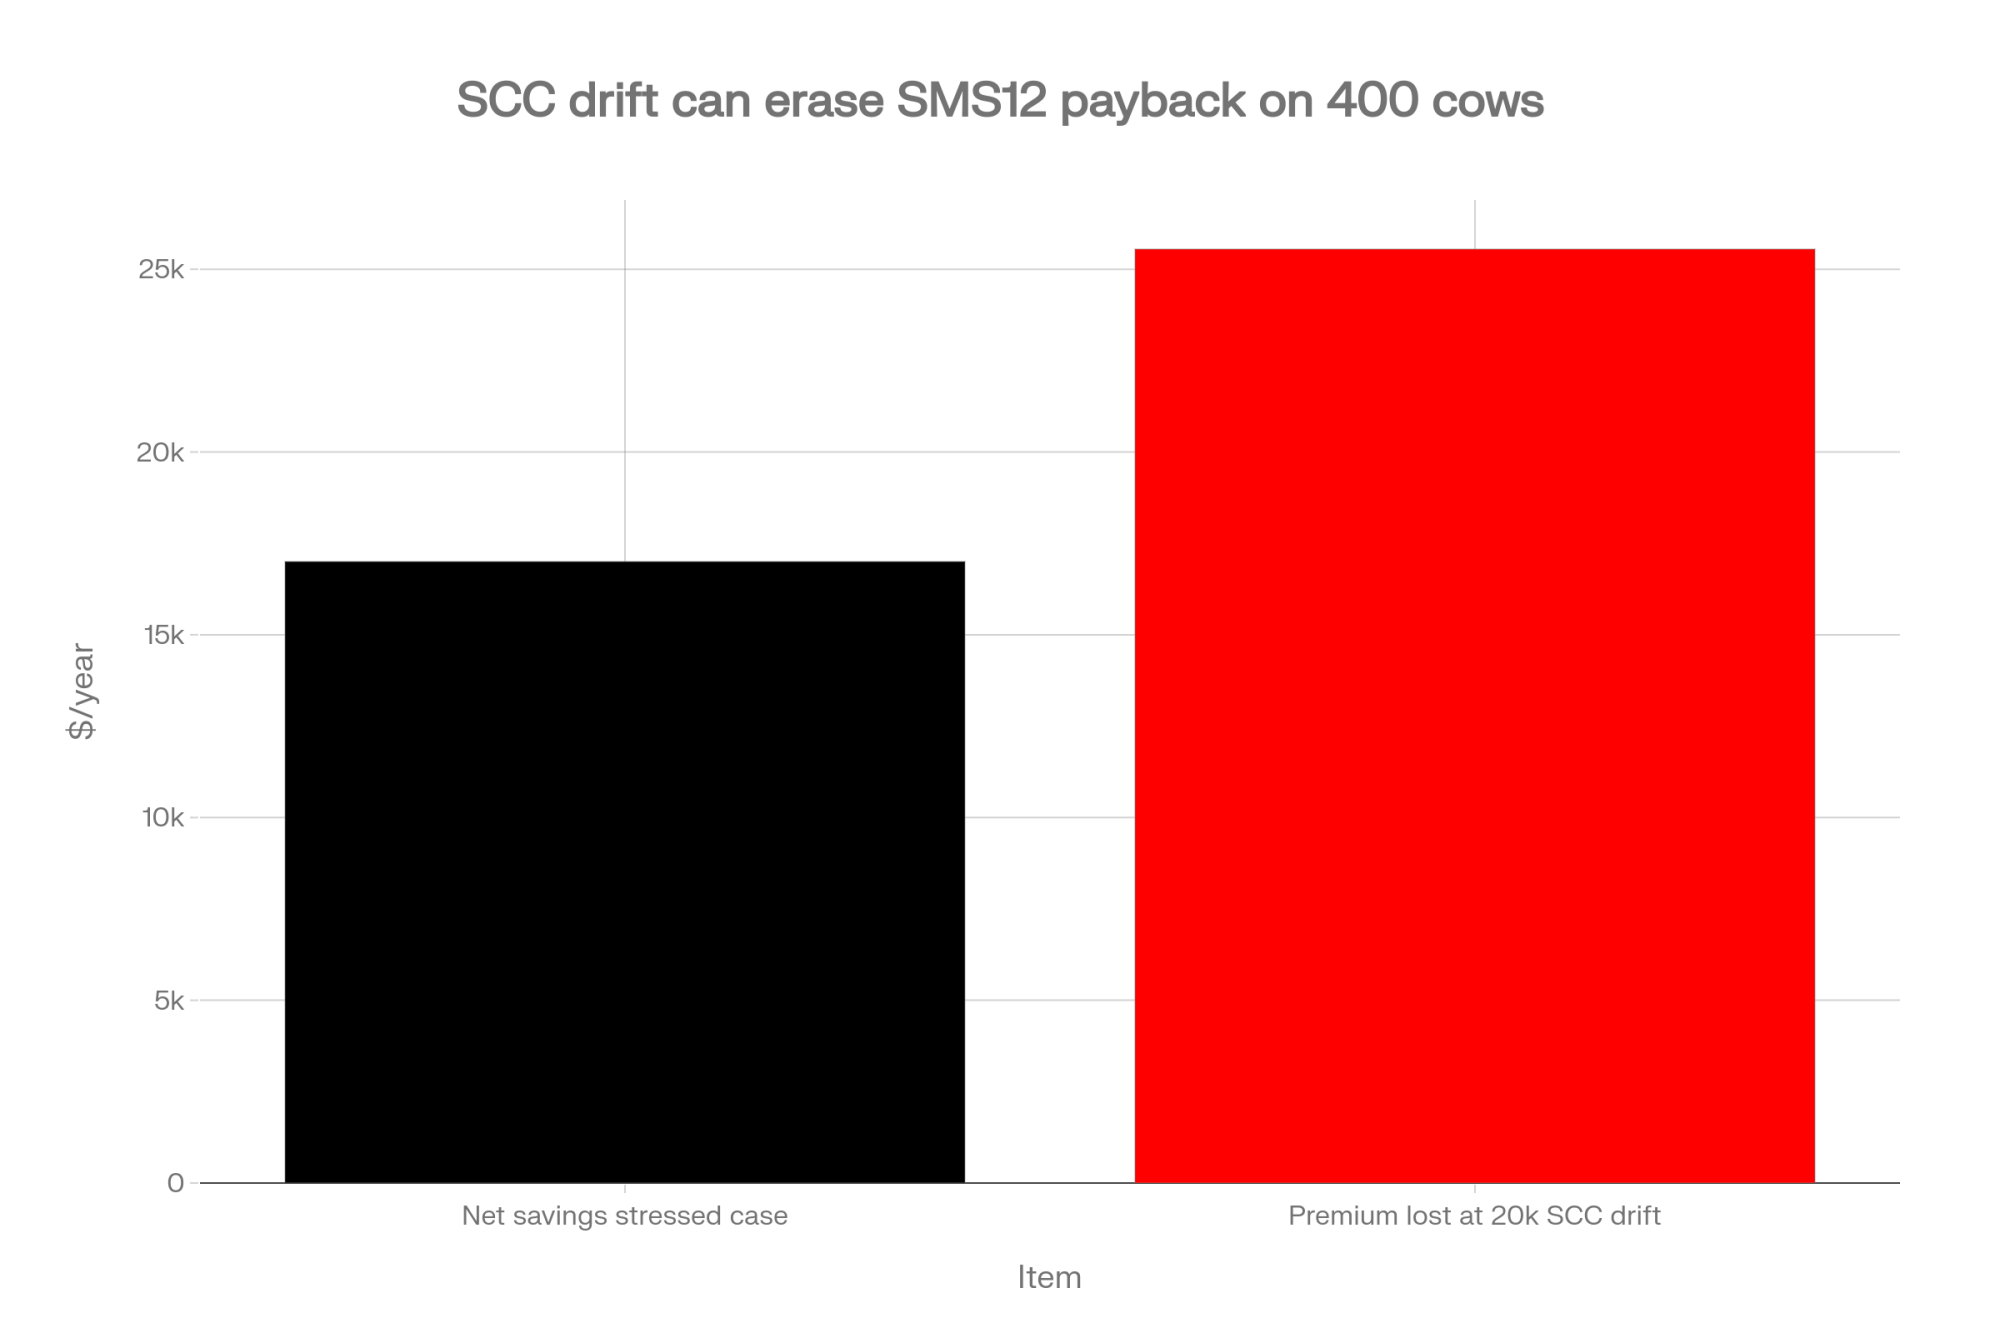
NewsSubscribe
First
Last
Consent

83% of Dairies Overtreat Mastitis – That’s $6,500/Year Walking Out the Door

Michigan State researchers found treatment costs varying threefold across similar operations. The difference wasn’t the antibiotics. It was the decisions.

EXECUTIVE SUMMARY: With Class III averaging $17-18 and margins under pressure, there’s $30,000-50,000 per year hiding in your mastitis protocols—and Michigan State research shows exactly where to find it. Dr. Pamela Ruegg’s team tracked 37 commercial dairies and found treatment costs varying threefold ($120 to $330 per case) for identical infections, with the gap driven entirely by decisions, not antibiotics. The core issue: 83% of producers treat longer than label minimum, adding $65/day in unnecessary milk discard because we treat until milk looks normal—even though bacterial cure precedes visual cure by 24-48 hours. On-farm culture cuts antibiotic use in half while maintaining outcomes, with typical payback under 90 days. The hardest part isn’t the protocol change; it’s trusting the science when you’re staring at off-looking milk on day three. But the economics don’t lie—and in today’s market, leaving $30K on the table isn’t something most operations can afford.

mastitis treatment costs

You know, when Dr. Pamela Ruegg’s team at Michigan State University started digging into mastitis economics across 37 commercial dairies—operations averaging around 1,300 cows each—they found something that really made me sit up and take notice. Out-of-pocket treatment costs for cases that were essentially identical ranged from $120 to $330 per farm. Same antibiotics. Same case severity. Nearly three times the cost difference.

That finding deserves some thought because it points to something a lot of us have probably sensed over the years but rarely put numbers to. We’ve accepted for a long time that mastitis runs about $250 per case and somewhere around $2 billion annually across U.S. operations—figures the National Mastitis Council has been citing for years now. Those numbers get repeated so often they’ve almost become white noise at conferences and in the trade publications. But here’s what the Michigan State work actually shows: those averages hide enormous variation in real-world outcomes. Some operations are spending well under $250 per case while getting solid results. Others are spending considerably more and still can’t seem to get ahead of their udder health challenges.

The difference, as Dr. Ruegg’s research suggests, comes down to decisions we can control: treatment duration, pathogen identification, prevention investment, and culling calculations. None of this requires fancy new technology or major capital investment. It does require taking a fresh look at some practices we might not have questioned in a while. And with 2024-25 margins under pressure—Class III averaging in the $17-18 range, feed costs still elevated—the buffer that used to absorb inefficiency just isn’t there anymore.

The Math Most of Us Have Been Using—And What the Research Actually Shows

Here’s where things get interesting. The way most of us have been calculating mastitis costs doesn’t capture what’s actually happening economically. Take a look at how traditional thinking stacks up against what the research reveals:

FactorTraditional MathThe Real MathAnnual Impact (500-cow herd)
Treatment DurationTreat until milk looks normal (5+ days)Label minimum often sufficient (2-3 days)$6,500+ in unnecessary discard
Days in Milk ImpactAll cases cost ~$250Early lactation: $444; Late lactation: ~$120Varies 3-4x based on timing
Subclinical Loss“Not a problem if the bulk tank is fine.”Accounts for 48% of total mastitis costs$33,000+ in hidden losses
Culling DecisionsHeifer cost minus cull valueFuture profit potential over the planning horizonCulling = 48% of clinical mastitis costs

Sources: Michigan State University (Ruegg, 2021); Canadian Bovine Mastitis Research Network (Aghamohammadi et al., 2018)

Understanding Where Cost Variability Comes From

Dr. Ruegg’s work at Michigan State, published in the Journal of Dairy Science back in 2021, breaks down exactly where this variation originates—and honestly, the findings offer some pretty clear direction for anyone willing to act on them.

Subclinical mastitis and culling decisions (shown in red) account for 96% of total mastitis costs—yet most operations only track clinical treatment and discarded milk 

Timing matters more than most of us probably realize. A case hitting a cow in her first 30 days fresh averages around $444 in total impact because that production hit follows her through the entire lactation. That same infection at 200 days in milk? You’re looking at something closer to $120, simply because there’s less lactation left to affect. Makes sense when you think about it, but how often do we actually factor timing into our treatment intensity decisions? In my experience, not often enough.

A mastitis case in the first 30 days costs $444 vs. $120 in late lactation—yet most operations apply identical treatment intensity regardless of timing

What’s causing the infection matters quite a bit, too. Your gram-negative cases—E. coliKlebsiella—tend toward more dramatic presentation but often resolve without intervention. Meanwhile, gram-positive infections generally respond well to appropriate treatment but won’t clear up on their own. The research consistently shows that gram-negative infections incur higher total costs due to their severity, even though many will self-cure if given time.

And then there’s treatment duration. This is where the Michigan State findings become immediately useful. Their data showed that each additional treatment day beyond label minimum costs approximately $65 in discarded milk and extended withdrawal. Think about what that actually means on your operation: an 80-pound cow at $18 per hundredweight generates $14.40 in daily milk value. Extend treatment for three days beyond what’s actually necessary? That’s $43 in direct milk loss right there, plus your antibiotic costs, plus labor time. It adds up faster than most of us realize.

The Hidden Economics Most of Us Miss

What I’ve come to appreciate over years of following this research—and talking with producers who’ve really dug into their numbers—is that our standard accounting does a surprisingly poor job capturing actual mastitis costs. We track what shows up on invoices. We miss what accumulates quietly in the background.

A study published in Frontiers in Veterinary Science back in 2018 really quantified this gap in a way that hit home for a lot of folks I’ve discussed it with. Researchers from the University of Montreal and the Canadian Bovine Mastitis Research Network tracked 145 commercial operations and calculated total mastitis costs at CAD $662 per cow annually across the herd. Now, that’s not per case—that’s per cow in the milking string, whether she had clinical mastitis or not. And here’s the kicker: subclinical mastitis accounted for nearly half of those costs, with milk yield reduction being the biggest hidden driver.

Think about what typically shows up on your books: antibiotic purchases, discarded milk during withdrawal, vet visits for the severe cases, and labor during treatment. Now think about what usually doesn’t show up anywhere: the production drop that persists after an early-lactation infection clears, the extra days open that subclinically infected cows tend to accumulate, the culling decisions made without complete economic analysis, the bulk tank SCC that hovers just under penalty thresholds but quietly costs you quality premiums month after month.

I’m not pointing fingers here—the economic feedback most operations receive is simply incomplete. But that incomplete picture can lead us to underinvest in prevention and make treatment decisions that don’t really optimize for what matters most to the bottom line.

Reconsidering How Long We Treat

This is where the research translates most directly into money you can actually keep.

That same Canadian study found something really interesting about how producers actually handle treatment. Among farmers using a single protocol for mild or moderate cases, 83% were treating for longer than the labeled regimen—averaging about two extra days beyond the protocol’s duration. Only 17% were following the label duration exactly. If you think about your own habits or watch what happens in your parlor, those numbers probably ring true.

And look, the tendency to keep treating when milk still looks abnormal makes complete sense. You’re looking at clumpy milk on day three, and every instinct you’ve developed over years of working with cows tells you “she’s not better yet.” That’s a reasonable instinct. I get it.

But here’s what the biology actually shows, and this is worth really understanding: clinical cure—milk appearance returning to normal—lags biological cure by 24-48 hours. The bacteria can be cleared while the inflammation is still resolving. The udder is healing, even though the milk still doesn’t look quite right. Treating through visual normalization often means you’re medicating a cow whose infection has already resolved. As Dr. Ruegg puts it, the abnormal milk appearance is due to inflammation, and it’s not predictive of whether bacteria are still present.

Research from California, published in the Journal of Dairy Science, tracked non-severe gram-negative cases across different treatment protocols and found that a 2-day treatment achieved equivalent clinical outcomes to a 5-day treatment—at meaningfully lower cost. For operations running a typical mastitis incidence, those savings compound pretty quickly over a year.

I talked with a Wisconsin herd manager not long ago who shared his experience implementing shorter protocols: “First month was brutal,” he told me. “My lead milker was absolutely convinced I was going to kill cows by stopping treatment at two days. Milk still looked off in a couple of them. I had to stand between him and the treatment box physically. Three days later? Milk was normal. He’s a believer now, but we had to get through that crisis of faith first.”

83% of producers extend treatment beyond label minimum, adding $65 per day in unnecessary milk discard—even though bacterial cure precedes visual cure by 24-48 hours 

That psychological barrier—trusting the biology over what your eyes are telling you—seems to be the hardest part of making this change. The research supports shorter treatment for non-severe cases. The economics favor it clearly. But in the moment, standing in front of a cow showing abnormal milk… it takes real discipline to trust the science over your instincts.

Why Some Infections Just Won’t Clear—The Biology Most of Us Never Learned

Here’s something that wasn’t in the textbooks when most of us were coming up: bacteria talk to each other. And that communication—scientists call it quorum sensing—might explain why that chronic mastitis case keeps coming back no matter what you throw at it.

The basic concept is this: bacteria aren’t just mindless individual cells floating around waiting to be killed by antibiotics. They’re sophisticated communicators. Through quorum sensing, they release signal molecules to detect how many similar bacteria are nearby. When the population reaches a critical mass, they undergo what researchers describe as a phenotypic shift—essentially flipping a switch that triggers coordinated group behavior.

And one of the most important things that switch turns on? Biofilm formation.

You’ve probably seen biofilm in your water troughs or pipeline—that slimy layer that builds up over time. The same thing happens inside the udder. Research published in Frontiers in Veterinary Science in 2021 confirms that Staphylococcus aureus, one of our most problematic mastitis pathogens, forms biofilm communities inside udder tissue. Once established, these bacterial fortresses become remarkably difficult to eliminate.

Here’s why that matters for treatment: bacteria within a biofilm can be up to 1,000 times more resistant to antibiotics than the same bacteria floating freely. It’s not that the antibiotic doesn’t work—it’s that the biofilm creates a physical barrier AND, perhaps more importantly, bacteria inside biofilms actually change their gene expression. They essentially turn off the cellular processes that antibiotics are designed to target.

Dr. Johanna Fink-Gremmels, a veterinary pharmacology specialist, puts it this way: “Bacteria within a biofilm change their gene expression. They may turn down protein or membrane synthesis, which are common antibiotic targets, making the antibiotics ineffective because their target is gone.”

That’s a fundamentally different problem than what we typically think about with treatment failure. We’re not just dealing with resistant bacteria—we’re dealing with bacteria that have essentially hidden themselves and gone dormant until the threat passes.

This helps explain some patterns we’ve all probably noticed. That quarter that clears up after treatment but flares again three weeks later? Likely a biofilm reservoir that was never eliminated. The chronic subclinical case that never quite gets below 400,000 SCC no matter what you do? Same story.

What’s particularly interesting—and honestly, a bit concerning—is that sub-therapeutic antibiotic exposure can actually trigger biofilm formation. The bacteria sense a threat that isn’t quite strong enough to kill them, and they respond by building more protection. It’s a reminder that partial treatment or insufficient duration can sometimes make things worse rather than better.

The emerging research is exploring ways to disrupt quorum sensing itself—blocking the bacterial communication that coordinates biofilm formation in the first place. Some plant-derived compounds show promise for jamming these bacterial signals. A study from Texas A&M found that certain phytogenic compounds can reduce biofilm formation by 60-88% by interfering with quorum sensing pathways.

Now, I want to be careful here—this is still relatively emerging science, and I’m not suggesting everyone should abandon proven protocols for the latest thing. But understanding these mechanisms helps explain why:

  • Chronic S. aureus infections are so difficult to cure (biofilm formation is particularly strong)
  • Early-lactation infections can establish persistent problems (bacteria have time to form biofilms before immune function fully recovers)
  • Prevention consistently outperforms treatment economically (avoiding biofilm establishment is far easier than eliminating it)
  • On-farm culture matters more than we might think (knowing you’re dealing with a biofilm-prone pathogen changes the calculus)

For practical purposes, this biology reinforces what the economics already tell us: preventing infections from establishing is worth far more than treating them after the fact. And when you do have persistent problems, understanding that you may be dealing with protected bacterial communities—not just stubborn individual cells—changes how you think about the challenge.

It’s also worth noting that biofilm can form in your equipment, not just in udders. That slimy layer in water troughs or pipeline? Research from the University of Wisconsin suggests it can reduce water palatability enough to cut intake—and every pound of reduced water consumption costs you roughly a pound of milk. Keeping equipment truly clean, not just visibly clean, matters more than most of us probably realize.

The Value of Actually Knowing What You’re Treating

If treatment duration is probably the most accessible economic lever, bacterial identification might be the most impactful one over the long haul. The value of knowing what you’re actually dealing with becomes pretty obvious when you look at pathogen-specific outcomes.

Penn State extension has documented this stuff for years now. Here’s what systematic culturing typically reveals—and what it means for your treatment decisions:

Culture ResultFrequencyRecommended ActionEconomic Impact
No Growth10-40%Do not treatSaves antibiotics + 2-5 days milk discard
Gram-Negative25-35%Supportive care; short duration if treatedPrevents 2-3 days of unnecessary discard
Gram-Positive30-50%Targeted antibiotic therapyHigher cure rate with appropriate treatment

Source: Penn State Extension; Journal of Dairy Science

Farms implementing on-farm culture consistently report around 50% reductions in antibiotic use while maintaining or even improving cure rates. They’re using half the antibiotic and achieving comparable or better outcomes because they’re matching treatment to what’s actually happening in that quarter.

Operations implementing culture-guided protocols cut antibiotic use by 50%, reduce costs by 40%, and eliminate 80% of unnecessary treatments—all while maintaining or improving cure rates

The economics pencil out for most operations:

  • System cost: $2,500-3,000 for a quad-plate setup
  • Per-case culture cost: ~$10-15, including supplies and labor
  • Typical payback: 60-90 days for operations running industry-average mastitis incidence

Penn State’s extension materials emphasize that trained producers can achieve high accuracy in decisions that actually matter—distinguishing gram-positive from gram-negative from no growth. You don’t need laboratory-level precision here. You need enough accuracy to guide treatment decisions, and that’s absolutely achievable with proper training and consistent technique.

Culture ResultFrequencyRecommended ActionEconomic Impact Per Case
No Bacterial Growth10-40% of casesNO treatment neededSave $130-195
Gram-Negative
(E. coli, Klebsiella)
25-35% of casesSupportive care; short duration if treatedSave $65-130
Gram-Positive
(Staph, Strep)
30-50% of casesTargeted antibiotic therapy (2-3 days)Optimize drug selection
Contaminated Sample5-15%
(poor technique)
Re-sample with better aseptic techniqueWaste $10-15

Prevention Economics – Where the Real Returns Hide

There’s a tendency in our industry to view prevention as an expense category and treatment as the necessary response to problems that inevitably arise. The research suggests we might have that framing exactly backwards.

Post-milking teat disinfection emerges across virtually every study as the highest-ROI intervention. That Canadian study I mentioned earlier found 97% of participating farms were already using post-milking teat dipping—it’s become nearly universal because the returns are so clear and immediate. For any operation that isn’t doing this consistently, it’s probably the clearest opportunity out there.

Selective dry cow therapy is another area where research increasingly supports approaches different from the traditional blanket treatment most of us grew up with. Dr. Ruegg’s team at Michigan State examined what happens when farms move from blanket treatment to selective protocols—treating only infected or high-risk cows based on SCC history while applying internal teat sealants universally. They found potential for about 50% reduction in antibiotic use and estimated savings of roughly $5.37 per cow with equivalent or superior early-lactation udder health outcomes.

Now, this approach does require more management intensity and solid record-keeping, so it won’t fit every operation equally well. But for farms with the systems to implement it properly, the economics look pretty favorable.

InterventionInitial InvestmentPayback PeriodAnnual Savings (500-cow herd)Antibiotic Use Impact
On-Farm Culture System$2,500-3,00060-90 days$6,500+-50%
Post-Milking Teat Dip$800-1,200/yearImmediate$8,000-12,000Prevents infections
Selective Dry Cow Therapy$1,500-2,000 setup4-6 months$2,685-50%
Extended Treatment (Beyond Label)$0Loses $6,500/year-$6,500+35% (wasted)

The Norwegian dairy industry offers what might be the most comprehensive example of what prevention-focused economics can achieve at a whole-industry scale. Their systematic implementation of prevention priorities, mandatory health recording, and selective treatment protocols reduced national mastitis costs from 9.2% to 1.7% of milk pricebetween 1994 and 2007. They now report the lowest antibiotic use per kilogram of livestock biomass among all the European countries being tracked.

That kind of transformation didn’t happen overnight or by accident—it required infrastructure investment, aligned incentives across the supply chain, and genuine cultural change throughout their industry. But it demonstrates what becomes possible when prevention rather than treatment becomes the default mindset.

The Culling Calculation Worth Revisiting

Here’s a calculation I think a lot of farms are getting wrong, and it’s costing real money in both directions—keeping cows too long and culling too soon.

The common approach most of us use: replacement heifer cost minus cull cow sale value. With heifers running $3,000-4,000 and cull cows bringing $1,800-2,300 these days—those cull values are at historic highs, by the way—that math suggests a $1,200-2,200 replacement cost from culling. The narrowed gap might make culling seem more attractive on paper, but that simple calculation still misses what actually matters.

What’s the difference in future profit potential between keeping this specific cow versus replacing her with a specific heifer?

Think through a practical example. A second-lactation cow at 150 days in milk develops mastitis. Production drops from 75 to 68 pounds daily. She’s open but otherwise healthy.

  • Simple transaction math says culling costs around $1,500 (heifer price minus elevated cull value).
  • A complete economic analysis considers her remaining profit potential—finishing this lactation, completing a third lactation at mature-cow production levels, and eventual cull value—compared with what a replacement heifer would generate over the same timeframe.

That fuller analysis often favors keeping her despite the mastitis episode. The infection dropped her production, sure, but she may still be worth more than her replacement over the relevant planning horizon.

What’s particularly telling: that Canadian study found culling represented the largest single cost component for both clinical and subclinical mastitis—accounting for about 48% of clinical mastitis costs. That magnitude suggests these decisions deserve more systematic analysis than they typically get.

Even with today’s elevated cull values narrowing the replacement cost gap, the fundamental point remains: cows that would have been clear culling candidates when heifers cost $1,800 now have positive retention value at $3,500 heifers. The economic decision point has shifted. The question is whether our decision frameworks have shifted along with it.

The Subclinical Challenge That Keeps Nagging

Bulk tank SCC shows up on every pickup report. It’s probably the most frequently measured metric we have in dairy. Yet subclinical mastitis continues to cause estimated annual U.S. losses of $1 billion+, according to the National Mastitis Council. Why does that gap between measurement and management persist?

The limitation is that bulk tank SCC only tells you the aggregate average. It doesn’t tell you which cows are infected, how long they’ve been dealing with it, or whether the situation is trending better or worse.

A reading of 185,000 cells/mL could represent a herd with 85% healthy cows and 15% chronic infections. Or it could mean widespread low-grade infection that’s building toward clinical outbreaks. Same number, completely different situations requiring completely different responses.

A Pennsylvania producer shared a story with me that illustrates this really well: “We were running 178,000 bulk tank, feeling pretty good about ourselves,” he said. “Then we actually pulled the DHI data and found 14 cows averaging over 400,000 that weren’t showing any clinical signs. Given the production losses those cows were experiencing, we were bleeding money on milk that never even made it to the tank. The bulk tank number had us thinking everything was fine when it really wasn’t.”

Farms that manage subclinical mastitis effectively tend to have systematic protocols that convert data into specific, actionable decisions. They set clear thresholds: culture any cow over 200,000 on consecutive tests; immediate intervention at 400,000; and specific action plans at each level. They review watchlists weekly rather than just filing the DHI report and moving on to the next thing.

Regional and Seasonal Context

These economics aren’t uniform everywhere, and that’s worth acknowledging directly. The figures I’ve been citing primarily reflect Upper Midwest, Northeast, and Canadian commercial operations—the regions where most of this research has been conducted.

Southeast dairies deal with different realities. Heat stress and humidity create environmental mastitis challenges that shift the pathogen mix considerably. Summer months typically see more E. coli and Klebsiella from bedding contamination, while contagious pathogens spread more readily in winter housing. California’s large dry lot operations have different exposure patterns than Wisconsin freestalls. Organic operations face additional considerations regarding treatment options that significantly affect the calculations.

Smaller operations may find some interventions don’t quite pencil out at their scale—the fixed costs of on-farm culture systems require sufficient case volume to justify the investment.

The principles apply broadly: know your pathogens, match treatment to actual need, invest in prevention, and make culling decisions based on complete economics. But the specific numbers need local calibration.

The Implementation Reality

It’s worth being direct about why more farms haven’t adopted practices the research so clearly supports. The economics favor on-farm culture and selective treatment. Payback periods are short. Returns are well-documented. And yet adoption remains pretty modest across the industry.

Part of it is the psychology I already mentioned—trusting biology over visual appearance, accepting that abnormal-looking milk doesn’t always mean more treatment is needed. That runs against instincts we’ve built over entire careers.

Part of it is implementation discipline. The farms that succeed with culture-based protocols treat them like any other systematic management approach: written protocols everyone follows, trained staff at every level, and regular review of outcomes. The farms that struggle tend to treat it more casually—doing it when convenient, following culture results except when it doesn’t feel right. That second approach rarely holds up over time.

Sample contamination is another common practical failure point. Without solid aseptic technique, you get plates showing multiple bacterial species that can’t actually guide treatment decisions. When contamination rates run too high, farms often conclude the whole system doesn’t work—when really their collection technique just needs some refinement.

A veterinarian who consults with a lot of Upper Midwest operations framed it this way when I talked with him: “The farms that succeed have written protocols, trained staff, and monthly review meetings where we examine outcomes together. The farms that struggle treat it like a suggestion. That second approach just doesn’t hold up.”

Looking Ahead

Several forces seem likely to shape mastitis economics over the coming years.

Processor requirements are evolving beyond simple SCC penalties toward documentation of antimicrobial stewardship practices. Export markets and retail buyers increasingly demand verification of responsible antibiotic use, pushing processors to ask more of their suppliers. This trend isn’t going away—and producers who wait for processors to mandate culture-based protocols will find themselves implementing under pressure rather than capturing savings on their own timeline.

Technology keeps making selective treatment more practical. Activity monitoring systems from companies like SCR, Afimilk, and others increasingly incorporate udder health alerts that flag quarters before clinical signs appear. Inline sensors that measure conductivity and other milk parameters can detect problems earlier than visual observation alone. As these systems become more prevalent and affordable, the practical obstacles to selective treatment continue to diminish.

And economic pressure keeps forcing optimization throughout the industry. At current input costs and milk prices, the margins that once absorbed some inefficiency just don’t do that as comfortably anymore. Avoidable mastitis costs that might have been tolerable at better margins become harder to carry when overall profitability is tight.

Key Takeaways

On treatment economics:

  • Research supports label-minimum treatment durations for non-severe cases
  • Each extra treatment day costs approximately $65 in discarded milk
  • Biological cure precedes visual normalization by 24-48 hours—milk can look abnormal even after the infection has cleared

On bacterial identification:

  • On-farm culture systems typically achieve a 60-90 day payback
  • 10-40% of clinical cases show no bacterial growth—treating these provides zero benefit
  • Knowing the pathogen enables targeted therapy with better economic outcomes

On prevention investment:

  • Post-milking teat disinfection consistently shows the highest returns
  • Selective dry cow therapy can reduce antibiotic use by approximately 50% while maintaining udder health
  • Subclinical mastitis accounts for nearly half of the total mastitis costs in most studies

On culling decisions:

  • Simple transaction math (heifer cost minus cull value) still misses future profit potential—even with today’s elevated cull prices
  • At current heifer prices, many cows previously culled now have positive retention value
  • Culling accounts for 48% of clinical mastitis costs—these decisions matter

On implementation:

  • Written protocols consistently outperform verbal agreements
  • Cross-training multiple staff members prevents knowledge loss when people move on
  • Regular reviews make ROI visible and maintain protocol adherence
  • Veterinary partnership provides valuable expertise for protocol development and troubleshooting

Resources for Further Reading

For producers interested in exploring these approaches further, several university extension programs offer detailed implementation guidance:

  • Penn State Extension: On-farm culture training materials and mastitis treatment protocols at extension.psu.edu
  • University of Wisconsin Milk Quality Program: Decision support tools and economic calculators at milkquality.wisc.edu
  • Michigan State University Extension: Mastitis economics research and practical recommendations at canr.msu.edu/dairy
  • National Mastitis Council: Industry guidelines and research summaries at nmconline.org

The Bottom Line

The research points toward real opportunities for operations willing to examine their protocols against current evidence. The changes involved aren’t revolutionary—optimized treatment duration, bacterial identification, systematic prevention, more complete culling calculations—but the cumulative impact on farm economics can be pretty substantial. For a 500-cow herd running industry-average mastitis rates, the difference between optimized and traditional protocols could mean $30,000-50,000 in annual margin. That’s real money sitting in decisions you make every day.

For operations considering these approaches, documenting your current costs as a baseline, followed by a veterinary consultation on protocol options, provides a sensible starting point. The economics appear favorable for most situations. Implementation requires discipline and systematic follow-through. Whether that fits your operation’s circumstances, capabilities, and management style is ultimately a judgment only you can make—but at least now you’ve got solid numbers to inform that decision.

Next time you’re standing in the parlor on Day 3 of a treatment, put the tube back in the box and trust the biology. Your bottom line will thank you.

Complete references and supporting documentation are available upon request by contacting the editorial team at editor@thebullvine.com.

Learn More

The Sunday Read Dairy Professionals Don’t Skip.

Every week, thousands of producers, breeders, and industry insiders open Bullvine Weekly for genetics insights, market shifts, and profit strategies they won’t find anywhere else. One email. Five minutes. Smarter decisions all week.
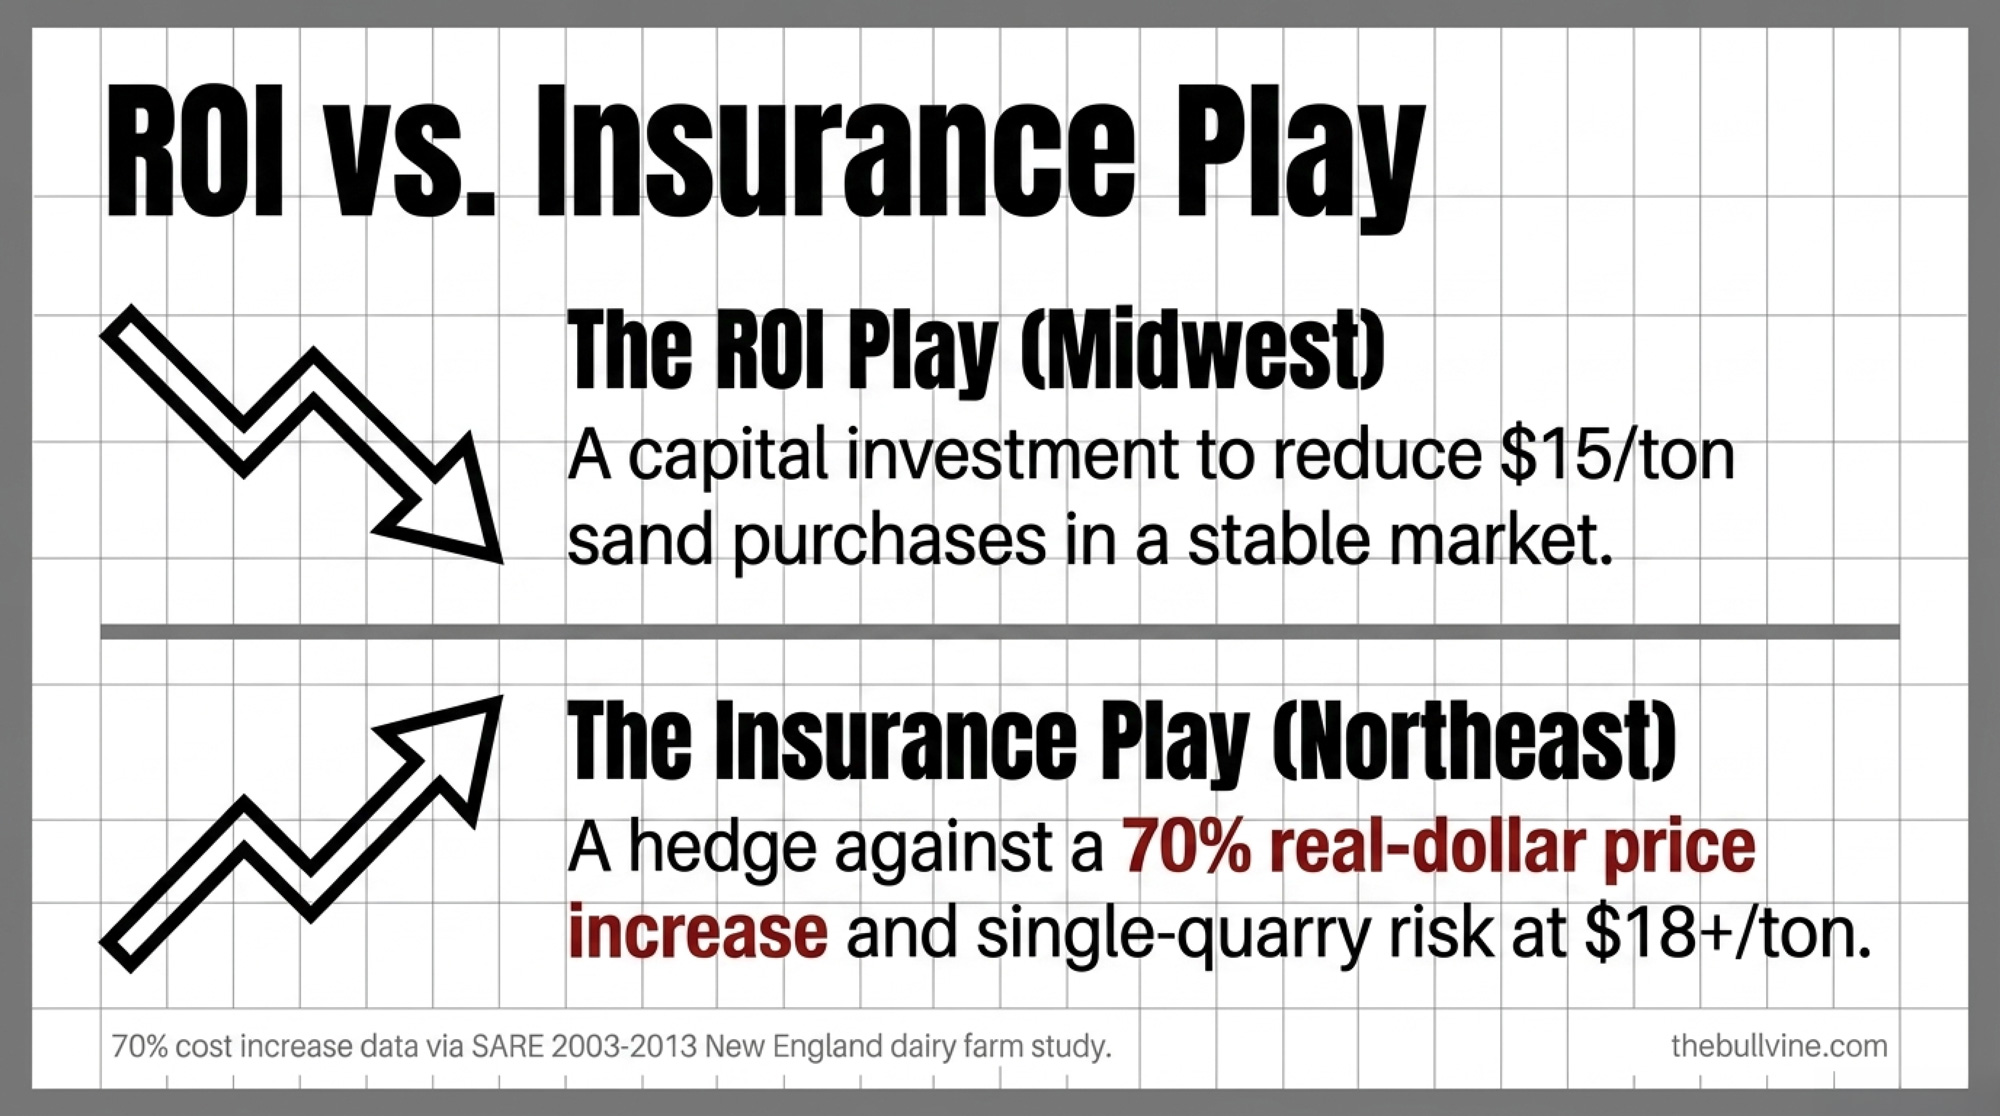
NewsSubscribe
First
Last
Consent

Choosing the Right Teat Dip: Myths and Facts for Dairy Farmers

Are you using the right teat dip for your dairy farm? Discover how to choose the best one to prevent mastitis, save money, and ensure high-quality milk production.

Have you thought about the significant influence the teat dip you apply has on your dairy farm? The condition of your cows and the quality of your milk output depend much on this little choice. Not only are teat dips essential, but they also serve as the first line of protection against mastitis, a disorder directly influencing production and quality. Join us as we bust common misconceptions regarding teat dips and help you decide which best fits your farm. The proper mix improves the quality of your milk, your dairy’s profitability, and your herd’s general state. Come along as we dispel misconceptions and provide practical guidance on choosing the best teat dip for your farm. By then, you will be ready to make decisions to safeguard your herd and boost production.

The Role of Teat Dips in Dairy Farming 

To protect against infections, teat dips—liquid disinfectants—are applied to dairy cows’ teats before and after milking. These dips, which serve as the first line of defense against mastitis, an inflammatory udder condition, are crucial for dairy farming operations. Their role in reducing the bacteria count on the teat skin not only ensures the production of high-quality milk but also provides a reassuring barrier against illness.

Beyond simple contamination prevention, teat dips are essential for preserving udder health in dairy production. The correct application guarantees uniform coating, forming a barrier against external factors and lowering fissures and sores where germs may flourish. Teat dips can include emollients like glycerin or lanolin to keep the skin flexible and stop dryness and chapping.

Furthermore, teat dips may significantly avoid mastitis, one of the most expensive illnesses in dairy production. Following pre- and post-milking dipping procedures helps farmers improve milk quality while also helping to maintain a low somatic cell count in the milk—an indication of excellent udder health. This monitoring is crucial for securing quality premiums and guaranteeing economic sustainability.

Teat dips are critical for preventing mastitis and enhancing udder health. Farmers can guarantee sound milk output and protect the welfare of their herds by choosing the correct teat dip and consulting milk quality experts.

Debunking the Iodine Myth: Exploring Diverse Germicide Options for Teat Dips

Although most dairy farms believe iodine is the best teat dip germicide, current developments have provided other substitutes with either similar or better effects. For high-yield operations where udder health is critical, chlorhexidine—for example—is hailed for its broad-spectrum antibacterial qualities and long-lasting residual action and known for their efficient cleaning and mildness on teat skin, hydrogen peroxide-based dips shine, especially in challenging weather or with sensitive animals.

Furthermore, lactic and salicylic acids are well-known for their quick action and adaptability in various surroundings. These substitutes challenge iodine’s supremacy and let dairy producers choose the most suitable germicide for their situation, improving udder health and milk quality.

Eventually, the emphasis should be on knowing the many germicides accessible rather than depending only on iodine. This will help dairy producers make wise judgments that guarantee their teat dips fit their particular agricultural environment.

The Synergy Between Germicides and Emollients: Ensuring Comprehensive Teat Health 

Any conscientious dairy farmer must realize that a germicide in a teat dip only counts somewhat. Although they destroy microorganisms well, germicides cannot guarantee the cow’s teats’ general protection. Emollients then become necessary.

Emollients assist in preserving and rebuilding the skin’s natural barrier. Varying weather and frequent milking may dry and split teats, increasing their infection susceptibility. Emollients improve cow comfort by keeping the teat skin smooth and less injury-prone, avoiding pathogen entry into the udder.

Formulating a teat dip requires balancing emollients and germicides to improve effectiveness. The proper proportion guarantees that the germicide kills dangerous bacteria without compromising the integrity of the skin. Specific formulas, for instance, have a vivid green hue that ensures coverage and efficacy for apparent assurance of appropriate dipping.

A premium teat dip, made under Good Manufacturing Practices (GMPs), aggregates these elements to provide complete protection. GMPs ensure that the teat dip is produced in a clean and controlled environment, free from contamination. Regular assessment of dipping techniques and full execution of dipping rules help strengthen this protection, improving udder health and producing better-quality milk.
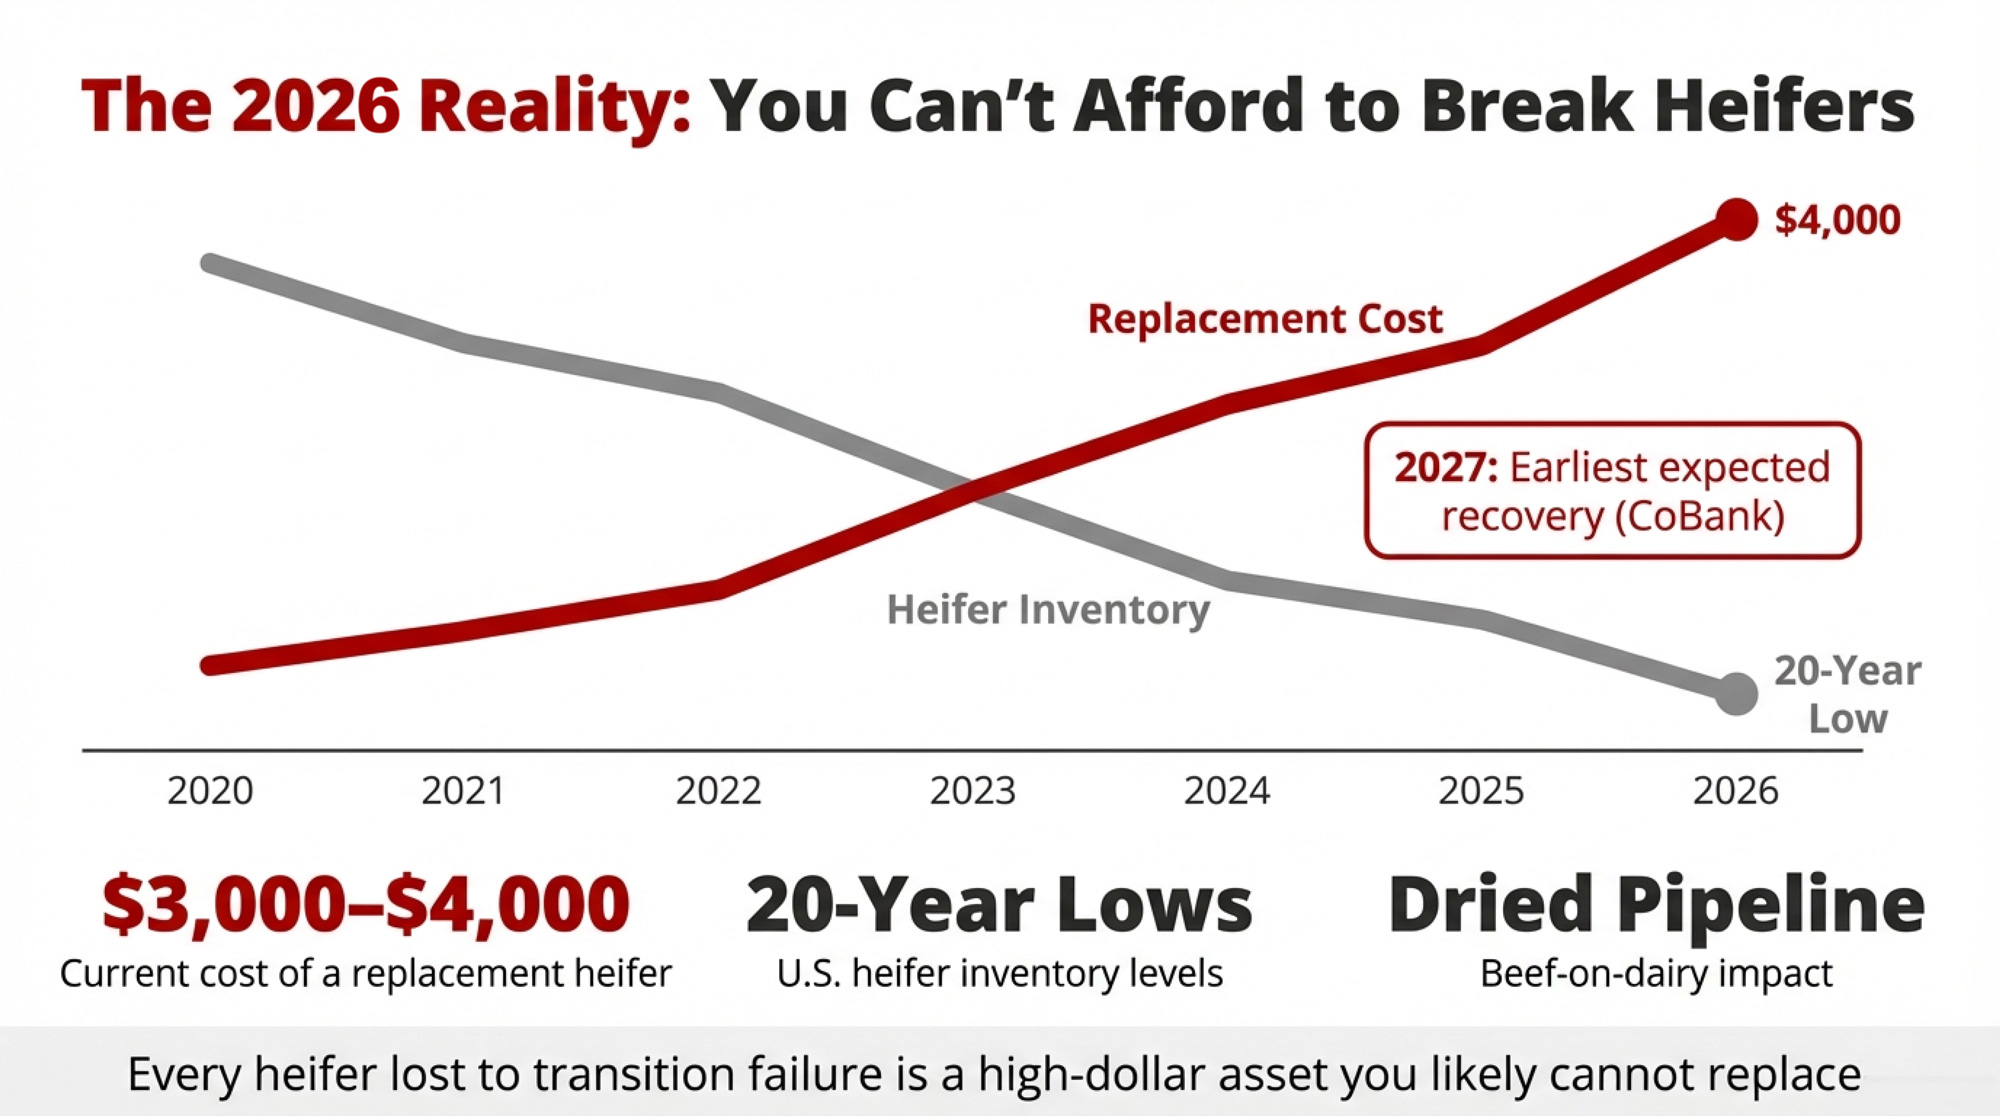
Dispelling the One-Size-Fits-All Myth: Tailoring Teat Dip Formulas to Individual Farm Needs 

Many people think that the same teat dip recipes apply everywhere. However, this needs to include the particular requirements of every dairy. Herd size, environmental factors, and specific farm needs vary substantially. A method perfect for a small farm may not work well for a large-scale business. Larger herds could require stronger germicides, whereas smaller farms might concentrate on emollients for improved skin conditions.
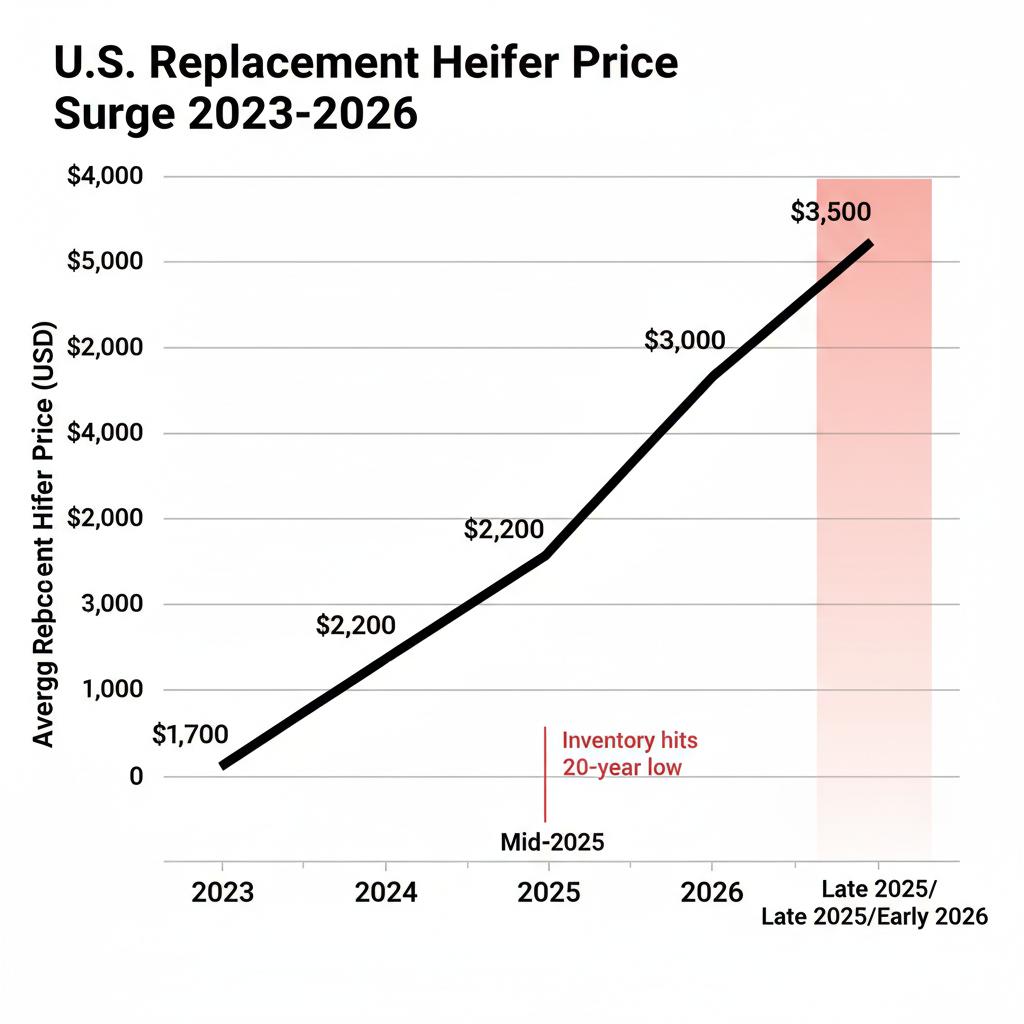
Another very vital factor is the weather conditions. While farms in humid climates may need moistening dips to avoid chapping, farms in brutal winters might need fast-drying dips to prevent frostbite. Customizing the teat dip to the particular situation of your farm guarantees good disinfection and enhances teat health.

Think through your farm’s particular requirements. While some might find recipes suited for all-year-round housed herds, others would benefit from colored dips for visual coverage checks. By tackling these many elements, farmers may pick the best teat dip, thus improving udder health, keeping low somatic cell counts, and guaranteeing top-notional milk output.

Strategic Teat Dip Selection: Safeguarding Herd Health and Maximizing Dairy Farm Profitability 

Selecting the correct teat dip to protect your herd against mastitis is crucial. Customizing the mixture to fit your farm’s environmental demands guarantees good teat protection and sanitization. In winter, a fast-drying cream decreases chapped teats, lowering infection risk. The complete coating reduces the likelihood of bacteria entering the teat canal by dipping or spraying.

Economically, a good teat dip may result in huge savings. Reasonable mastitis control helps to lower veterinarian expenses and the necessity for culling resulting from ongoing infections. Reduced mastitis instances assist in preserving and improving milk production and quality. Udder health depends on a low somatic cell count (SCC), affecting milk quality and influencing farm profitability, which may attract premium prices. This financial benefit should motivate you to make strategic teat dip selections.

Using items based on good manufacturing standards (GMPs) guarantees consistent performance. Frequent updates to pre- and post-dip treatments support udder health all year round. A local milk quality professional may provide customized advice, achieving a balanced approach to mastitis avoidance, cost savings, and maximum milk output.

The Critical Importance of Choosing the Right Teat Dip: Science and Real-World Evidence 

Dairy producers trying to preserve herd health and maintain milk quality must choose the appropriate teat dip. Mastitis may be much reduced using teat dips created based on scientific study. For instance, studies supported by data showed that teat dips significantly reduced mastitis cases and enhanced udder health, lowering somatic cell numbers.

Actual instances confirm this. Six months after changing to a scientifically validated teat dip, a Midwest dairy farm saw mastitis cases decline from 12 to three per month. This action also improved their milk quality premiums, demonstrating the sensible advantages of well-informed judgments.

Certain clinical benefits from using teat dips have been confirmed. Farmers improve herd health and structure their activities to be successful in the long term. See a local hygiene and milk quality professional to identify a proven teat dip catered to your farm’s requirements.

Harnessing Expertise: The Vital Role of Local Hygiene and Milk Quality Specialists 

Depends on local hygiene and milk quality experts’ output. These professionals provide customized recommendations based on every farm’s circumstances and difficulties. Their observations guarantee that your teat dip schedule is ideal for optimal efficacy, helping fight certain infections and adapt formulas for each season. Before altering your teat dip schedule, it is highly advisable to consult these experts to avoid mastitis, save expenses, and maintain a low somatic cell count.

The Bottom Line

High-quality milk production and herd health depend on ensuring the teat dip is used most effectively. Dairy farmers may limit mastitis incidence and optimize profitability by eliminating iodine fallacies, knowing the synergy between germicides and emollients, and avoiding a one-size-fits-all strategy. Iodine is not always the best choice, even if it is conventional. Teat health depends on the interaction between germicides and emollients. Hence, customized teat dip formulations are essential considering every farm’s situation. See local hygienic and milk quality experts and use items with scientific backing. Effective farm management depends on strategic teat dip choices, influencing operating costs, herd health, and milk quality premiums. A good dairy runs on an educated, customized strategy alone. See your local hygienic and milk quality professional to guarantee the optimal teat dip for your farm’s requirements, avoiding mastitis and promoting a healthier herd.

Consult your local milk quality and hygienic professional to ensure you utilize the best teat dip. Using the correct strategy guarantees a better future for your dairy farm and the prevention of mastitis. Your decision on the appropriate teat dip now goes beyond immediate advantages to open the path for consistent herd health, better milk quality, and more income.

Key Takeaways:

  • Teat dip selection aligns directly with the production of high-quality milk and the minimization of mastitis incidence.
  • Effectiveness varies by formula, farm conditions, and pathogen strains, necessitating tailored choices over generic solutions.
  • Research-backed teat dips offer proven efficacy, making scientific validation a critical factor in selection.
  • Diverse germicides beyond iodine present viable options, broadening choices for specific farm needs and pathogen challenges.
  • The synergy of germicides and emollients is essential for comprehensive teat health, not just pathogen eradication.
  • Engaging local hygiene and milk quality specialists ensures informed decisions, optimizing herd health and profitability.
  • Clinical testing under experimental and natural conditions confirms the real-world applicability and effectiveness of teat dips.
  • Regular veterinary observations are pivotal in monitoring teat conditions and adjusting protocols as needed.
  • Understanding that every farm is unique, pushing against the one-size-fits-all myth, and preemptively assessing specific needs improve outcomes.

Summary:

Teat dips are essential in dairy farming to protect against infections and mastitis. They reduce bacteria count on the teat skin, ensuring high-quality milk production and providing a reassuring barrier against illness. Emollients like glycerin or lanolin help keep the skin flexible and prevent dryness and chapping. Farmers must follow pre- and post-milking dipping procedures to improve milk quality and maintain low somatic cell count. Good Manufacturing Practices (GMPs) ensure clean and controlled production. Customizing teat dip formulas to individual farm needs is crucial for udder health, low somatic cell counts, and maximum milk output. A good teat dip can result in significant savings, as it helps lower veterinarian expenses and the need for culling due to ongoing infections.

Learn more: 

Send this to a friend