Archive for Class III milk pricing

Organic Valley Sued USDA Over $50M a Year — and Your Blend Price Is In It

Organic Valley says it’s forced to pay ~$50M a year into a pool for milk it can’t sell. The same June 2025 rule cut your check too. Here’s the pooling math.

Executive Summary

  • What happened: On April 28, three of the biggest organic dairies in the country — Organic Valley/CROPP, Aurora, and Horizon — filed four federal lawsuits arguing that Federal Milk Marketing Order pooling is unconstitutional as applied to organic. CROPP alone claims more than $60 million for roughly 1,350 farms and pegs the ongoing drain near $50 million a year.
  • The mechanism: Organic processors are almost all Class I, so they pay into the pool at the top, then get back a blend average dragged down by cheaper cheese and butter milk — money that lands with the manufacturing handlers.
  • The trigger: The same June 2025 AMS rule that cut Class III by about 92¢/cwt and pulled $337 million out of producer checks raised organic’s pool-in payments while shrinking what the pool pays back.
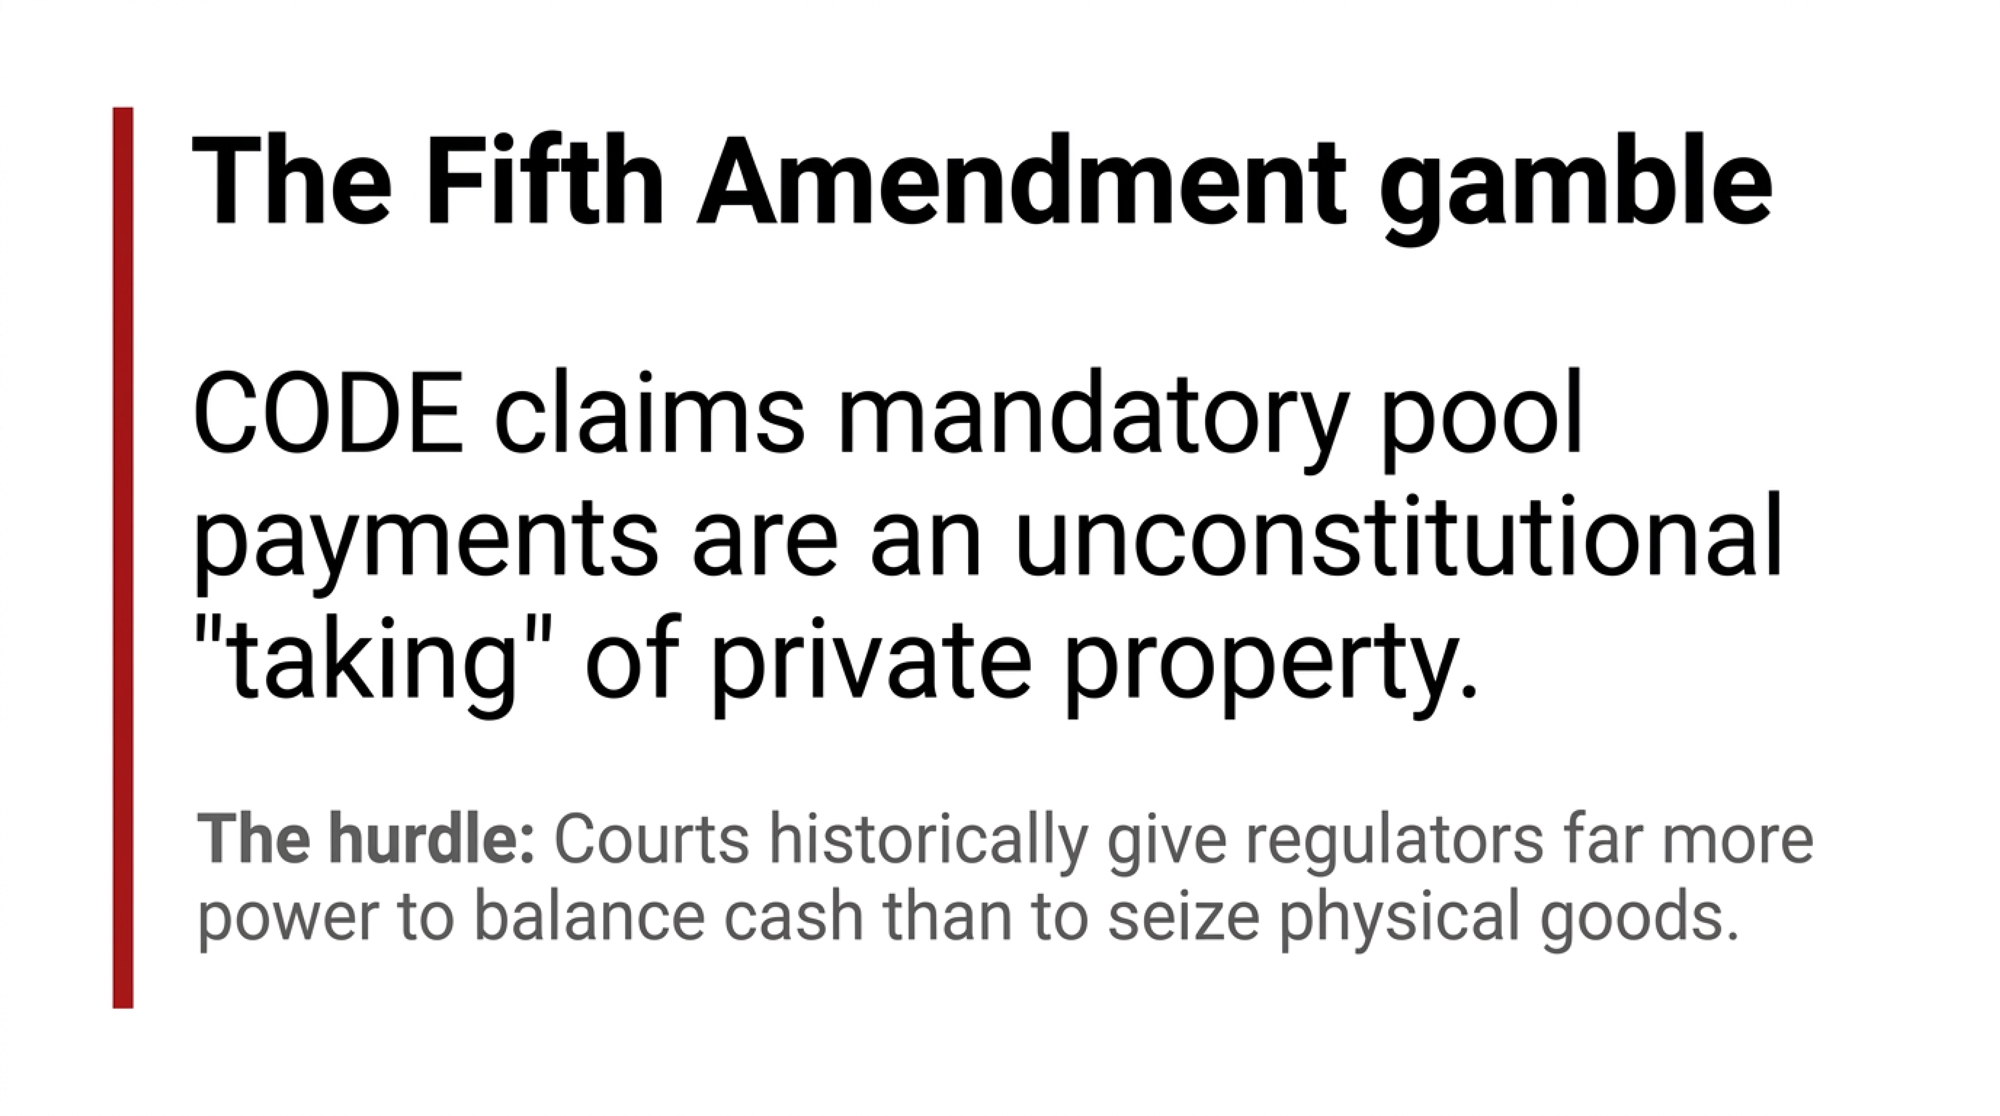
  • The legal reality: CODE’s lead claim leans on Horne v. USDA, but Horne involved a physical taking of raisins. Proving a regulatory cash pool is a “taking” is a real legal stretch, and USDA hadn’t responded as of July 9.
  • Why it’s not just an organic story: A win shrinks the pool conventional blend prices lean on, and it bites hardest in fluid-heavy Southern orders like Florida (Order 6, $24.04/cwt in April) and the Southeast — not the Upper Midwest, where January’s PPD was $0.46/cwt.
  • The caveat: The dollar figures above $50M are CODE’s own math, not audited findings. Read the arrow, not the number.
  • Your move: Before the late-August answer deadline, know which order you’re in and how exposed your blend price is if the biggest premium producers walk out of the pool.
organic dairy lawsuit FMMO

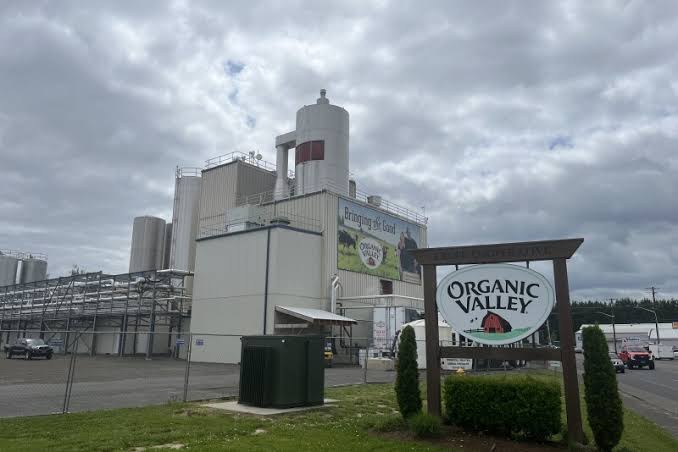
Here’s the number that put USDA in front of three federal judges: about $50 million a year — what the country’s biggest organic dairies say they’re forced to pay into a Federal Milk Marketing Order pool for milk they legally can’t even sell. On the hook are Organic Valley/CROPP, Aurora Organic Dairy, Horizon Organic, and seven named CROPP farmer-members — people like Elvin Ranck in Pennsylvania and Remington Perkins, who, by CODE’s account, runs West Virginia’s first certified organic dairy, filing for roughly 1,350 farms. The trap they’re fighting is the same June 2025 rule change that cut your milk check — and if they win it, the pool your blend price leans on gets smaller. 

While framed as an organic dispute, this is an FMMO fight that could fundamentally alter blend prices for conventional fluid milk shippers. The ruling lands on them whether they’ve shipped an organic pound or not.
Who’s Suing, What They Claim, and How Much

On April 28, 2026, three companies filed four separate suits in three federal courts. They call themselves CODE — the Coalition for Organic Dairy Exemption — a descriptive name, not a separately incorporated entity. USDA hadn’t publicly answered any of the four as of July 9, 2026, and docket numbers weren’t confirmable in public PACER records at press time. 

PlaintiffCourtCore claimDollar figureSource status
CROPP/Organic Valley (7 farmer-members)Court of Federal Claims (D.C.)Fifth Amendment Takings, class action>$60M for ~1,350 farms Filing
CROPP/Organic ValleyW.D. WisconsinDue process, non-delegation, APA ~$50M/yr ongoing Plaintiff estimate
Aurora Organic DairyD. ColoradoTakings, due process Part of >$400M since 2006 Plaintiff estimate
Horizon OrganicD. ColoradoTakings, due process Part of >$400M since 2006 Plaintiff estimate

While the headline numbers are massive — reaching up to $400 million since 2006 — it’s critical to note these are the plaintiffs’ internal accounting figures, not audited court findings. Only the $60 million class-action claim traces directly to a filing. 

Why Should a Conventional Producer Care About an Organic Lawsuit?
It isn’t an organic lawsuit. Strip the label, and it’s one question: can a pricing law written in 1937 force a legally distinct product to bankroll a pool it can’t draw from — and does that break the Fifth Amendment? The organic-versus-conventional framing is the distraction. The real fight is small-and-differentiated against the industrial pool, argued based on pooling math and constitutional law. (Related: The Bullvine’s July 2, 2026 make-allowance analysis, “$337 Million Disappeared from Milk Checks. Cheese Prices Never Dropped.”) 

How the Producer Settlement Fund Actually Moves the Money
Skip the textbook. Every hundredweight in an FMMO gets priced by what it becomes — fluid drinking milk (Class I) pays the most, cheese (Class III) and butter/powder (Class IV) less. The market administrator blends all that value into one uniform price, the minimum every handler pays. Handlers whose milk went to a high-value class pay the difference into the Producer Settlement Fund. Handlers whose milk went cheap draw out of it. The key thing to remember: it’s the handlers who settle with the pool, not the individual farmer. 

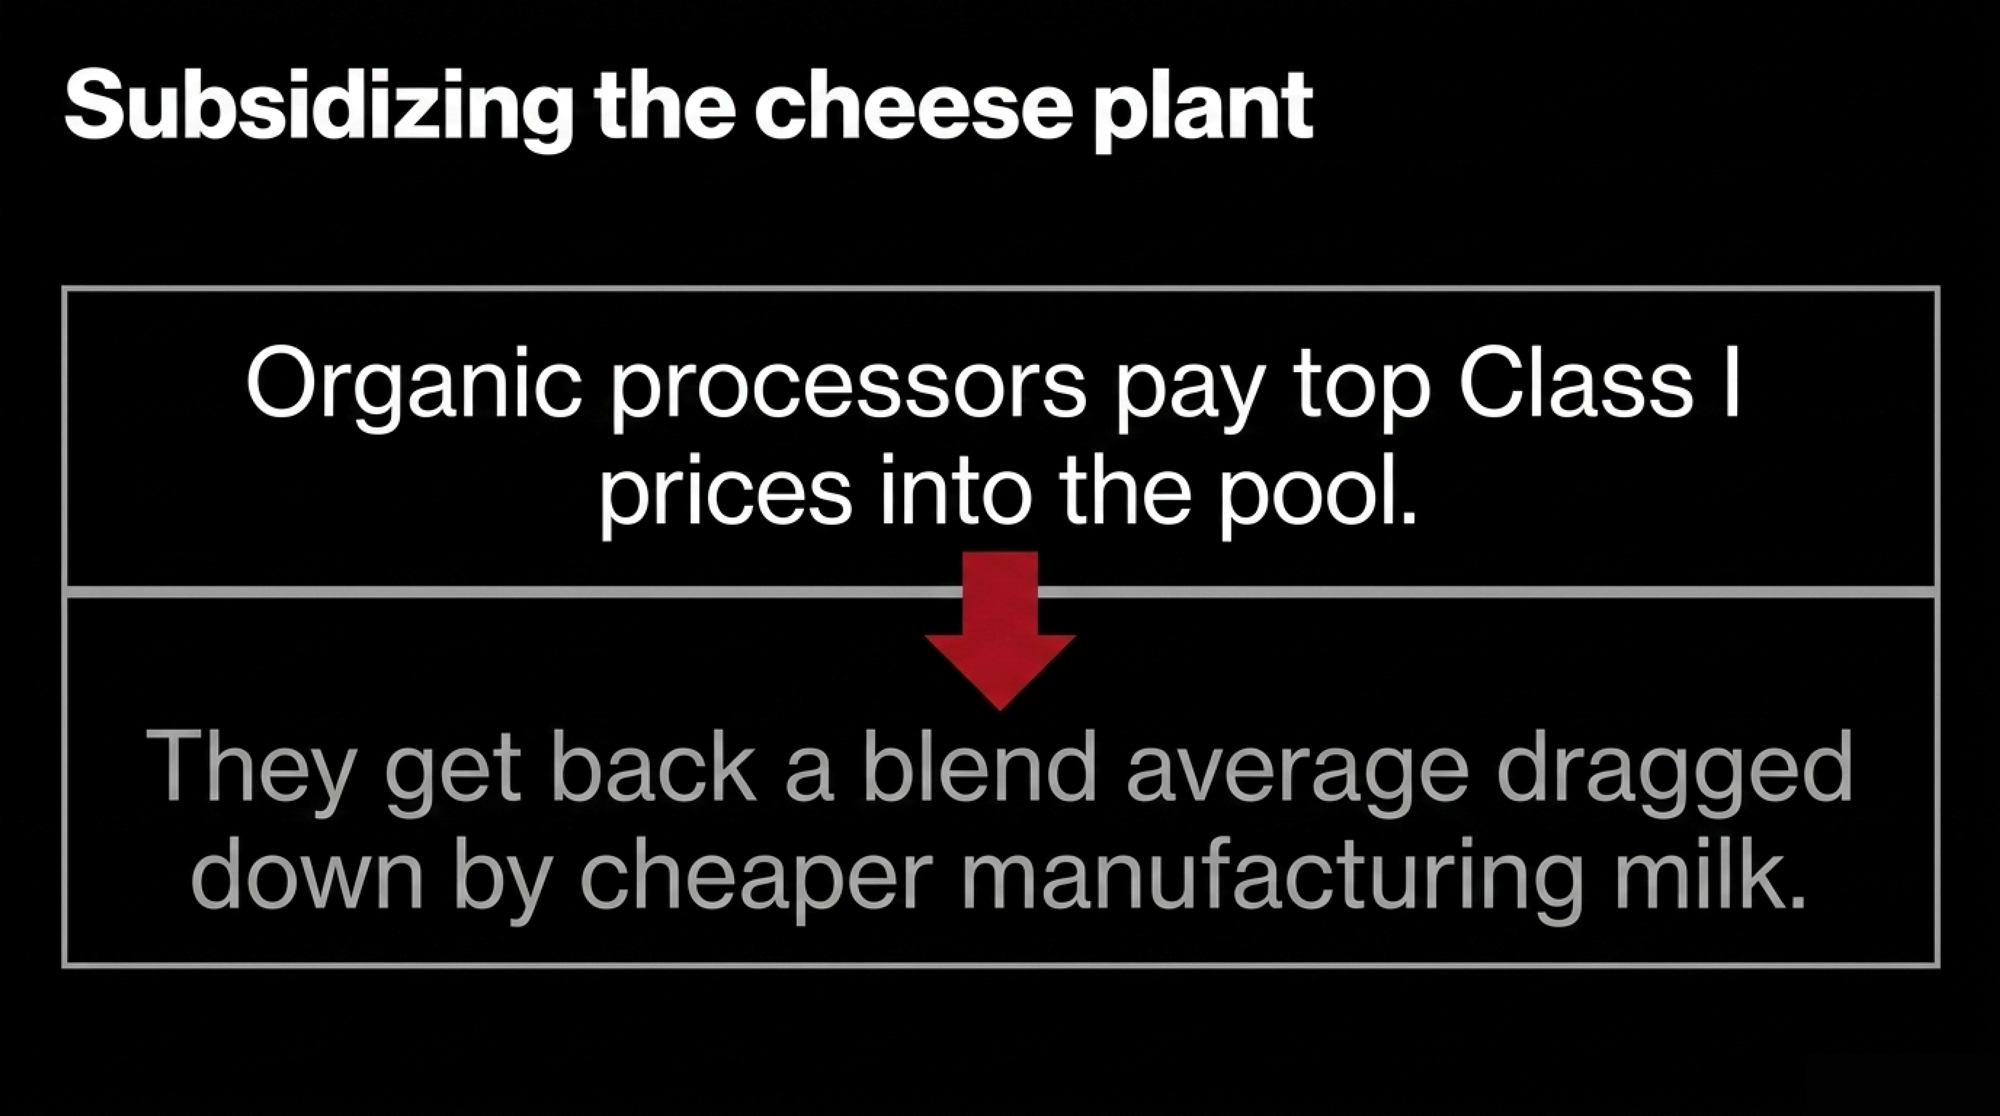
Now watch where organic gets stuck. Organic processors are almost all Class I. They pay in at the top, then get back the blend average, dragged down by all that cheaper cheese and butter milk. The gap doesn’t evaporate — it lands with the handlers who ran the cheap manufacturing milk. 

Pay in at the top. Get back the average. Subsidize the cheese plant. Every month.

Adam Warthesen, Organic Valley’s VP of Government and Industry Affairs, pegs the transfer at more than $400 million out of organic since 2006 — about $50 million a year now. Both figures are CODE’s own math. No neutral party — not USDA, not a land-grant economist, not Farm Bureau — has independently run them in any source found for this piece. Believe the arrow. Don’t yet bank the number. 

The June 2025 Rule Change That Lit the Fuse

You felt this one. The USDA AMS final rule, published January 17, 2025 and effective June 1, did five things. 
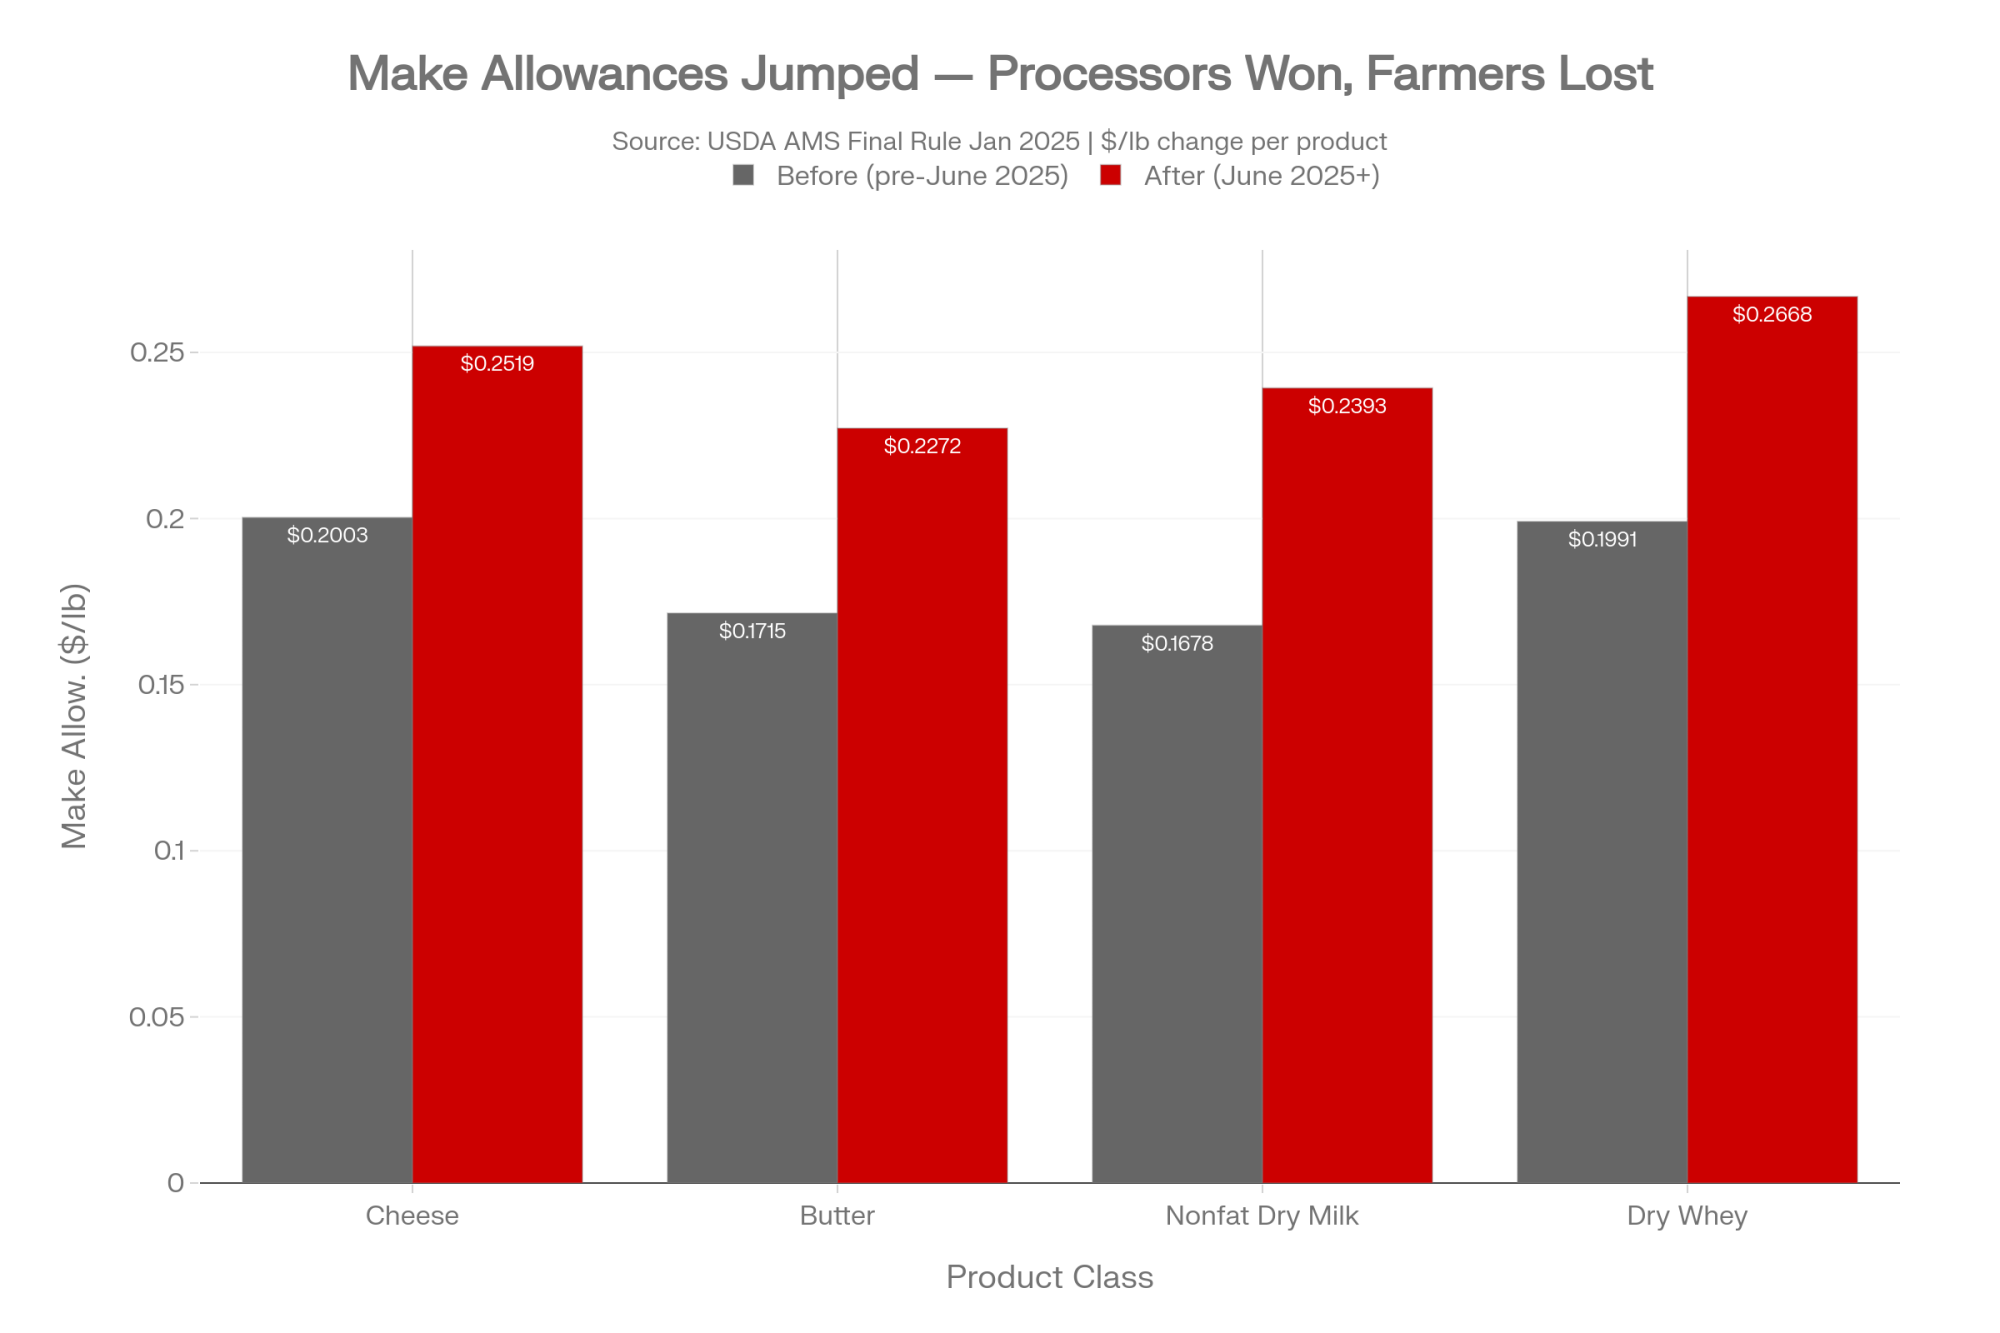
  • Raised make allowances — the processing-cost credits in Class III/IV. Cheese went from $0.2003 to $0.2519/lb; butter, from $0.1715 to $0.2272/lb; nonfat dry milk, from $0.1678 to $0.2393/lb; dry whey, from $0.1991 to $0.2668/lb. 
  • Restored the “higher-of” Class I mover, scrapping the 2019 average-of-plus-74-cents formula.
  • Raised Class I location differentials.
  • Dropped the 500-lb barrel cheddar from the Class III formula.
  • Updated skim composition factors, effective December 1, 2025.

That make-allowance change cut roughly 92¢/cwt from the Class III price and pulled about $337 million from producer milk checks — money that now stays with processors, even though cheese prices never dropped to match. Across all classes, the reform netted a $231.9 million decline in pool revenue in its first three months. 

Here’s the piece aimed at organic. Under the restored higher-of, the base Class I skim price each month equals the higher of the advanced Class III and Class IV skims. For July 2026, USDA’s advanced price sheet put the base Class I price at $21.33/cwt, down $0.85 from June. Organic processors are Class I handlers. Higher Class I means a bigger check into the pool, and fatter make allowances shrank what the pool hands back in the blend. Organic pays more in, pulls less out — both levers yanked the same way on June 1, 2025. 

Running the Numbers: What the Pool Costs, Organic vs. Conventional

The 300-Cow Organic Herd

Organic cows milk well below conventional — regional organic data runs roughly 10,000 to 19,000 lb/cow/year depending on grain and pasture rules, so call it 16,000 lb/cow (160 cwt) as a working middle. For a 300-cow herd, that’s about 48,000 cwt a year. 

Now the drag per cwt, and here’s where you have to be careful, because CODE’s own numbers point two directions. Spread the $50 million-a-year claim across the roughly 1,350 farms and their volume, and the annual burden lands near $0.35/cwt. Take instead the $60 million class-action claim — a cumulative compensation ask, not an annual flow — and the implied per-cwt figure runs higher. They aren’t the same measurement, and stacking one on the other double-counts. Use the annual figure for a yearly comparison.

  • Pool drag (CODE-implied annual): roughly $0.35/cwt.
  • Annual PSF transfer for a 300-cow organic herd: 48,000 cwt × $0.35 = about $16,800 per year, leaving that herd’s pool position for the conventional system.

That’s not lost revenue — these farms still clear $35–$45/cwt in organic pay. It’s the cash walking out the pool door. Warthesen claims that June 2025 lifted organic’s pool burden by about 60%; the direction holds, but the exact percentage is CODE’s estimate and varies with the order, volume, and butter-cheese spread each month. 

The Conventional Herd, Same Rule Change

Conventional cows milk far harder — figure roughly 24,000 lb/cow (240 cwt), so a 300-cow herd runs near 72,000 cwt. That’s why the cwt totals differ between these two boxes even at the same cow count. Apply the verified 92¢/cwt Class III make-allowance cut:
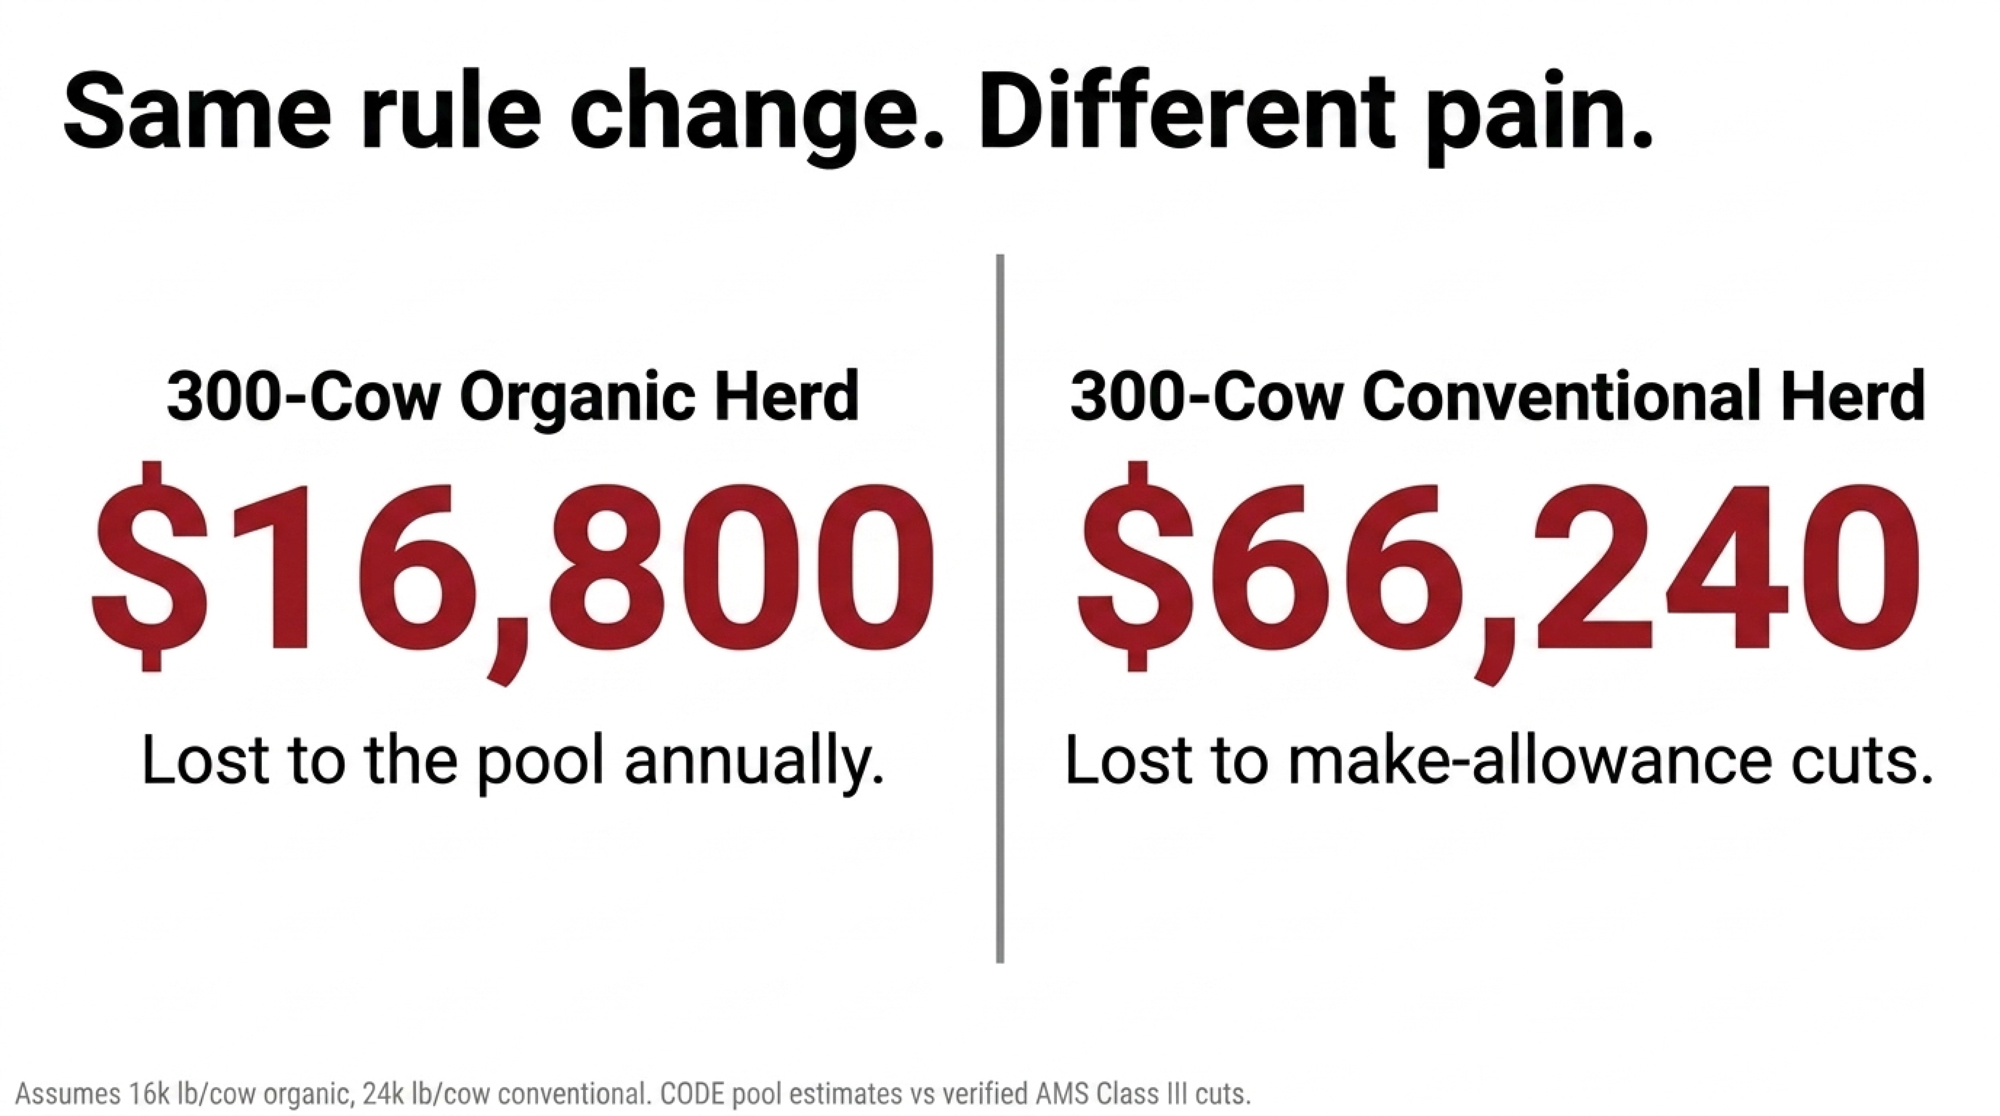
  • 300 cows (~72,000 cwt): 72,000 × $0.92 = about $66,240 a year, gone.
  • 500 cows (~120,000 cwt): 120,000 × $0.92 = about $110,400 a year.

Same rule change. Two producers. The conventional herd’s dollar hit is bigger — it’s a measured make-allowance loss straight off USDA’s own class-price math, not a contested pool estimate — and yet it’s the organic side that went to court. Plug in your own herd’s rolling average and the arithmetic doesn’t change.

Metric300-Cow Organic300-Cow Conventional500-Cow Conventional
Est. milk yield/cow16,000 lb (160 cwt)24,000 lb (240 cwt)24,000 lb (240 cwt)
Annual herd volume~48,000 cwt~72,000 cwt~120,000 cwt
Per-cwt impact~$0.35/cwt pool drag$0.92/cwt make-allow. cut$0.92/cwt make-allow. cut
Annual dollar hit~$16,800~$66,240~$110,400
Organic pay base$35–$45/cwt~$18–22/cwt blend~$18–22/cwt blend
Source qualityCODE estimate — unauditedUSDA-verified class price mathUSDA-verified class price math

The 11-Year Paper Trail Before Anyone Filed

CODE didn’t skip the line. In 2015, the Organic Trade Association asked USDA to exempt organic fluid handlers from PSF payments above a threshold. NMPF, DFA, Agri-Mark, Land O’Lakes, and ten co-ops lined up against it; OTA withdrew by January 2017 with no hearing held. The 2023–24 national FMMO hearing in Carmel, Indiana, ran 49 days and accepted 21 proposals — organic’s weren’t among them. USDA’s Final Decision landed November 2024 with organic’s submissions unaddressed. CODE filed formal Section 15A petitions in May 2025; they’re still pending. Then, on April 28, four lawsuits were filed. 

Eleven years. Two hearing cycles. Three administrations. Same answer every time.

What’s the Constitutional Argument — and Is It Real?

CODE makes four claims. Every one is a plaintiff allegation; none adjudicated; USDA hasn’t answered. 

Legal ClaimWhat CODE ArguesKey PrecedentUSDA’s Likely CounterRelative Strength
Fifth Amendment TakingsMandatory PSF payments = taking of private property without just compensationHorne v. USDA(2015) — raisin physical takingRegulatory cash pool ≠ physical seizure; courts give regulators more latitude over money than goodsMedium — Horne is real but the fit is a stretch
Due ProcessOrganic gets no usable benefit from a pool it can’t draw commodity supply fromGeneral 14th/5th Amendment doctrineOrganic processors voluntarily entered a regulated market knowing pooling was mandatoryWeak-to-medium — voluntary entry undermines this
Non-DelegationPrivate industry groups (NMPF, DFA) effectively blocked organic’s proposals from reaching a hearingAPA structural limits on delegationHearing process followed statutory AMAA procedures; all proposals subject to the same rulesWeak — hardest to win at district level
APA (Arbitrary & Capricious)USDA ignored organic’s FMMO reform submissions in its 2024 Final DecisionMotor Vehicle Mfrs. v. State Farm(1983)USDA considered and implicitly rejected organic’s submissions through the public recordMedium — strongest if organic can document procedural gaps

The Fifth Amendment Takings claim is the heavyweight: mandatory PSF payments take private property without just compensation. The precedent is Horne v. USDA (2015), in which the Supreme Court ruled 8-1 that a marketing order requiring raisin growers to physically surrender part of their crop to a government reserve was a per se taking. 

Here’s the catch, and it’s a real one. In Horne, the government physically took raisins — tangible property it hauled off. In CODE’s case, USDA isn’t seizing milk; it’s telling a handler what to do with their money through a regulatory pool. CODE’s hurdle is proving that a regulatory cash-balancing mechanism constitutes a physical or categorical “taking” of private property, not just an economic regulation that handlers dislike. Courts have long given regulators more room on money than on physical goods. That gap is exactly where USDA will push back.

The other three claims round it out: due process (organic gets no benefit from a pool it can’t draw supply from), non-delegation (CODE alleges private industry groups effectively pick which proposals reach a hearing and blocked organic’s), and an APA claim (ignoring organic’s submissions was arbitrary and capricious). Horne is real and decided. Whether a cash cross-subsidy fits inside it is the live question — and it’s not frivolous. 

The Case for the Other Side — Without the Hedging

USDA hasn’t filed its answer. The conventional defense is real, so put it on the table straight.

The strongest card isn’t legal; it’s arithmetic. Organic lost a vote it was always going to lose, then went to court. The 2025 changes were approved by a two-thirds supermajority of pooled producers in separate referenda under the Agricultural Marketing Agreement Act of 1937. Organic accounts for about 3% of the pool volume. The system is built to let 97% outvote 3% — that’s the design, and it’s held up for 90 years. 

Second card: voluntary entry. Organic processors entered a regulated market knowing that participation was mandatory. Courts don’t love a plaintiff who signs up for the game, then calls the rulebook unconstitutional when the score turns.

Third, NMPF’s genuine point is that the pool isn’t pure extraction. It sets a floor nobody can lowball under and keeps marketing orderly — the whole Depression-era reason it exists. The counter is just as sharp. None of that answers Horne. “You benefit from stability” didn’t save the raisin reserve, and “you knew the rules” gets weaker when the rules changed under organic in 2025 by a vote it couldn’t win. Two real arguments. That’s why this won’t settle on a napkin. 

Does a CODE Win Actually Shrink Your Pool?

Yes — but smaller and more targeted than the headline suggests, and not where most people assume.

Everyone pictures the Northeast as fluid country. It isn’t anymore. Order 1’s Class I utilization has run in the high-20s to low-30s percent in recent months, and sat near 20% in 2024. The truly Class I-heavy orders are the Southeast (Order 7) and Florida (Order 6), which run on skim-fat pricing and post the highest uniform blend prices in the country — Florida’s statistical uniform price hit $24.04/cwt this past April against far lower manufacturing-order prices. That’s where an organic exit from the pool actually bites a conventional blend price. In Upper Midwest cheese-and-butter country, a multiple-component-pricing order where January 2026’s PPD was just $0.46/cwt, you’d barely feel it. 
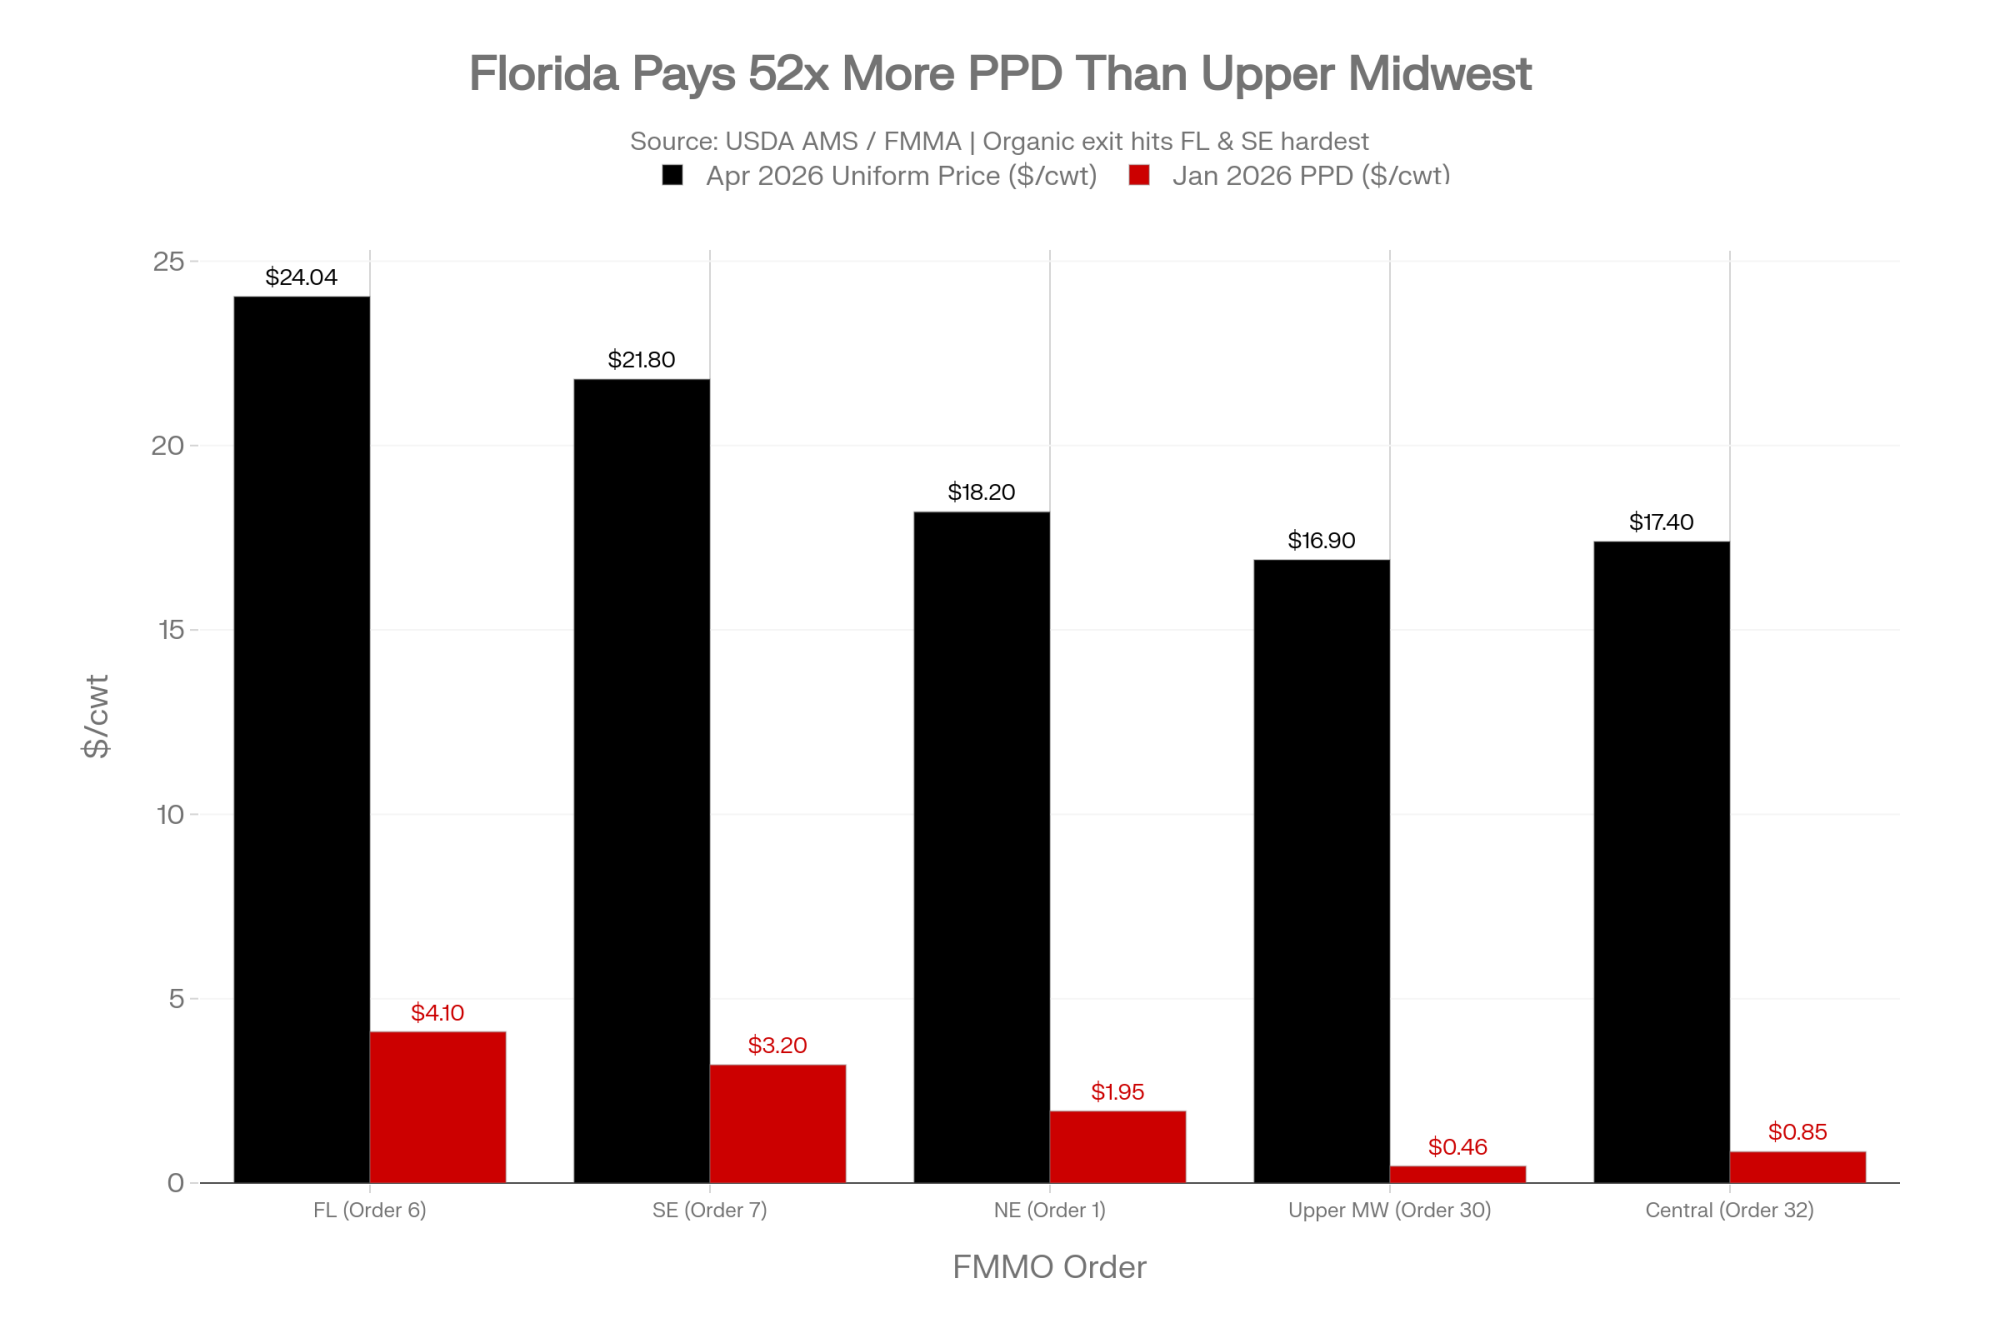
Organic accounts for about 3% of total U.S. milk and a larger share of Class I fluid. Pull it out, and the net payers shrink; the Class III and IV plants that currently receive PSF money get a little less. Spread CODE’s ~$50M/year across the affected orders and the per-cwt hit is real but small. 

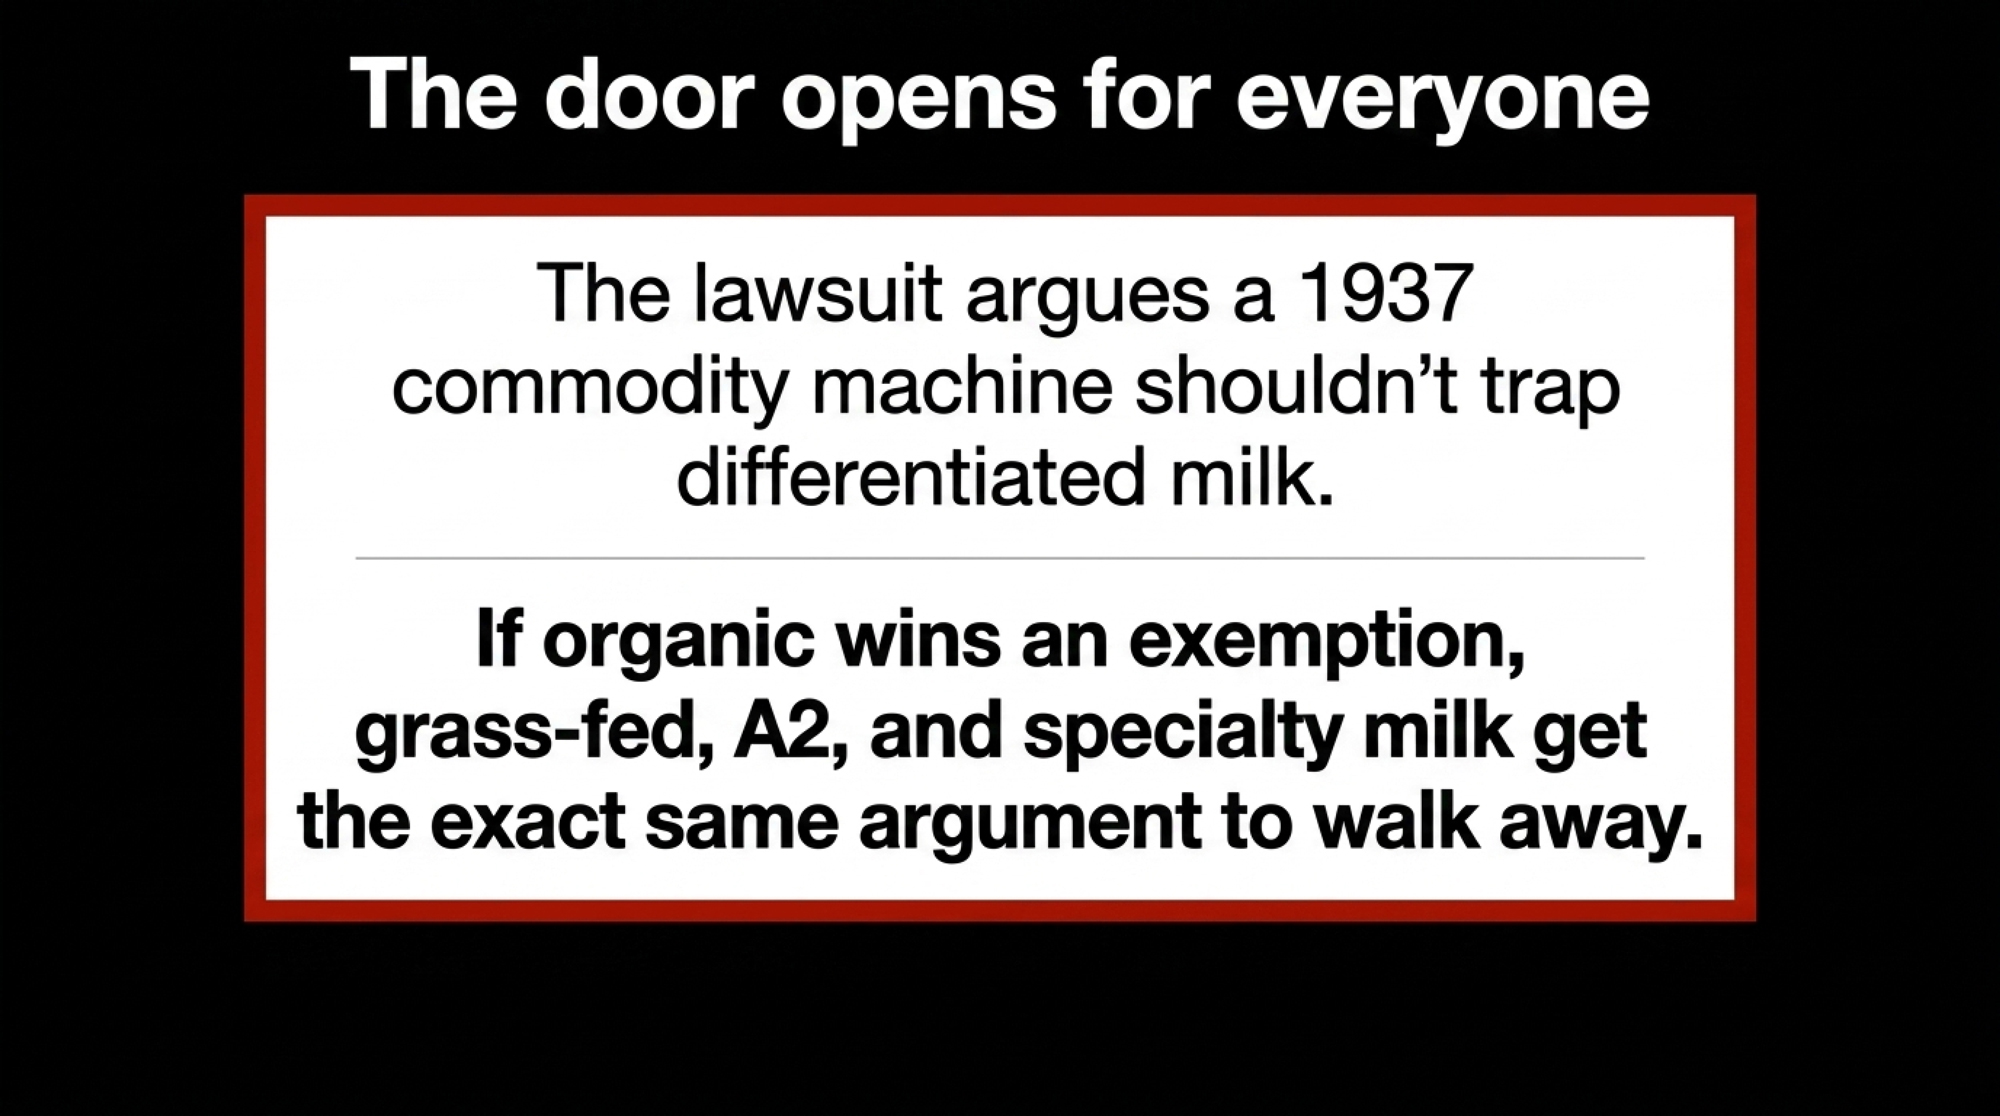
Here’s the bigger question, the one that should keep co-op boards up at night. CODE isn’t only asking for an organic carve-out. They’re arguing the FMMO was never built for a differentiated market — that a 1937 commodity machine structurally punishes any product that’s legally distinct, sells at a premium, and can’t swap commodity milk into its supply chain. Win on that, and grass-fed, A2, and high-protein specialty milk all get the same argument, ready-made. That’s not a certainty. It’s a door — and CODE just showed everybody where it is. (See also The Bullvine’s coverage of building-component premiums and differentiated-milk market position.) 

The 30/90/365-Day Playbook for Herds Like Ranck’s

In the next 30 days — run the urgent checks.

  • Know your order and how it prices. If you ship into Florida (Order 6) or the Southeast (Order 7), you’re in a skim-fat order that pays a single uniform blend price directly — that blend value is your exposure, and it’s among the highest in the country. If you’re in a component-pricing order like the Upper Midwest, your check reflects fat, protein, and other solids plus a PPD, and your exposure to an organic exit is far smaller. 
  • Map your blend-price exposure, not a “pool draw.” Individual farmers don’t settle with the Producer Settlement Fund — handlers do. What matters for you is how much of your order’s blend value rides on Class I utilization that a premium-milk exit could thin out.

In the next 90 days — make the structural moves.

  • Calendar USDA’s answer deadline and read what USDA files. Under Federal Rule of Civil Procedure 12(a)(2), the government gets 60 days from service, putting the window into roughly late August 2026 depending on the actual service date. A motion to dismiss on standing means USDA is dodging the merits; a head-on Horneargument means a durable fight. 
  • If you sit on a co-op board in a high-Class-I order, ask your GM one question: if organic exits the pool, what happens to our blend price — and who’s next in line behind them? Just don’t overreact to a lawsuit that’s 12–24 months from any ruling.

Over the next 365 days — position for the outcome.

  • Model your blend price under a scenario where premium milk leaves the pool. If you’re manufacturing-heavy and your handlers draw from the PSF, a shrinking pool of net-payer handlers is a slow structural risk worth pricing into your next contract cycle.
  • Track the parallel fight — USDA still hasn’t ruled on CODE’s Section 15A petitions, filed back in May 2025. Sitting on them can itself become an APA issue and reshape the timeline. 

Realistic ruling horizon: 12–24 months minimum. Don’t expect a district decision before late 2027. But August tells you which movie you’re watching. (Background: The Bullvine’s ongoing coverage of the Class III/IV price squeeze on family-scale operations.) 
What This Means for Your Operation

The FMMO was built in 1937 for a market where milk was milk. The market it’s policing in 2026 has organic, grass-fed, A2, and specialty premiums the law never imagined and can’t substitute. CODE isn’t trying to burn the pool down — they’re asking three federal courts one question: can a Depression-era commodity system force a legally distinct product to pay for a pool it doesn’t use?

Lose, and nothing changes. Win small, and a couple of fluid-heavy Southern orders lose a little blend value. Win big — on the theory, not just the exemption — and the wall around your pool has a door in it. You gain nothing by waiting until the ruling to run your own numbers.

So here’s the contract check that matters more than the headline: know your order, know how it prices, and know how much of your blend value rides on Class I milk staying in the pool. What does your check look like if the biggest premium producers in the country win the right to walk out?
Key Takeaways

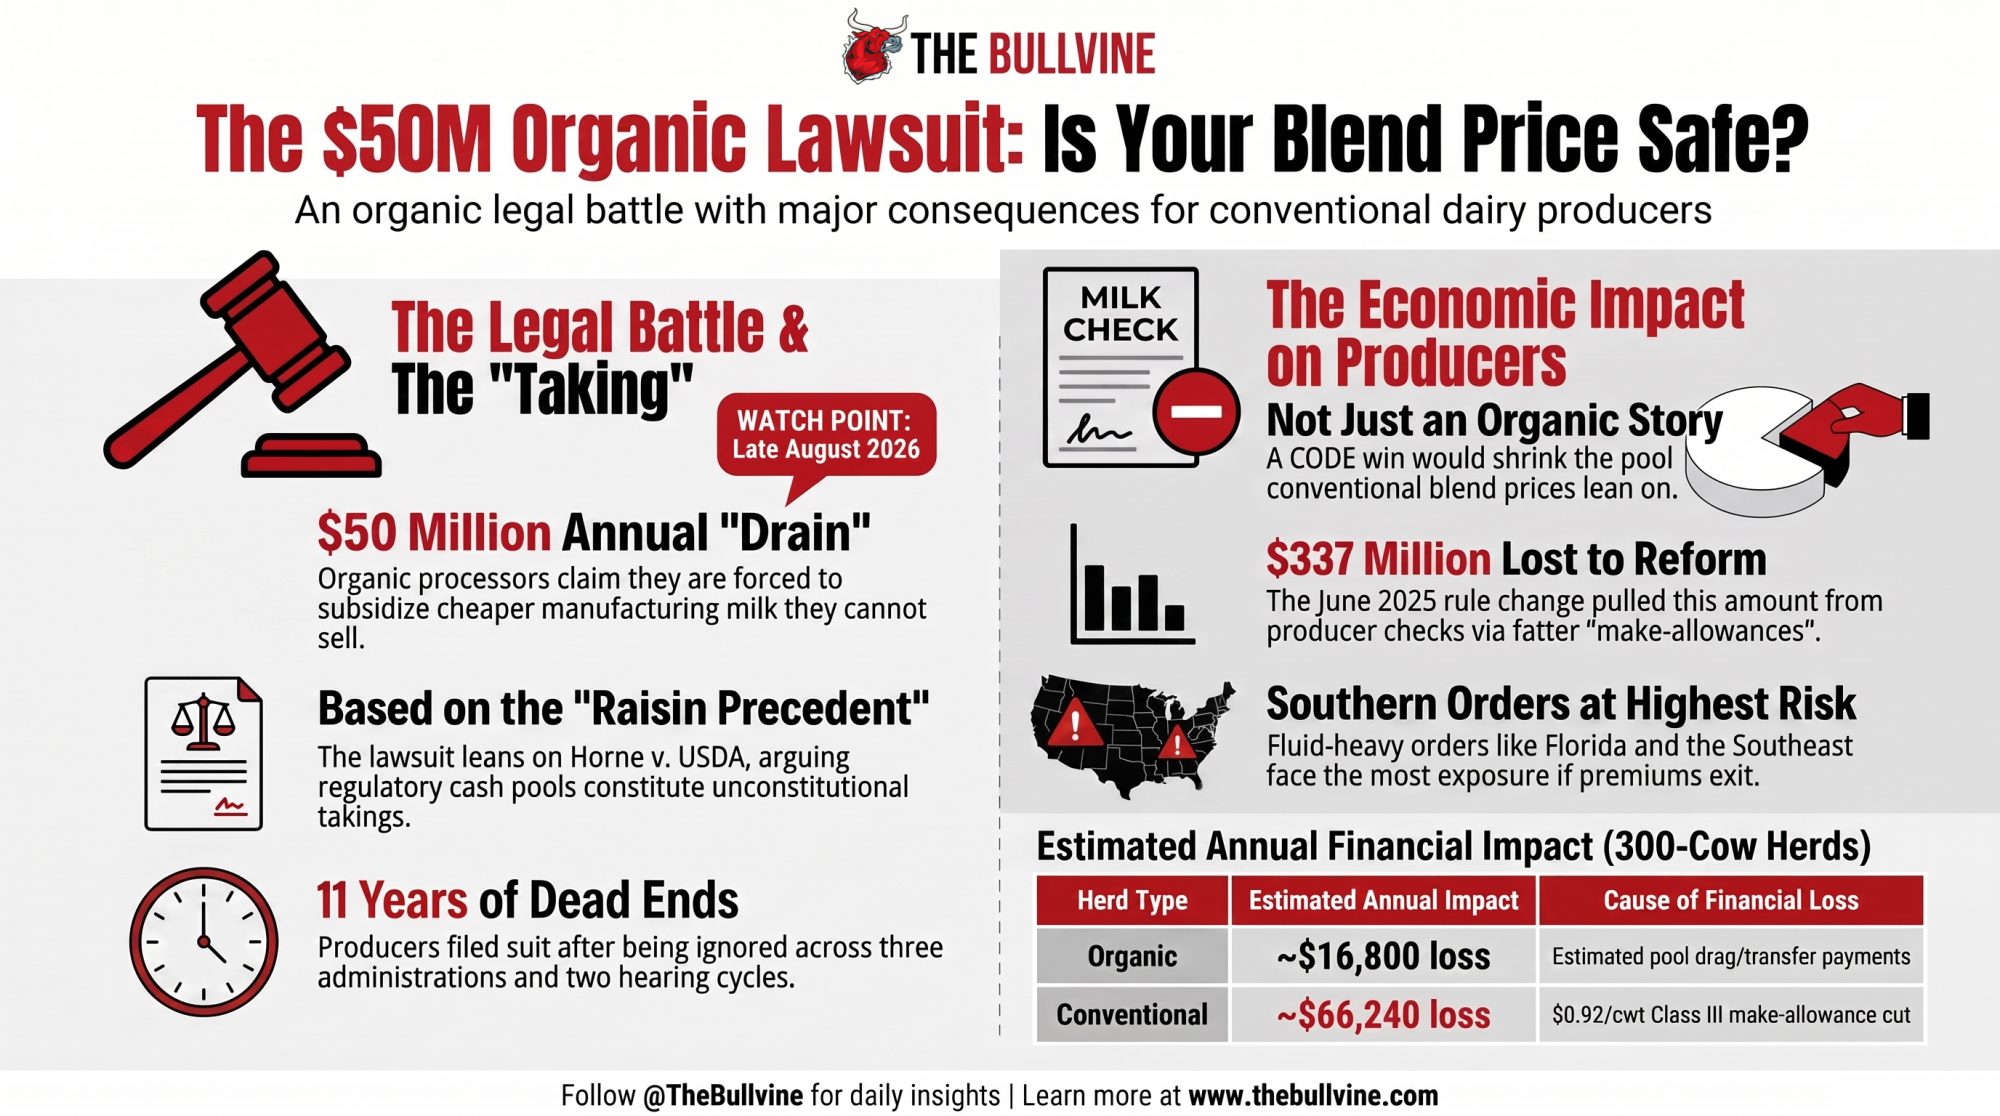
  • This isn’t an organic fight — a CODE win shrinks the pool your blend price leans on, and it bites hardest in fluid-heavy Southern orders like Florida (Order 6) and the Southeast, not the Upper Midwest.
  • The $50M/year, $60M class, and $400M-since-2006 figures are CODE’s own math, not audited findings. Read the arrow, not the number, until USDA answers.
  • The lawsuit leans on Horne v. USDA, but Horne was a physical taking of raisins. Proving a regulatory cash pool is a “taking” is a real stretch, so don’t assume this wins.
  • Before the late-August answer deadline, know your order and how it prices — Florida and the Southeast pay a uniform blend directly, so your whole blend value is what’s exposed.

FMMO Revenue Pool Exposure Calculator

Evaluate your localized make-allowance impact and Class I premium pool exposure.

Estimated Annual Production: 7,200 cwt
Direct Make-Allowance Formula Loss: -$66,240 / yr
EXTREME STRUCTURAL EXPOSURE

Loading assessment…

Legal claims attributed to CODE and its members throughout; USDA had not publicly responded as of July 9, 2026. Docket numbers for the April 28 filings couldn’t be found in public PACER records at press time. The $50M/year, $60M class, $400M since 2006, and ~60% pool-burden-increase figures originate with CODE/Organic Valley and have not been independently verified. FMMO class prices, make allowances, uniform prices, and PPDs are sourced from USDA AMS and Federal Order market administrator sources. The ~$0.35/cwt annual organic pool-drag figure and the 16,000 lb/cow organic and 24,000 lb/cow conventional yields are labeled estimates. The Bullvine editorial team will source party and expert commentary separately.

Complete references and supporting documentation are available upon request by contacting the editorial team at editor@thebullvine.com.

Learn More

The Sunday Read Dairy Professionals Don’t Skip.

Every week, thousands of producers, breeders, and industry insiders open Bullvine Weekly for genetics insights, market shifts, and profit strategies they won’t find anywhere else. One email. Five minutes. Smarter decisions all week.

NewsSubscribe
First
Last
Consent

Where Did All That Cheese Go? What the USDA’s November Dairy Product Production Report Really Means for Your Milk Check

More cheese, no price crash: did 44 million pounds of U.S. cheese really ‘disappear’ in November—and what does that do to your milk check?

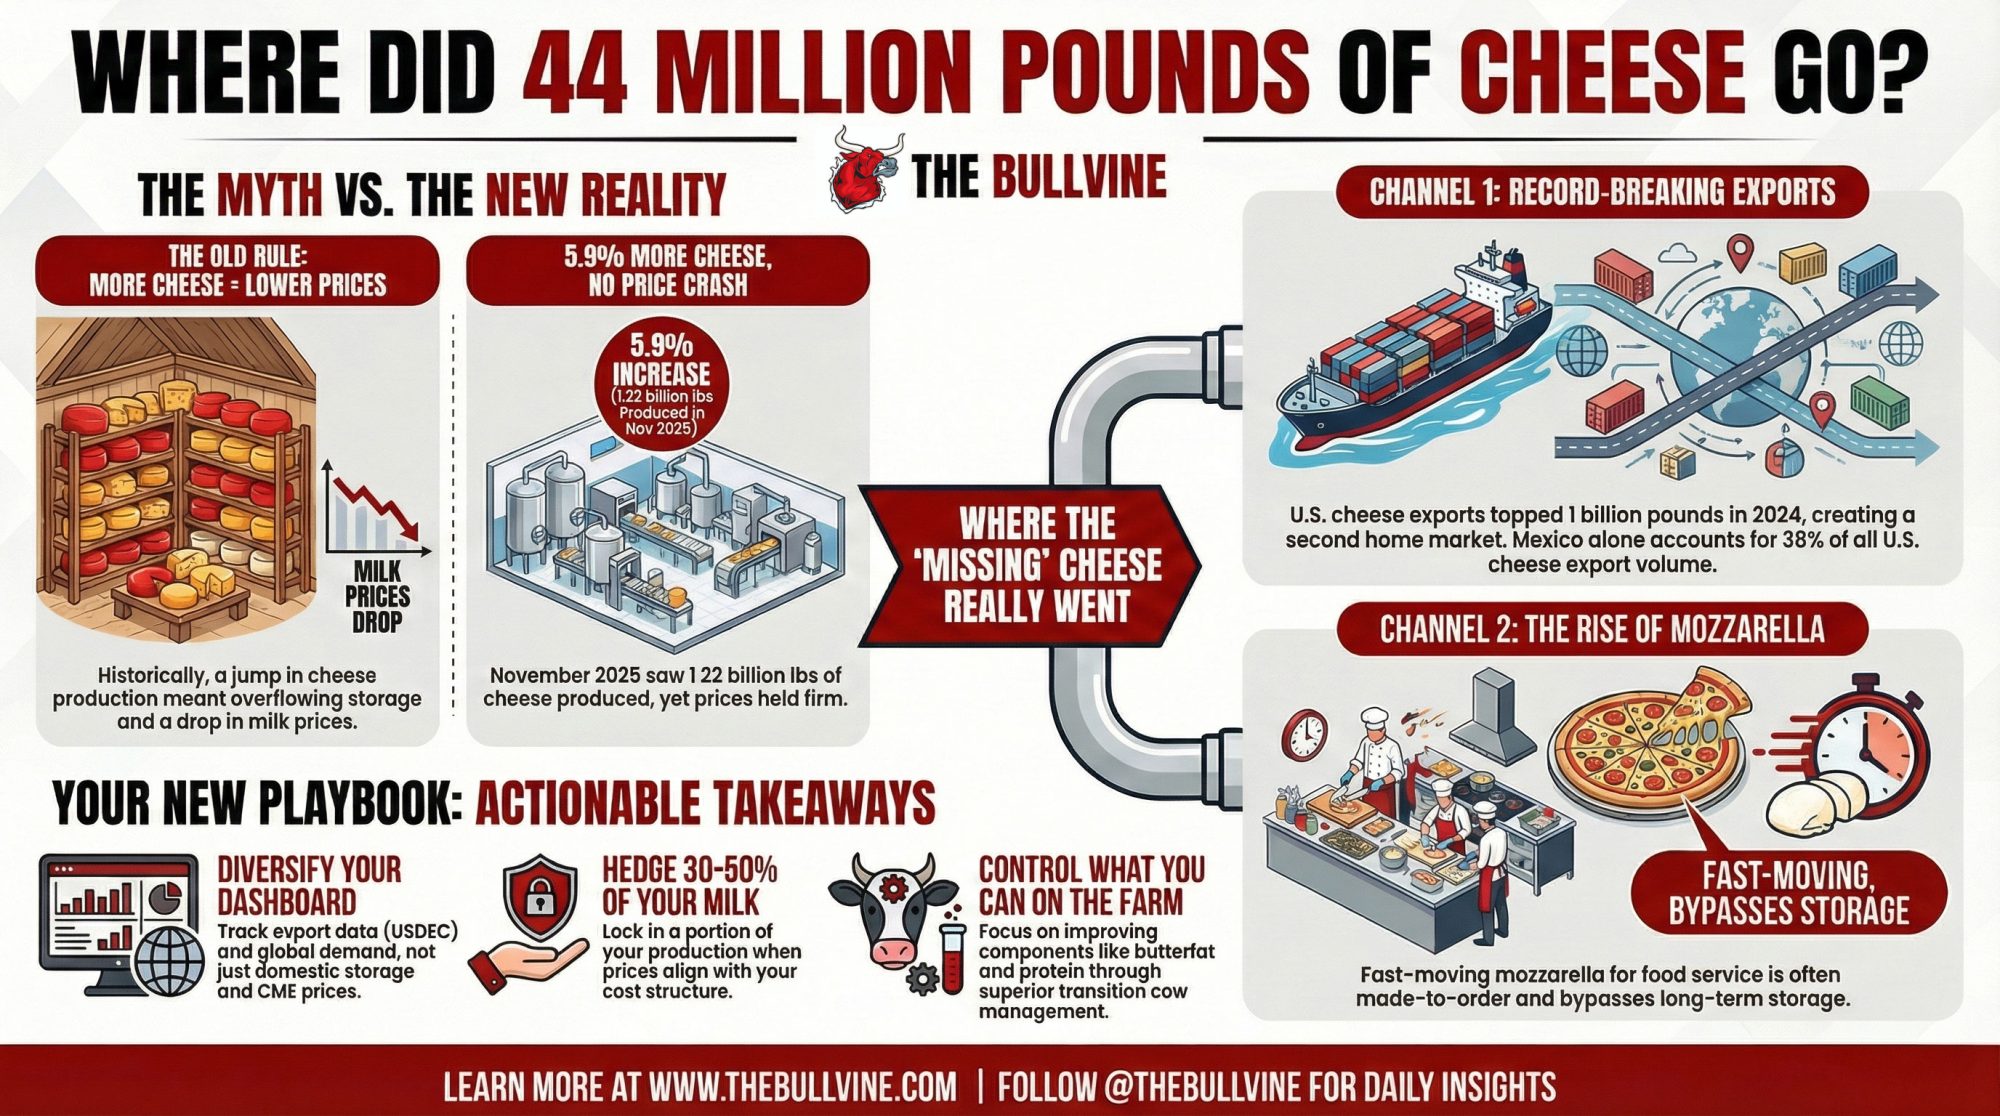
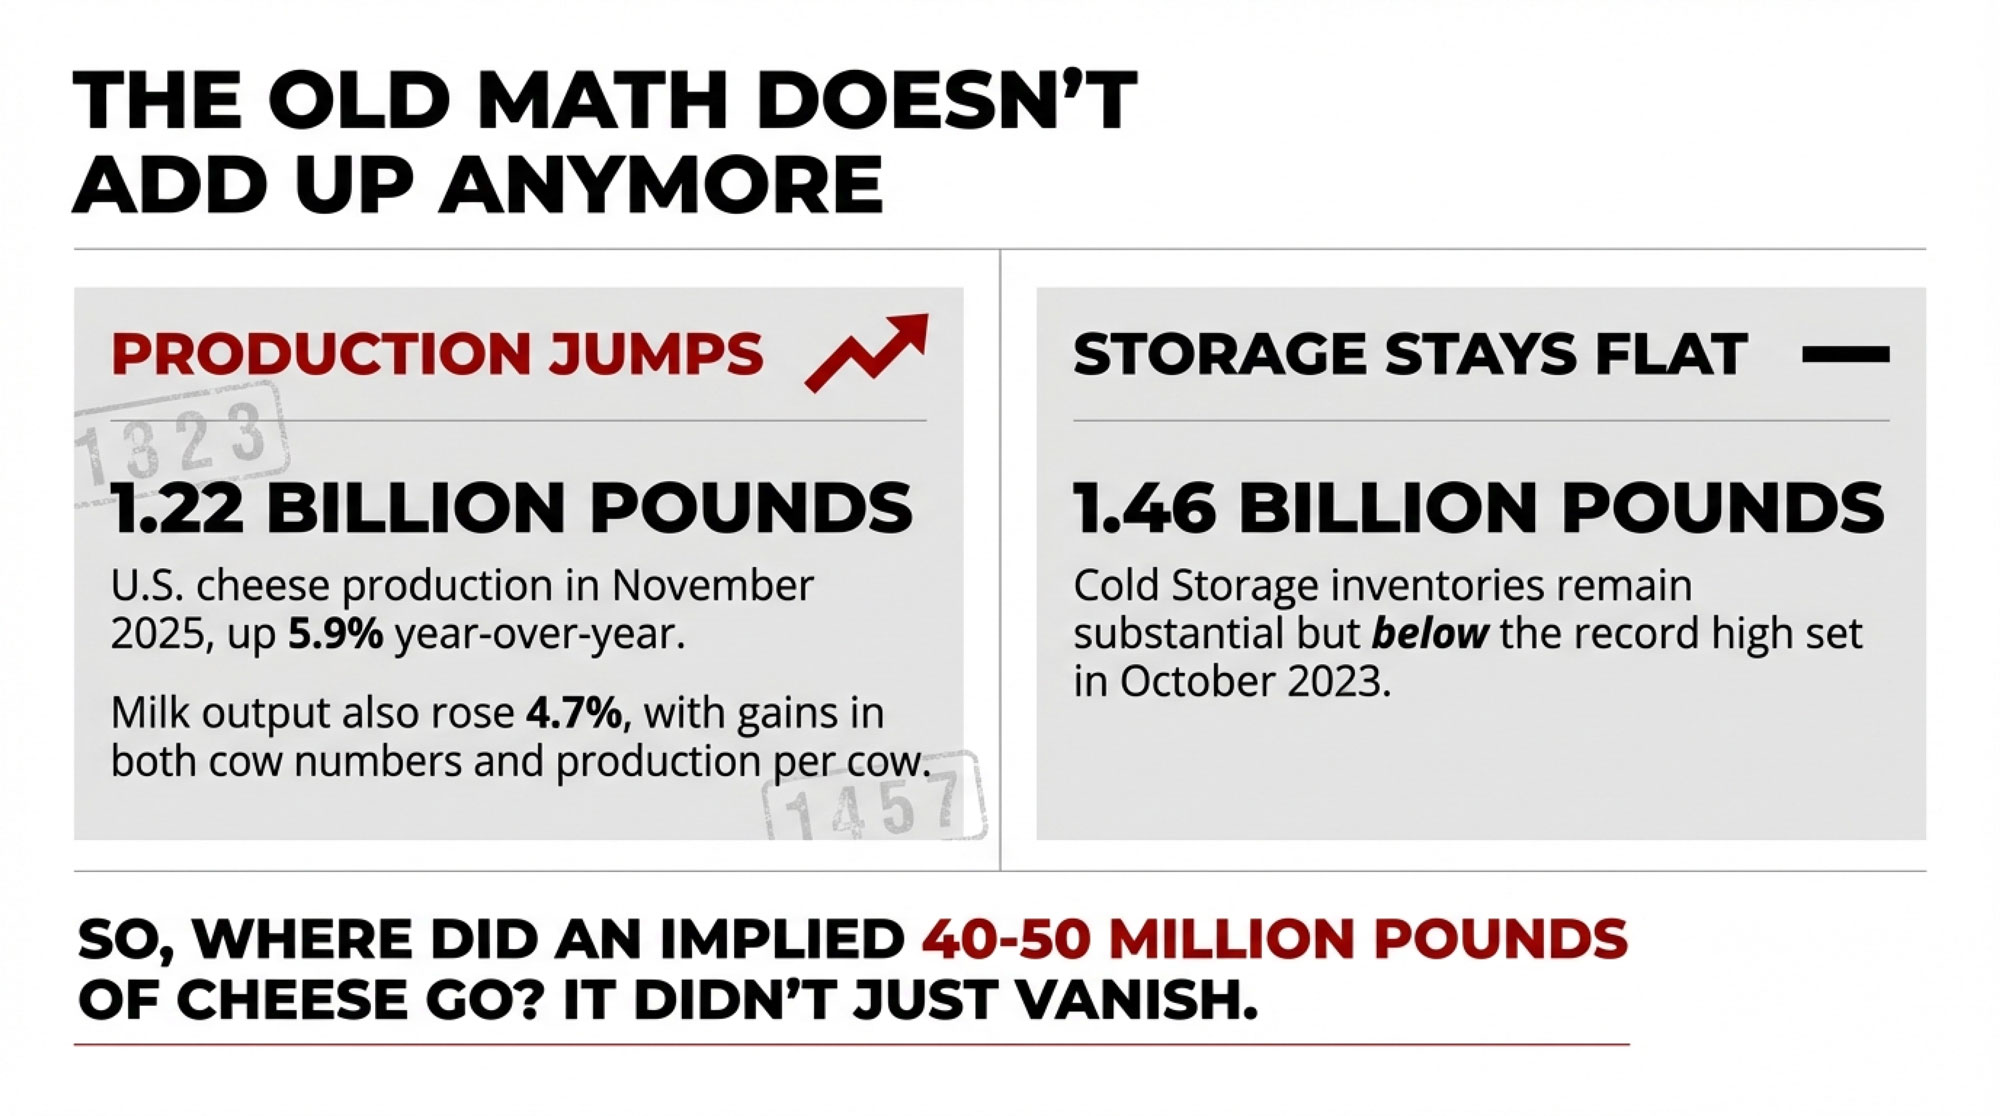
Executive Summary: U.S. cheese production jumped 5.9% to 1.22 billion pounds in November 2025, and milk output rose 4.7%—yet Cold Storage stocks didn’t hit new records, and Class III held firmer than the old “more cheese = lower prices” rule would predict. The reason is structural: roughly 40 to 50 million pounds of cheese flowed through channels that bypass traditional inventory tracking—contract mozzarella for food service, record exports exceeding 1 billion pounds in 2024 (led by Mexico at 38% of volume), and fast-turn value-added products. CME cheddar and Class III now reflect a shrinking share of total U.S. cheese, which means producers relying on those signals alone are flying partially blind. Midwest cheddar-heavy farms still need Cold Storage and CME, but Western and export-linked operations should track USDEC export data and global demand just as closely. The playbook: diversify your indicators, hedge 30–50% of your milk when prices fit your cost structure, ask your buyer how much of their output is cheddar vs. mozzarella vs. exports, and invest in components and transition-cow management—the variables you actually control. The cheese didn’t vanish; the market just evolved faster than many mental models could keep up.

Forty‑four million pounds. That’s not a rounding error; that’s a pretty good sign that the way U.S. dairy moves is changing on us, and you can feel it in your milk check long before you sit down with the latest USDA report.

Looking at the hard numbers first keeps everyone honest. In its Dairy Products report released January 6, 2026, USDA’s National Agricultural Statistics Service says total natural cheese production, excluding cottage cheese, was 1.22 billion pounds in November 2025, 5.9% higher than in November 2024. At the same time, USDA Cold Storage data describe cheese inventories as substantial but still below the “record cheese in cold storage” mark set back in October 2023, when stocks hit about 1.46 billion pounds and made headlines as an all‑time high.

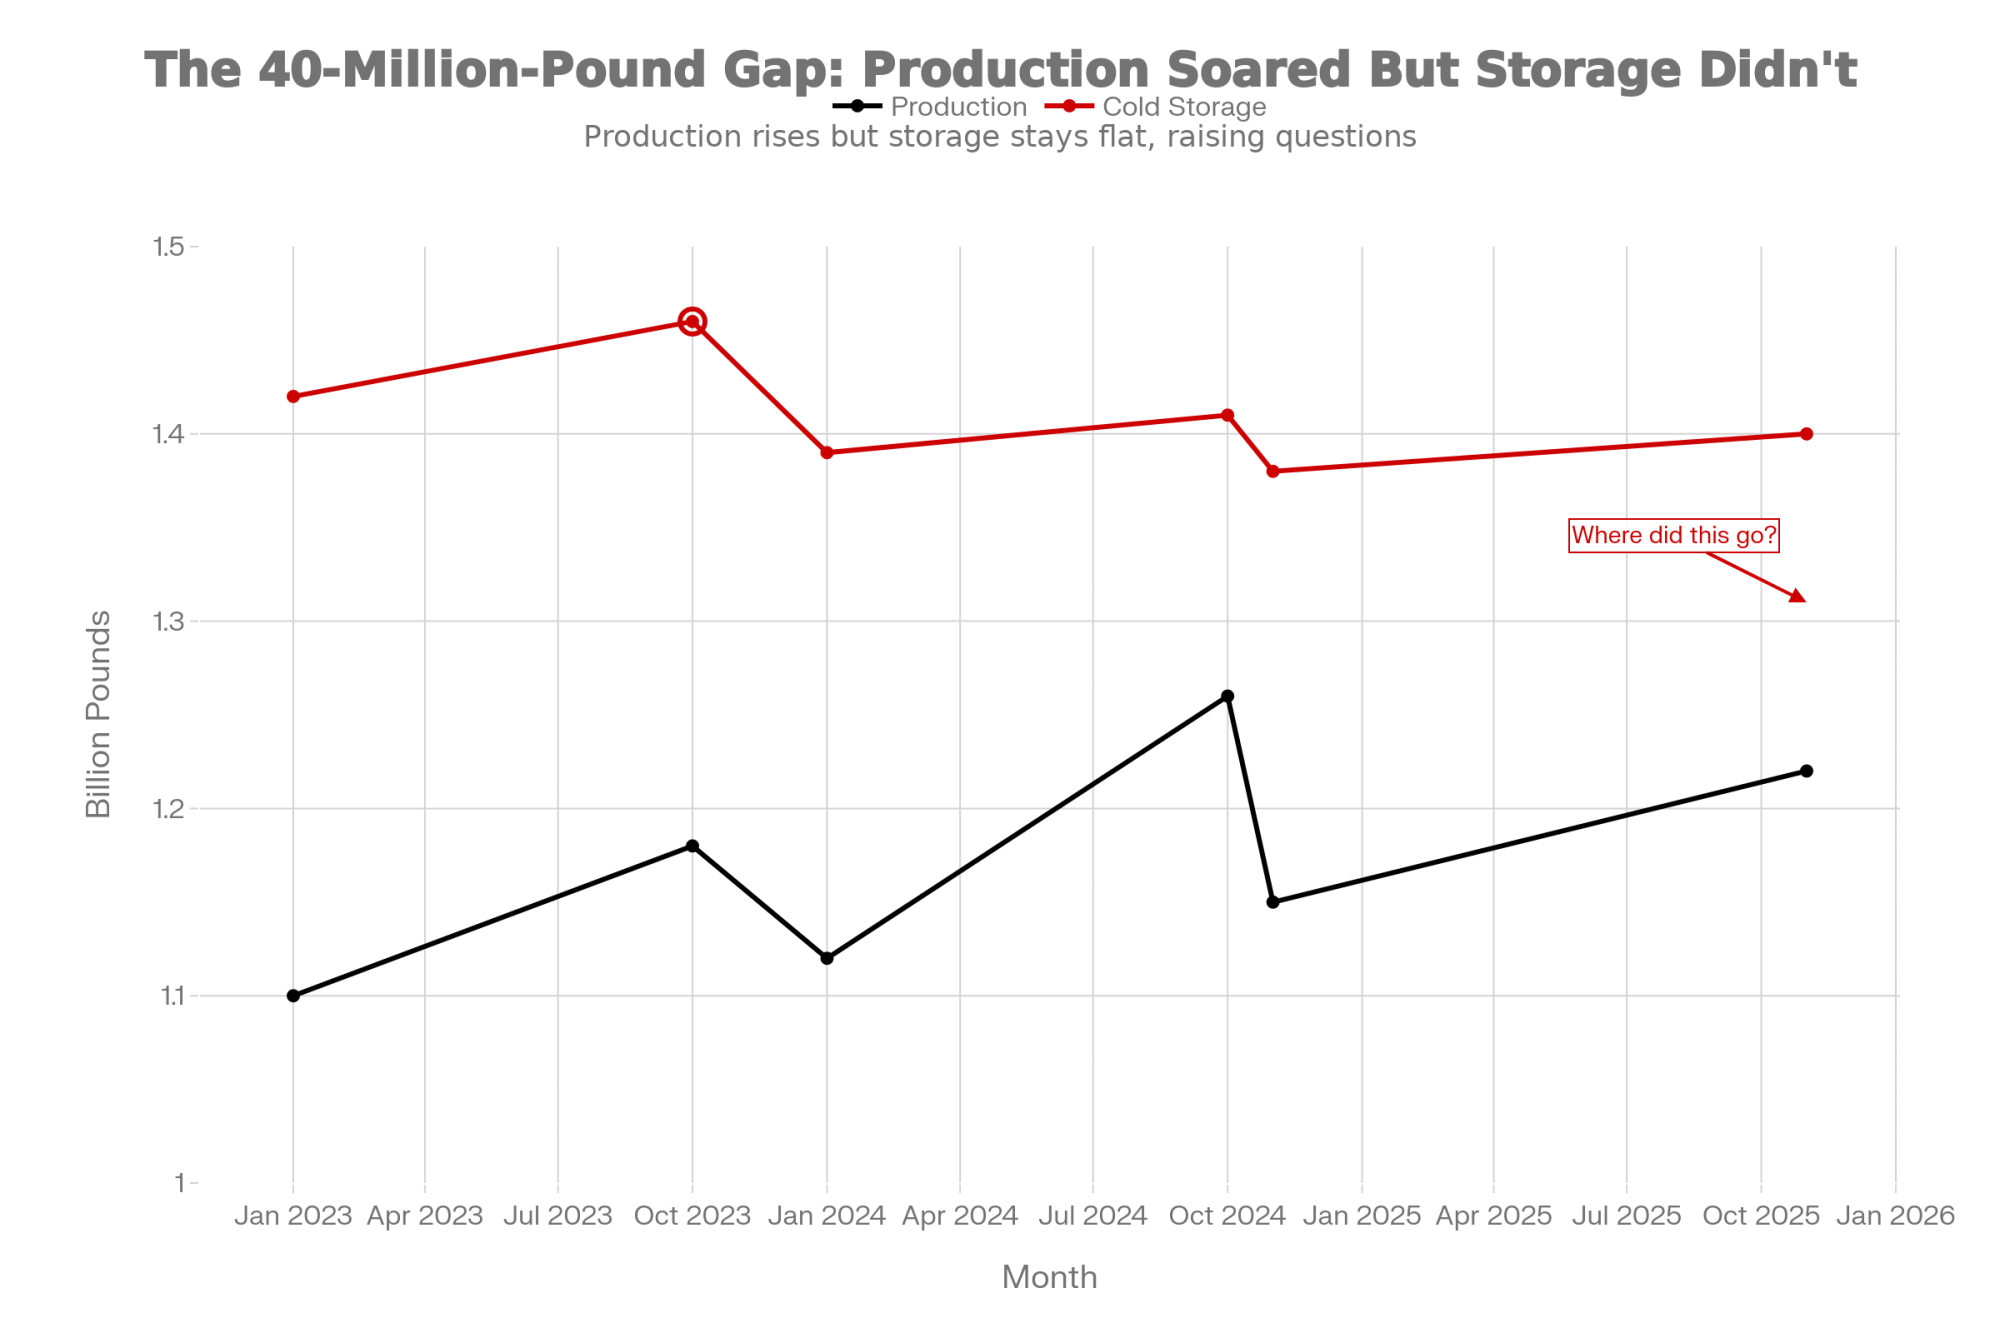
So the data suggests production moved up sharply, but stocks didn’t jump to fresh record levels alongside it. When you put that 5.9% year‑over‑year increase on a 1.22‑billion‑pound base next to “high but not record” storage language, you end up with a rough, implied gap on the order of tens of millions of pounds—somewhere in that 40‑ to 50‑million‑pound neighborhood of cheese that got made in November but didn’t show up as a big extra bulge in the Cold Storage number most of us still watch.

Production climbed 6% year-over-year while Cold Storage stayed below 2023 records—the 40-to-50-million-pound monthly gap is real, and it’s structural

And you know, this isn’t happening in a year when milk is just muddling along. USDA’s Milk Production report released December 22, 2025, puts November output in the 24 major dairy states at 18.1 billion pounds, up 4.7% from November 2024, with total U.S. production at 18.8 billion pounds, up 4.5% on the year. Recent media reports have all noted how quickly both cow numbers and production per cow rose in 2025 compared with 2023–24. On top of that, work on milk composition and efficiency, along with extension discussions from programs like Wisconsin, Cornell, and Penn State, continues to show gradual gains in butterfat performance and protein levels, tied to better fresh-cow management, tighter transition‑period protocols, and greater focus on cow comfort and ration design.

So the milk is there, and the components are there. But the old, simple pattern—more milk, more cheese, more cheese piling up in storage—just doesn’t jump out of the latest reports the way it used to, and that’s where the story really starts to matter for your milk check.

Looking at This Trend Without the Noise

What farmers are finding, when they actually sit down with a coffee and walk through the USDA reports, is that the November numbers make a lot more sense once you separate “how much we made” from “where it went.”

On the production side, the story is pretty straightforward. USDA’s November 2025 Dairy Products summary lays it out plainly: total cheese output (excluding cottage cheese) was 1.22 billion pounds, 5.9% above November 2024 and 3.4% below October 2025. Earlier Dairy Products releases in 2025, and coverage in Brownfield and Cheese Market News describe “more cheese and butter, less whey and powder” and solid year‑over‑year growth across much of the cheese complex, which lines up with what a lot of you have seen in plant‑level reports. Reports has also noted that as butterfat and protein levels in the milk pool have trended higher, more cheese can be produced from every 100 pounds of milk.

On the inventory side, USDA Cold Storage reports and late‑2023 commentary from Brownfield make it clear that October 2023 remains the record high for cheese in storage, at around 1.46 billion pounds. Later updates through 2024 and into 2025 talk about “heavy” or “ample” stocks but don’t flag new records, which fits with what we see in the market: plenty of cheese around, but not a repeat of that 2023 peak.

When you put those two pieces together, the math keeps pointing in the same direction. Production is up sharply. Inventories aren’t pushing into new record territory. The difference—again, roughly that 40‑ to 50‑million‑pound range in a month like November, when you ballpark it—is being absorbed somewhere other than long‑term storage. The real question is where it’s going, and that’s where things start to get interesting.

ChannelEstimated Monthly Volume (Million lbs)% of GapWhy It Bypasses Cold Storage
Export Programs15–2035–40%Moves plant → port consolidator → container; not surveyed in NASS commercial stocks
Contract Mozzarella (Food Service)12–1825–35%Tight delivery schedules for pizza chains; lean inventories, frequent shipments
Fast-Turn Value-Added Products5–810–15%Shredded blends, cheese ingredients, protein-fortified products sold B2B with short lead times
Direct Retail & Private Label3–56–10%Moves quickly through retailer DCs; minimal time in commercial cold storage
Other & Timing Differences2–44–8%Reporting lags, in-transit inventory, non-surveyed smaller warehouses
TOTAL GAP40–50100%

What’s Interesting About Mozzarella Right Now

Looking at this trend, what’s interesting is that the cheese telling the story isn’t cheddar; it’s mozzarella.

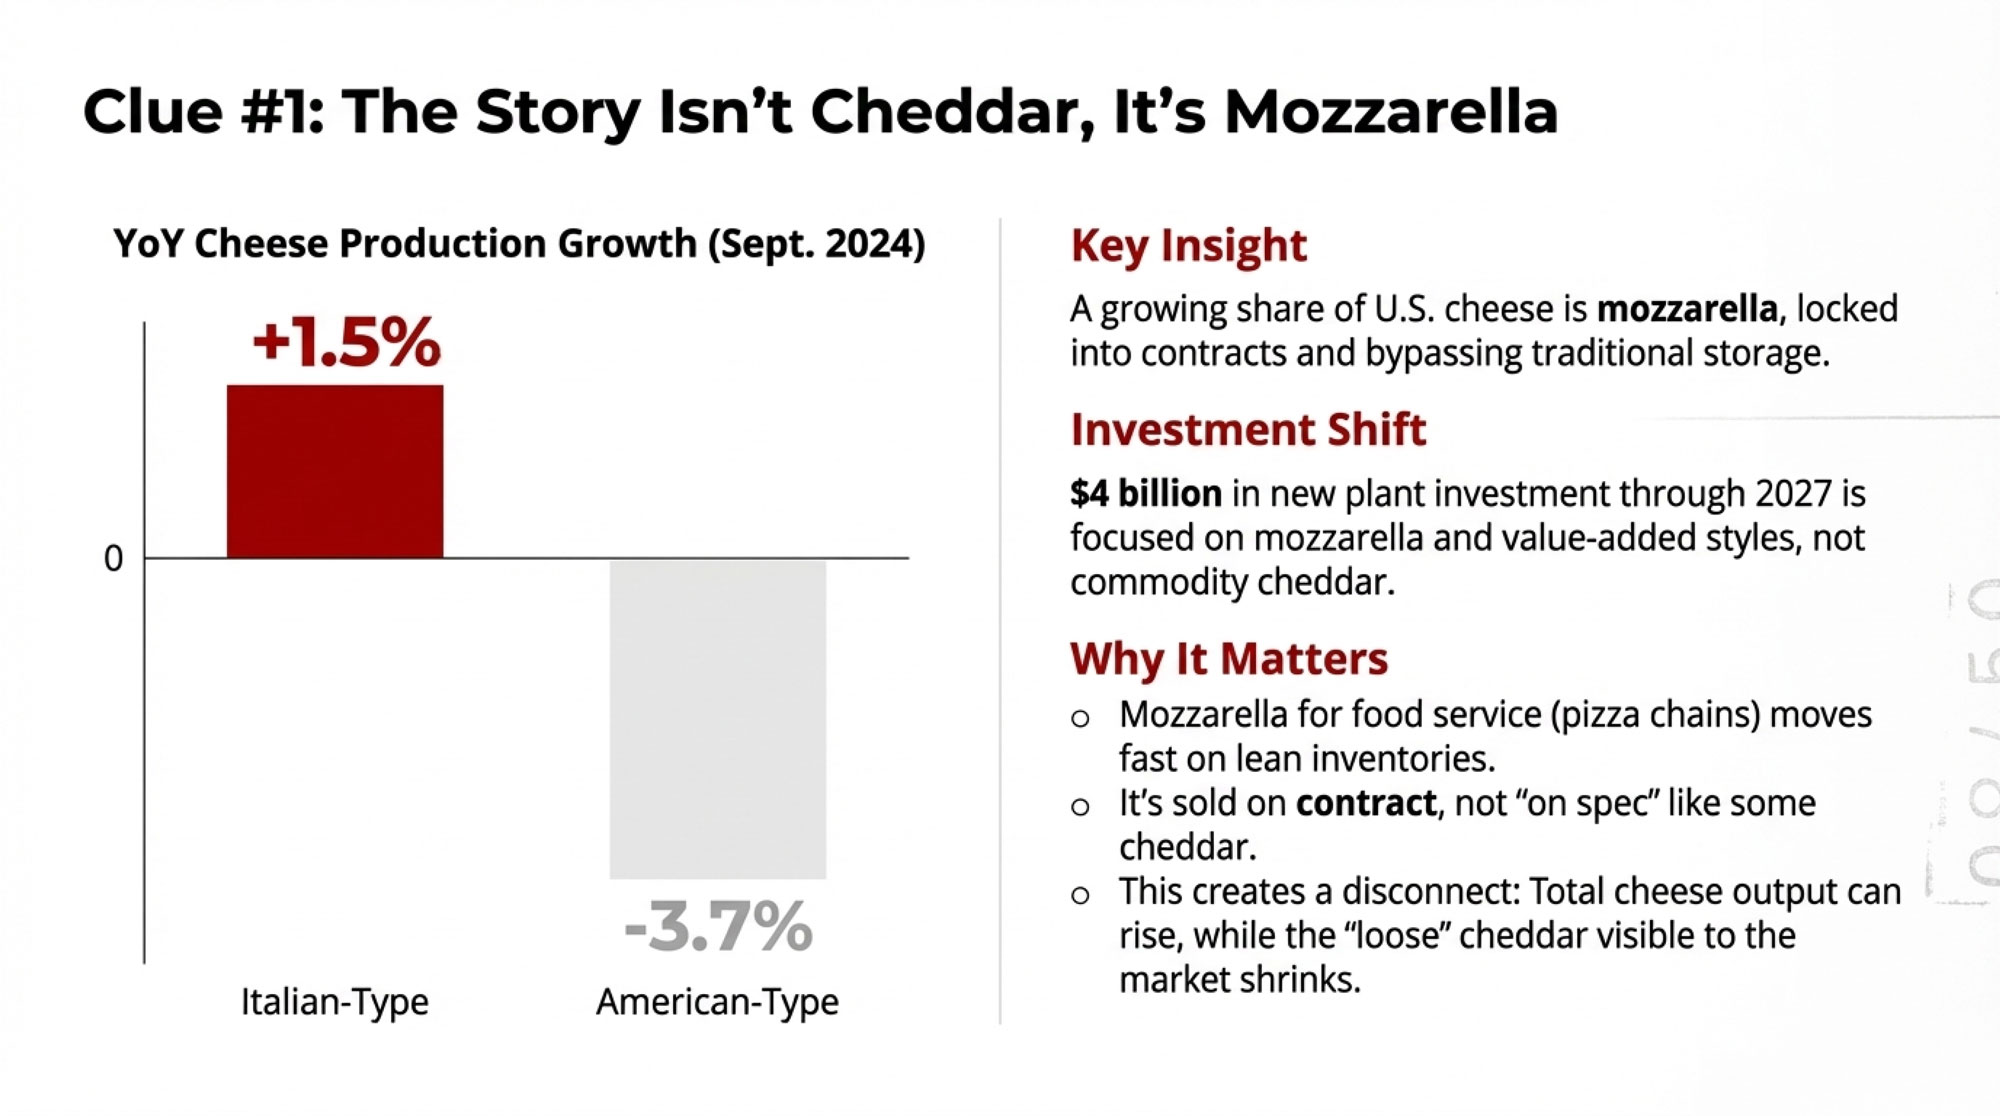
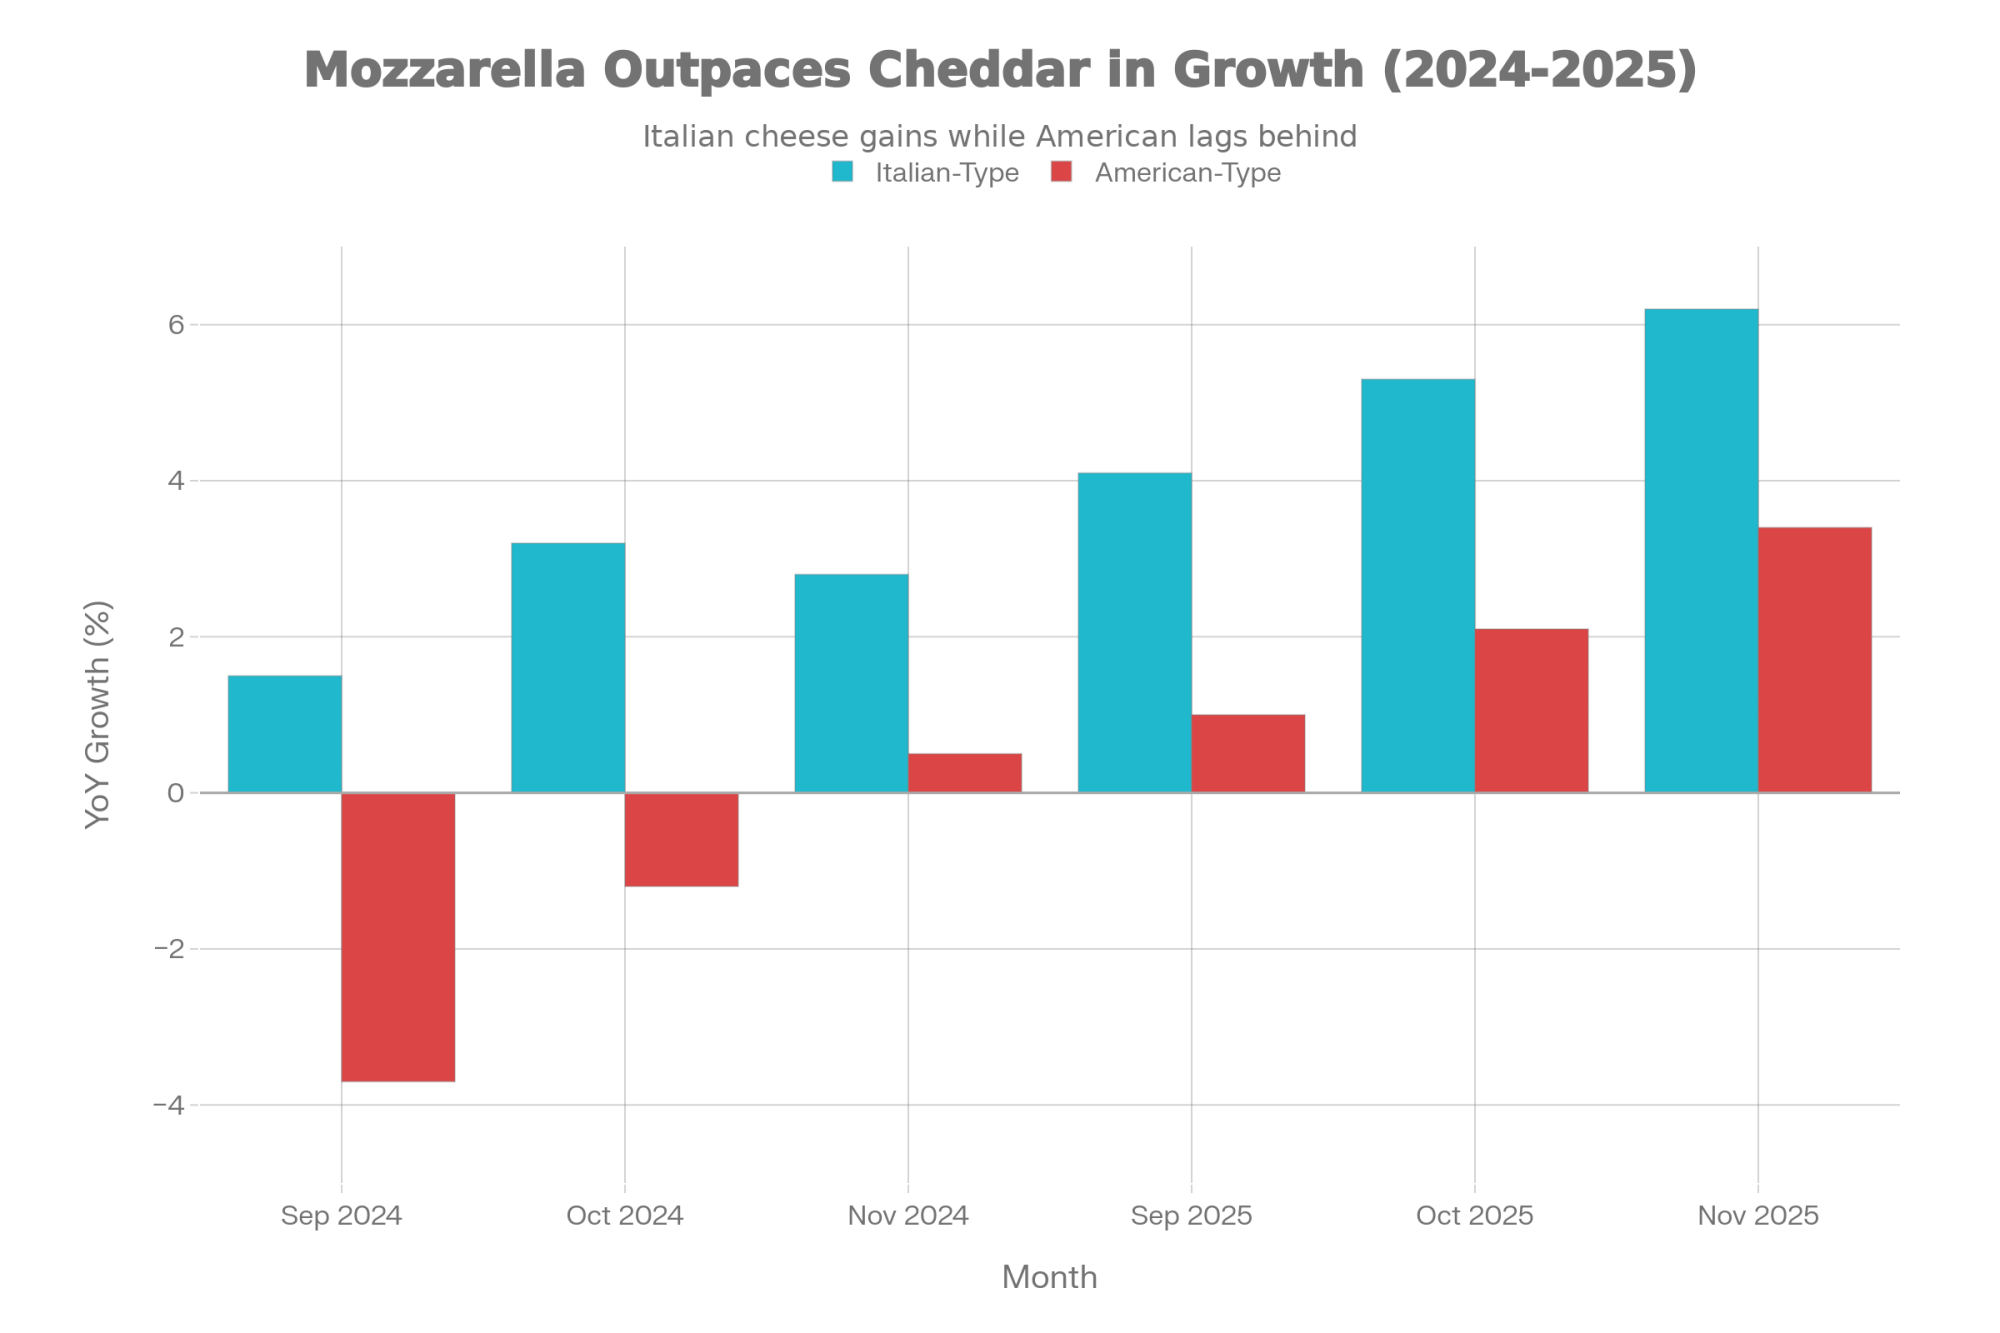
USDA’s breakdowns for Italian‑type and American‑type cheeses in the Dairy Products reports show multiple recent months when Italian‑type cheese—including mozzarella—grew faster than total cheese, while American‑type cheese, including cheddar, lagged behind or even slipped below year‑ago levels. September 2024 total cheese production was about 1.16 billion pounds, up slightly from 2023, with Italian‑type cheese up 1.5% year‑over‑year at 487 million pounds and American‑type cheese down 3.7% from a year earlier. That same USDA snapshot showed butter production at 159 million pounds, up 11.3% on the year; nonfat dry milk production up 14.3%; and skim milk powder down 21.4%, which suggests plants are actively shifting cream and skim between product streams as markets move.

From a technical angle, researchers at places like the University of Wisconsin’s Center for Dairy Research and other dairy science groups have explained that low‑moisture mozzarella for pizza is designed for fast movement rather than long aging. The functional shelf life and performance window for pizza mozz are shorter than those for many cheddar styles, and large food‑service buyers—national pizza chains, regional restaurant distributors—try to run lean inventories with regular, frequent deliveries rather than big piles of cheese sitting in a freezer somewhere.

MonthItalian-Type CheeseAmerican-Type Cheese
Sep 2024+1.5%-3.7%
Oct 2024+3.2%-1.2%
Nov 2024+2.8%+0.5%
Sep 2025+4.1%+1.0%
Oct 2025+5.3%+2.1%
Nov 2025+6.2%+3.4%

On the ground, what I’ve noticed—and it lines up with what you hear in risk‑management workshops and plant visits—is that mozzarella lines are often heavily tied to contracts. Plants usually have a pretty tight handle on what their core accounts need week to week and month to month, whether that’s a national chain program, a regional distributor, or a long‑term export deal, and they run those vats accordingly. They’re not churning out mozzarella “on spec” the way some cheddar used to move; they’re filling orders that are already on the books.

Cheddar’s role is shifting at the same time. USDA data shows American‑type cheese growing more slowly than “all cheese” in several months, and in some cases running below year‑earlier levels while Italian‑type keeps climbing. Analysis of cheese markets and export opportunities has also highlighted about $ 4 billion in new cheese plants slated to come online through 2027, with new facilities already taking milk in Kansas and Texas and more expansions underway in the Upper Midwest, along the East Coast, and in the West. Company announcements and industry reporting emphasize mozzarella, Hispanic cheeses, and other value‑added styles as key outputs from many of these investments, often alongside powders and concentrated fat and protein ingredients.

This development suggests a structural disconnect that a lot of you are feeling in your milk checks. The CME spot market and the Class III milk price formula still lean heavily on cheddar blocks and barrels plus dry whey, as research on U.S. dairy futures, price transmission, and market integration has documented. When a growing share of U.S. cheese production is mozzarella and other styles that are locked into contracts or export channels, and a smaller share is “loose” cheddar available to show up in CME trading and Cold Storage, total cheese production and CME‑visible cheddar supply just aren’t tied together like they used to be.

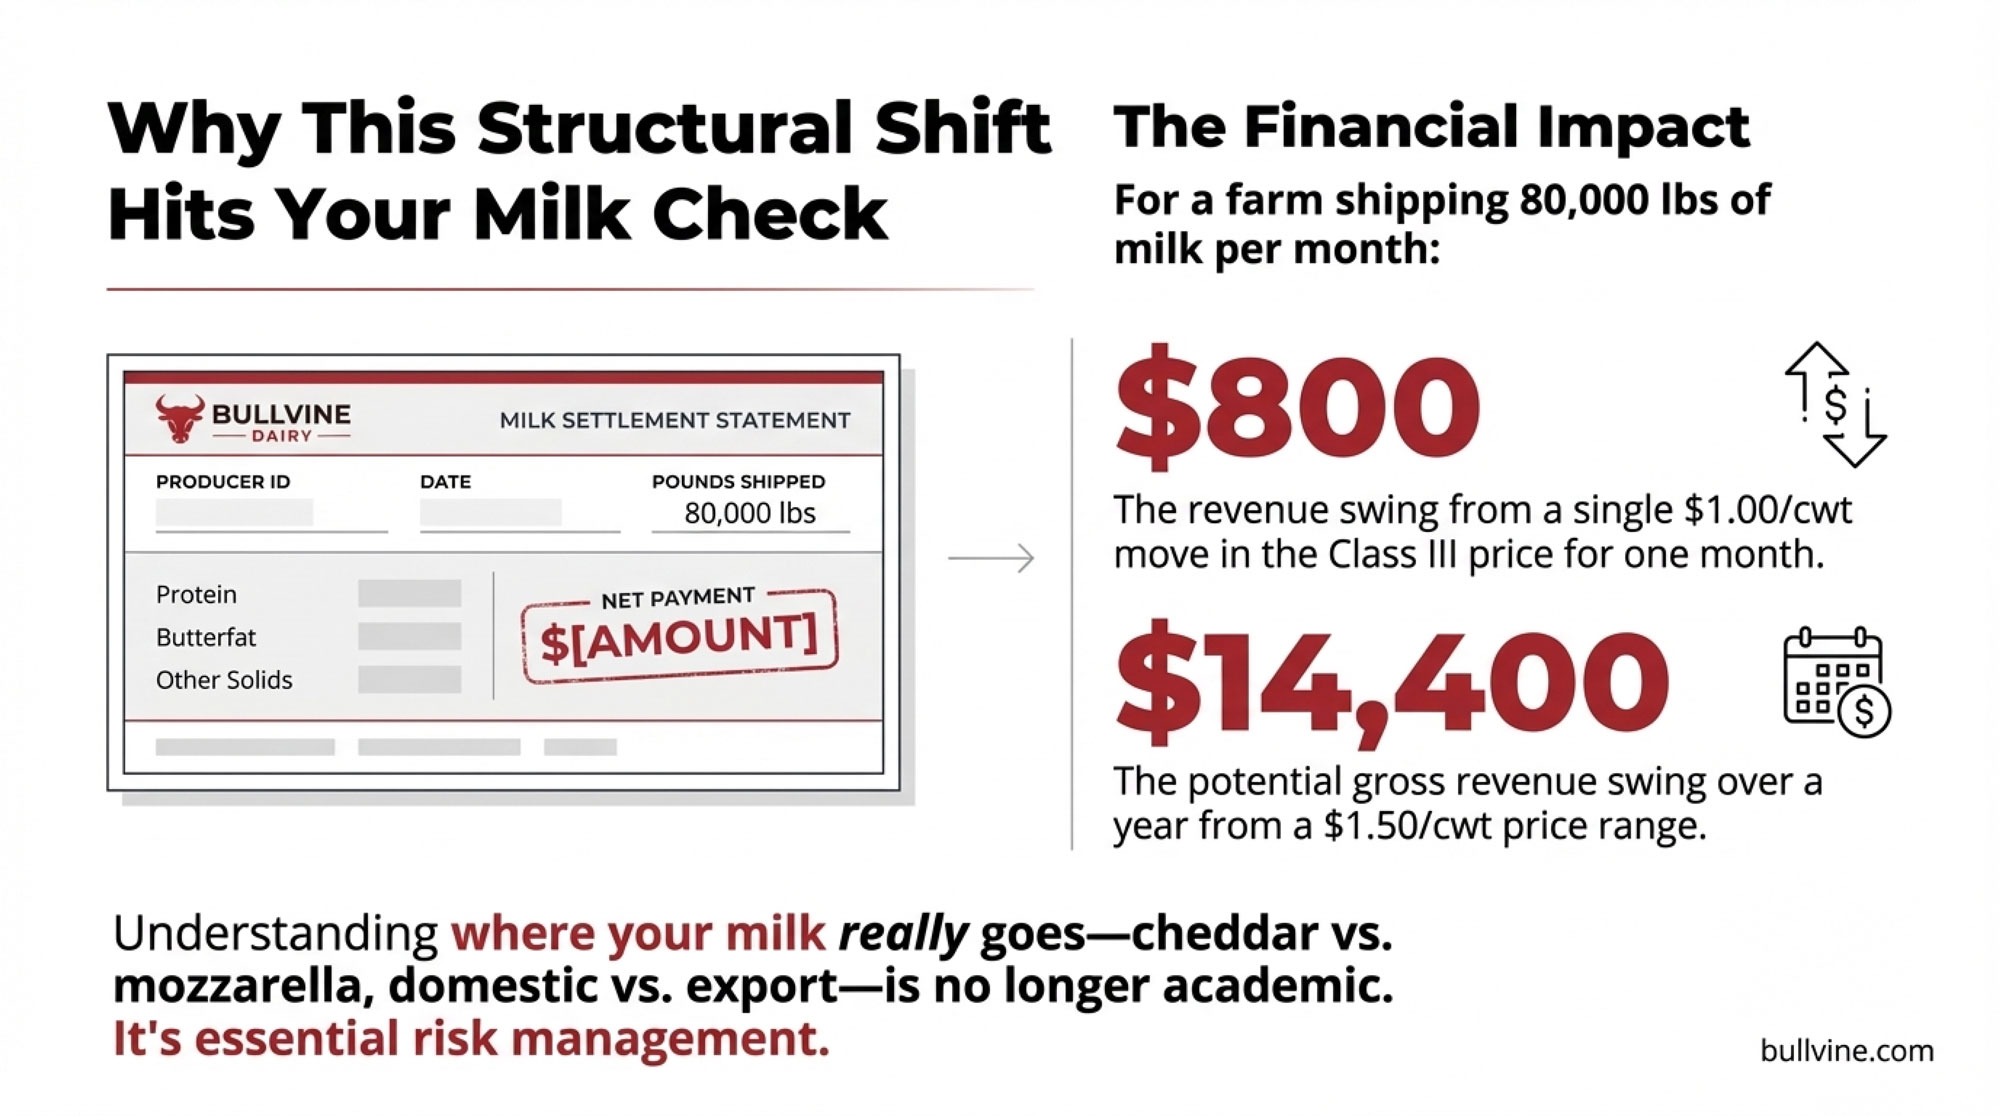
To put some numbers behind that feeling, think about a farm shipping around 80,000 pounds of milk in a month. Each one‑dollar move in Class III is roughly 800 dollars up or down in gross revenue for that month, because 80,000 pounds is 800 hundredweights. On a 500‑cow freestall in the Midwest, that’s a noticeable swing. On a 3,000‑cow dry lot system in the Southwest, you multiply that impact several times over. So the way cheese moves—cheddar versus mozzarella, domestic versus export—flows straight back to your bottom line.

Herd Size / TypeMonthly Milk Volume (lbs)Impact of $1.00 Class III Move (Monthly)Impact of $1.50 Range Over 12 Months (Annual)% of Typical Net Margin
80-cow grazing (Northeast)80,000$800$14,400~12–15%
500-cow freestall (Midwest)500,000$5,000$90,000~10–13%
1,200-cow (Western/Midwest)1,200,000$12,000$216,000~9–12%
3,000-cow dry lot (West)3,000,000$30,000$540,000~8–11%

And if you zoom out a bit, a $1.50 per hundredweight range over a year on those same 80,000 pounds a month adds up to about $14,400 of gross revenue, swinging one way or the other. That’s real money when you start lining it up against feed bills, interest payments, or the cost of upgrading fresh cow facilities.

Exports: The Other Big Piece of the Puzzle

What farmers are finding, when they look beyond domestic reports, is that exports are quietly soaking up a lot of that “extra” cheese.

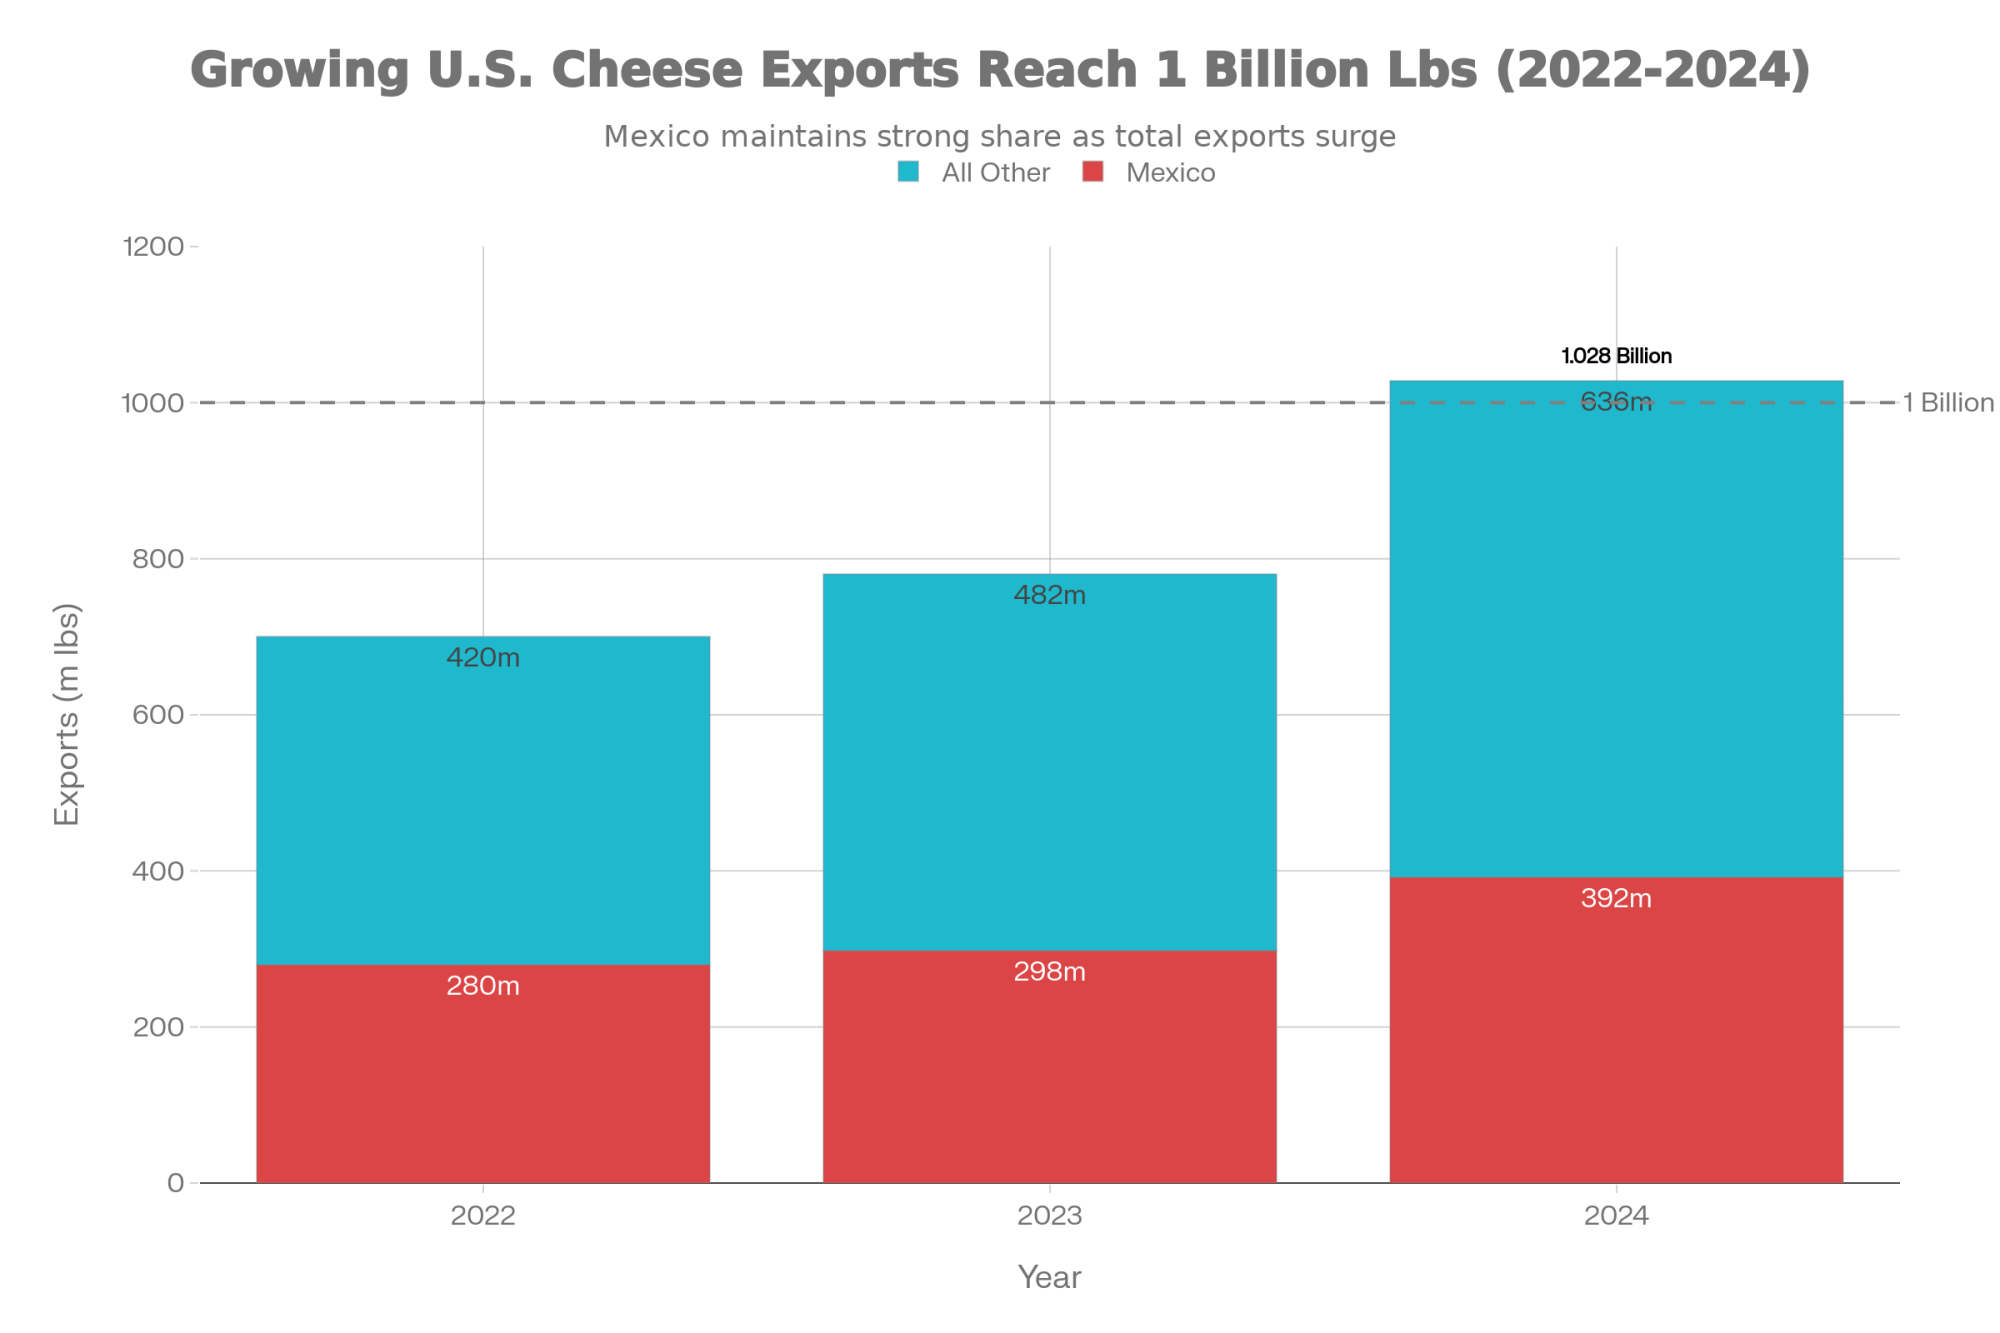
Media reports in early 2025 that U.S. cheese exports through November 2024 reached 1.028 billion pounds, the first time they’d crossed the billion‑pound mark. Mexico alone accounted for 392 million pounds of that total, roughly 38% of all U.S. cheese exports, and increased its cheese imports from the U.S. by 32% compared with the same period in 2023. The Bullvine’s own coverage of that milestone drew on USDEC and USDA Foreign Agricultural Service data and noted that South Korea, Japan, Central America, and several Middle Eastern buyers also increased their cheese purchases from the U.S., helping push exports over that threshold.

YearMexico All Other Destinations Total
2022280 million lbs420 million lbs700 million lbs
2023298 million lbs482 million lbs780 million lbs
2024392 million lbs636 million lbs1,028 million lbs

A 2024 export review in Progressive Dairy and Dairy Processing reported that total U.S. dairy export value reached about 8.2 billion dollars in 2024, with cheese exports totaling roughly 508,808 metric tons—about 1.12 billion pounds—an improvement of around 17% over 2023. That same coverage highlighted Mexico and Canada together taking more than 40% of U.S. dairy export value, with Mexico importing about 2.47 billion dollars’ worth of U.S. dairy products and Canada around 1.14 billion. USDEC’s own summaries reinforce that cheese has become a leading export item by volume and value for the U.S. in recent years, especially into North American and Asian markets.

In plain language, those buyers are acting like a second home market for U.S. cheese. That’s the kind of demand that can absorb a lot of “extra” product before it ever shows up as a big stock build in Cold Storage.

So if you step back from the individual line items, it’s pretty clear where a big chunk of that “missing” 40‑ to 50‑million‑pound gap in a month like November can go. It doesn’t stick around in domestic Cold Storage because much of it simply leaves the country through export channels.

Physically, export cheese tends to follow a different path than domestic retail cheese. It often moves from the plant to a specialized consolidator or a warehouse near a port, then into refrigerated containers bound for overseas destinations, spending relatively little time in the broad commercial cold‑storage facilities that NASS surveys for its stock reports. The same pattern holds for concentrated butterfat products—anhydrous milk fat and high‑fat blends—produced for export or industrial customers, which are usually sold under contract and don’t always show up neatly in the familiar “butter in cold storage” figures.

Fast‑Moving Channels and Value‑Added Products

What’s interesting here is that exports aren’t the only thing changing how cheese and components move. Domestic distribution has been evolving right alongside the global story.

Industry reporting has highlighted the growing share of cheese and dairy ingredients moving through food‑service and business‑to‑business channels, supported by regular, frequent shipments and lean inventory strategies. Major restaurant chains and broadline distributors often prefer multiple smaller deliveries rather than big, infrequent loads, especially when they’re dealing with shredded mozzarella, custom blends, or ingredient cheeses tailored to specific food manufacturers.

At the same time, research reviews and applied nutrition work are documenting steady growth in value‑added fluid and high‑protein dairy products—filtered milks, protein‑fortified beverages, and specialty dairy drinks—that build on higher butterfat and protein levels in the milk supply. Several recent and planned processing projects in states like Kansas and Texas, highlighted by regional agribusiness outlets, are designed to produce both cheese and higher‑value components, capturing more value from butterfat and protein rather than simply pushing volume into commodity powder and bulk butter.

All of this lines up with what many of us have seen on the ground over the last decade: that old “production minus stocks” rule of thumb used to capture a big chunk of what was happening in the market. Today, it describes a smaller slice. The milk still gets turned into product, and the product still gets sold, but more of it is moving through channels—export programs, contract‑driven mozzarella lines, food‑service and ingredient streams, and value‑added beverages—that don’t create large, slow‑moving inventories in the specific warehouses USDA tracks as “cheese in cold storage.”

How This Feels in Different Milksheds

The national data might be the same on paper, but it sure doesn’t feel that way on every farm. Regional context matters a lot, and it’s worth talking about that openly.

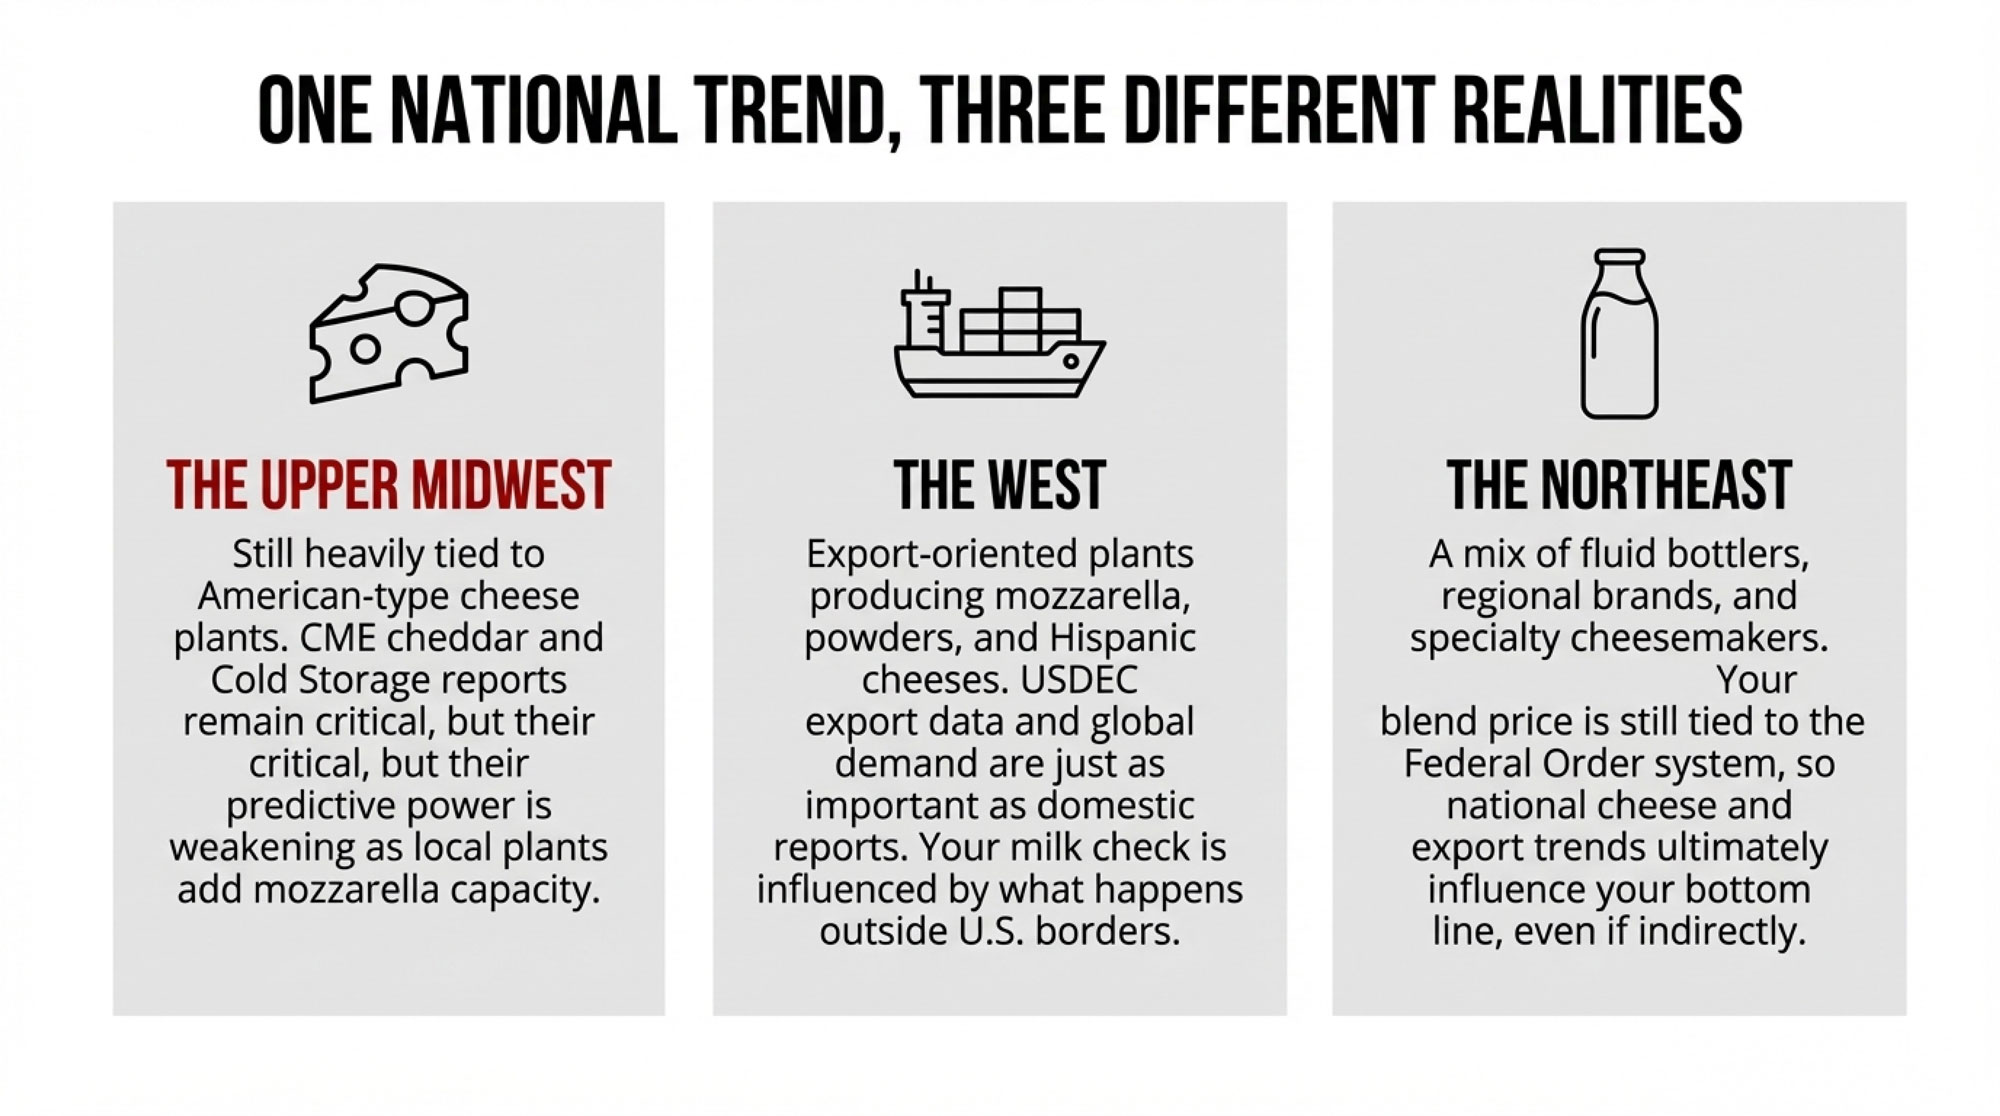
In Wisconsin operations and across much of the Upper Midwest, a large share of milk still goes into plants with substantial American‑type cheese capacity, even though many of those plants have added Italian‑type and specialty cheese lines in recent years. Many Midwest producers will tell you they still watch Cold Storage reports and CME cheddar prices almost like a weather forecast, because historically those numbers have been tightly linked to local basis and premiums—a relationship regional market updates and extension economists in that area often highlight. As more capacity in the Midwest shifts toward mozzarella and specialty cheeses, though, that one‑to‑one connection gets noisier. The indicators still matter; they just don’t explain everything the way they used to.

In California and the broader West, a lot of major plants built or expanded over the last decade were designed from day one with exports and value‑added production in mind. These facilities commonly produce mozzarella, Hispanic cheeses, milk powders, and concentrated fat and protein ingredients for both domestic and international customers, a pattern that shows up repeatedly in Western market updates and company announcements. Western producers shipping to those plants are often just as focused on export program health, port congestion, and global demand as they are on Cold Storage or the latest Dairy Products report, because their milk checks are heavily influenced by what’s happening outside U.S. borders.

In the Northeast, quite a few smaller and grazing‑based family farms still ship to fluid bottlers, regional brands, or specialty cheesemakers. Their daily reality revolves around local retail demand, co‑op policies, and regional brand strength, which is a story you see in provincial and state‑level dairy board and market reports. Even so, their blend prices and over‑order premiums still flow out of a federal order system tied back to national Class I, III, and IV values, which respond to the same production, inventory, and export trends we’ve been walking through.

For Canadian readers operating under supply management, it’s worth noting that while quota systems and Canadian Dairy Commission programs do buffer day‑to‑day volatility at the farm gate, the same global trends in cheese exports, product mix, and component emphasis still influence processor investment decisions and trade pressures that show up in national board discussions and long‑term policy debates.

So, as many of us have seen, one size doesn’t fit all. The November numbers are the same across the country—and, in many ways, across the border too—but the way they land in your mailbox depends heavily on who’s buying your milk, what they’re making with it, and how much of their business leans on cheddar, mozzarella, Class III versus Class IV, exports, or value‑added products.

Region / MilkshedDominant Cheese TypesPrimary Price Signals to WatchExport ExposureHedging PriorityWhat Keeps You Up at Night
Midwest (WI, MN, IA)Cheddar, some mozzarellaCME blocks/barrels, Cold Storage, Class III futuresModerate (15–25% of volume)CME Class III options, DRPCold Storage builds, cheddar oversupply
West (CA, ID, NM, TX)Mozzarella, Hispanic cheeses, powdersUSDEC exports, global powder prices, Class III & IVHigh (30–45% of volume)Class III/IV combo, export contract hedgesMexico demand swings, port delays, trade disputes
Northeast (PA, NY, VT)Regional brands, specialty, fluidClass I differentials, regional blend price, over-order premiumsLow (5–15% of volume)Basis contracts, limited futuresFluid demand decline, retail brand strength, local co-op health

What Farmers Are Finding Helps in This Environment

So, sitting here over coffee, the real question is: what do you actually do with all this?

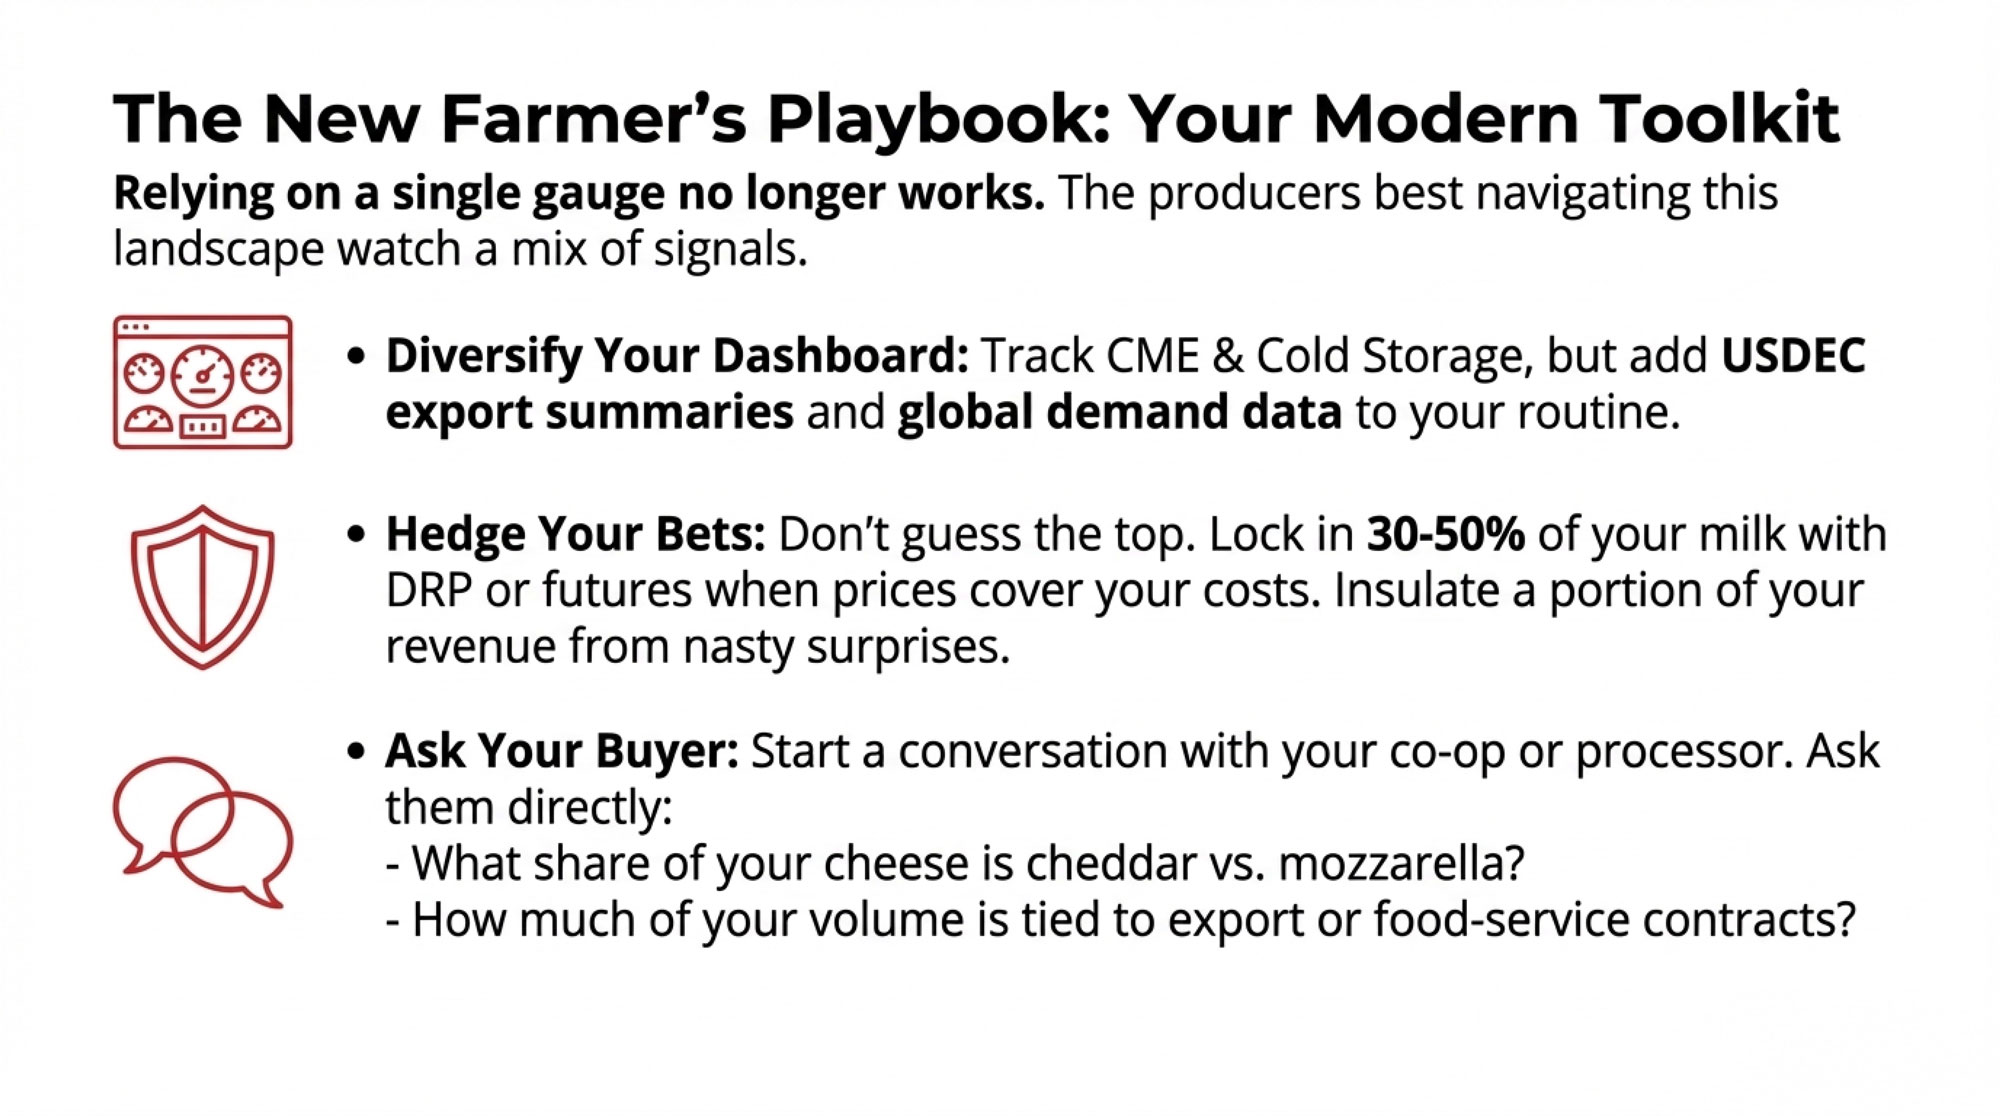
One thing I’ve noticed, and it matches what land‑grant risk‑management programs are teaching, is that relying on a single gauge doesn’t work very well anymore. Watching only cheese production, or only Cold Storage, or only the Class III board is a good way to be surprised. The producers who seem most comfortable navigating this changing landscape tend to watch a mix of signals—USDA Milk Production and Dairy Products reports, Cold Storage updates, USDEC and USDA export statistics, plus the information they get from their buyers and co‑ops.

That’s why much of the extension work focuses on partial hedging strategies rather than “all in” or “all out” approaches. The idea isn’t to guess the exact top or bottom; it’s to lock in a portion of your milk—often something in that 30% to 50% range—for a few months ahead when futures or Dairy Revenue Protection coverage levels line up with your cost structure, and leave the rest open to the market. That way, a nasty price surprise doesn’t hit 100% of your volume, but you’re not completely locked into a price that might look too low if markets rally later. For a 500‑cow herd shipping around 80,000 pounds a month, covering even a third of that volume means several hundred hundredweights are insulated if Class III falls apart for a few weeks, which can be the difference between a bad month and a really rough one.

Of course, none of those tools are free. Hedging carries costs and margin requirements, and stepping up your risk‑management program means investing more time in tracking markets and working with advisors. Improving fresh cow management and the transition period requires investing time, training, and often capital in facilities, rations, or monitoring, as on-farm case studies and extension bulletins regularly point out. But when you line those costs up next to the revenue swings that come with a volatile Class III and the kind of structural shifts we’re seeing in cheese markets, a lot of farms are deciding it’s worth putting at least some of those tools to work.

On top of price tools, butterfat performance and protein yield are still right at the center of most advisory conversations, and for good reason. Research and on‑farm work from programs such as Penn State, Cornell, and Wisconsin consistently show that better transition‑period management, less stress on fresh cows, and careful ration balancing are among the most reliable levers you’ve got for improving components and overall milk value. You can’t control where CME cheddar settles next week. You absolutely can influence how your cows come through calving, what their transition period looks like, and how efficiently they convert feed into fat and protein.

It’s also worth talking directly with your buyer or co‑op. Producers who ask questions such as, “Roughly what share of your cheese output is cheddar versus mozzarella or other styles?” and “How much of your volume is tied to export programs or food‑service contracts?” usually walk away with a much clearer picture of what drives their basis and premiums. You’re not asking them to hand over their business plan; you’re trying to understand whether your milk check is more exposed to CME cheddar swings, changing export demand, or shifts in domestic retail and food‑service patterns.

If you want to get even more practical, here are a few simple starting points producers are using:

  • If you’re a Midwest farm heavily tied to cheddar:
    Keep a close eye on CME block and barrel prices, USDA Cold Storage cheese stocks, and Class III futures, and ask your co‑op how much of their output is still commodity cheddar versus mozzarella or specialty styles. That helps you judge how quickly a cheddar price break could hit your basis compared with a neighbor shipping to a plant with a more mixed product portfolio.
  • If you’re shipping to a Western plant focused on mozzarella and exports:
    Add USDEC export summaries, global cheese price comparisons, and port or logistics updates to your watch list, and ask how much of your milk ends up in export programs under long‑term contracts. That gives you a better handle on how trade disputes, freight issues, or foreign demand swings might show up in your mailbox, even when domestic stocks look comfortable.
  • If you’re a smaller Northeast or grazing‑based operation:
    Track Class I, III, and IV prices plus regional blend prices, and talk with your buyer or co‑op about how their product mix—fluid, regional brands, or specialty cheese—feeds back into your over‑order premiums. That helps you see whether your check is more sensitive to local fluid demand or to the same cheese and export forces driving the national conversation.

For co‑ops and processors, the same November data push in a similar direction. Channel mix is now a strategic decision, not just an operational detail. Knowing how much of your product mix goes into retail grocery, food‑service, industrial ingredients, and export programs helps you decide which data streams you absolutely need on your dashboard—Cold Storage, Dairy Market News, Global Dairy Trade auctions, USDEC export statistics, scanner data for retail cheese and butter, and even global futures where appropriate. It’s why more co‑ops and plants are building simple internal dashboards that put USDA production and inventory reports next to export volumes and global price indices, something extension economists and industry consultants have been encouraging in board‑room and planning sessions.

The Bottom Line

What’s encouraging in all this is that the system isn’t broken; it’s evolving.

We’ve got more milk and more cheese than we did a year ago, according to the USDA’s Milk Production and Dairy Products reports for November 2025. Butterfat performance and protein levels have improved on many farms after years of work on genetics, fresh-cow management, and the transition period, a trend reflected in both research and industry commentary. U.S. cheese exports have pushed past the billion‑pound mark for the first time, with Mexico and a growing list of other countries playing major roles, as documented by USDEC‑linked trade summaries. New plants worth billions of dollars are coming online, many of them designed to make mozzarella and other value‑added cheeses along with powders and concentrated components for both domestic and global markets.

So when someone says, “Forty‑four million pounds of cheese disappeared in November,” you know the cheese didn’t vanish. It moved through channels that our old mental shortcuts don’t always capture very well—contract‑driven mozzarella destined for pizza ovens, record‑level export programs, fast‑turn food‑service and ingredient sales, and value‑added dairy products that don’t pile up in the Cold Storage bins we all grew up watching.

If you keep that bigger picture in mind while you’re checking USDA reports, talking with your buyer, and planning your own risk and herd management, you’ll be in a better spot to decide what to lock in, what to leave open, and where to invest your time and dollars—whether that’s tightening transition‑cow protocols, tweaking rations to support stronger butterfat performance, or asking a few more pointed questions at your next co‑op meeting about where your milk really goes once it leaves the yard. 

Key Takeaways:

  • Production up, stocks flat: November 2025 cheese hit 1.22 billion pounds (+5.9% YoY), yet Cold Storage didn’t set new records—roughly 40-50 million pounds moved through exports, contract mozzarella, and fast-turn channels that bypass traditional tracking.
  • Exports are a second-home market: U.S. cheese exports topped 1 billion pounds in 2024 for the first time; Mexico took 38% of the volume, absorbing supply before it piles up in storage.
  • CME cheddar no longer tells the whole story: Class III reflects a shrinking slice of total U.S. cheese—if Cold Storage and block prices are your only signals, you’re flying partially blind.
  • Regional exposure varies: Midwest cheddar-heavy farms still need CME and Cold Storage; Western and export-linked operations should weight USDEC data and global demand equally.
  • Control what you can: butterfat performance, transition-cow protocols, partial hedging (30-50%), and knowing where your milk actually goes matter more than guessing where cheddar will settle next week.

Learn More

Complete references and supporting documentation are available upon request by contacting the editorial team at editor@thebullvine.com.

Learn More

The Sunday Read Dairy Professionals Don’t Skip.

Every week, thousands of producers, breeders, and industry insiders open Bullvine Weekly for genetics insights, market shifts, and profit strategies they won’t find anywhere else. One email. Five minutes. Smarter decisions all week.
NewsSubscribe
First
Last
Consent
Send this to a friend