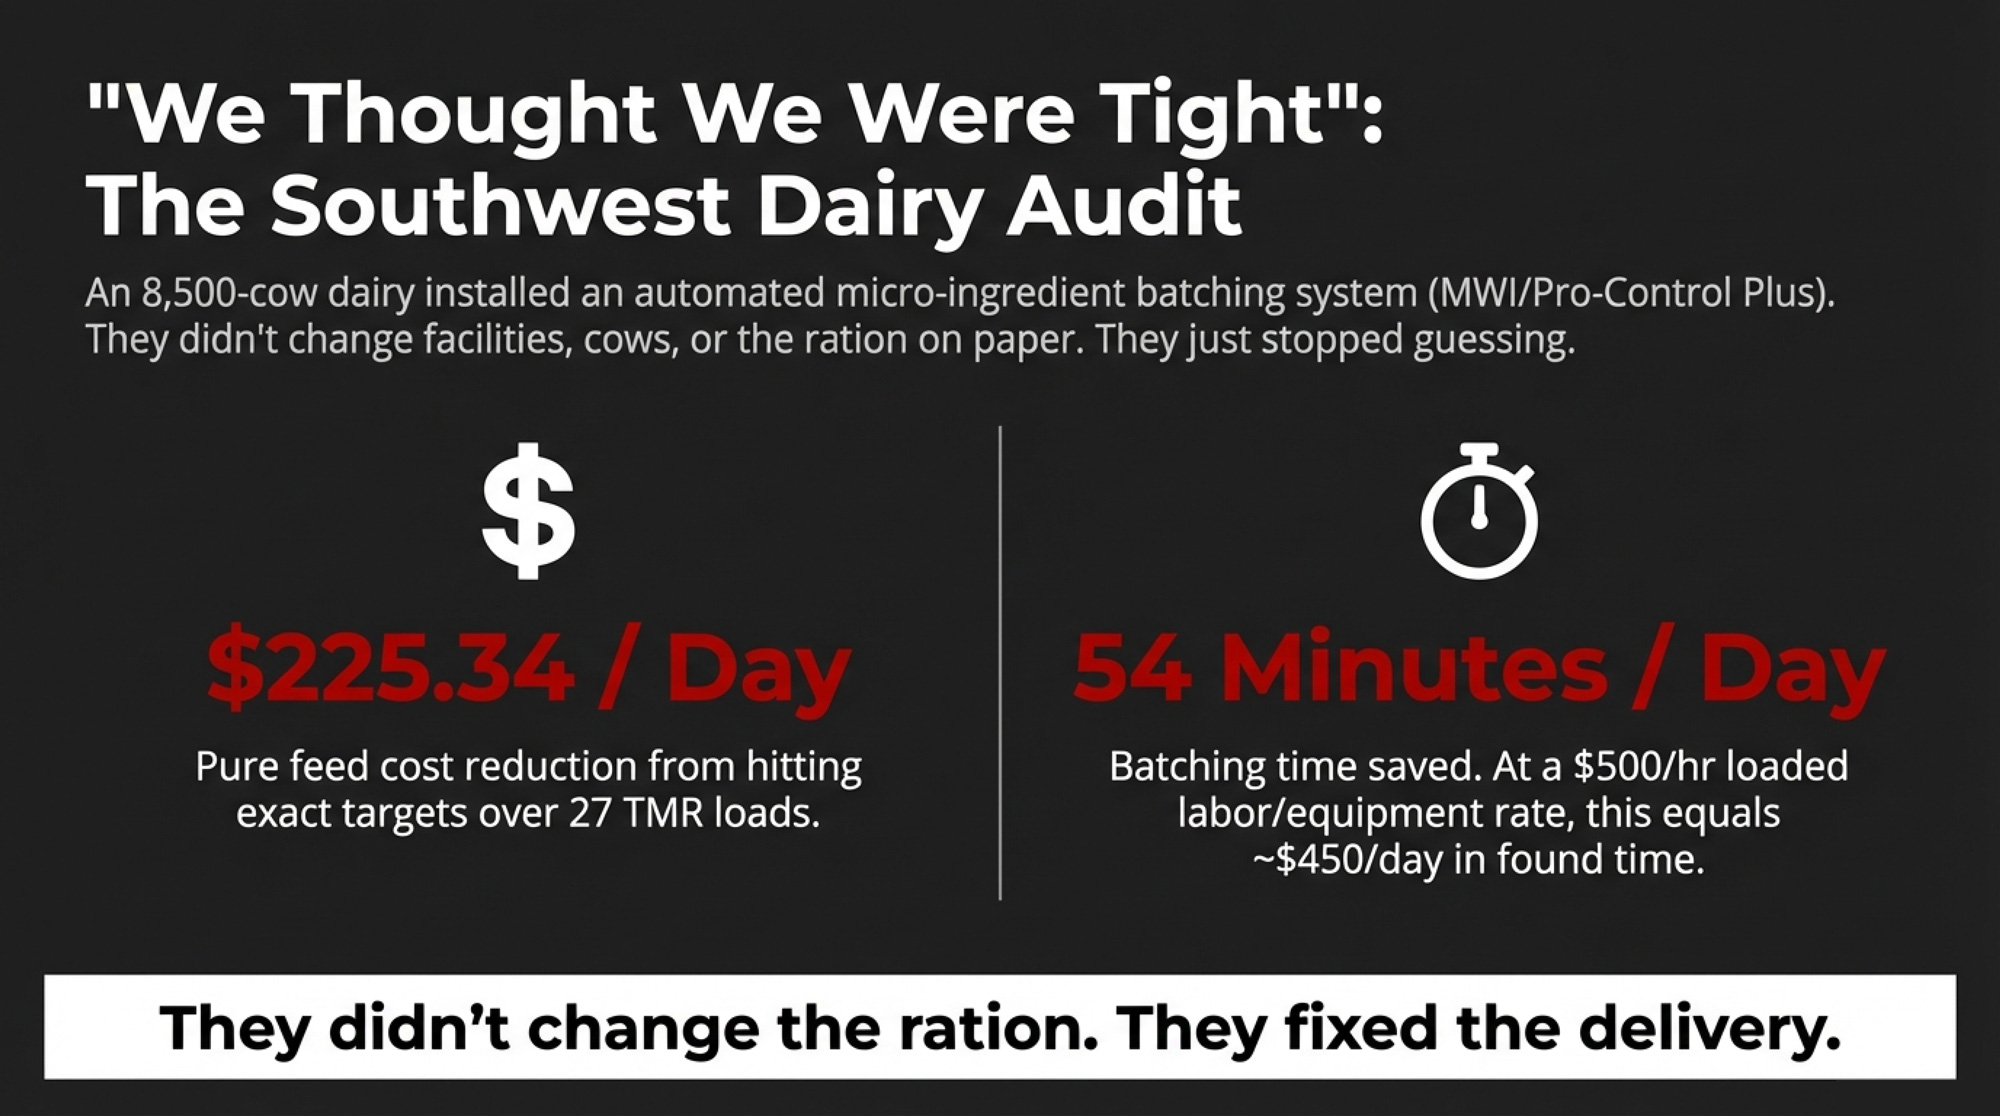
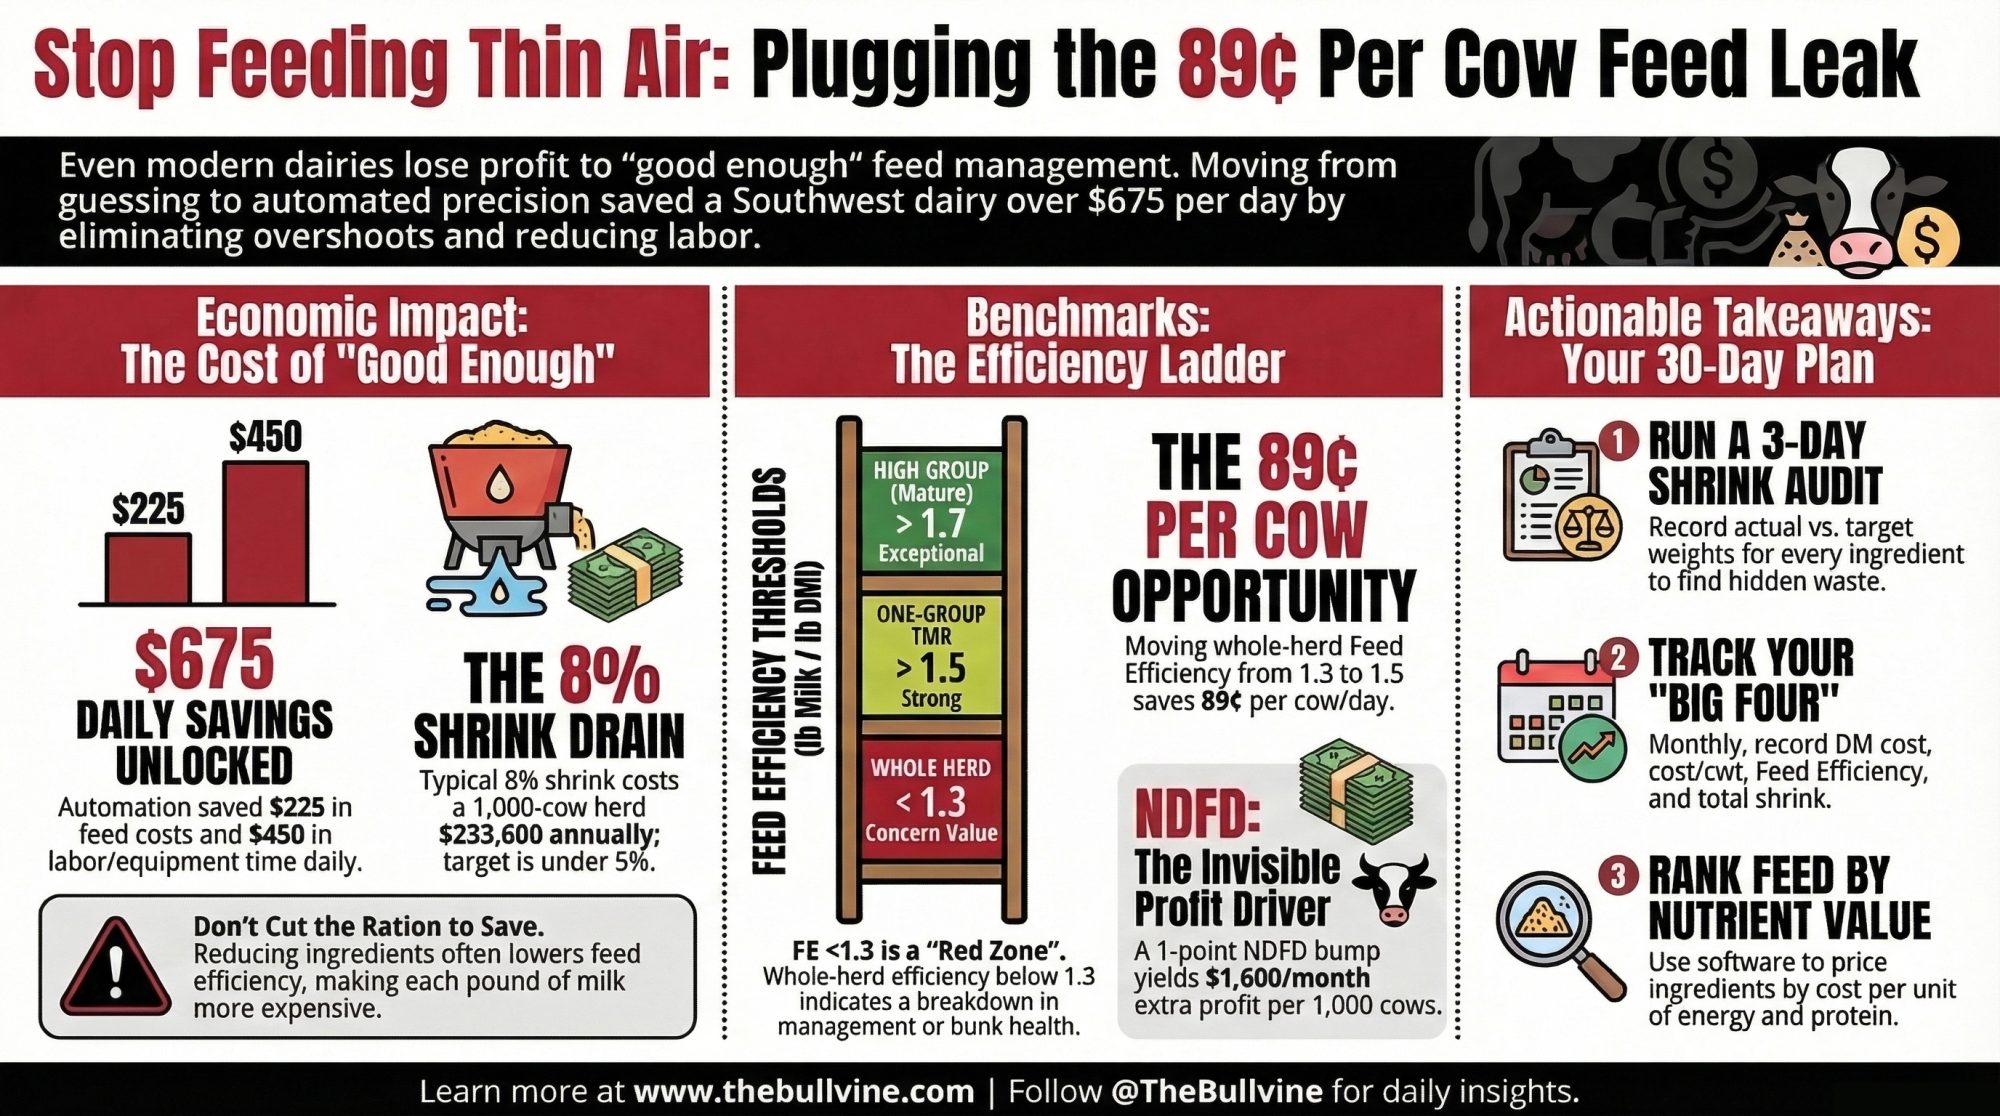
An 8,500‑cow Southwest dairy installed a batching system and suddenly found $225 a day in feed they’d been “feeding” to thin air. Sure, your numbers wouldn’t say the same?
Executive Summary: A Southwest dairy milking 8,500 cows was sure its feed program was “good enough” until an automated batching system exposed an 89¢ per cow per day leak in the feed center. Tightening micro‑ingredient delivery with MWI’s system and Pro‑Control Plus didn’t change the ration on paper, but it cut $225.34/day in feed cost and saved 54 minutes/day of batching time across 27 loads. Hutjens’ benchmarks and simple barn math show why that matters: whole‑herd feed efficiency below 1.3 and total shrink in the 6.5–8.5% range quietly turn feed into a six‑figure annual drain. The article lays out exactly how those numbers play out — from the 89¢/cow/day FE ladder to the $233,600/year lost at 8% shrink on a 1,000‑cow herd — and why cutting the ration usually makes IOFC worse, not better. It then turns the Southwest dairy’s wake‑up call into a playbook any herd can use: run a 3‑day shrink audit, write down four key numbers (DM cost, feed cost per cwt, FE, shrink), price feeds by nutrient value, and treat NDF digestibility like a trait you get paid for before next harvest. Readers finish with concrete thresholds and 30‑day actions to decide whether their own “good enough” feed program is quietly starving their profits.
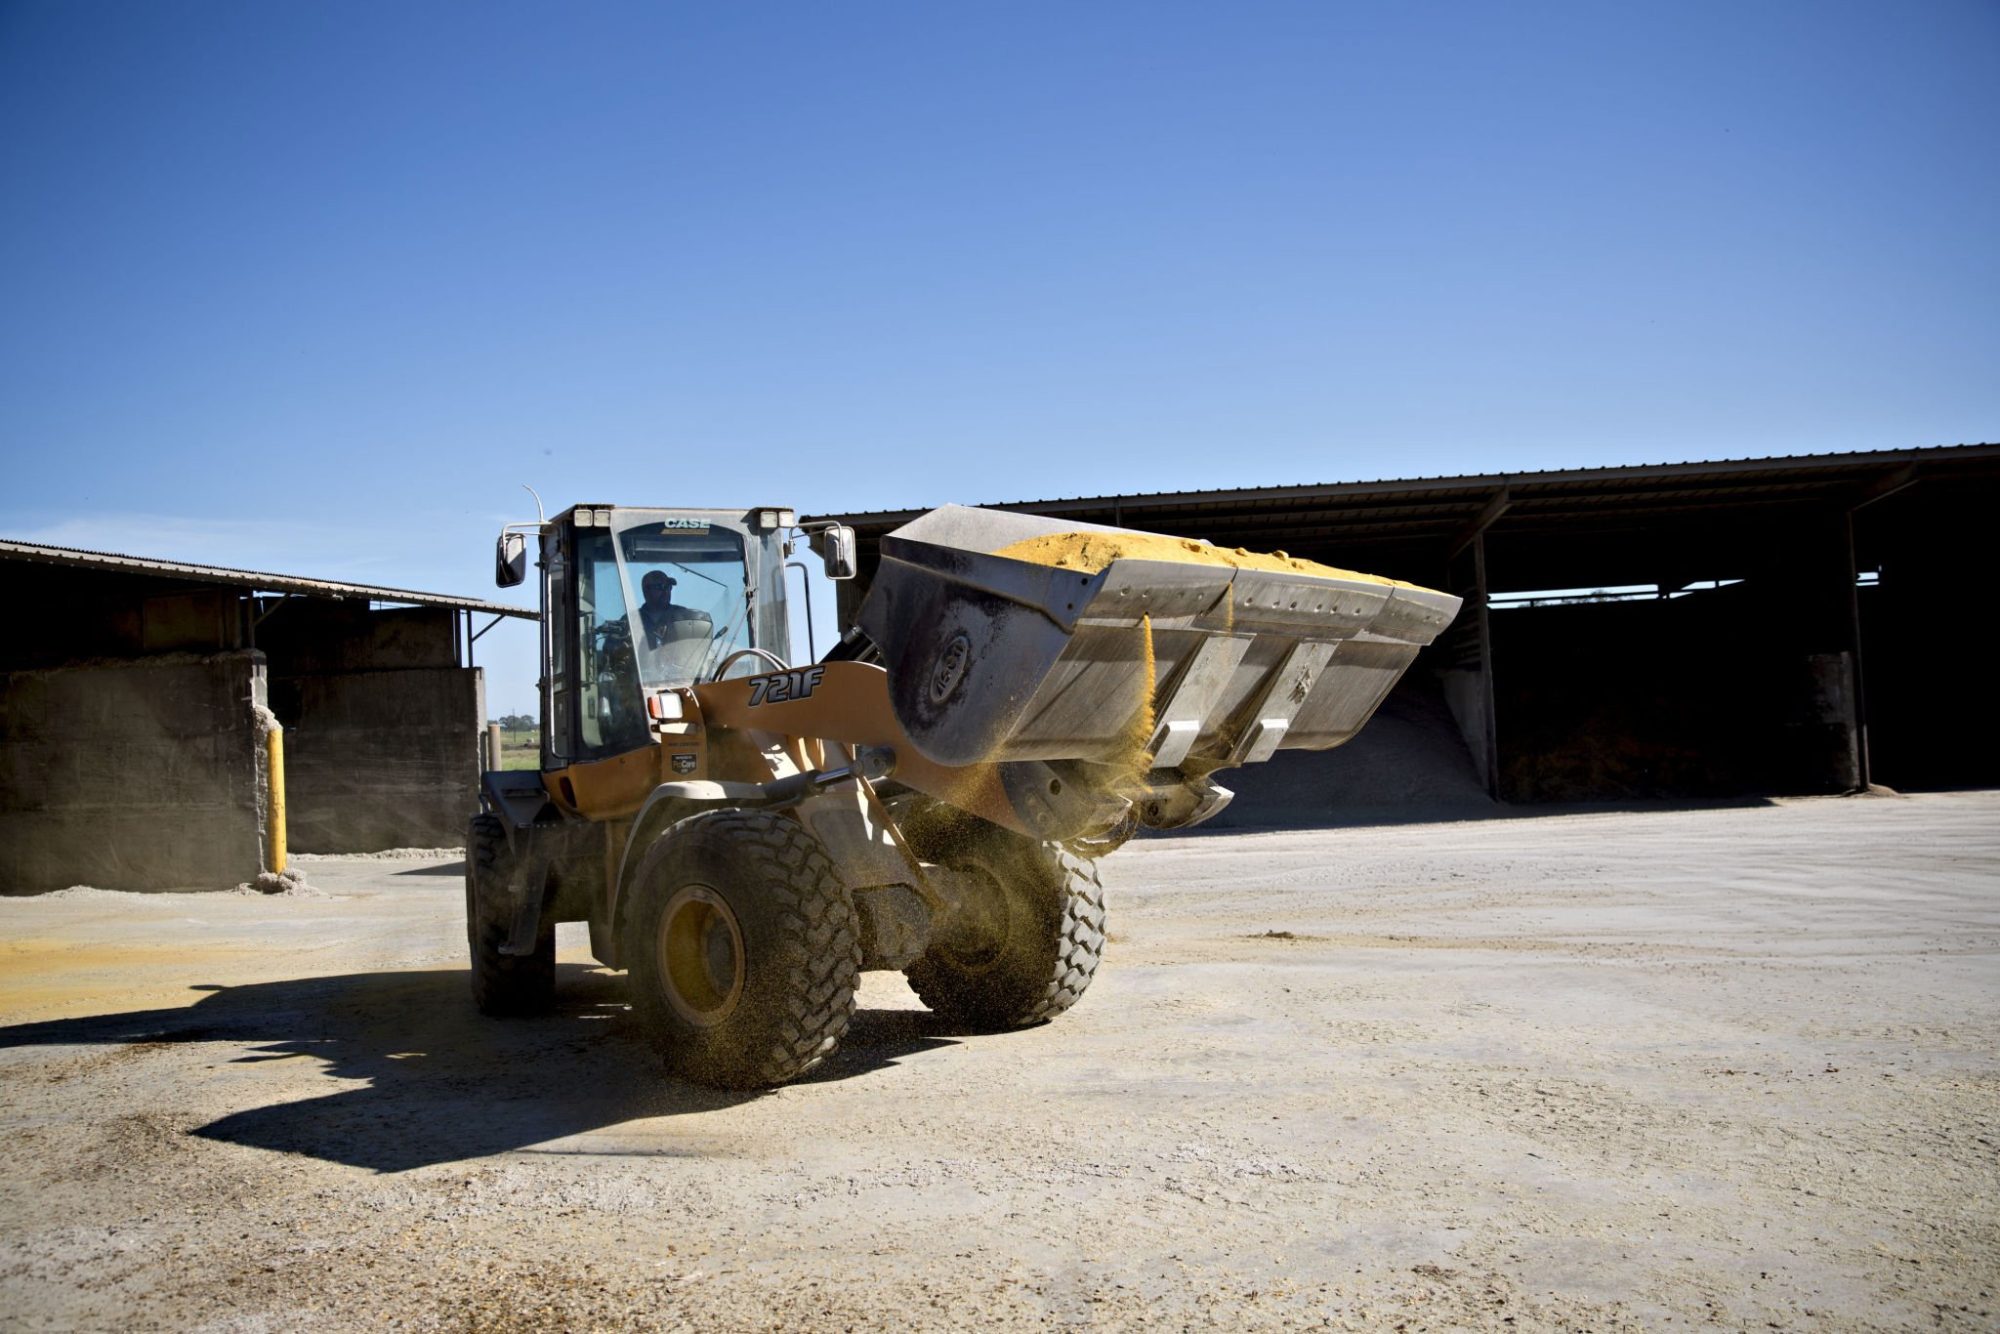
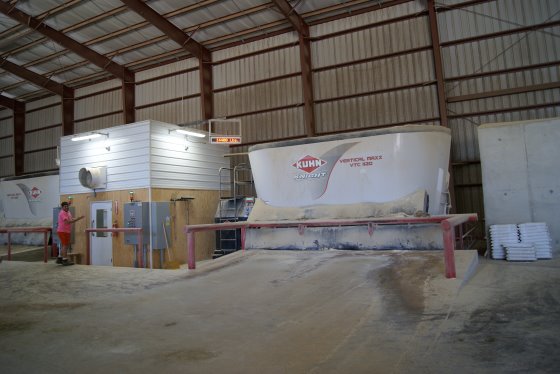
The feed center at a Southwest dairy wakes up before the sun. Loaders arc in and out of commodity bays. A mixer hums. A feeder jokes with the trucker while the first TMR drops into the bunk. On paper, this 8,500‑cow herd was doing everything right on feed.
Then they put a number on what was actually going into the mixer.
When the dairy installed an automated micro‑ingredient batching system built around MWI Animal Health’s Micro Ingredient Delivery System and Pro‑Control Plus Feed Batching platform, they didn’t change cows, facilities, or even the ration on paper. They just stopped guessing. Within weeks, they could point to $225.34 per day in feed savings and 54 minutes of batching time saved across 27 loads per day, based on their own cost structure and time studies. With the manager’s fully loaded labour and equipment rate of $500/hour, that 54 minutes of saved time was worth about $450/day on its own.
They hadn’t discovered a magic ingredient. They’d discovered how much their “good enough” program was actually costing them.
“We Thought We Were Tight”: When the Ledger Tells a Different Story
This Southwest dairy isn’t a shoestring outfit. It’s a big, modern operation with experienced people and plenty of steel. The manager genuinely believed the feed program was in good shape. The numbers seemed to back that up.
Then 2025 happened.
The USDA’s Dairy Margin Coverage index slid to $9.42/cwt in December 2025, triggering the first and only Tier I indemnity payment of the year — a total of $0.08/cwt. Illinois Farm Business Farm Management data, summarized by economist Bradley Zwilling, showed that while cash returns finally clawed their way back into the black in 2024 and were projected to stay barely positive in 2025, total economic costs were still above total returns on many herds.
That’s the kind of math that keeps managers awake at 2 a.m.
Feed has always been the big line item. Hutjens’ benchmarks put feed at about 60% of total costs on many Midwestern dairies. You can’t move the mailbox price or the DMC formula. You can move what you shovel into the mixer.
Like a lot of operations, the Southwest dairy’s first instinct was to “tighten up” feed. But before they started pulling ingredients, they decided to find out how much feed they were actually buying, batching, and feeding to cows. That decision turned out to be more important than any single tweak to the ration.
The Day They Stopped Guessing in the Feed Center
Before automation, micro‑ingredients at this dairy were classic “good enough.” The feeder was careful and experienced, but micro bins and totes were still handled by eye and habit. Scoop sizes and bucket loads varied a little from batch to batch. Over the course of 27 TMR loads a day, those “little” variations turned into real money.
With the MWI system in place, every micro-ingredient was delivered to the mixer via a controlled delivery line rather than a bucket. The Pro‑Control Plus batching platform logged target and actual weights, as well as time per batch. The manager suddenly had hard data instead of a gut feel.
It didn’t take long to see the pattern:
- Micro‑ingredients were routinely overshot “to be safe.”
- Loads weren’t identical; they were “close enough.”
- The crew was working hard, but the system made it hard for them to be precise.
Once the batching system took over micro‑delivery and locked in targets, the averaged numbers told the story:
- $225.34/day in feed cost reduction, with the same ration specs and milk targets.
- 54 minutes less batching time per day, across 27 loads.
- Less “hero work” and rushing in the feed center; more consistency from batch to batch.
For this Southwest dairy, that was the first big wake‑up: they didn’t have a ration problem. They had a delivery problem.
How Much Is “Good Enough” Feed Efficiency Costing You?
Zoom out from that one farm and look at the math the way Hutjens does in his feed‑cost talks.
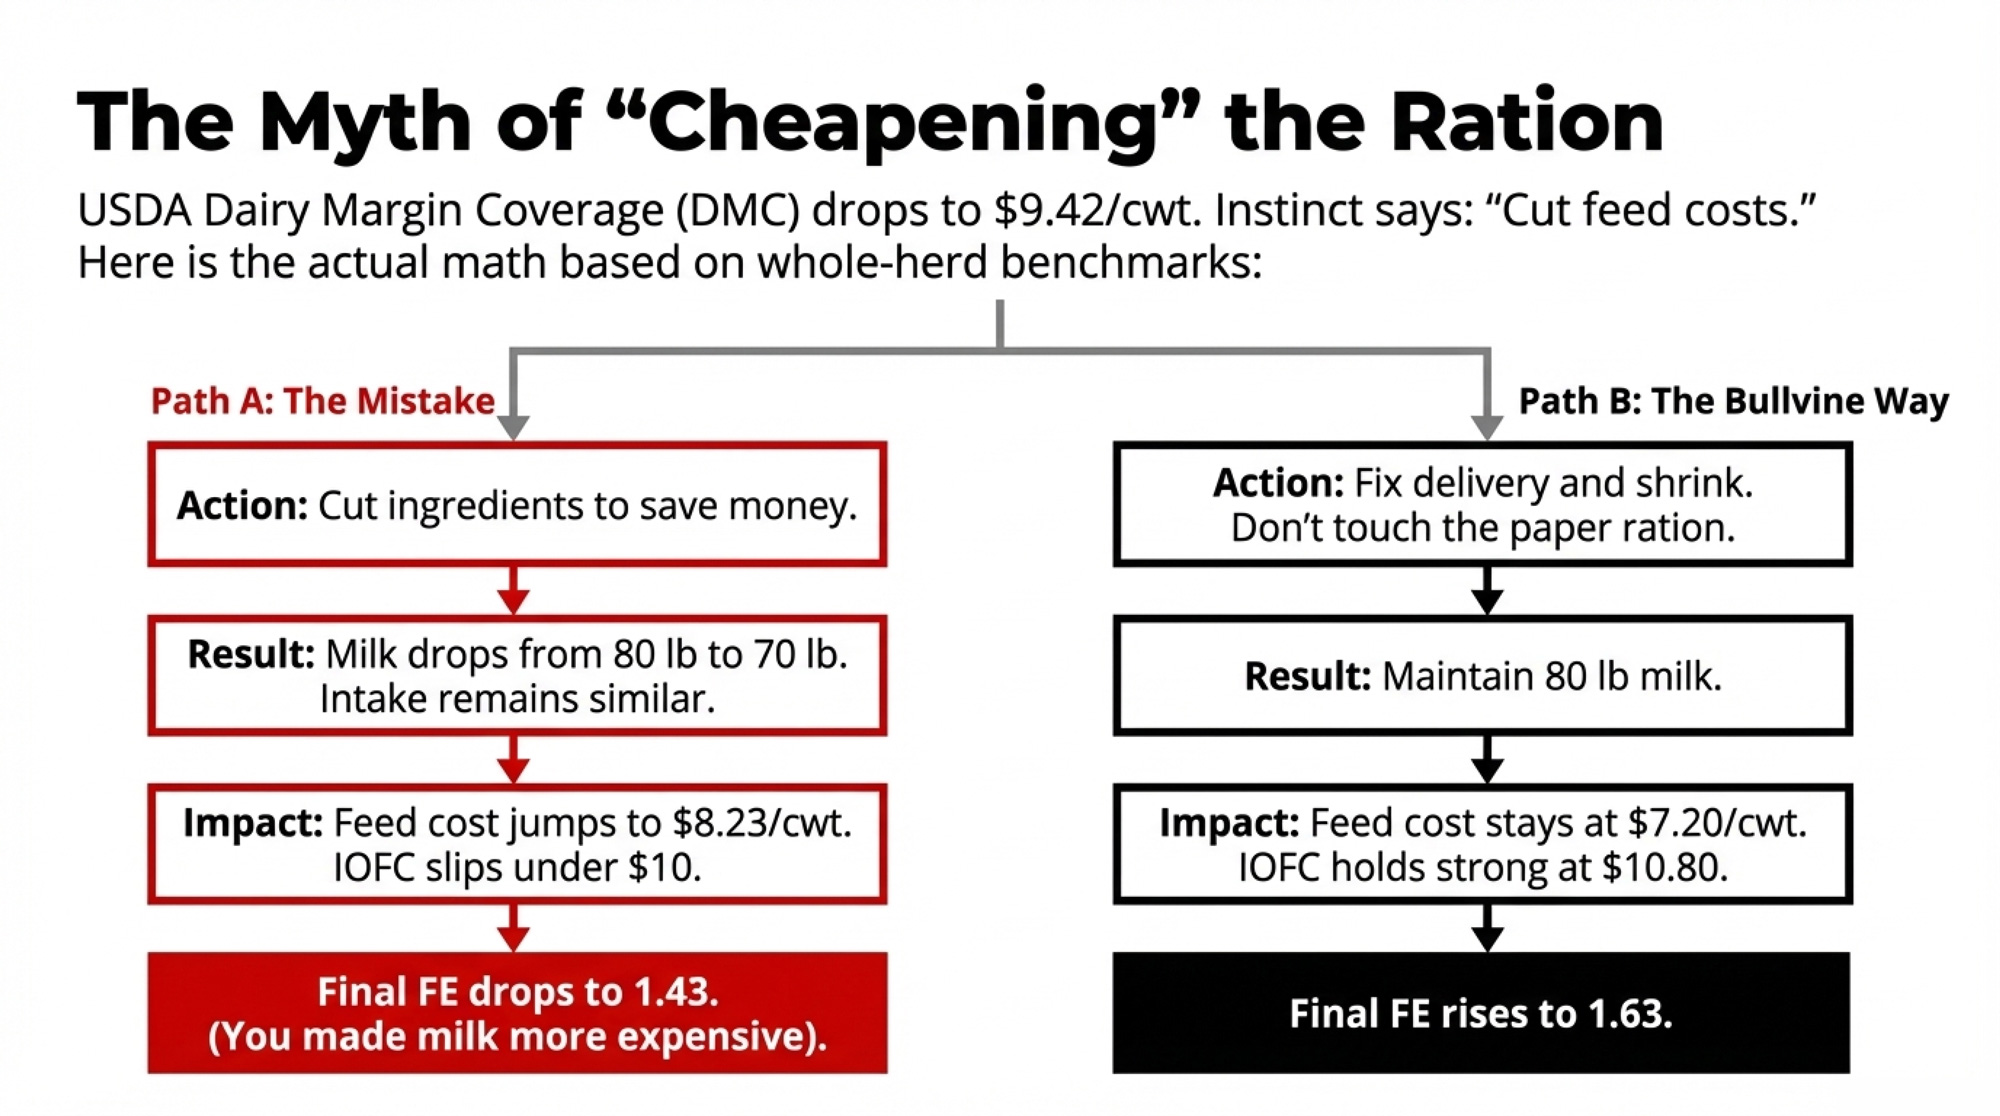
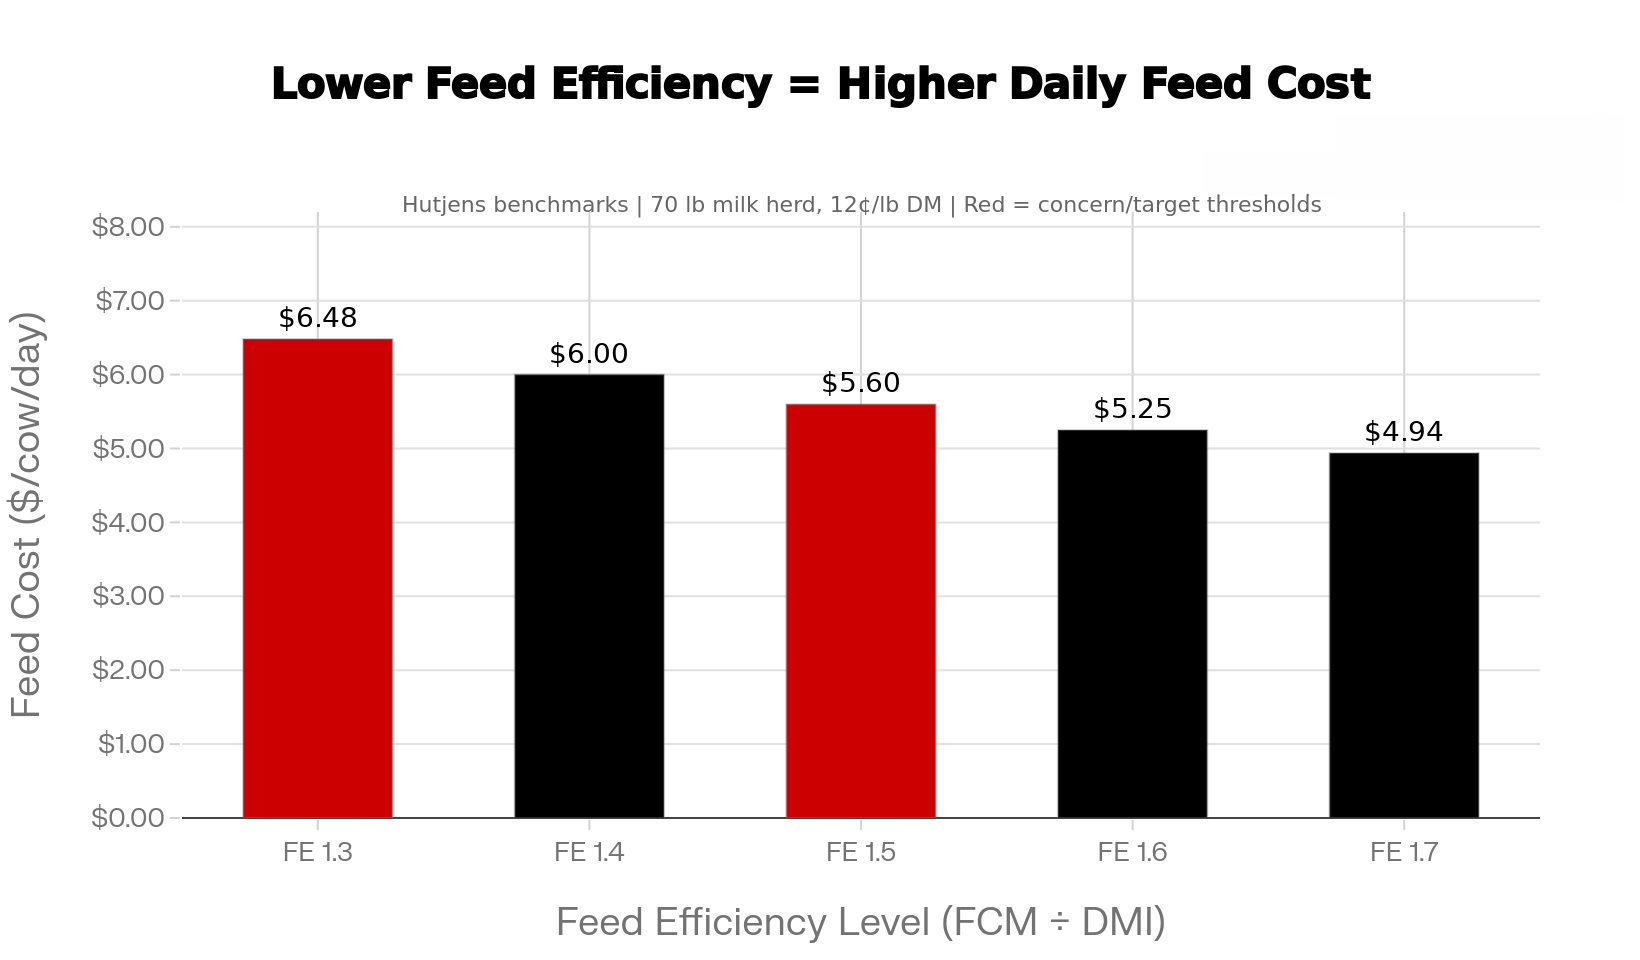
Take a mid‑range ration that costs $5.76/cow/day for a lactating Holstein in a Midwestern TMR system. That buys you about 49 lb of dry matter at an average ingredient cost of just under 12¢/lb DM. On a herd averaging 80 lb of milk, that works out to a feed cost of about $7.20/cwt and an income over feed cost (IOFC) around $10.80/cwt at an $18 milk price.
Now imagine your herd slides down to 70 lb of milk because you cut ingredients to save money — but you don’t actually reduce intake much. If feed cost stays at $5.76, your feed cost per hundredweight jumps to $8.23, IOFC slips under $10/cwt, and feed efficiency drops from 1.63 to 1.43.
You didn’t save the feed. You made each pound of milk more expensive.
| Milk Yield (lb/cow/day) | Feed Cost/Cow/Day | Feed Cost ($/cwt) | IOFC ($/cwt) | Feed Efficiency |
| 80 | $5.76 | $7.20 | $10.80 | 1.63 |
| 75 | $5.76 | $7.68 | $10.32 | 1.53 |
| 70 | $5.76 | $8.23 | $9.77 | 1.43 |
| 65 | $5.76 | $8.86 | $9.14 | 1.33 |
| 60 | $5.76 | $9.60 | $8.40 | 1.20 |
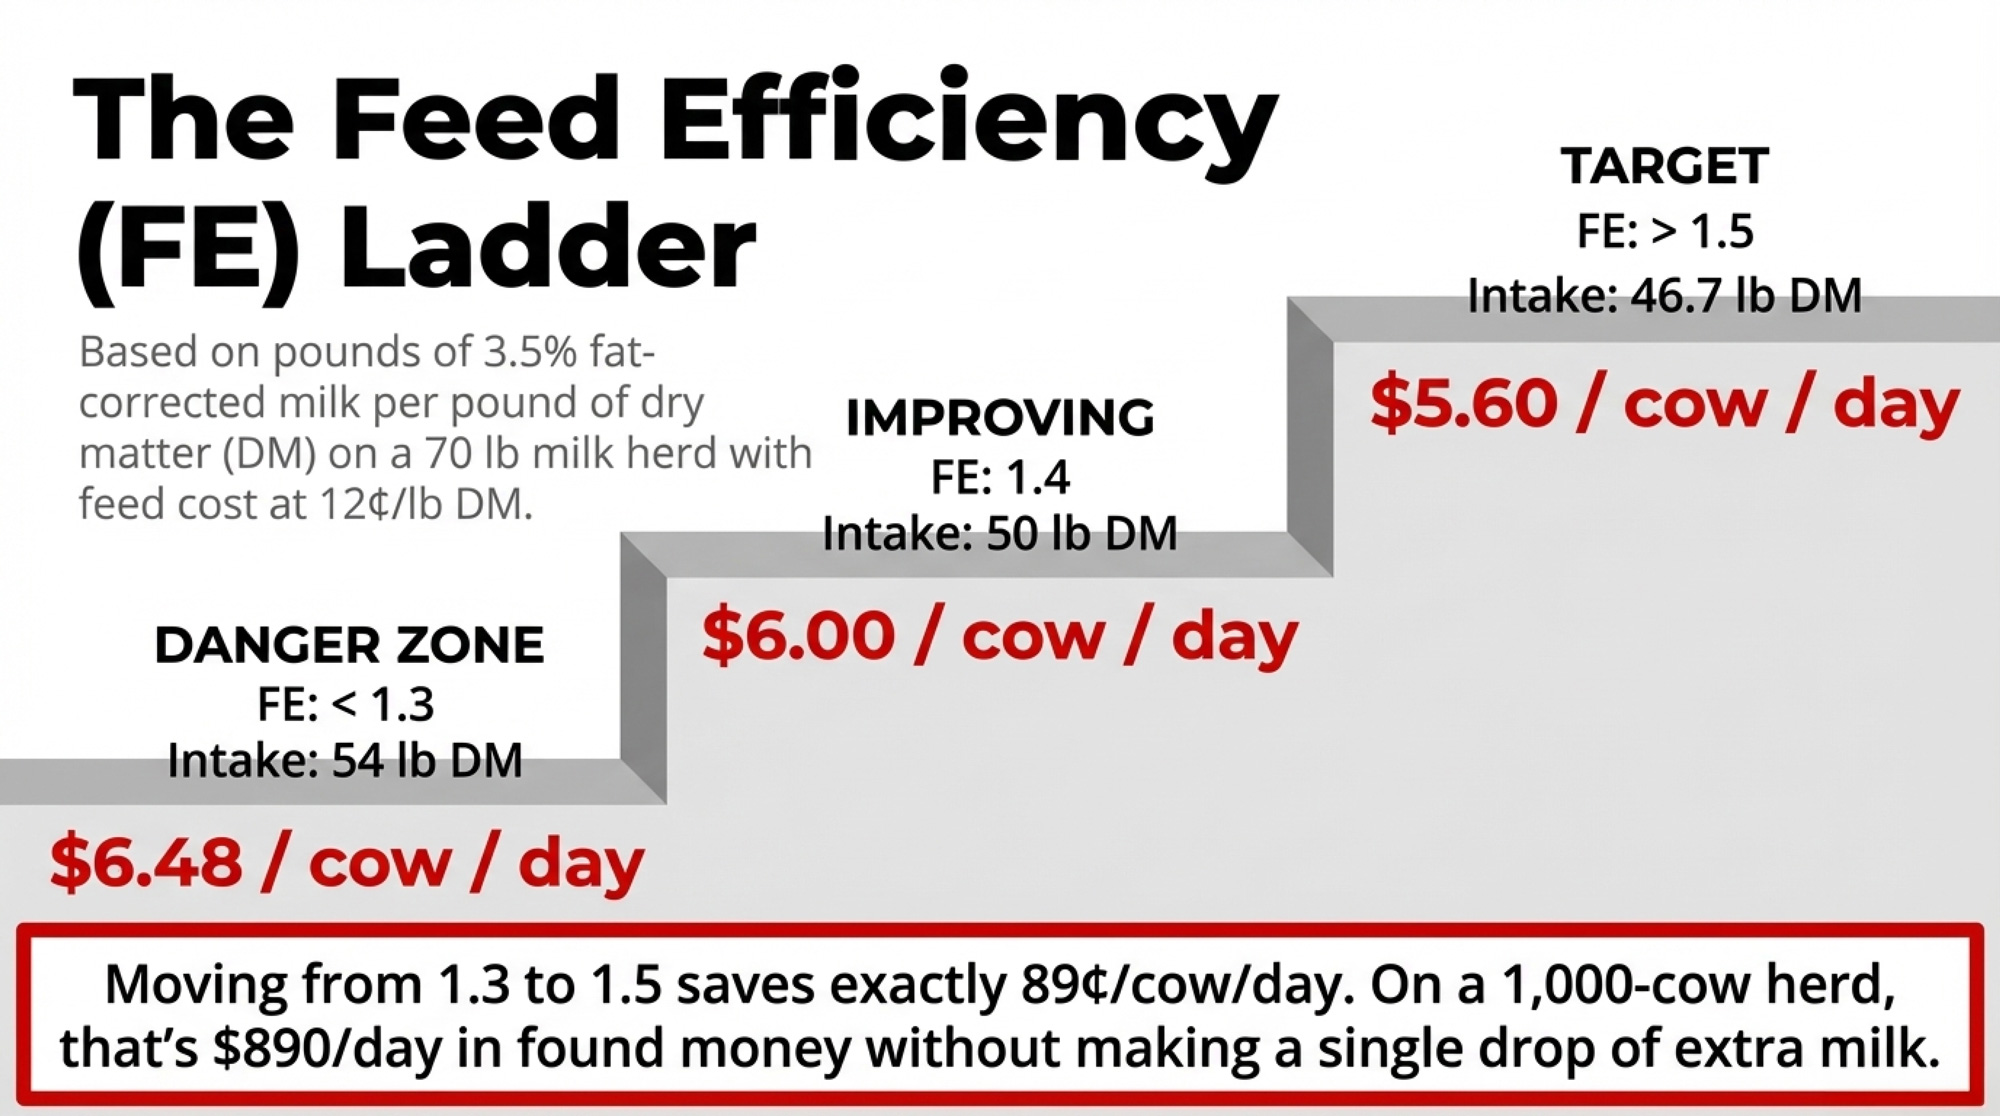
Feed efficiency — pounds of 3.5% fat‑corrected milk per pound of dry matter — gives you a quick, hard‑number check. Hutjens’ guidelines are simple:
- High group, mature cows: >1.7.
- One‑group TMR herds: >1.5.
- Whole herd: <1.3 is a concern value.
Now run the same 70‑lb herd through those FE numbers:
- At FE 1.3, cows need about 54 lb DM. Feed cost at 12¢/lb DM: $6.48/cow/day.
- At FE 1.4, cows need 50 lb DM. Feed cost: $6.00/cow/day.
- At FE 1.5, cows need about 46.7 lb DM. Feed cost: ≈$5.60/cow/day.
That’s roughly:
- 48¢/cow/day saved going from 1.3 to 1.4.
- 40¢/cow/day from 1.4 to 1.5.
- About 89¢/cow/day from 1.3 all the way up to 1.5 — with the same 70 lb of milk.
On a 250‑cow string, that’s around $222/day. On 1,000 cows, it’s close to $890/day. On 2,500 cows, you’re over $2,200/day.
You don’t need to be an 8,500‑cow operation to feel that.
Dutch dairy farmer and CRV consultant Niels Achten sees exactly that spread in Europe. Working with his own ~280‑cow herd and clients through consultancy firm Liba, he’s watched operations with similar genetics and facilities post very different feed efficiencies purely on management and cow comfort. “Many dairy farmers still have opportunities to increase the feed efficiency on their farms,” he says.
The uncomfortable truth: most of those opportunities aren’t in the nutrition program on paper. They’re in what actually lands in the bunk.
Where 6.5–8.5% of Your Feed Disappears Before Any Cow Sees It
The MWI case study put real numbers on batching losses. Progressive Dairy has done the same with shrink.
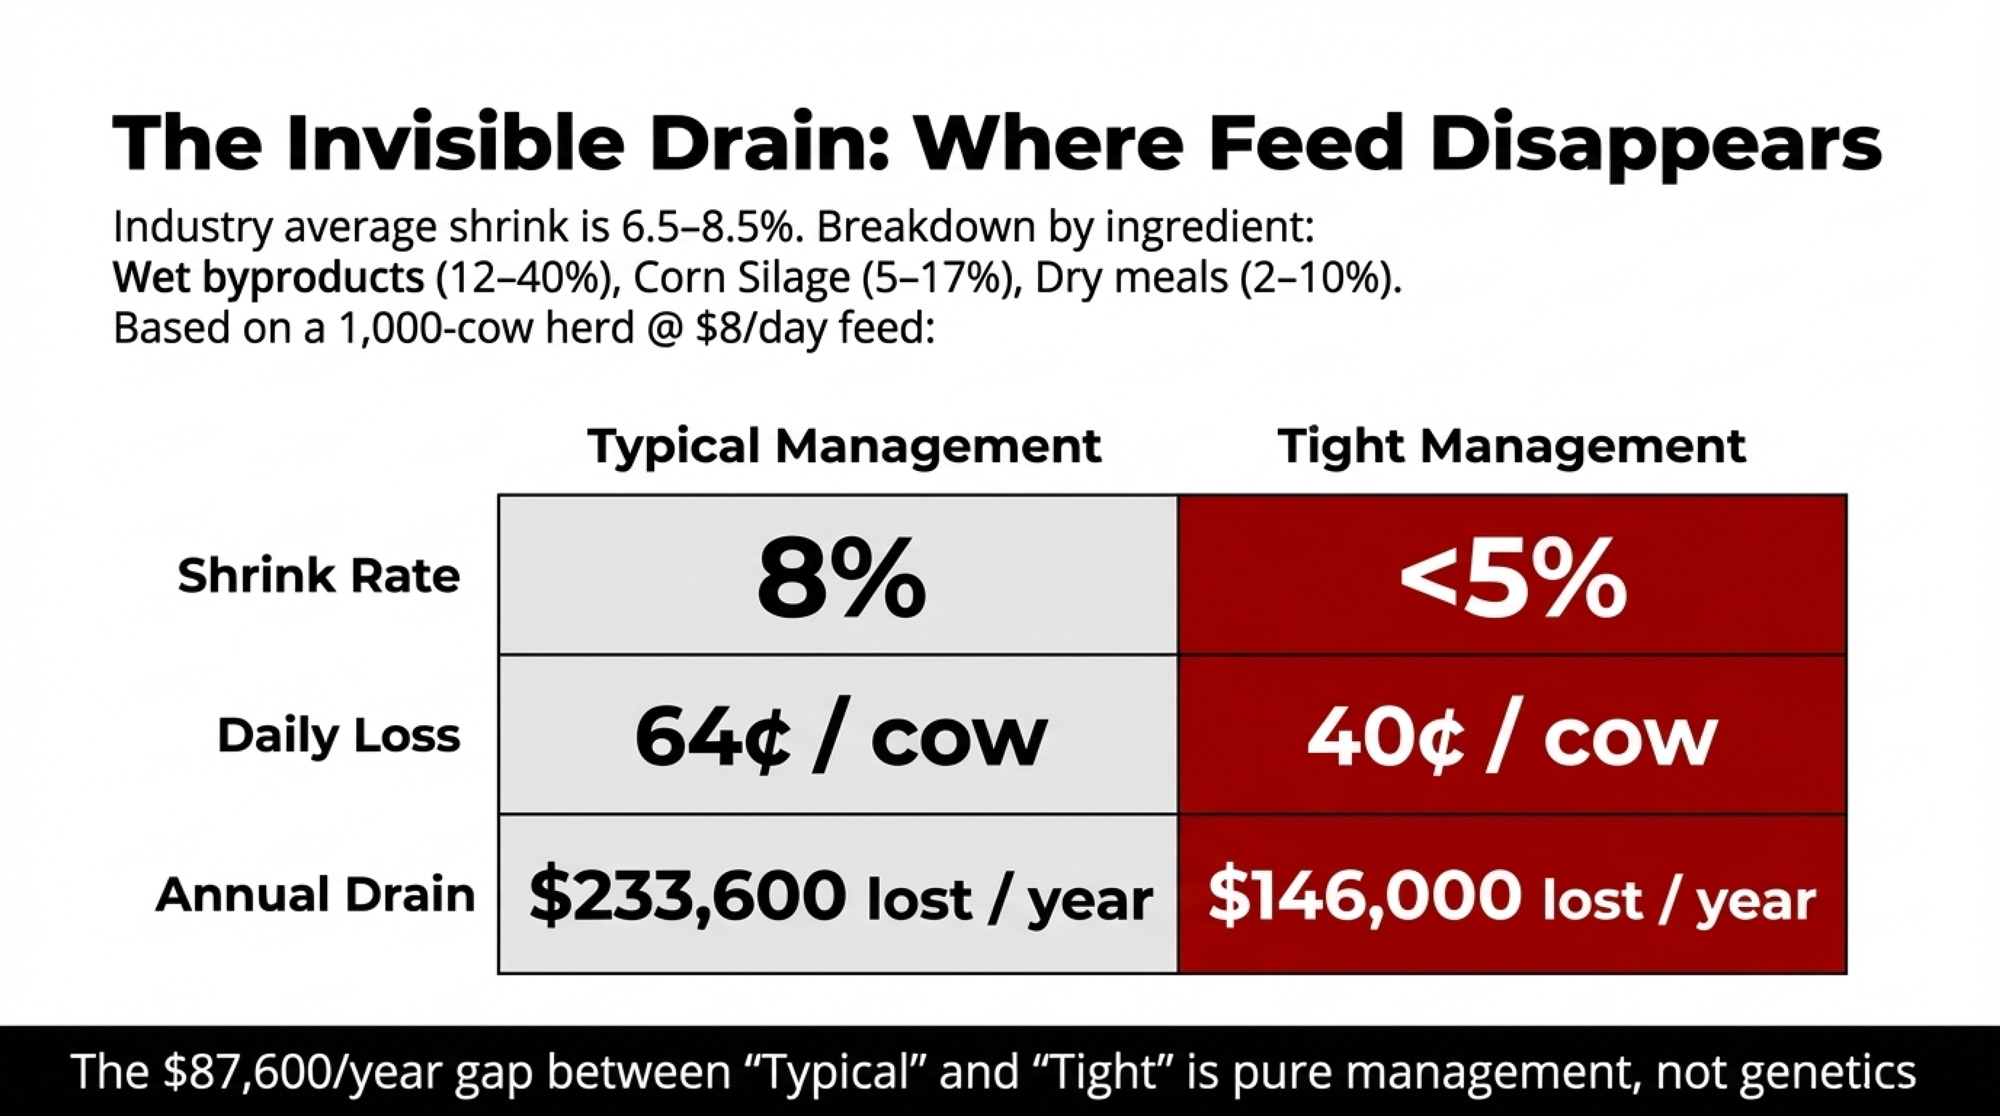
| Ingredient Category | Typical Shrink Range | High-Risk Threshold | Annual Loss on 1,000 Cows ($8/day) |
|---|---|---|---|
| Wet byproducts | 12–40% | >20% | $35,000–$116,800 |
| Corn silage | 5–17% | >10% | $14,600–$49,600 |
| Dry meals & minerals | 2–10% | >6% | $5,800–$29,200 |
| Hay/dry forages | 3–12% | >7% | $8,760–$35,040 |
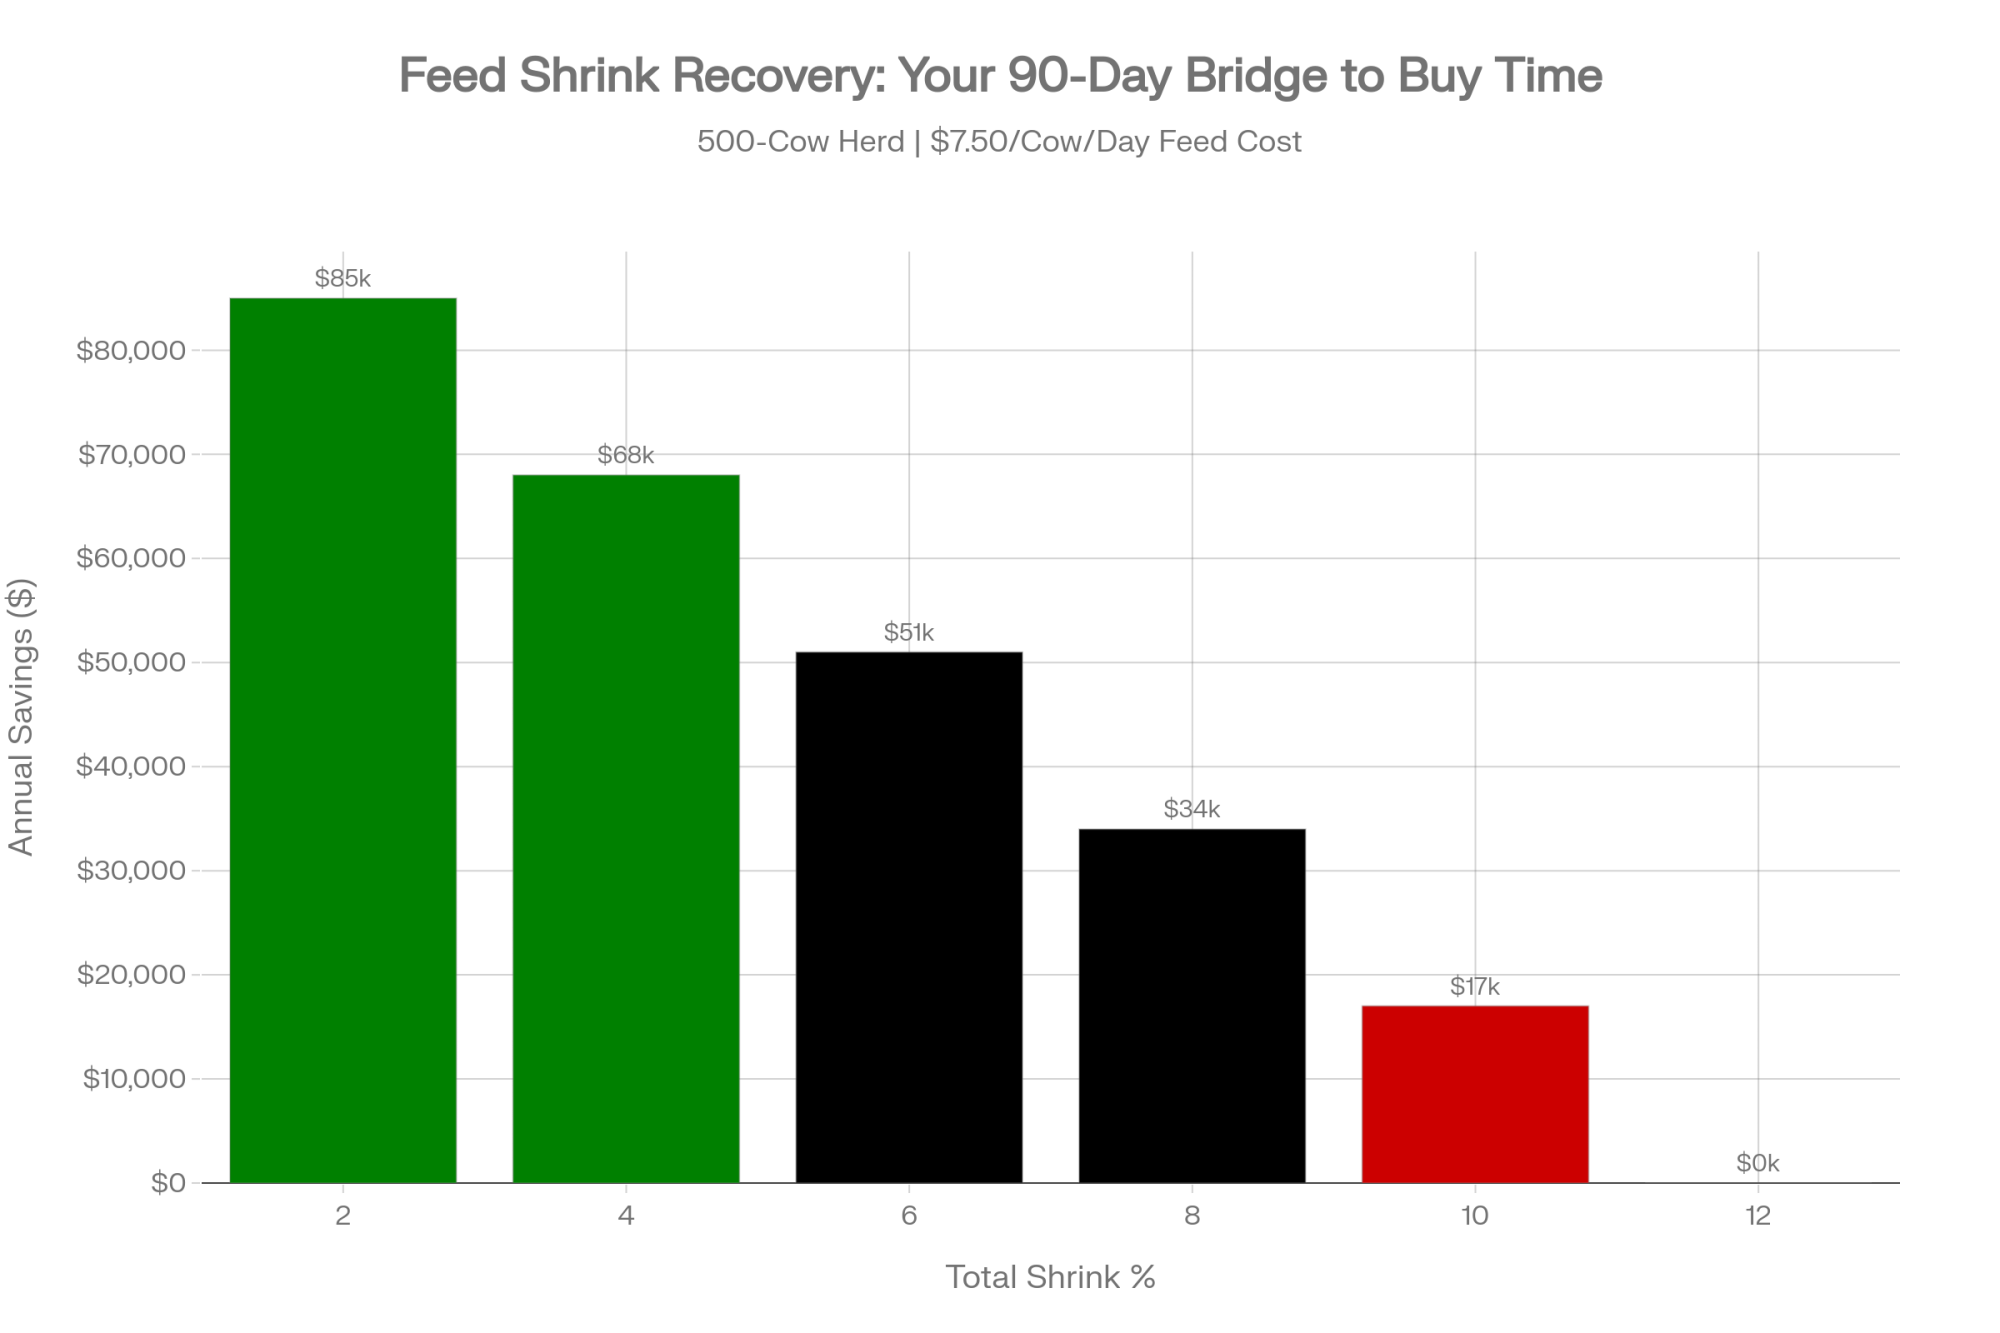
| Total feed (all classes) | 6.5–8.5% | >7% | $189,800–$248,200 |
In a 2022 article, they pulled together research and field data and landed on a typical 6.5–8.5% feed shrink across all ingredients at many North American dairies. The range by ingredient is sobering:
- Wet byproducts: 12–40%.
- Corn silage: 5–17%.
- Dry meals and minerals: 2–10%.
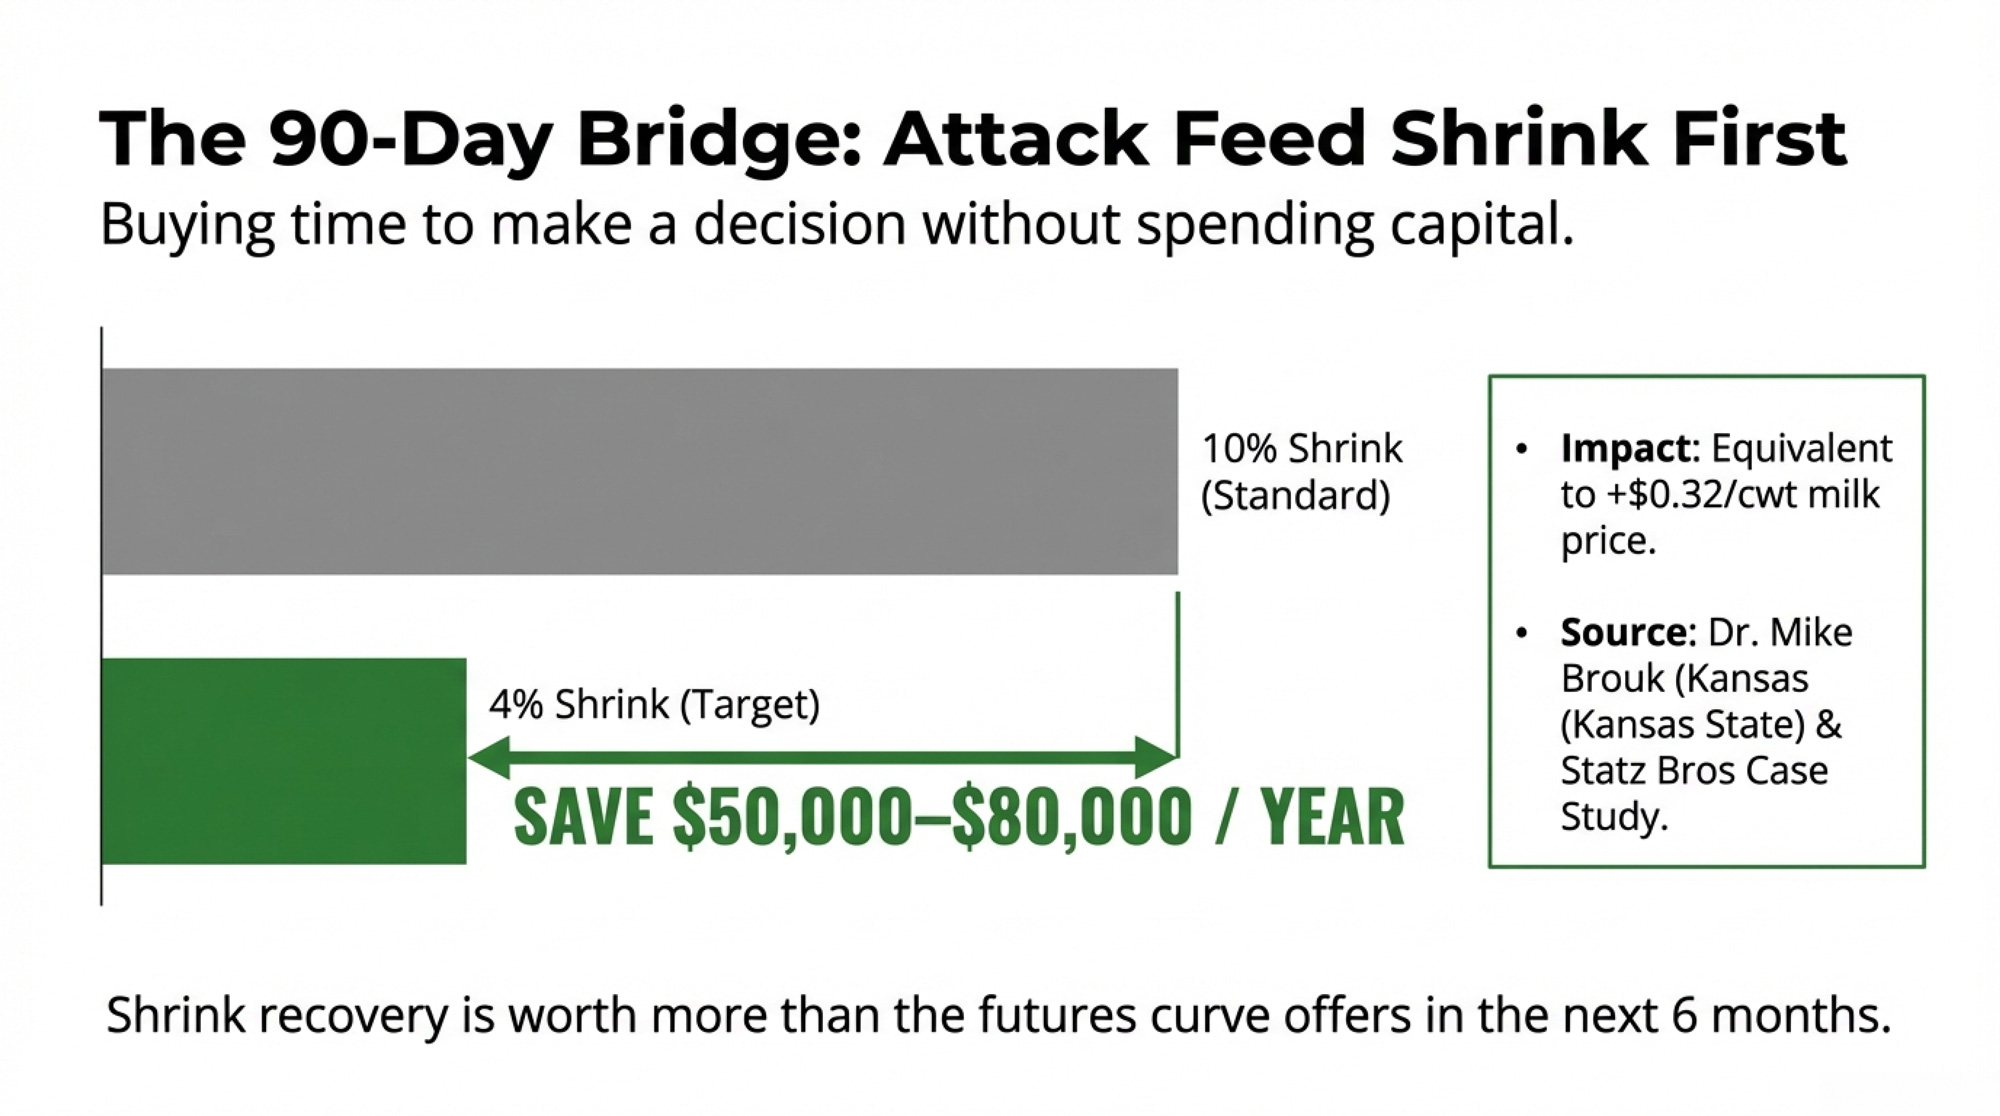
Their target: keep total shrink under 5%.
Now plug that into a herd that spends $8/cow/day on feed across all classes. At 8% shrink, you’re losing 64¢/cow/dayyou paid for but never fed. On a 1,000‑cow herd, that’s about $233,600/year that disappears in the feed center, bunker, and bunk.
At 5%, you’re still losing money, but the annual cost drops to roughly $146,000. That’s an $87,600/year gap between “pretty typical” and “tight.”
The Southwest dairy didn’t fix shrinkage everywhere overnight. But by tightening batching and making ingredients hit the mixer consistently, they plugged one of the worst leaks first — the part they could measure fastest.
And that’s a key pattern. You don’t have to solve everything at once. You have to pick the spots where you can actually see what’s going on.
How Forage Quality Quietly Turns Into Milk Cheques
Feed efficiency and shrink live in the feed center. Forage quality lives in your fields and bunkers — but it shows up in the same ledger.
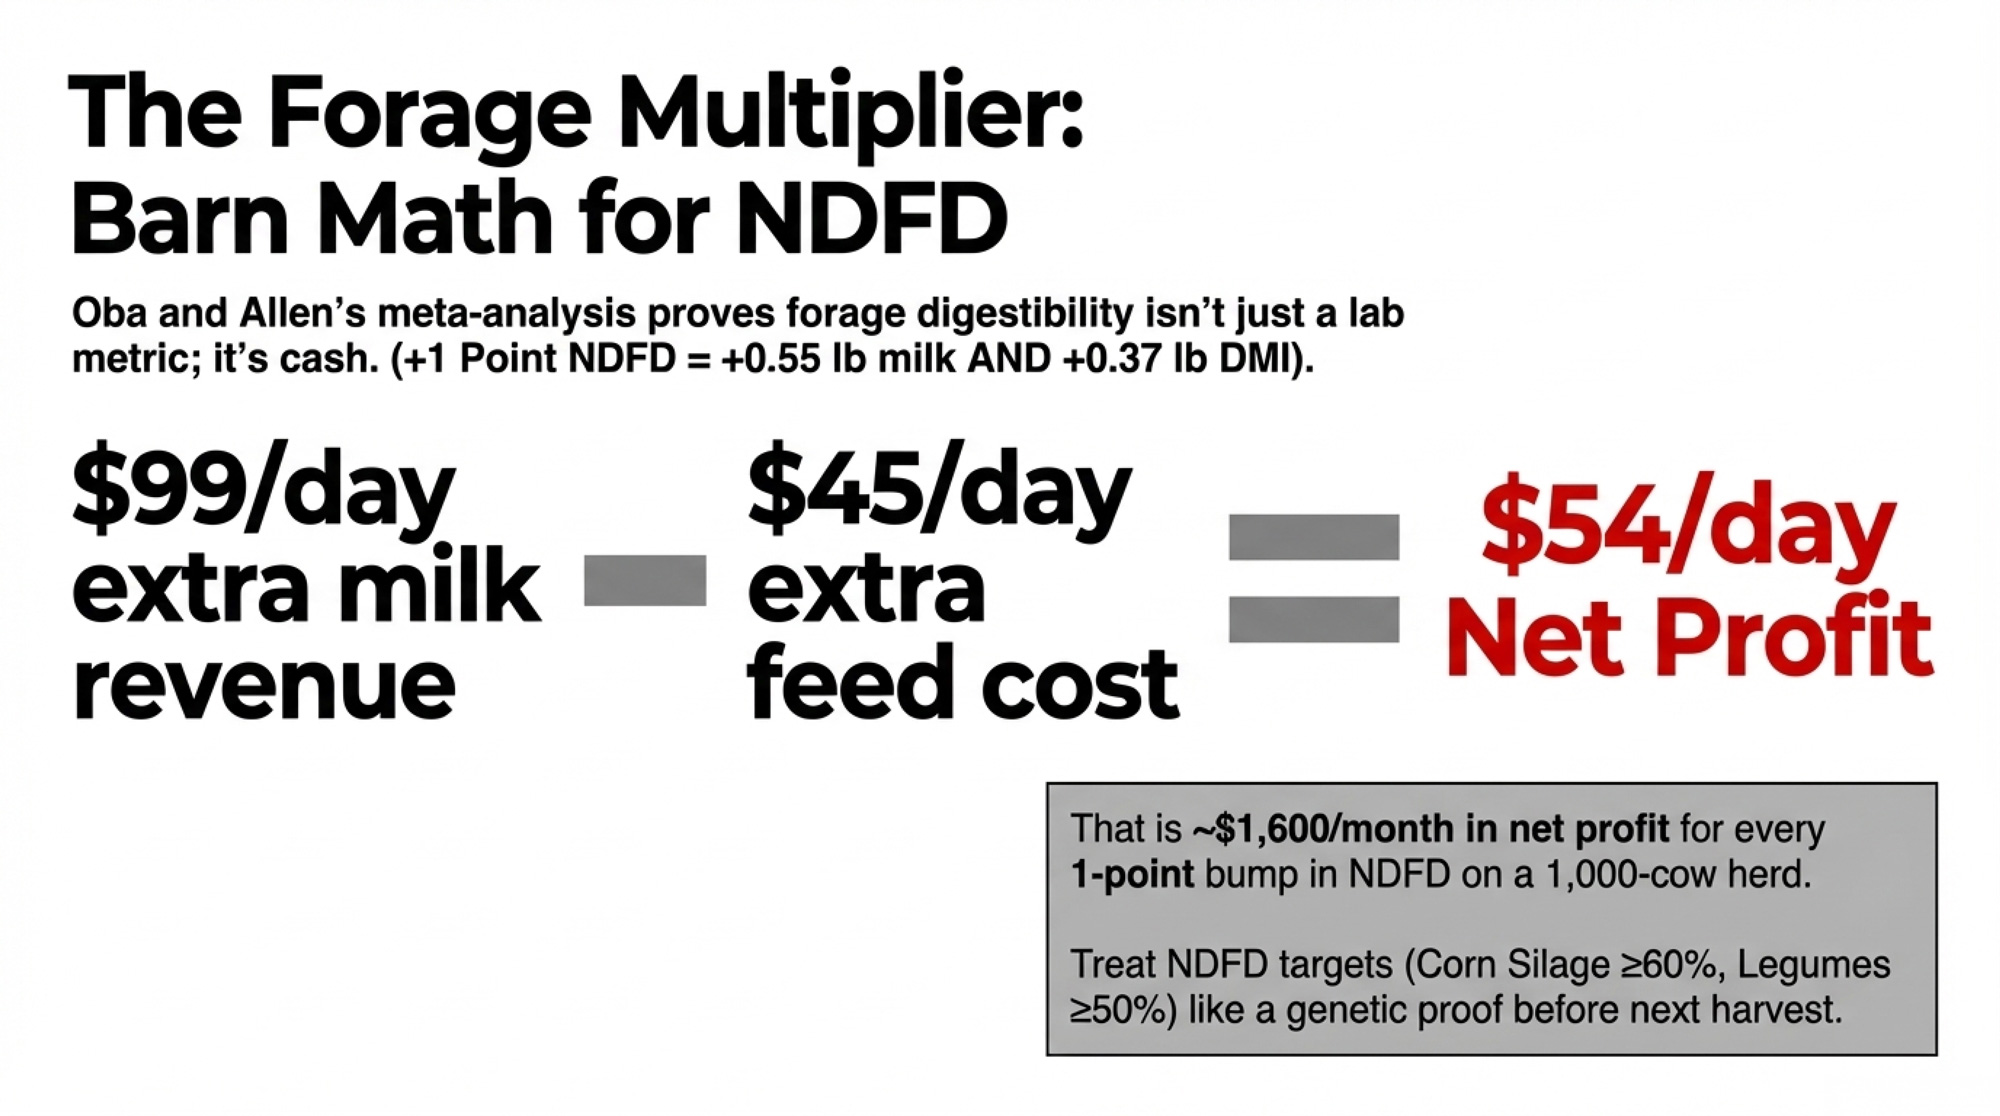
Oba and Allen’s 1999 meta‑analysis in the Journal of Dairy Science is still the go‑to reference on NDF digestibility:
- For every 1‑point increase in NDFD, dry matter intake goes up about 0.17 kg/day, and 4% fat‑corrected milk goes up about 0.25 kg/day.
On a 1,000‑cow herd, that 0.25 kg (about 0.55 lb) of extra FCM per cow is roughly 5.5 cwt/day. At an $18/cwt milk price, that’s about $99/day of extra milk revenue.
Those cows will eat a bit more to get there, around 0.17 kg (0.37 lb) of extra DM per cow per day. At 12¢/lb DM, that’s roughly $45/day more feed across the herd.
Net result: a 1‑point NDFD bump is worth about $54/day, or roughly $1,600/month, on that 1,000‑cow herd after you pay for the extra feed.
Hutjens and the 2021 NASEM dairy update both push toward the same practical targets:
- 30‑hour NDFD:
- Legumes and cool‑season grasses: ≥50%.
- Corn silage: ≥60%.
- Low‑lignin corn silage hybrids: ≥65%.
- uNDF240:
- Around 5.0–5.3 lb/day of forage uNDF for a 1,400‑lb Holstein — enough to keep the rumen working without choking intake.
Lab summaries from places like Dairyland Labs show a wide spread. Many alfalfa samples peak at around 45% NDFD— shy of the 50% mark. Corn silage, especially low‑lignin hybrids harvested right and stored tight, often sits in the 60–70% NDFD range. Small-grain and grass silages can be anywhere from corn‑like to straw‑like.
Two bunkers can both say “NDF 40%.” If one is 45% NDFD and the other is 60%, those aren’t the same feed at all.
For a herd like the Southwest dairy, that’s the difference between a ration that looks okay on paper and a feed program that actually hits the milk tank the way the nutritionist expects.
The Feed Bunk: Where You Can See If It’s Working
Hutjens calls feed bunk management one of the places producers have the most control — and the least patience.
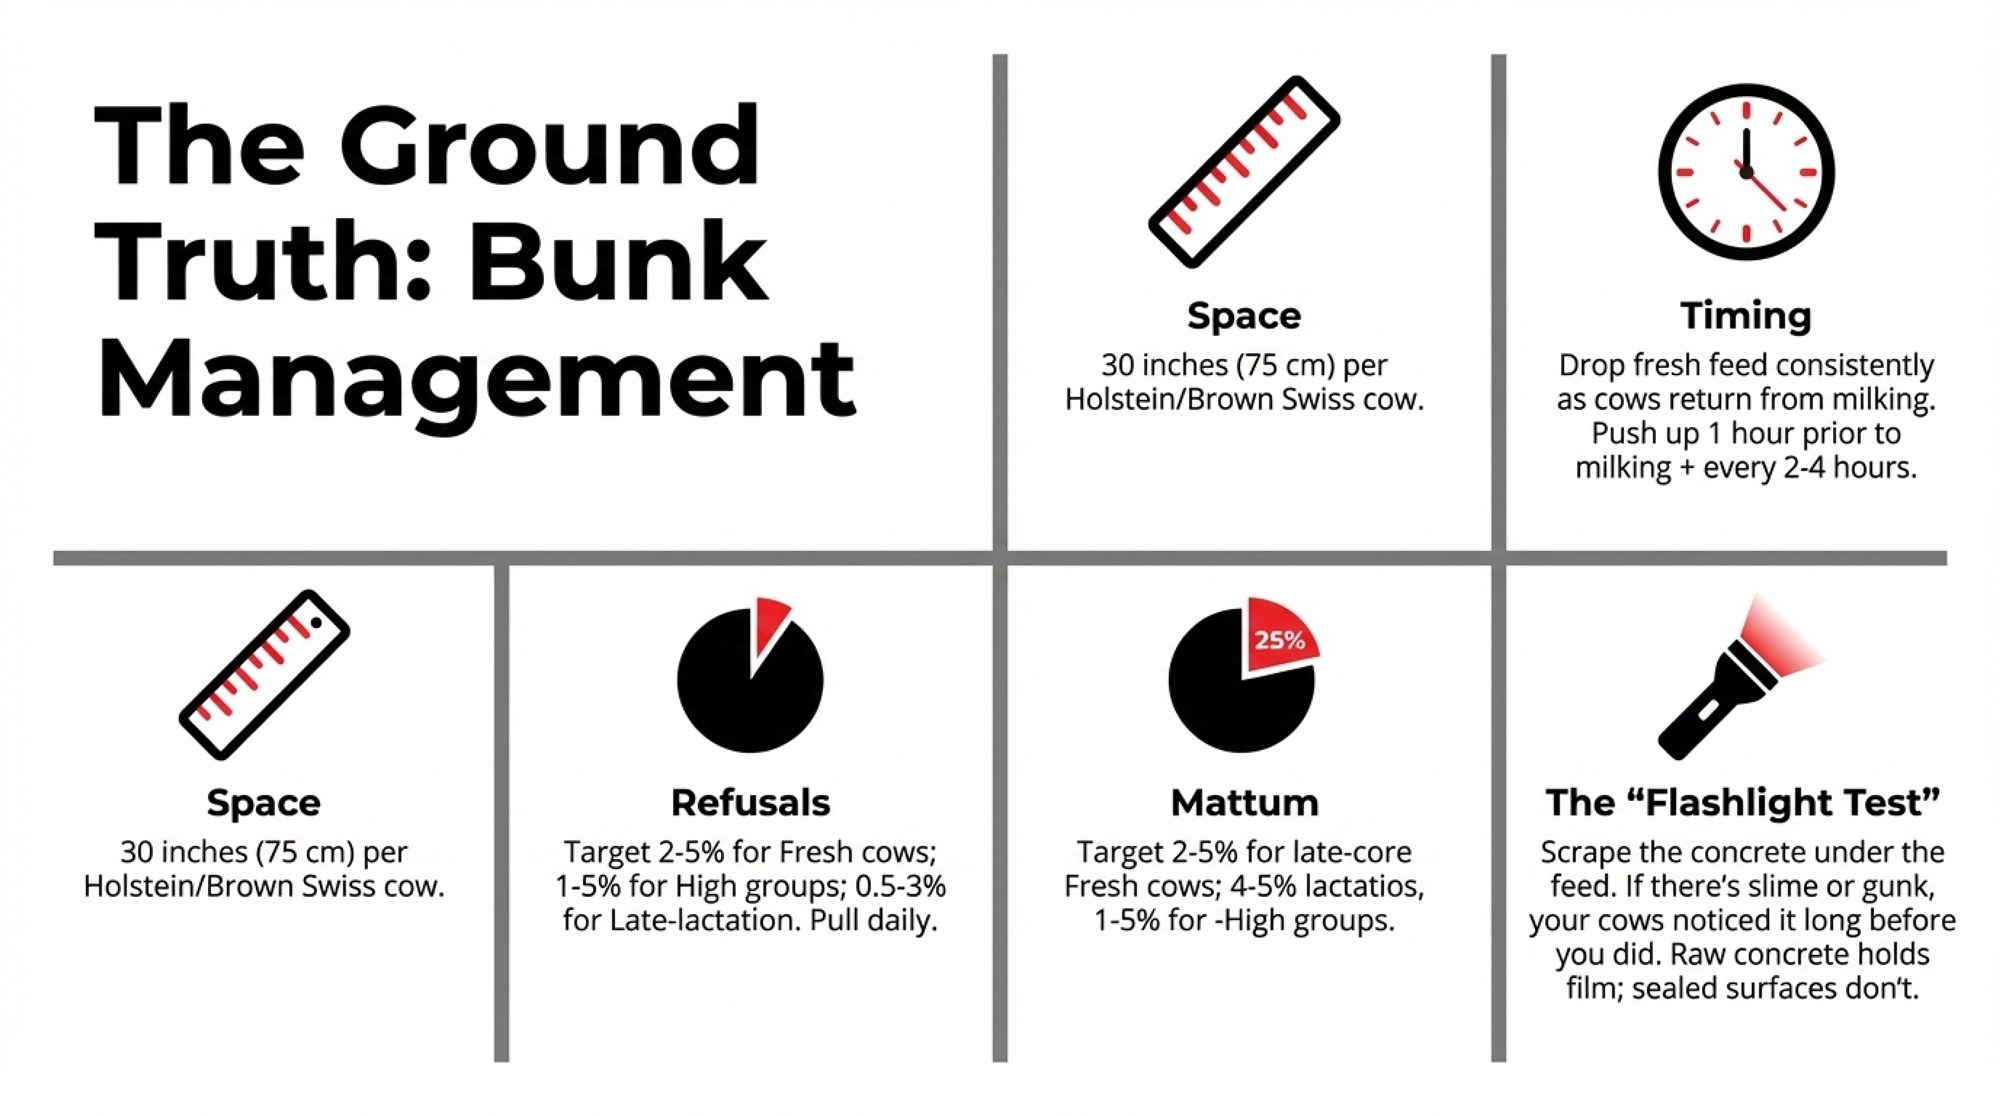
The guidelines aren’t complicated:
- Bunk space: About 75 cm (30 inches) per Holstein or Brown Swiss cow.
- Refusals:
- Fresh cows: 2–5%.
- High groups: 1–5%, depending on sorting.
- Late‑lactation: 0.5–3%.
- Timing:
- Drop fresh feed at a consistent time, ideally as cows return from milking.
- Push up roughly an hour before milking and every 2–4 hours after, depending on cow behavior.
- Clean‑up:
- Pull refusals at least daily; more often if you can.
On the Southwest dairy, the new batching system made it obvious when feed was late or uneven. Overhead cameras made it even more obvious. Pictures of bunks taken at regular intervals showed:
- Red zones with little or no feed where cows were standing.
- Times when the feed was supposed to be delivered but wasn’t.
- Spots where cows sorted hard, leaving long particles and rejected bits.
On a 60‑cow freestall, you might not need cameras. A flashlight and your nose work fine.
A simple test: scrape your fingers along the concrete under where the feed sits. If you come up with gunk, slime, or something that makes you wince, your cows noticed it long before you did. Sealed surfaces, epoxy, or tile clean out better than raw concrete and don’t hold that film.
The Southwest dairy team didn’t love what they saw in the first week of bunk photos. But once they could see it, they could fix it — morning feed times, push‑up schedules, bunk‑cleaning routines. None of that required a new wagon. It required a new level of stubbornness.
“We Didn’t Change the Cows. We Changed Our Expectations.”
Feed additives, DCAD, precision grouping — all of that matters. But on a lot of farms, those tools get thrown at problems that start in the feed center and bunk.
Hutjens’ own “needs list” of additives for high‑producing herds is respectably short:
- Rumen buffers.
- Yeast cultures or yeast‑based products.
- Monensin (where legal).
- Proven silage inoculants.
- Biotin.
- Organic trace minerals.
- Rumen‑protected choline and anionic salts for close‑up and fresh cows.
The Southwest dairy already had a lot of those boxes ticked. What they didn’t have was the discipline to demand a certain level of feed efficiency and shrink — and the tools to see where they were falling short.
That’s the line their manager kept coming back to after they saw the first month of data.
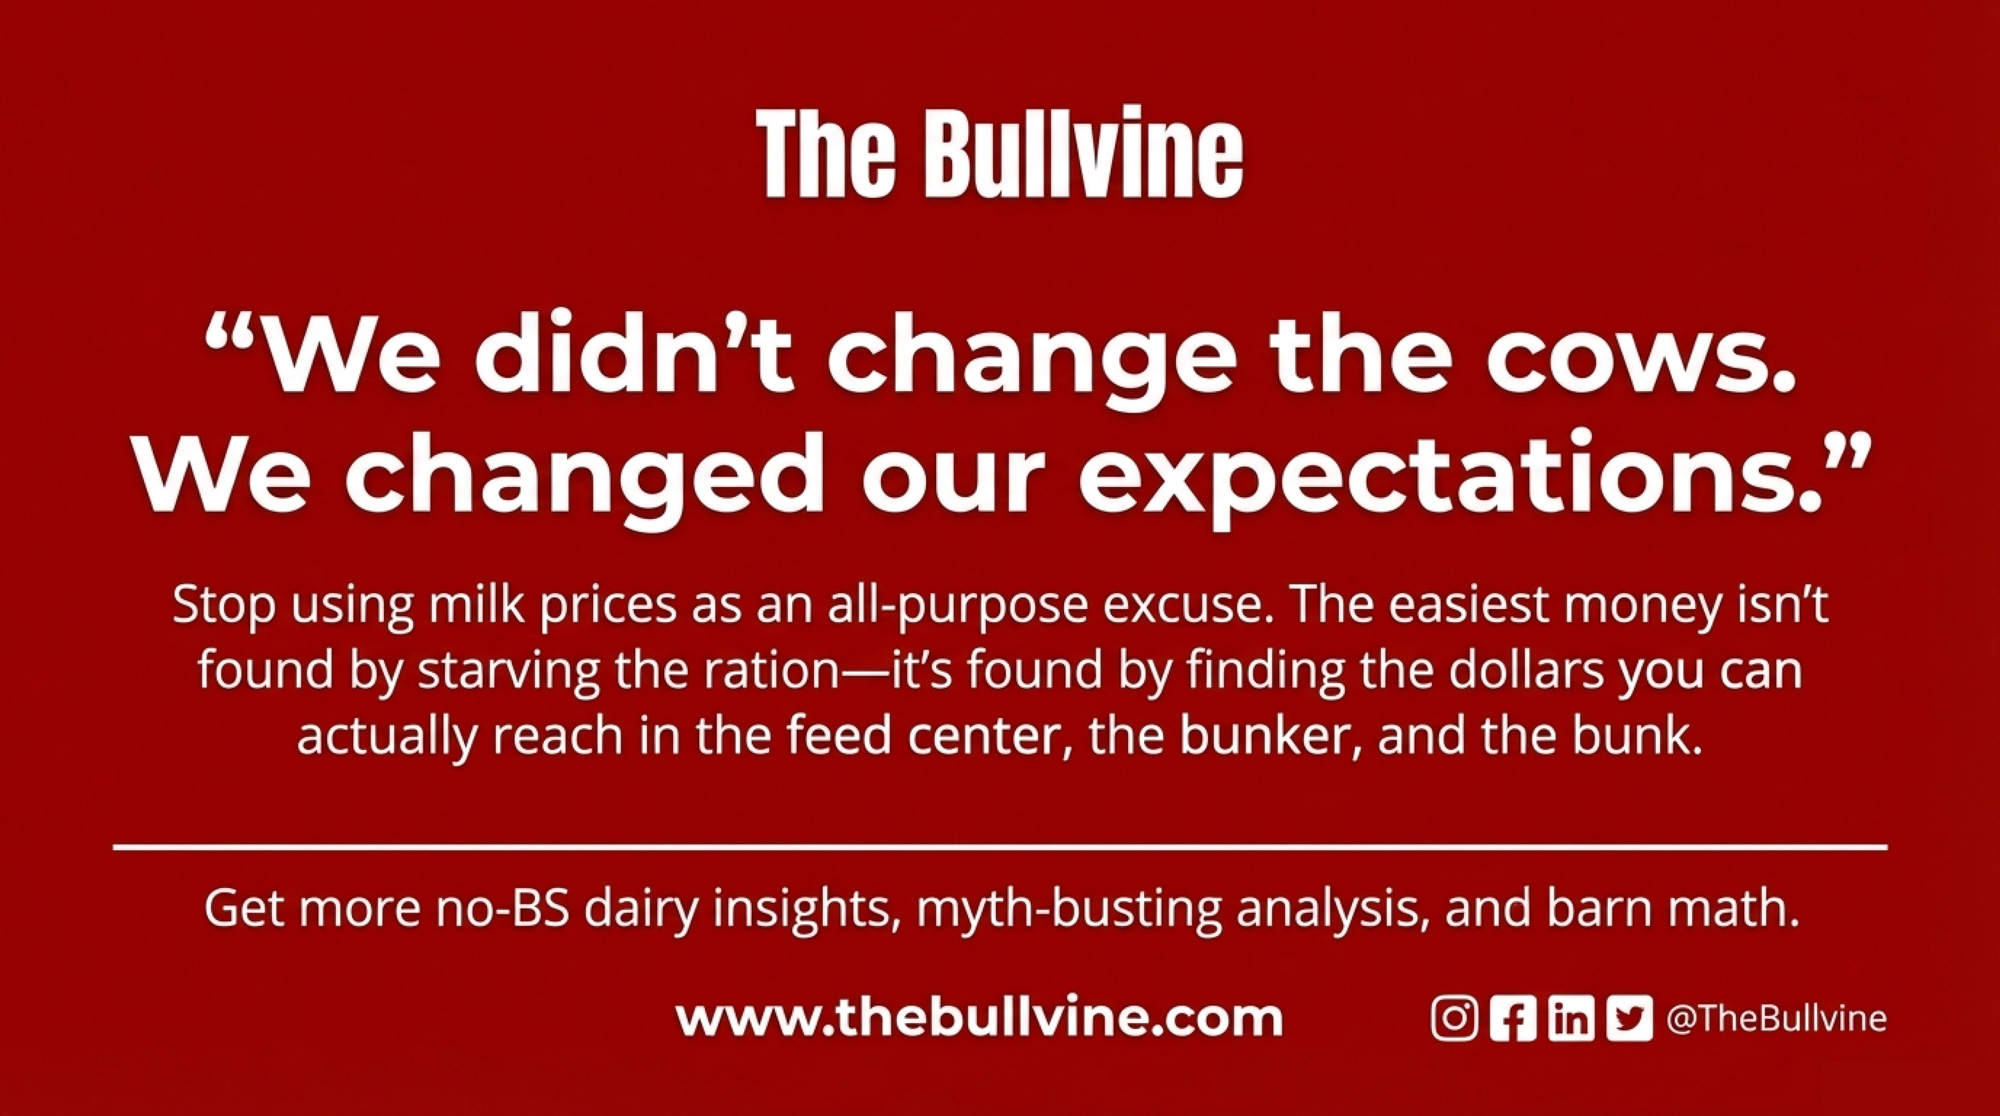
“We didn’t change the cows. We changed our expectations.”
They stopped accepting “good enough” for batching and bunks. They started writing down their own feed efficiency, shrink, and IOFC numbers. They stopped using milk price as an all‑purpose excuse and started looking for dollars they could actually reach.
That’s the part any operation reading this can copy — with or without an automated batching system.
What This Means for Your Operation
You don’t need 8,500 cows or a brand‑new micro‑ingredient setup to get the same kind of reality check. You need to stop guessing and write down a few numbers.
1. In the next 7 days, get your shrink out of the dark.
Pick three consecutive days. For each ingredient, record what should go into the mixer and what actually goes in. Track spoiled feed, wind losses, and what piles up in corners. If your total shrink comes in above 6–7%, that’s not “normal.” It’s a big, fixable cost center.
2. Within 30 days, write down four numbers.
- Feed cost per pound of dry matter.
- Feed cost per hundredweight of milk.
- Whole‑herd feed efficiency (3.5% FCM ÷ DMI).
- Best estimate of total feed shrink.
If you can’t put all four numbers on a single sheet of paper for your own herd, you’re flying blind.
3. Within 30 days, sit down with your nutritionist and price ingredients by nutrient, not habit.
Use a tool like Ohio State’s SESAME or your own spreadsheets to rank feeds by cost per unit of energy and protein at today’s prices. Corn silage, decent byproducts, and good forages often pencil out better than they look at first glance. Some “cheap” ingredients don’t.
4. Before your next harvest, treat NDFD like you would a proof.
Pull last year’s forage analyses. If your corn silage NDFD is stuck under 55% or your alfalfa under 50%, talk now about hybrid choice, planting decisions, and cutting stage. A 1‑point NDFD bump is worth roughly $1,600/month on a 1,000‑cow herd after extra feed is paid for. That’s as real as any proof change.
5. Any time you feel tempted to cut the ration, force yourself to run the 80‑lb vs 70‑lb math.
On a scratch pad, calculate feed cost per cwt and IOFC at both levels. If cutting ingredients pushes your feed cost per cwt up and IOFC down, your “savings” are just another shrink line — this time in the milk tank.
Key Takeaways
- If your whole‑herd feed efficiency is under 1.3 for more than a month, treat it as a breakdown signal, not a ration‑cutting excuse. First, fix shrink, forage quality, and bunk behavior.
- If you’ve never actually measured shrink by ingredient, your easiest money probably isn’t in the ration — it’s in the feed center and bunk. A three‑day audit will show you whether you’re closer to 5% or 8.5% shrink. The difference between those two is too big to ignore.
- If your first response to a bad DMC margin is to cheapen feed, you’re probably deepening the hole instead of climbing out. The Southwest dairy only started winning when they stopped trying to save their way into profit and started demanding more milk and margin per pound of dry matter.
- If your forages haven’t been tested for NDFD in the last year, you don’t actually know what you’re feeding. Until you do, you’re building rations on hope, not on what’s really in the bunk.
The Bottom Line
The Southwest dairy didn’t become a different farm when they installed that batching system. They just gave themselves nowhere to hide from their own numbers. If you pulled the last three months of your feed and milk data and wrote those four key numbers on a scrap of paper this week, would you like what you see?
Complete references and supporting documentation are available upon request by contacting the editorial team at editor@thebullvine.com.
Learn More
- Dairy Tech ROI: The Questions That Separate $50K Wins from $200K Mistakes – This guide delivers the hard-nosed financial thresholds needed to greenlight automation. It reveals exactly how to match technology to your herd size, ensuring you avoid the $200,000 “sticker price” trap and capture actual labor-saving gains.
- Record Corn Won’t Save You: The $100K Margin Hit Coming for Mid-Size Dairies in 2026 – This strategic breakdown exposes why falling milk prices will outpace cheap feed by over a dollar per hundredweight. It arms you with a 2026 survival playbook to protect your operating margin before the market cycle shifts.
- Unlock Hidden Dairy Profits Through Lifetime Efficiency: How Modern Genetics and Strategic Nutrition Can Cut Feed Costs by $251 Per Cow – This analysis reveals how selecting for Residual Feed Intake (RFI) transforms your herd’s metabolic engine. It breaks down the $251 per cow advantage of breeding for efficiency, creating a competitive edge that compounds with every generation.
 The Sunday Read Dairy Professionals Don’t Skip.
 The Sunday Read Dairy Professionals Don’t Skip.
Every week, thousands of producers, breeders, and industry insiders open Bullvine Weekly for genetics insights, market shifts, and profit strategies they won’t find anywhere else. One email. Five minutes. Smarter decisions all week.