


New overtime thresholds in Washington, California, Oregon, and New York are handing mid‑size dairies a cost nobody budgeted for — and every option for absorbing it carries a price the regulators never modeled.
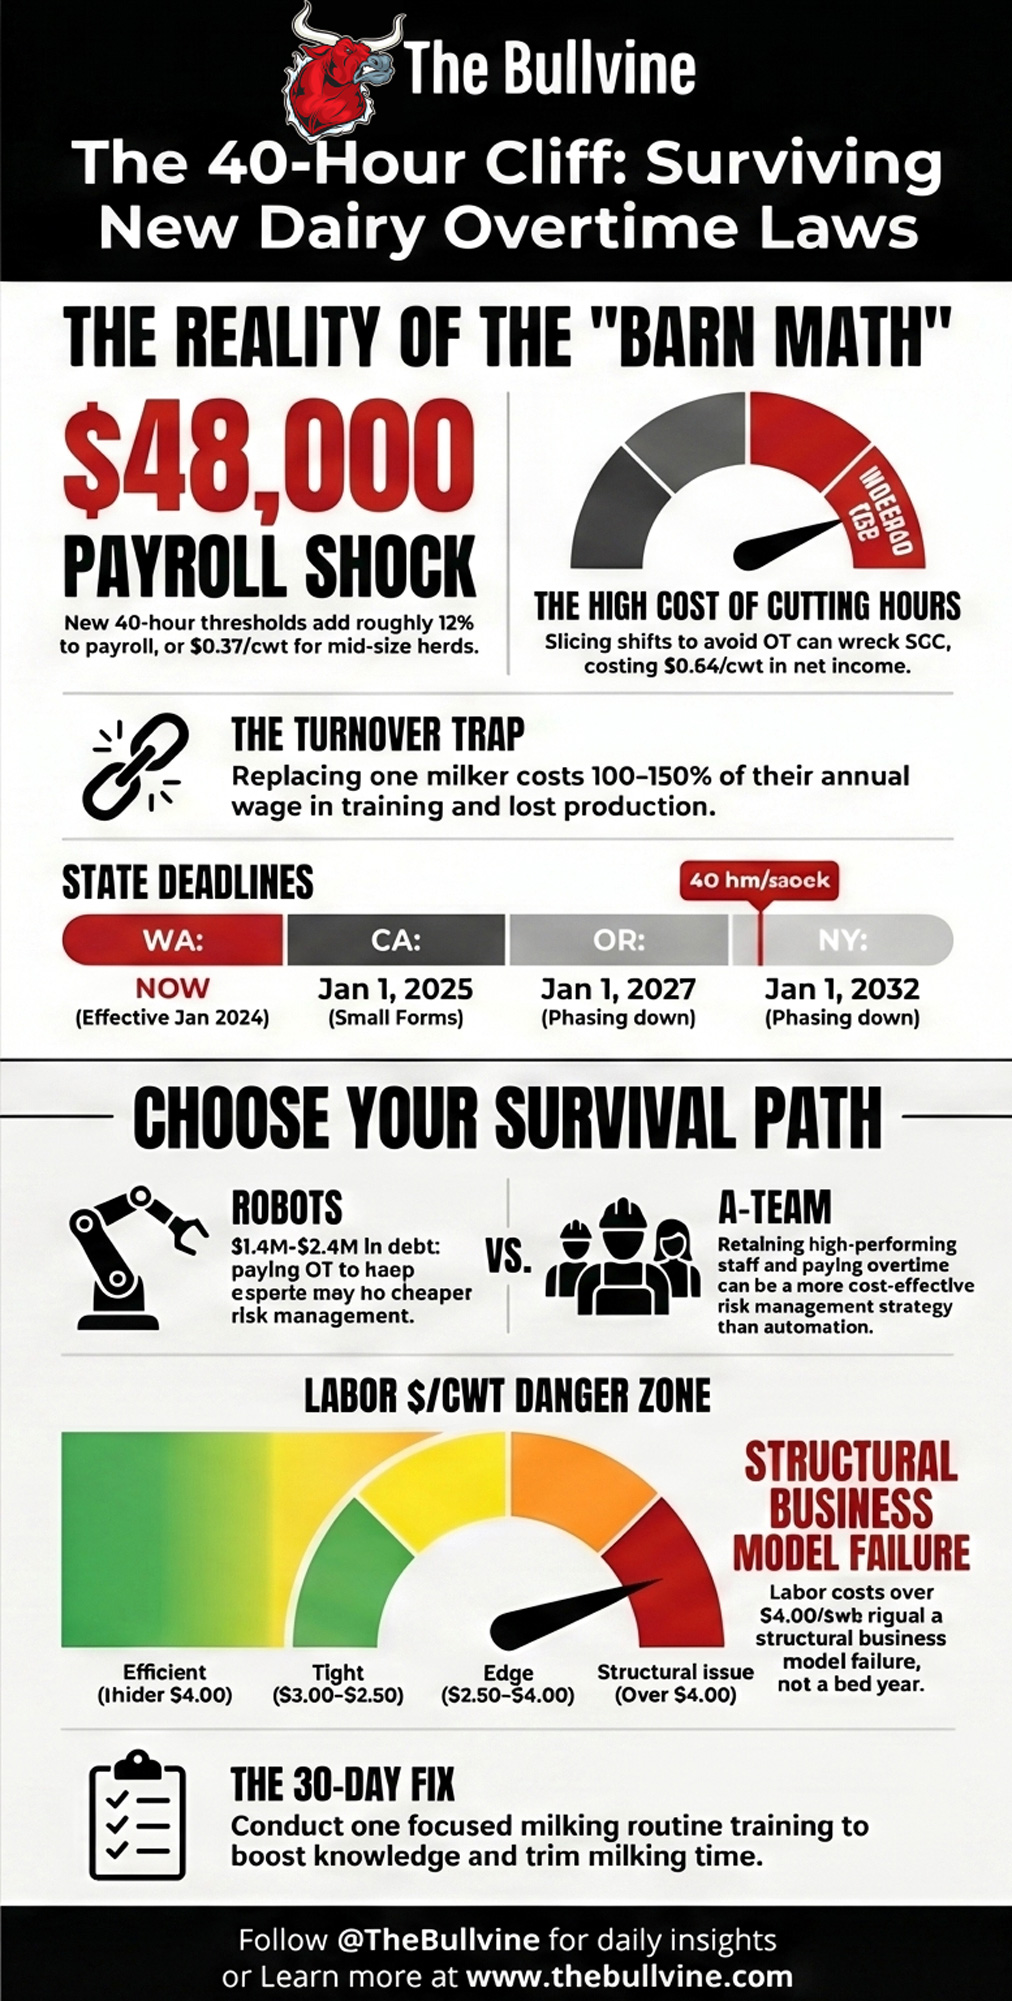
Executive Summary: New overtime laws in WA, CA, OR, and NY are adding roughly 12% to dairy payroll, which works out to about $48,000 a year, or 36–37¢/cwt, for a 480‑cow herd with a $400,000 labor bill. That pushes you into a three‑way choice: pay overtime to keep your best milkers, take on $1.4–$2.4 million in robot debt, or cut cow numbers and labor together, and each option carries risks regulators never modeled. OSU and UMN data show that if your all‑in labor cost is over $4.00/cwt, the problem is structural, but if you can hold it under $3.50/cwt, paying overtime to hang onto an A‑team can pencil better than a rushed robot install. At the same time, Zoetis/Compeer and MSU work make it clear that chopping hours and constantly retraining new milkers is a fast way to wreck SCC and give up $0.64/cwt in net income plus premium dollars you can’t afford in a tight year. The article walks through barn‑floor math on all four paths — overtime, robots, downsizing, and shift redesign — so you can plug in your own herd size, labor bill, and milk price to see which version of your operation actually survives a milk drop and one key milker walking away.

On January 25, 2024, about 300 farmworkers packed the steps of the Washington state Capitol in Olympia. They weren’t chanting for overtime pay. They were protesting what the new law was doing to their paychecks.
Washington’s agricultural overtime threshold had just finished phasing down to 40 hours per week after a two‑year rollout sparked by the Martinez‑Cuevas court decision. Workers who once counted on 60‑ or 70‑hour weeks during peak season were now getting scheduled for closer to 36–40 hours, because farms were hiring more people and spreading hours around to avoid time‑and‑a‑half. “It’s not giving enough money to send to his family in Mexico,” one H‑2A dairy worker told Northwest Public Broadcasting reporter Johanna Bejarano about his new schedule.
Down in Chehalis, Washington, Sun‑Ton Farms has been milking cows for three generations. In local interviews, the Schilter family has made it clear that new labor rules are right up there with milk prices and feed costs as the challenges that decide whether their legacy continues. For operations like theirs, the dairy farm overtime laws 2026 don’t read like a policy debate. They read like a $48,000 problem they didn’t ask for. For many family herds, these dairy farm overtime laws 2026 are less about politics and more about whether the barn math still works.
The Deadlines You’re Actually On
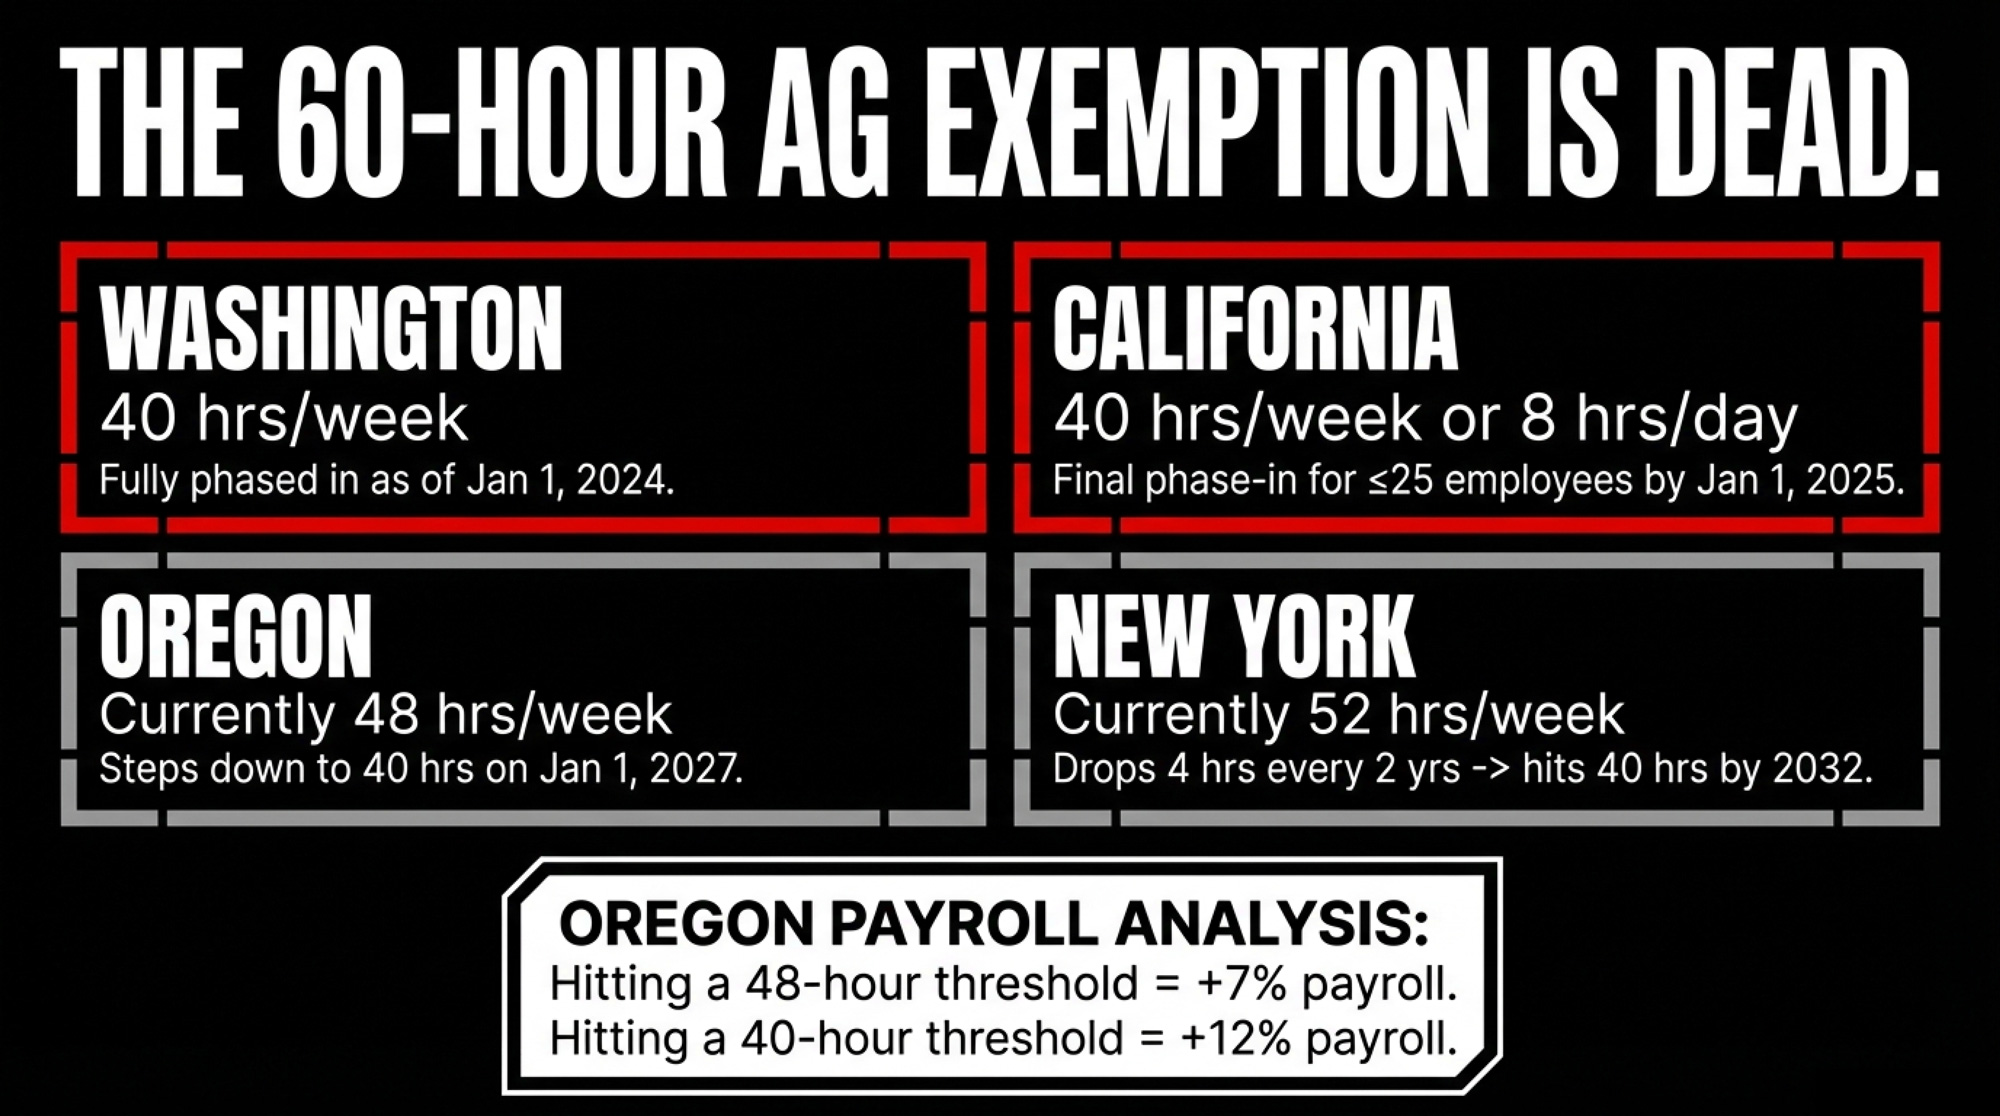
The ag overtime exemption that let dairy crews work 55–70 hours at straight time for decades is disappearing, state by state. The practical scoreboard looks like this:
| State | OT Threshold Now | Effective | Where It’s Headed |
| Washington | 40 hrs/week | Jan 1, 2024 | Fully phased in |
| California | 40 hrs/week or 8 hrs/day | Jan 1, 2025 final phase‑in for ≤25 employees | Larger employers already there |
| Oregon | 48 hrs/week | Jan 1, 2025 (HB 4002) | Steps down to 40 hrs on Jan 1, 2027 |
| New York | 52 hrs/week | Jan 1, 2026 | Drops 4 hrs every 2 yrs → 40 hrs by 2032 |
Washington is your preview. Analysis of real payroll records and interviews with both workers and employers show that farms aren’t simply paying overtime. They’re restructuring around it — adding more bodies, capping hours below 40, and compressing schedules.
California’s numbers tell a similar story. USDA Farm Labor Survey data, analyzed by Cornell’s Agricultural Workforce Development group, shows California’s directly hired farmworkers averaged 2.7 more hours per week than all U.S. farmworkers in 2016; by 2023, they averaged about one hour less. The overtime law didn’t automatically boost total paychecks. Hours shrank. Weekly earnings often went the wrong way.
For dairy, which already ran some of the longest workweeks on the farm, those trends hit harder than in most crops.
The Barn Math Behind the $48,000 Shock
Oregon State economists Tim Delbridge and Jeff Reimer pulled anonymized payroll records from five Oregon farms — three dairies, three nurseries, and two cherry orchards — and modeled what happens at different overtime thresholds. Dairy was the most exposed because its employees were already working the longest weeks.
Their estimates:
- At a 48‑hour threshold, dairy payroll jumped around 7%.
- At 40 hours, the increase was about 12%.
Now put that into your barn.
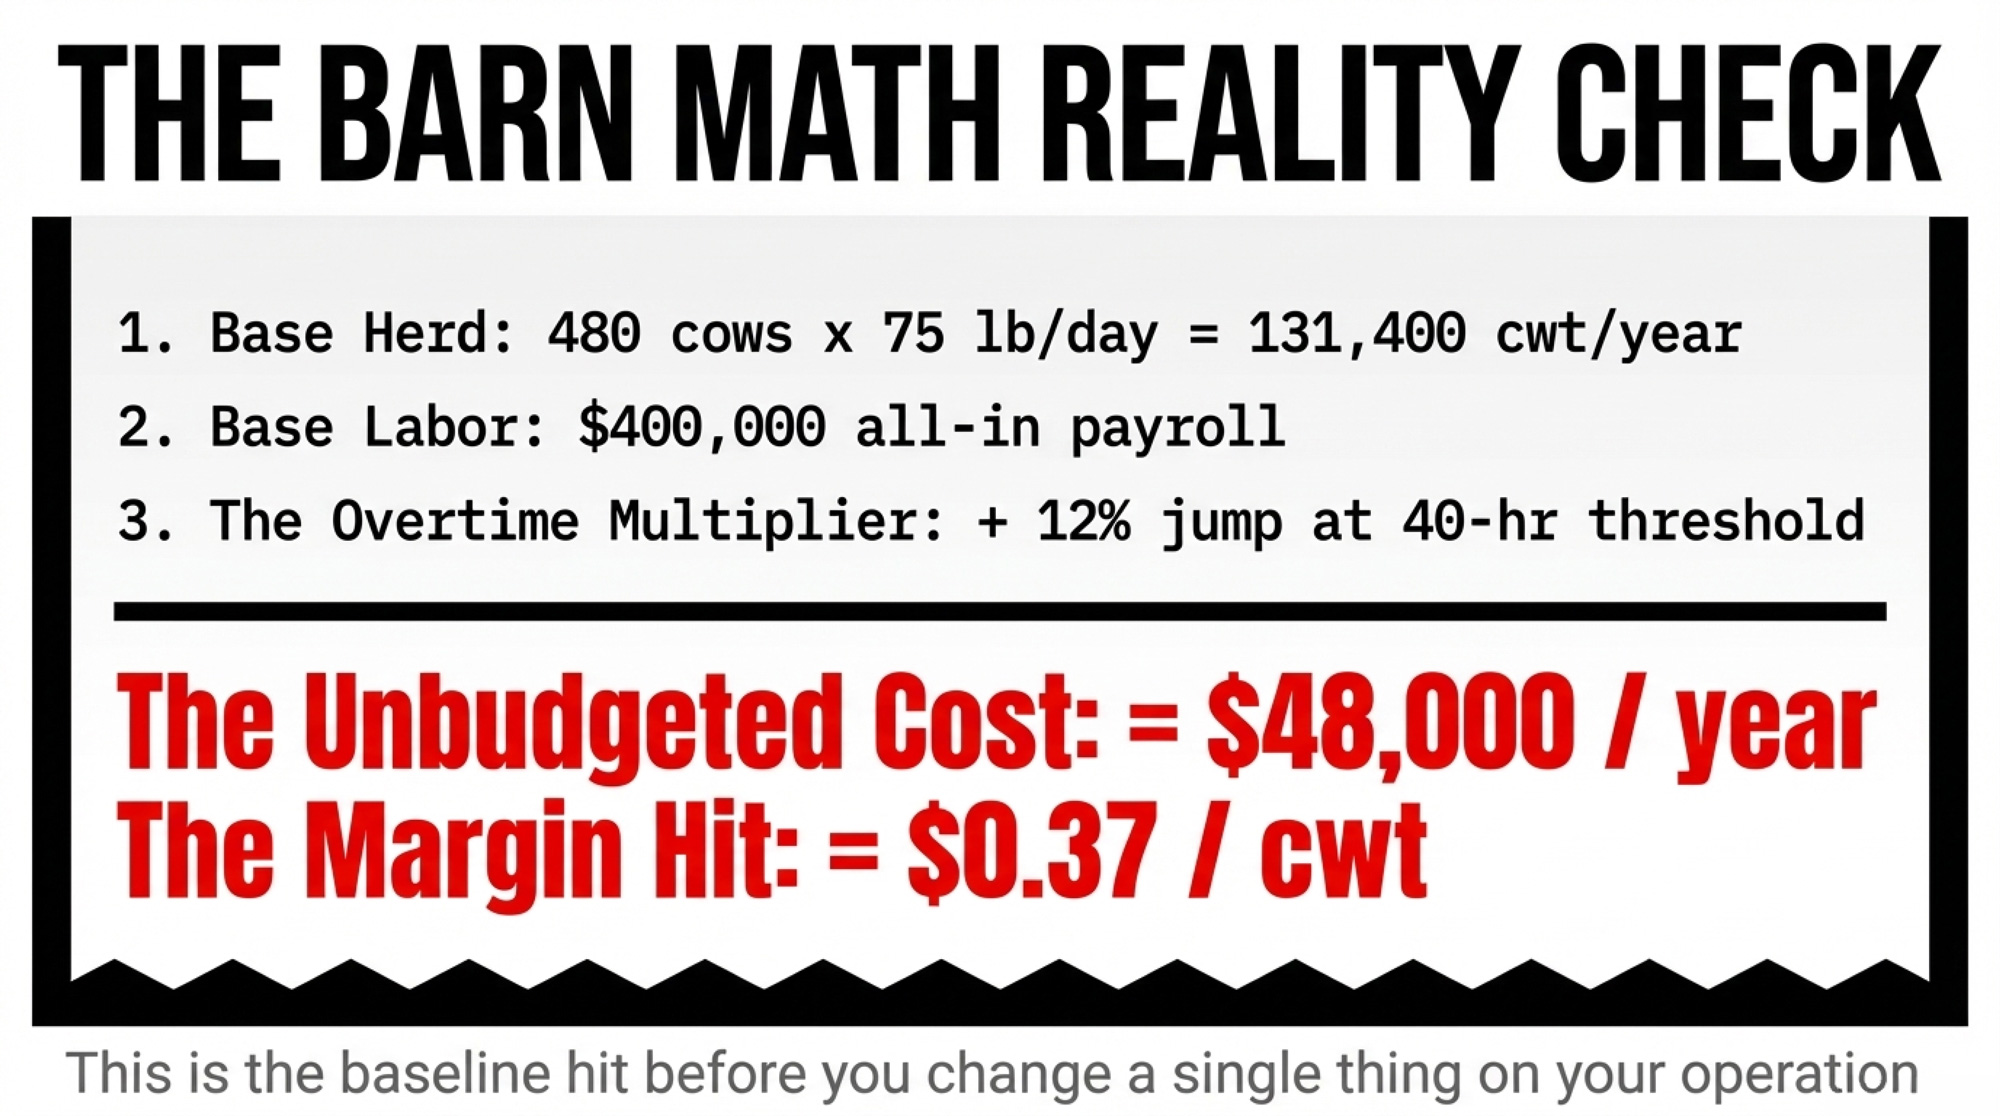
You’re running 480 cows, shipping 75 lb/cow/day. That means:
- 480 cows × 75 lb/day = 36,000 lb/day
- Over 365 days: 36,000 × 365 = 13,140,000 lb/year
- Divide by 100 → 131,400 cwt/year
Your all‑in payroll for parlor and cow care — wages, payroll taxes, basic benefits — is around $400,000. usda
Twelve percent of $400,000 is $48,000. Spread across 131,400 cwt:
- $48,000 ÷ 131,400 ≈ $0.37/cwt
Call it roughly 36–37 cents per cwt of the new cost you didn’t have last year. That’s the “just pay it” option.
But the Oregon analysis and follow‑up coverage also show what farms actually did in response: opb
- Cut back individual hours so fewer workers exceeded 40 hours.
- Hired more workers part‑time to cover the same work.
- Reshuffled tasks to squeeze milking and cow care into tighter windows.
Workers ended up with higher hourly rates and lower weekly pay. Farms ended up managing more people for the same output. And that’s where the hidden costs start.
How Much Overtime Can Your Operation Actually Carry?
USDA ERS estimates hired labor accounts for roughly 13–15% of total dairy cash expenses on average. A University of Minnesota analysis used by Choices magazine shows that a 10% increase in labor costs can shave about 15% off net income on an average dairy.
The number that really matters isn’t wage per hour. It’s labor cost per hundredweight shipped — and how many pounds each full‑timer helps move out the driveway. A farm paying $18/hour with 1.5 million pounds sold per full‑time equivalent can be in better shape than a neighbor paying $16/hour and moving only 900,000 pounds per worker.
Once you calculate your true all‑in labor cost per cwt — wages, overtime, payroll taxes, benefits, plus a realistic estimate for turnover and any quality losses tied to labor — chances are you land somewhere on this spectrum:
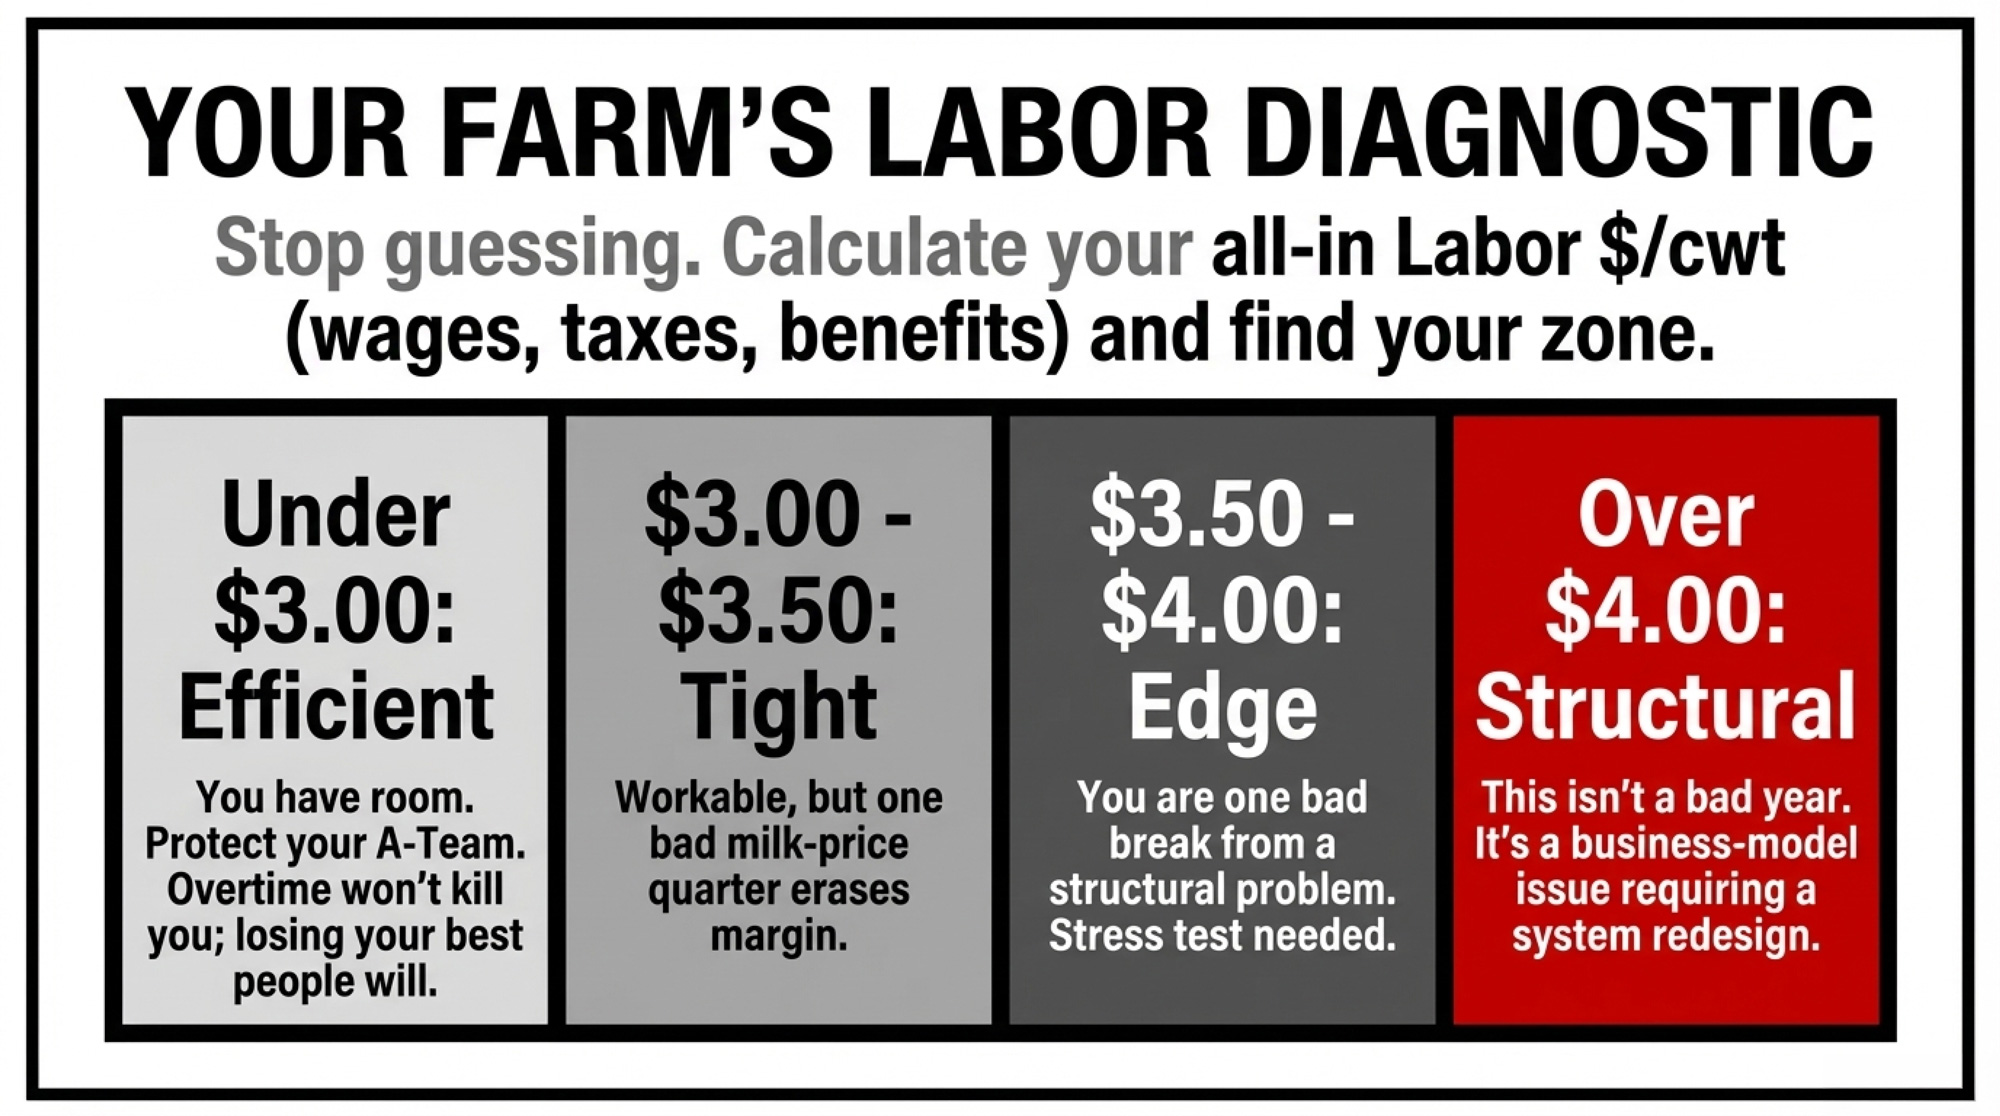
| Labor $/cwt | Zone | What It Really Means |
| Under ~$3.00 | 🟢 Efficient | You’ve got room. Overtime by itself won’t kill you. The real risk is losing your best people. |
| $3.00–$3.50 | 🟡 Tight | Workable, but one bad milk‑price quarter erases margin. |
| $3.50–$4.00 | 🟠 Edge | You’re one bad break from a structural problem. Time for a stress‑test. |
| Above ~$4.00 after a serious cleanup | 🔴 Structural | This isn’t a bad year. It’s a business‑model issue that needs a redesign. |
Those zones align with MSU and UMN benchmarks and USDA’s own cost‑of‑production work.
One question cuts through the noise:
If milk drops $2/cwt and you lose one key milker in the next 12 months, does your current setup still keep the farm alive?
If the honest answer is yes, then paying overtime to hold a strong crew together might be the cheapest risk management you’ve got.
If the answer is no, overtime is a bridge — not a plan.
What Happens to Your SCC When You Chop Your Milker’s Shifts at 40 Hours?
Your cows don’t read the labor code. They care about one thing: the same person doing the same thing the same way, every milking.
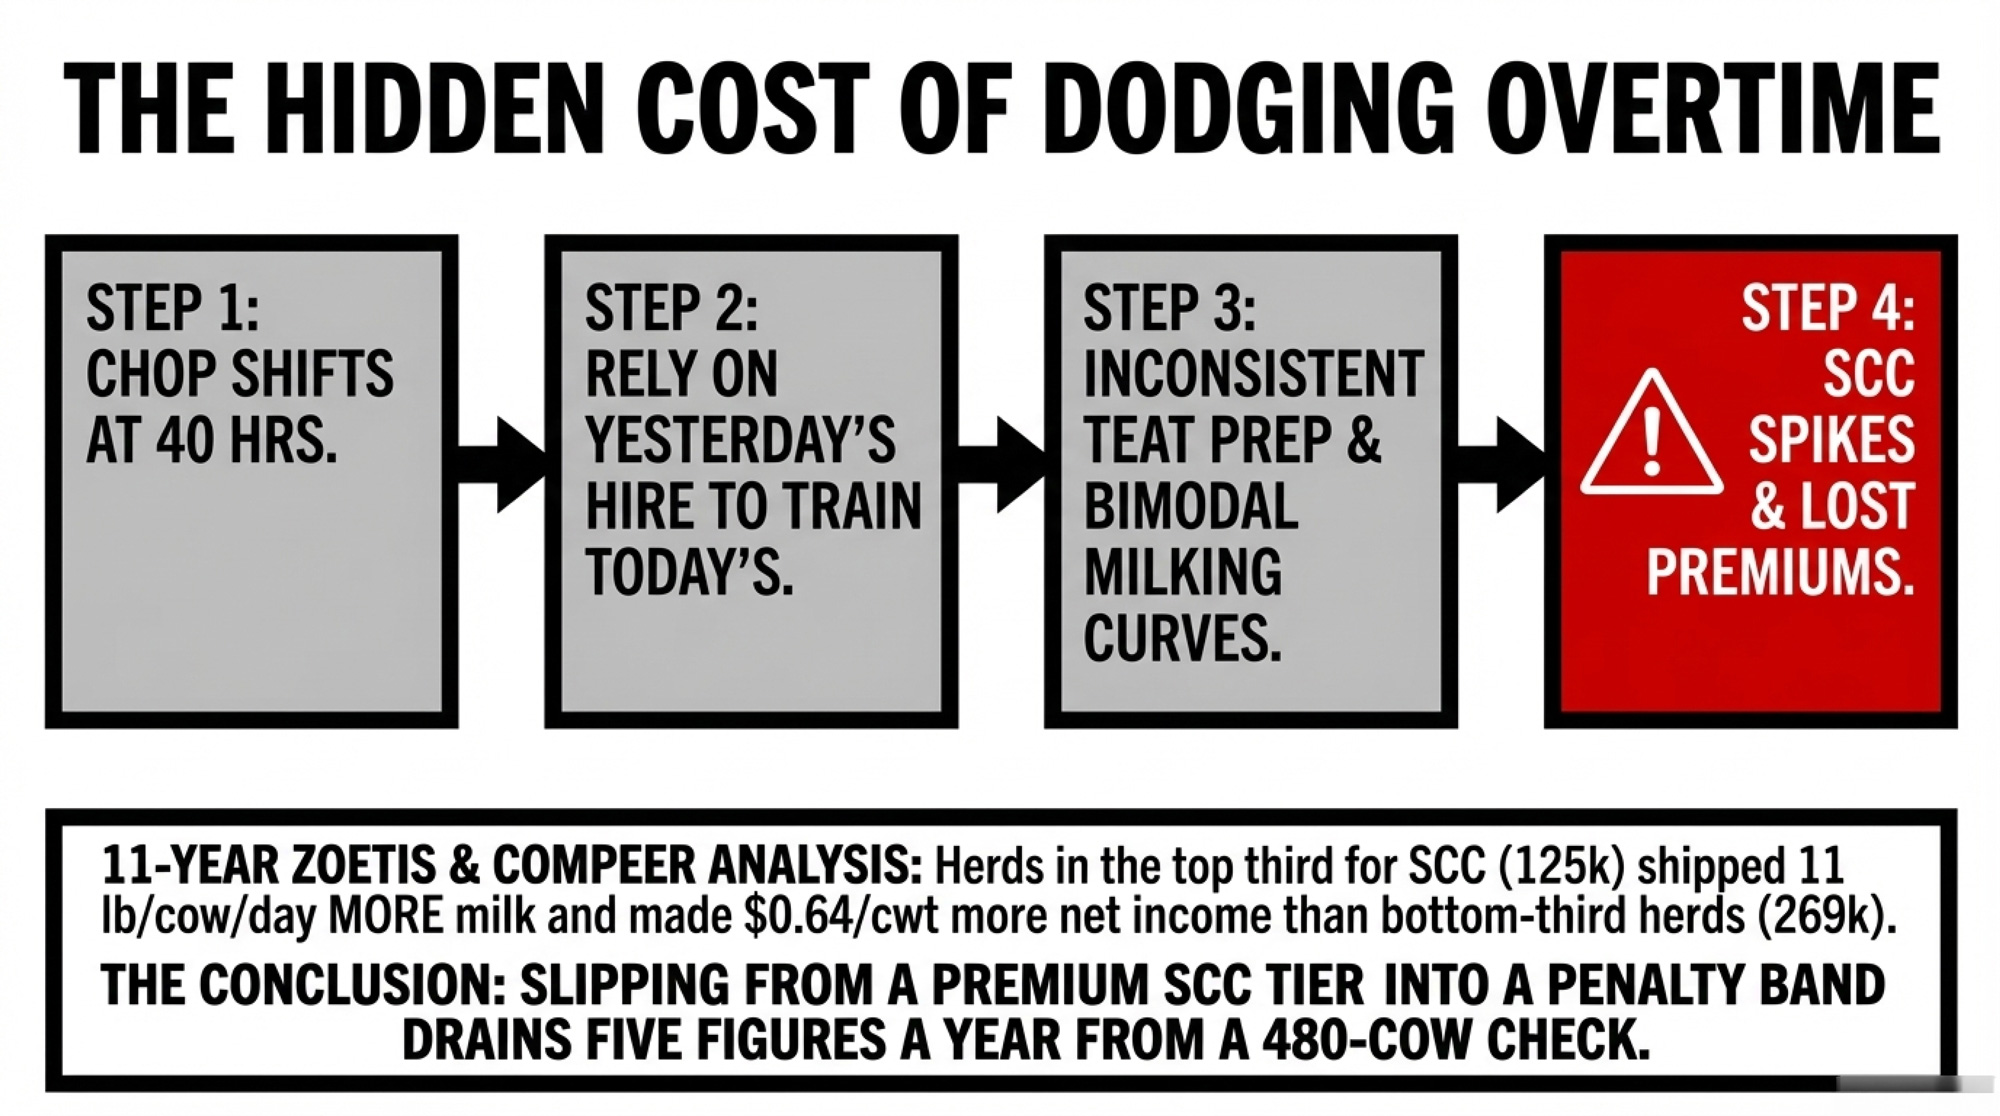
An 11‑year analysis by Zoetis and Compeer Financial found herds in the top third for bulk tank SCC — averaging around 125,000 cells/mL — shipped about 11 lb/cow/day more milk and made $0.64/cwt more net income than herds in the bottom third, which averaged about 269,000 cells/mL. Genetics helps, but that spread is mostly routines and people.
Work from Pamela Ruegg and others has put hard numbers on milking routine: standardized prep and unit attachment generated a 5.5% increase in lactational milk yield compared to inconsistent prep and timing. A separate study across 68 dairy herds found that milker behavior and management explained up to 40% of the variability in bulk-tank SCC among herds.
Michigan State University’s parlor evaluation team gives one example that should make you sit up: a herd with bulk tank SCC in the 80,000–85,000 range was still running 44% bimodal milking events, a sign that cows weren’t letting down properly even though the tank looked great. The parlor looked fine on paper. The milk curves told a different story.
Now overlay overtime.
When you slice shifts to dodge OT, you:
- Add more people to cover the same parlor hours.
- Give each person fewer full milking cycles to master.
- Rely on yesterday’s hire to train today’s.
Rodriguez’s training study, which The Bullvine covered earlier, looked at 112 milkers on 16 farms. A single focused, bilingual on‑farm training session:
- Moved milker knowledge scores from 49.3% to 67.6%.
- Cut inadequate teat prep from 69% to 48%.
- Trimmed milking time by 25–43 seconds per cow.
And yet herds that had SOPs written down for milking but no training showed bulk tank SCC 21,600 cells/mL higherthan herds with no SOPs at all. A three‑ring binder doesn’t milk cows. People do.
Dairy One and processor premium sheets translate that into real dollars: slipping from a premium SCC tier into a penalty/no‑premium band in a 400–500‑cow herd can quietly drain five figures a year from your milk check. The overtime law doesn’t itemize that. Your settlement sheet does.
The Mid‑Size Squeeze
The operations caught in the worst squeeze are in the 200–800 cow range. Too big to cover everything with family and one hired hand. Too small to spread robot installation costs over 2,000–3,000 cows.
Bre Elsey, director of governmental affairs at the Washington Farm Bureau, told Cascade PBS that “agriculture is the second largest industry in the state, and we’re losing them, one by one.” She was talking about family operations — the six‑ to twelve‑employee outfits that can’t casually absorb a $48,000 annual payroll shock without rethinking everything.
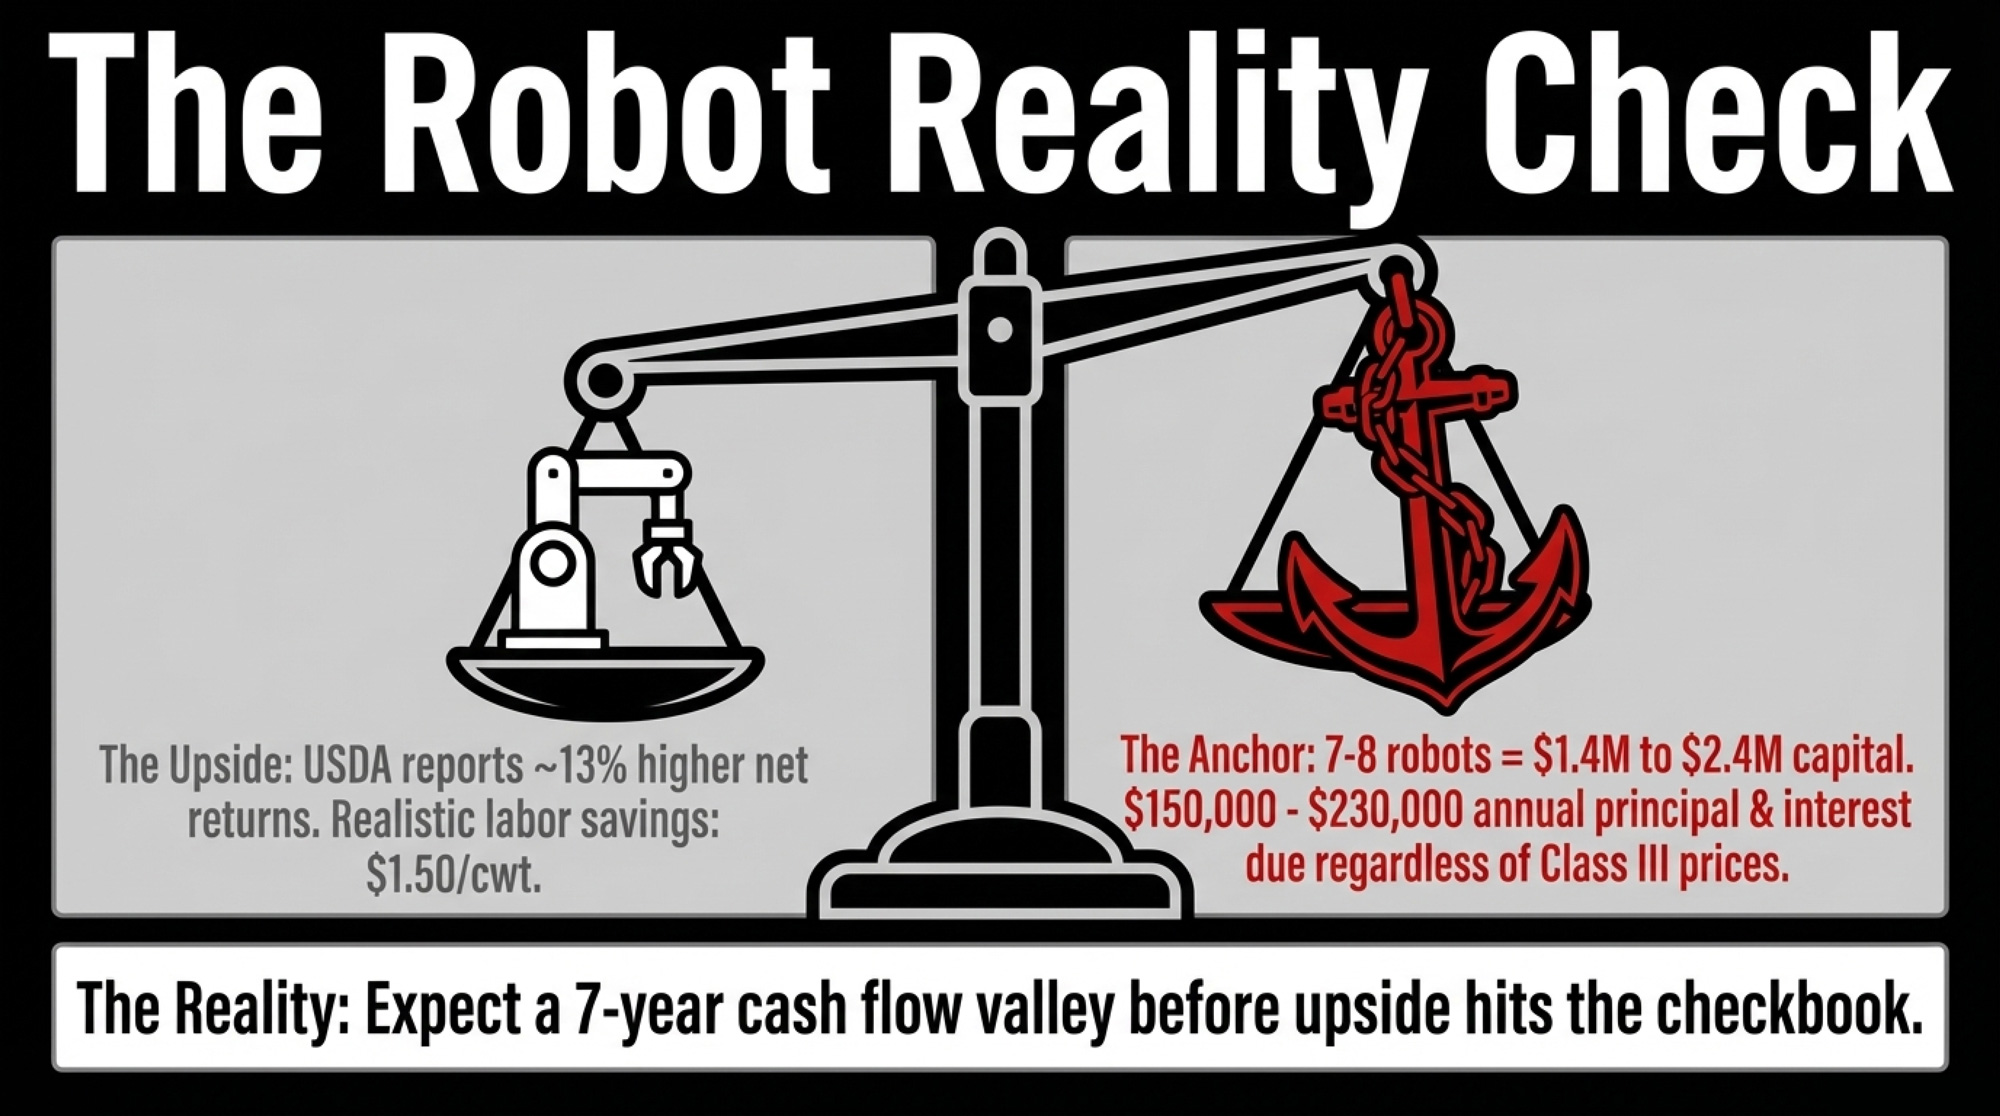
On the robot side, the temptation is real. USDA’s January 2026 report, ERR‑356, suggests farms using automatic milking systems (AMS) can see about 13% higher net returns over time. But Iowa State’s Larry Tranel, whose AMS cash‑flow work underpins a lot of extension talks, shows a typical install running roughly seven years of negative or flat cash flow before that upside shows up in the checkbook.
Scale that to a 480‑cow parlor:
- You’re looking at 7–8 robots.
- At $200,000–$300,000 installed per box, that’s $1.4–$2.4 million in capital.
- Annual principal and interest on that kind of note can land roughly in the $150,000–$230,000 range at typical 10–15 year terms and current rates.
Those payments don’t care what Class III does next winter. But for some, the $230,000/year debt is a “reliability tax” they are willing to pay just to stop checking their phone for “I can’t make my shift” texts.
One Bullvine case study laid out what happens when the milk price in the dealer’s spreadsheet doesn’t match reality. A 240‑cow family ran their dealer’s four‑robot proposal at $18 milk instead of $22 and watched the projected milking cost jump from $2.03 to $4.07/cwt. The robots did what they promised. The economics didn’t.
The Cost Nobody Logs Under “Labor”
Here’s the thread that runs through every path you’re considering.
U.S. dairies using hired labor are reporting turnover rates of 30–40% per year. The National Dairy FARM Workforce Development survey reported an average of 38.8%. Extension and HR estimates peg the real cost of replacing a single hourly dairy employee — recruiting, hiring, onboarding, on‑the‑job training, early mistakes, and lost production — at 100–150% of that person’s annual wage.
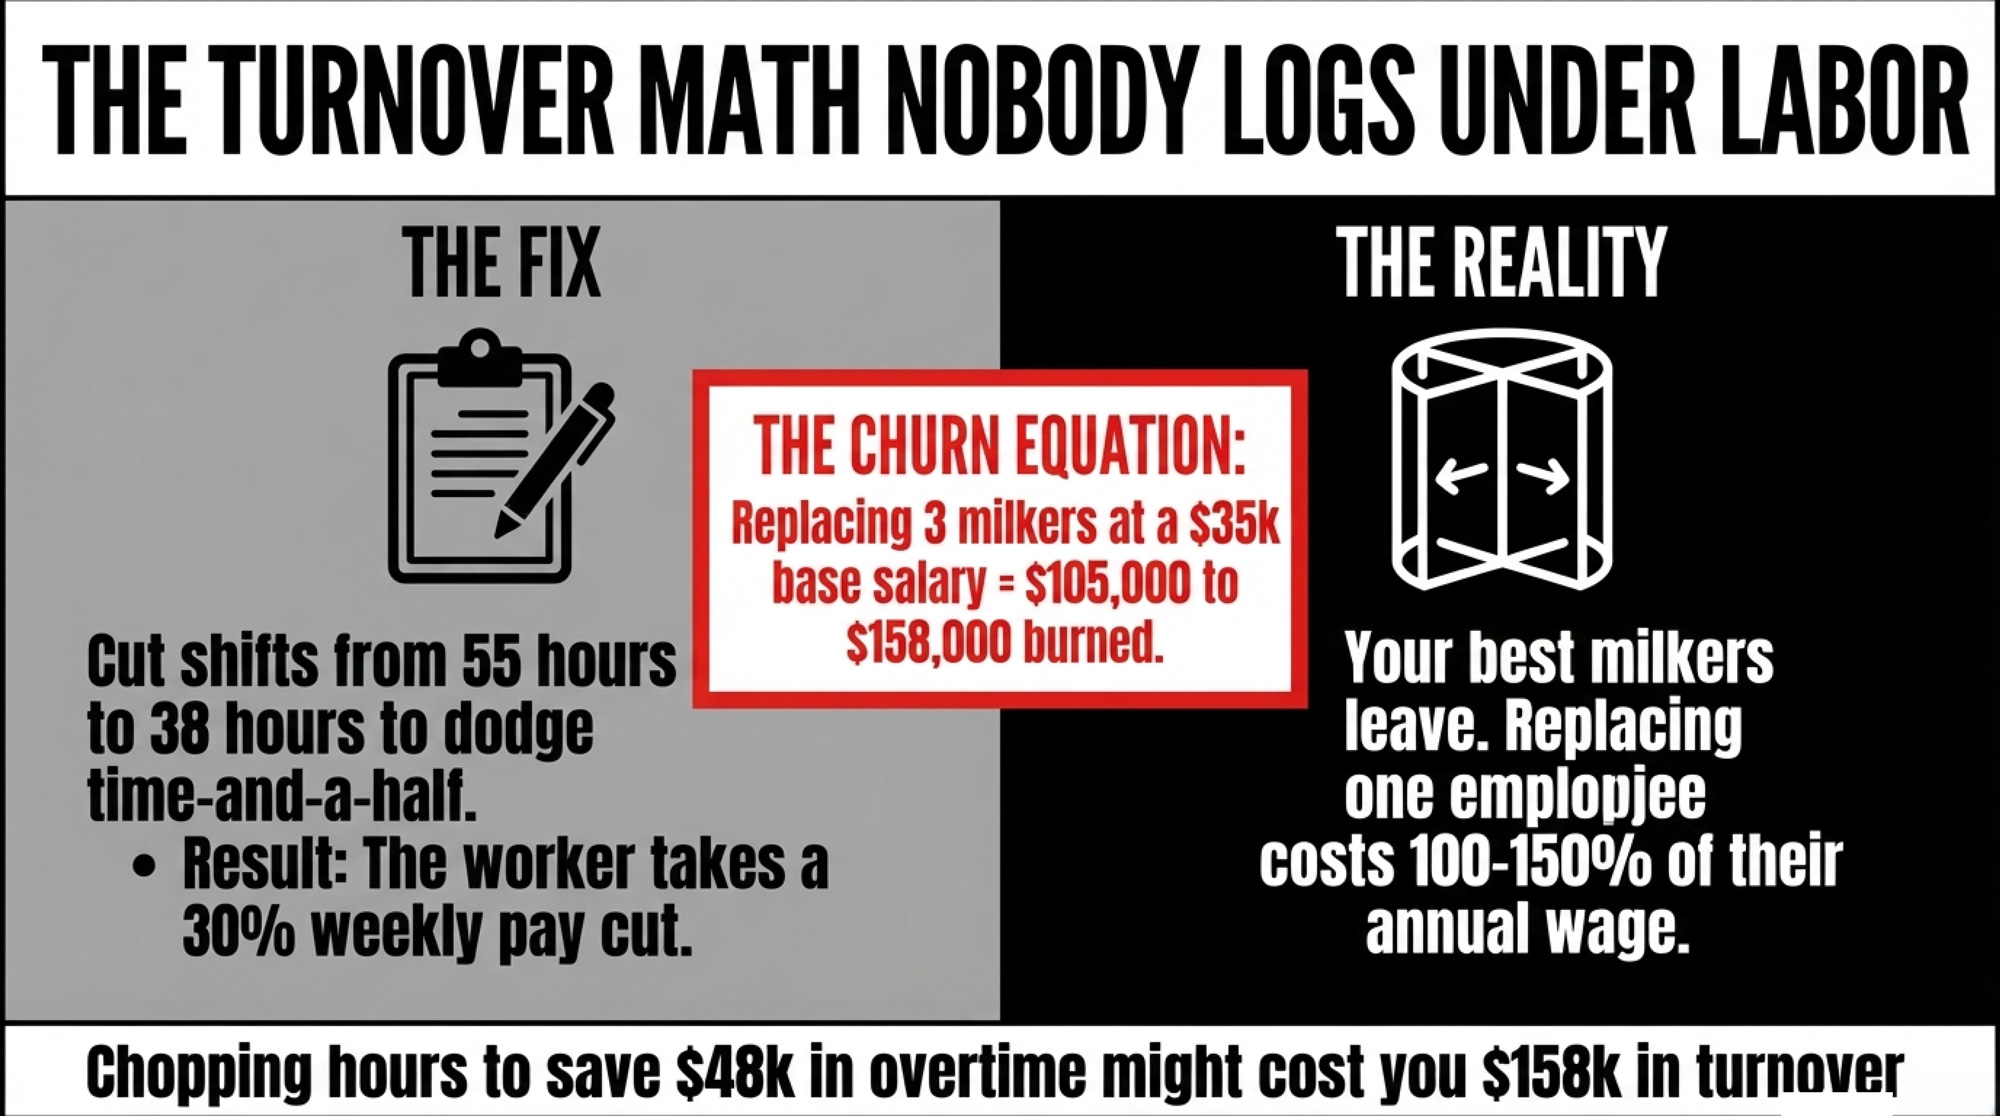
If three milkers leave in a year at $35,000 base pay, you’re effectively burning:
- 3 × $35,000 × 100% = $105,000 on the low end.
- 3 × $35,000 × 150% = $157,500 on the high end.
Round it, and you’re somewhere around $105,000–$158,000 in real cost churned through just because you had to refill the same three positions.
Now layer overtime on top.
If your crew was working 55 hours a week at straight time pre‑law and you now cut them to 38 hours at straight time to avoid time‑and‑a‑half, their straight‑time hours just dropped by 31%. That’s roughly a 30% pay cut if the hourly rate doesn’t change. You’ve just handed a good milker a powerful reason to find a steadier income.
So the choice isn’t really “overtime vs robots.” It’s: pay a known premium to keep your best people, or design your system so it quietly pushes them out the door.
| Scenario | Annual Payroll Impact | SCC Risk | Training Disruption | Net Income Hit |
|---|---|---|---|---|
| Pay overtime, keep A-team (480 cows) | +$48,000 (+37¢/cwt) | Low — consistent crew | Minimal | –$48k vs. baseline |
| Cap hours, trigger turnover (3 exits/yr @ $35k wage) | +$105k–$158k replacement cost | High — rotating pit | Constant retraining | –$105k–$158k + SCC penalty |
| SCC slip (top → bottom third, 480 cows) | $0 added labor cost | –$84,096 net income premium | Routine breakdown | –$84k/yr disappears from milk check |
| Robot install + ramp (Yr 1–5 deficit years) | –$100k to –$35k/yr net vs. debt | Low once stable | High during transition | –$100k–$200k/yr until Yr 6+ |
How Much Overtime Can Your Operation Carry? (Economic Question)
If you’re sitting at $2.80/cwt in all‑in labor cost and you’ve got a stable crew, overtime can look like tuition — money you pay to keep the people who make your cows more productive and your SCC more predictable.
If you’re at $3.20/cwt, you’re tight, but you’ve got options. You can absorb some overtime, trim obvious waste, and buy yourself a year or two to decide whether robots or a parlor redesign make sense.
If you run the real numbers and you’re at $3.80–$4.20/cwt even after cleanup, then you’re not dealing with a bad year. You’re looking at a system problem.
The takeaway: don’t guess. Pull your last quarter’s labor spend, include payroll taxes and benefits, divide by cwt sold, and see exactly where you sit on that spectrum. Then look at that number next to your milk price, your interest rate, and your tolerance for a 15% swing in net income.
What Happens to Your SCC When You Chop Your Milker’s Shifts at 40 Hours? (Operational Question)
You’ve seen it in your own tank. When the same three or four people milk every day and follow the routine, SCC trends one way. When you’re swapping new faces into the pit every month, it trends another.
Research from Wisconsin and elsewhere consistently links predictable, low‑stress cow handling with better oxytocin release and more complete milk letdown. MSU’s parlor performance team talks about watching bimodal milking curves — a sign that cows aren’t letting down properly — as closely as you watch vacuum settings.
When you redesign shifts purely around a 40‑hour line, you risk turning your parlor into a revolving‑door training program. The overtime line on your payroll might look cleaner. Your SCC report probably won’t.
Options and Trade‑Offs for Farmers
You’ve really got four paths. None is painless. Each one has a breaking point.
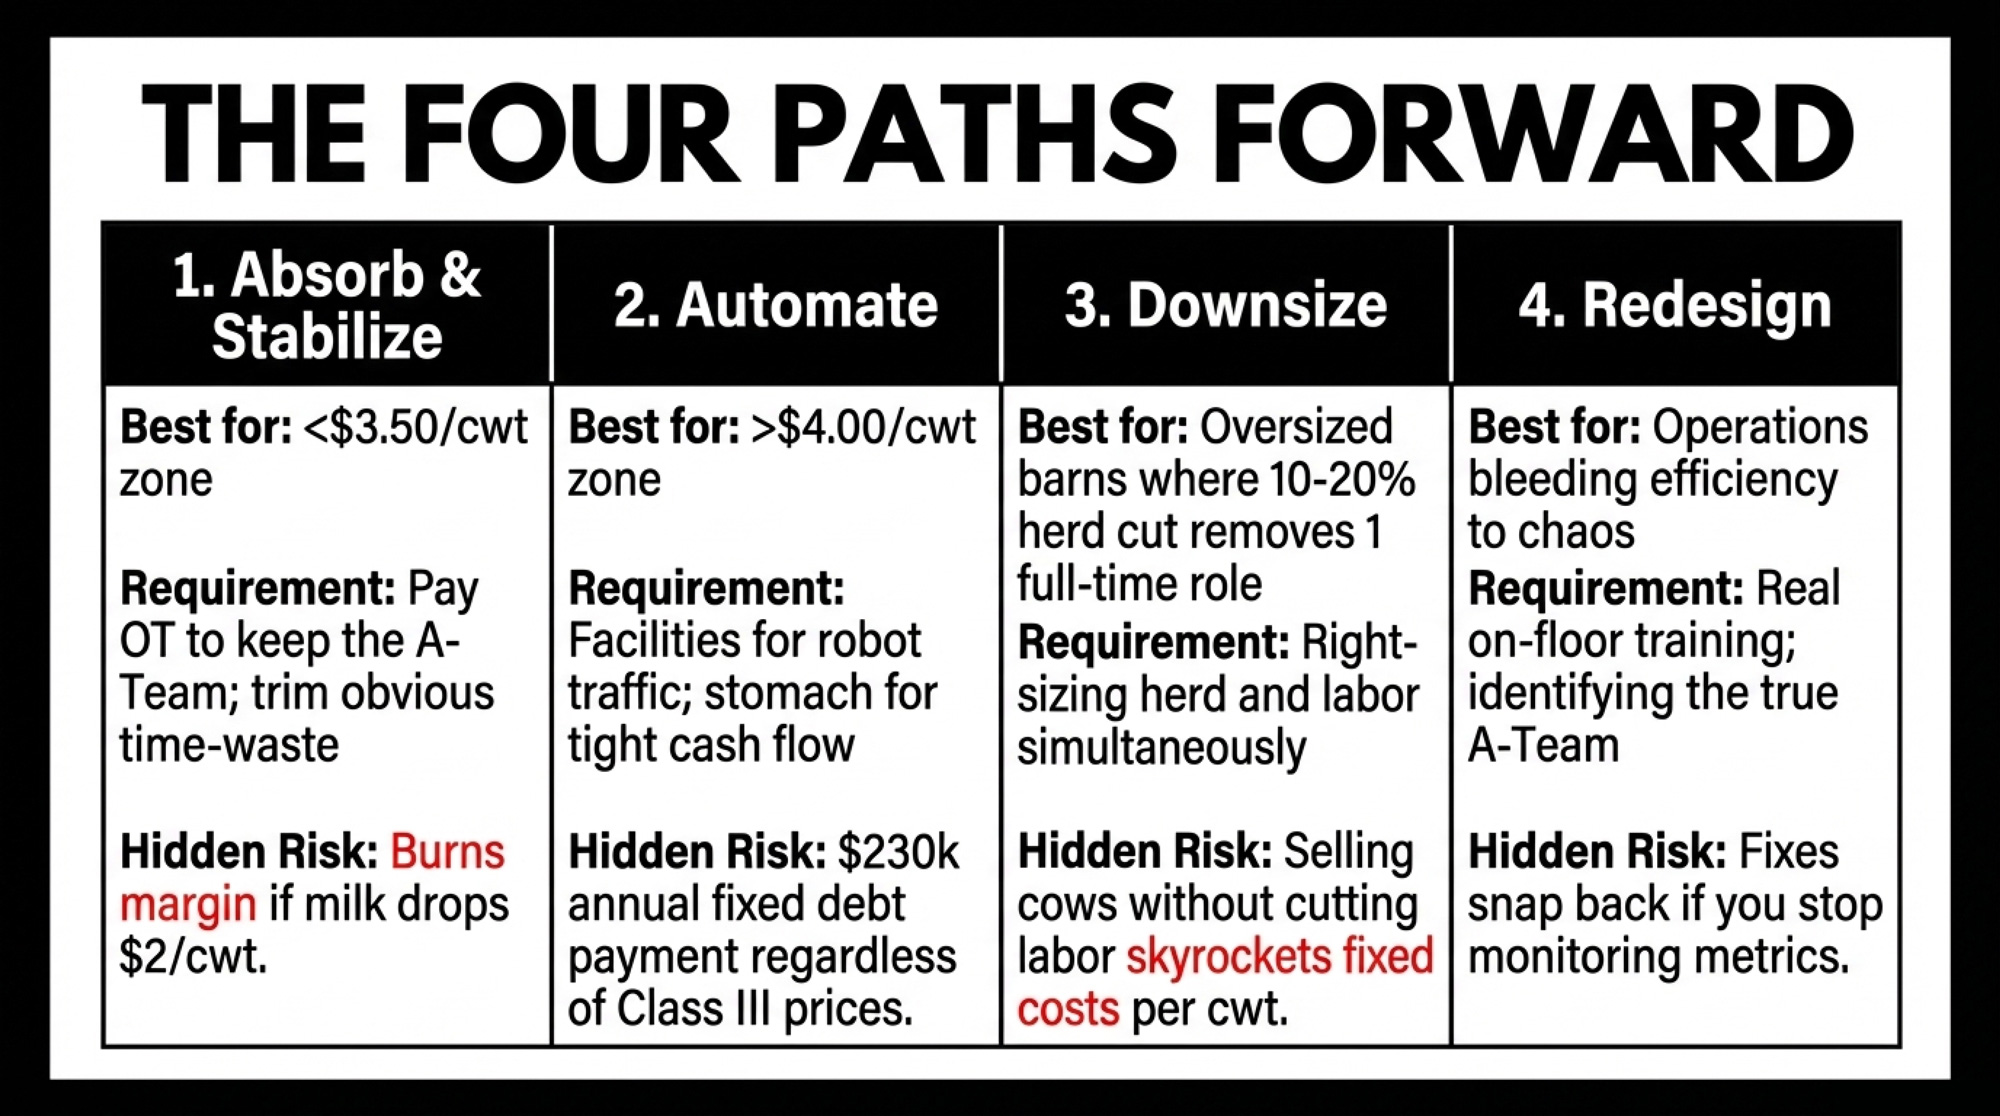
| Path | Best Fit (Labor $/cwt) | Core Requirement | Annual Cost/Investment | Break Point |
|---|---|---|---|---|
| Absorb Overtime | < $3.50/cwt | Stable A-team crew | +$48,000/yr (37¢/cwt) | $2 milk drop + 1 key milker lost |
| Automate (Robots) | > $4.00/cwt structural | Barn redesign + data discipline | $1.4M–$2.4M capital; $150k–$230k/yr P&I | 7–10 yrs negative cash flow; $16 milk |
| Downsize Herd | Any, if labor not cut | Remove ≥ 1 FTE with cows sold | Cow sale offset; lower production | Spread fixed costs over fewer cwt → $/cwt spikes |
| Shift Redesign | $3.50–$4.00/cwt | Identify A-team + run real training | 30-day effort; low cash cost | Reverts if not tracked quarterly |
Path 1: Absorb Overtime and Stabilize
When it makes sense: Your all‑in labor cost comes in under about $3.50/cwt after a realistic cleanup. Your SCC trends are solid. You’ve got a core group of milkers you trust, and your banker is not excited about you taking on another million‑plus of debt.
What it requires:
- Treat overtime on your best milkers as a planned investment, not a mistake.
- Trim obvious time‑waste — double work, jobs that creep into the milking window — instead of cutting the A‑team.
- Track labor $/cwt quarterly so you see creep before it bites you.
Risks and limits: If milk falls $2/cwt, that extra 36–37 cents of labor burns more of what little margin you’ve got. If your A‑team leaves anyway, you’re paying overtime to a less‑skilled crew and getting worse results.
Path 2: Automate
When it makes sense: Even after cleanup, your labor cost sits above roughly $4.00/cwt, and it’s not a one‑year fluke. Your facilities work for robot traffic. Your balance sheet and stomach can handle 7–10 years of tighter cash flow.
What it requires:
- Treat robots as a full‑farm system change. Genetics, grouping, fetch strategy, and data use all have to move with it.
- Use realistic labor‑savings numbers. The USDA report and large‑herd AMS perception studies both suggest many farms land around $1.50/cwt in real labor savings — not the $3–4/cwt you sometimes see in sales decks.
- Stress‑test your payment at a few milk prices and interest rates. Don’t model only your best year.
Risks and limits: Fixed payments in the $150,000–$230,000/year neighborhood for a 480‑cow install — every year, whether Class III is $22 or $16. Tranel’s work suggests roughly seven years before the net‑return upside shows up in the checkbook. You don’t unwind that bet easily.
Path 3: Downsize the Herd
When it makes sense: You can sell 10–20% of your cows and actually remove at least 0.5–1.0 full‑time positionswithout making the remaining crew’s lives impossible. Your barns aren’t so oversized that fewer cows send your fixed cost per cwt through the roof.
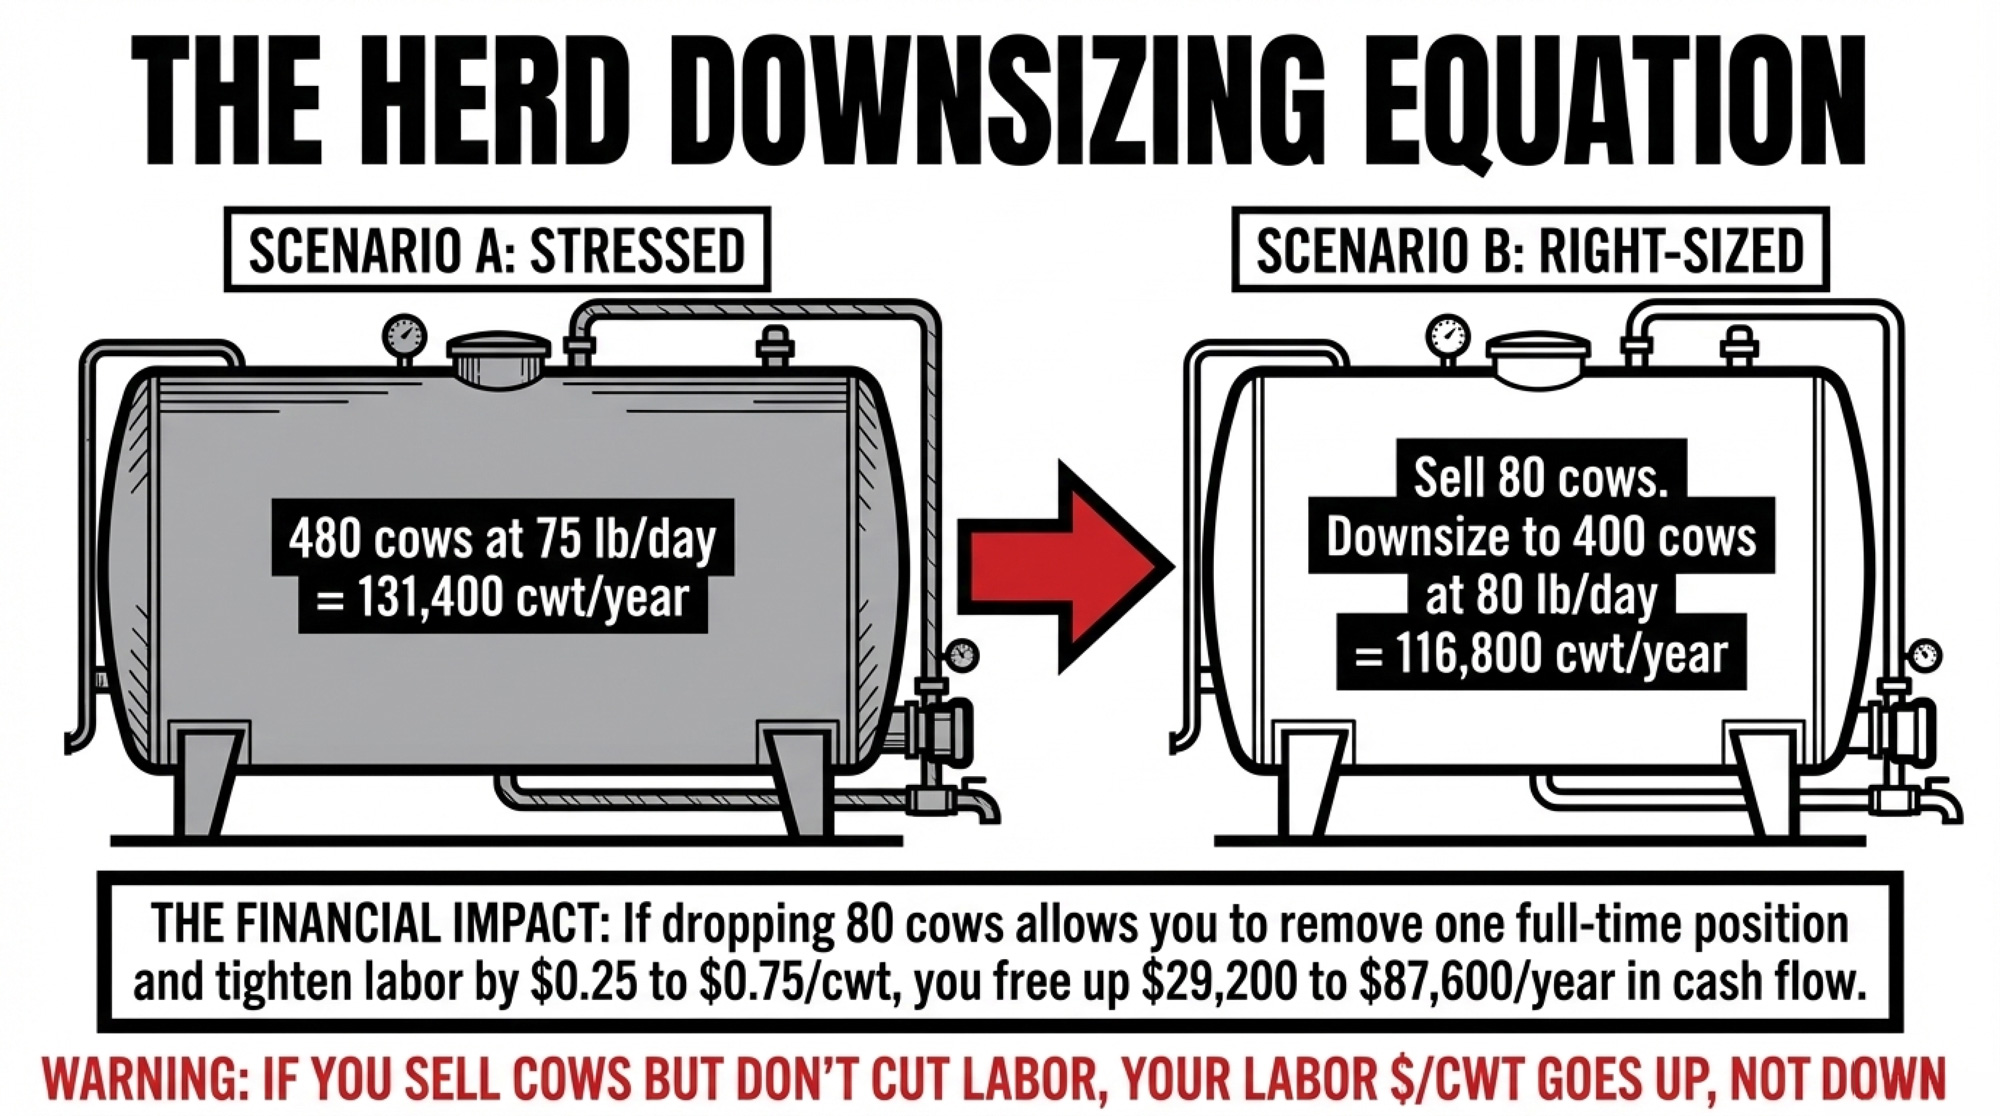
Barn‑floor math: Say you go from 480 cows at 75 lb/day to 400 cows at 80 lb/day.
- 400 × 80 = 32,000 lb/day
- Over a year: 32,000 × 365 = 11,680,000 lb = 116,800 cwt
If you cut labor $0.25–$0.75/cwt by removing one position and tightening everything up, you free up $29,200–$87,600/year in cash flow. At the same time, a well‑planned right‑sizing move can keep total margin surprisingly close to where it was.
Risks and limits: If you sell cows but don’t cut labor, you just spread the same barn costs over fewer pounds — your labor $/cwt goes up, not down. And if reproduction or health slips while you’re shrinking, you take a double hit: fewer cows and fewer pounds per cow.
Path 4: Redesign Shifts and Roles — Your 30‑Day Move
When it makes sense: Your biggest problem is chaos, not headcount. Shifts bleed into each other, nobody really owns training, and you’re not confident about where the time is going.
Do this in the next 30 days:
- Identify your A‑team. These are the two to four milkers whose shifts consistently show better parlor numbers. Don’t just look at speed. Look at SCC trends on their pens, the consistency of their milking curves, and how cows behave around them. Calm, predictable handling boosts oxytocin release and milk letdown; rough or inconsistent handling has the opposite effect.
- Run one real milking routine training. Not a laminated sheet. An actual session where someone with credibility watches prep and attachment, corrects in real time, and follows up. Rodriguez showed that one focused session moved knowledge, prep quality, and milking time across 112 milkers.
- Audit time‑waste. Walk a few full shifts with a notebook. Where are people waiting? Where do cows get hung up? What jobs are happening in the pit that could happen somewhere else?
Over the next 90 days, track four numbers:
- All‑in labor $ per cwt.
- Rolling 3‑month SCC.
- Milk per cow per day.
- Turnover (who leaves, who stays).
If all four move in the right direction and stay there, you’ve changed the system. If they snap back the second you stop watching, you had a good month — not a fix.
Oregon drops from 48 to 40 hours in 2027. New York ratchets down its cap every two years until it hits 40 in 2032. You want to hit those dates with your labor $/cwt and your people in a place where you’re choosing your next move, not having one forced on you.
Key Takeaways
- If your all‑in labor cost stays above about $4.00/cwt after a serious cleanup, treat that as a structural problem, not a bad year. University of Minnesota modeling suggests a 10% labor increase can slice roughly 15% off net income. At that level, “wait and see” is usually the riskiest strategy.
- If you can get that number under about $3.50/cwt and keep it there for 90 days, paying overtime to keep your A‑team together is a defensible choice. You’re buying consistency in your parlor instead of rolling the dice on constant turnover.
- If you’re between $3.50 and $4.00/cwt, you’re in the danger zone. You should be running the survival question — $2 milk drop, one key milker gone, 12 months — do we make it? — before doing anything else.
- If robots are on the table, don’t sign until you’ve modeled 7–10 years of cash flow at realistic labor savings and current interest rates. The 13% net‑return bump in the USDA report is real for many farms. So is the 7‑year cash‑flow valley Tranel’s numbers show.
- If you haven’t done a real milking routine training in the past year, that’s your cheapest 30‑day move. It’s a lot less expensive than signing a million‑dollar note or losing two of your best milkers because their hours got chopped.
The overtime laws aren’t going away. Oregon’s own economists are telling lawmakers dairy payroll will rise about 12%, and the state is moving ahead anyway. California is already at 40 hours across the board. New York has started its slow walk toward 40 by 2032. Washington’s workers went to Olympia to say the law cut their pay, and family farms like Sun‑Ton are still trying to make it work on their side of the fence.
So the real question for your farm isn’t whether any of this is fair.
Pull your last quarter’s timesheets. Calculate your true labor cost per cwt. Then ask yourself this — which version of your operation survives a $2 milk swing, a 40‑hour cap, and one key milker walking out the door?
That answer is your strategy. Everything else is just noise.
And if you want to see exactly how the robot‑versus‑labor numbers shake out at different herd sizes and milk prices — including why one 240‑cow family’s four‑robot proposal doubled their milking cost at $18 milk — we opened the full spreadsheet up for you here:
➡️ The Robot vs. Labor Spreadsheet: When $200,000 in Debt Beats $1 in Overtime — and When It Doesn’t
Complete references and supporting documentation are available upon request by contacting the editorial team at editor@thebullvine.com.
Learn More
- The $100,000 Winter Secret: How Systematic Dairy Farms Avoid Crisis Costs – Reveals how systematic management prevents five-figure labor and infrastructure drains. It delivers a blueprint for converting reactive chaos into a 1,800% ROI, ensuring you aren’t paying a “crisis tax” when labor availability is already at its thinnest.
- The $19 Milk Trap: How 2026 Prices Quietly Drain a 400‑Cow Dairy’s Equity – Exposes the structural price asymmetry that threatens mid-size herds as they face rising costs. It arms you with long-term positioning strategies to protect your equity before 2026 market resets decide your farm’s fate for you.
- April 2025 Production Data Exposes the Strategic Milk Allocation Revolution Reshaping Global Dairy – Breaks down how high-tech pioneers achieve 2.2 million pounds of milk per worker through surgical automation. It reveals the disruptive technologies that enable 15-20% productivity gains, fundamentally changing the labor math for forward-thinking producers.
 The Sunday Read Dairy Professionals Don’t Skip.
 The Sunday Read Dairy Professionals Don’t Skip.
Every week, thousands of producers, breeders, and industry insiders open Bullvine Weekly for genetics insights, market shifts, and profit strategies they won’t find anywhere else. One email. Five minutes. Smarter decisions all week.
