Archive for value-added dairy

$20 Milk, $19.14 Costs, 15.9¢ of the Food Dollar: Should You Chase Thunder CoffeeMilk-Style Value-Added?

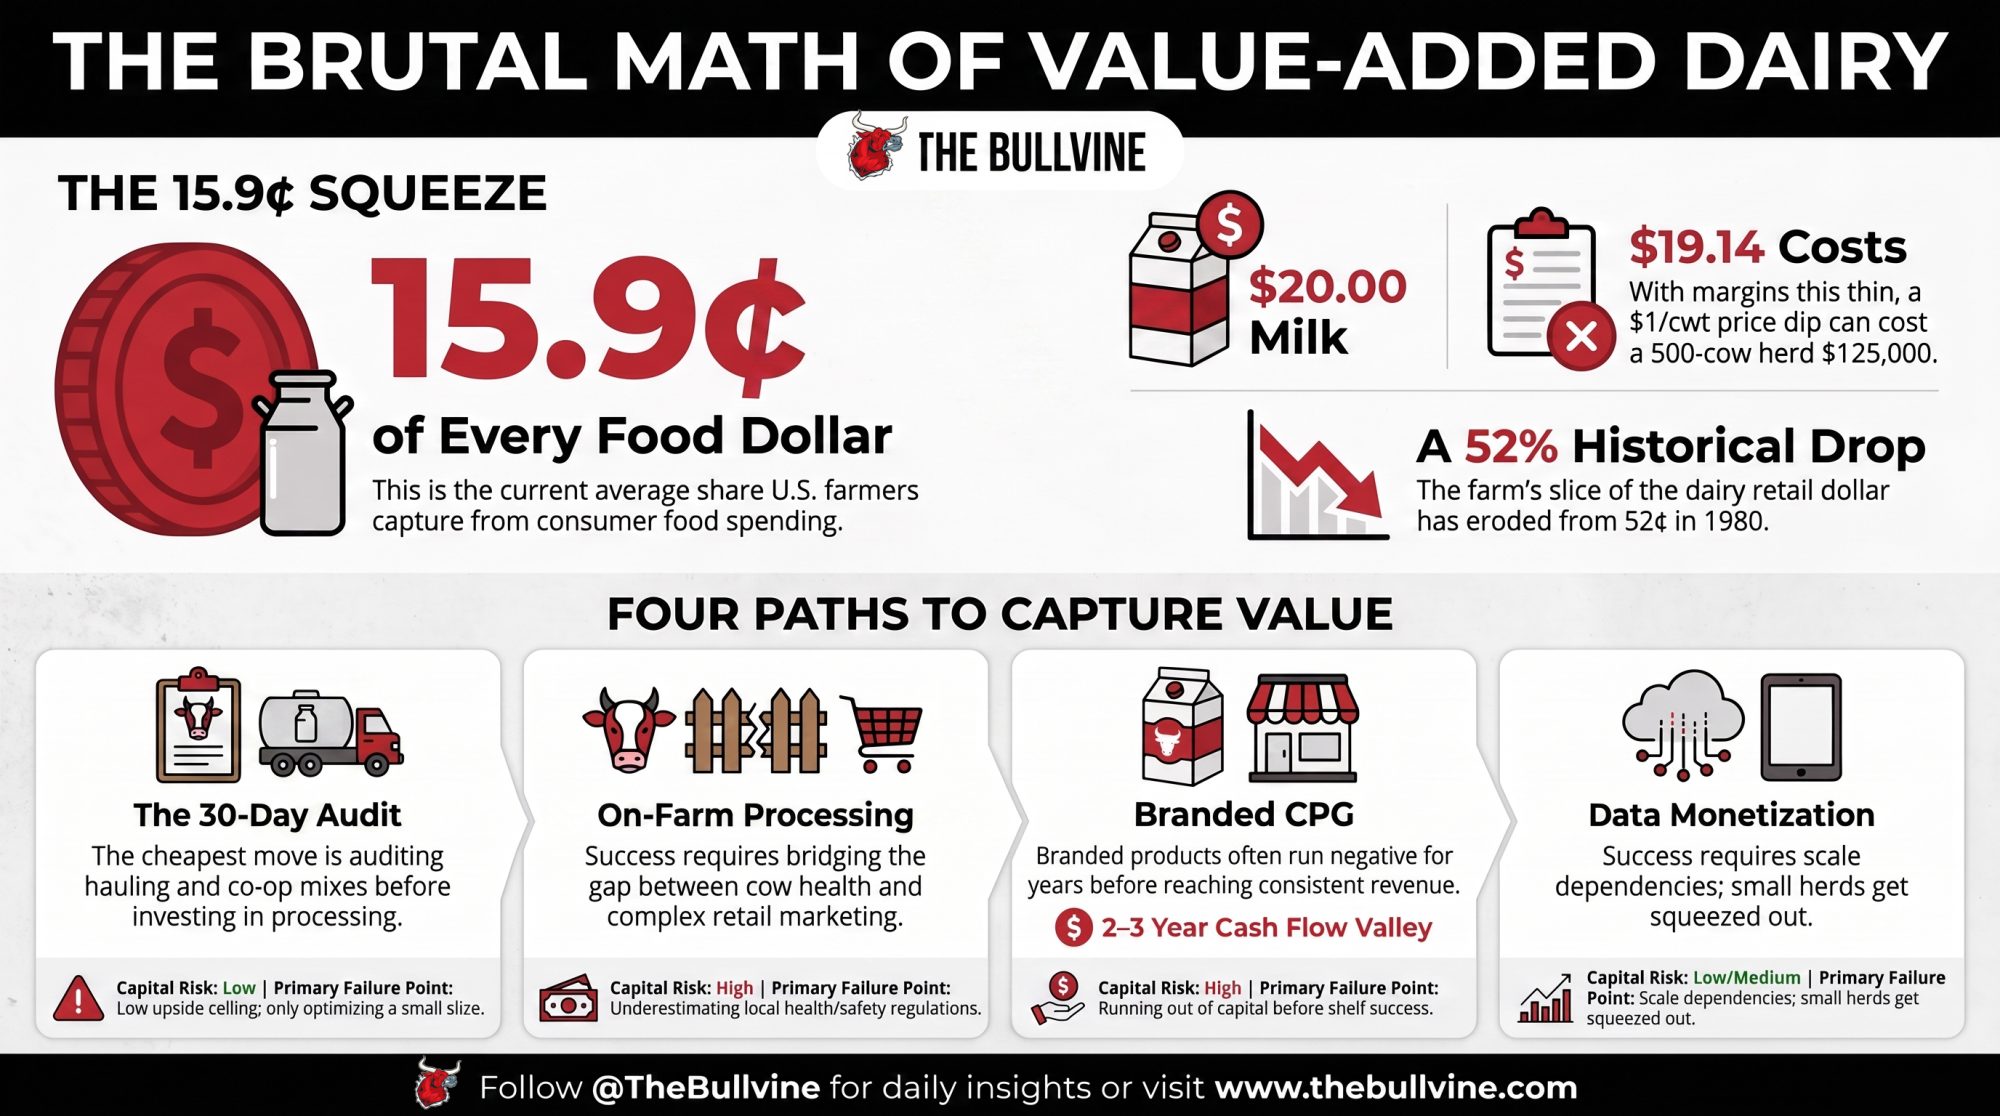
At roughly $20/cwt milk against $19.14 in full costs and just 15.9¢ of the food dollar, Thunder’s $40–50K months show both what’s possible — and how fast value-added can blow a hole in your cash flow.

Executive Summary: Two Florida dairy farmers built Thunder CoffeeMilk into $40,000–$50,000 a month — starting in a kitchen, driving 15 hours to a Michigan lab, and watching their first shelf-stable batch come out as a solid brick. The reason it matters to you has nothing to do with coffee: you get just 15.9¢ of every food dollar, and the dairy farm share has slid from 52¢ in 1980 to 25¢ today. At an all-milk price around $20/cwt against $19.14 in full costs, a lot of herds are running on fumes, and value-added looks like the way into the other 84¢. But the math is brutal — Thunder ran negative cash flow for two to three years, and if you’re bankrolling a brand off the same balance sheet that feeds your cows, a $1/cwt price dip is another $125,000 to absorb on a 500-cow herd. The piece lays out four real paths past 15.9¢ — branded CPG, on-farm processing, commodity optimization, and carbon/data monetization — and exactly where each one breaks. Read it if you’ve ever wondered whether your operation is built to capture value or just produce it. The 30-day move is the cheapest one: spend half a day auditing your hauling and co-op product mix before you fantasize about cans.
value-added dairy

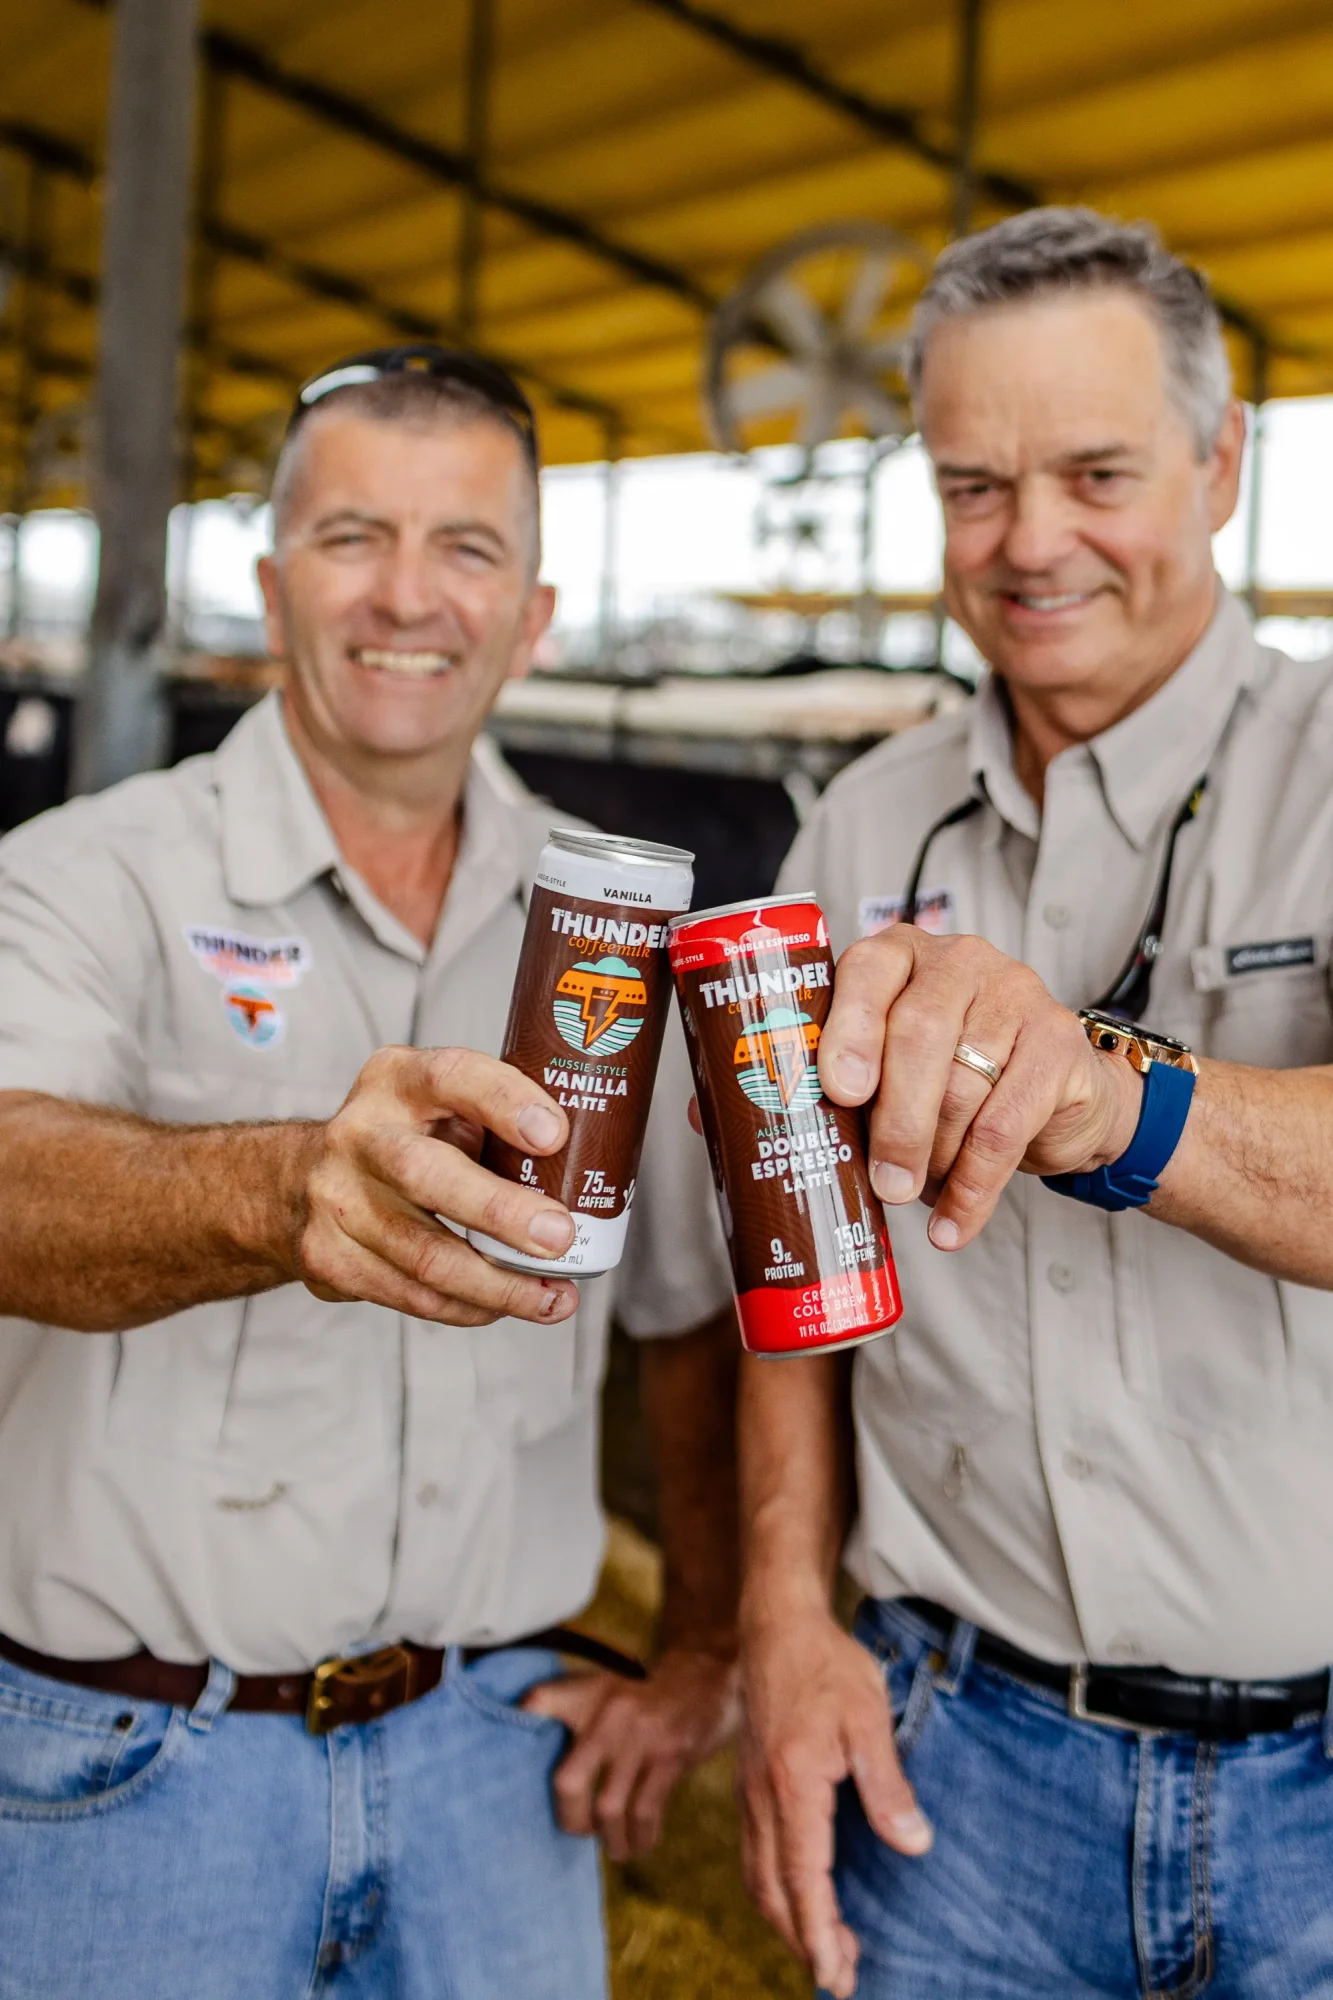
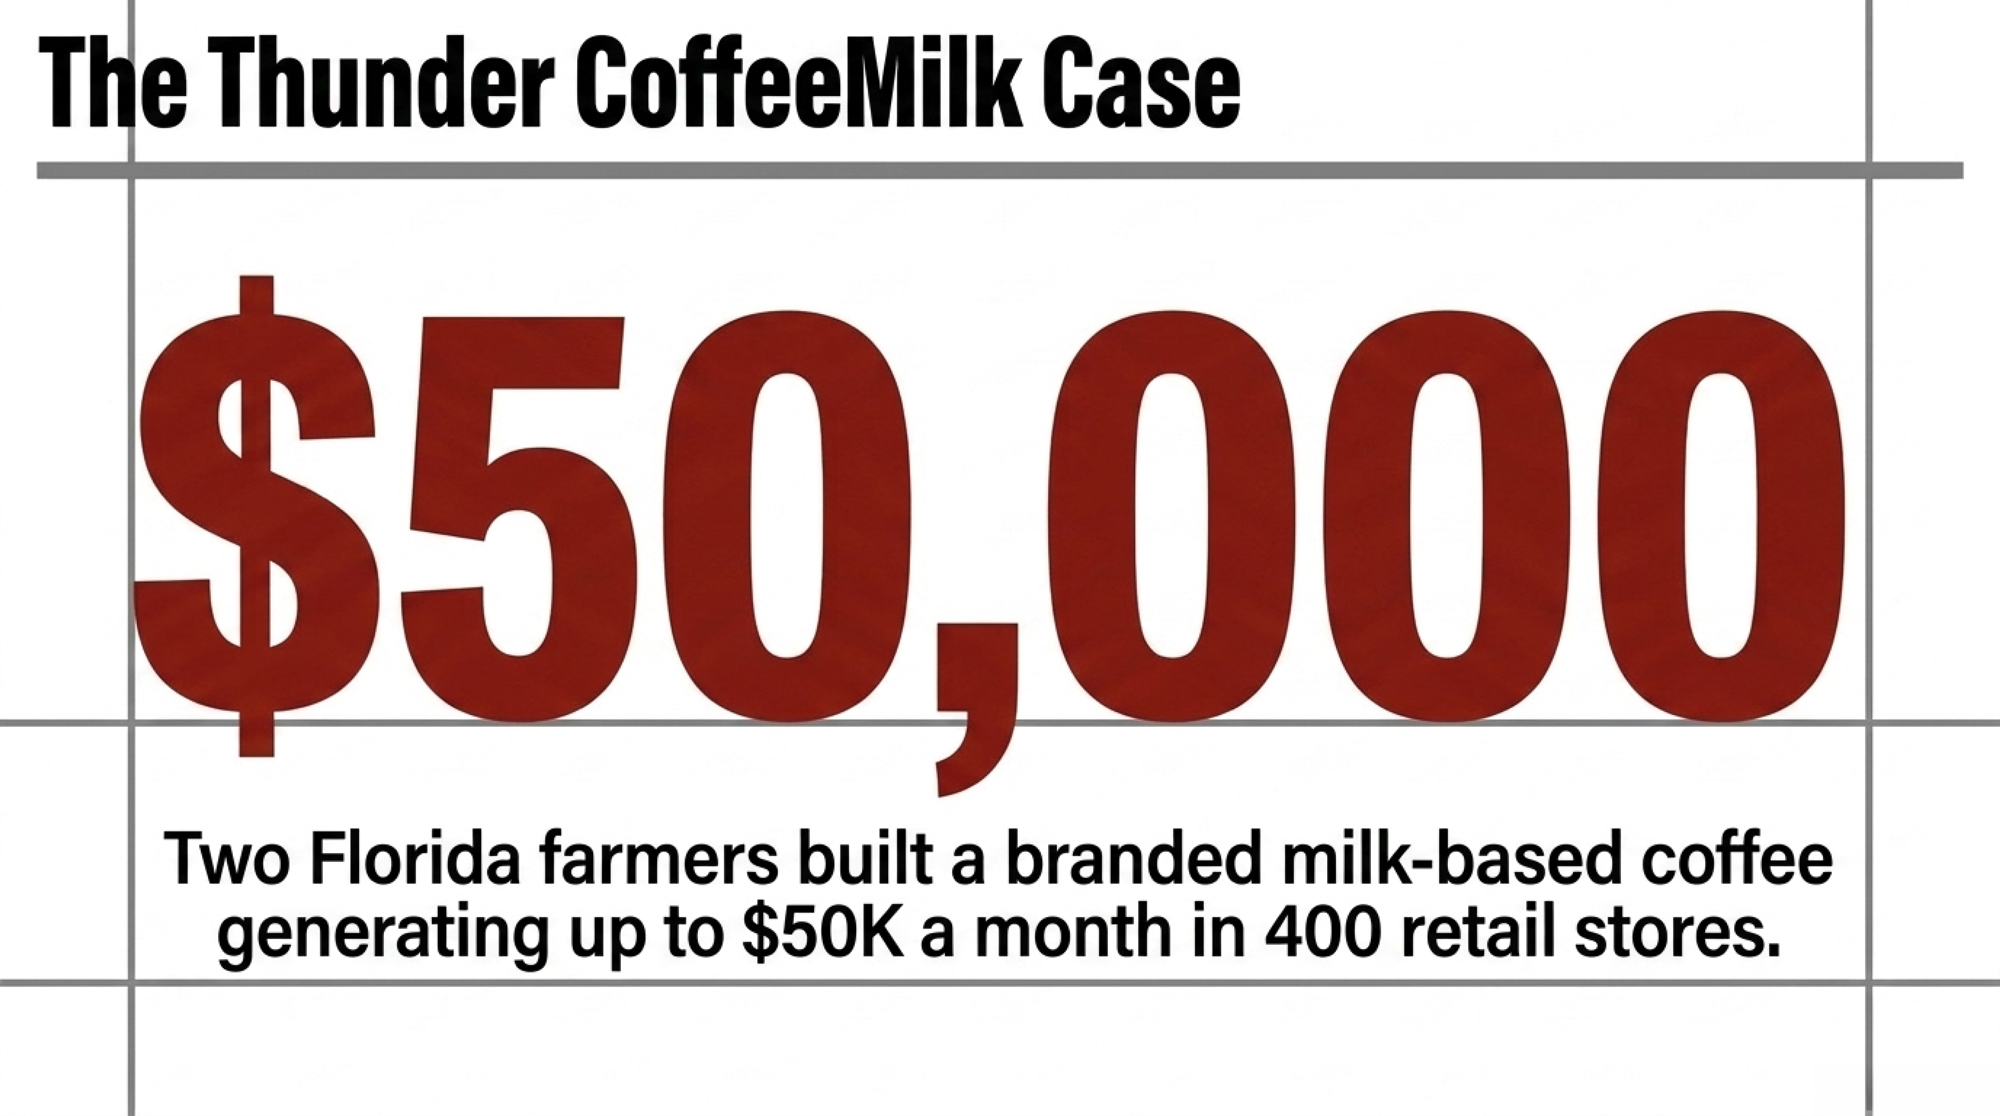
Dave Temple grew up on a dairy farm in Queensland, Australia, where milk-brewed iced coffee is the drink you grab without thinking about it. He moved to Florida, started his own farm, and went looking for that coffee on American shelves. It wasn’t there. So he and fellow multigenerational dairy farmer Ed Henderson decided to build it themselves, starting eight years ago in Ed’s kitchen (Entrepreneur, June 15, 2026).
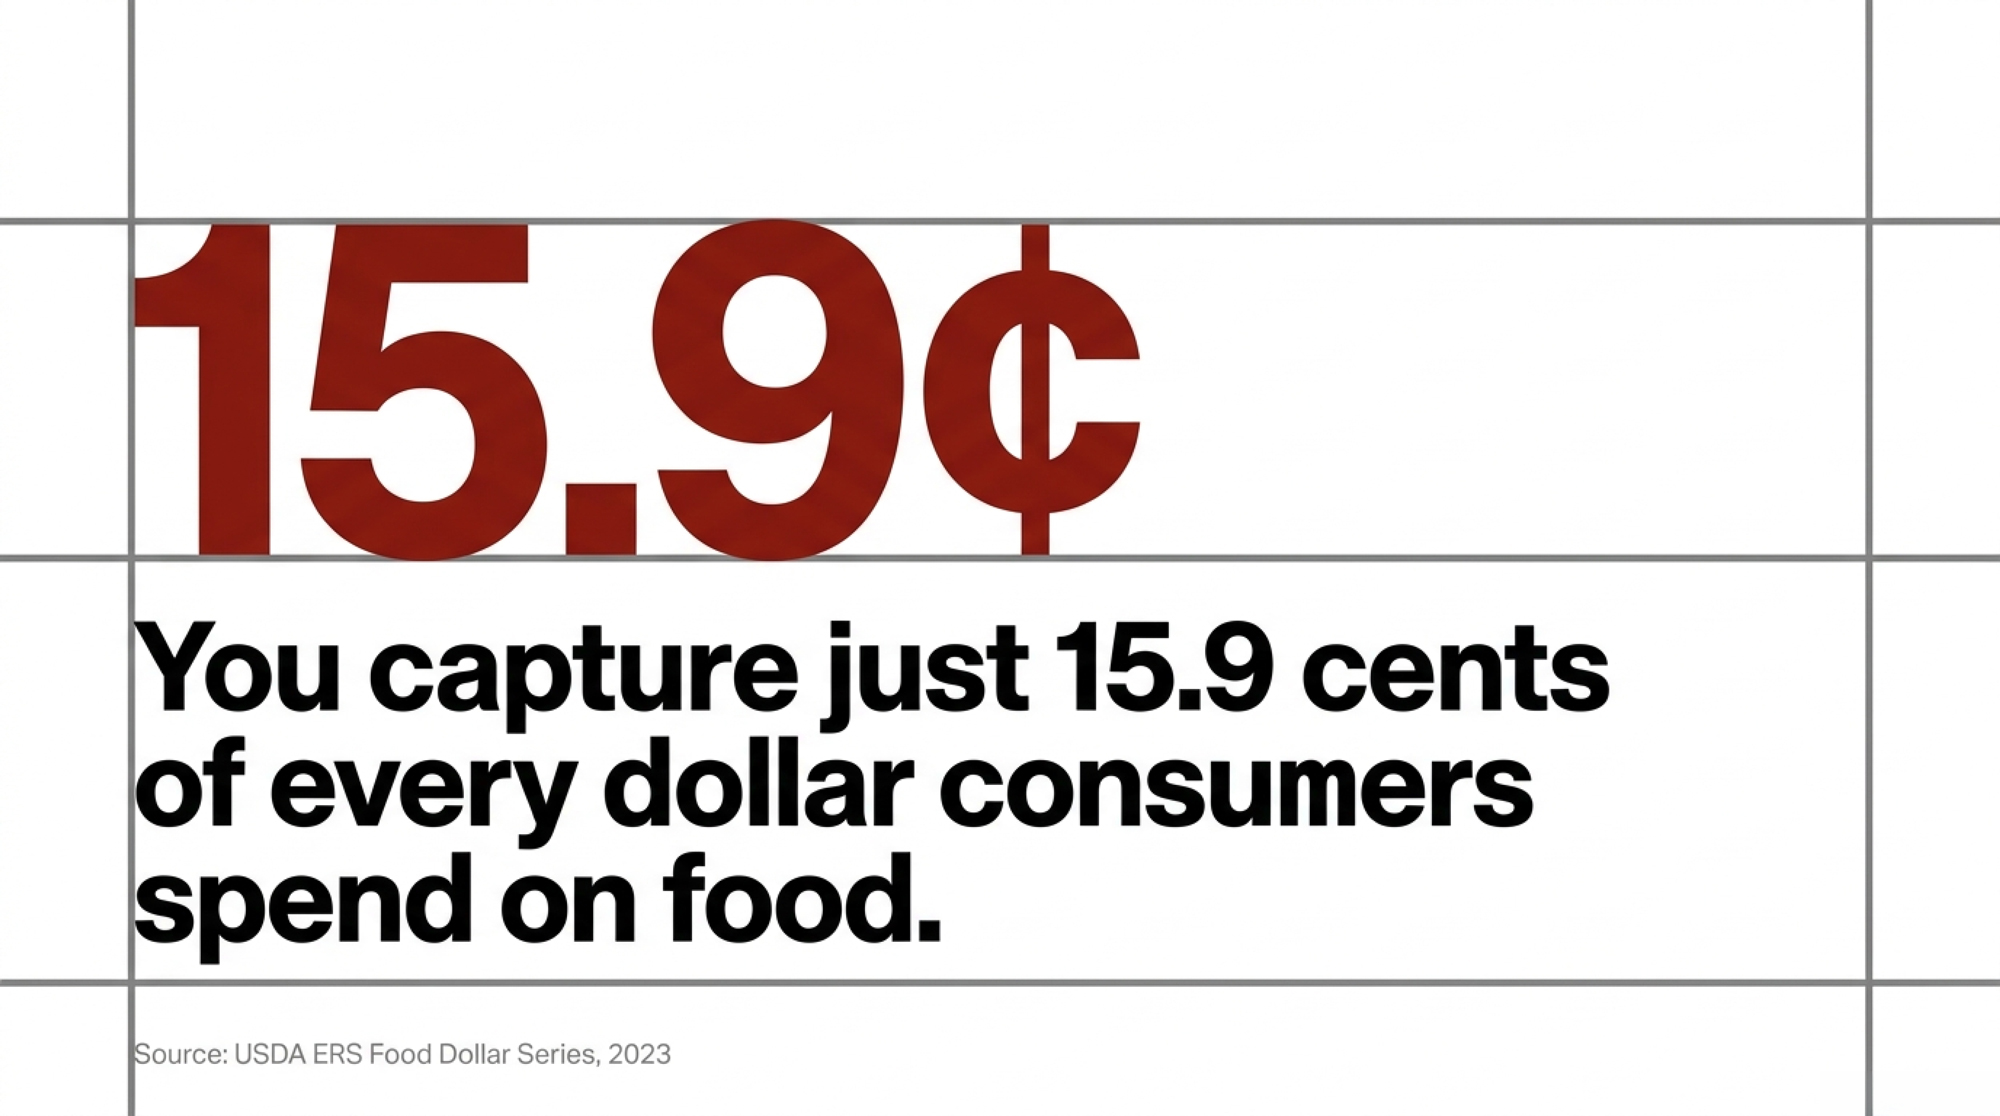
Their brand, Thunder CoffeeMilk, now moves $40,000 to $50,000 a month and rolled out across more than 400 select 7-Eleven stores in Florida when it launched. The numbers sound impressive until you stack them against what USDA says you get from the average food dollar. In 2023, U.S. farmers captured just 15.9 cents of every dollar consumers spent on domestically produced food (USDA ERS Food Dollar Series, 2023 data). That ceiling is the backdrop for what Temple and Henderson built — a value-added product that captures more of the retail dollar than raw milk ever will, one 11-ounce can at a time.
What’s Actually Squeezing the Farm Share
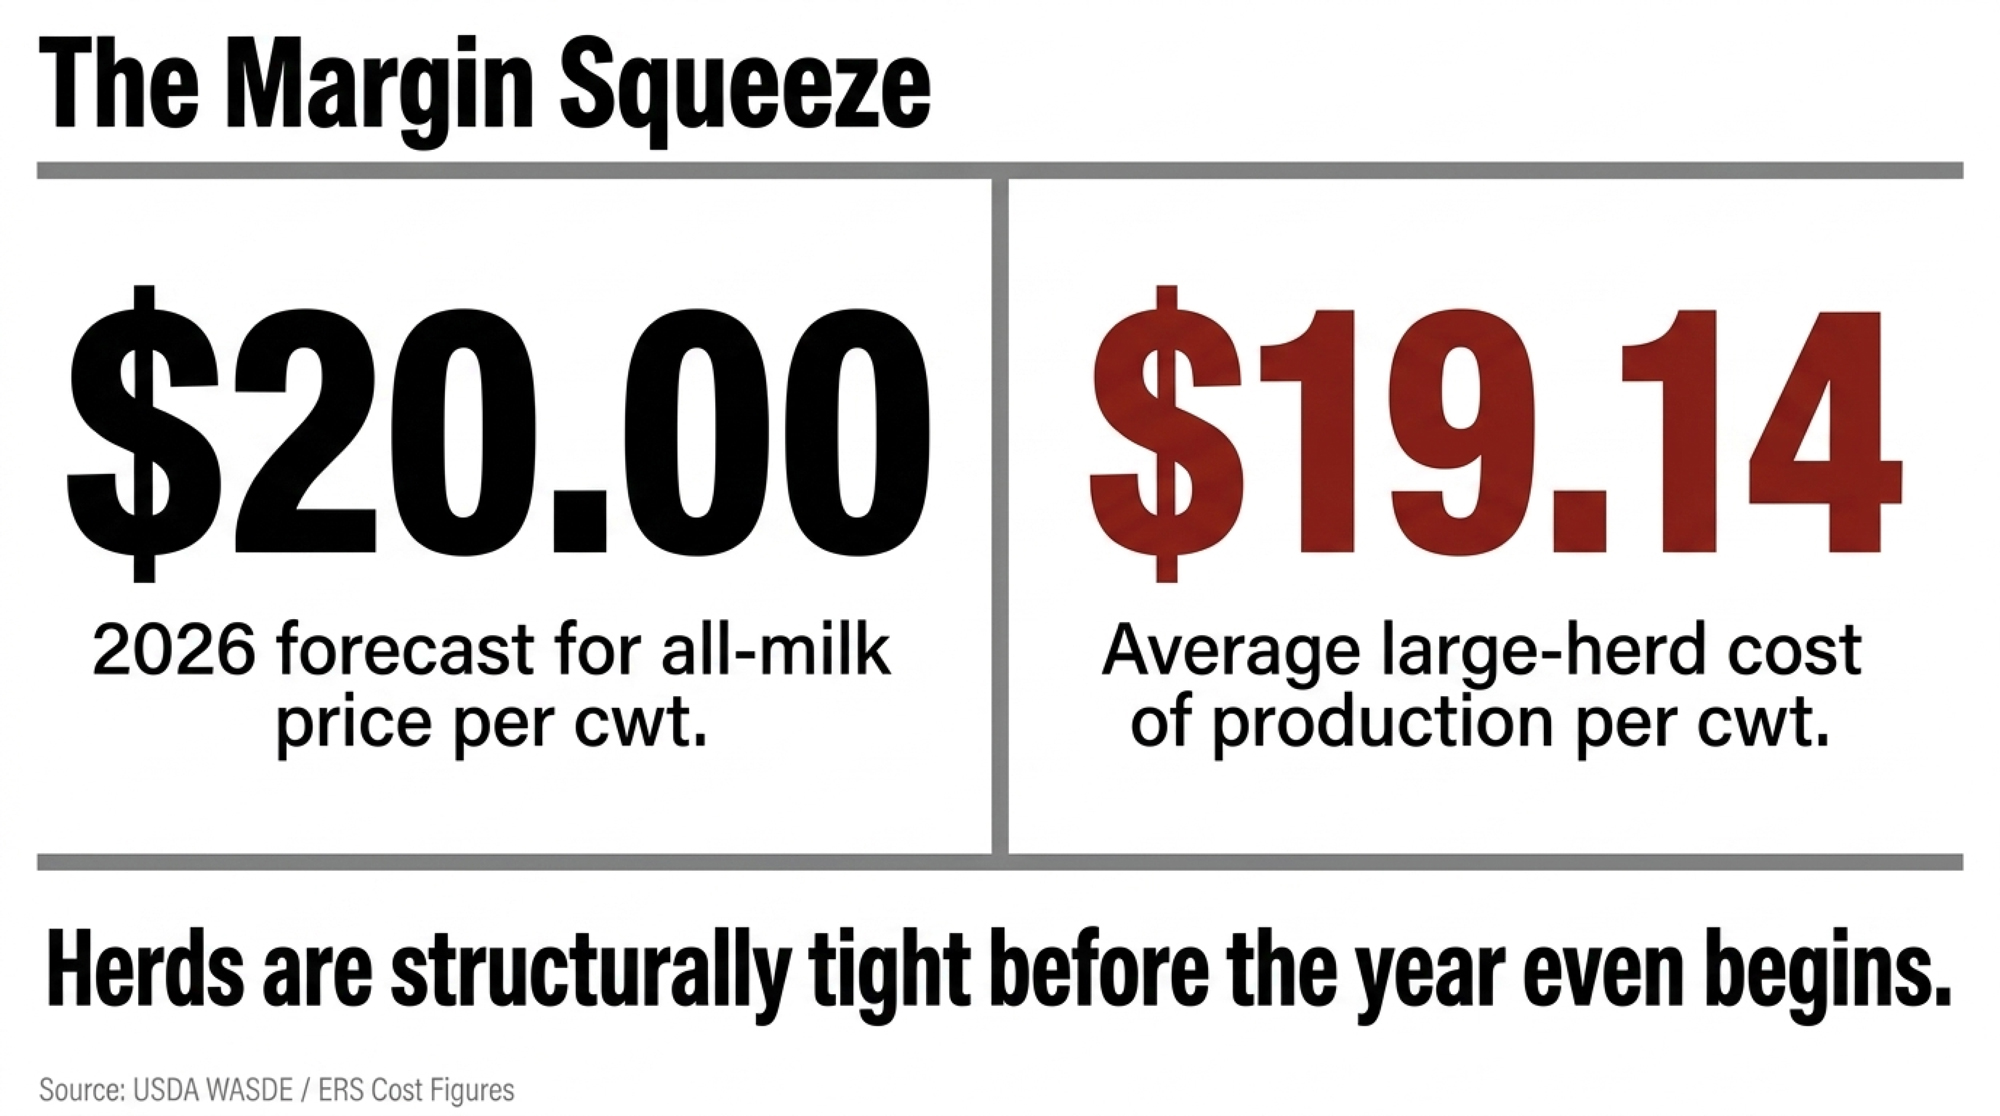
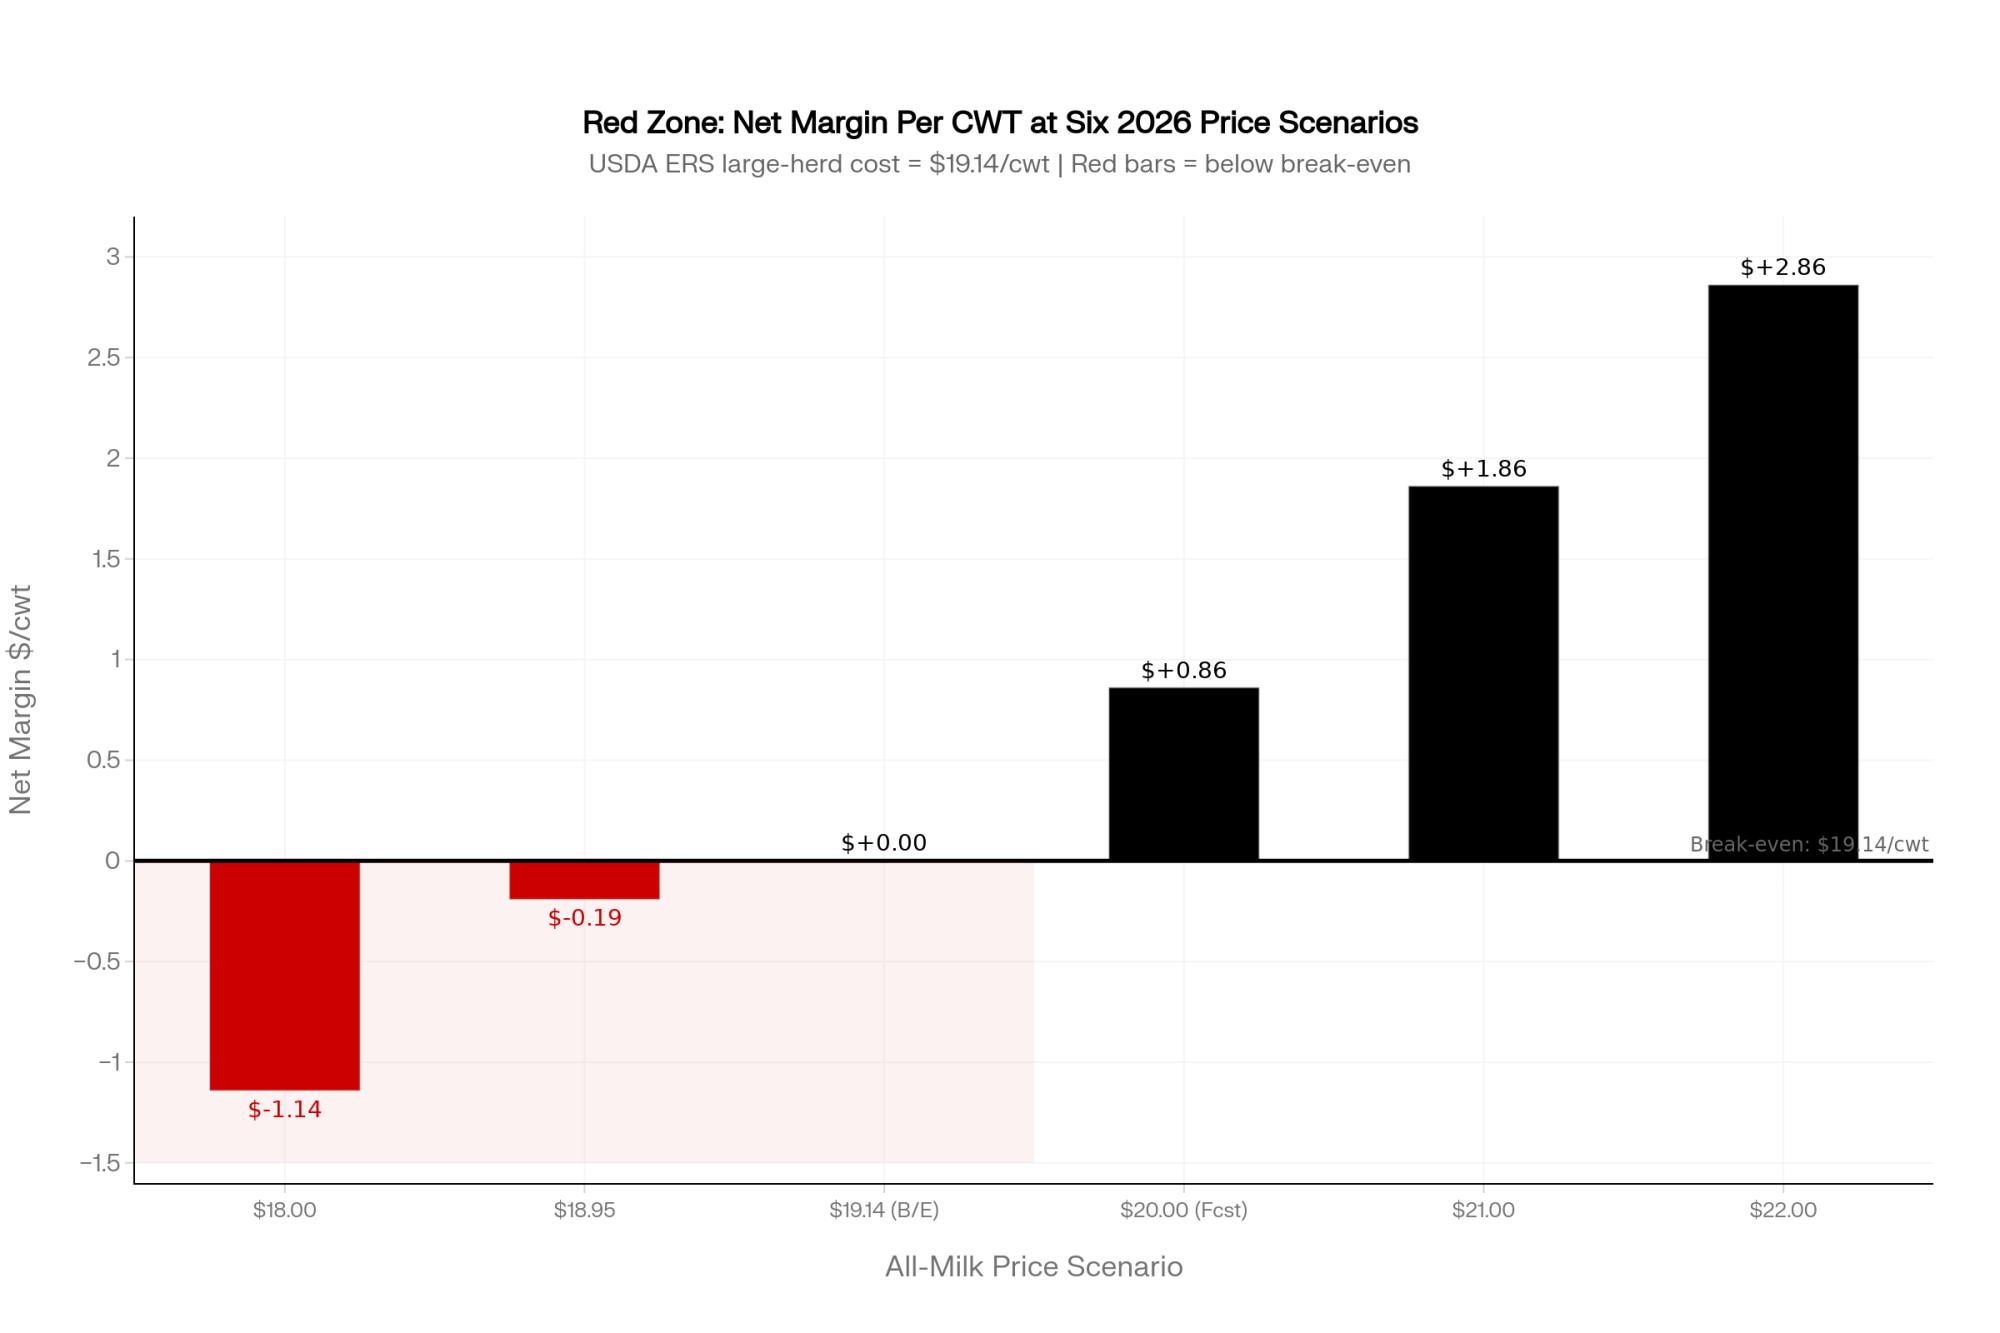
The old playbook was simple. Milk more cows, milk them cheaper, ship to the co-op, and pray the mailbox price covered your cost of production. In 2026, that math is harder to make work. USDA’s latest WASDE outlook has 2026 all-milk hovering around the $20/cwt mark, with 2027 pegged lower. ERS cost figures put average large-herd cost near $19.14/cwt, and the smallest herds run far higher — which is why plenty of dairies start the year structurally tight even when the price looks decent (The Bullvine, “$18.95 Milk, $19.14 Costs,” Feb 10, 2026).
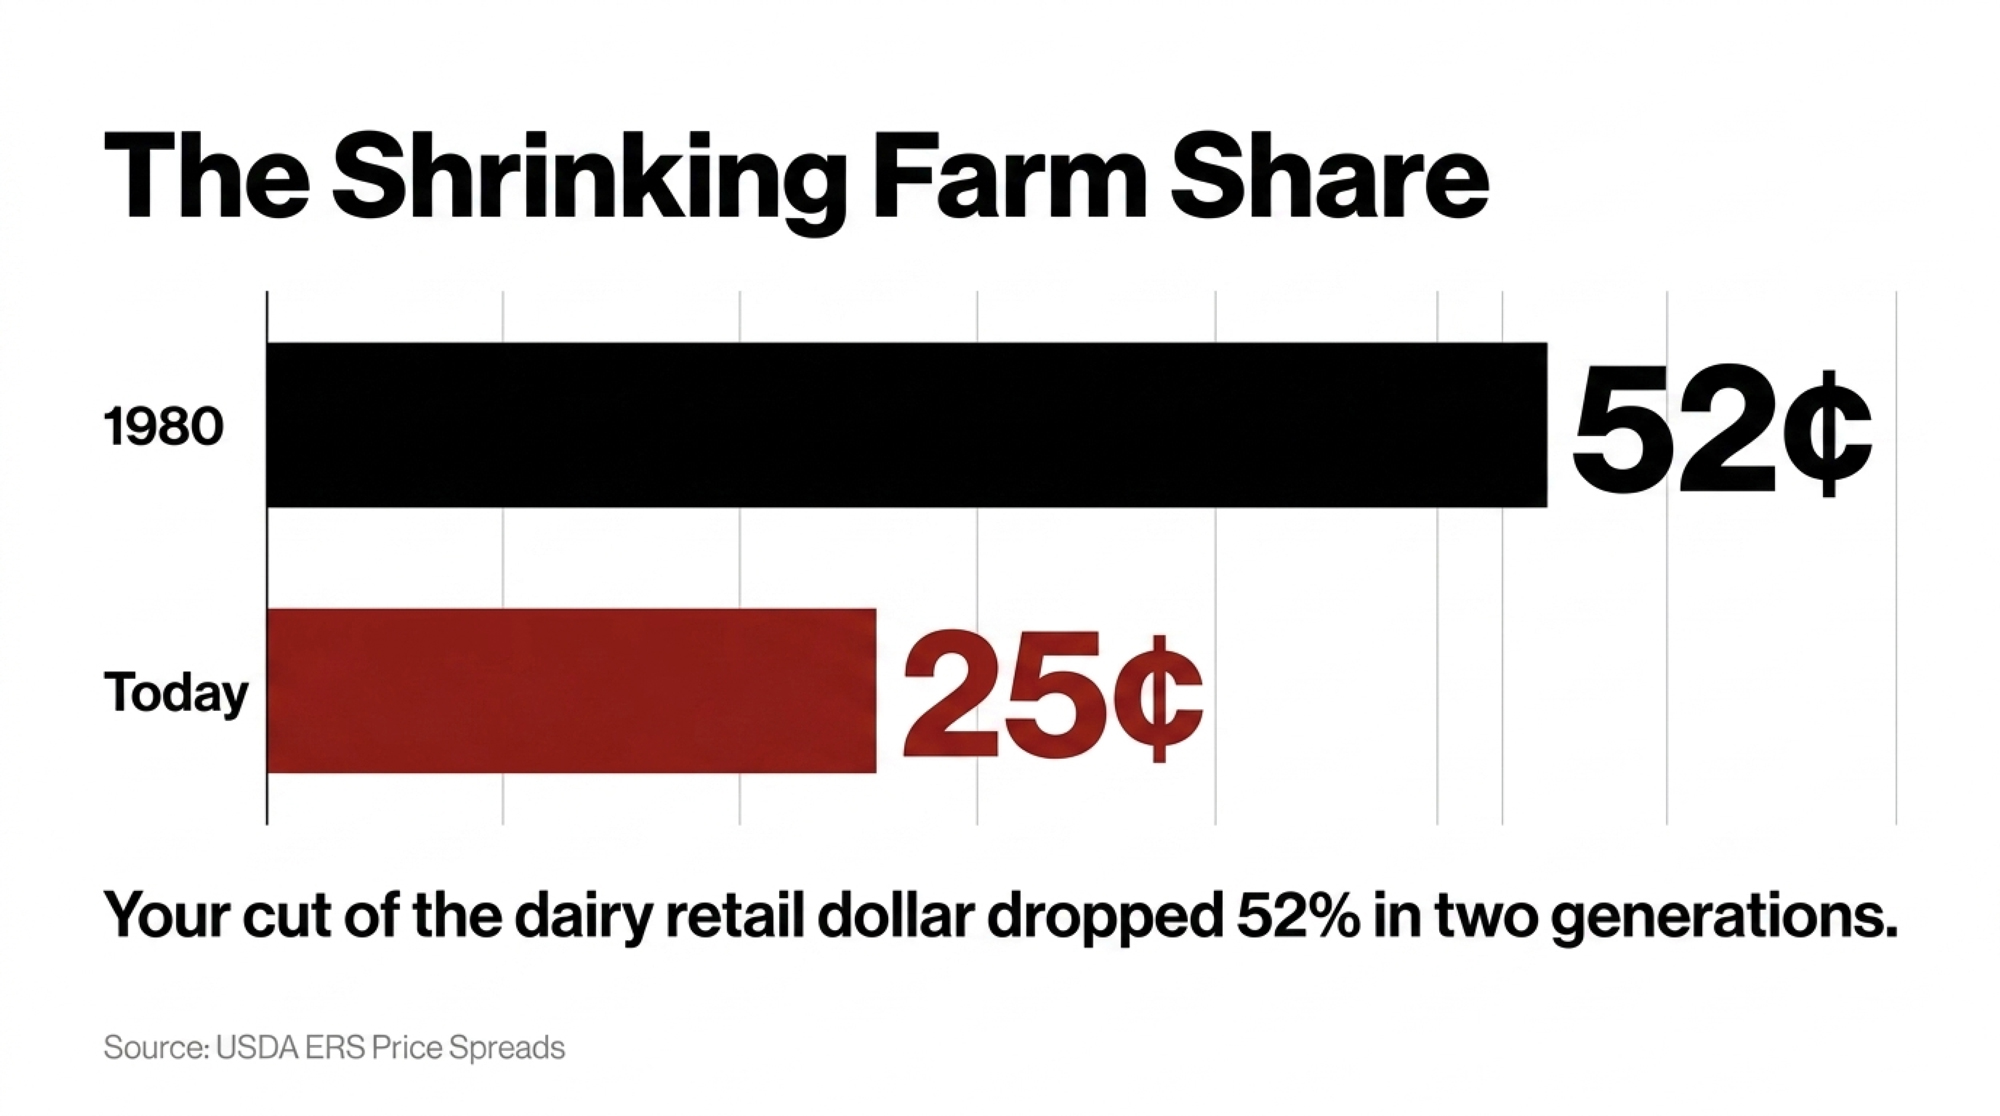
The farm’s slice of the dairy retail dollar has been eroding for two generations. It sat near 52 cents in 1980. USDA’s most recent price-spread data puts it around 25 cents today — the full decline from 52¢ to 25¢ is roughly a 52% drop over that span (The Bullvine, Dec 30, 2025, citing USDA ERS Price Spreads). Same cows. Same barn. A much thinner cut of the same gallon.
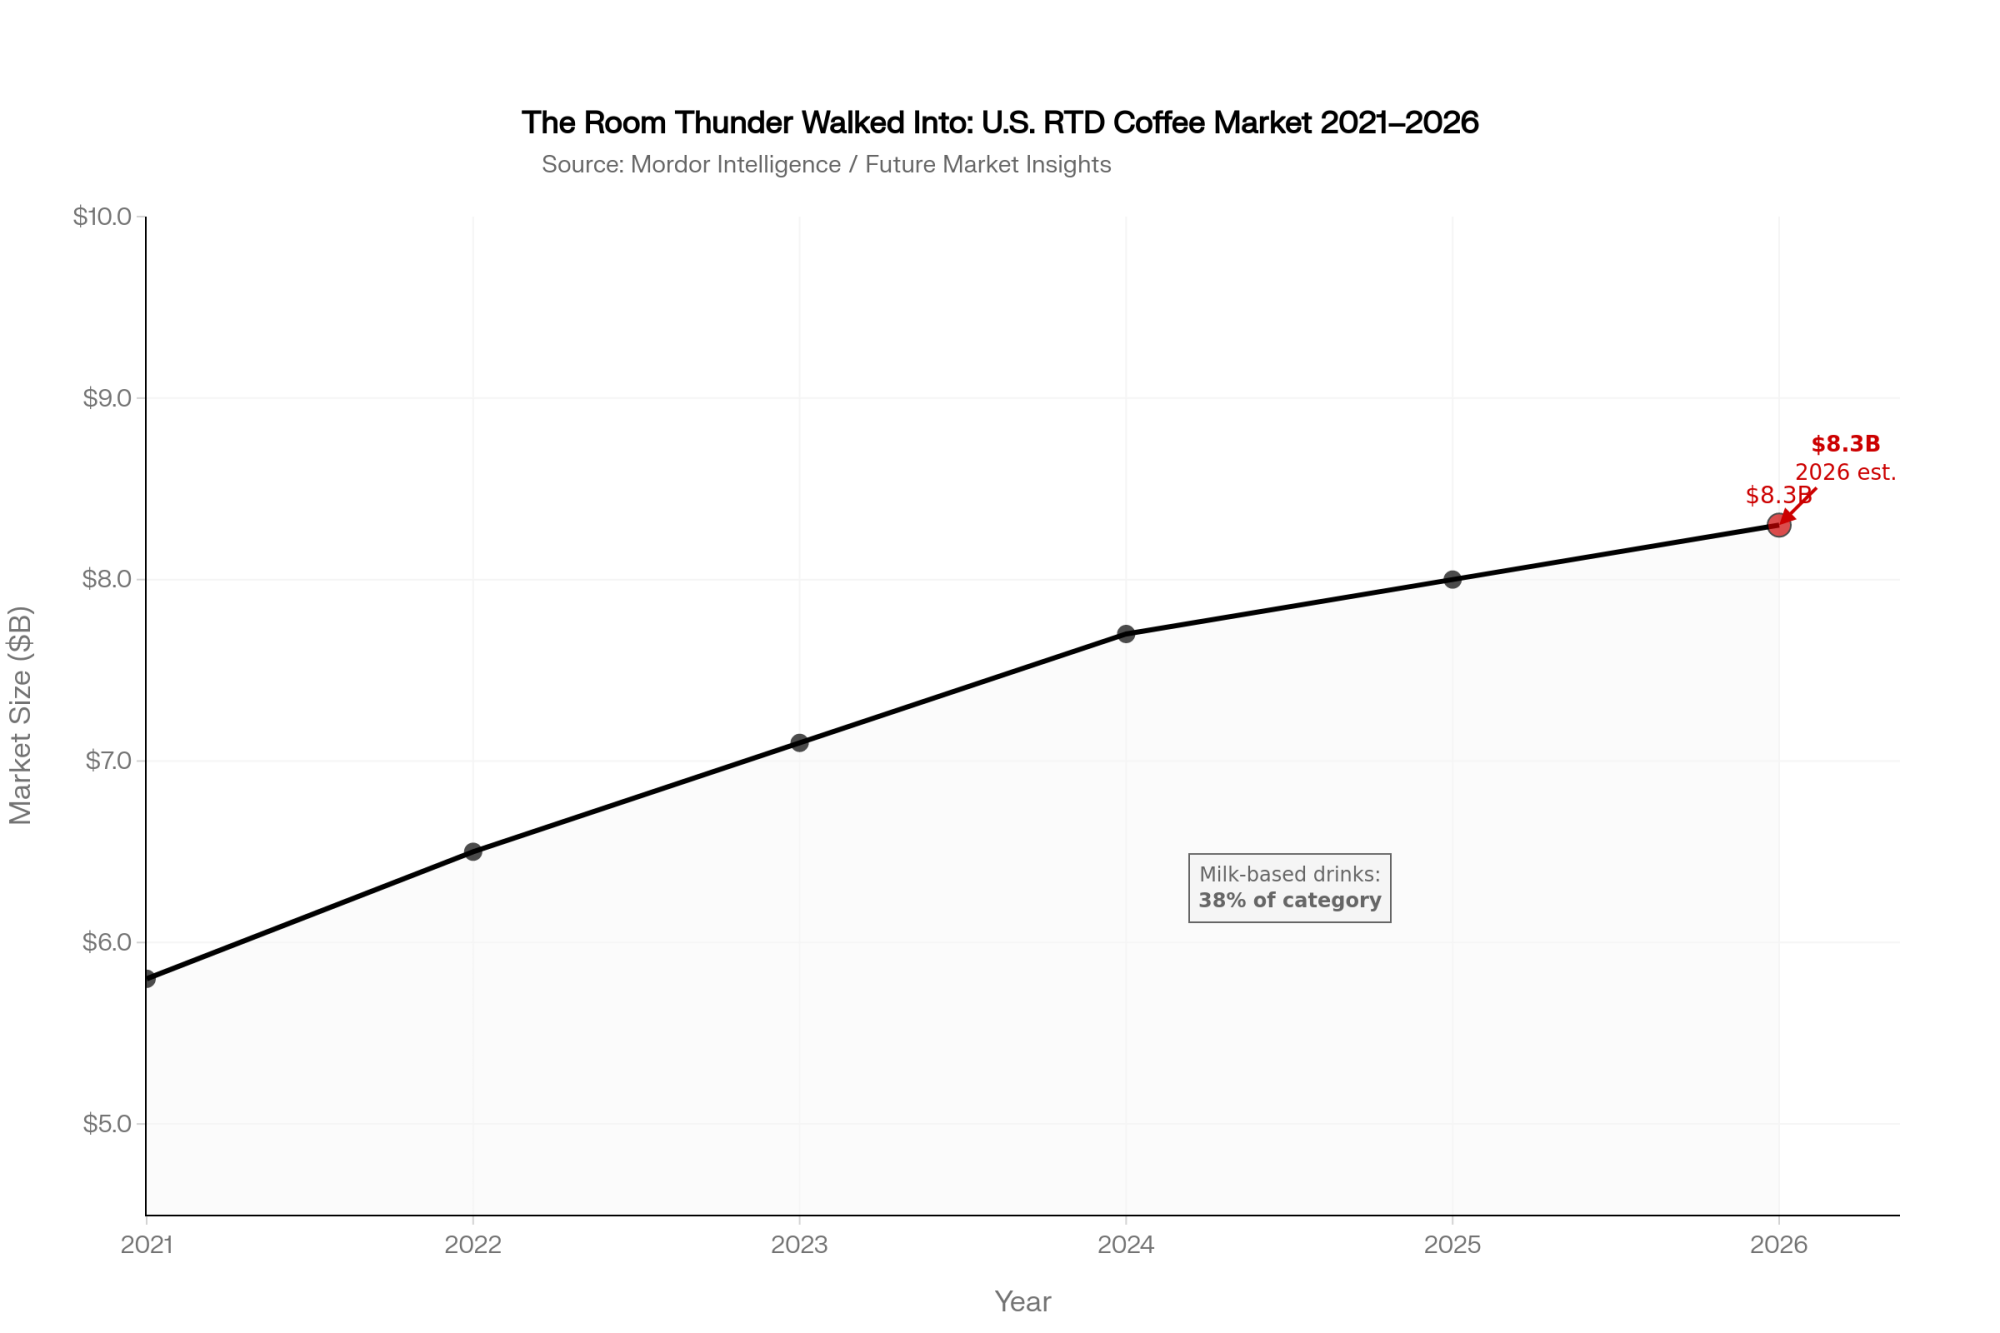
That’s the pressure pushing more farmers to look past the tank. Bullvine’s own analysis puts value-added dairy growth near 12% a year while commodity fluid milk stays roughly flat (Nov 24, 2025). And ready-to-drink coffee is one of the hottest rooms in that house — Mordor Intelligence pegs the U.S. RTD coffee market at about $8.3 billion in 2026, and Future Market Insights has milk-based drinks leading the category at 38% (May 2026). Temple and Henderson didn’t chase a fad. They walked into a growing category and noticed most canned coffee is brewed in water, with milk added as an afterthought. Their whole thesis was to flip that — brew the coffee in real milk from the start.
The Solid Block: What It Costs to Cross the Fence

Picture it: two dairy farmers, fifteen hours from home, standing in a food-processing lab at Michigan State University’s Food Processing Innovation Center, watching their first shelf-stable run come out of the machine. Except it didn’t pour. It thudded. The whole batch had seized into a solid block — not a drink, a brick (Entrepreneur, June 15, 2026). That brick is the whole story of value-added dairy in one image.

They spent two days on-site reworking the recipe before they could move forward. And here’s the honest part they’ll tell you themselves: neither had a background in sales, marketing, or distribution. Just decades of farming and a willingness to keep asking questions until they found the right people.

That solid block is worth more than a laugh. It’s the tuition receipt for crossing from commodity supplier to manufacturer. Inside the fence, these two can diagnose a sick cow or a broken ration in seconds. Step outside it into protein chemistry and shelf-life validation, and none of that instinct transfers. You’re back at square one. The failure wasn’t a fluke — it’s what the leap actually feels like. A 2024 Tarleton State University review names limited business and technical expertise, plus thin access to processing infrastructure, as core barriers stopping small U.S. dairy farms from making exactly this kind of move (Tarleton State University, Dec 22, 2024).

How This Plays Out on a Real Balance Sheet
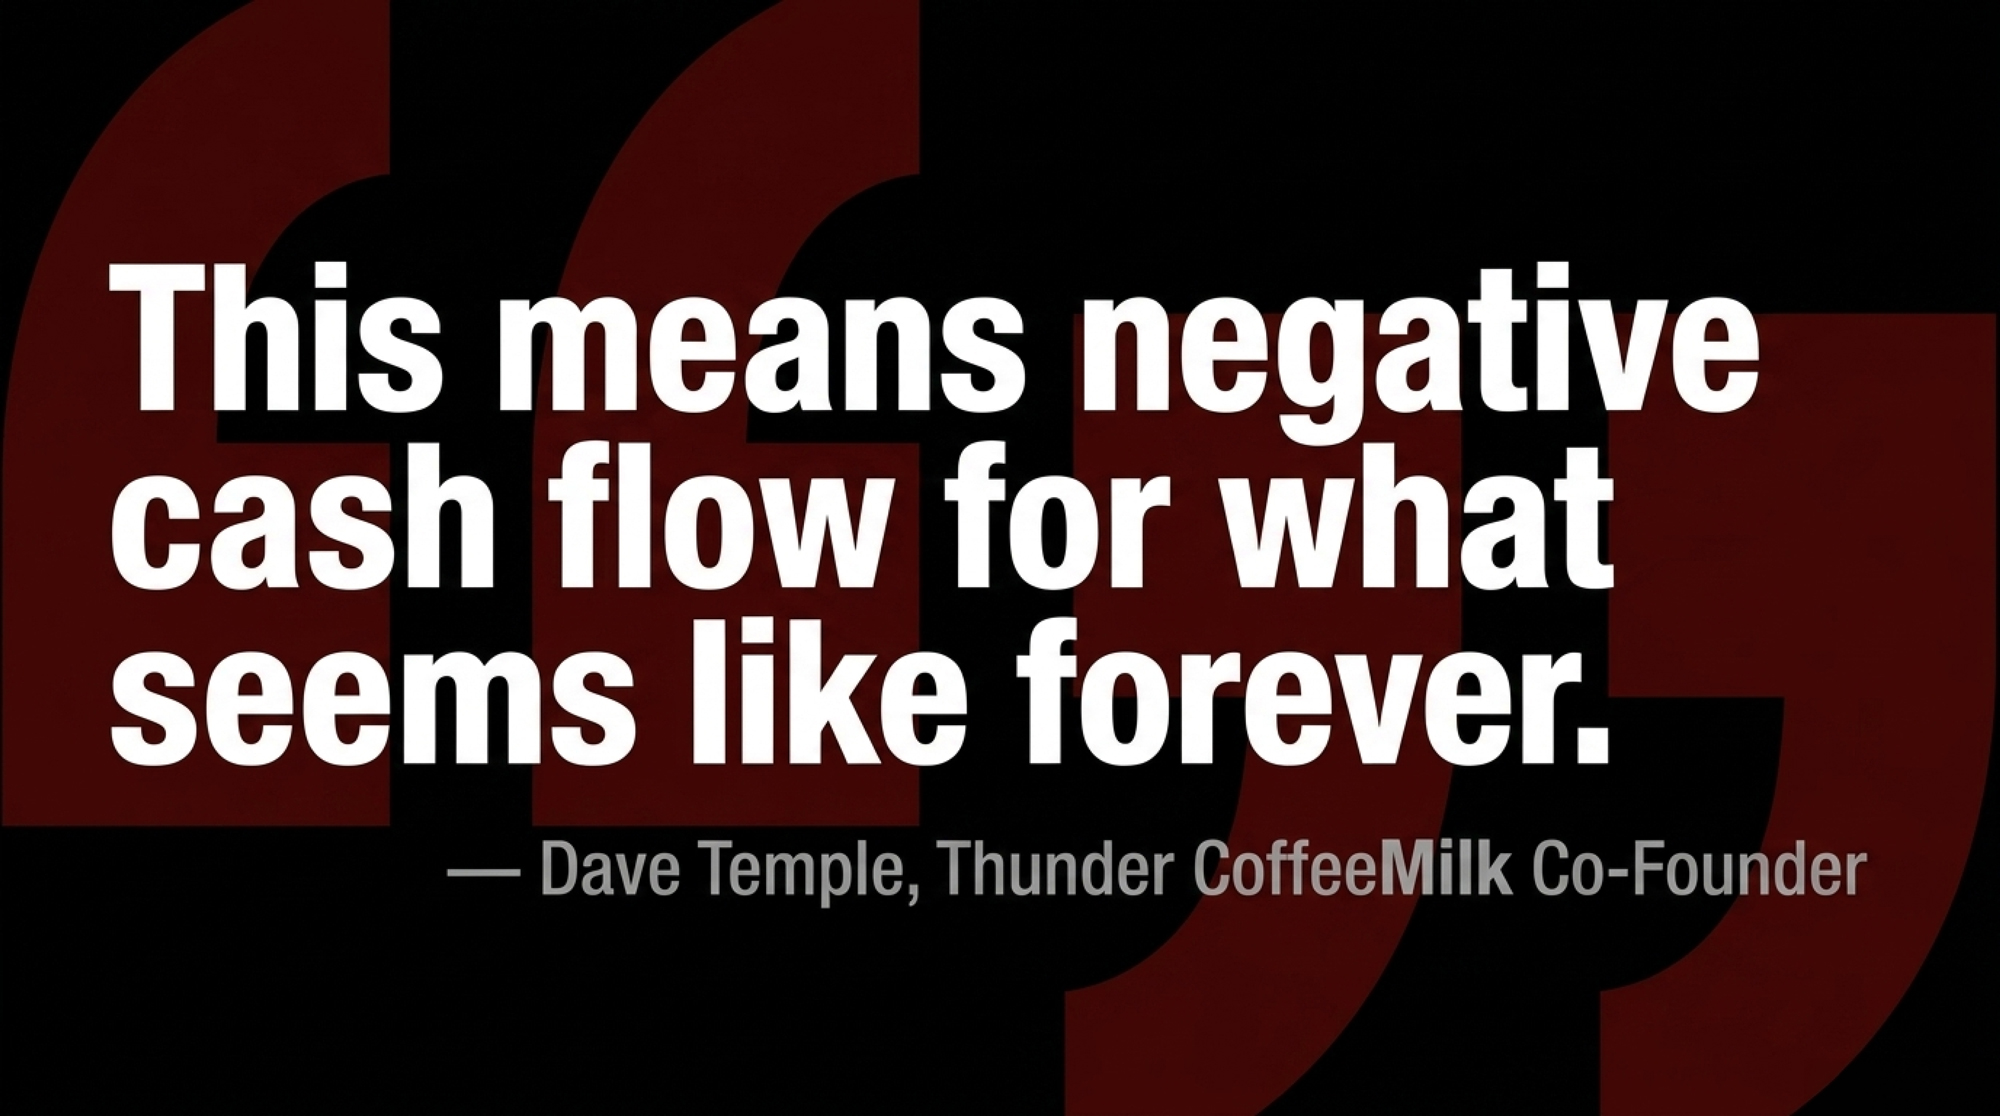
The line from Dave that should stop any producer cold is about retail, not chemistry. “For us to get our toe in the door, it has cost a large amount of money to effectively buy space to get our product in stores,” he told Entrepreneur. “This means negative cash flow for what seems like forever.” That’s not a Silicon Valley runway story with venture money padding the fall. That’s an operating line feeding cows and buying shelf space at the same time.
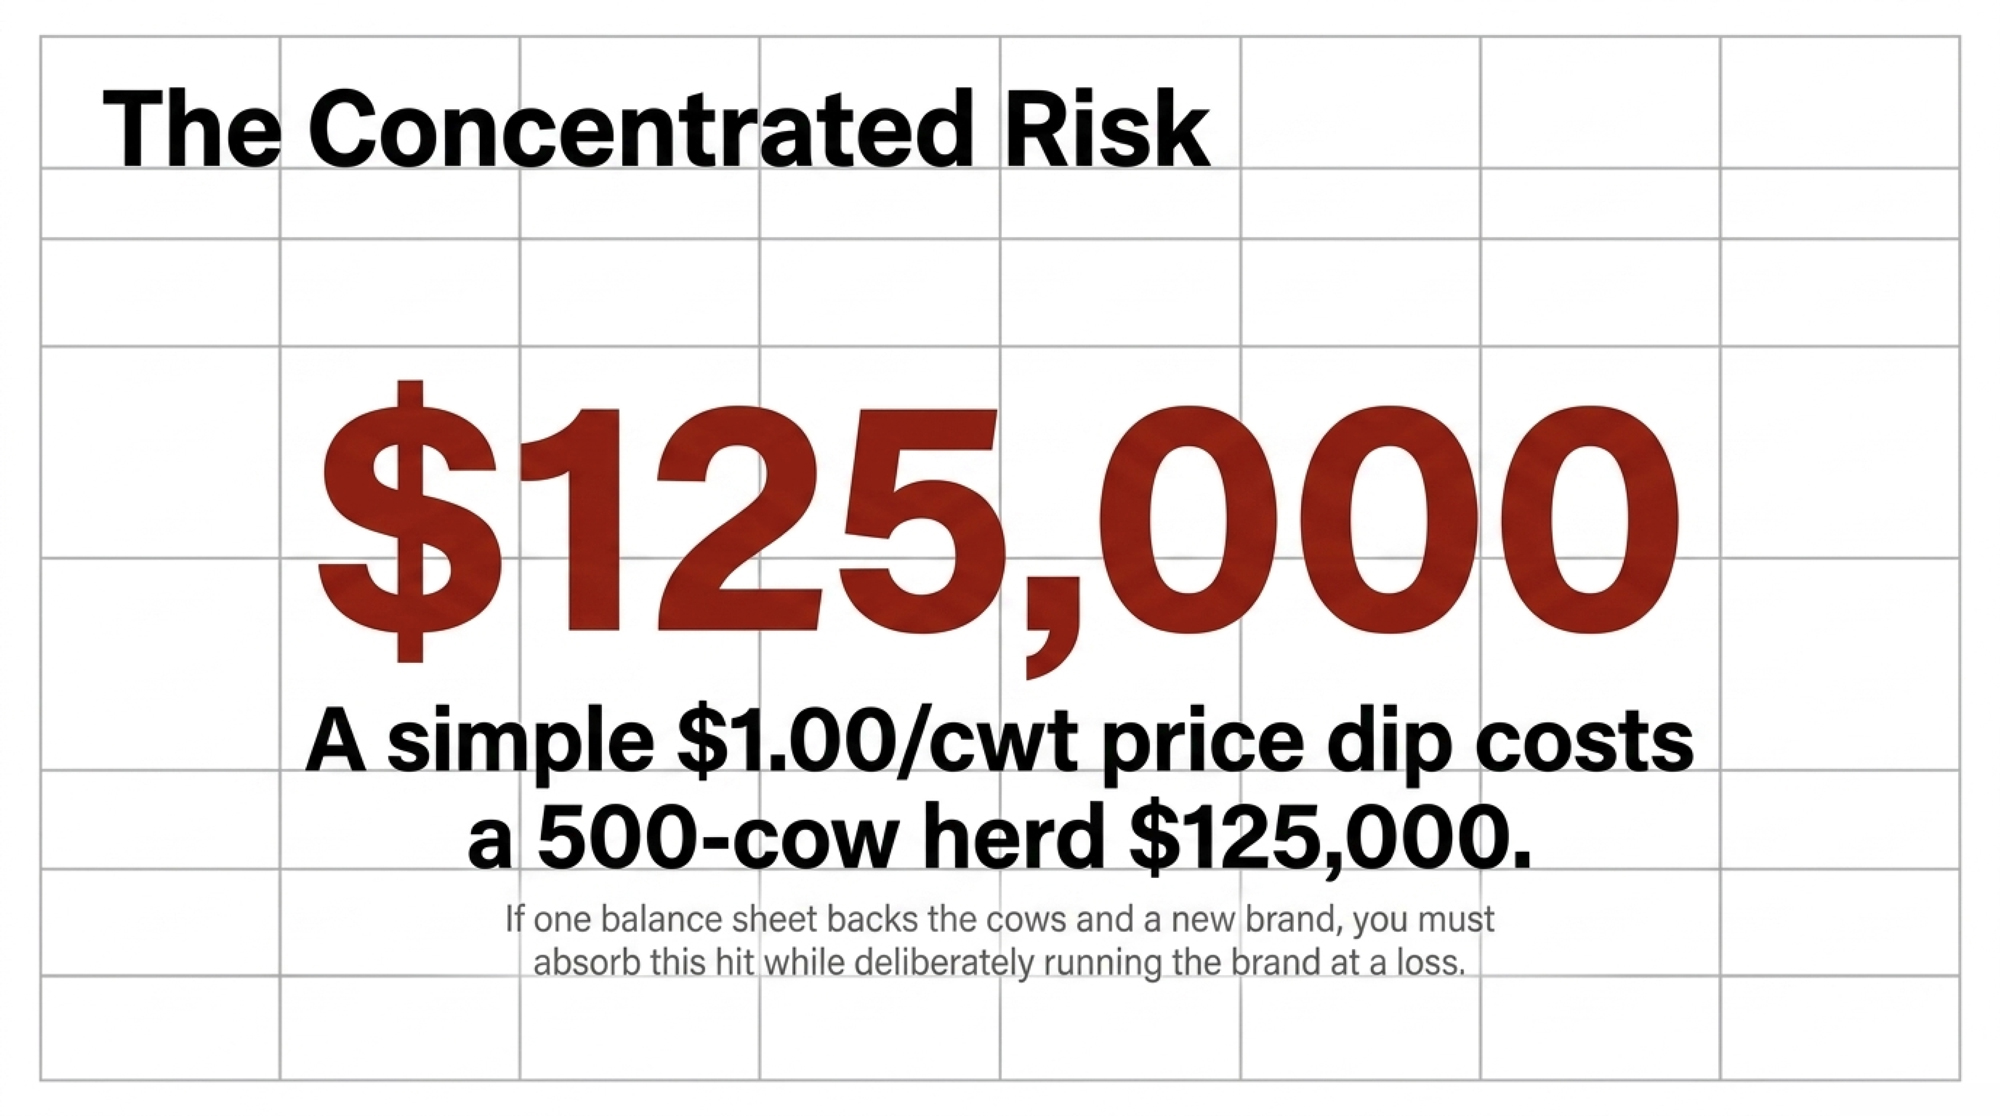
Put real numbers on the milk side first, because that’s the floor this whole bet stands on. Take a 500-cow herd averaging around 25,000 lb per cow — call it 125,000 cwt a year. A $1.00/cwt swing in your mailbox price — well within the range USDA has moved its 2026 forecast this year alone (from $18.95 in February toward the low $20s by mid-year) — is $125,000 in cash flow, up or down, across twelve months. Run lighter cows at 22,000 lb, and you’re closer to $110,000, but the point holds either way. That’s the sensitivity before you add a thing — then you stack a second business on top, one you’re deliberately running at a loss to hold a cooler slot.

Herd SizeAvg Production (lbs/cow)Annual CWT ProducedImpact of $1/cwt SwingImpact of $2/cwt SwingMargin Note
100 cows25,000 lbs25,000 cwt$25,000$50,000Modest swing — still can’t absorb brand losses
250 cows25,000 lbs62,500 cwt$62,500$125,000One bad year = value-added runway gone
500 cows25,000 lbs125,000 cwt🔴 $125,000$250,000Article benchmark — two ventures, one balance sheet
750 cows25,000 lbs187,500 cwt$187,500$375,000Enough scale to potentially isolate ventures
1,000 cows25,000 lbs250,000 cwt$250,000$500,000Scale helps but concentrated risk remains high
1,500 cows22,000 lbs330,000 cwt$330,000$660,000🔴 Large exposure — separate entity structure essential

Here’s the retail side in plain barn terms. For example, say you sell a can wholesale for around a dollar and it costs you 70 cents to make and ship — that’s 30 cents of gross margin per can. Slotting fees, demos, and marketing to hold shelf space in a category run by recognized brands can eat into five figures per chain, per year. At 30 cents per can, you’re moving tens of thousands of units just to cover the cost of being on the shelf — before you clear a dime. That’s the arithmetic hiding inside “negative cash flow for what seems like forever,” and it’s why it took Thunder two to three years to reach consistent monthly revenue. (Those per-can figures are illustrative; Thunder hasn’t published its unit economics.)

Why Is the Farm’s Slice So Thin to Begin With?

Most of the value in food gets built after the product leaves the farm gate. USDA’s Food Dollar data assigns more than 88 cents of every consumer food dollar to the “marketing bill” — processing, packaging, transportation, retail, and food service. A farmer selling raw milk into that system is, by design, holding the smallest slice on the table. In 2024, the all-food farm share slipped to 11.8 cents, with only about 5.8 cents representing true farm-level value added (American Farm Bureau, citing USDA ERS, 2024).

Ed Henderson framed the real barrier better than any economist could. Marketing, he said, is “a feeling. I’m not a feeling kind of guy.” That’s the whole problem in one sentence. Deep expertise inside the fence can turn into a blind spot outside it — you don’t know what you can’t see.

But that same trap cut in their favor once. Not knowing the “proper” RTD formulation rulebook, they built the simplest version that survived the science: cold brew, real milk, a short ingredient list, no artificial sweeteners. Their one stated regret is not bringing a food scientist in earlier. Yet that clean label — the thing shoppers now reward — may exist precisely because two farmers didn’t over-engineer a product they were still learning to make.

Which Path Actually Fits Your Balance Sheet?

Thunder isn’t a template you can photocopy. It’s proof the staircase exists. There are four real paths producers are using to reach past 15.9 cents — and each one breaks in a different, predictable place. Find yours before you commit a dollar.

Strategy PathCapital RiskTime to Positive Cash FlowPrimary Skill GapPrimary Failure PointBest Fit Herd Size
Branded CPG(Thunder path)🔴 High — multi-year negative cash flow2–3 yearsMarketing, slotting, CPG brokersRunning out of capital before shelf velocity covers feesAny — if balance sheet is isolated from farm
On-Farm Processing(cheese/bottled)🔴 High — infrastructure upfront3–5 yearsRegulatory compliance, local salesUnderestimating health/safety compliance cost100–500 cows with local market access
Commodity Optimization(hauling/co-op audit)✅ Low — no new entity30–90 daysInternal ops, premium program knowledgeLow ceiling; optimizing a small sliceAll herd sizes — start here
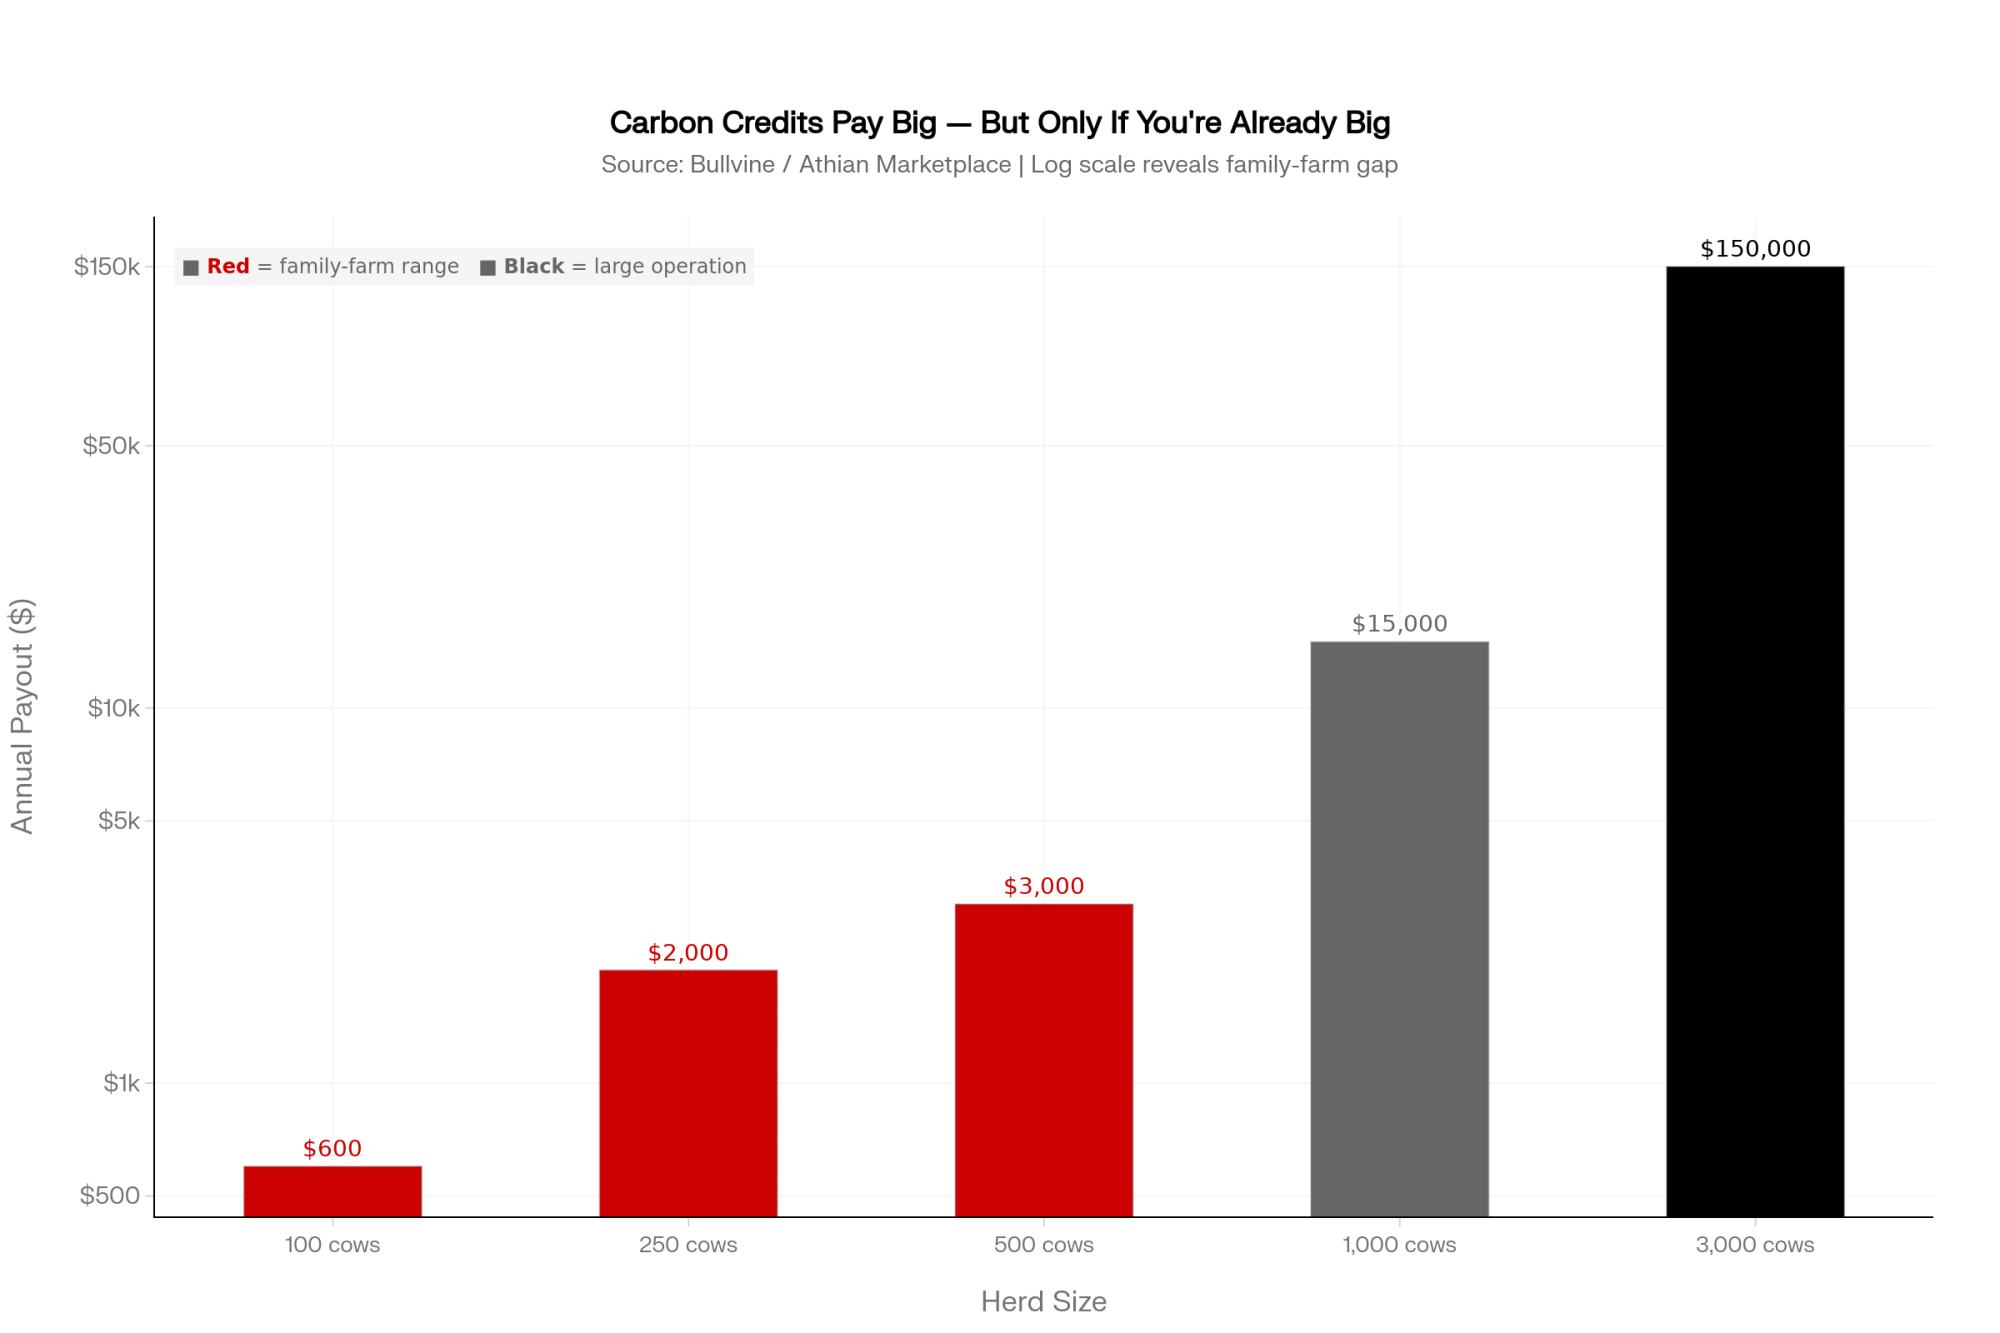
Carbon/Data Monetization🟡 Low–Medium — verification cost1–2 yearsDisciplined record-keeping🔴 Scale dependency: 500-cow farm ≈ $3,000/yr vs 3,000-cow ≈ $150,000/yr1,000+ cows to make verification overhead worthwhile

¹ Entrepreneur, June 15, 2026 · ² Nuffield Scholar report, 2016 · ³ The Bullvine, “You Only Get 15.9¢ of the Food Dollar” · ⁴ The Bullvine, “Data That Pays”

The branded-product path — Thunder’s — makes sense when you’ve got capital tolerance, a genuine market gap, and someone willing to learn the outside-the-fence game. And retail is no safe harbor: 7-Eleven’s parent, Seven & i, disclosed in its Q4 earnings documents that it expects to close or convert roughly 645 North American stores in fiscal 2026, per cstoredive (April 12, 2026) — even the shelf you fought to reach can move under you.

On-farm processing is the more traveled road, the one most research treats as the default value-added move (Nuffield Scholar report, 2016, Ireland/EU). The limit shows up early: regulatory complexity and capital cost stop most farms before they start. Only a small fraction of Irish farms are formally diversified, per Nuffield’s data — a useful signal for how steep the on-ramp is.

Then there’s the move you can actually start this month, no new company required. Capture more inside the commodity system — audit your hauling routes, question your co-op’s product mix, and press on component and premium programs, the cents-per-cwt kind of work that doesn’t require you to build a thing (The Bullvine, Jan 21, 2026). The ceiling is lower, but the risk is low and the payback is fast.

The fourth path is younger and worth watching: monetizing data and verified sustainability. Bullvine’s reporting found the Athian Marketplace has paid between $15 and $35 per metric ton of CO₂ equivalent for certified U.S. livestock emission reductions (The Bullvine, “Data That Pays,” Oct 22, 2025). It requires verification infrastructure and disciplined record-keeping. The catch is scale — payouts skew hard toward large operations, with 3,000-cow dairies capturing around $150,000 a year while family farms see closer to $3,000 (The Bullvine, Nov 23, 2025).
How Much Does “Buying Your Way In” Really Cost?

More than the slotting fees, honestly. The real cost is concentrated risk. When one family balance sheet backs both the farm and the new venture, a milk-price dip or a feed-cost spike hits both businesses on the same day. Bullvine’s robotic-milking case study describes the same shape of pain — Iowa State’s Larry Tranel found a typical two-robot install can run roughly $8,776 a year in the red for seven years before the payoff arrives (The Bullvine, “Robotic Milking Labor Math,” Apr 10, 2026). If your 500-cow herd hits a $1/cwt price drop in the middle of that valley, that’s another $125,000 you have to absorb. Thunder lived a beverage version of the same thing: two to three years before steady revenue, shelf space bought on borrowed patience. Before you chase any value-added play, the real question isn’t “can I make the product.” It’s “can my balance sheet survive the years before it pays.”

Is Your Operation Built to Capture Value, or to Produce It?

This is the shift worth sitting with, and it has nothing to do with coffee. Most dairies are built — financially and mentally — as commodity producers: fill the tank, ship the milk, take whatever price the system hands back. Temple and Henderson took the other route — a producer-owned brand that signs its own co-packer contracts and holds a piece of the story beyond the farm gate. You don’t need to launch canned coffee to make that shift. But it does mean asking, honestly, whether your operation is set up only to produce milk — or to capture some of what your milk becomes. Australian value-adding scholar Fiona Aveyard put it plainly in her 2023 Nuffield report: farmers “often have more control over their product than they realise” (Nuffield Australia, “Beyond the Farm Gate,” Aug 13, 2025).
Key Takeaways

  • If your net runs below full economic cost — check your real number against the ERS large-herd benchmark near $19.14/cwt against an all-milk forecast around $20/cwt — you’re in the same squeeze pushing farmers toward value-added plays. Nail down your breakeven before you consider one.
  • Before launching any branded product, model a two-to-three-year negative cash-flow window and stress-test whether your balance sheet absorbs it while milk prices swing.
  • Too big a leap? This month, set aside half a day to audit hauling costs and your co-op’s product mix for the cents-per-cwt you’re leaving on the table.
  • Name your outside-the-fence skills gap out loud. If you can’t spot what’s broken in marketing the way you can in the parlor, budget for the expertise you don’t have.
  • Don’t over-engineer the product. Thunder’s clean, short-ingredient label came from building the simplest version that worked.
  • Treat data and sustainability programs as a real but young value stream — and check where a herd your size actually lands, since a 3,000-cow dairy can bank roughly $150,000 while a 500-cow family farm might see around $3,000.

Where does your operation sit on that staircase right now — still shipping into the 15.9 cents, or reaching for a piece of the other 84? You don’t have to answer with a product launch. You do have to answer with your own numbers, because at an all-milk forecast around $20/cwt against $19.14 costs, ERS math says a lot of herds are running on a razor-thin full-cost margin.

Run Your Numbers

Dairy Profit Projector — Before you chase the other 84¢, find out if your core business even pencils. Drop in your herd size, milk price, and ration to see your breakeven milk price, IOFC, and 12-month margin — then stress-test what a $1/cwt swing does to your bottom line before you bet a second business on it.

Complete references and supporting documentation are available upon request by contacting the editorial team at editor@thebullvine.com.

Learn More

The Sunday Read Dairy Professionals Don’t Skip.

Every week, thousands of producers, breeders, and industry insiders open Bullvine Weekly for genetics insights, market shifts, and profit strategies they won’t find anywhere else. One email. Five minutes. Smarter decisions all week.
NewsSubscribe
First
Last
Consent

The $134,000 Hole You Can’t See: Why “We Paid Our Bills” Is the Most Expensive Sentence in Dairy

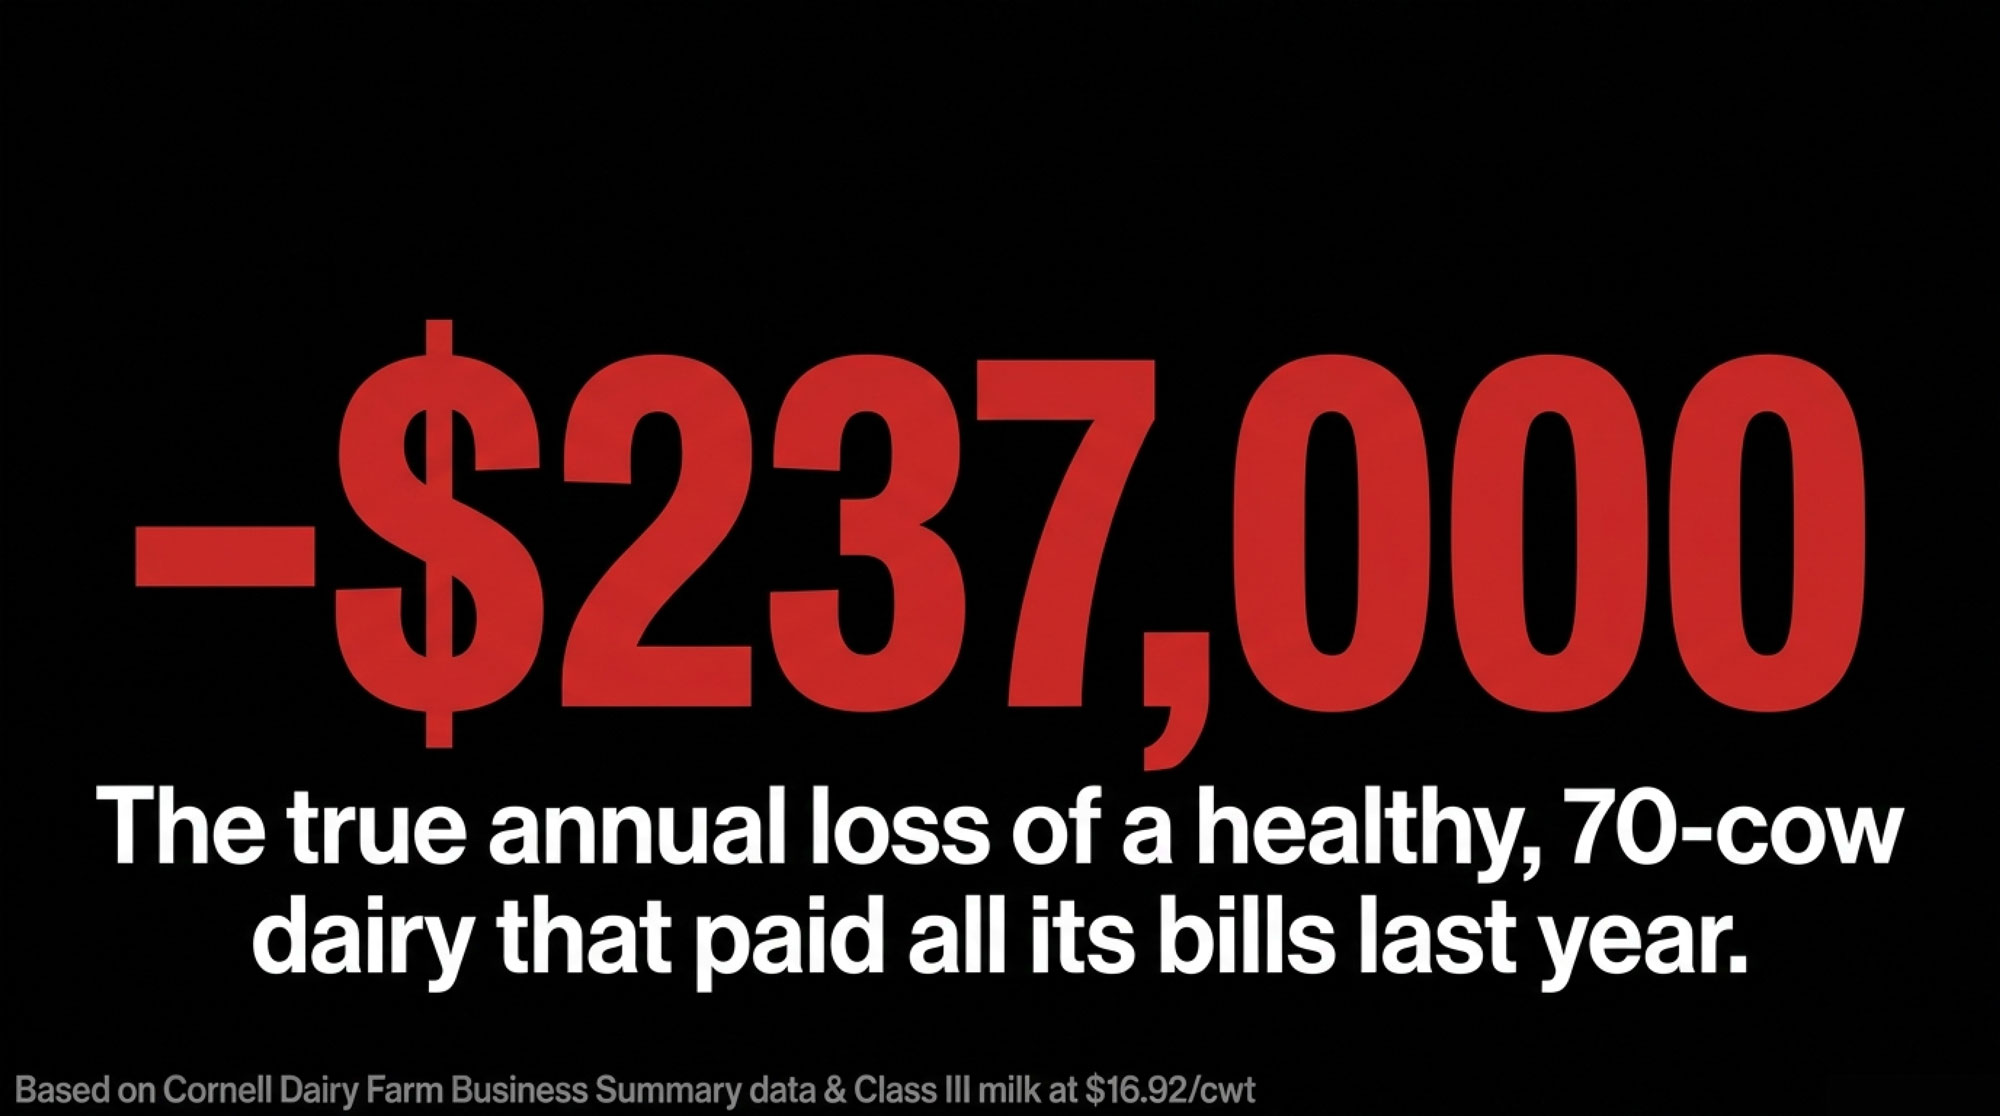
Cows healthy, tank full, bills paid — and a 70-cow dairy still lost about $237,000 last year. At $16.92 per cwt for milk against Cornell’s $31/cwt, here’s the bill your milk check never shows you.

The dairy farmers in this scene aren’t real, but every number behind them is. Picture a family that’s milked 70 cows in the same tie-stall barn for 25 years, sitting across the kitchen table from an advisor who’s just run their numbers. They’re good farmers. Cows are healthy, the bulk tank’s full, the bills got paid last year. Then the spreadsheet says they lost money — real money — and the look on their faces is the whole problem with small commodity dairy in 2026.

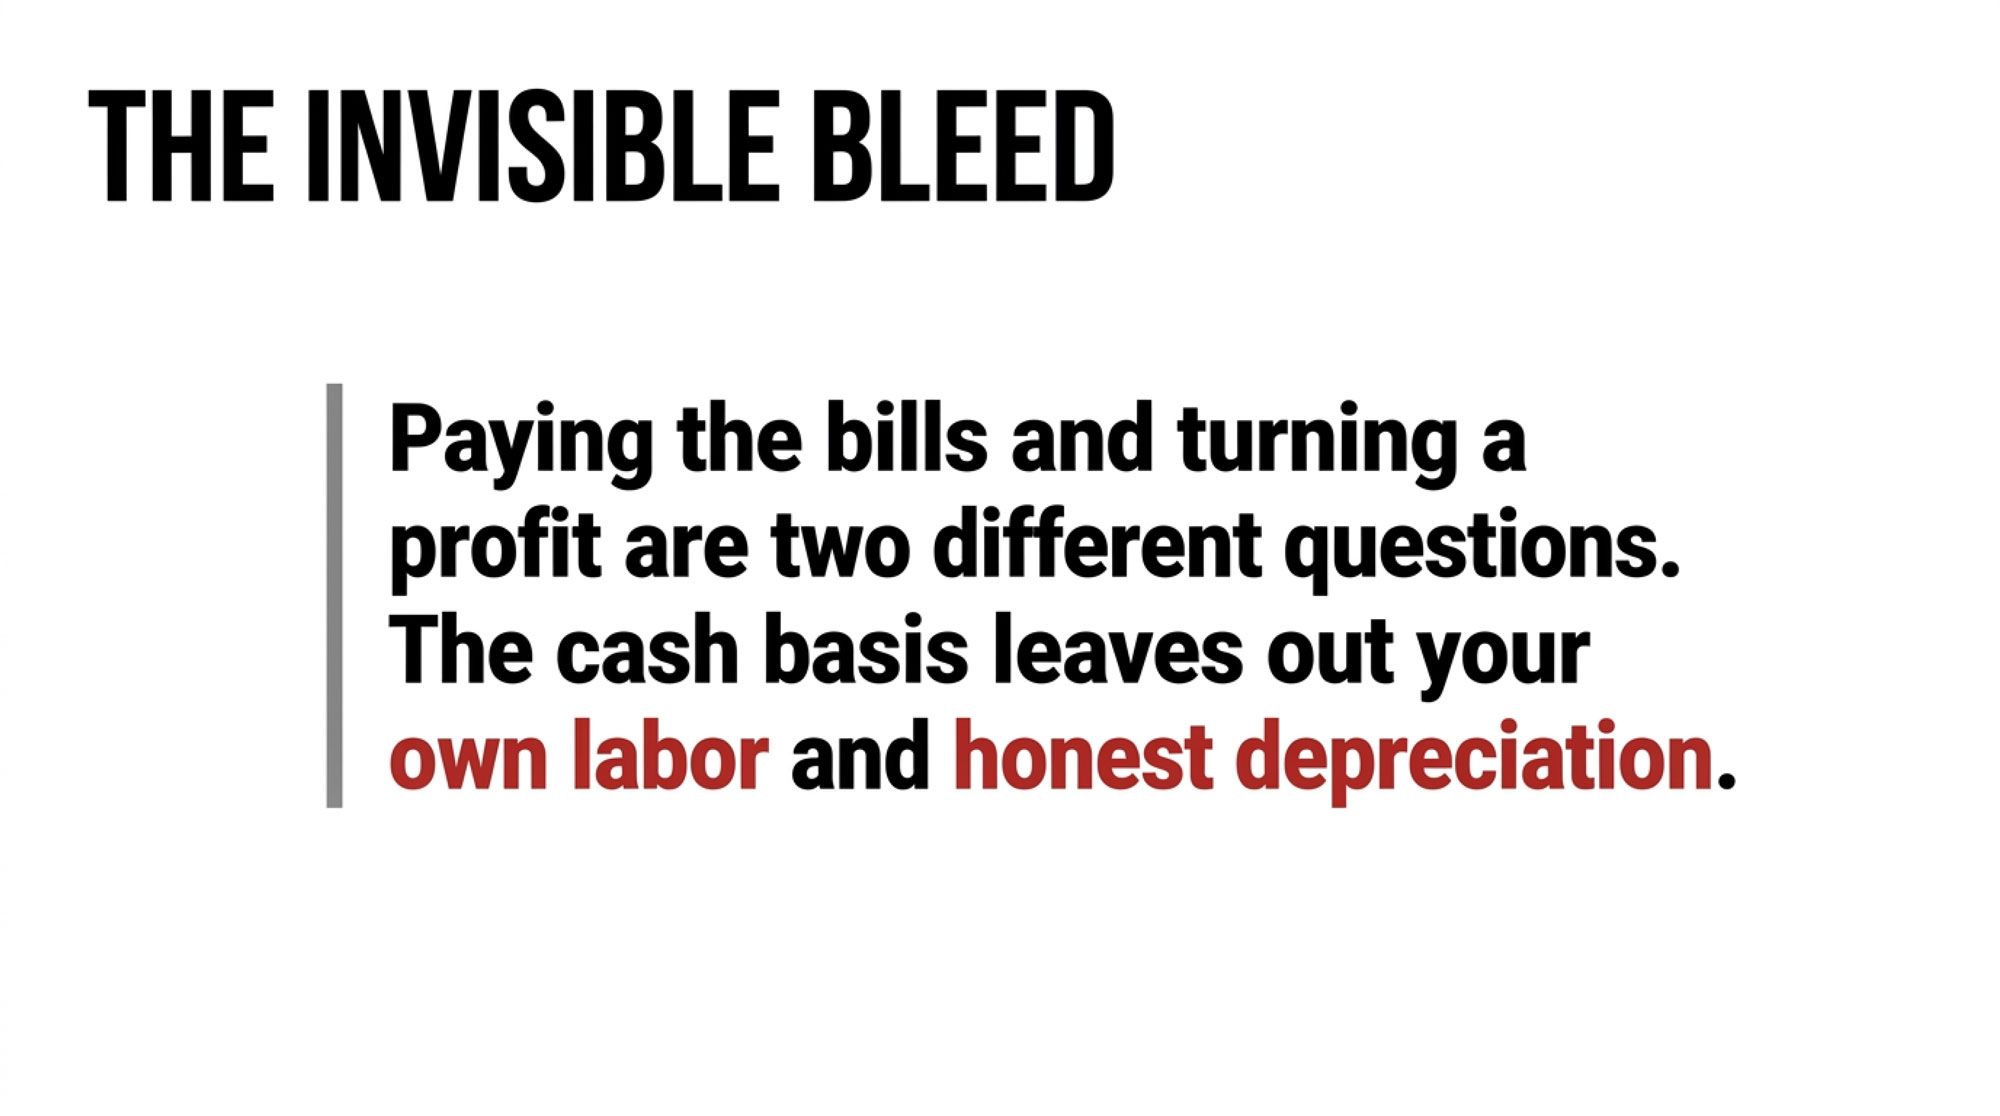
They didn’t lie when they said “We paid our bills.” They did. But paying the bills and turning a profit are two different questions, and the gap between them is where small commodity dairies quietly bleed equity. At 60 to 150 cows shipping to a co-op with no premium, that gap can run well past $130,000 a year — and you can lose it without ever feeling the hit. This is the cost of production math nobody wants to run. It’s also the only math that tells you which of three paths you’re actually on.

What’s Changing and Why

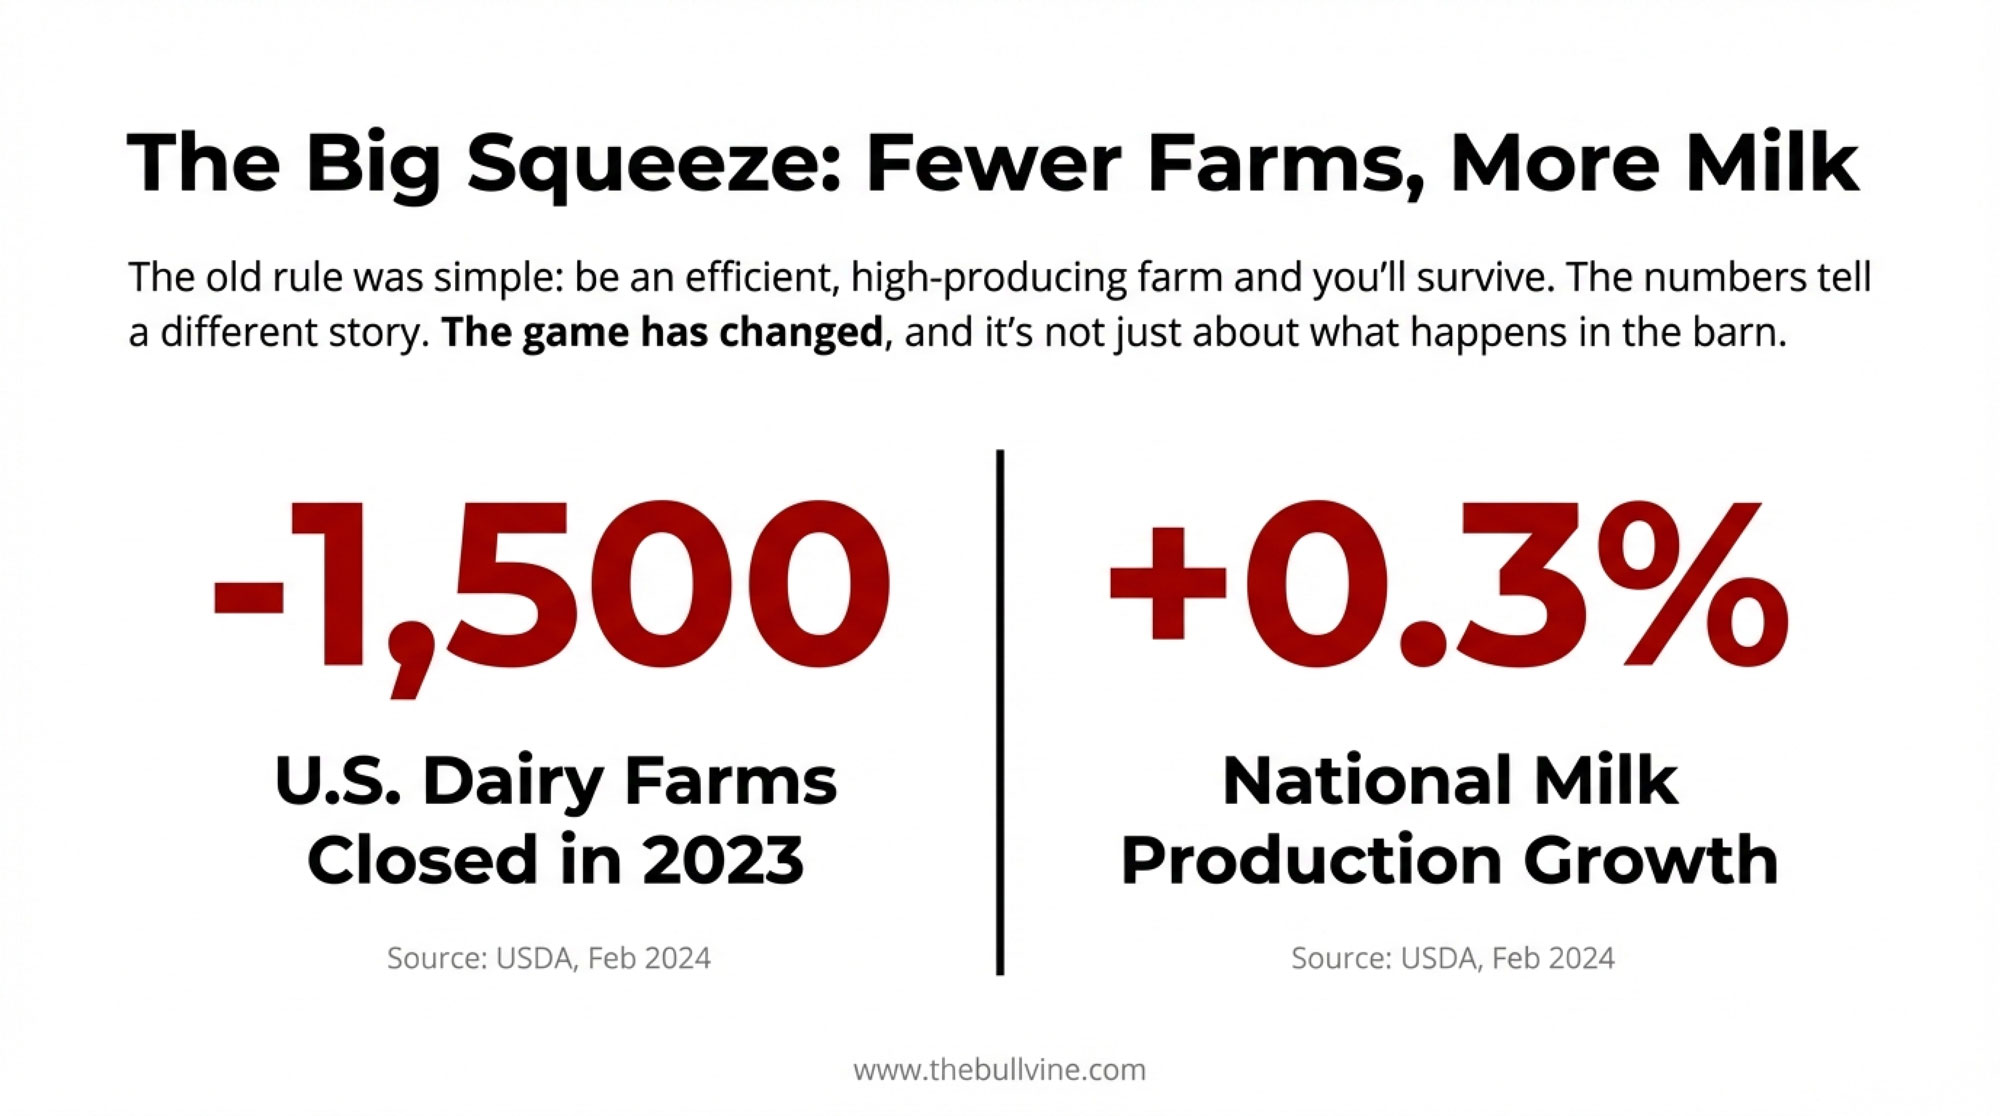
The structural numbers don’t leave much room for argument. USDA’s Economic Research Service reported in February 2026 that licensed U.S. dairy herds fell from 66,825 in 2004 to 24,811 in 2024 — a 63% drop — while total milk production climbed from 170.8 to 225.9 billion pounds over the same stretch. Fewer farms. More milk. And the herds that disappeared were overwhelmingly the small ones.

Look closer at which farms vanished and the pattern sharpens. Farmdoc’s read of the 2022 Census of Agriculture found the 20–49 cow class declined the most on a percentage basis, with 50–99 cow herds right behind — the exact bracket our 70-cow family sits in. In total, 39% fewer U.S. farms sold milk in 2022 than two decades earlier. The milk didn’t disappear with them. It moved to bigger barns.

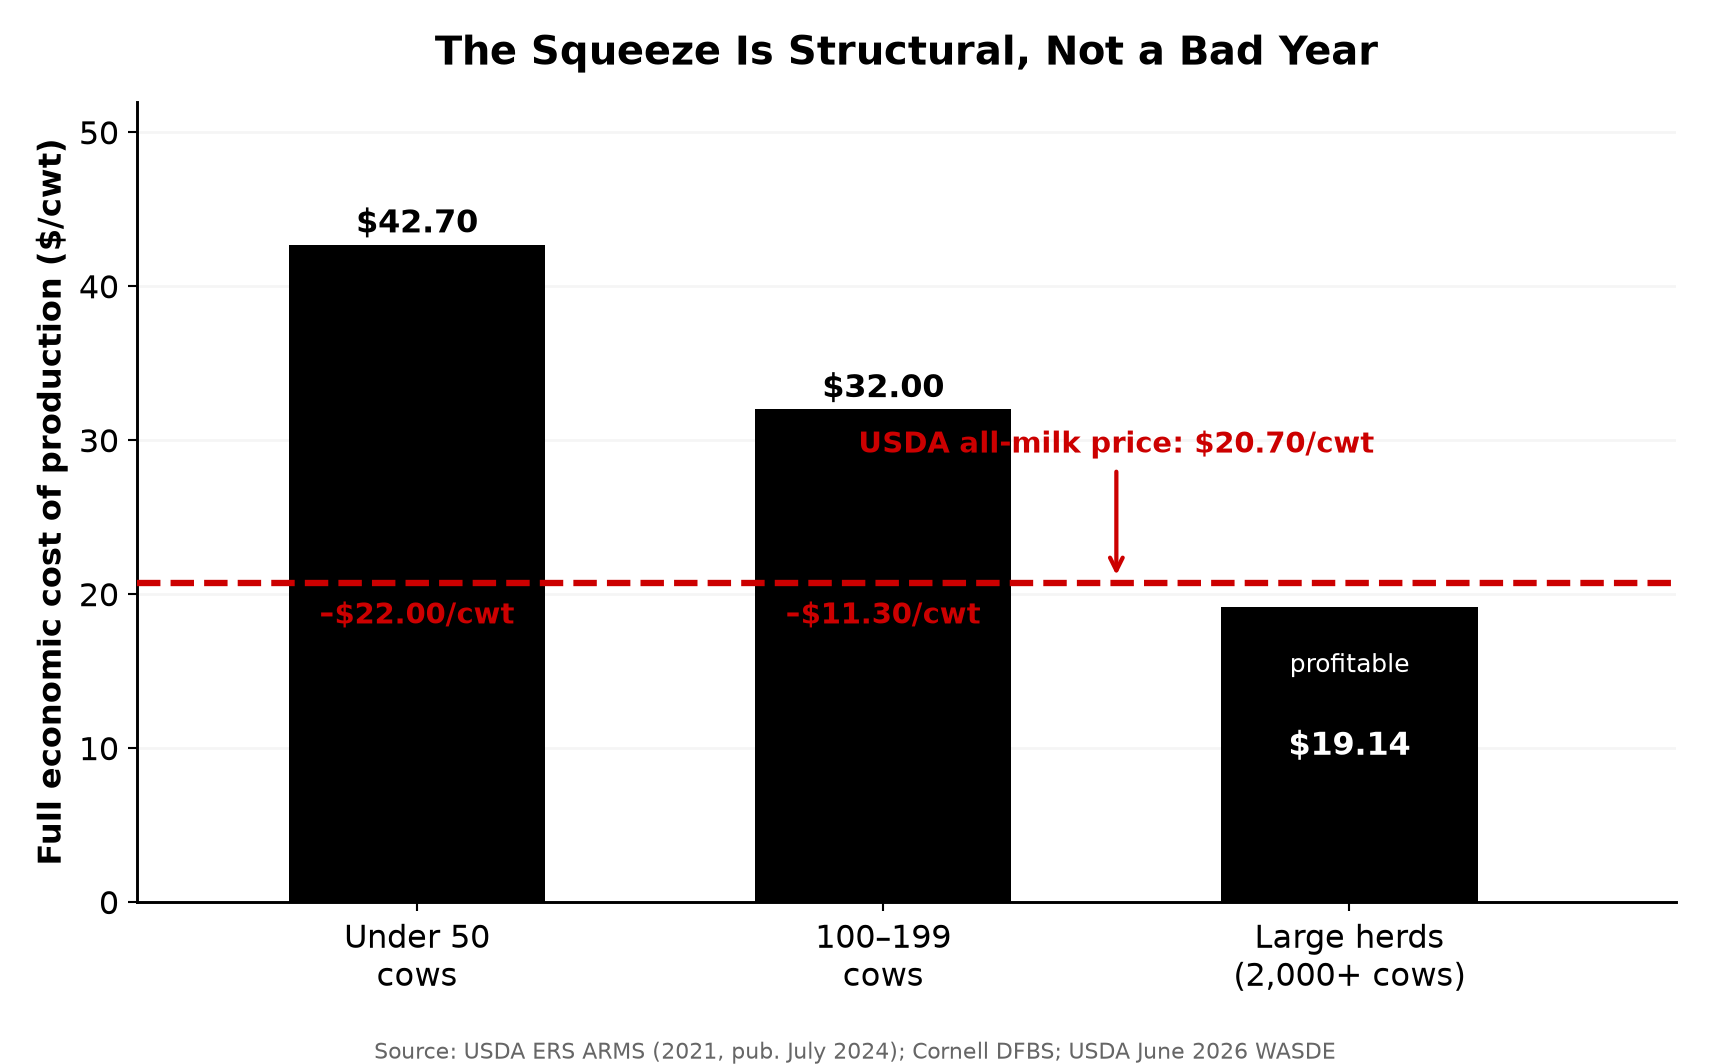
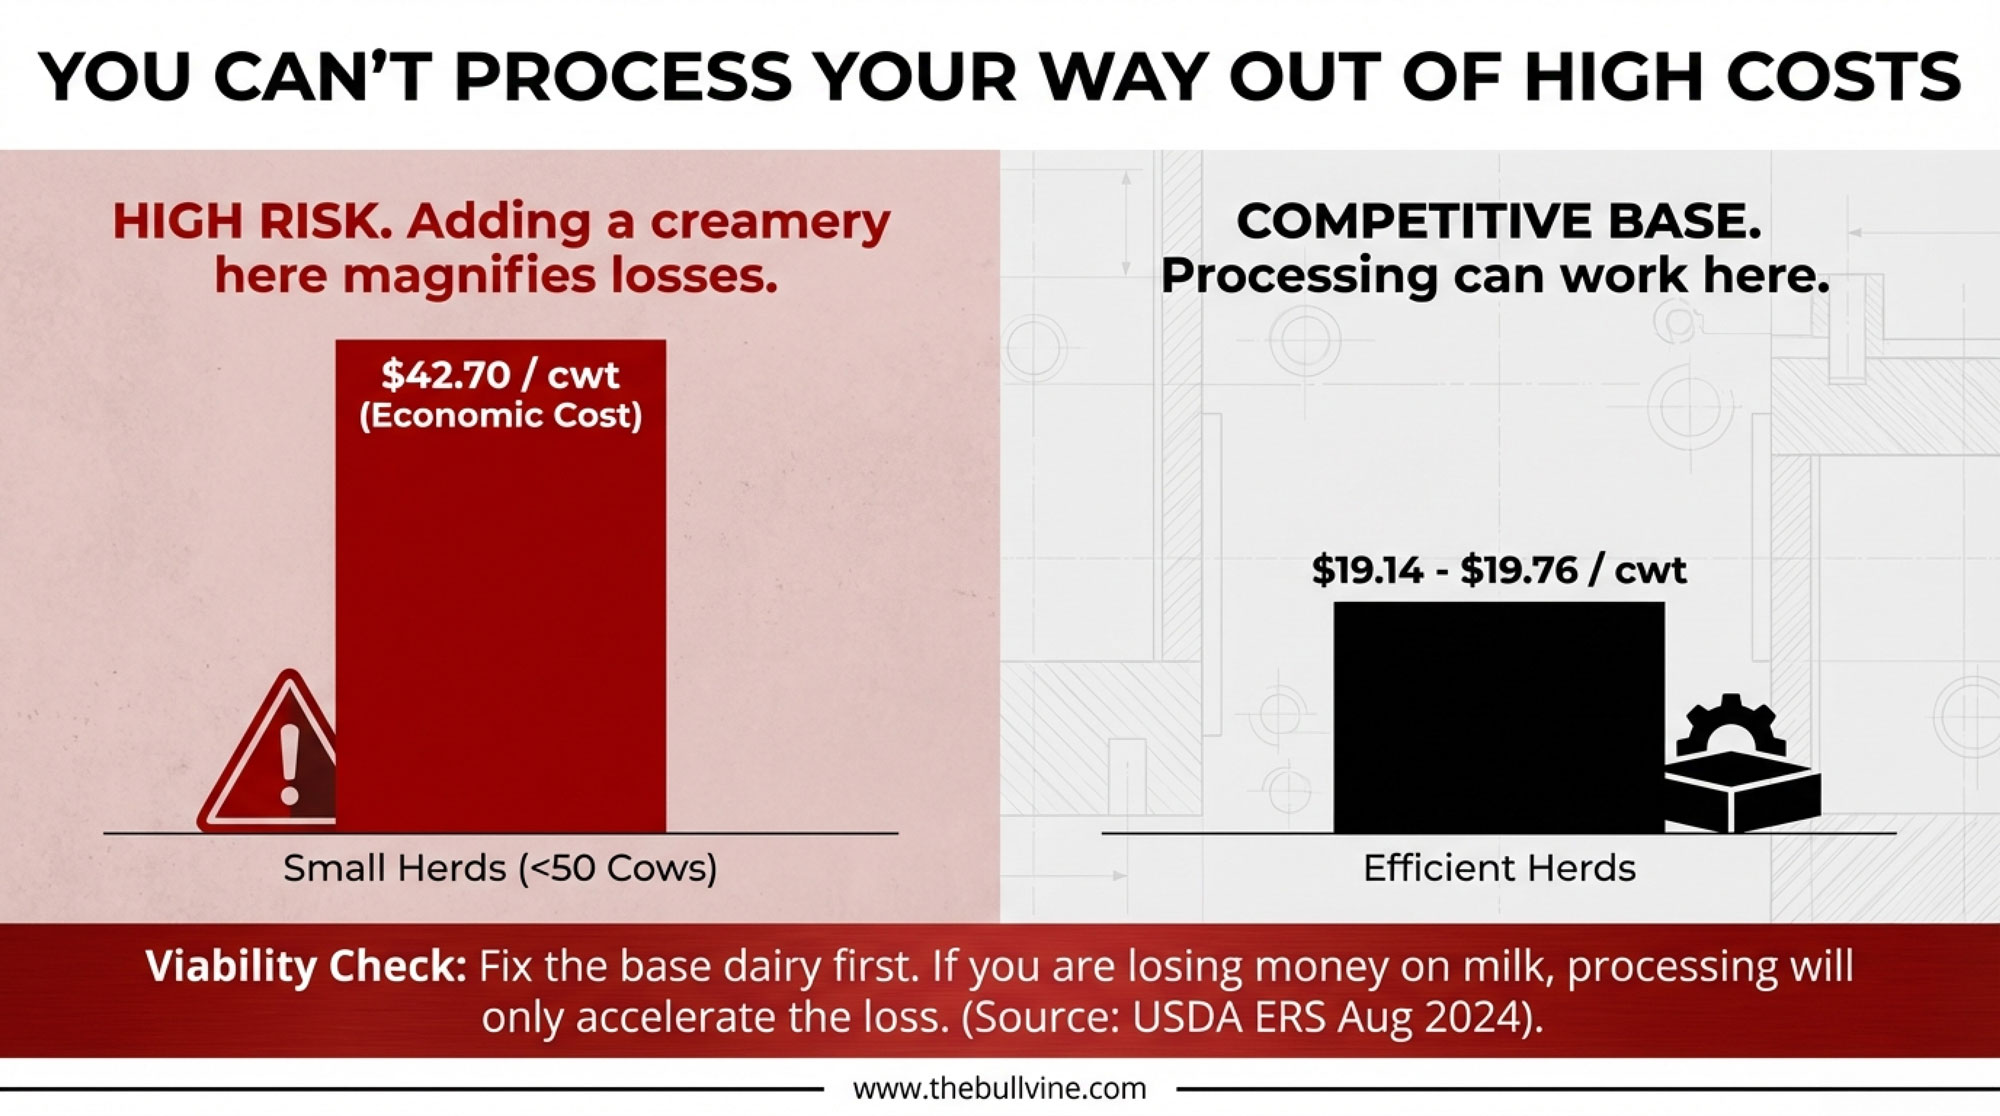
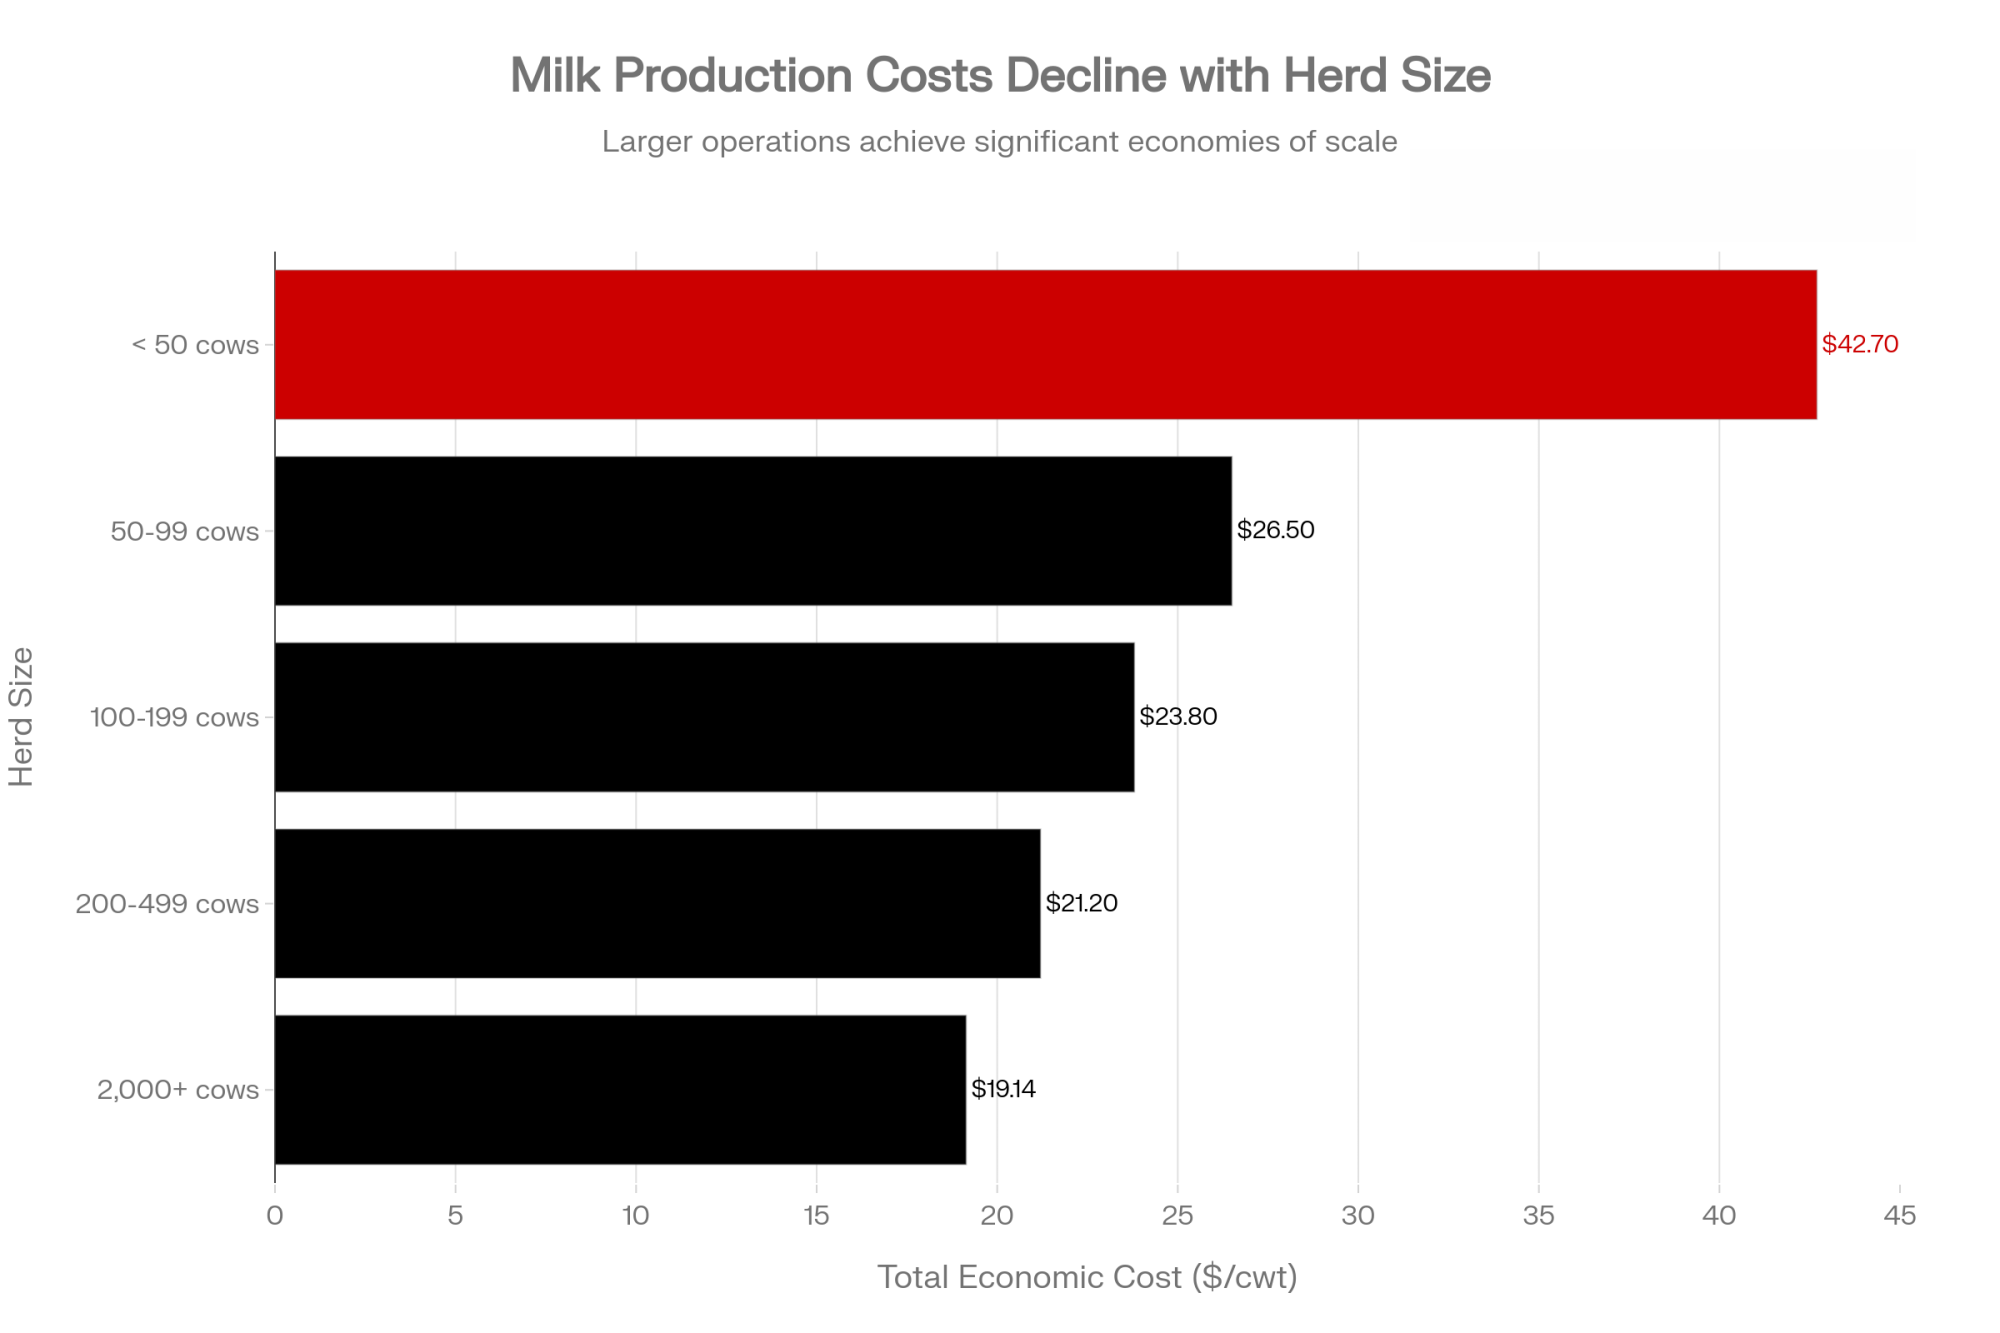
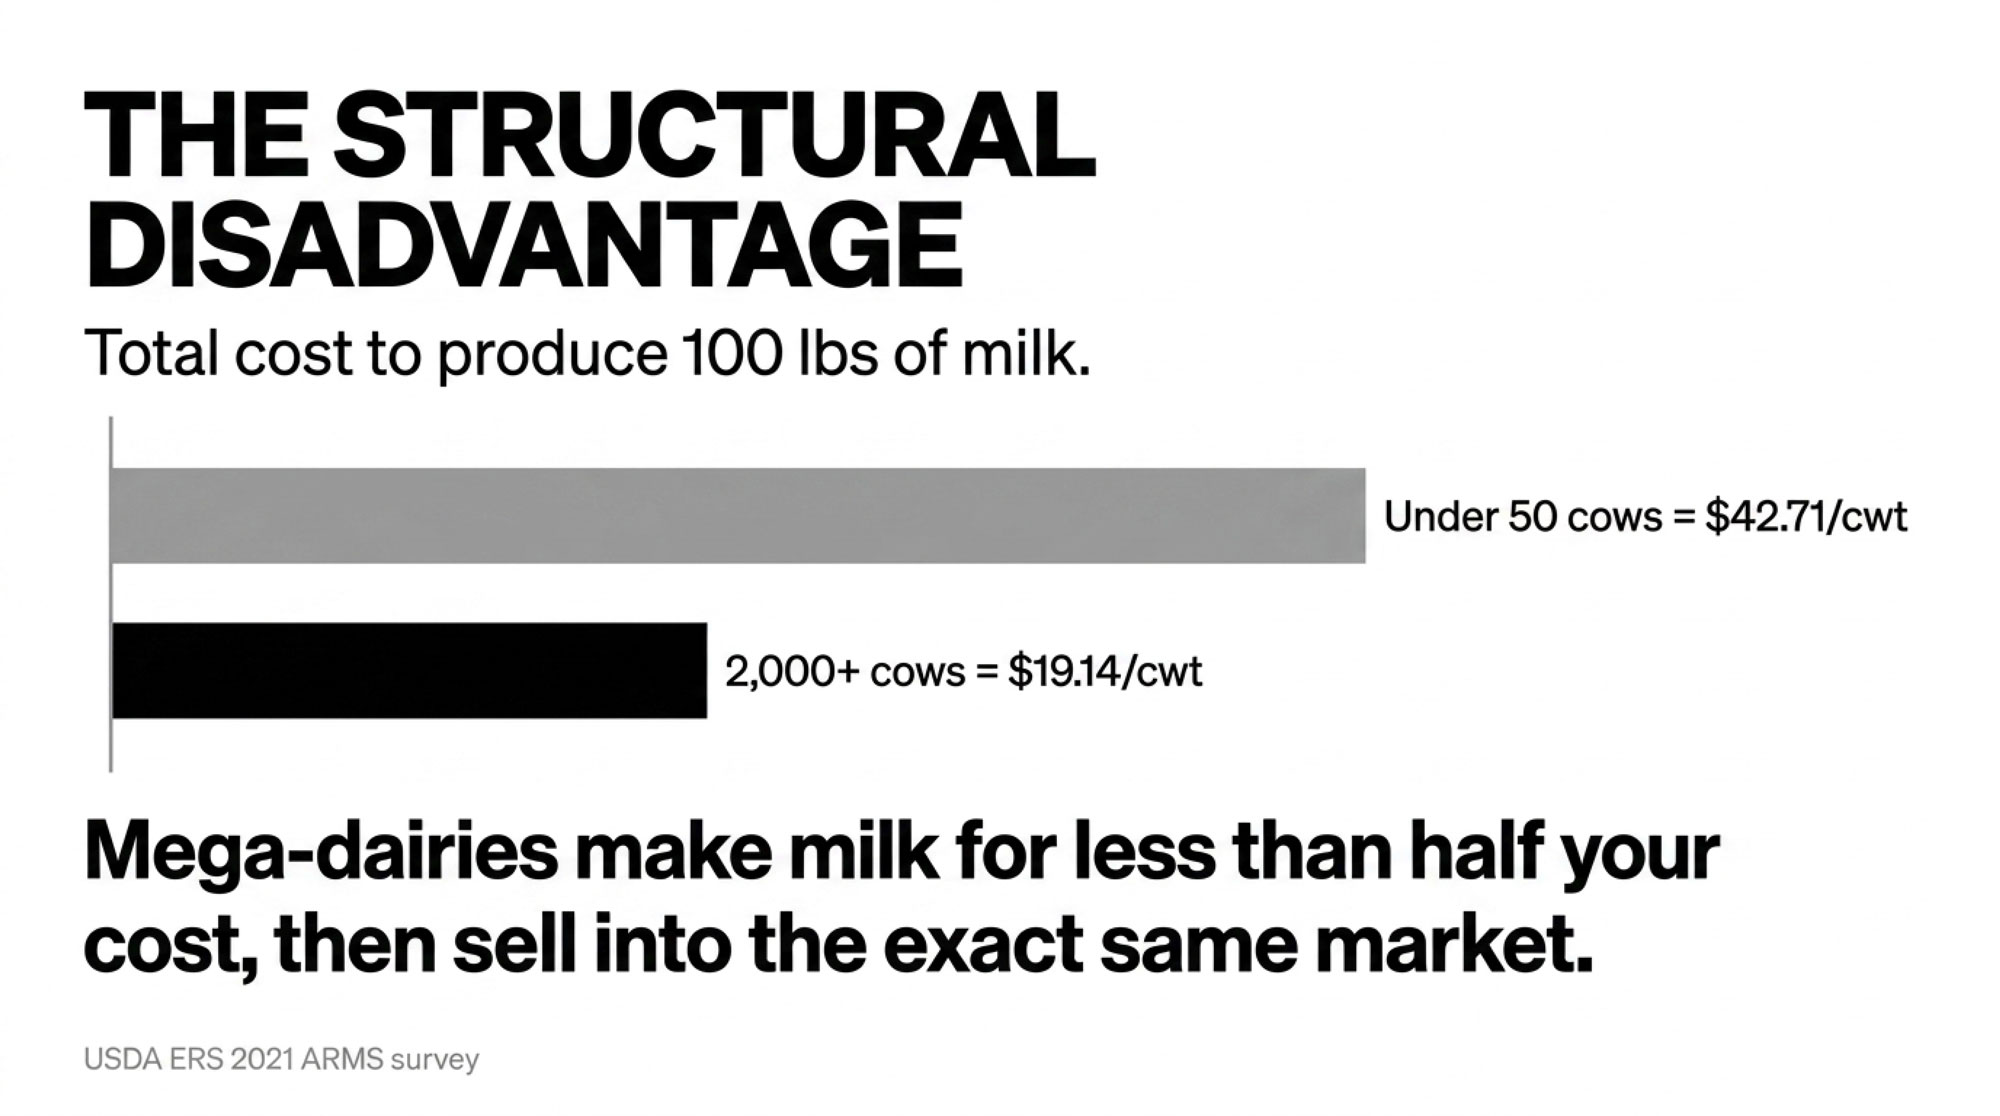
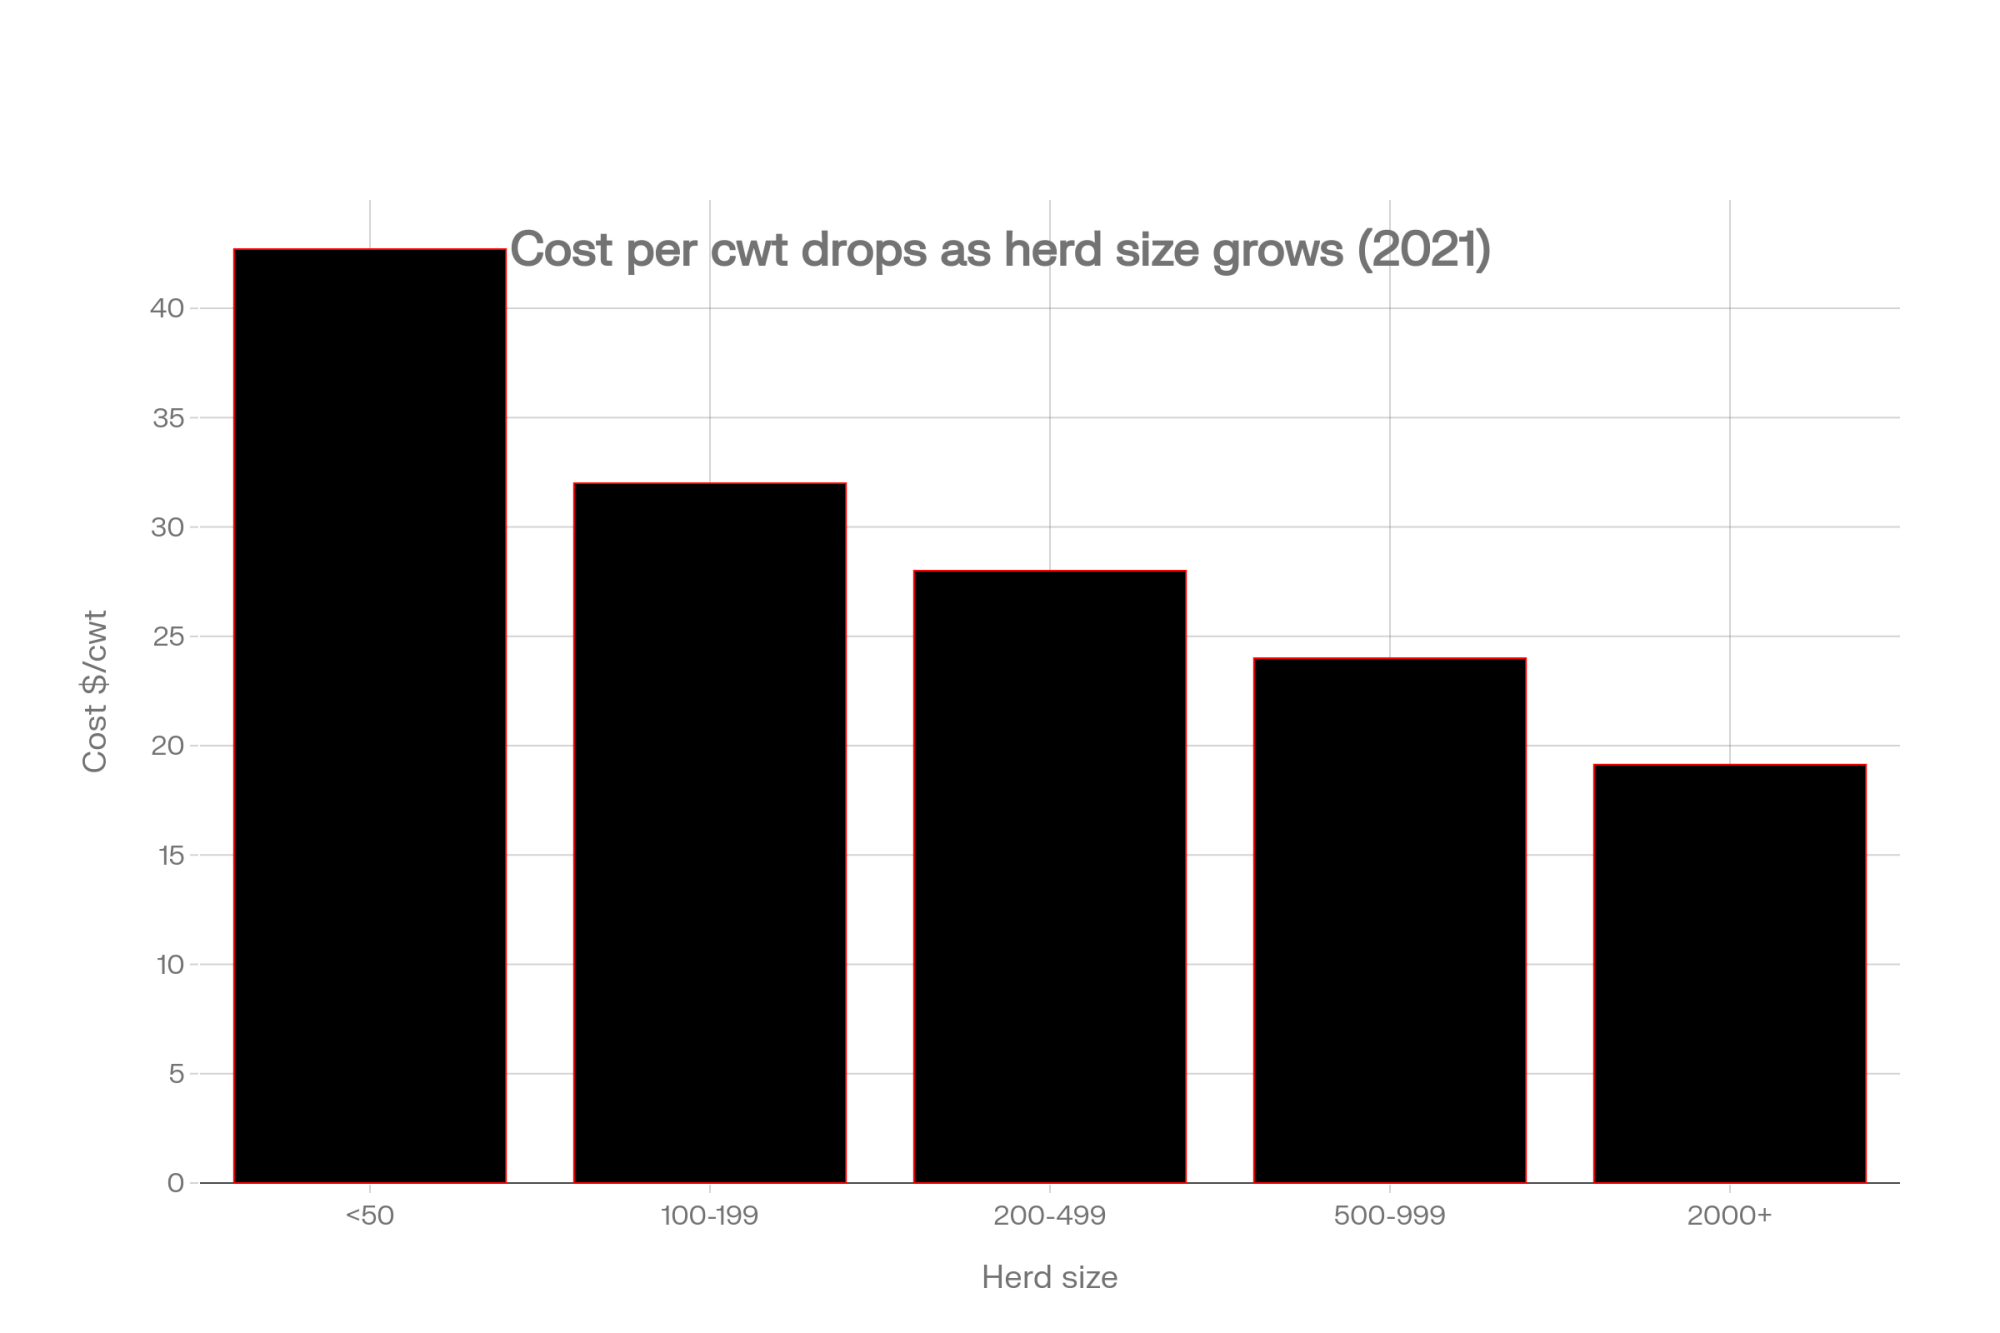
The cost gap is why. ERS data from its 2021 ARMS survey put the total cost to produce 100 pounds of milk at $42.71 per cwt for herds under 50 cows, against $19.14 for herds with 2,000 or more. That’s not a rough patch you outwork. It’s a roughly $23/cwt structural disadvantage built into scale itself, and it doesn’t care how hard you hustle in the parlor.

Our 70-cow family sits right in the teeth of it. So does anyone running 50 to maybe 500 cows, shipping bulk milk with no value-added product and no direct premium. You’re competing on cost against operations that make milk for less than half what you spend, then selling into the same market at the same price.

How a Profitable-Looking Farm Loses Six Figures

Here’s the part that blindsides families. On a cash basis, a small dairy can look fine — the milk check covers feed, the vet, the loan payment, and there’s something left to live on. But the cash basis leaves out two enormous costs: the family’s own labor and honest depreciation on barns and equipment bought decades ago. According to Illinois Farm Business Farm Management data released in December 2024, even farms with positive cash returns posted negative economic returns averaging –$686 per cow over five years, including –$758 per cow in 2023.

So run the barn math on that 70-cow family. At roughly 24,000 lbs per cow, they ship about 16,800 cwt a year. Anchor it to a real price: USDA’s Agricultural Marketing Service reported Class III milk closed May 2026 at $16.92/cwt — the number a cheese-market commodity shipper actually lives on, even as USDA’s headline all-milk forecast sat higher at $20.70. At $16.92, that’s about $284,000 in revenue. For full economic cost, use a real benchmark instead of a guess: Cornell’s Dairy Farm Business Summary puts the 100–199 cow class at $31–33/cwt once labor and capital are counted, and a 60–150 cow operation sits at or above the top of that band. Take the low end — $31/cwt — and this herd’s cost runs about $521,000. The hole is roughly $237,000 a year. Even at the rosier $20.70 forecast, you’re still down more than $170,000.

The number that trips up commodity operators: $20.70 is the forecast. $16.92 is the check. Now, all-milk and Class III aren’t a clean apples-to-apples subtraction — all-milk blends every class and folds in premiums. But the gut-check holds: if you budget your year on the price you actually get paid, not the forecast headline, you’re planning around roughly $3.78/cwt you may never see. On 16,800 cwt, that’s about $63,000 between the plan and the mailbox.

So why don’t they feel the loss? Nobody writes the family a paycheck at $18–22 an hour, and the barn’s still on the books at 1990s prices instead of today’s rebuild cost. The signs show up before the spreadsheet does. Deferred vet calls. Peeling paint on the milkhouse. A spouse’s town job quietly covering the feed bill some months.

That last one is the clearest diagnostic there is. Farm Credit Canada’s BeefResearch.ca team flagged the gut-check back in September 2022: if off-farm income has covered farm operating losses in three or more of the last five years, you’re looking at a structural problem, not a tight stretch — the farm isn’t paying its own way. The benchmark is Canadian, but the logic crosses the border intact. A farm leaning on a town paycheck to cover operating losses, not just household groceries, isn’t carrying itself. That doesn’t make it worthless. Plenty of families decide, eyes open, to subsidize a life they love, and that’s a legitimate call when you make it on purpose. The trouble starts when the subsidy is invisible — when a farm runs a decade on borrowed equity while everyone at the table calls it “tight but okay.” Name it out loud, and the question shifts from “are we failing?” to “what do we actually want this to be?” That’s a far better question to answer while you’ve still got options on the board.

What Does the Same Barn Look Like at 40 Cows and a Cheese Vat?

Now flip the model. Take a 40-cow herd that never sees a co-op truck — every drop goes direct-to-consumer, into a cheese vat, or onto a farm-store shelf. Fewer cows, radically different math. At 24,000 lbs/cow, that’s 9,600 cwt a year, against the 70-cow herd’s 16,800. On commodity terms it’d be a rounding error. The point is that this farm isn’t selling a commodity.

Here’s where the numbers diverge hard. NODPA reported organic and grass-fed pay prices running $38–60/cwt this spring — more than double the $16.92 a conventional cheese shipper saw. Say half this herd’s milk — 4,800 cwt — moves as branded fluid or direct sales at an organic-grade $45/cwt: that’s about $216,000. Turn the other 4,800 cwt into farmstead cheese, and the leverage compounds, because roughly 10 lbs of milk makes 1 lb of cheese. That’s about 48,000 lbs of cheese; even at a conservative farm-store $12/lb, you’re looking at another $576,000 in gross sales off the same volume that would’ve fetched maybe $81,000 as bulk milk. (These 40-cow figures are illustrative, built on conservative assumptions — a 50/50 fluid-to-cheese split, mid-range NODPA organic pay price of $45/cwt, and $12/lb farm-store cheese — not a single sourced operation.)

But before anyone trades the parlor for a make-room, read the trade-off honestly. That cheese revenue isn’t margin — it’s gross, and the costs behind it are brutal. A Journal of Dairy Science study pegged artisan cheese plant startup at $267,248 to $623,874, and that’s a 2013 figure, so budget higher today. Then add the labor: aging, packaging, food-safety compliance, farmers’-market booths, and the website that drives the whole thing. You’re not adding a revenue stream. You’re bolting a second business — manufacturing and retail — onto a dairy farm, and plenty of operators discover they like cows a lot more than they like invoicing. The upside is real. So is the failure rate.

The Mechanics Behind the Outcomes

So why is the deck stacked this way for the commodity shipper? Part of it is plain scale economics. Bigger farms spread fixed costs across more cows and buy feed, semen, and supplies cheaper per unit. RaboResearch puts that edge at roughly $10/cwt for 2,000-plus-cow farms over 100–199 cow herds. But part of it is the pricing system itself, which shifted again in 2025 — and most farmers never saw it move.

The Federal Milk Marketing Order changes that took effect June 1, 2025, raised the “make allowances” — the manufacturing-cost credits processors keep before paying for your milk’s components. The American Farm Bureau Federation calculated the change lowered Class III prices by 92¢/cwt in the first three months and pulled roughly $337 million out of producer pool revenues nationwide, per economist Daniel Munch’s September 2025 Market Intel analysis. On our 70-cow family’s 16,800 cwt, 92¢ is about $15,500 a year — gone, off a check that was already underwater.

Here’s why that 92¢ stings a small herd worse than a big one. The cut comes off everyone’s component price the same way — but large operations have buffers small shippers don’t. The Bullvine’s own market reporting notes smaller farms take disproportionate hits, and scattered producers routinely pay higher per-cwt hauling charges than the big routes. Volume herds negotiate over-order and quality premiums that claw back some of the loss; many small bulk shippers don’t have that leverage. And hedging tools like Class III futures or Dairy Revenue Protection can offset a price drop — but as risk-management firms like CIH lay out, they take a broker relationship, a written margin-management policy, and enough volume to make the contracts worthwhile. A 70-cow herd rarely has all three. So the same 92¢ that a mega-dairy partly absorbs or hedges away lands full-force on the small commodity shipper’s mailbox check.

And it arrived almost invisibly. The change came inside dense formula language and a single up-or-down producer vote on the whole order — so on most farms it showed up simply as a lower milk price, not as a line item anyone flagged. There’s no entry on a milk check that reads “this is the day margin moved from your bulk tank toward the plant.” The system keeps your eye on the gross price while the real action happens three layers down in the formula.

How Much Does Waiting Actually Cost?

More than most families expect — and the meter runs whether you look at it or not. Cornell’s Dyson School research, as reported by The Bullvine in December 2025, found that well-planned transitions preserve $400,000 to $680,000 more wealth than distressed sales, and that delaying an exit by three years can destroy roughly $450,000 in family equity. Forced sales make it worse. When assets sell on a lender’s timeline instead of yours, Calder Capital’s March 2025 distressed-sale analysis pegs auction recovery at just 23–51% of fair market value, versus far more in an orderly going-concern sale.

There’s a quieter cost too. Farm advisors note that producers who have an exit plan — even one they never pull the trigger on — make calmer, sharper daily decisions, because the desperation’s gone. The plan isn’t a white flag. It’s a steering wheel you keep in your own hands instead of handing to the bank.

Staring at numbers like these and feeling the weight of them? You’re not the only one, and you don’t have to sort it out alone. Farm Aid (1-800-FARM-AID) and Do More Ag connect farm families with both financial and mental-health support.

So Which Path Are You Actually On?

There are three real paths here — not a fourth one where milk prices ride in and rescue a small commodity herd. Each one works for some operations and quietly destroys others. The honest part is matching the path to who you actually are. Read the prerequisite first: if it doesn’t describe you, that’s not your path.

PathBest forPrerequisite to even startWhat it requiresThe risk
1. Go big & efficient (commodity)Operators who want to compete on cost at scaleA balance sheet that pencils well below the $20.70 forecast — extension economists advise stress-testing expansion against milk as low as $16/cwt500–1,000+ cows, strong equity, low cost per cwtYou stop being a “small dairy” entirely, and the debt is real the day milk drops
2. Go radically niche (high margin, low cow count)Operators near affluent/health-minded buyers who genuinely like marketing$267,248–$623,874 in processing capital for modest artisan cheese volumes — and that’s a 2013 figure, so budget higher today (Journal of Dairy Science, 2013)Brand work, regulatory know-how, and patience through years of thin returnsPremium transitions often lose money for years before they turn; the upside is real — organic and grass-fed ran $38–$60/cwt this spring per NODPA, against that $16.92 check
3. Exit while you still have equityFarms with no successor and a breakeven stuck above marketAn honest valuation and a timeline you control, before the lender sets one for youA real tax conversation and lead timeNone, if done early — strategic exits have preserved $400,000–$680,000 more than forced liquidations (Bullvine, March 2026)

Our 70-cow family at the kitchen table? On these numbers, with no off-farm buyer lined up and no appetite for building a brand, they’re a Path 3 candidate — unless someone’s willing to pay a premium for the story behind that milk, which moves them toward the 40-cow value-added model and Path 2. What they can’t be is Path 0: a commodity tie-stall that pays all the bills at $16.92. That option left the table years ago.

And the choice isn’t only about this year’s check. Each path carries a different forward bet. Path 1 is a bet that you can keep driving cost per cwt down faster than milk prices fall — RaboResearch’s $10/cwt scale gap says the big farms will keep pressing that advantage. Path 2 is a bet that the organic and direct-to-consumer premium holds; NODPA’s $38–60/cwt spread is real today, but it rides on consumer demand you don’t control. Path 3 is the only one that locks in what you’ve already built before the next down-cycle takes another bite. Pick the bet you can live with.

The 30-day move that fits all three: Calculate your true cost of production. Price your own labor at $18–22 an hour, depreciate the barn at replacement cost, and stack the result against the price you actually get paid — not the forecast headline. Cornell Cooperative Extension recommends a full production-and-financial analysis plus a sit-down with your lender as the first moves for farms under pressure. You can’t pick a path until you know which side of the line you’re standing on.

Key Takeaways

  • If you can’t state your cost per cwt with your own labor priced in and depreciation at replacement cost, that’s your first 30-day project — Cornell pegs the 100–199 cow class at $31–33/cwt, so if your number is lower, prove it before you bank on it.
  • If you’re budgeting off USDA’s $20.70 all-milk forecast instead of the Class III strip your check actually tracks ($16.92 in May 2026), rebuild the plan on the lower number before you commit a dollar.
  • If off-farm income has covered farm operating losses in three or more of the last five years, treat it as a structural signal and run the full economic analysis, not just the cash flow.
  • If niche is the dream, price the second business honestly — $267K-plus in processing capital plus the marketing and food-safety load — before you fall for the $38–60/cwt headline.
  • If there’s no successor and equity’s sliding, get a valuation now — a planned exit can hold six figures that a forced sale at 23–51% of value won’t.
  • If you’re staying commodity, book the lender conversation with real numbers before a covenant breach books it for you.

So where does your breakeven actually sit right now — not the cash version, the real one with your wage and your depreciation in it? That single number tells you whether you’re running a business, subsidizing a way of life, or slowly handing your equity to someone further up the chain. None of those three is wrong. But you ought to know which one you’ve chosen, instead of finding out when the bank does.

Complete references and supporting documentation are available upon request by contacting the editorial team at editor@thebullvine.com.

Learn More

The Sunday Read Dairy Professionals Don’t Skip.

Every week, thousands of producers, breeders, and industry insiders open Bullvine Weekly for genetics insights, market shifts, and profit strategies they won’t find anywhere else. One email. Five minutes. Smarter decisions all week.
NewsSubscribe
First
Last
Consent

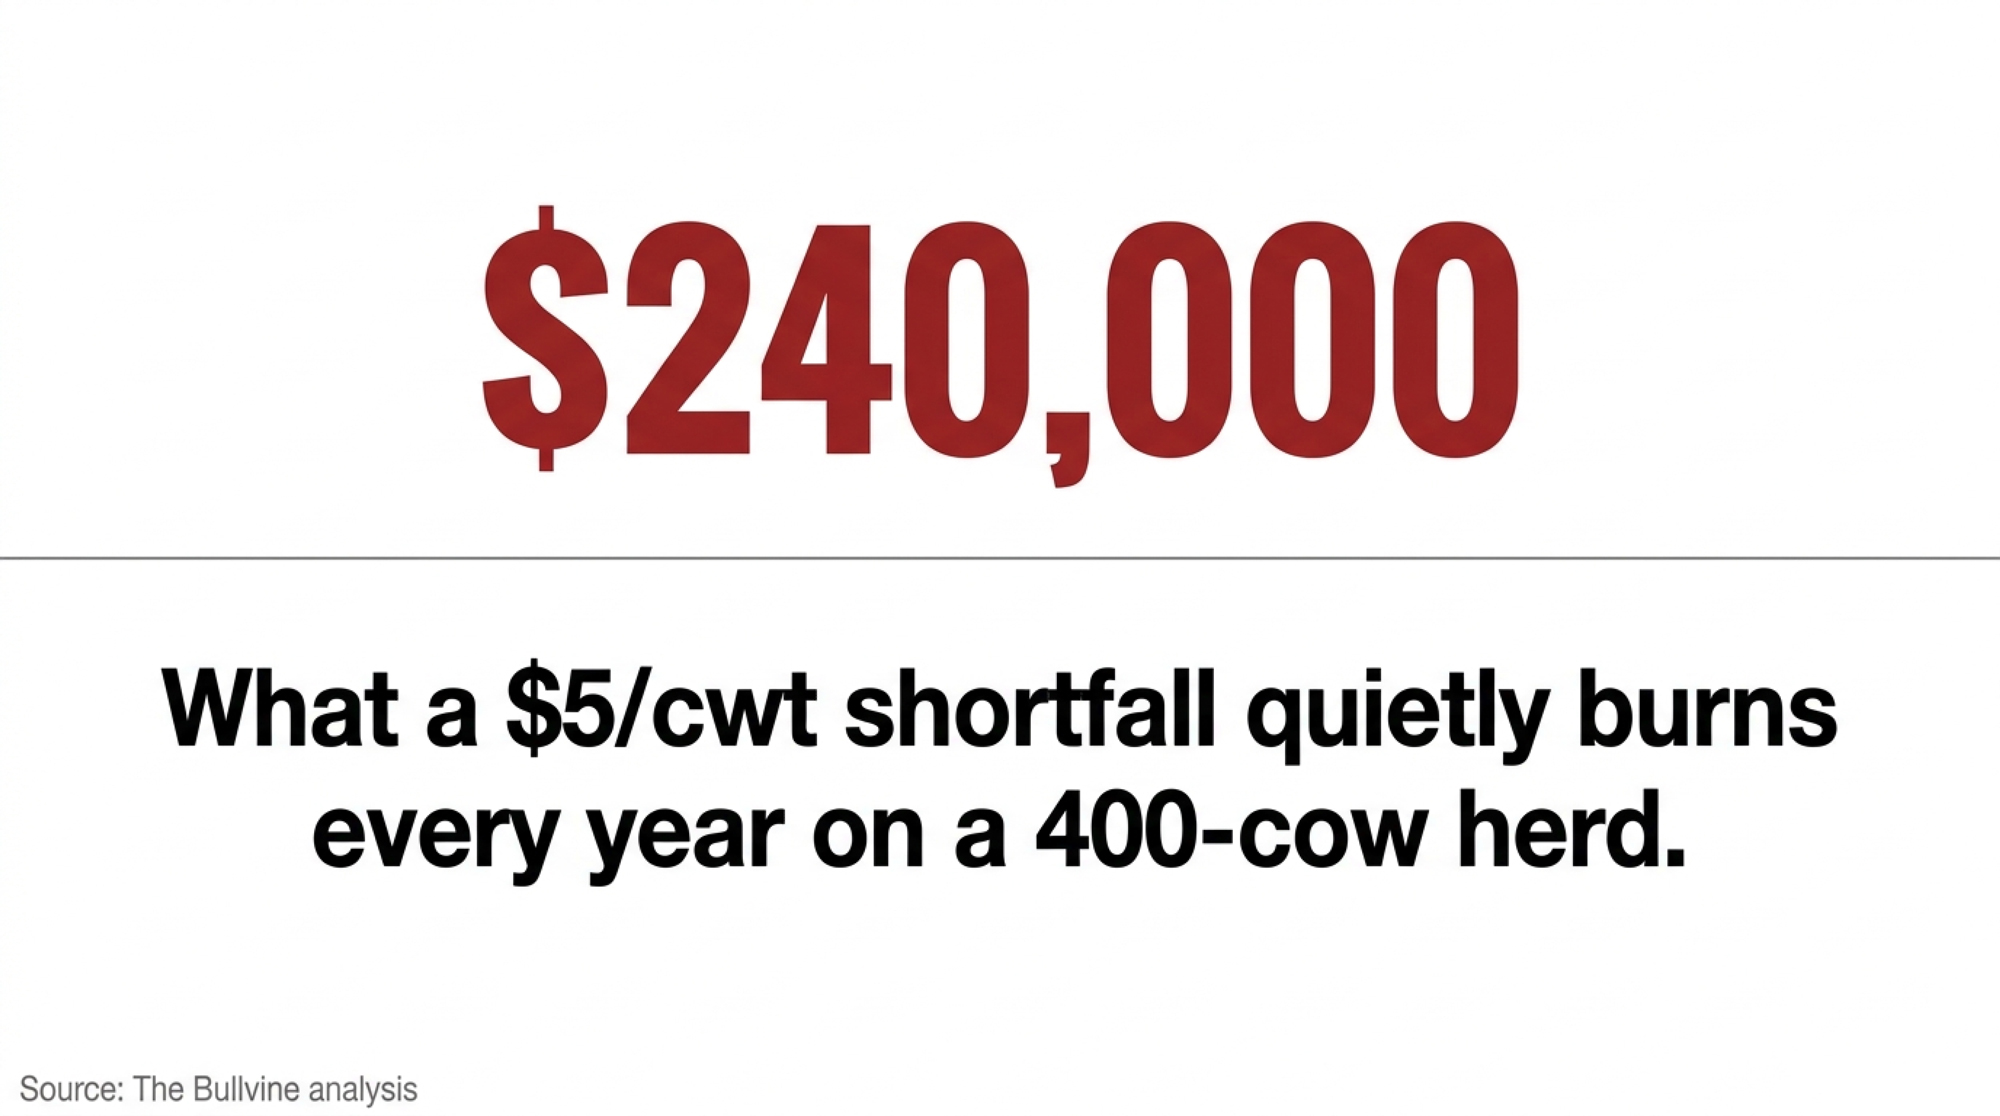
A $240,000 Warning: What a $5/cwt Gap Really Does to a 400-Cow Dairy

On a 400-cow herd, a $5/cwt shortfall quietly burns about $240,000 a year — and value-added only saves you if the math, the market, and your labor all line up.

On her 25th birthday — April 18, 2026 — Natalie Paino became licensed to make cheese curds from her family’s own milk. Getting there took six years: grant applications, a creamery built inside a shipping container, the full 423-page Pasteurized Milk Ordinance, and two kids born along the way. 

Paino runs Hightail Delivery near Plainfield, Iowa, selling ice cream and fresh cheese curds straight to consumers off the family’s dairy. She didn’t build it because direct sales are trendy. She built it because the commodity milk check stopped making sense — and that’s the same quiet conclusion many mid-size operators are reaching at their own kitchen tables right now. “Milk prices have been pretty poor over the last 40 years,” she told Iowa Food & Family in March 2026. “In fact, they’ve stayed about the same throughout that time, even adjusting for inflation.” That’s not a complaint. It’s a diagnosis — and the numbers back her up. 

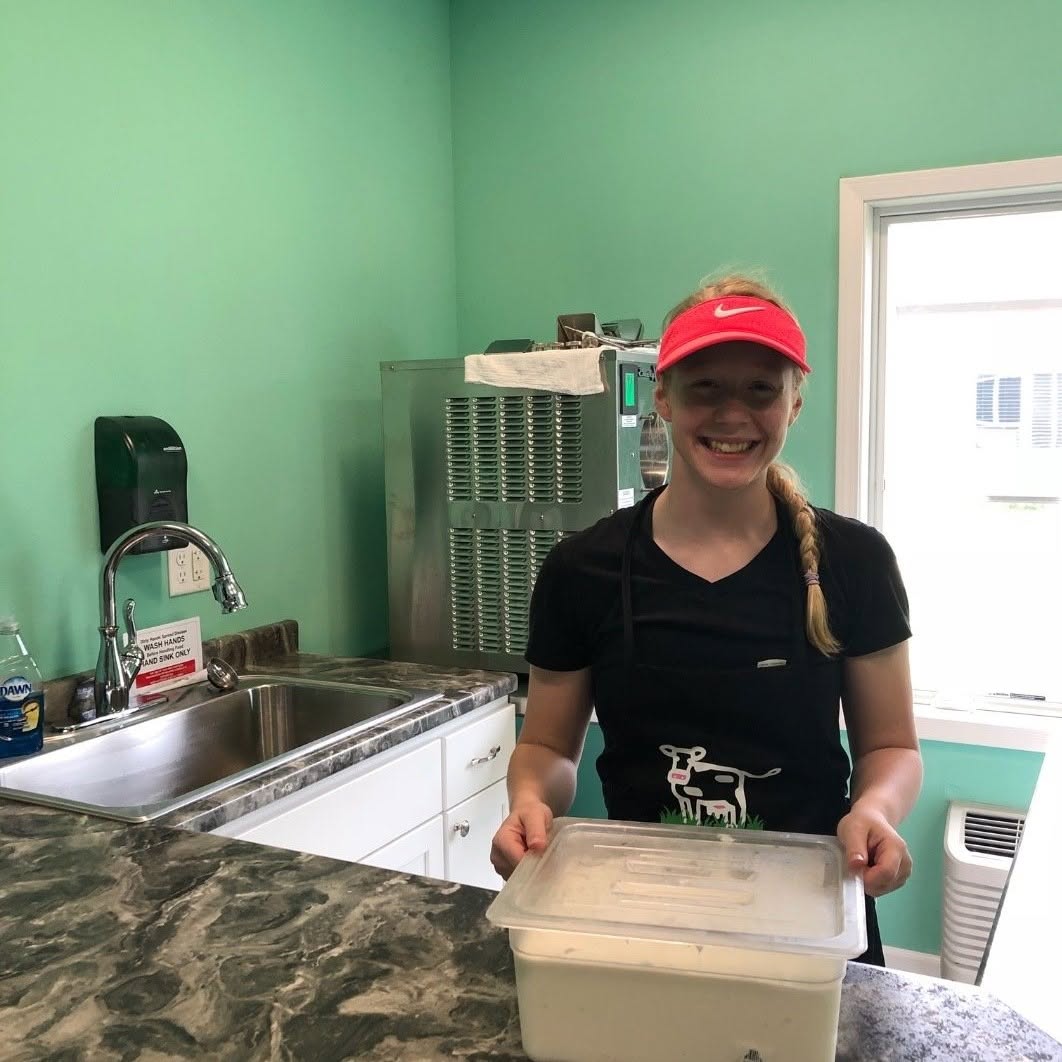
Natalie Paino, packs a tub of ice cream to go at Hightail Delivery near Plainfield, Iowa — soft-serve machine humming behind her, the family dairy’s milk turned into something the commodity check never paid for.

Her work didn’t go unnoticed, either. Iowa State University Extension and Outreach named her a 2025 “Women Impacting Ag” honoree, and in 2026 she took a $10,000 Iowa Farm Bureau “Grow Your Future” award toward the operation. The recognition matters less than what it signals: a 25-year-old built a working dairy business out of a milk check that, by her own account, hasn’t paid in decades. 

What’s Changing and Why

Here’s the gap driving it all. For a 100-199-cow operation, Cornell University’s most recent Dairy Farm Business Summary puts the full cost of production at $31-33/cwt for that size class. USDA’s June 2026 WASDE projects this year’s all-milk price at $20.70/cwt — up from the $18.95 it forecast back in February, but still well short. Even big, efficient herds run $19.14/cwt in full economic cost, per USDA ERS’s 2021 ARMS survey published in July 2024. So the loss shows up before you count a single hour of family labor. 

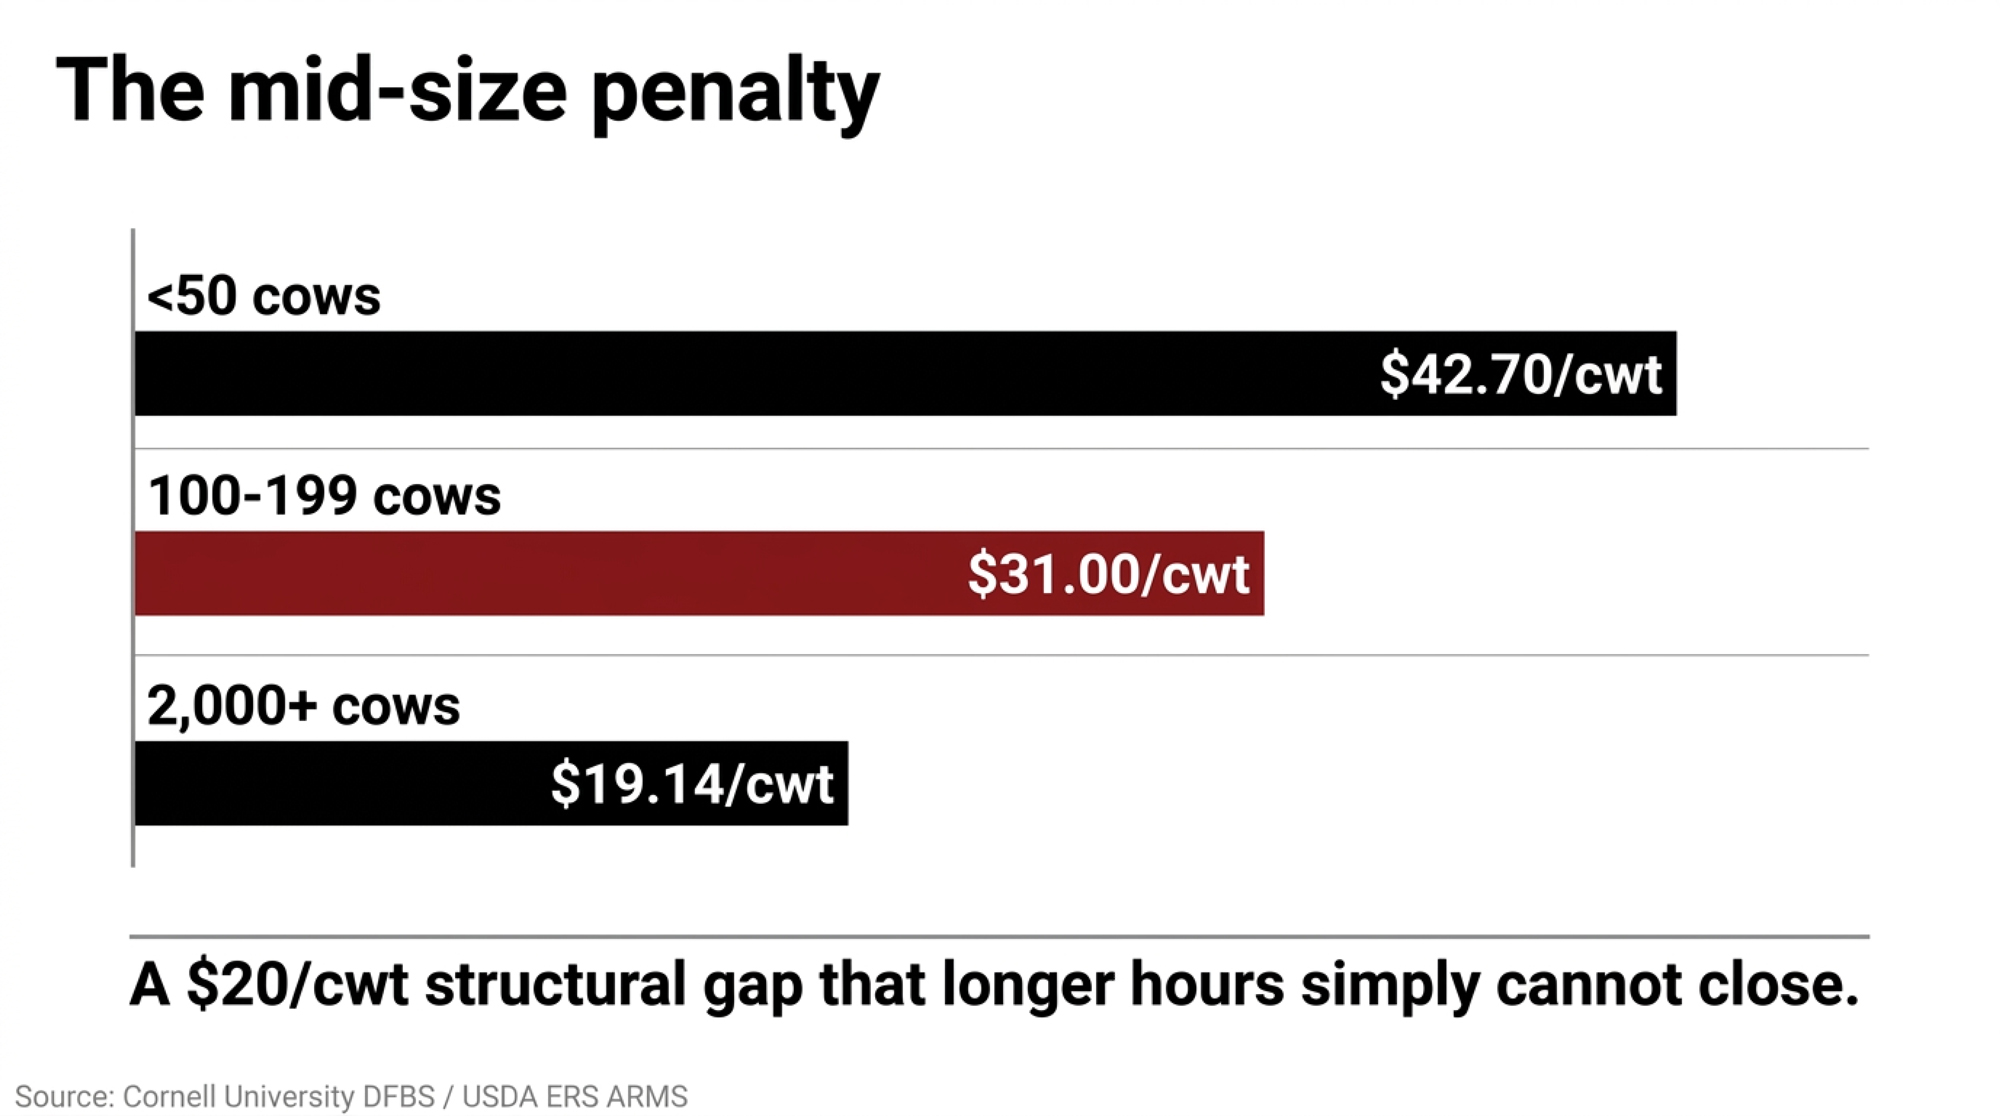
And this isn’t a rough patch you wait out. That same USDA ERS ARMS data shows herds under 50 cows carry full economic costs near $42.70/cwt, while 2,000-plus-cow operations sit at $19.14/cwt — a structural gap of more than $20/cwt that longer hours can’t close. The mid-size disadvantage is baked into purchasing power, labor efficiency, and scale, not effort. A cycle ends. This one hasn’t ended for small- to mid-sized commodity dairy in over a generation. 

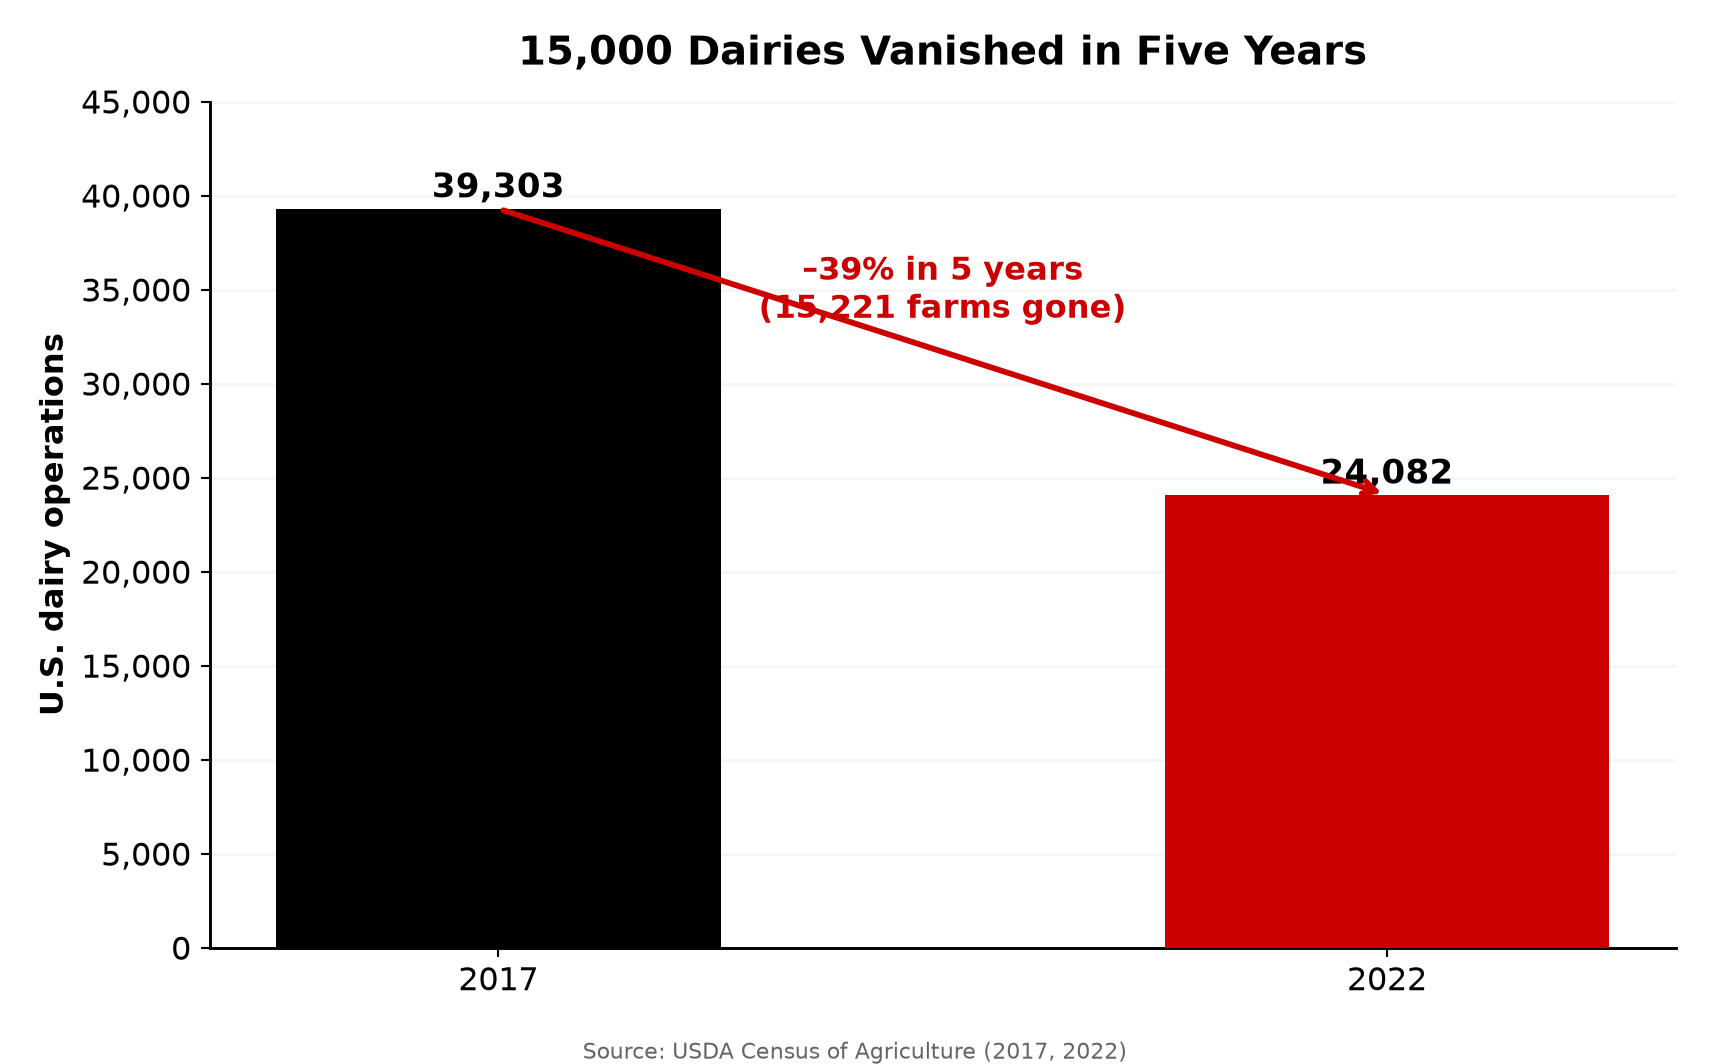
The squeeze lands hardest in the middle. Big enough to be a full-time business, too small to hit the cost efficiencies of a 2,000-cow operation. The 2022 USDA Census of Agriculture counted 24,082 dairy operations, down from 39,303 in 2017 — roughly a 39% drop in five years. The mid-size herd is standing right in its path. 

That exit rate isn’t spread evenly. The farms disappearing fastest are the ones too big to run as a hobby and too small to out-buy and out-scale a mega-dairy on feed, labor, and capital. Paino’s own read on the long arc — four decades of flat, inflation-adjusted prices — is exactly the math that’s been quietly thinning that middle for years. Where does your breakeven actually sit? If you haven’t run that number against $20.70 milk lately, that’s the first thing this piece should push you to do. 

How This Plays Out on Real Farms

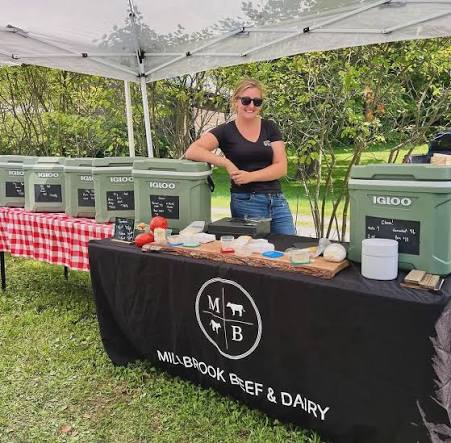
Keegan Donovan works her Millbrook Beef and Dairy stand at a farmers market in Dutchess County, New York — coolers of product, a board of fresh cheese, and the first-generation bet that direct sales beat shipping commodity milk.

Paino isn’t a one-off. Keegan Donovan was 22 when she and her husband, Brian, launched Millbrook Beef and Dairy in Dutchess County, New York, in 2022 — first-generation farmers who quickly found that the cost of producing their milk outran what they were paid for it. Their answer was to stop shipping commodity milk entirely and sell beef, dairy, pork, and eggs directly off the farm. “You have to be able to bet on yourself,” Keegan told Main Street Magazine in 2024. For two people who started with no land base and no inherited herd, that bet was the whole business plan. 

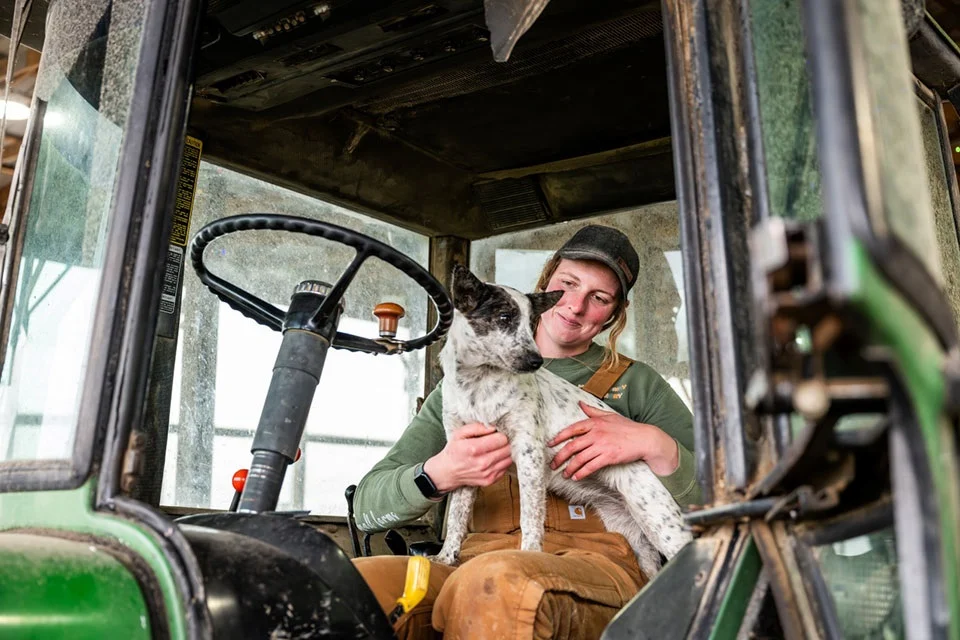
Emily Mullen-Niccum takes a quiet minute with the farm dog in the tractor cab at her family’s Butler County, Ohio dairy — one of the two operations left in a county that once ran 88, now turning 4,000 pounds of milk a week into 35 flavors.

Then there’s Emily Mullen-Niccum, who came back to her family’s Butler County, Ohio, dairy knowing exactly how the commodity story ends there. Her county had gone from 88 dairies in 1970 down to two. She runs about 65 cows through a robotic milker and turns 4,000 pounds of milk a week into 35 product flavors. Her line to DTN/Progressive Farmer in January 2025 lands harder than any margin chart: “Average was over. Nothing bad about Dad or that generation of farmers… However, that generation has forgotten their worth.” 

What ties these three together isn’t age or geography. It’s the same calculation, run independently, ending the same way: the milk check alone doesn’t clear the cost of producing the milk, so they each found a buyer who’d pay for something more than a tanker pickup. None of them set out to be a movement. Each one just looked at the same spread between cost and check and decided the tanker wasn’t the only way off the farm.

Now the barn math — and watch what it does to the dream version. Take a slightly bigger herd than the one in the headline — 500 cows — and carve off 20% into a direct channel netting an extra $1.50 a gallon. At roughly 70 lbs of milk per cow, that slice is about 800 gallons a day (at 8.6 lbs per gallon), which throws off close to $1,200 a day.Sounds like the problem’s solved. It isn’t. You’re still shipping the other 80% into the same commodity market that’s bleeding money, and that premium only shows up if you actually sell every gallon you process. The direct channel doesn’t replace the milk check. It patches part of the hole the check leaves — and only when the selling works.

The Mechanics Behind the Outcomes

So the first thing to get straight: value-added is a wedge, not a replacement. A 300-cow herd makes around 21,000 lbs of milk a day — far more than a farmstead creamery typically moves. Most operations at this scale process only a fraction of their own volume through premium channels and ship the rest conventionally; UMass Extension warns producers outright that a value-added business may not turn a profit in its first five years. The co-op check doesn’t vanish. It shrinks while a higher-margin slice grows beside it. 

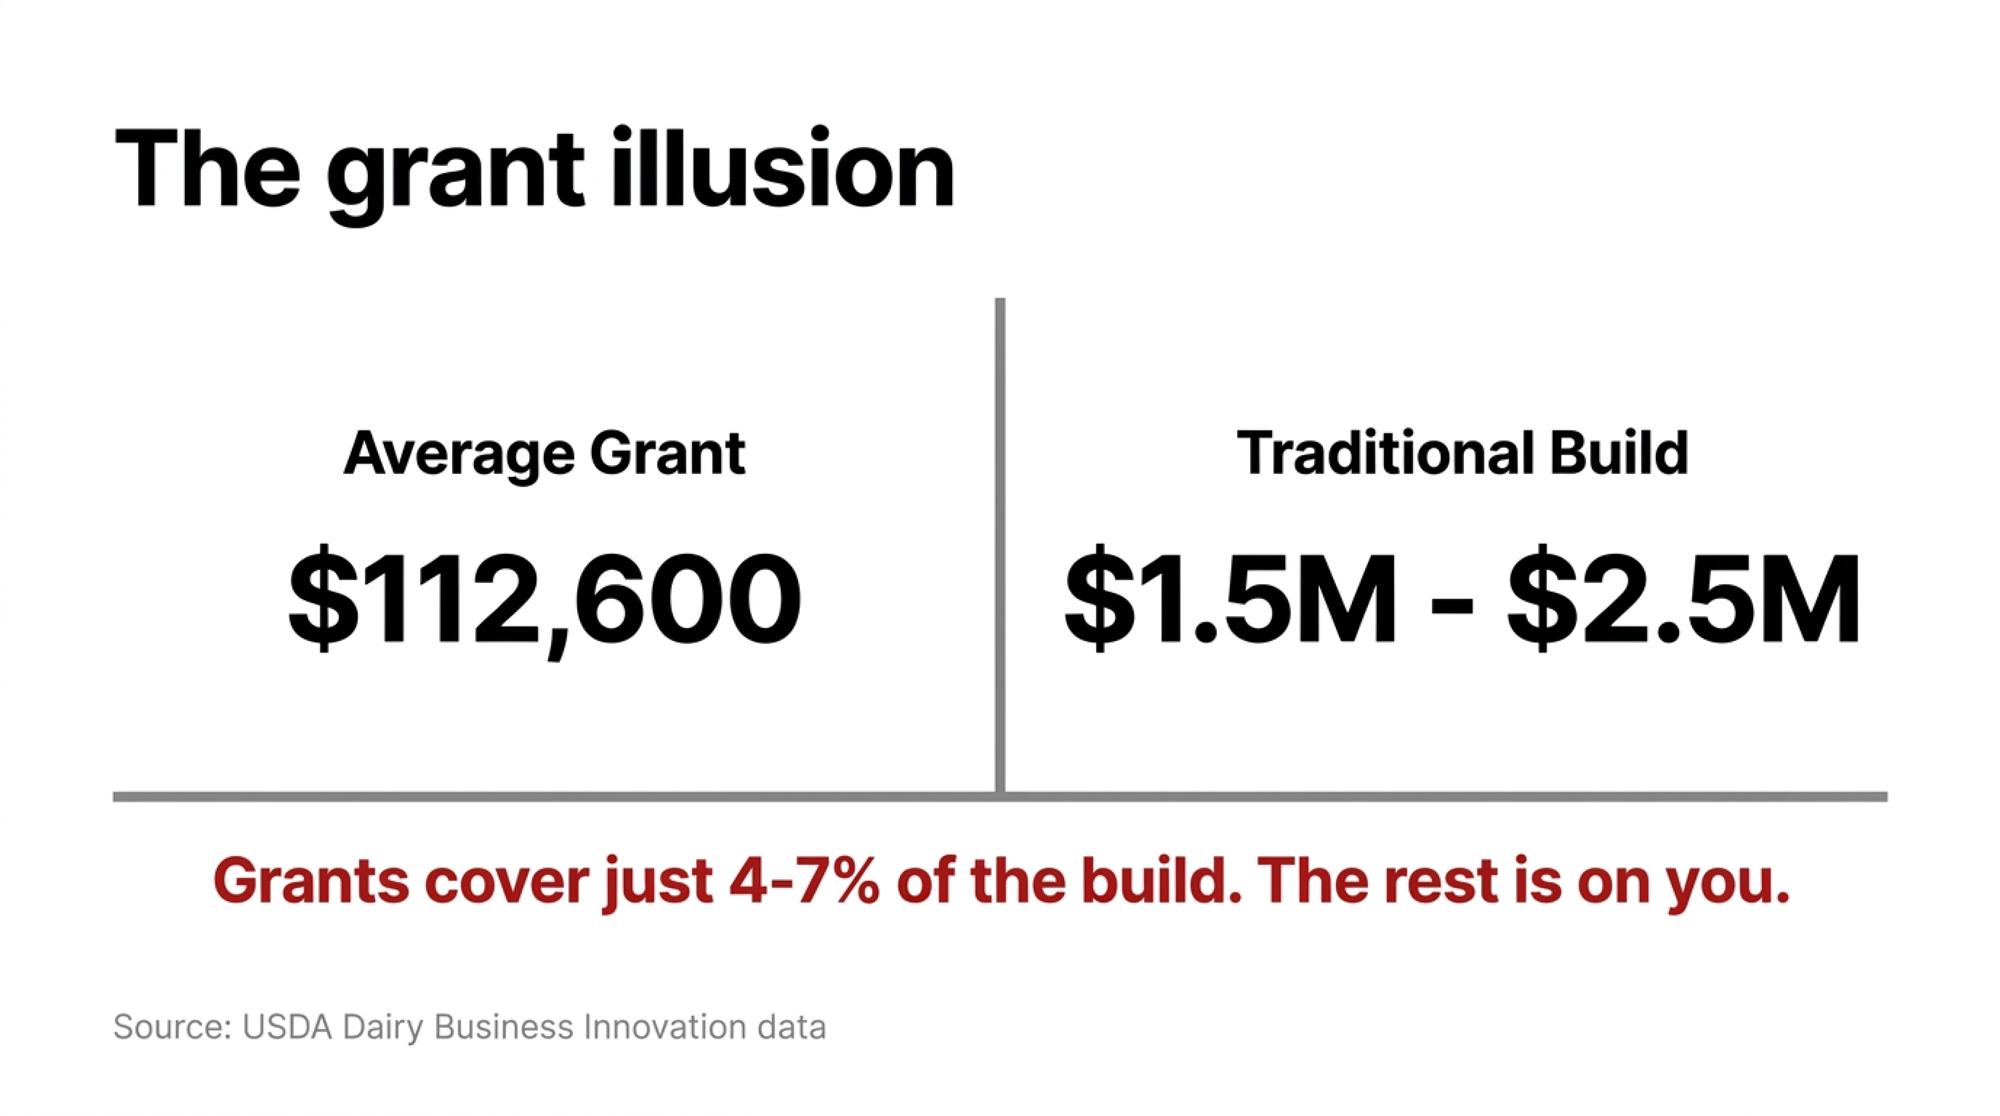
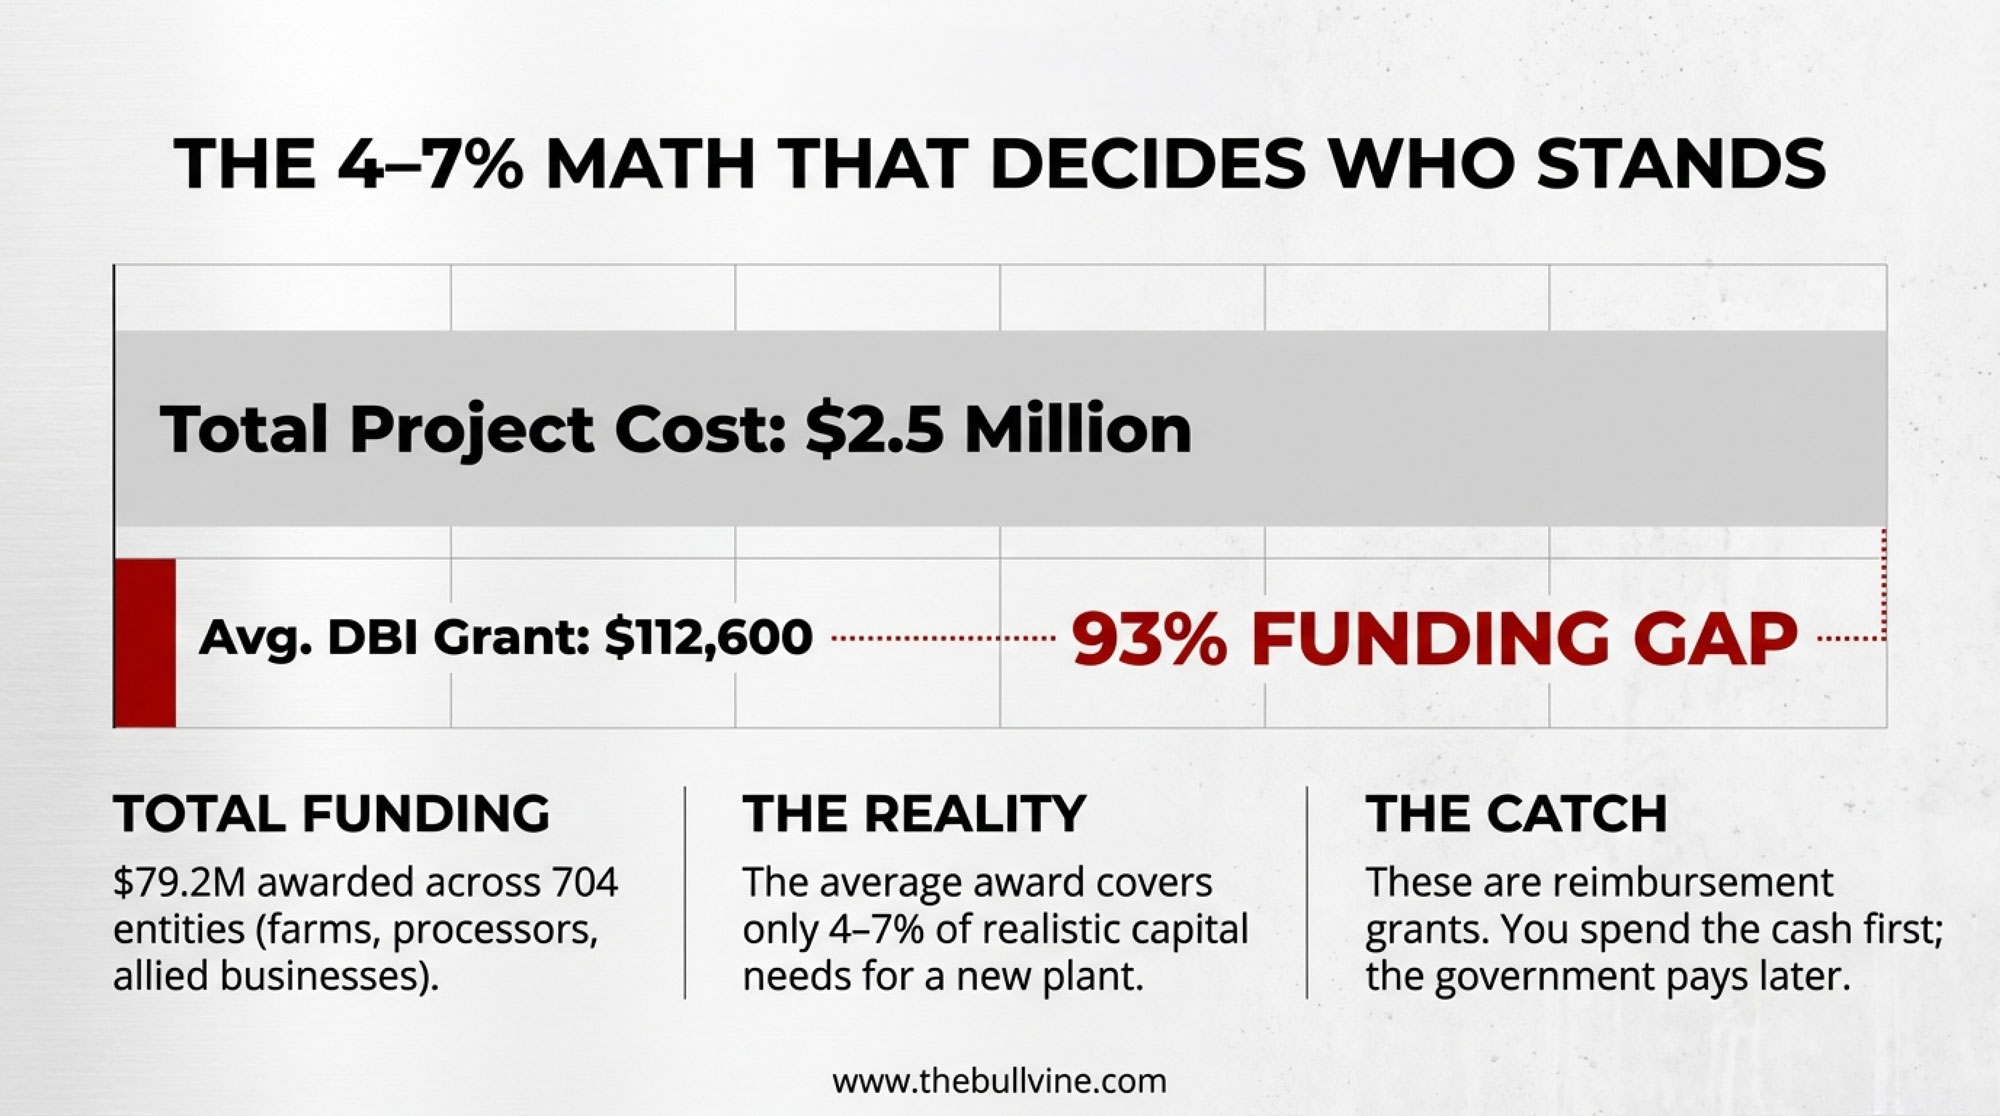
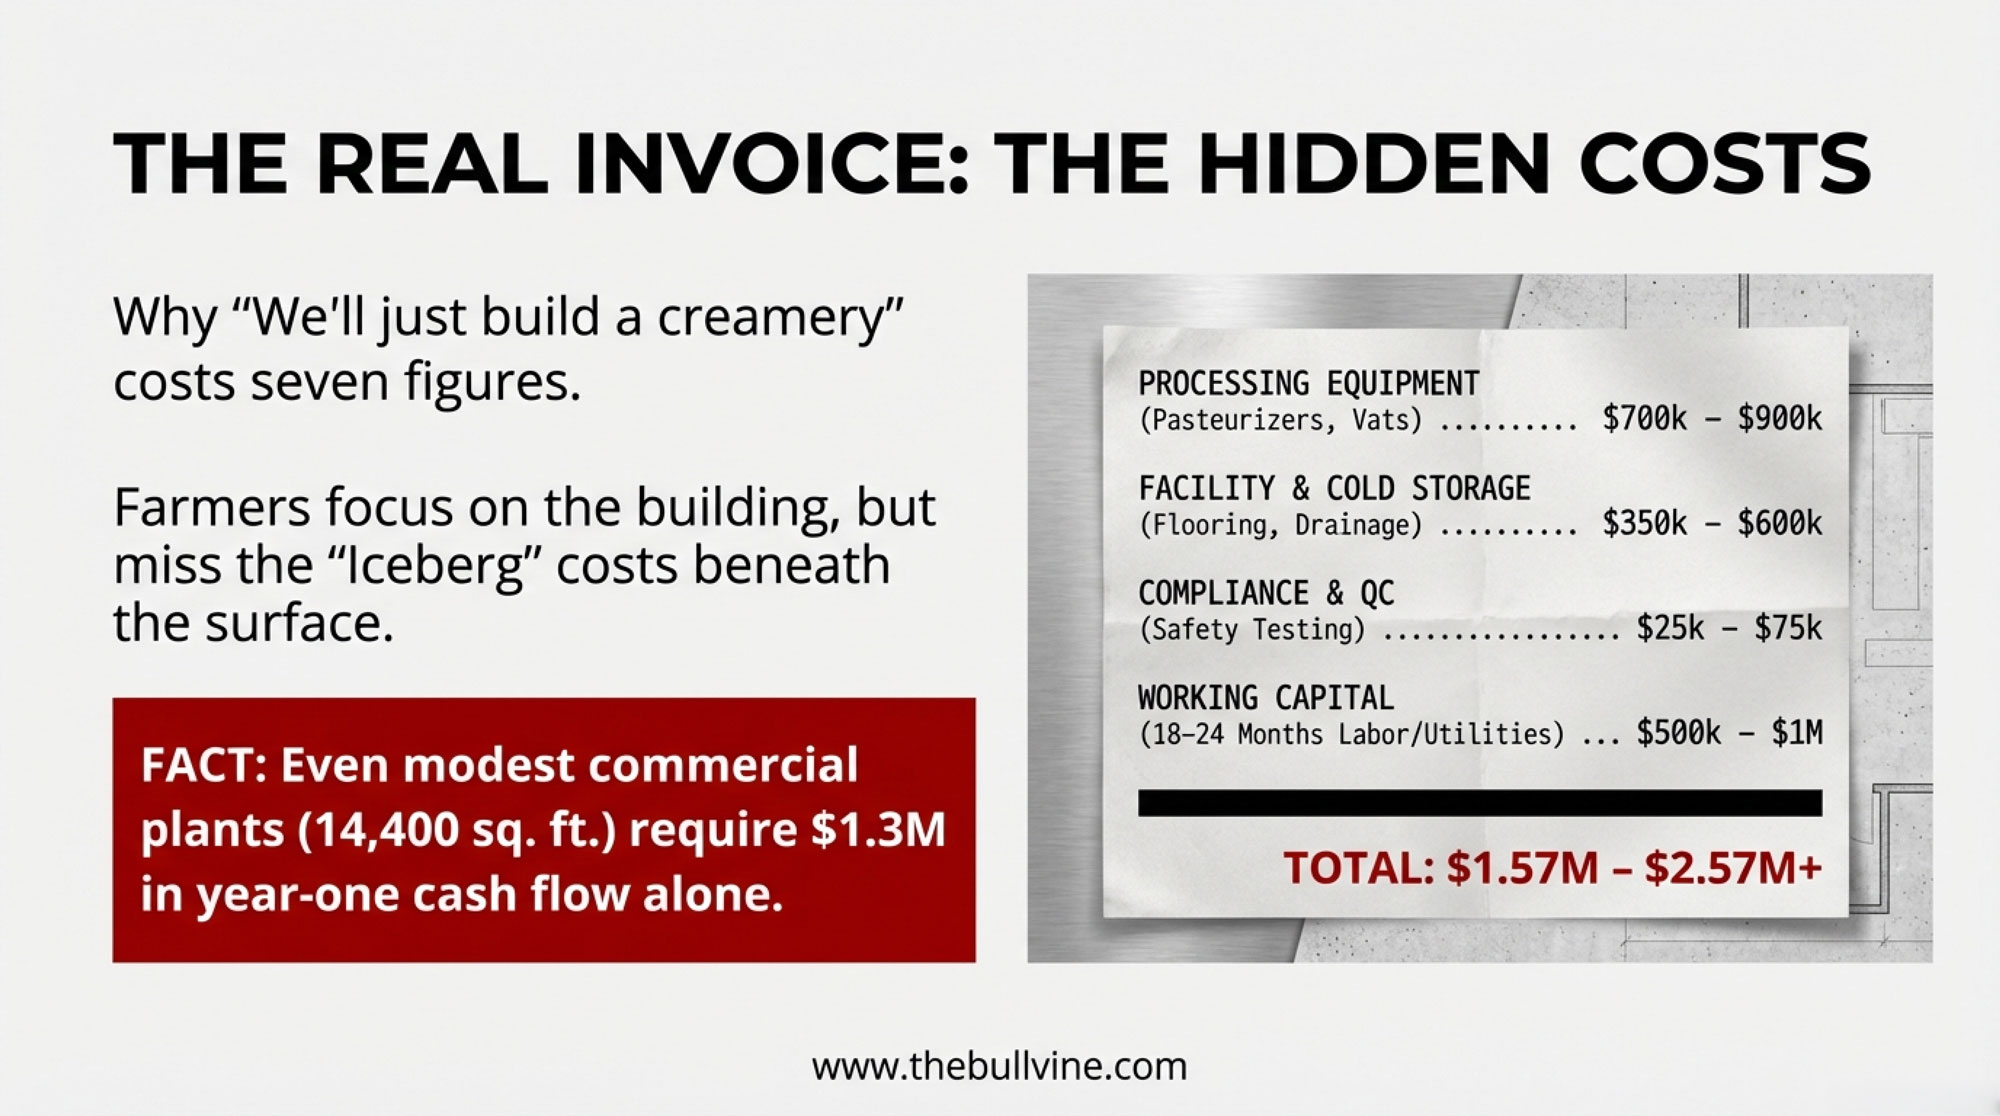
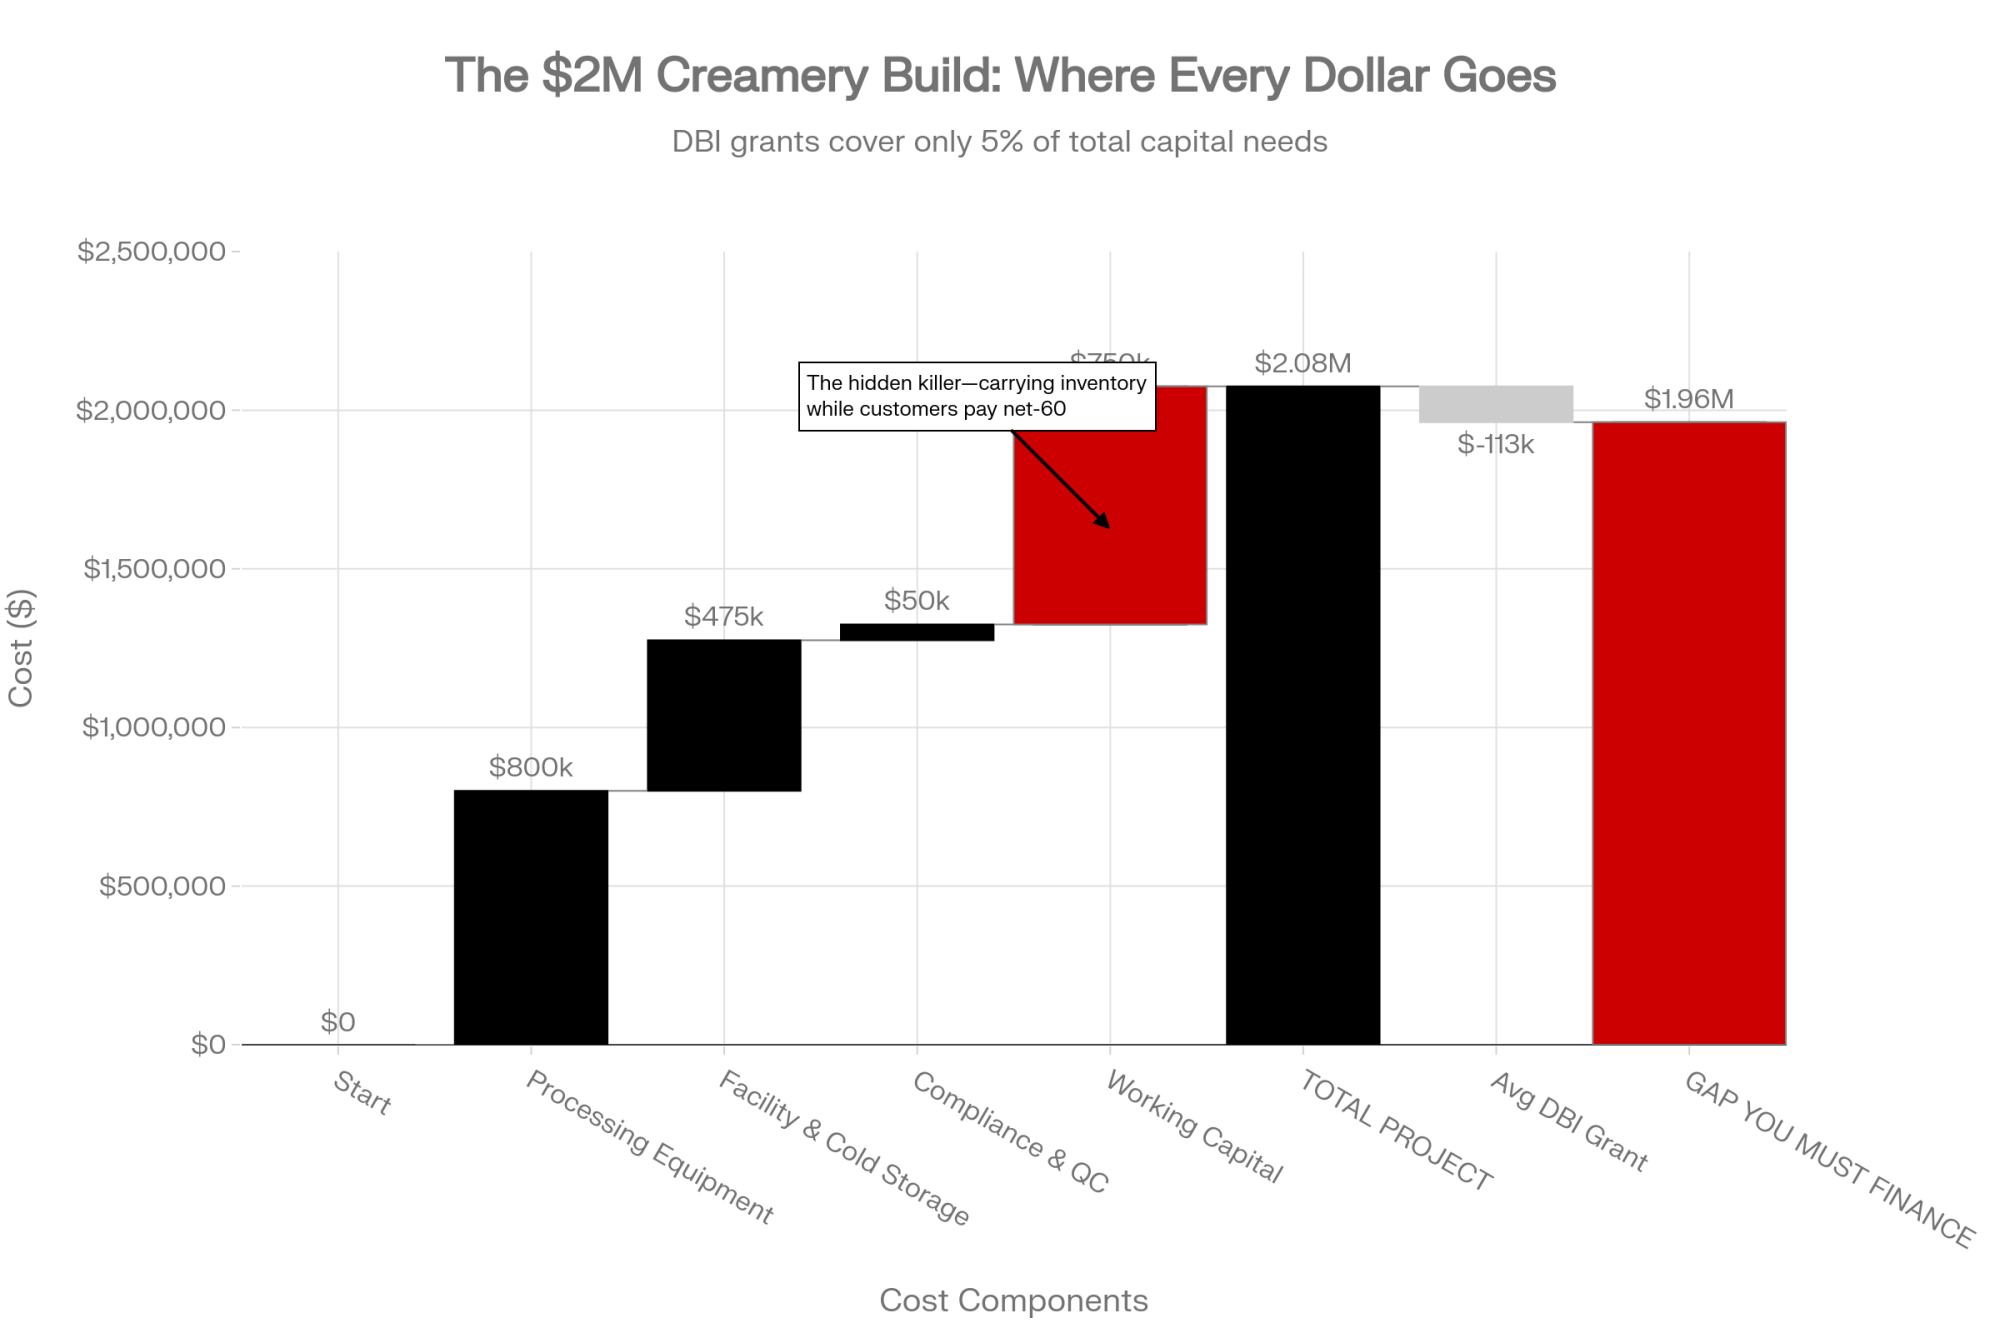
The capital math is humbling, too. A traditional on-farm creamery build runs $1.5-2.5 million, and the average USDA Dairy Business Innovation grant works out to roughly $112,600 per funded entity — about 4-7% of the bill. That’s the number that should stop people cold. Paino dodged it by going small on purpose. “Building a traditional creamery could easily cost millions of dollars,” she said. “So I started researching micro-dairies.” A shipping container isn’t a romantic origin story. It’s how you keep the entry cost from burying you before the first batch sells. 

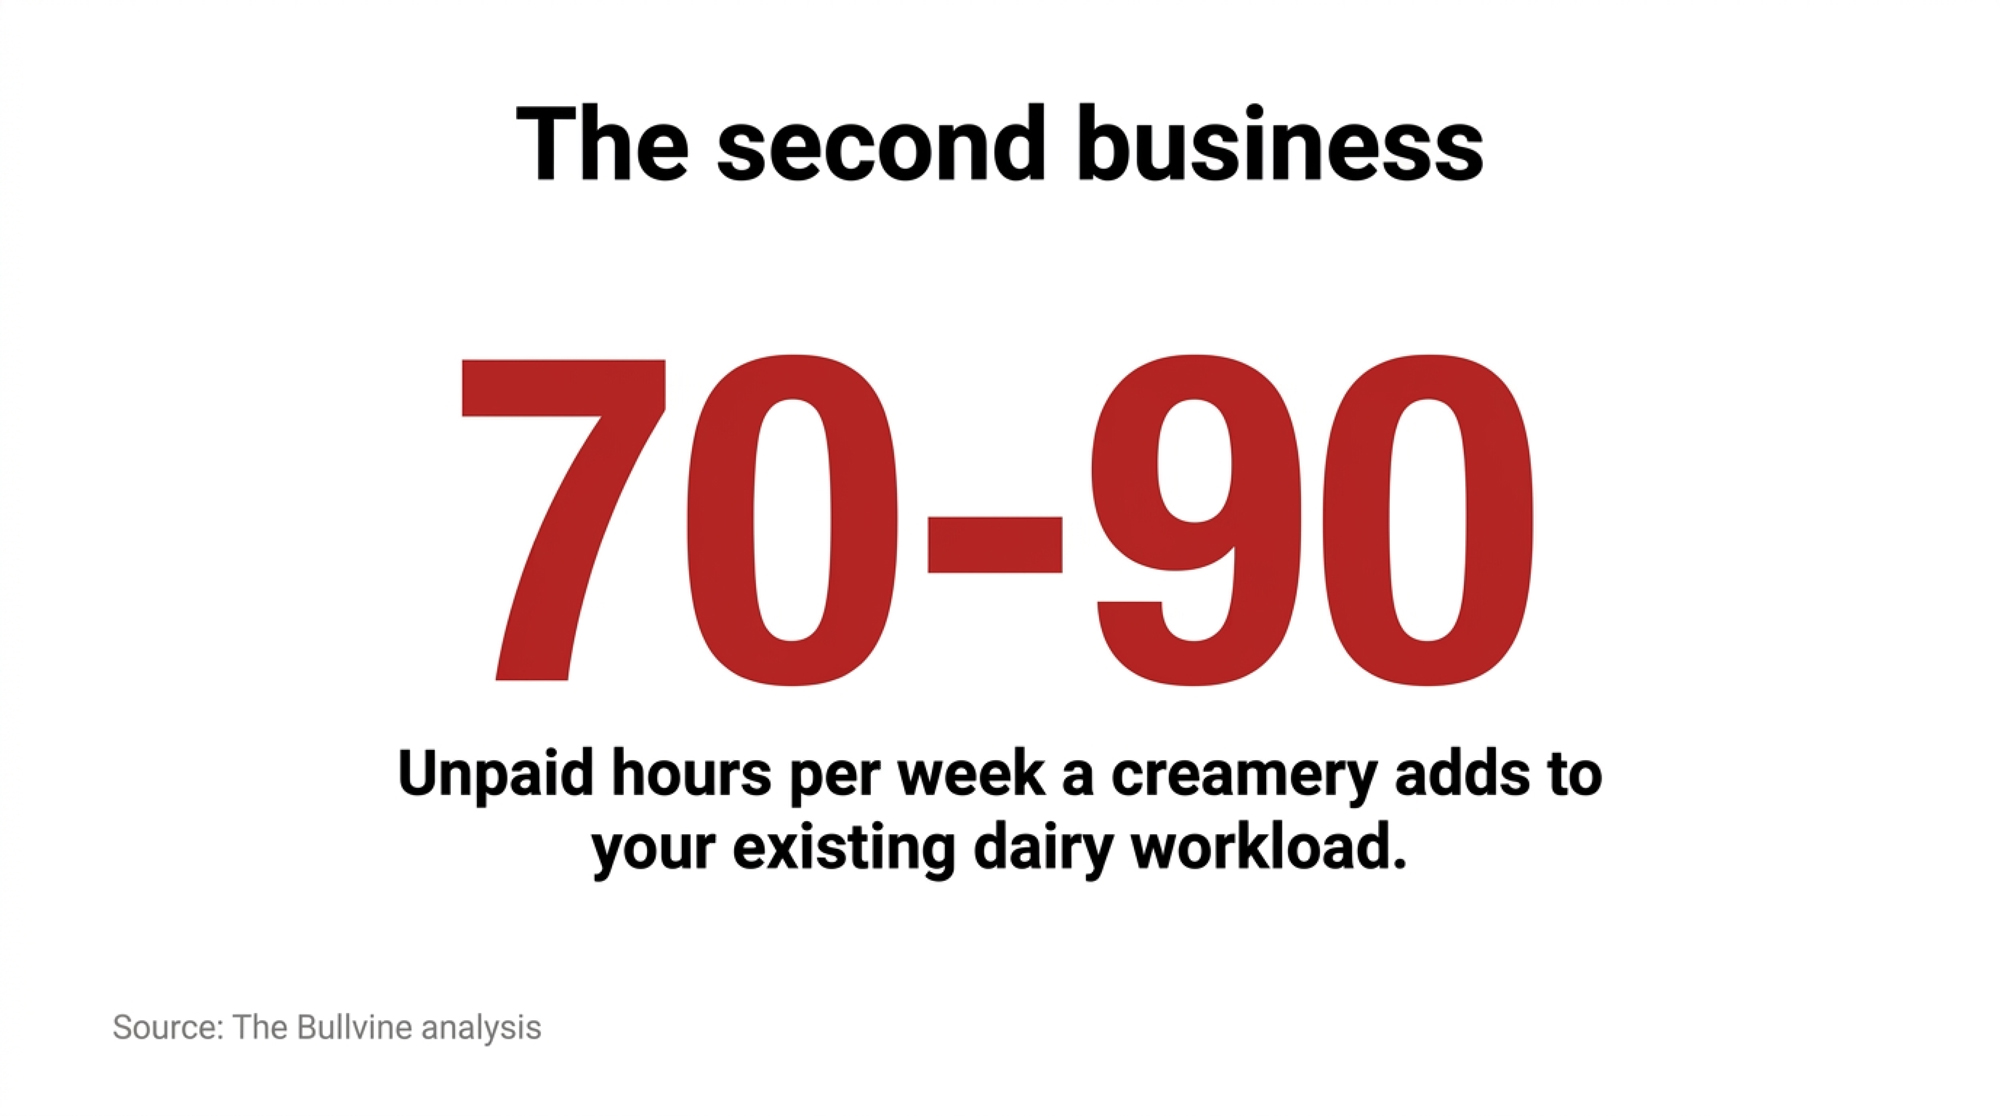
Then there’s the cost nobody pencils in. A Bullvine analysis of a documented creamery operation found that on-farm processing added 70-90 hours per week to a full dairy workload. That’s not a side hustle. That’s a second business stapled to the first one — and somebody in the family has to run it, or you’re hiring it out and watching that $1.50 premium shrink. 

Paino’s six-year timeline tells you the rest. The grant applications, the 423-page PMO, the licensing that didn’t clear until her 25th birthday — that’s not slow execution, that’s the actual length of the on-ramp. Anyone who thinks value-added is a quick pivot out of a bad milk year has the timeline backwards. You start building before the crisis, or you’re building during it with no runway left. 

What Does This Mean for Your Co-op?

Here’s the angle that doesn’t get talked about enough. Every gallon a young member routes into ice cream or curds is a gallon that doesn’t ride the co-op tanker. And the members most likely to peel off are exactly the ones a co-op needs for the next 30 years — the under-35 crowd, who already make up just 9% of U.S. producers (USDA 2022 Census). When your youngest, most adaptable members start carving off volume, the erosion isn’t just this year’s pounds. It’s the future supply base. 

Run the co-op-side math, using that same 500-cow member from above. Shift 20% — roughly 7,000 lbs a day — out of the commodity pool and into their own creamery. Over a year, that’s about 2.5 million pounds of fluid milk leaving the co-op’s book from one farm (7,000 lbs × 365 days; illustrative, built on the herd assumptions above). One farm won’t move a regional co-op. But ten or twenty of them, clustered near the same metro markets where value-added actually works, start to thin the fluid pool on which a balance sheet was built.

The honest read for co-op supply managers: this isn’t a stampede, and there’s no clean public figure yet on how much volume direct channels are pulling out of co-op pools. But the direction is one-way. The members leaving the commodity pool aren’t the ones retiring out — they’re the ones who were supposed to be still shipping in 2050.

Is Value-Added Actually Right for Your Farm?

Before you price a single tank, run the operation through five honest filters. Each one has killed more creamery dreams than bad product ever has. Lay them out as a vertical checklist block — one card per filter, each with the question on top and the hard number underneath — so a reader has to slow down and answer each before scrolling on.

FilterThe QuestionHard NumberKill Signal
1 — Market AccessWithin reach of a metro market that’ll pay a premium?Needs a farmers-market track record, not a hunchNo market = no margin
2 — CapitalCan you fund the build without betting the dairy?Grant covers only 4–7% of a $1.5–2.5M buildFull-scale number sinks most first-timers
3 — LaborWho runs the second business?On-farm processing adds 70–90 hrs/week“We’ll figure it out” = unstaffed second business
4 — Regulatory LoadReady for the PMO, licensing, inspections?The PMO runs 423 pages; on-ramp ran 6 years for PainoTreating compliance as a footnote, not the job
5 — Margin BreakevenAt what volume/price does the premium clear costs?Budget for no profit in years 1–5 (UMass)Can’t write the number = a hope, not a plan
  • FILTER 1 — MARKET ACCESS Are you within reach of a metro market with buyers who’ll pay a premium — and can you prove it with a farmers-market track record, not a hunch? UMass Extension’s first question is blunt: are your locations convenient to the consumer? No market, no margin. 
  • FILTER 2 — CAPITAL Can you fund the build without betting the dairy? The grant covers 4-7%, not half. The rest is on you and your lender — a micro-build like Paino’s container creamery exists precisely because the full-scale number sinks most first-timers. 
  • FILTER 3 — LABOR Who’s running the second business — the processing, deliveries, licensing paperwork, and marketing? If the answer is “we’ll figure it out,” that’s 70-90 hours a week with no name attached to it. 
  • FILTER 4 — REGULATORY LOAD Are you ready for the Pasteurized Milk Ordinance, state licensing, and inspection cycles? Paino read all 423 pages of the PMO. That’s the job, not a footnote. 
  • FILTER 5 — MARGIN BREAKEVEN At what volume and price does the premium actually cover processing, labor, packaging, and spoilage? UMass tells producers straight: budget for no profit in the first five years. If you can’t write that number down, you don’t have a plan — you have a hope. 

Clear all five, and value-added is a real wedge against the squeeze. Miss two or more, and you’re building a money pit with a freezer attached.

How Much Does Waiting Actually Cost You?

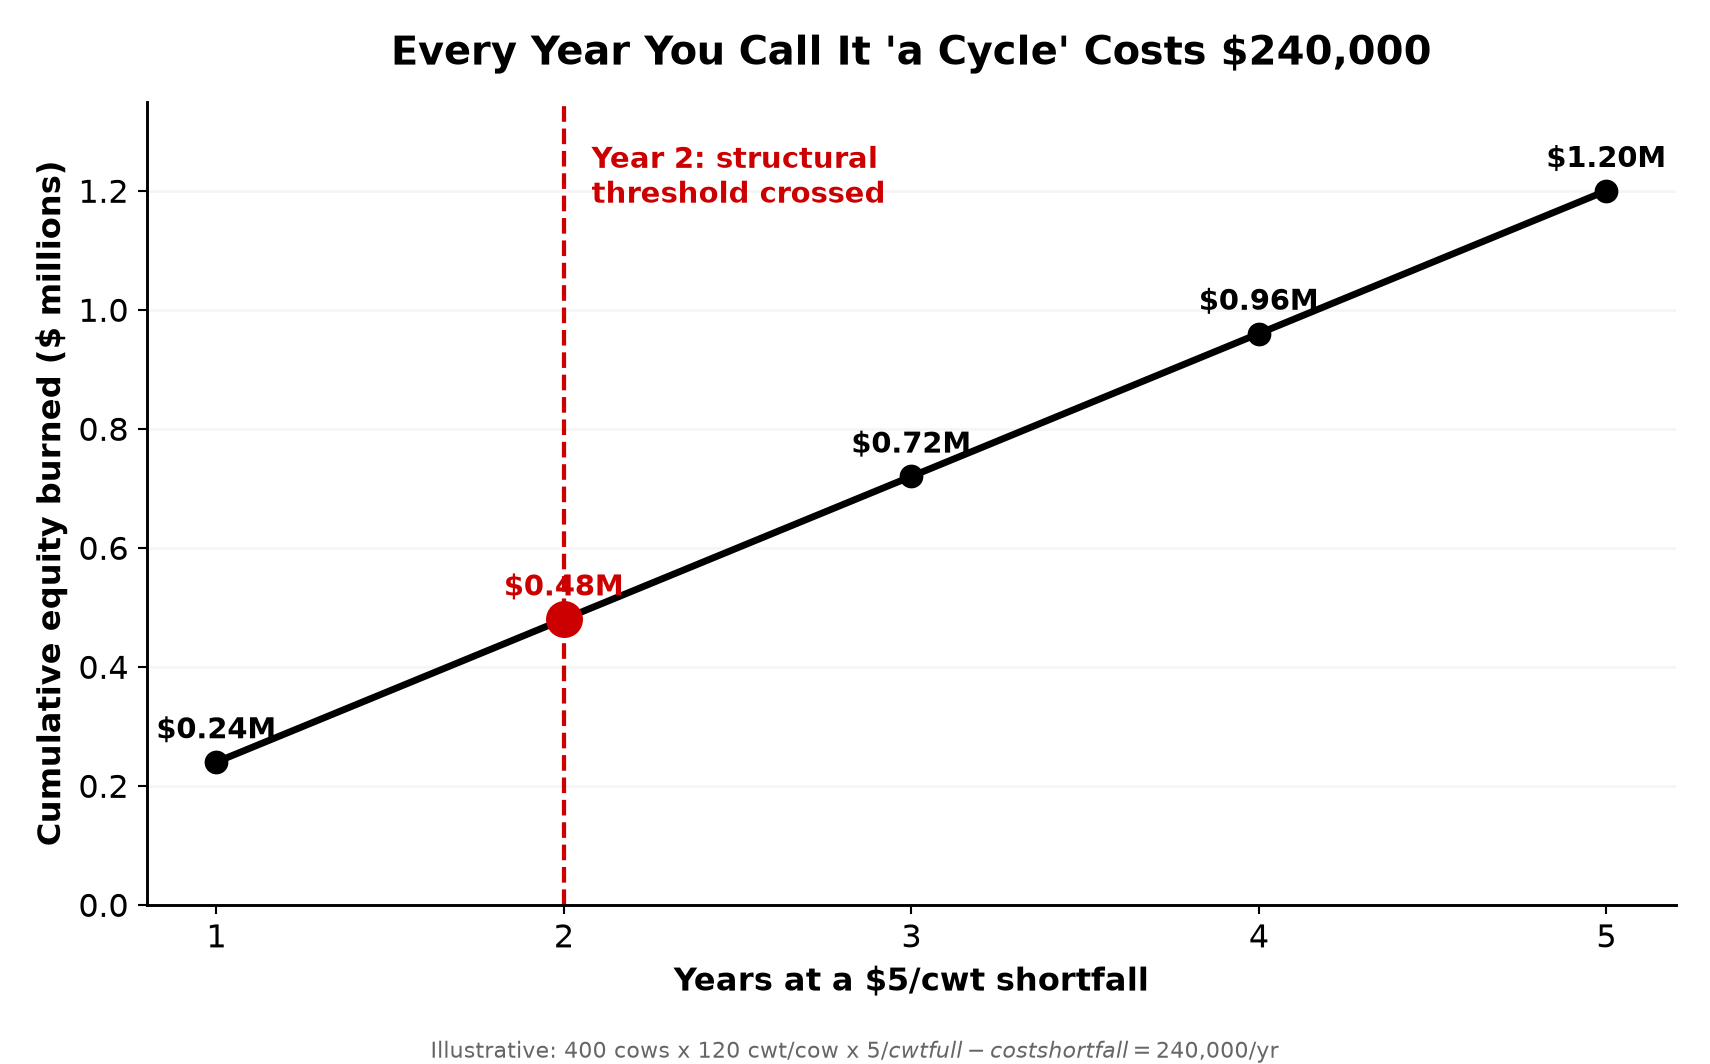
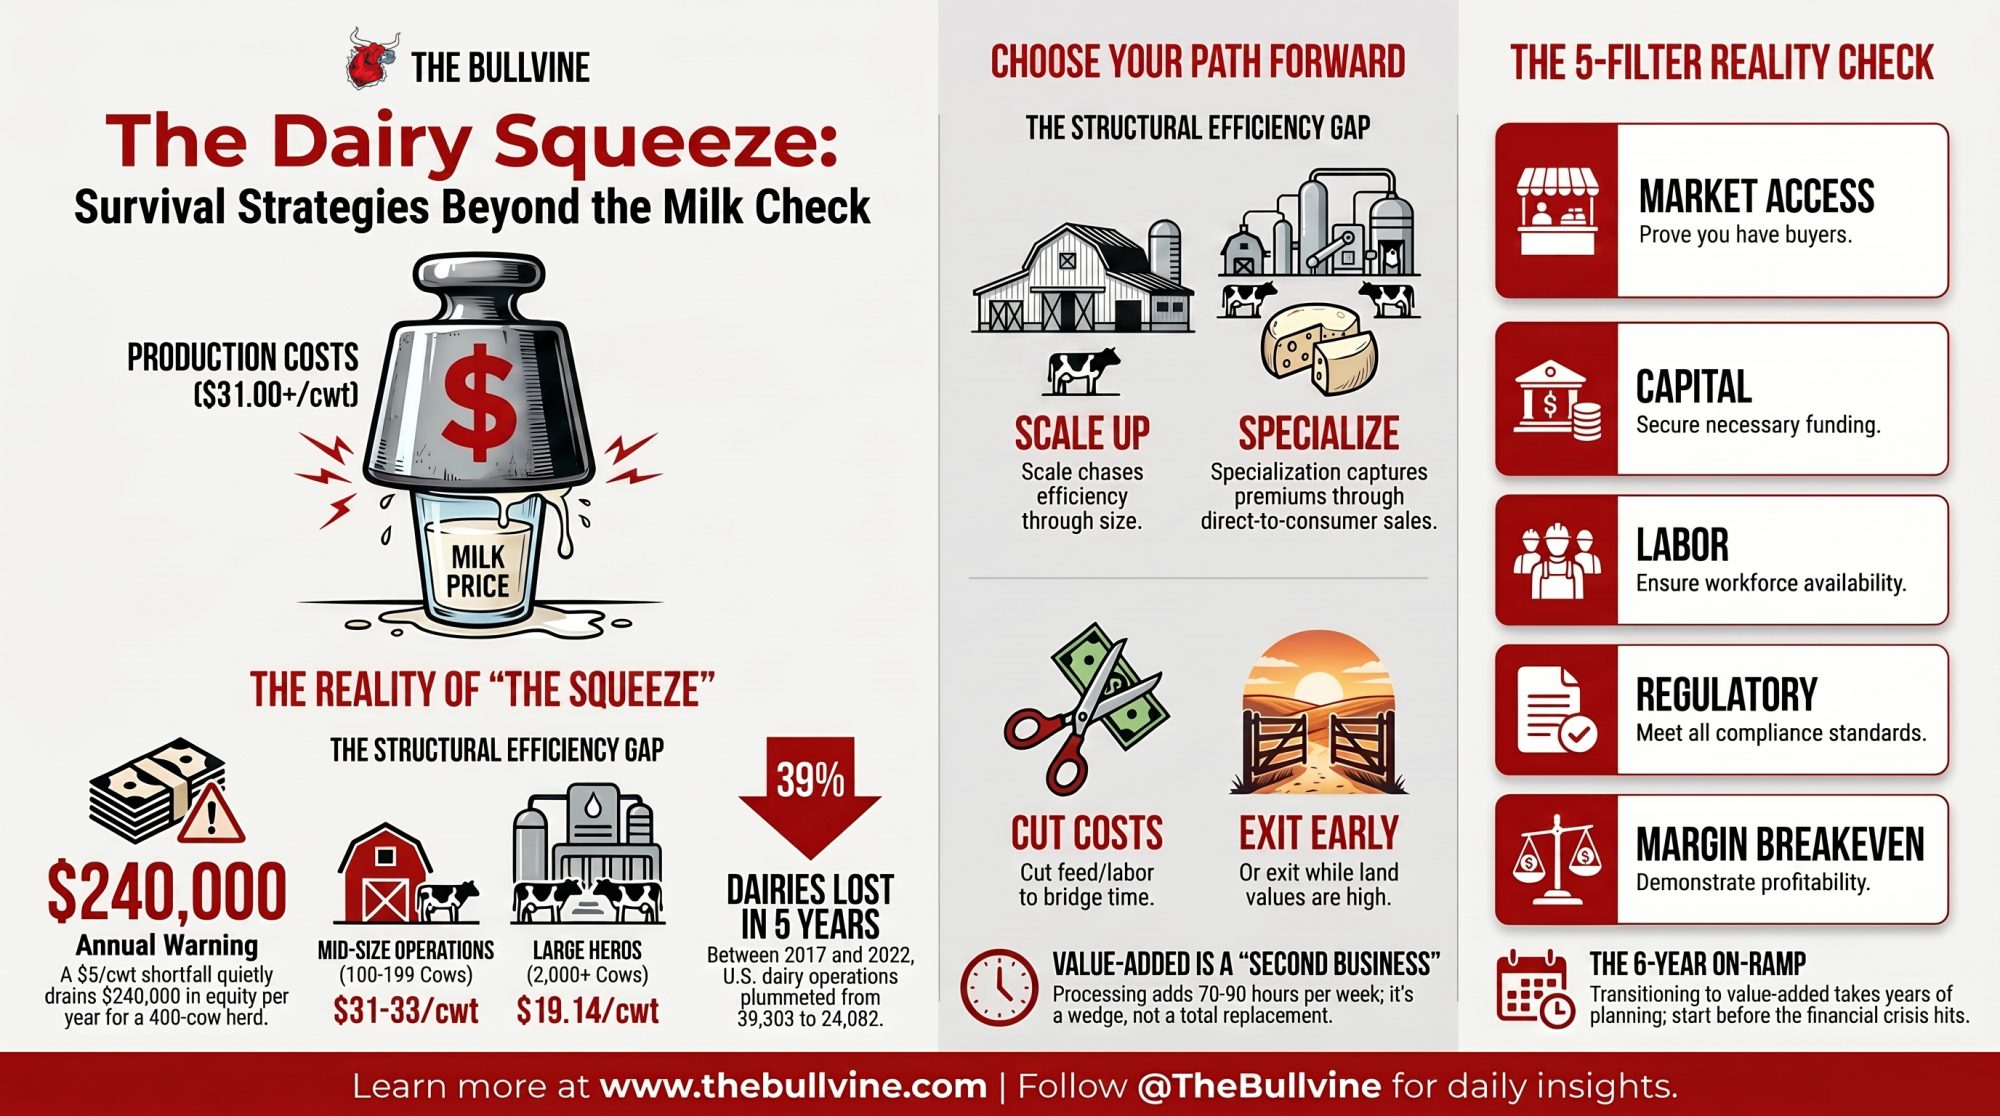
This is where the clock matters. There’s no tidy figure for how long a struggling dairy drifts before it exits, but the pattern advisors describe is consistent: if off-farm income has bailed out farm operating losses in three or more of the last five years, that’s structural, not a tight stretch. Put real numbers on it. For a 400-cow herd shipping 120 cwt per cow, a $5/cwt full-cost shortfall amounts to about $240,000 a year — straight out of family equity, not the feed mill or the co-op. Every year you call that “a cycle,” that’s the bill. 

So the honest question isn’t “will prices come back?” It’s “what is this gray zone costing me every year I keep deciding not to decide?” Bullvine’s modeling puts the critical threshold at two consecutive years of full cost above the all-milk price — past that, you’re funding someone else’s business plan with your own balance sheet. The direction is one-way, and the value-added on-ramp that might offset it runs for years, not months. So the decision and the build can’t be the same conversation. 

Is Your Inheritance Plan Built on a Real Conversation?

Plenty of operators absorb losses on the quiet assumption that a son or daughter will take over. Be careful with that one. Only 9% of U.S. producers are under 35, and the average age of producers is 58.1 years (USDA 2022 Census). Iowa State research found a daughter’s odds of being the chosen successor climb from about 5.4% to 20.7% when she has real farm experience — though the experience and an explicit plan have to come first, and that figure is Iowa-specific, so treat it as directional rather than national. 

Here’s the sharper question underneath it. What are you actually trying to pass on — the land and the history, or this exact commodity business model? They’re not the same thing. Families hand down land and paid-off equipment all the time. Far fewer manage to hand down an unchanged model that’s losing money at today’s prices, and asking a 25-year-old to inherit a margin gap isn’t much of a gift. The young operators in this piece didn’t reject the family farm — they rejected the part of it that didn’t pay, and kept the cows.

Options and Trade-Offs for Farmers

When the commodity math breaks, four structural responses exist. Not all of them are open to every farm. Present these as four side-by-side path cards — each with the move, when it works, and the trap — so a reader can scan straight to the one that fits their balance sheet.

PathThe MoveWorks WhenThe Trap
Scale UpChase size efficiency — big herds run $19.14/cwt vs. $42.70 for the smallestYou’ve got equity and lending roomBorrowing toward efficiency you can’t service — millions of capital on an already-underwater sheet
Specialize (Value-Added)Capture the premium — diversified dairies report $25K–$300K/yr in non-commodity incomeYou’ve cleared all five filtersBuild the creamery before proving demand and you’ve bought a pricier way to lose money
Cut the Cost BaseAttack feed and labor — the two biggest cost linesYou need a bridge while you decideStalls as a standalone — most survivors already trimmed what they can; there’s a floor
Exit on Your TermsSell while land values holdNo viable successor, no capital for specializationWaiting until a lender forces the sale instead of choosing the timing
  • PATH 1 — SCALE UP The move: Chase the cost efficiency of size. The biggest herds run at $19.14/cwt full cost while the smallest sit near $42.70, and that gap is widening, not closing. Works when: You’ve got equity and lending room. The trap: Borrowing your way toward an efficiency you can’t service — reaching cost-competitive scale can mean millions in capital on a sheet that’s already underwater.
  • PATH 2 — SPECIALIZE (VALUE-ADDED / DIRECT) The move: Capture the premium. Diversified dairies have reported anywhere from $25,000 to $300,000 a year in non-commodity income, depending on scale and channel, while commodity producers fought for pennies at the milk check. The road Paino, the Donovans, and Mullen-Niccum each took. Works when: You’ve cleared all five filters above. The trap: Build the creamery before you’ve proven the demand and you’ve just bought a more expensive way to lose money.
  • PATH 3 — CUT THE COST BASE The move: Attack feed and labor — the two biggest lines in cost of production. Works when: You need a bridge while you decide. The trap: As a standalone strategy it stalls — most farms still running have already trimmed what they can, and there’s a floor under how lean you can get.
  • PATH 4 — EXIT ON YOUR TERMS The move: Sell while land values hold. Land has held or risen across most regions even as margins fell. Works when: There’s no viable successor and no capital for specialization. The trap: Waiting until a lender forces the sale instead of choosing the timing yourself.

The move that fits any of these — and you can start it this month: pull your last 12 months of milk checks, feed bills, debt service, and labor, and calculate your real cost per hundredweight, your own and your spouse’s labor included at $18-22/hour. Most operators in trouble are flying on feel instead of a current number. You can’t pick a path until you know which side of breakeven you’re actually standing on.

Run Your Own Number First

Dairy Profit Projector — This whole piece comes down to one question: would your farm make money at $20.70 milk? Run your herd through the Projector to pressure-test breakeven milk price, IOFC, and your next 12 months of margin before you pick a path — or decide value-added is worth the six-year build.

Key Takeaways

  • If you haven’t calculated full cost per cwt — family labor included at $18-22/hour — in the last 12 months, do it before month’s end. Every other decision waits on that number. 
  • If your full cost of production stays above the $20.70 all-milk projection for two consecutive years, the gap is coming out of family equity — treat that as the line, not a rough patch. 
  • If government payments (nearly 29% of net farm income nationally in 2026) are covering operating losses rather than topping up profit, read that as a signal, not a cushion. 
  • If you’re eyeing value-added, model it on a slice of your volume — not all of it — clear all five filters, and budget for no profit in years one through five. 
  • If a grant is what makes your creamery plan pencil, the plan doesn’t pencil. The average DBI grant covers about 4-7% of the build. 
  • If you’re starting a value-added build to escape a bad year, you’re already too late for that year — Paino’s on-ramp ran six years. Start before you need it. 
  • If you’re a co-op supply manager and your under-35 members are floating direct-channel ideas, treat retention of that group as a volume-planning issue now, not a problem for later.
  • If you’ve got no named, willing successor who’s actually seen the numbers, stop absorbing losses “for the next generation” until you’ve had that talk.

What’s Your Number?

So here’s what’s worth sitting with tonight. Strip out the off-farm paycheck and the government check — would this farm still make money at $20.70 milk? And if not, which of the four paths actually fits your balance sheet and your zip code? Most operators already know the answer in their gut. The numbers just make it sayable — and they tell you which door to walk through while you still get to choose. Natalie Paino ran her version of that math at 18 and spent six years acting on it. The question isn’t whether she’s unusual. It’s whether the math that pushed her is sitting on your kitchen table too.

If you want the deeper math — the full cost-per-cwt model broken out by herd size, plus the real capital and labor behind a value-added build before you sign anything — that’s where the next pieces pick up. Start with our breakdown of why the milk-check math stopped working, run the numbers in our honest creamery ROI piece, and if you’re a co-op member or manager, the milk-price coverage is where the supply-side story keeps developing.

Complete references and supporting documentation are available upon request by contacting the editorial team at editor@thebullvine.com.

Learn More

The Sunday Read Dairy Professionals Don’t Skip.

Every week, thousands of producers, breeders, and industry insiders open Bullvine Weekly for genetics insights, market shifts, and profit strategies they won’t find anywhere else. One email. Five minutes. Smarter decisions all week.
NewsSubscribe
First
Last
Consent

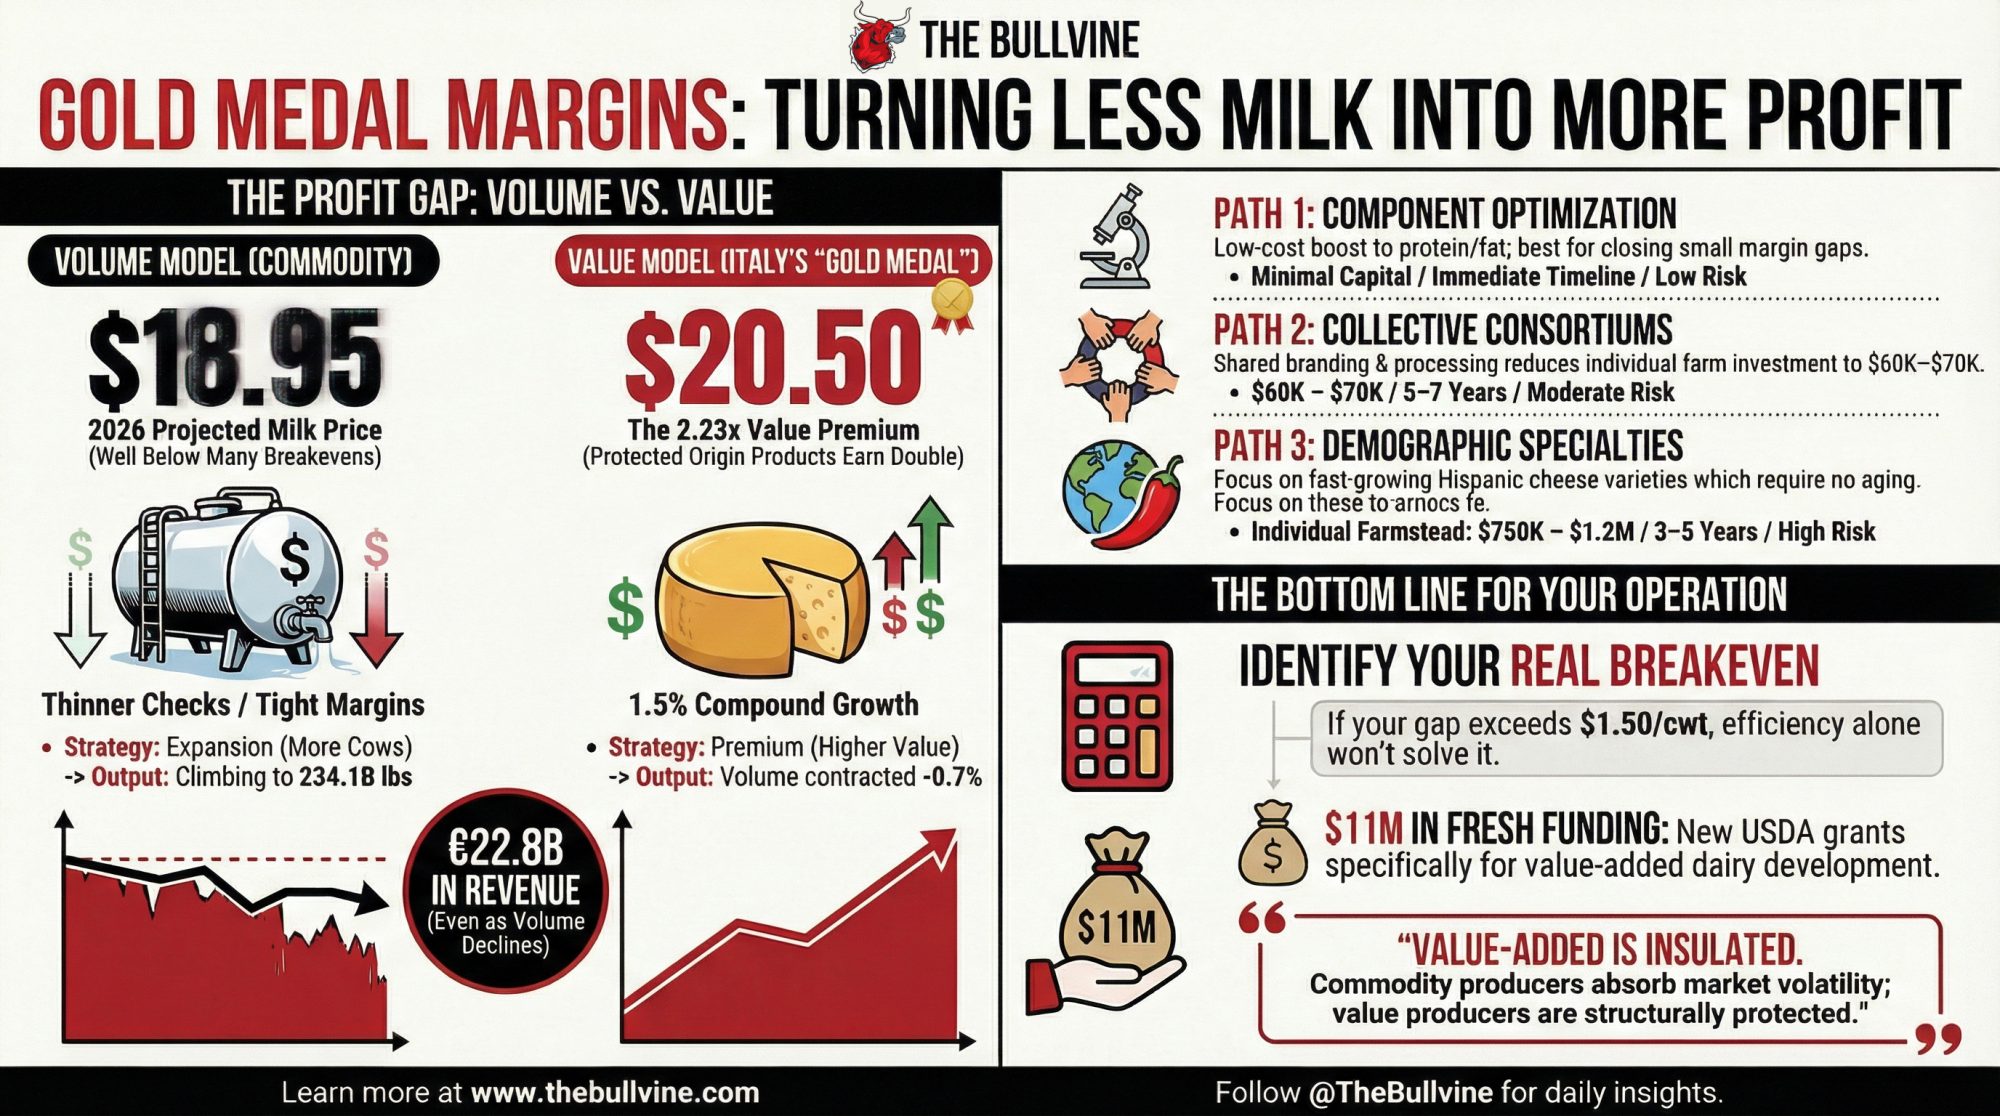
Gold Medal Margins: Italy Turns Less Milk into €22.8B. You’re Stuck at $18.95.

As Milano-Cortina chases medals, Italy’s dairies pull €22.8B from less milk. If your 2026 outlook starts with $18.95, you need to see how they did it.

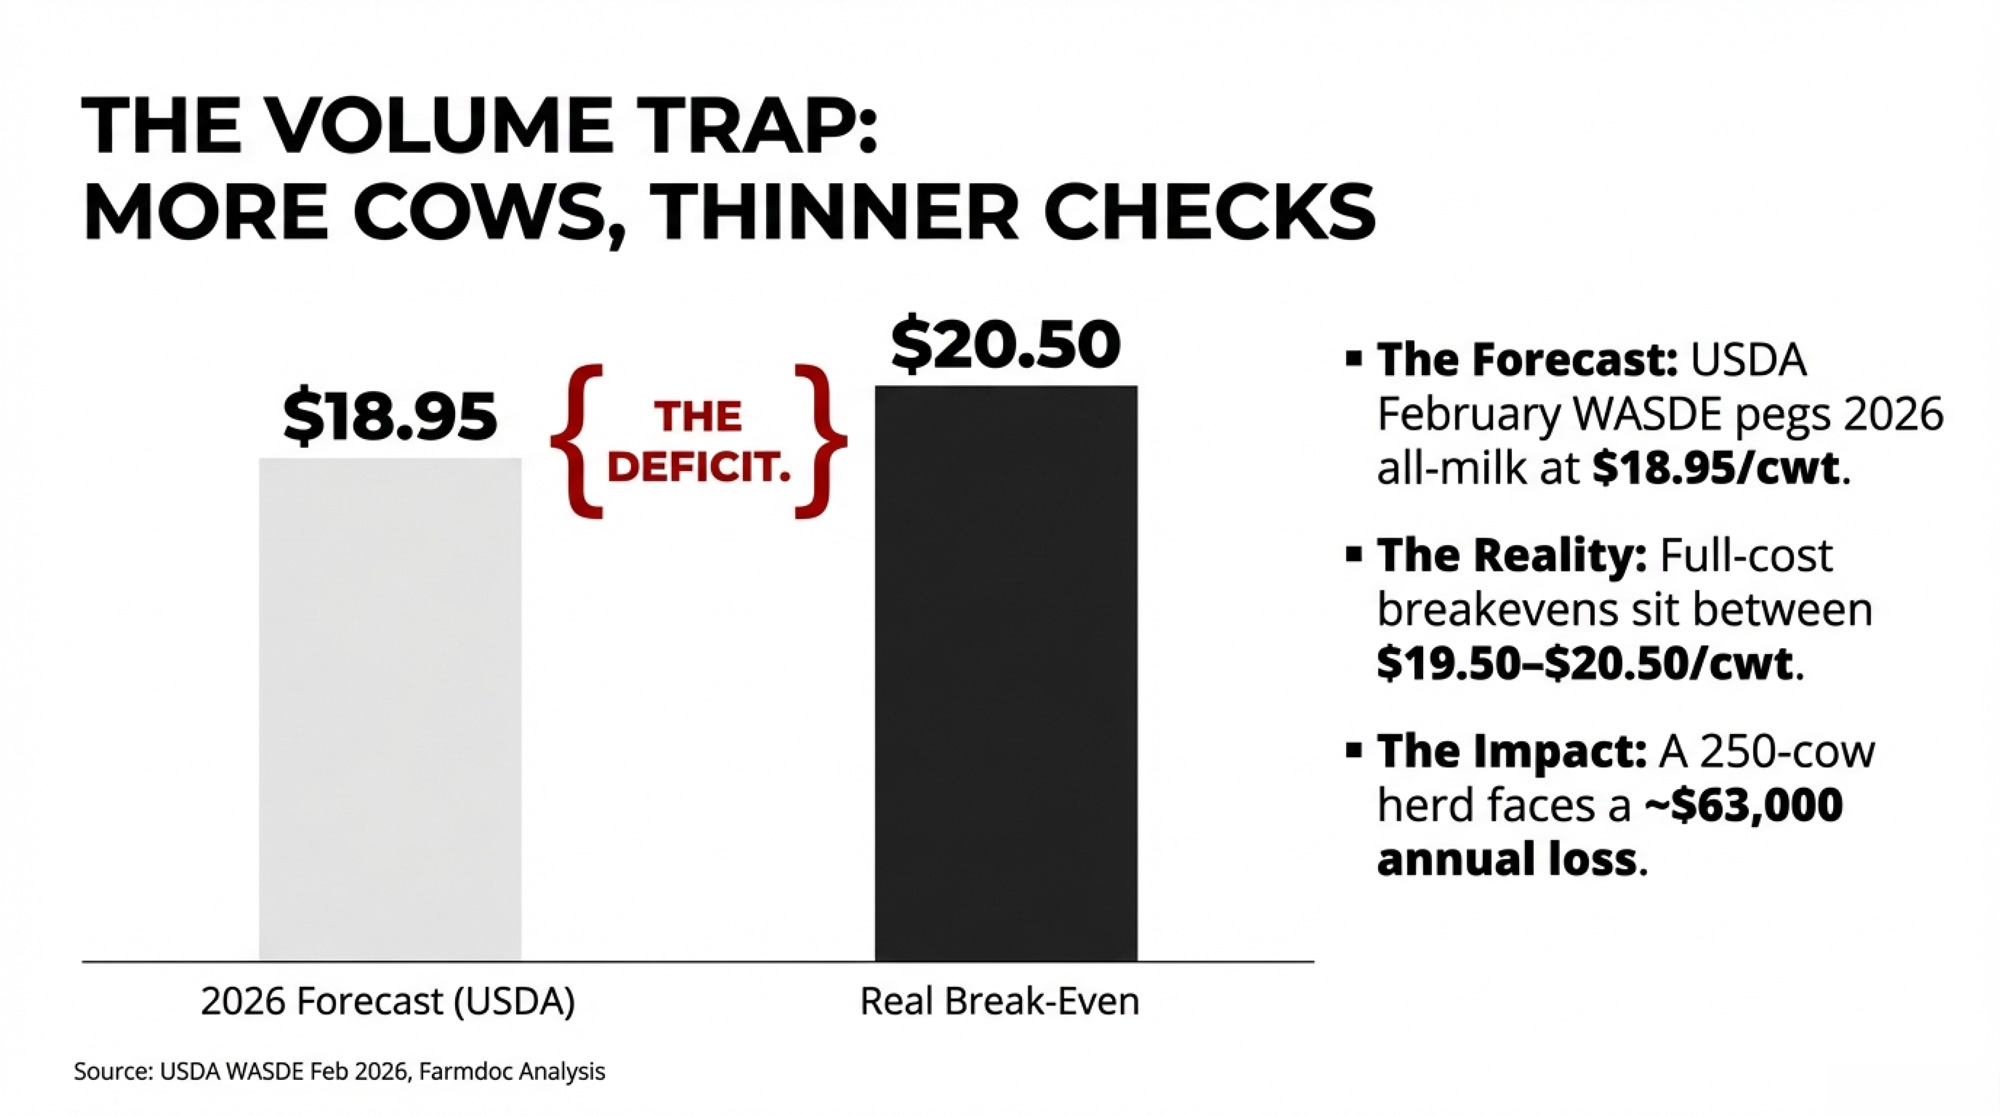
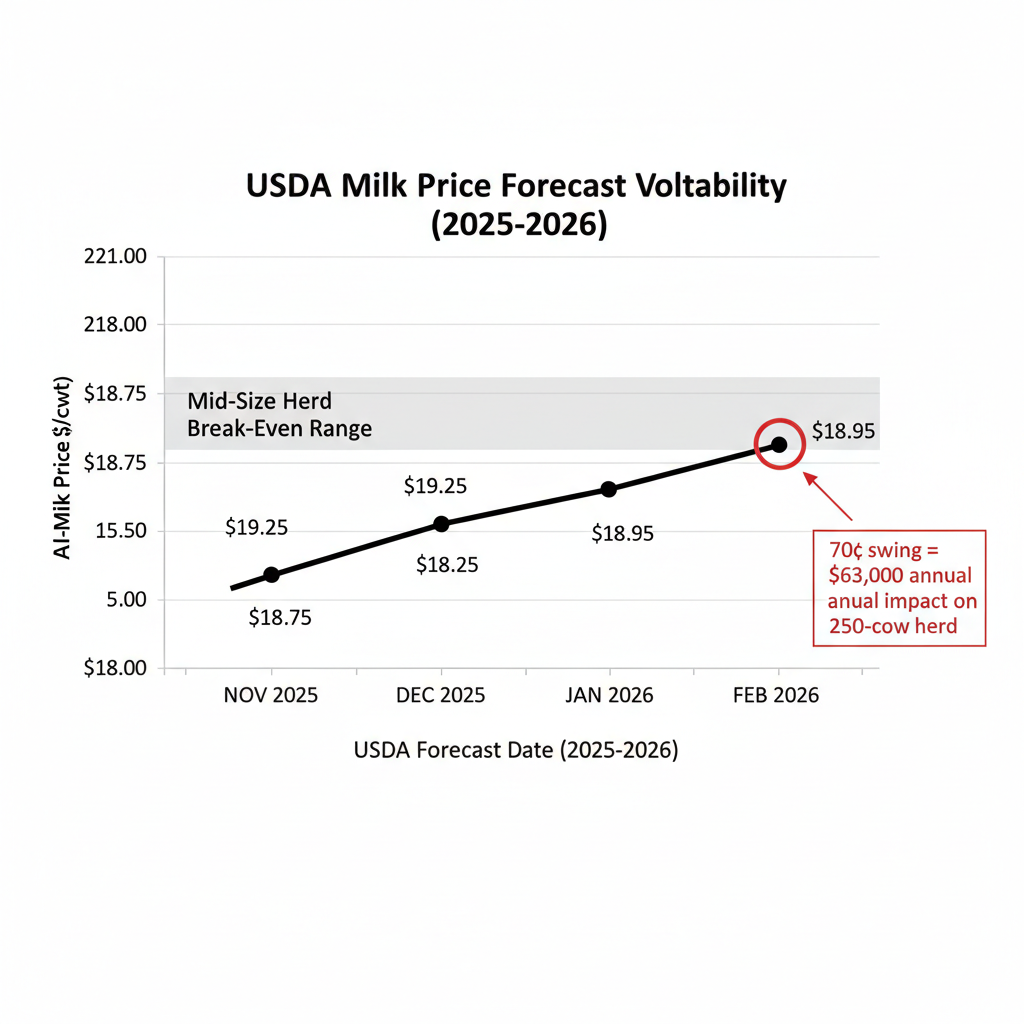
Where does your real break-even sit — family labor honestly valued, principal payments included, living expenses accounted for? Bullvine analysis pegs a mid-size herd’s full-cost break-even in the range of $19.50–$20.50/cwt, depending on region, debt load, and unpaid family labor assumptions — consistent with farmdoc’s 2024 analysis, which places full costs in the low $20s/cwt. USDA’s outlook has been a moving target: the all-milk price for 2026 fell from $19.25 in November to $18.75 in December to $18.25 in January — then bounced to $18.95/cwt in the February 2026 WASDE, released yesterday. Even with the uptick, a 250-cow operation at the midpoint of that break-even range faces a projected annual loss of roughly $63,000. That gap has whipsawed $70,000 in four months of USDA revisions — and the direction isn’t settled.

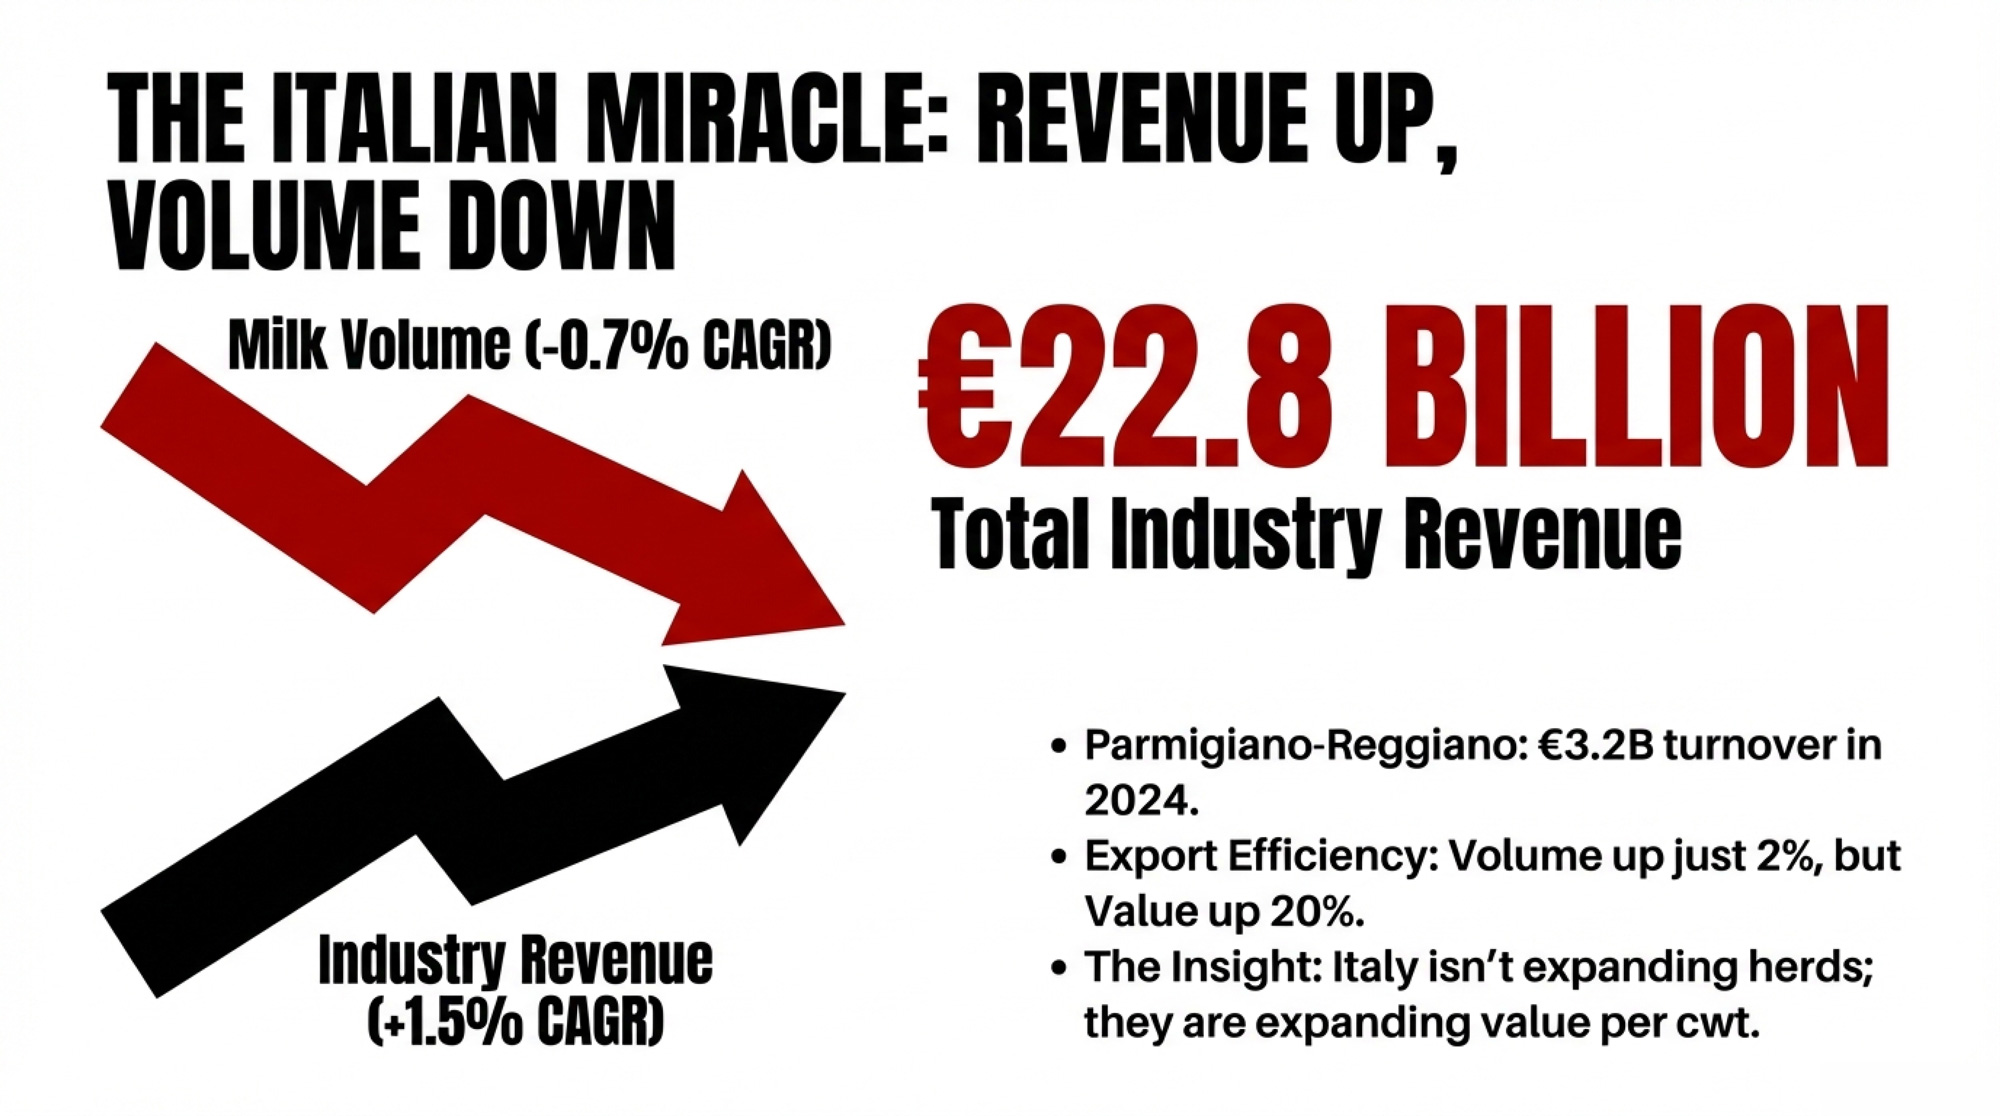
Now consider the country hosting this month’s Winter Olympics, where dairy producers are doing the opposite: generating €22.8 billion in industry revenue while their milk production declines year over year. The value-added dairy production model behind that number isn’t a European curiosity. It’s a functioning alternative to the volume-first strategy that’s compressing margins across North American herds in 2026 right now.

Two Industries, Two Scorecards: Volume vs. Value in 2026

The U.S. dairy herd expanded by an estimated 211,000 cows in 2025 while margins deteriorated. More cows. Thinner checks. USDA projects output climbing to 234.1 billion pounds in 2026, and income-over-feed-cost margins are tightening toward roughly $11.40/cwt. Meanwhile, USDA-ERS cost-of-production data show even the lowest-cost tier — operations with 2,000-plus cows — averages $19.14/cwt on a full economic basis, essentially breakeven at $18.95 milk.

Italy went the other direction. The number of Italian dairy businesses actually increased over the past five years, reaching roughly 4,043 operations (IBISWorld, 2025 data). An industry gaining participants while losing volume only happens when per-unit returns make smaller-scale production pay. Industry revenue grew at a positive 1.5% CAGR over 2020–2025, while milk volume contracted at approximately –0.7% CAGR. Revenue up. Volume down.

EU-wide, the pattern holds. Milk production dropped an estimated 0.2% to 149.4 million metric tons in 2025, while cheese production rose 0.6% to 10.8 million metric tons (USDA FAS data). Germany and France shed 2.3% and 1.8% of milk output, respectively, while Dutch cooperatives lost 14% of members since 2023. The full picture is in our earlier analysis: EU production is declining while cheese output is rising.

The Parmigiano-Reggiano production zone — which extends from Parma north into Lombardy — overlaps with the broader Milano-Cortina Olympic region. The athletes and the cheesemakers are competing in the same territory this month. Only one group has figured out how to turn less into more.

What the Premium Actually Looks Like

Parmigiano-Reggiano, the world’s top-selling PDO (Protected Designation of Origin) cheese, generated €3.2 billion in turnover at consumption in 2024 — a record, up 4.9% from €3.05 billion in 2023 — from approximately 4 million wheels, according to consortium data reported at its April 2025 annual press conference in Milan. Total sales volume rose 9.2%, with domestic sales up 5.2% and exports surging 13.7%. Producer prices for 12-month matured wheels reached €11.0/kg in 2024, up 9% year-over-year. By mid-2025, wholesale hit €13.30/kg. A 21% gain.

The export math is where it gets pointed. Italian cheese exports in the first half of 2025: volume up 2.2%, value up 20.4%. Two percent more product out the door, twenty percent more revenue back. Exports now account for 48.7% of Parmigiano’s total sales volume — closing in on overtaking domestic consumption. As consortium president Nicola Bertinelli put it: “2024 was a challenging year for Parmigiano Reggiano, yet it ended with record results.” The U.S. alone absorbed over 16,000 tons in 2024, up 13.4%.

On this side of the Atlantic, Mateo Kehler’s Jasper Hill Farm in Greensboro, Vermont — population roughly 800 — generates multi-million-dollar annual revenue and pays partner farms roughly three times the commodity milk price, according to figures shared with The Bullvine. Kehler has observed that a Vermont family can make a good living with 25 to 30 cows, provided they make high-end cheese. By the operation’s own accounting, the vast majority of profits stay in-state.

But Jasper Hill is entirely debt-financed, took two decades to reach its current scale, and recently watched its Canadian export market collapse after tariff-driven boycotts. Kehler has had to buy 11 properties to house employees in a town with Vermont’s highest second-home ownership rate. Even successful premium transitions create new problems. In Wisconsin, Uplands Cheese Company — two neighboring families in Dodgeville’s Driftless Region — milks roughly 150 cows (Holsteins, Jerseys, and Brown Swiss) and produces just two cheeses: Pleasant Ridge Reserve during summer pasture months and Rush Creek Reserve in fall. At peak production, a day’s run yields up to 78 ten-pound wheels. When the cheese was launched, wholesale pricing was roughly 4 times commodity cheddar — about $10/lb versus $2.50/lb. Multiple Best of Show wins at the American Cheese Society competition. Strategic scarcity is built into the production calendar.

Why the Italian Premium Sticks

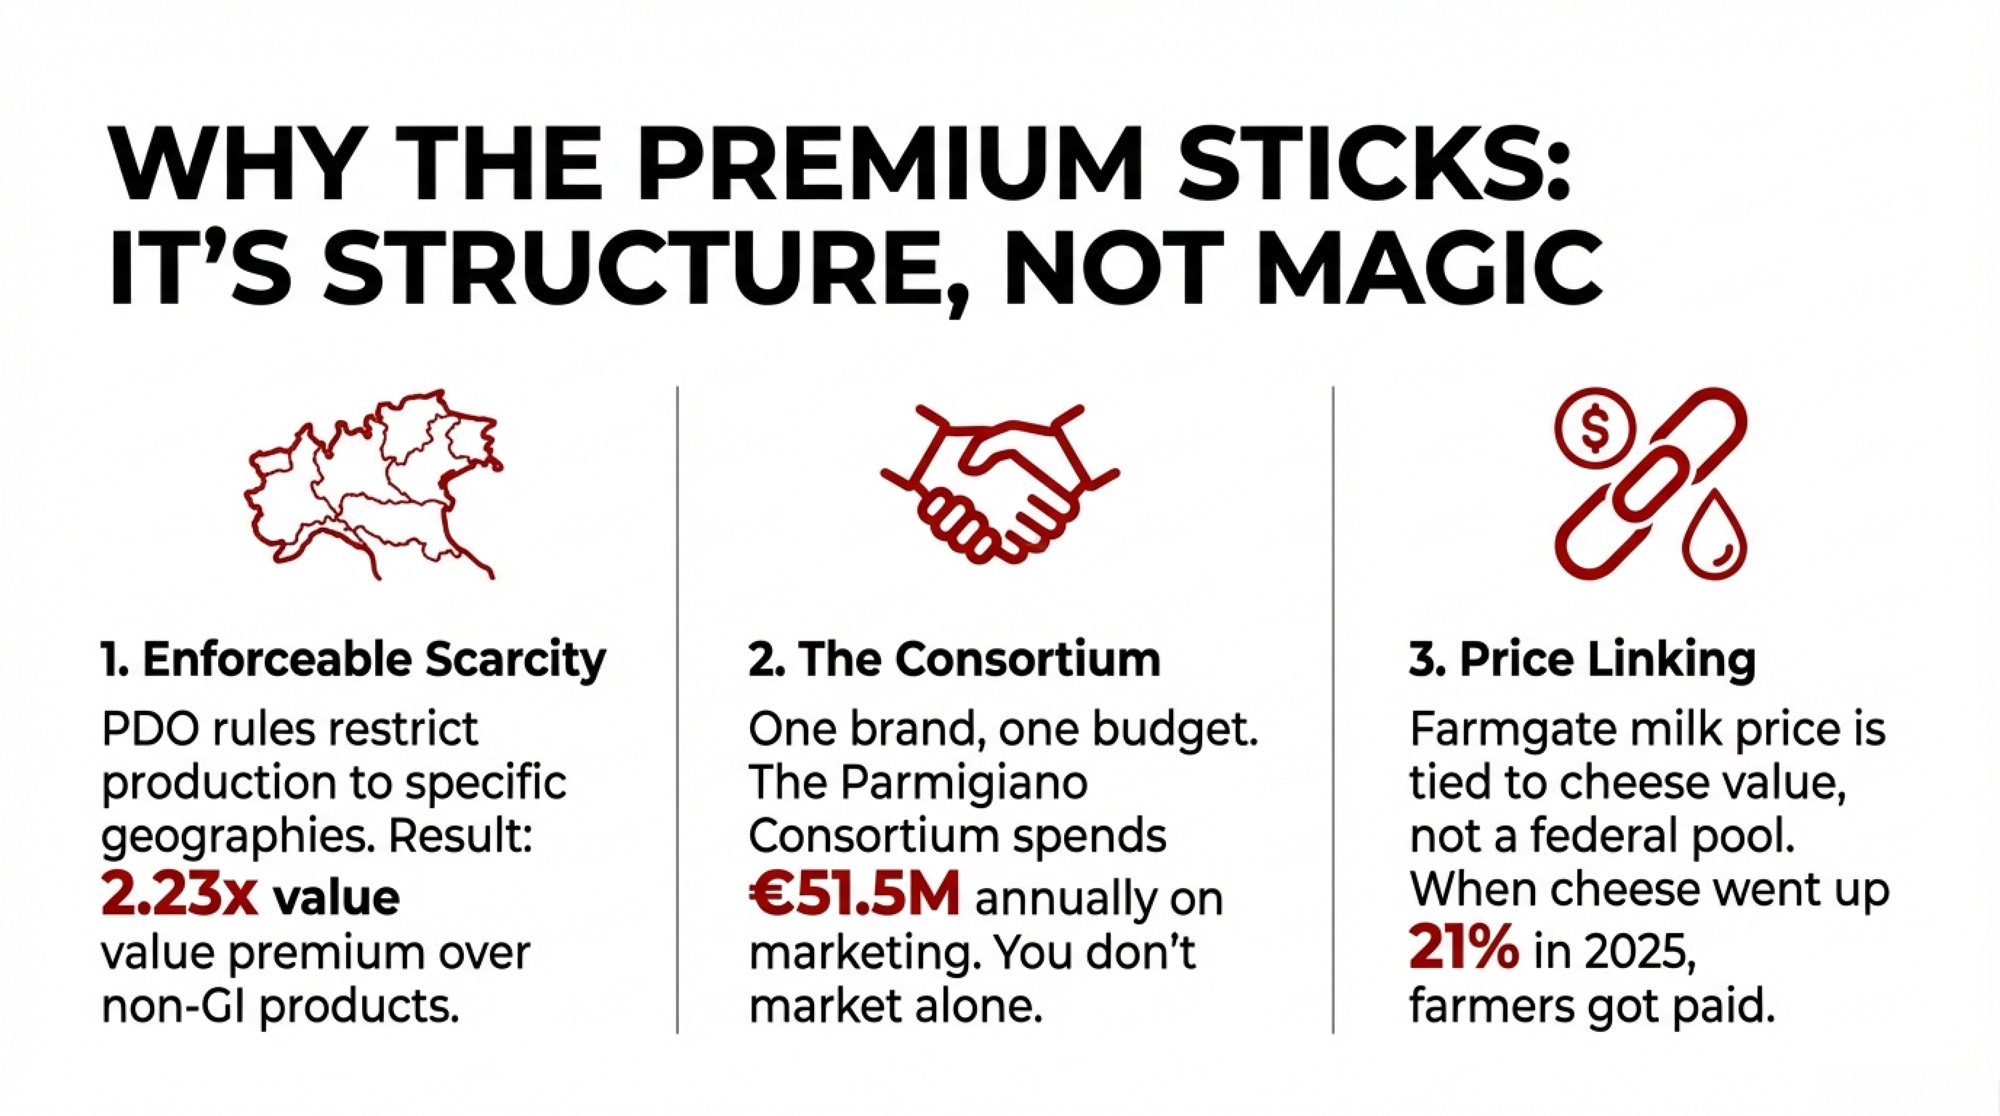
The Italian premium isn’t about Mediterranean mystique or tourist spending. It’s three structural mechanisms—and the first two are replicable.

Geographic designations create enforceable scarcity. PDO rules require all production within a defined region. A 2012 study by AND-International for the European Commission’s DG Agriculture — covering GI products across EU member states — found that the “value premium rate” for PDO/PGI products averaged 2.23 times that of comparable non-GI products. A separate, more detailed 2014 study by Areté srl for the Commission confirmed that PDO/PGI products were generally more profitable than their comparators, though with significant variation across products and regions. Export prices run roughly 11.5% higher even in international markets where consumers have no cultural attachment to the origin.

Consortium structures align producers with collective brand value. The Parmigiano Consortium operates on a projected €51.5 million budget for 2025 — including a €1.5 million crisis fund for price stabilization. Individual farms don’t need their own marketing. The consortium is the marketing.

Farmgate prices link directly to end-product value. When Parmigiano prices rise, supplying farms get paid more — Italian spot milk quotations ran €0.425–€0.4575/kg even during recent downturns. North America’s FMMO system deliberately severs that link through pooling. Under the USDA Final Rule published in January 2025, the FMMO make allowance for cheese increases to $0.2519/lb effective June 1, 2025 — locking in a higher guaranteed margin for processors before your milk check is calculated. Your milk check reflects pool averages, not what your specific milk became.

MetricU.S. Commodity BaselinePDO 2.23× MultiplierJasper Hill (VT)Parmigiano (Italy)
Base milk price$18.95/cwt (Feb 2026 WASDE)$18.95/cwt$18.95/cwt$18.95/cwt (equiv.)
Value multiplier1.0×2.23× (EU study avg.)~3.0× (est.)2.23× (applied)
Premium farmgate equivalent$18.95/cwt$42.26/cwt$56.85/cwt$42.26/cwt
Annual revenue (250-cow herd)¹$455,400$1,015,548$1,365,900$1,015,548
Revenue gain vs. commodity+$560,148+$910,500+$560,148

In France, the Comté PDO tells the same story. Data from French agricultural statistics (SCEES), compiled by Origin-GI, show Comté-zone farms achieved a 32% profitability premium over non-PDO dairy farms in the same Franche-Comté region. A February 2022 analysis by the French Ministry of Agriculture’s Centre for Studies and Strategic Foresight confirmed the pattern, finding Franche-Comté PDO farms earned a surplus of approximately €22,000 per agricultural worker unit compared to non-GI farms in surrounding areas. Farmgate milk ran 14% above baseline. Between 1988 and 2000, PDO-area farms lost 36% of their operations — a painful but non-PDO farm loss in the same area was 57%. The designation didn’t prevent consolidation, but it meaningfully slowed it.

These systems aren’t risk-free. Long aging cycles tie up capital for months or years, concentrated brands can suffer when export demand softens, and inventory exposure during downturns is real. But the studies suggest that, over time, farms inside well-run GI systems have had more room to absorb shocks than their commodity neighbors. For more on how geographic indications are reshaping global dairy trade, including the U.S. industry’s pushback, see our earlier analysis.

Four Paths Forward — and What Each One Costs

Not every operation can or should pursue the same route. Your scale, your balance sheet, and how much transition risk your family can absorb determine which path makes sense.

PathUpfront CapitalTimeline to PremiumRisk LevelBest Fit
1. Component optimizationMinimalImmediateLowAny herd with protein below 3.4%
2. Individual farmstead cheese$750K–$1.2M3–5 yearsHighOperations with strong local market access
3. Collective regional consortium$60K–$70K per farm5–7 yearsModerate3+ neighboring herds facing shared margin pressure
4. Demographic-driven specialtyModerate1–3 yearsModerateHerds near growing Hispanic or urban markets

Path 1: Component optimization. Under FMMO reforms effective June 1, 2025, moving from 3.1% to 3.4% protein could generate approximately $8,640 annually for a 200-cow herd based on current component pricing — no infrastructure change required. At the February WASDE’s $18.95/cwt outlook, a herd with a $19.50 break-even faces a $0.55/cwt gap — component optimization (including butterfat and quality adjustments) could plausibly close that. At a $20.50 break-even, you’re staring at a $1.55/cwt hole, and $8,640 on 48,000 cwt is only $0.18/cwt in protein gains alone. Path 1 is a margin patch, not a margin strategy. But if your gap is under roughly $1.00/cwt, components might be enough.

PathUpfront CapitalTimeline to PremiumRisk LevelBest FitEst. $/cwt Gain
1. Component OptimizationMinimal (<$10K)Immediate (0–6 mo)LowAny herd with protein <3.4%, gap <$1.00/cwt$0.15–$0.50/cwt
2. Individual Farmstead Cheese$750K–$1.2M3–5 yearsHighStrong local market access, $150K+ working capital$5–$15/cwt
3. Collective Regional Consortium$60K–$70K/farm5–7 yearsModerate3+ neighboring herds, shared margin pressure$3–$8/cwt
4. Demographic-Driven Specialty$150K–$400K1–3 yearsModerateNear Hispanic/urban markets, no aging required$2–$5/cwt

Path 2: Individual farmstead cheese. A 2014 study by Bouma et al., published in the Journal of Dairy Science, found that startup costs for artisan cheese processing and aging facilities ranged from $267,248 to $623,874 for annual production volumes of 7,500 to 60,000 pounds. Bullvine’s own financial modeling — which extrapolates Bouma et al.’s capital benchmarks to current prices and adds working capital, a broader product mix, and aging capacity — puts total investment for a 250-cow operation diverting 40% of milk to artisan cheese at roughly $750,000 to $1.2 million. Annual cheese operating costs add approximately $456,000. The model shows cumulative returns turning positive around Year 4 at $18/lb artisan retail pricing. Kehler’s experience suggests the model works from roughly 25 cows up, but the capital structure looks completely different at 25 versus 250.

Uplands Cheese proves the premium is real — four times commodity cheddar at wholesale — but the operation runs on 150 cows making just two cheeses, and only during months when pasture conditions are ideal. And here’s the sobering counterweight: the American Cheese Society’s 2022 biennial industry survey — funded by the American Cheese Education Foundation, based on responses from more than 200 artisan and specialty cheesemakers (published June 2023) — found 24% of U.S. artisan cheesemakers gross under $50,000 annually. Premium pricing is not automatic. As Paul Scharfman told the Wisconsin Dairy Task Force 2.0, “many specialty cheesemakers are fighting for the same four-foot section in a grocery store.”

Path 3: Collective regional consortium. Twenty farms sharing infrastructure brings individual exposure to roughly $60,000–$70,000 per farm. A consortium modeled on France’s Comté CIGC — shared aging infrastructure, collective branding under a USPTO certification mark, codified production standards that naturally constrain supply — addresses the capital and distribution barriers that kill individual producers. The trade-off is real: Parmigiano producers subordinate their individual farm identity entirely to the regional brand. You gain collective pricing power. You give up the option to differentiate on your own terms. John Umhoefer of the Wisconsin Cheese Makers Association identified “money, licensing, regulations, and liability” as the obstacles when the Wisconsin Dairy Task Force explored exactly this concept. DATCP had $200,000 in total processor grant funding. Parmigiano’s consortium operates on €51.5 million. That funding gap tells you everything about institutional commitment.

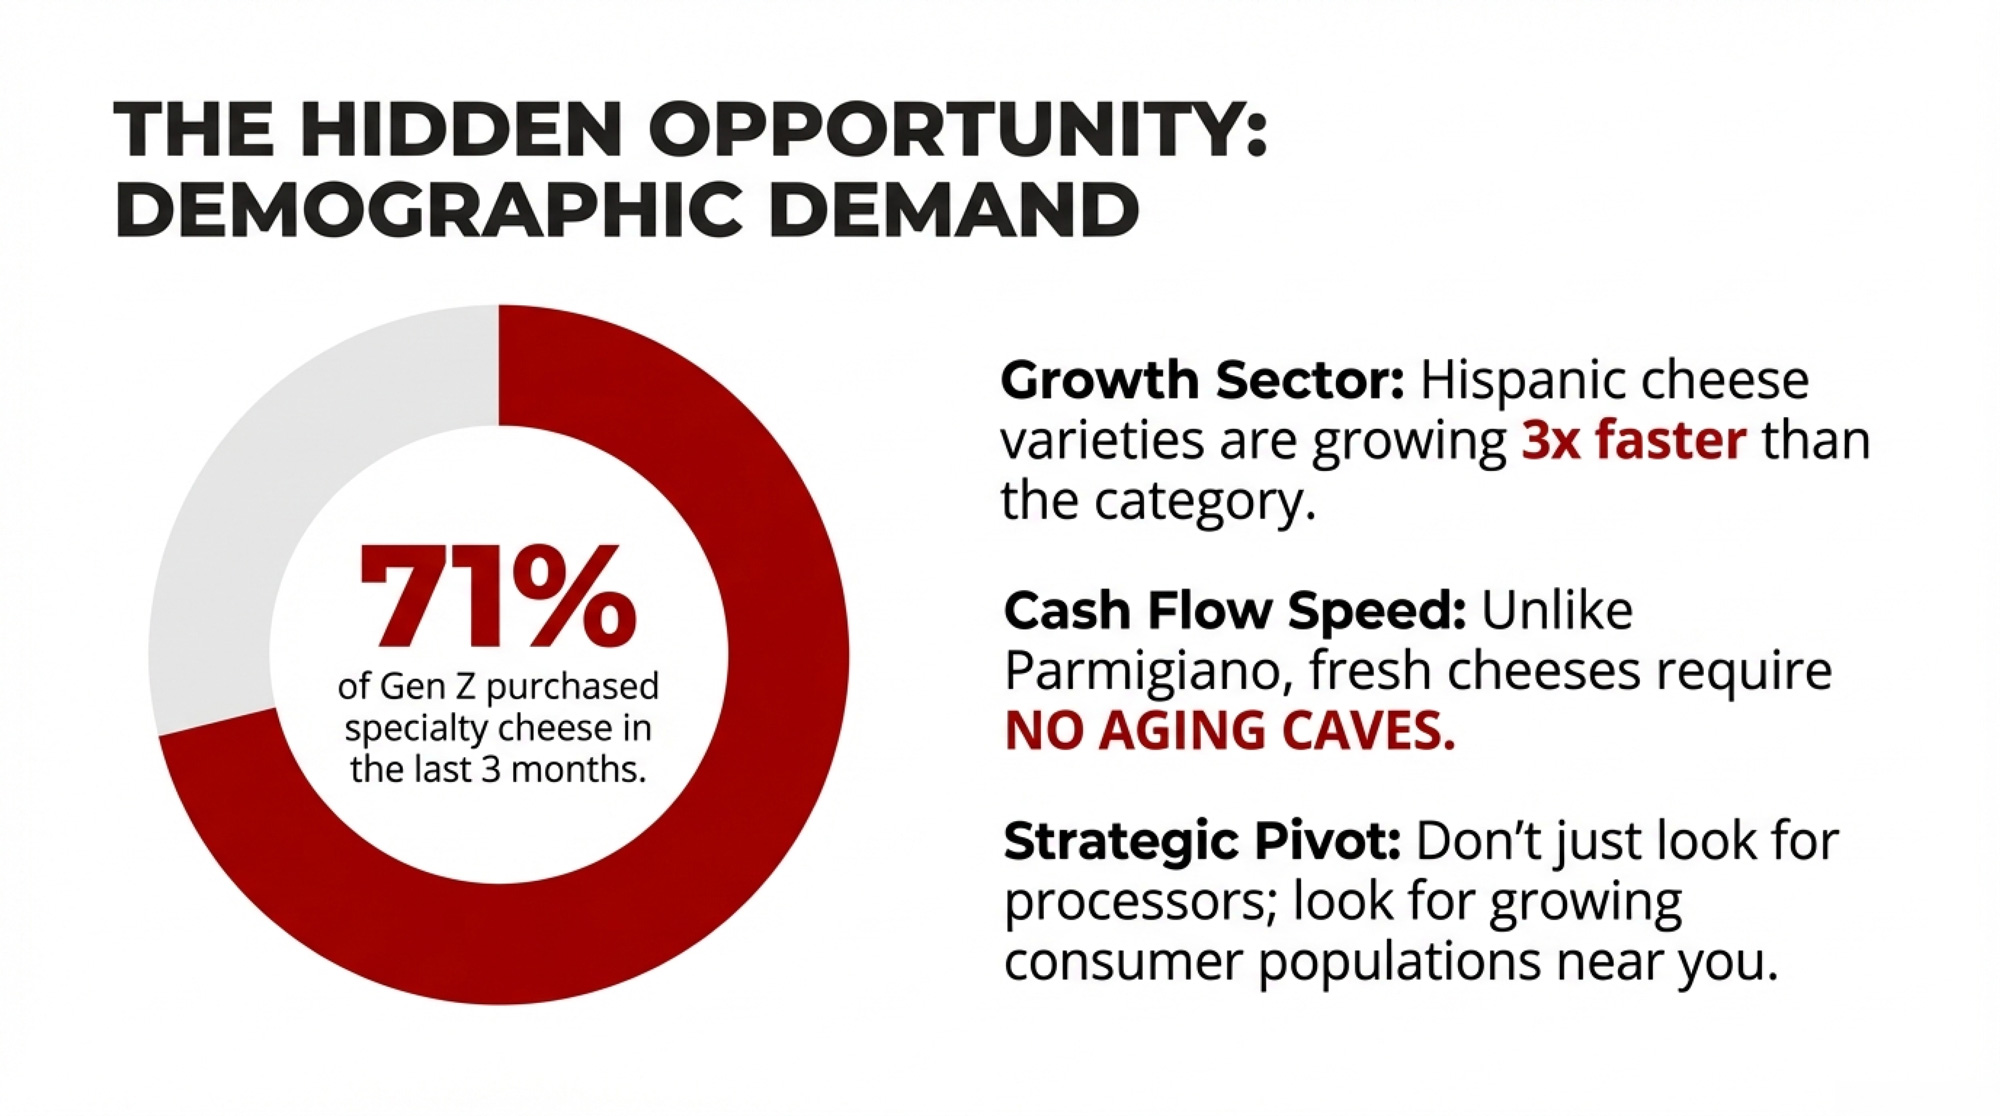
Path 4: Demographic-driven specialty. Hispanic cheese varieties are growing at more than three times the rate of the broader cheese category, according to DFA’s Ken Orf, citing Circana data from early 2024. The latest 52-week MULO+ data (ending December 29, 2024) confirms the acceleration, with Hispanic cheeses growing at 2× to 27× faster than mainstream counterparts in comparable applications. DFA’s acquisition of W&W Dairy in Wisconsin was targeted directly at this segment. No aging caves required, no geographic branding necessary — you need to understand which consumer populations are expanding near you and produce for them.

The Demand Signal Is Already There

A nationally representative survey of 583 U.S. supermarket shoppers — commissioned by Supermarket Perimeter and conducted by Cypress Research (Kansas City, Mo.) with fieldwork in March 2023 — found 64% of Americans purchased specialty cheese in the prior three months. Gen Z led at 71%. And 56% of specialty cheese buyers actively seek seals of authenticity or origin, even though there is no North American GI system.

Market data from Circana supports it. Over the most recent 52-week tracking period in 2025, deli specialty cheese sales rose 8% in both dollars and volume, led by Hispanic and Italian cheese types. American cheese — the commodity benchmark — fell nearly 5% over the same stretch. Rachel Shemirani, senior vice president of Poway, California-based Barons Market, described Gen Z consumers gaining “visual access to different types of specialty cheeses” through TikTok, driving discovery that once took generations to build. The Milano-Cortina Games this month will put Italian food production on a global screen for two weeks, but the domestic demand signals suggest North American consumers don’t need the reminder.

California’s Real California Milk seal — a regional origin certification, not a formal PDO — already delivers a measurable 6.3 percentage point sales spread over non-origin-branded specialty cheese in the same stores (Circana/IRI data, 52 weeks ending May 2023: volume up 3.3% with seal, down 3.0% without). “Domestic origin labeling, and even more so local connotations, carry our customers’ trust in their quality and value,” said the California Milk Advisory Board’s Katelyn Harmon.

On the institutional side, USDA announced $11 million in new Dairy Business Innovation Initiative grants on January 20, 2026. Wisconsin and Vermont each received $3.45 million — explicitly earmarked for value-added development in small and mid-size dairy operations. That comes on top of the $11 billion in new processing capacity coming online through 2028, almost all of it commodity-oriented. The question is whether any of the new stainless includes specialty or aged-cheese capacity—and whether premium returns would flow back through your milk check.

The Canadian Paradox: You Already Have Organized Scarcity — Without the Premium

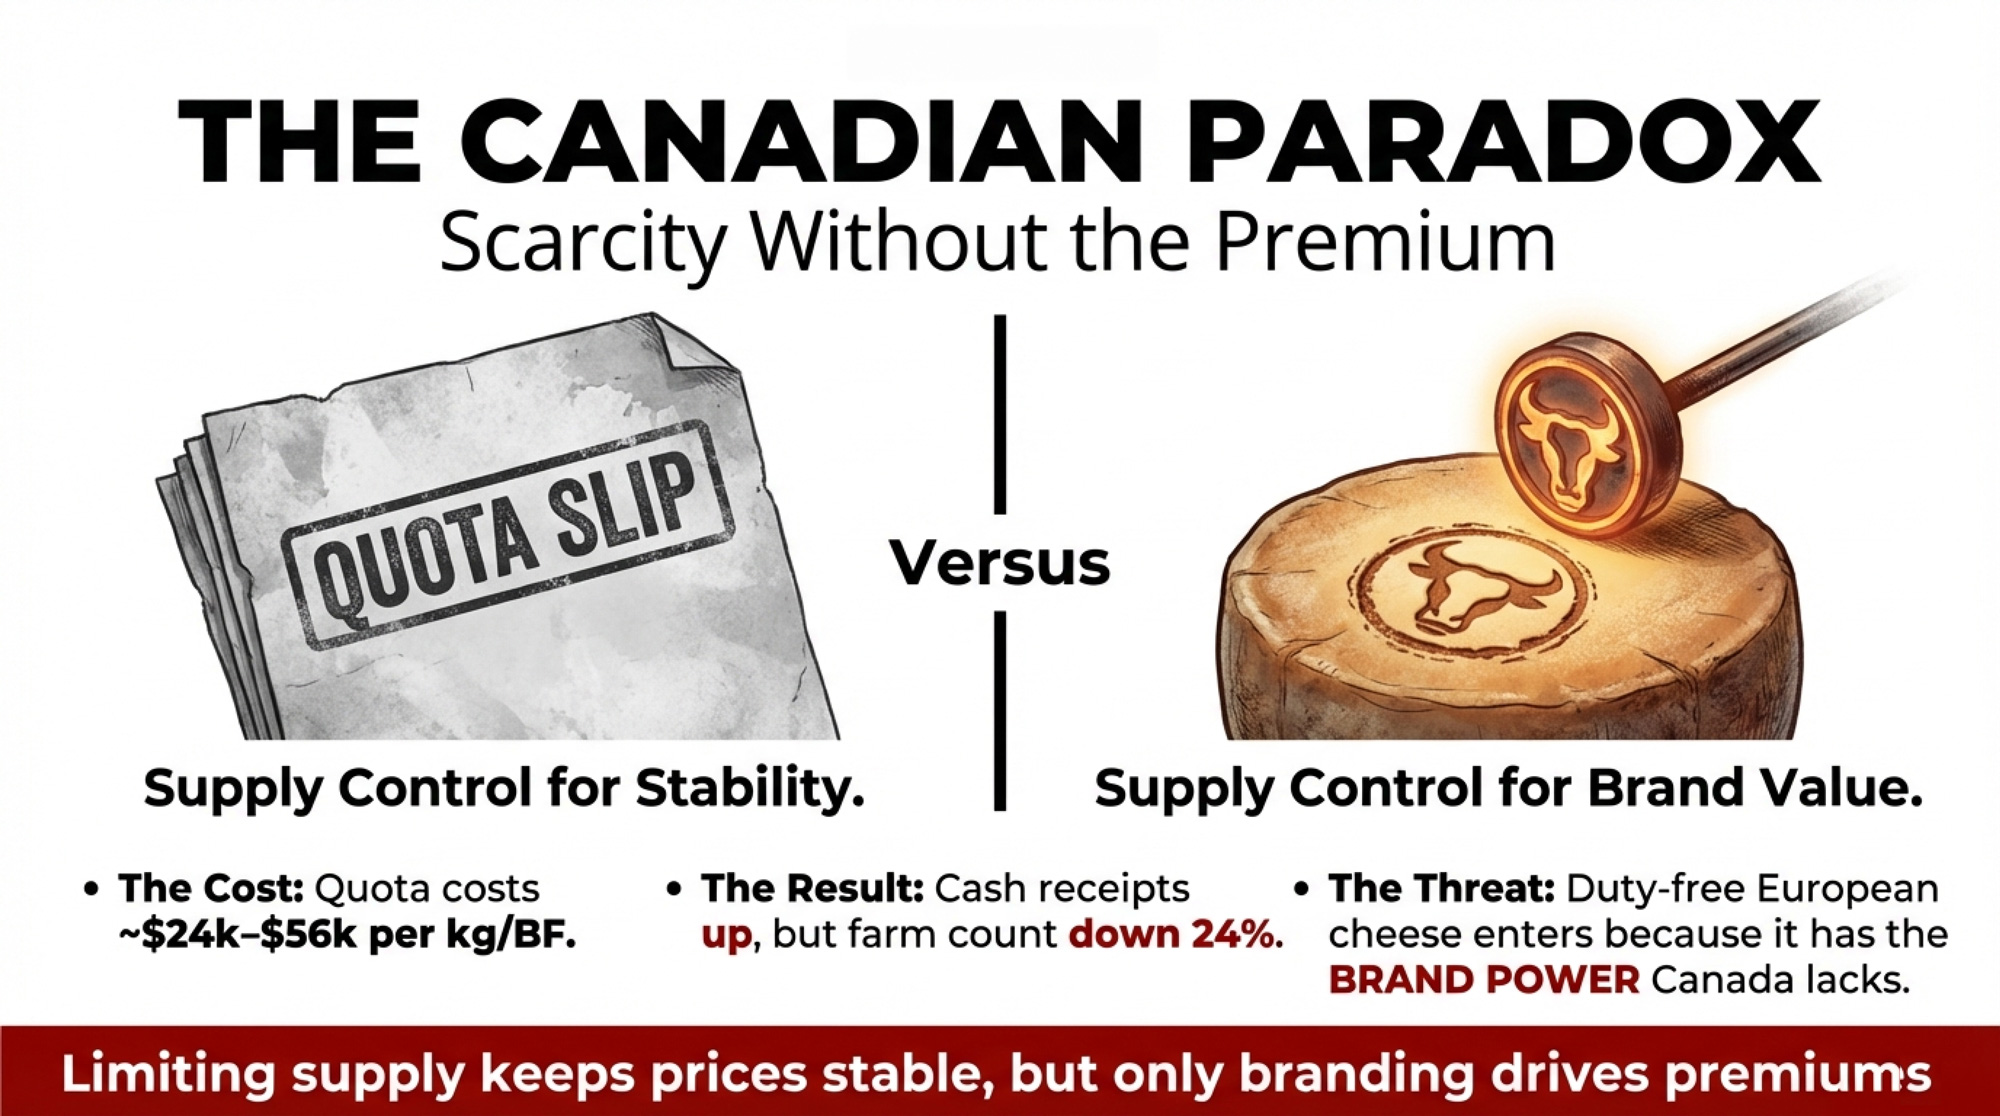
Here’s the part that should frustrate Canadian producers most: you’re already operating inside a managed-supply system. Quota limits production. Tariffs block imports. The Canadian Dairy Commission sets prices. Supply management has shaped the structure of the Canadian dairy industry since 1972. That’s organized scarcity—the same foundational principle behind every PDO consortium in Europe.

And yet the economic outcomes aren’t even close.

System FeatureParmigiano Consortium (Italy)Canadian Supply ManagementResult
Quota systemYes – tied to brand protectionYes – tied to domestic demand matchingBoth manage scarcity
Annual brand investment€51.5M (2025 budget)$350M CETA compensation (couldn’t measure impact)Italy builds value; Canada maintains floor
Farmgate price mechanismContractually linked to wheel pricesRegulated floor price, pooledItaly: price rises with product; Canada: static regulation
Premium to farmers (vs. commodity)2.23× average (EU study)Minimal to noneItaly captures value; Canada captures stability
Producer count trend (recent)+4,043 operations (growing)–24% farms (2012–2022)Italy adds participants; Canada consolidates
Export competitiveness48.7% of sales, growing 13.7%/yrFaces 16,000 MT duty-free EU cheese importsItaly wins globally; Canada defends domestically
Price volatilityLow (brand-buffered)Low (quota-regulated)Both stable—but only Italy delivers premium

The Parmigiano Consortium also assigns production quotas directly to farmers, with financial contributions required from anyone who exceeds their allocation—a system the Italian Ministry of Agriculture formally approved for the 2020–2022 cycle and has renewed since. Both countries manage supply. But Italy’s quotas exist to protect the brand value of a €3.2 billion product and flow premium returns back to the farms that produce the milk. Canada’s quotas exist to match domestic supply to domestic demand at a regulated floor price. One system creates scarcity, driving up the value of the end product. The other creates scarcity that maintains stability, which is a different thing entirely. For many Canadian farms, that stability has been the point, and it’s delivered real income predictability that U.S. producers riding the WASDE rollercoaster don’t have. But it hasn’t translated into a structural price premium the way PDO status has in Europe.

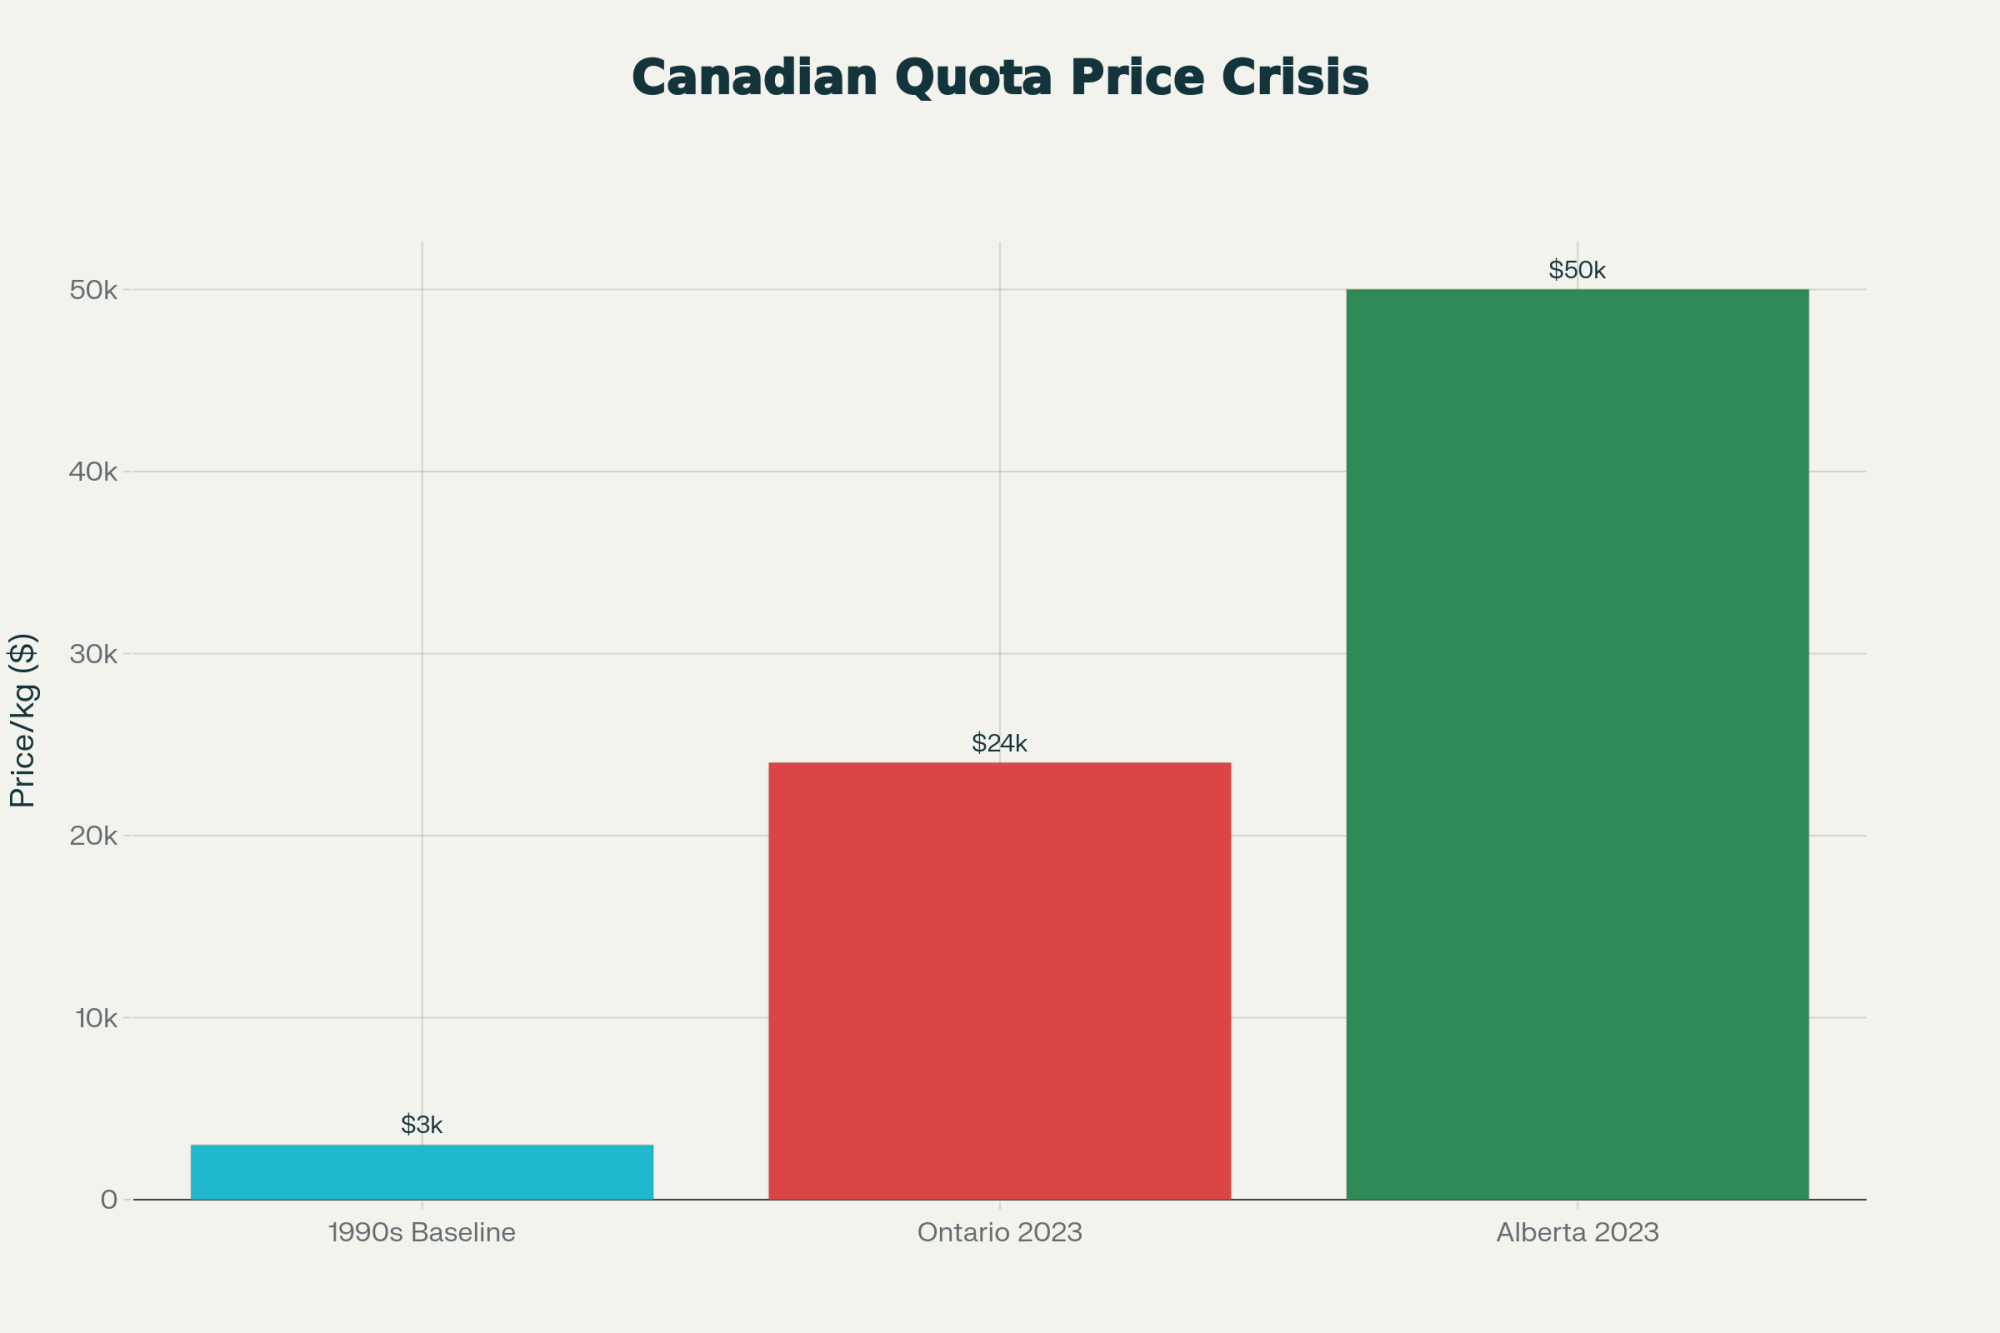
The numbers bear it out. Canadian dairy cash receipts rose from $5.9 billion to $8.2 billion between 2012 and 2022 — a 39% increase (AAFC evaluation, 2024). But the number of farms dropped from 12,762 to 9,739 over the same period, a 24% decline. Production went up 18%. Fewer farms, more milk, higher gross receipts — and yet, as McGill University’s 2023 policy analysis concluded, the system “limits producers’ ability to set the price and quantity of their products” and “prevents farms from achieving economies of scale.” Quota costs in Ontario sit at roughly $24,000 per kilogram of butterfat per day; in other provinces, recent transactions have exceeded $44,000 and even $56,000 per kg/BF/day (Agriculture Canada, 2025 monthly quota trade reports). That capital buys you the right to produce milk at a regulated price. It doesn’t, on its own, create a premium brand.

Agriculture Canada’s own evaluation of the $350 million CETA compensation programs (DFIP and DPIF) was blunt: the department “is unable to determine whether either program mitigated anticipated future growth losses” from increased European cheese imports. Meanwhile, CETA opened the door to 16,000 metric tonnes of duty-free EU cheese annually — about 4% of Canadian consumption. The irony is hard to miss: European PDO cheese is entering the Canadian market because it commands a premium, while Canadian producers inside a managed-supply system have no structural mechanism to build comparable brand value with their own milk.

It’s not impossible to break through. Gunn’s Hill Artisan Cheese in Oxford County, Ontario — Canada’s self-described Dairy Capital — demonstrates at least a partial path. Owner Shep Ysselstein trained in the Swiss Alps, then returned to build a small artisan cheese plant using milk from his family’s neighboring dairy farm, Friesvale Farms. Today, Gunn’s Hill produces Swiss-style artisan cheeses sold in over 300 retail locations across Ontario. And as of this week, dairy farmer organizations across Canada are changing how farmers get paid for milk to meet growing demand for protein — cottage cheese alone grew 32% — which at least signals the system can adapt when market pull is strong enough.

But Gunn’s Hill is small, regional, and essentially operating around the edges of supply management rather than through it. What’s missing isn’t the production discipline — Canadian dairy already has that in spades. What’s missing is the brand architecture, the collective marketing investment, and the legal framework that turns managed scarcity into managed premium. Italy devotes €51.5 million a year to one consortium’s brand. Canada spent $350 million across the sector — and AAFC couldn’t determine whether those investments protected future growth.

What This Means for Your Operation

Before your next capital decision, these are worth working through:

  • Where does your real break-even point sit? Not cash break-even — real break-even, with family labor, principal, and living expenses honestly accounted for. Farmdoc’s 2024 analysis pegs full costs in the low $20s/cwt. USDA-ERS data show even the largest herds (2,000+ cows) average $19.14/cwt on a full economic basis. The February WASDE raised the 2026 all-milk outlook to $18.95/cwt — up from $18.25 in January — but a 250-cow herd at a $20.00 break-even still faces a $1.05/cwt structural gap, or roughly $63,000 annually. If your gap exceeds $1.50/cwt, component optimization alone won’t close it. That’s a structural problem, not an efficiency problem.
  • How many years of operating losses can your balance sheet absorb? The farmstead cheese model shows a 42-month ramp to positive cash flow. If your current debt service doesn’t leave room for three-plus years of additional operating costs, Path 2 isn’t viable without outside capital — whether that’s DBI grants, USDA Rural Development financing, or equity partners.
  • Is there a specialty processor within 100 miles who could use your milk at a premium? Jasper Hill pays partner farms at a rate triple the commodity rate. Operations like this cluster across Vermont, Wisconsin, Oregon, and upstate New York. The conversation costs nothing.
  • Are three or more neighboring operations facing similar margin pressure? If each operation’s gap exceeds $1.50/cwt, the cost of a collective exploration of shared processing infrastructure is less than one farm’s annual component premium — and the DBI grants specifically fund this kind of feasibility work.
  • Has your cooperative discussed value-added returns to producers? The $11 billion in new U.S. processing capacity coming online through 2028 is almost entirely commodity-oriented. Ask whether any of it includes specialty or aged-cheese capacity — and whether premium returns would flow back through your milk check.
  • Does your state dairy association have a position on geographic indication development? NMPF and USDEC have identified GI protections as trade barriers in 34 markets, opposing them on stated grounds that GIs function as non-tariff barriers. As USDEC’s Krysta Harden put it in our Global Cheese Wars analysis: “Europe’s misuse of geographical indications is nothing more than a trade barrier dressed up as intellectual property protection.” The organizations representing you nationally may oppose the legal framework that underpins Italy’s pricing power. It’s a question worth raising at your next member meeting.

Key Takeaways

  • Italy generates €22.8 billion in dairy revenue while production volume shrinks — driven by PDO-protected cheese commanding 2.23 times the value premium of comparable non-GI products, according to AND-International’s 2012 study for the European Commission.
  • North American consumer demand for premium cheese is well established: 64% of U.S. shoppers buy specialty cheese regularly, with Gen Z leading at 71%, and 56% of buyers actively seek origin seals (Cypress Research for Supermarket Perimeter, March 2023).
  • A collective consortium approach reduces per-farm investment from $750K–$1.2M to roughly $60K–$70K — and $11 million in fresh USDA DBI funding is available now.
  • USDA’s 2026 all-milk outlook has whipsawed from $19.25 (November) to $18.25 (January) to $18.95 (February WASDE). That volatility itself is the point: commodity producers absorb every revision; value-added producers are structurally insulated from it.
  • Canada already has organized scarcity through supply management — the same foundational principle Italy uses — but hasn’t built the brand premium layer on top of it. The structure is there. The premium isn’t.
  • The realistic timeline is 5–7 years to meaningful premium returns for individual operations, potentially faster for organized collective efforts. Comté’s 32% profitability premium over neighboring farms — confirmed by both Origin-GI analysis and the French Ministry of Agriculture’s 2022 study — took 15–20 years to fully mature, but the divergence from the commodity market began almost immediately.

The Bottom Line

Italy didn’t build a €22.8 billion dairy industry by expanding herds. It organized producers into consortiums that turned commodity milk into protected brands — then enforced the quality and scarcity that hold price. The USDA outlook bounced 70 cents in one month. Next month, it could drop again. Value-added producers don’t spend February wondering which direction the revision goes. Where does your operation sit on that question?

Complete references and supporting documentation are available upon request by contacting the editorial team at editor@thebullvine.com.

Learn More

The Sunday Read Dairy Professionals Don’t Skip.

Every week, thousands of producers, breeders, and industry insiders open Bullvine Weekly for genetics insights, market shifts, and profit strategies they won’t find anywhere else. One email. Five minutes. Smarter decisions all week.
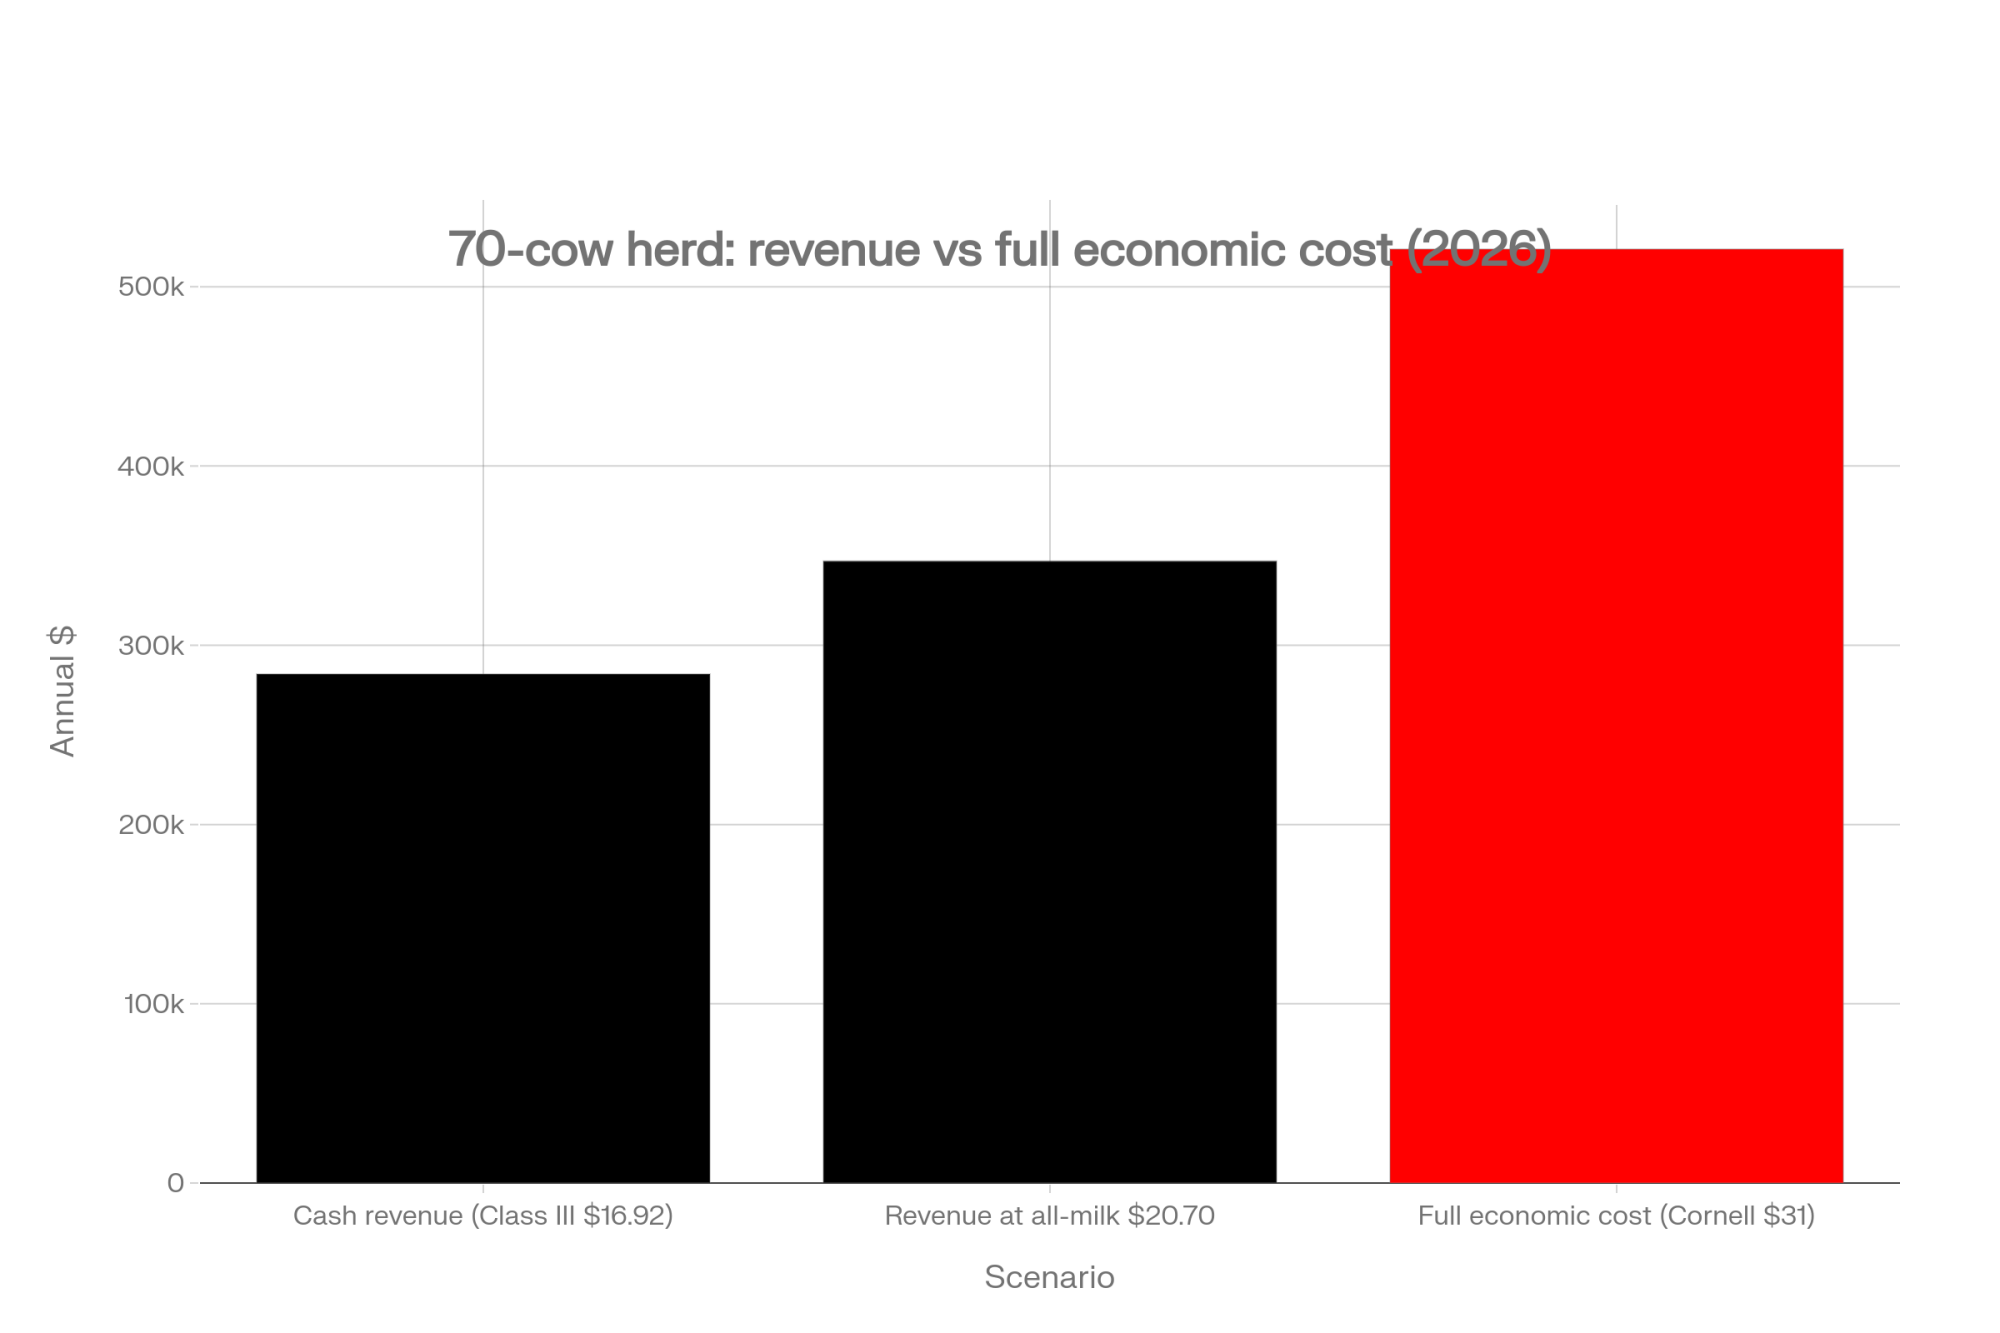
NewsSubscribe
First
Last
Consent

$112K Grant. $2M Creamery. The DBI Math That Decides Who’s Still Standing.

420 dairy businesses, $28.6 million frozen—and why USDA’s Dairy Business Innovation grants still only cover 4–7% of a real creamery build.

Executive Summary: The average DBI grant is $112,600. The average creamery costs $1.5–2.5 million. That gap—grants covering just 4–7% of real project costs—is why the February 2025 funding freeze hit so hard: 420 dairy businesses with $28.6 million in pending reimbursements suddenly learned whether their plans could survive without the money they’d been counting on. The projects that weathered it shared a pattern: solid base dairy economics, committed buyers before pouring concrete, and business cases that penciled without grants. Farms like Hill Valley Dairy in Wisconsin and Nash Family Creamery in Tennessee fit that profile—DBI helped them move faster, but it wasn’t the reason their businesses existed. For producers weighing value-added processing, the deciding question isn’t whether to apply—it’s whether your project survives the zero-grant scenario when your cost of production already pushes $40/cwt or higher. DBI is an accelerator for viable businesses, not a rescue for struggling ones.

dairy business innovation grants

You know the story. A grant program comes along, the brochures look shiny, and suddenly everyone’s talking about building a creamery.

If you’re milking somewhere in the 80–300 cow range and thinking about value-added processing in 2025 or 2026, you’ve probably heard about USDA’s Dairy Business Innovation grants. The pitch sounds great: federal money to help you build a plant, bottle your own milk, make cheese, escape the commodity trap. What you don’t hear as often is that the average DBI award covers roughly 4–7% of a realistic project budget—and that 420 dairy businesses learned the hard way in early 2025 just how quickly “sure thing” grant money can freeze up.

This is the conversation we’d be having over coffee: what DBI actually is, what it costs to build a real plant, who wins with this program, and how to figure out if it makes sense for your operation.

What DBI Actually Covers—And What It Doesn’t

Let’s start with the basics, because a lot of producers overestimate what DBI can do.

USDA’s Dairy Business Innovation Initiatives came out of the 2018 Farm Bill. Since 2019, the four regional DBI centers have together awarded just over $79.2 million in competitive funds to 704 unique entities—farms, processors, and allied dairy businesses—across 40 states and Puerto Rico, according to the DBII Combined Impact Report published in September 2025. That averages out to roughly $112,600 per funded entity, nationwide.

Those four centers are the Dairy Business Innovation Alliance (DBIA) in the upper Midwest, the Northeast Dairy Business Innovation Center (NE-DBIC) based in Vermont, the Southeast Dairy Business Innovation Initiative (SDBII) run by the University of Tennessee, and the Pacific Coast Coalition coordinated by Fresno State.

USDA has kept money flowing. By late 2024, DBI had invested more than $64 million across about 600 projects, and another $11-plus million went out to the four centers. In January 2026, USDA announced another round—again over $11 million—to keep DBI grants going into processing, market expansion, and workforce projects.

Here’s the part that changes the conversation when you’re sitting with your banker.

DBI grants are reimbursement-based. NC State Extension, the University of Tennessee folks, and the Wisconsin Cheese Makers Association all make that clear. You pay out of your own pocket or on your line of credit first, then submit the paperwork and get reimbursed. At least half of all DBI funds must be awarded as subawards to farms and processors, and some programs—like SDBII’s farm grants—require a 25% cash match for certain infrastructure projects.

In plain terms: DBI is designed to share risk on projects that already make sense. It was never free money to turn a weak idea into a strong business.

[Read more: Decide or Decline: 2025 and the Future of Mid-Size Dairies]

When $28.6 Million Got Frozen: The Stress Test Nobody Asked For

In early 2025, every DBI recipient in the country got a sharp reminder of that reality.

On February 26, 2025, NC State’s dairy extension team posted a notice titled “SDBII 2025 Funds Frozen.” USDA had told all four DBI centers to pause reimbursements on grant expenses, effective January 19, 2025. Any DBI-eligible costs after that date wouldn’t be reimbursed until further notice.

Roughly 420 dairy businesses across the four centers had projects underway, and about $28.6 million in reimbursements were suddenly in limbo. The Wisconsin Cheese Makers Association provided more detail: 88 businesses in the DBIA region alone were waiting on nearly $6.5 million.

The freeze lasted about a week and a half before pressure from cheesemakers, WCMA, and lawmakers—including Wisconsin Senator Tammy Baldwin—got USDA to reverse course. Brownfield reported on March 6, 2025, that the freeze had been lifted and reimbursements were back on track.

Here’s what matters: the freeze acted like a stress test. It didn’t create weak balance sheets—it exposed how fragile some projects already were, something lenders and industry groups pointed out as they watched which projects wobbled when reimbursements paused. WCMA noted in its communications that some smaller operations had structured their entire cashflow around those expected reimbursements. When the money stopped, mid-project builds got shaky fast. The businesses that weathered it were the ones that could have survived without it.

That’s not a knock on any individual operation. It’s a lesson in what happens when you build a plan that depends entirely on money you don’t control.

A lot of lenders looked at that situation and asked a simple question: “If this project only works with DBI plugged into the spreadsheet, should we really be doing it?”

The Real Start-Up Bill: Why “We’ll Just Build a Creamery” Means Seven Figures

So let’s talk about the check you’re actually writing.

University of Tennessee’s on-farm processing work is a good place to start. One of their scenarios looks at building a cow-milk processing plant of about 14,400 square feet—not a boutique hobby, but a modest commercial plant with room to grow.

The estimates in that example break down like this:

  • Roughly $1.5 million for the facility
  • Just over $1 million for processing equipment
  • More than $1.3 million in year-one cashflow needs for labour, utilities, ingredients, and loan payments

Cornell’s research on farmstead cheese companies tells a similar story. When you tally up a new building, stainless steel, and the operating money you need to get through the first year or two, total start-up needs can easily push into the $2.5 to $3 million range, especially if you’re doing aged cheeses or a wide product mix.

If you’re renovating an existing space and picking up some used equipment, your costs can come down. But not nearly as much as the back-of-the-napkin plans usually assume.

Pulling from those University of Tennessee, Cornell, and Penn State examples, here’s what a realistic range often looks like for a small-to-mid processing project:

CategoryIllustrative RangeWhy It Sneaks Up on You
Processing Equipment$700,000–$900,000Pasteurizers, vats, and the “stainless steel tax.”
Facility & Cold Storage$350,000–$600,000Flooring, drainage, and refrigeration are non-negotiable.
Compliance & QC$25,000–$75,000The cost of proving your milk is safe every single day.
Working Capital (24 mo)$500,000–$1,000,000Carrying inventory while waiting for retailers to pay.
TOTAL PROJECT$1.57M–$2.57M+The average DBI grant (~$112K) covers roughly 4–7%.

Stress Test Question: Could your project survive for 6 months without DBI reimbursements?

This isn’t pulled line-for-line from one single budget, but those bands are right in line with what university models and real farms end up with once the last invoice comes in. Even when you scale down and use some sweat equity, “we’ll just build a creamery” still usually means a total project somewhere in the $1.5 to $2.5 million neighbourhood.

Now, place DBI into that picture.

If DBI has awarded about $79.2 million across 704 unique entities, that’s an average of roughly $112,600 per recipient. Against a $1.57-$2.57 million project, that average award works out to roughly 4–7% of total capital—useful, but nowhere near a full funding solution.

Cost CategoryLow RangeHigh RangeAvg. DBI GrantCoverage %
Processing Equipment$700,000$900,000$112,60012.5–16%
Facility & Cold Storage$350,000$600,000$112,60018.8–32%
Compliance & QC$25,000$75,000$112,600Exceeds cost
Working Capital (18–24 mo)$500,000$1,000,000$112,60011.3–22.5%
TOTAL PROJECT$1,575,000$2,575,000$112,6004.4–7.1%

The Cost Gap: Why Some Herds Start Behind Before They Process a Litre

You probably know this from your own balance sheet, but USDA’s Economic Research Service spells it out clearly.

In an August 28, 2024, Chart of Note, ERS looked at 2021 cost-of-production data by herd size (ERS national averages). When they added up both operating costs—feed, vet, supplies—and allocated overhead—buildings, equipment, land, and unpaid family labour—they found:

  • Farms with fewer than 50 cows had total economic costs around $42.70 per hundredweight.
  • Farms with 2,000 cows or more came in around $19.14 per hundredweight.

ERS notes that larger herds are generally better able to spread fixed costs and invest in labour-saving technology, thereby reducing their cost per cwt.

What does that mean in practical terms?

Some of the lowest-cost herds in the 100–199 cow bracket can get total economic costs down near $19.76 per hundredweight—competitive with or better than some high-cost 2,000-cow herds. So small doesn’t automatically mean uncompetitive. But on average, smaller herds start higher on the cost curve and have less room to make mistakes.

If your cost of production for milk alone is already at the high end—closer to that $40 range—it’s going to be a steep climb to make money once you add processing risk. If you’re in that $20-something band with good butterfat levels and tight fresh cow management, your odds of making a creamery pencil out improve a lot, as long as you’re disciplined.

[Read more: Same Milk, Different Payday: How Your Processor’s Product Mix Shapes Your Future]

Who Actually Thrives With DBI Support

The DBI projects that still look smart five or ten years out share a handful of traits. These patterns show up across case studies from the Midwest, Northeast, Southeast, and Pacific Coast regions.

The dairy was solid before any stainless steel showed up. These herds know their cost of production per cwt and how it compares to other farms of their size. Their fresh cow management during the transition period is under control, reproduction is consistent, SCC is competitive, and butterfat and protein levels support both the milk check and the planned product line. Research from the University of Guelph on resilient dairy farms has shown that operations that lean into innovation and value-added are usually already strong in basic management and efficiency, not the other way around.

They treat DBI as an accelerator, not the engine. If the DBI money disappeared, they’d still go ahead—maybe with more used equipment or slower expansion—but the business case stands on its own. Penn State’s value-added cashflow guidance comes back to this point over and over again: you want the core farm business to be viable before you start layering in grants and loans.

Take Hill Valley Dairy in Wisconsin. It’s a third-generation family farm that started making artisan cheese in 2015. They received a DBIA grant to purchase equipment for a new alpine-style cheese line—helping them use more of their own milk and expand into new markets. But as Hill Valley puts it: “We are building a long-term venture that supports both the small dairy farm and cheesemaking businesses.” The grant helped them move faster; it wasn’t the reason the business existed.

Or look at Nash Family Creamery in Tennessee. They received SDBII grants in 2021, 2022, and 2023 for operational improvements—including custom printing for new containers to begin selling ice cream wholesale. When asked how processing has impacted the family business, Cody Nash said: “It’s been really great adding that extra revenue stream and to have that extra interaction with the public to where we’re not just a dairy that’s off the road, that’s making raw milk that people are kind of disconnected from. We’ve been able to tie everything from growing feed to making ice cream back to the customer.”

They plan for 18–24 months of ugly cashflow. On-farm cheese plants that age product—and even bottled milk plants building new accounts—often burn cash for a year or two. The Tennessee examples show year-one cash needs exceeding $1 million when you include wages, inputs, and loan payments. The farms that survive have committed operating lines and reserves that cover 18–24 months, not just a few lean weeks.

They lock in customers before they pour concrete. Cornell and Penn State both hammer on this. Successful processors are already having serious conversations with grocery buyers, distributors, and restaurants before they build. They get letters of intent, pilot-scale commitments, or at least emails spelling out what volume and price range a buyer is willing to try.

They grow into processing instead of flipping everything at once. Many healthier projects start by processing maybe 10–20% of the farm’s own milk, leaving the rest under a co-op or processor contract. They might bottle whole milk and cream, do one or two cheeses, and test the waters. Only when that side of the business has proven it can move volume and support its own cashflow do they talk about scaling up.

Three Situations Where DBI Actually Fits Well

So where does DBI make sense?

You’re already selling product, and capacity is your bottleneck. Maybe you’ve been bottling a small share of your own milk for years. Maybe you’ve got a few cheeses that consistently sell out. Butterfat levels are good, your SCC is steady, and the question isn’t “will anyone buy this?” but “how do we keep up?” In that case, a DBI grant can help you step up to a larger pasteurizer, vat, or filler that you already know you can keep busy with.

That’s exactly the situation Tulip Tree Creamery in Indianapolis found itself in. In 2024, they received a $74,000 DBIA grant to install a cheese cutting and packing line. Co-owner and CEO Fons Smits told Brownfield Ag News: “Right now, our capacity is very limited. We make some really good artisan hard aged cheeses, but we can only [cut and pack] so much.” The grant didn’t create the demand—it helped them meet demand they’d already built.

You’re diversifying a healthy dairy, not escaping a sinking one. Your cost of production is reasonably close to regional averages for your herd size, and you’re steadily tightening feed efficiency, labour, and repro. You decide to put 10–20% of your milk into a simple product line and keep the rest on your co-op contract. If the value-added side doesn’t take off, you still have a core dairy that pays its way.

You’re building something the next generation—or a buyer—would actually want. Some families are looking at modest processing as a way to add a branded revenue stream that boosts overall sale or succession value, or to create roles for kids more interested in marketing and product development than in scraping stalls. A DBI-backed project can help get a moderate plant off the ground with less strain on retirement timing, as long as the economics work without assuming endless grant support.

[Read more: David vs. Goliath: Strategies for Small Dairy Farmers to Challenge Large Processors]

When “Not This Round” Is the Smartest Move

On the other side, there are situations where the bravest move is to step back from the grant opportunity.

You’re already losing money on milk. If your cost of production is running several dollars per cwt above your pay price—think roughly in the $4–6 range for more than a few months—your first priority probably isn’t a plant. It’s tightening that gap. Adding a high-risk venture on top of that is more likely to magnify the pain than solve it.

Your banker only likes the plan with DBI on the spreadsheet. If the project goes from “tight but OK” to “no way” when you remove the grant, that’s a sign of how dependent it really is on something you don’t control. Treat that as a red flag and have your lender walk through the zero-grant version with you before you commit.

You’ve never lived through lumpy cashflow. If your entire experience is steady co-op checks and relatively smooth bills, jumping straight into a seven-figure plant with slow-pay wholesale accounts and seasonal retail swings is a big leap.

Your main fuel is frustration with your current processor. Being angry about component pricing, basis adjustments, or hauling charges is understandable. But “I’m sick of my co-op” isn’t the same thing as “I’ve got committed buyers and a business plan that works.” Many of us have watched producers pour money into projects mainly to “show the co-op who’s boss,” only to end up in a tougher spot. Spite is a terrible basis for a business plan. For some herds, pushing harder on component premiums, quality bonuses, or contract terms may deliver better risk-adjusted returns than building a plant out of frustration.

“Not this round” doesn’t mean “never.” It means fix the base dairy first, then revisit the plant once the math works without grants.

A Note for Canadian Producers

If you’re operating under quota in Canada, your starting point is different—and in some ways, harder.

You’ve got stable base revenue thanks to supply management and provincial boards that oversee pricing and the allocation of processing capacity. You’re more likely looking at provincial grants, co-op investments, or local funds than U.S.-style DBI dollars.

But here’s what many producers don’t factor in: the entry cost into on-farm processing can be higher in Canada due to regulatory and quota complexities. A 2018 Ontario government release on proposed Milk Act changes noted that small dairy processors, such as artisan cheesemakers, can spend up to one-third of their construction budget on building requirements under current regulations—especially for layout, drainage, and food-safety requirements for plant licensing. And that’s before you get into the maze of quota transfer rules.

Dairy Farmers of Ontario’s policies include restrictions on moving quota purchased through ongoing farm purchases for 5 years, limits on shared-facility arrangements, and complex approval processes for any unconventional setups. Quebec has its own layers of regulation around artisan processing and the “fromage fermier” designation. None of this is impossible to navigate, but it adds time, cost, and uncertainty that doesn’t show up in the brochure math.

Research from the University of Guelph, Agriculture and Agri-Food Canada, and the Canadian Dairy Commission on regional and on-farm processing shows that niche markets—grass-fed, A2A2, organic, farmstead cheese—can open doors, but these projects still entail significant capital and labour demands.

Picture a typical Ontario quota farm deciding between joining a local co-op plant expansion or building a very small on-farm processing plant. Even with a quota underpinning milk revenue, the plant has to stand on its own economics—and the regulatory overhead can eat into margins faster than you’d expect.

The core questions look a lot like the U.S. version: Does the plant work on its own numbers without assuming permanent program support or sky-high premiums? Do you have the working capital and management bandwidth to handle inventory and receivables, in addition to quota payments, feed bills, and labour? Are the buyers and volumes real enough—ideally in writing—to justify the risk?

What This Means for Your Operation

Before you sign anything, here are the questions and thresholds that matter:

  • Run the zero-grant scenario. Create a version of your budget that assumes you receive no DBI funds. If the project flips from “tight but doable” to “dead in the water,” you’ve learned how fragile it really is. That’s not a green light—it’s a red flag.
  • Build the full capital budget. Include everything: buildings, equipment, regulatory work, inventory, and at least 18–24 months of operating capital. Then sit that total beside university models from Tennessee and Cornell. If your number is dramatically lower, figure out what you’re assuming that they aren’t.
  • Know your cost of production. If you’re closer to that $40/cwt ERS number than the low-$20s, a creamery adds risk on top of an already thin margin. Get the base dairy tighter first.
  • Lock in at least one serious buyer before you lock in the loan. Talk to the grocery chain, distributor, or foodservice customer you’re counting on. Ask for something concrete: volume ranges, a trial period, and a realistic price band.
  • Agree on your kill switches up front. Sit down with your family and your lender and write down your thresholds: how much extra capital you’re willing to inject, how long you’ll give it to reach break-even, minimum volume, or margin targets by certain dates.
  • Consider the alternatives. For some operations, negotiating harder on processor premiums, quality bonuses, or contract terms may deliver better risk-adjusted returns than building a plant.
  • Review your DBI exposure with your lender before applying. Walk through the capital plan, the reimbursement timeline, and what happens if funds are delayed. If your banker can’t get comfortable with the zero-grant scenario, that’s important information.
  • Ask the operations in your county that built plants five or ten years ago what they’d do differently if DBI disappeared tomorrow. Their answers might surprise you.

Key Takeaways

  • DBI covers 4–7% of a typical $1.5–2.5 million processing project. It’s an accelerator for viable businesses, not a rescue for struggling ones.
  • The 2025 freeze was a stress test. It didn’t create fragile projects—it exposed them. If your plan can’t survive a short-term reimbursement delay, it’s too dependent on money you don’t control.
  • Cost of production matters before you add stainless. Herds with milk costs near the high end of ERS benchmarks face steeper odds on processing.
  • The winners share a pattern: solid base dairy, committed buyers, 18–24 months of cash flow runway, and DBI treated as a bonus rather than a foundation.
  • “Not this round” can be the smartest strategy if your core dairy needs work first, or your plan only pencils with the grant included.

The Bottom Line

The best time to use a program like DBI is when your plan already works without it. The worst time is when you need the grant to rescue numbers that are already telling you “no.”

Where does your operation sit on that spectrum? That’s the question worth answering before you pour a yard of concrete.

Complete references and supporting documentation are available upon request by contacting the editorial team at editor@thebullvine.com.

Learn More

The Sunday Read Dairy Professionals Don’t Skip.

Every week, thousands of producers, breeders, and industry insiders open Bullvine Weekly for genetics insights, market shifts, and profit strategies they won’t find anywhere else. One email. Five minutes. Smarter decisions all week.
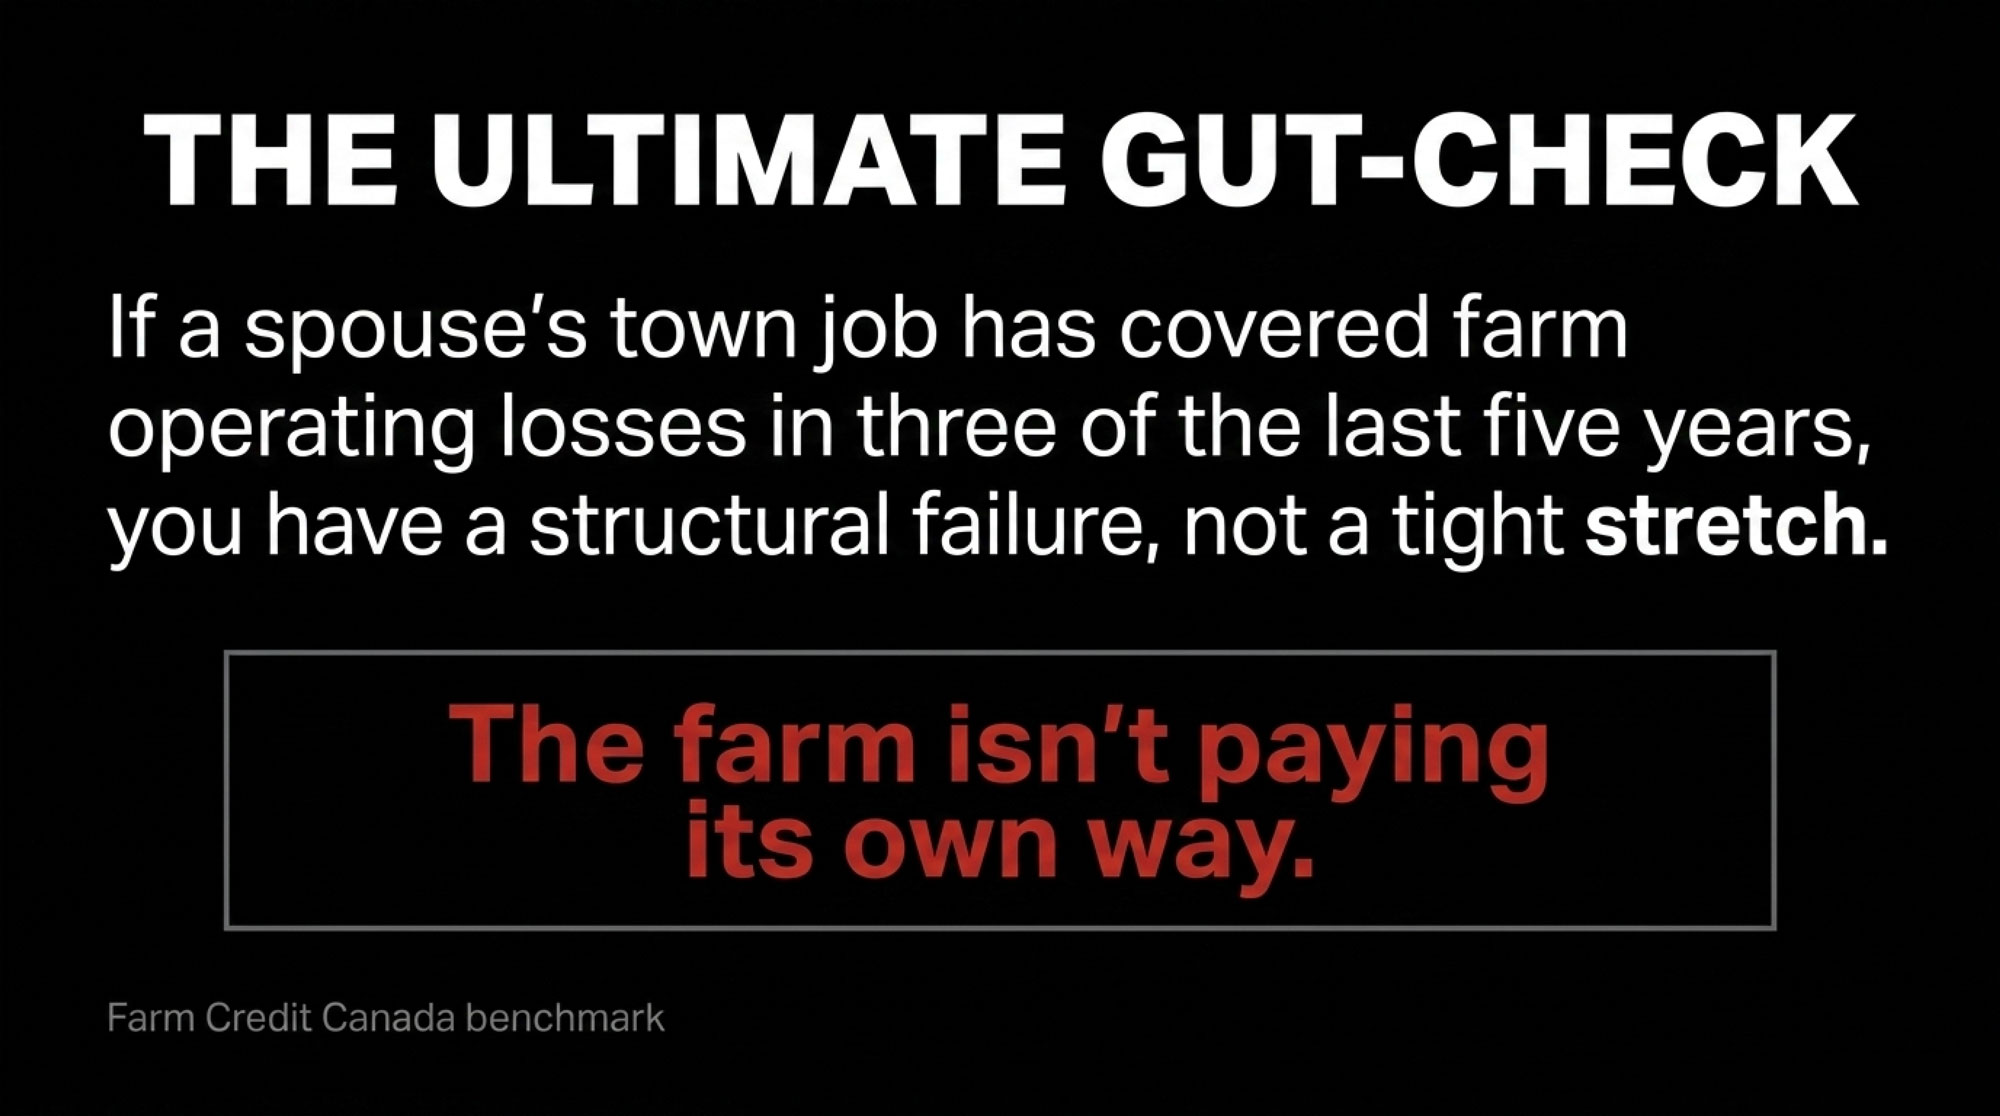
NewsSubscribe
First
Last
Consent

The Real Reason Dairy Farms Are Disappearing (Hint: It’s Not About Better Farming)

Dairy success isn’t about better farming anymore—here’s the real force changing who survives and who sells out.

The February 2024 USDA report had a number that’s stuck with me: about 1,500 U.S. dairy farms closed in 2023, yet national milk production ticked higher. That’s not just abstract data—it’s what drives our conversations at kitchen tables and farm meetings across the country. Let’s talk through what’s really happening and what it means for the future.

U.S. dairy farming faces an existential consolidation crisis, with farm numbers plummeting from 39,300 operations in 2017 to a projected 10,500 by 2040—a 73% reduction driven by systematic structural advantages favoring mega-operations over traditional family farms, with 1,420 farms disappearing annually as of 2024.

Looking at How the Structure Has Shifted

Start with the numbers, because they’re telling: The 2022 Census of Agriculture shows about 65% of American milk now comes from just 8% of herds—those with over 1,000 cows. Meanwhile, nearly 9 out of 10 farms (the 100–500 cow group) account for only 22% of the supply. In the Northeast and Midwest, that’s still the “standard” size, but the playing field keeps tilting.

As one third-generation Wisconsin farmer shared, “I remember 13 dairies on our road, but now it’s just us. Plenty of the folks who exited were younger managers, not retirees. They just couldn’t get the numbers to work.”

Cost of production varies dramatically by herd size, with the smallest operations facing a devastating $9/cwt disadvantage that translates to $250,000 in annual losses for a typical 600-cow farm—a gap driven by scale advantages in feed purchasing, financing, and regulatory compliance rather than management quality.

Cornell’s Dairy Farm Business Summary for 2022 has it in black and white: the biggest herds report $22–$24/cwt cost of production. For 100–199 cow operations, the range is $31–$33/cwt. In a market where the base price is set by regional blend or federal order, that gap eats margin and equity fast.

Beyond Raw Efficiency: What’s Really Behind Cost Gaps

What’s interesting here is how much of the “efficiency” story isn’t really about cow management or even genetics anymore. I talked to a Central Valley manager running 5,000 cows who summed it up: “We buy grain by the unit train—110 railcars. Our delivered price is CBOT minus basis, sometimes 15 cents lower. My neighbor with 300 cows pays elevator price, plus haul; that’s 40, 50 cents more per bushel.”

It’s not just West Coast operations seeing this. In the Upper Midwest, neighbors share similar experiences. Volume buyers get priority and save dollars, not because they feed cows better, but because they can buy enough at once to command a discount.

Bring in finance, and the gap widens. Published rates show 2,000-cow herds receiving prime plus 0.5%. A 200-cow farm might see prime plus two. On a $1 million note, that’s more than $15,000 a year in extra interest just for being smaller.

Then consider environmental compliance. The latest Wisconsin Department of Ag reports—which many of us turned to during the farm planning season—show the cost of nutrient management, methane compliance, and water permits comes out to 50 cents/cwt for the largest herds, but easily $15/cwt or more for the smallest. It’s the same paperwork, same inspector fee—just spread over far fewer cows and pounds.

The scale advantage isn’t about better farming—it’s about systematic structural advantages that give large operations a $4/cwt cost edge through volume discounts on feed, preferential financing rates, amortized regulatory compliance costs, and labor efficiency, creating a $100,000 annual penalty for a 500-cow farm that has nothing to do with management quality.

The Co-op/Processor Crossover: Facing Up to the Math

Now, here’s where a lot of dinner-table talk turns pointed. Vertical integration with co-ops, especially after big moves like DFA’s $425 million purchase of Dean Foods’ 44 plants, changes the dynamic. Industry estimates now indicate that more than half of DFA members’ milk flows through DFA plants.

There’s no way around it: when your co-op is both your “agent” and your buyer, it faces a built-in conflict. The original co-op job—fight for a fair farm price—collides with the processor’s goal: keep input costs as low and steady as possible.

A Cornell ag econ professor put it bluntly at last year’s co-op leadership workshop: “Co-ops owning plants face incentives that are tough to align. You can’t maximize both farmer pay price and processing margin.” And I’ve seen the evidence myself; the research shows co-ops often have lower stated deductions, but within the co-op group, “other deductions” can vary wildly. As one board member told us, “Transparency on this stuff is hard for everyone, even when we want it.”

Think about it: if your co-op owns the plant, is the negotiation about pay price truly across the table or just across the hallway?

Canadian Lessons: Costs and the Future

Now, Canadian friends watching these trends aren’t immune either. The Canadian Dairy Information Centre’s latest data puts the last decade’s dairy farm reduction at over 2,700, even under supply management. And quota levels are a choke point: In Ontario, with a strict cap, quota changes hands around $24,000 per kilo of butterfat; Alberta’s uncapped market runs up past $50,000.

A young producer near Guelph explained it best: “We want to keep the farm in the family, but the math now is about buying quota at market rate from Dad—he paid $3,000/kilo in the ’90s. I pay $24,000/kilo or more, and start so far behind on cash flow it feels impossible.”

Canadian dairy quota prices have exploded from $3,000 per kilogram in the 1990s to $24,000 in Ontario and $50,000 in Alberta by 2023—a 1,567% increase that creates an impossible generational wealth transfer barrier, forcing young farmers to begin their careers hundreds of thousands of dollars in debt simply to acquire the right to produce milk their parents obtained for a fraction of the cost.

Producers Team Up—and Win

We should all pay attention to how producers abroad have responded. In Ireland, Dairygold tried to drop prices, but farmers quickly networked on WhatsApp. Once they started comparing pay stubs, they discovered inconsistencies—same pickup, same composition, different pay. They organized: “If 200 show up with real data, will you join?” The answer was yes. Six weeks, 600 farmers, and the transparency improved, the price cut was rescinded.

That lesson isn’t just for Ireland. That’s modern farm business—facts and solidarity over rumors and grumbling.

U.S. Adaptation Tactics: What’s Working

Across the U.S., I’ve watched farmers embrace savvy but straightforward approaches. Central Valley producers doubled back to their milk checks and truck bills and found that some paid 20 cents/cwt more for identical hauls. As a group, they pressed for change—and got it.

Midwesterners have started bottling their own milk—Wisconsin’s extension reports show farmgate price benefits of $2 to $4 a gallon, though yeah, getting there takes $75,000 to $100,000 and some serious compliance stamina.

Debt is a fresh challenge in its own right in cow management. Now’s the time to renegotiate any credit above prime plus one. Dropping even one percent on a $2 million note brings $20,000–$25,000 savings straight to the P&L.

Environmental Law: A Sea Change

California’s methane digester rules, fully phased in over the past two years, are a classic case of “scale wins again.” For big operations, $4 million-plus digesters can become a profit center—especially if you trade renewable natural gas credits north of $1 million a year. Small farms? They can’t justify the capital, so the compliance cost splits unevenly—UC Davis economists show $2/cwt for small farms, under 50 cents for the largest.

It’s not about better manure management; it’s about who can amortize the cost.

The Path Ahead: What’s Next in Dairy Consolidation

The USDA’s Economic Research Service expects U.S. dairy farm numbers to dip below 10,000 by the mid-2030s, with Canadian farm numbers also dropping to around 4,000–5,000. That’s the math if nobody changes the model or the market.

But honestly, what gives me hope are examples of when perseverance, innovation, and strategic shifts pay off. In Wisconsin, several smaller herds now sell directly into grass-fed cheese contracts, pulling in a $4/cwt premium (more than make-allotment size, less fight for line space). “We stopped competing with 5,000-cow barns by beating them at their game,” one farmer told me. “We get paid for our story and our butterfat.”

Where To Focus Now

  • Calculate Your Position Honestly. Know your true cost—family living included—against hard local benchmarks. If the numbers don’t lie, accept what you see and plan accordingly.
  • Don’t Go It Alone. From paycheck audits to volume negotiations, the farms that win increasingly do so together.
  • Strategic Awareness Beats Production Alone. The future belongs to those who know how pricing, processing, and consumer trends intersect—and find their “crack” in the system instead of just producing more.

As Tom Vilsack put it at a dairy business roundtable: “We love to say we’re saving family farms, but policy and business choices keep rewarding bigness and consistency.” No matter your model—organic, conventional, something in between—the goal is to find your margin, your allies, and your leverage.

The numbers will keep changing, but one reality holds—those who adapt, share, and innovate stand the best chance. Old rules are being rewritten, and it’s worth being part of that conversation. For deep dives on industry economics, co-op strategy, and farm resilience, visit www.thebullvine.com.

KEY TAKEAWAYS

  • Butterfat numbers and raw efficiency don’t guarantee survival—market scale, price leverage, and transparency do.
  • Question every deduction and demand clarity from your co-op or processor—internal conflicts don’t have to shortchange you.
  • Benchmark your costs with neighboring farms and negotiate together—solo producers rarely win against consolidated buyers.
  • The farms thriving today are adapting: going direct-to-consumer, value-adding, or finding specialized markets to earn more per cwt.
  • Success in modern dairy comes from forward planning, embracing new models, and building your own leverage—not waiting for the system to “fix itself.”

EXECUTIVE SUMMARY:

Dairy’s old rules—“be efficient and you survive”—no longer hold. Drawing on real farm stories and national data, this investigation exposes why scale, access, and co-op consolidation matter more than top cow performance. You’ll see how market power and processor influence—not just farm management—decide who survives and who sells out. With insights from producers challenging these trends, along with practical strategies and benchmarks, this article is a must-read for anyone rewriting their playbook. Get the facts, the framework, and a clear-eyed look at what real success in dairy now demands.

Complete references and supporting documentation are available upon request by contacting the editorial team at editor@thebullvine.com.

Learn More:

The Sunday Read Dairy Professionals Don’t Skip.

Every week, thousands of producers, breeders, and industry insiders open Bullvine Weekly for genetics insights, market shifts, and profit strategies they won’t find anywhere else. One email. Five minutes. Smarter decisions all week.
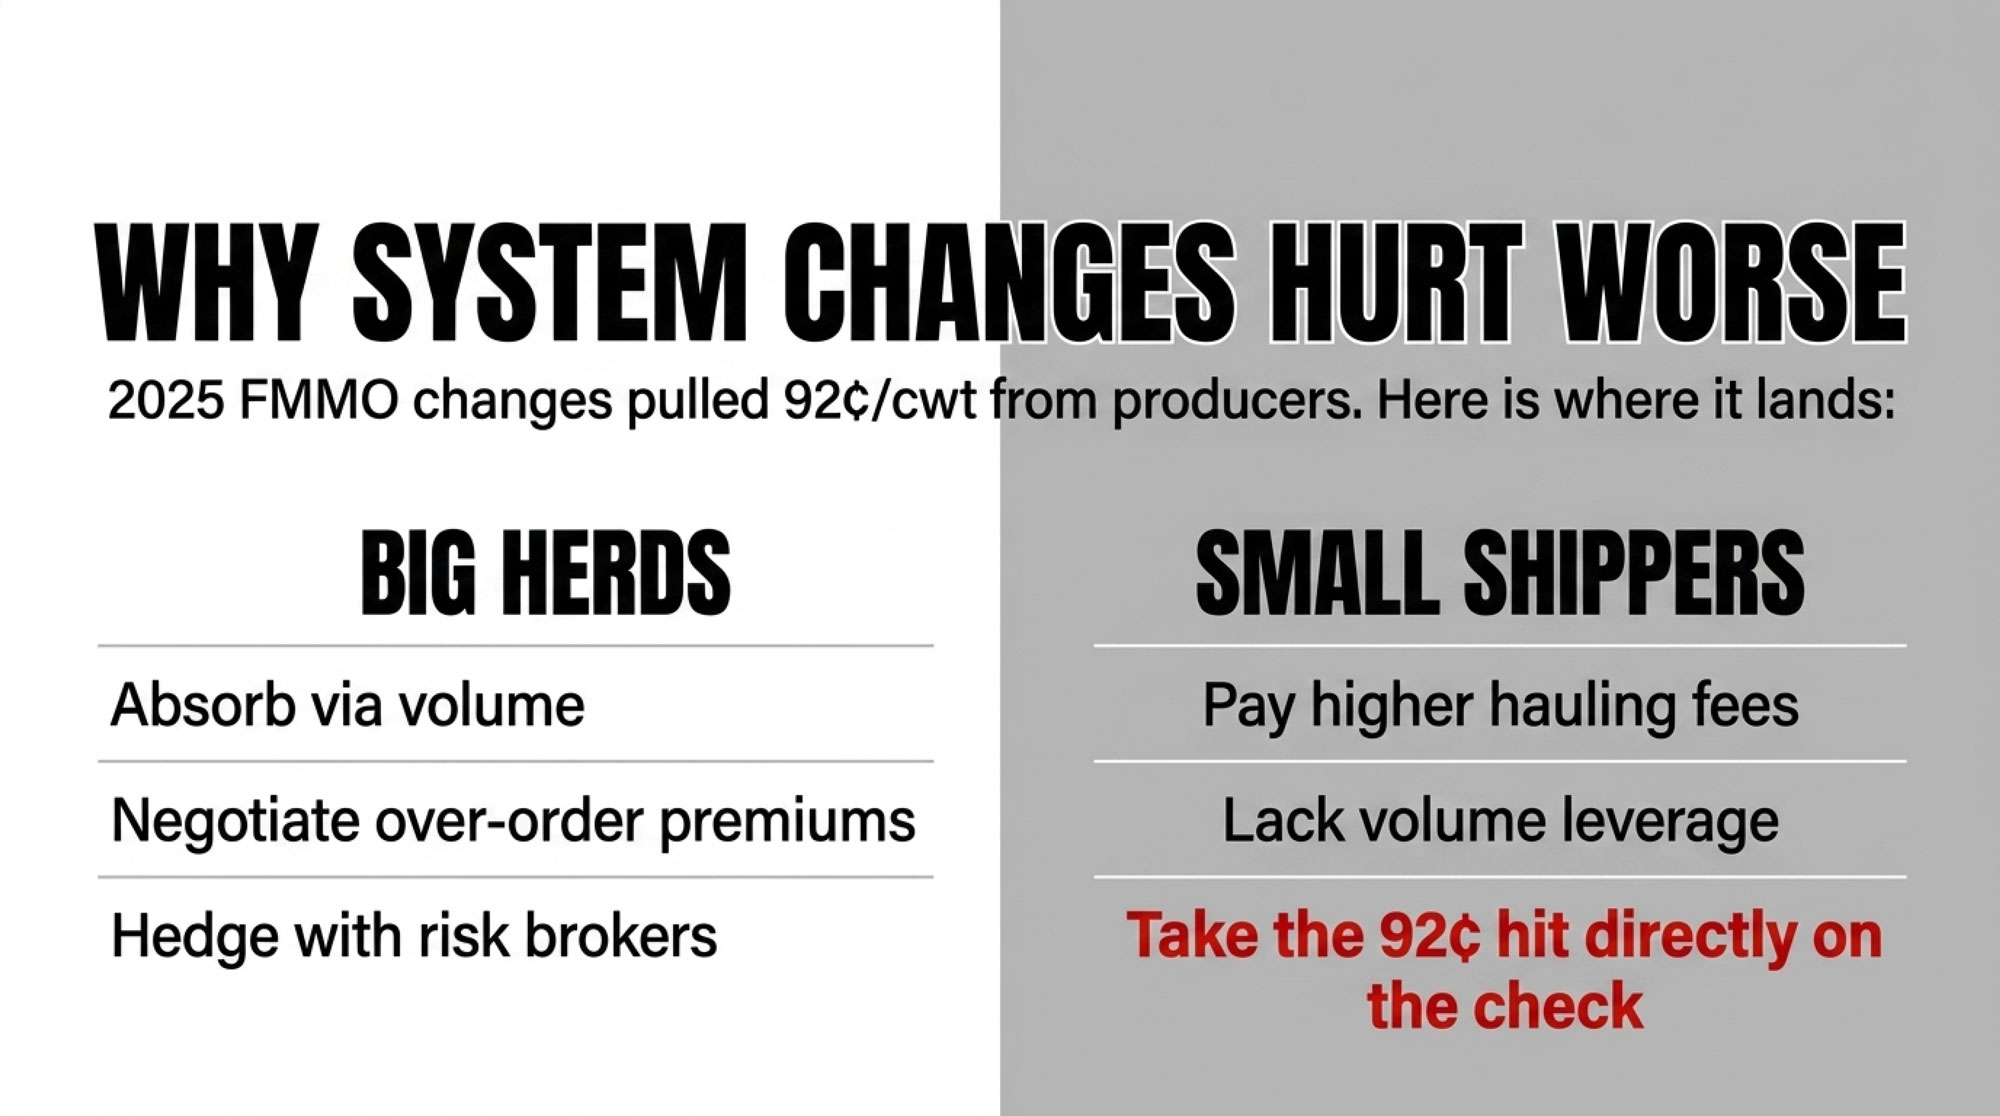
NewsSubscribe
First
Last
Consent

Whole Milk is Back in Schools. Here’s Why Only 834 Dairy Farms Will Really Win.

After 13 years of scientific vindication and structural transformation, the Senate’s unanimous approval reveals important lessons about policy, persistence, and what it really takes to survive in American dairy

EXECUTIVE SUMMARY: Whole milk returns to schools after 13 years, validating what dairy farmers knew all along—but for 17,000 operations that closed during the wait, vindication came too late. The University of Toronto’s 2020 research showed that whole milk reduces childhood obesity by 40%, yet policymakers needed five more years and a new administration to act. Today’s transformed industry means only farms with 1,500+ cows can capture meaningful returns ($40,000-$80,000 annually) from school contracts, while farms with fewer than 500 cows are effectively locked out. The December 31, 2025, deadline for cooperative engagement is the last chance to participate until 2029—but many mid-size farms are finding better opportunities in value-added production, earning 30% revenue increases versus marginal school milk returns. The harsh lesson: in agricultural policy, being scientifically right matters less than being financially resilient enough to outlast institutional inertia.

Whole Milk in Schools

You know, when I watched the celebrations after the Senate unanimously passed S.222 on November 20th—that’s the Whole Milk for Healthy Kids Act—I had mixed feelings. Don’t get me wrong, after thirteen years of being told our product was harmful to children, finally getting vindication feels good.

But I recently had coffee with a producer from central Wisconsin who put it perfectly:

“We won the battle, but the war changed while we were fighting it.”

— Wisconsin dairy farmer, November 2025

And that’s what I keep hearing as I talk with folks across the industry. This victory arrives in a fundamentally different world than the one we knew in 2012. The real question isn’t whether we were right about the science—turns out we were—but rather, what does this actually mean for operations trying to make it work today?

The Science Story: What Actually Changed Things

So let me walk you through what happened with the research, because it’s pretty revealing about how this whole system works.

The University of Toronto published this meta-analysis back in early 2020—Dr. Jonathon Maguire’s team analyzed 28 studies covering nearly 21,000 kids from seven countries. And here’s what knocked me sideways when I first read it: children drinking whole milk showed 40% lower odds of being overweight or obese compared to those drinking reduced-fat milk.

Think about that for a second. The 2010 policy that yanked whole milk from schools—we’re talking about 30 million students in the National School Lunch Program—that whole thing was built on the idea that cutting saturated fat would fight childhood obesity. The Toronto research basically said we might’ve had it backwards all along.

What’s really interesting is its consistency. Eighteen of those 28 studies pointed in the same direction. Not a single study showed that reduced-fat milk actually lowered obesity risk.

As the University of Toronto folks noted, these findings meant we needed to completely rethink our assumptions about whole milk and kids’ health.

But here’s where it gets frustrating, and I bet many of you felt this too. The 2020 Dietary Guidelines Advisory Committee had this research right in front of them—it’s in Part D, Chapter 9 of their Scientific Report if you want to look it up. They acknowledged it, called the evidence “limited” because it wasn’t from randomized controlled trials, and recommended no change to policy.

It would take five more years and a complete change in political administration before anything actually moved. That gap between having the evidence and getting the policy to shift? That’s something every agricultural sector needs to understand.

What Really Happened While We Were Waiting

The numbers tell part of the story, but they don’t tell all of it. USDA’s Census of Agriculture shows we went from about 43,000 dairy farms down to around 26,000. But let me break down what that meant in places we all know.

Wisconsin’s Department of Agriculture reported 2,740 operations closed. Pennsylvania’s Center for Dairy Excellence documented 1,570 farms gone. New York’s Department of Agriculture and Markets recorded 1,260 fewer operations.

These aren’t just statistics—these are neighbors, fellow co-op members, families we’ve known for generations.

What’s really revealing, though, is the structural shift. USDA’s Economic Research Service report from July shows that operations with over 2,500 cows actually grew from 714 to 834. Meanwhile, those mid-sized herds—the 500- to 999-cow operations that used to be the backbone of so many regions—declined by 35%. And farms running 1,000-2,499 head? Down 10%.

You know what this tells me? This isn’t just consolidation in the traditional sense. It’s a fundamental restructuring of who can even access certain markets anymore.

Component pricing arrangements, pooling structures, institutional procurement requirements—they’ve all evolved in ways that increasingly favor operations with scale and capital reserves.

Gregg Doud, President of the National Milk Producers Federation, acknowledged this reality in their press release after the Senate vote: “While we celebrate this victory, we must recognize that market access will vary significantly by operation size and regional positioning.”

He’s right. That’s the hard truth we need to face.

Three Producers, Three Different Paths

I was visiting with producers in three different states last month about exactly this. Dave from southeastern Pennsylvania, running 750 cows, told me, “We survived by diversifying early—not because we saw this coming, but because we couldn’t afford to wait around.”

A producer named Carlos down in West Texas with 3,500 cows had a different take: “We built for institutional markets from day one. Scale was always our strategy.”

And Sarah, milking 120 cows up in Vermont, said simply, “We stopped trying to compete in commodity markets five years ago. Best decision we ever made.”

Three different paths, all working. That’s what’s interesting about where we are now.

What the Whole Milk Opportunity Actually Looks Like

So here’s what industry analysts and cooperatives are projecting. If whole milk adoption in schools reaches 50%, we could see butterfat demand increase by tens of millions of pounds annually.

Schools account for roughly 8% of total fluid milk consumption through about 4.9 billion meals served each year—that’s based on USDA data—so we’re talking about meaningful volume.

But the distribution of that benefit? That’s where it gets complicated.

Based on what Federal Milk Marketing Order data and cooperative communications are suggesting, here’s how it breaks down:

Who Wins from Whole Milk’s Return?

Operation SizeProjected Annual ImpactStrategic Move
1,500+ Cows+$40,000–$80,000Aggressively bid 2026 RFPs; leverage volume for contracts
500–1,000 Cows+$1,500–$3,000 (marginal)Evaluate admin costs vs. return; focus on efficiency gains
Under 300 CowsLow/InaccessibleFocus on direct market/specialty; skip commodity school bids

Each operation needs their own pencil work here, but the pattern is clear: scale determines access.

The Timeline You Absolutely Need to Know

If you’re thinking about pursuing this, the window for action is pretty specific:

December 2025 is really your last shot to engage your cooperative about interest.

School districts typically release their RFPs between January and March 2026. You’ll need to get your documentation and compliance certifications together in February—and trust me, there’s a lot of paperwork.

Bids are due April through May. Awards get announced in June. New contracts start July 1, 2026.

Miss that window? You’re looking at waiting one to three years for the next cycle. That’s just how institutional procurement works.

What’s Actually Working Out There

While everybody’s been focused on the whole milk policy news, I’ve been tracking what successful operations are actually doing day to day. And the patterns are pretty instructive.

Value-Added Production: More Than Just Buzzwords

Market research shows that value-added dairy products are growing at about 12% annually, while fluid milk is pretty flat.

Michael Dykes, Senior Vice President for Regulatory Affairs at the International Dairy Foods Association, keeps saying what a lot of producers are discovering on their own: differentiation and innovation capture premiums that commodity markets just don’t offer.

Here’s what I’m seeing work:

  • Lactose-free products commanding decent premiums
  • A2 milk is getting significant price advantages in metro markets
  • Artisanal products at farmers’ markets are capturing really impressive margins—USDA’s direct marketing research backs this up consistently

I visited a family operation near River Falls, Wisconsin, last month that put in bottling equipment through a USDA Value-Added Producer Grant. They’re processing about 60% of their production on-farm now, and they’re seeing revenue increases pushing 30%. Plus, they created three local jobs.

But they’ll also tell you it took two years of planning and serious capital commitment. It’s not a quick fix.

Technology: What the Early Adopters Are Finding

The data on precision management is getting clearer, and it’s worth paying attention to.

IoT health monitoring systems are showing productivity improvements in the 15-20% range, with payback periods of 18-24 months—that’s based on extension research and what early adopters are reporting.

Precision feeding is demonstrating meaningful cost reductions, we’re talking tens of thousands annually for mid-sized operations. Robotic milking shows solid yield increases, though you’re looking at ROI horizons beyond seven years.

What’s interesting is how successful farms are approaching it. Mark from central Michigan told me, “We started with monitoring—low investment, quick returns. That funded our next technology step.”

That staged approach keeps showing up in the success stories.

Cooperative Innovation: Old Ideas, New Applications

Here’s something that gives me hope. Edge Dairy Farmer Cooperative’s President, Brody Stapel, recently discussed how producer groups are rediscovering collective bargaining power through the Capper-Volstead Act. This isn’t nostalgia—it’s a smart strategy.

Penn State Extension documented 12 Pennsylvania operations, each averaging 350 cows, that formed their own cheese-making cooperative. They’re getting $1.50 to $2.50 per hundredweight premiums through regional direct sales.

By controlling processing and marketing, they basically created their own market channel. Takes significant coordination, but it’s absolutely replicable.

How Different Regions Are Handling This

The whole milk opportunity plays out differently depending on where you are, and understanding your regional context really matters.

Traditional Dairy States: Infrastructure Without Volume

Wisconsin, Pennsylvania, New York—we’ve got the infrastructure and cooperative relationships to access school markets. But with way fewer farms to benefit now, the impact gets concentrated among fewer producers.

Wisconsin’s still losing hundreds of operations annually, according to their state statistics.

Bob Bosold from the Dairy Business Association frames it well: the infrastructure persists, but we’re down to half the number of farms we had when whole milk was banned. The survivors tend toward larger scale and efficiency, but there’s just fewer of them to capture the benefit.

Expansion Regions: Built for This

Texas, Idaho, and New Mexico operations? They were essentially designed for institutional contracts.

With $11 billion in processing capacity additions expected through 2026, according to industry investment tracking, these regions are optimized for high-volume, standardized production.

Average herd sizes in these areas now measure in the thousands, which aligns perfectly with procurement requirements. New facilities incorporate automated systems ensuring consistent butterfat ratios and daily delivery capacity from day one.

It’s industrial-scale dairying, and for that market segment, it works.

Specialty Markets: A Different Game Entirely

Vermont, Northern California, pockets of the Northeast—they’ve largely exited commodity competition. And honestly? Market research suggests organic dairy could exceed $30 billion by 2030.

For these regions, that represents a way better opportunity than school contracts.

Vermont’s Agency of Agriculture finds that about 75% of remaining farms now do value-added or direct marketing, up from 31% in 2012.

That’s not retreat—that’s strategic repositioning, and it’s working for them.

Understanding How Policy Actually Works

The whole-milk experience taught me something important about how agricultural policy really works. Scientific evidence alone—even compelling evidence like the Toronto study—doesn’t automatically drive policy change.

When FDA Commissioner Martin Makary started talking about ending what he called the “fifty-year war on saturated fat,” and Agriculture Secretary Brooke Rollins expressed support for whole milk, they provided something dairy producers couldn’t: institutional permission to challenge established frameworks.

That permission, not just the science, enabled the change.

NMPF had been citing the Toronto research since 2020, submitted formal comments, provided testimony—and followed all the proper channels. But as they noted in their testimony, they kept encountering “institutional commitment to existing guidance despite evolving science.”

The 2020 Dietary Guidelines Committee acknowledged potential benefits of higher-fat dairy for children but stuck with existing recommendations, saying the studies were observational rather than randomized controlled trials.

That’s institutional inertia in action—not conspiracy, just systematic resistance to change.

What This Means for Different Operations

Based on what I’m hearing from producers and seeing in market dynamics, here’s how I’d think about it:

Large operations (1,500-plus cows): You should probably evaluate school contracts pretty aggressively during that 2026 procurement window. The potential return likely justifies the effort.

And use that baseline volume to leverage value-added investments. But get talking to your cooperative now, not in March.

Mid-size operations (500 to 1,000 cows): You’ve got a more complex calculation. Those modest school premiums might not justify the administrative headaches.

University economics research keeps showing that value-added production, marketing alliances, or specialty certification offer better risk-adjusted returns for operations of your size.

Smaller operations (under 500 cows): Institutional markets are probably structurally out of reach, and that’s okay.

Extension research consistently shows that direct-to-consumer, on-farm processing, agritourism, or specialized production delivers way better margins than competing in commodity markets.

The Real Lesson Here

Here’s what the whole milk saga really reveals about agricultural policy:

  • Institutional frameworks resist change even when faced with strong contrary evidence
  • Individual operations can’t survive indefinitely waiting for policy-market misalignment to fix itself
  • Industry organizations face real constraints limiting how hard they can push
  • Political context matters just as much as scientific evidence

“The 17,000 farms that closed weren’t wrong about the science. They just couldn’t survive the wait.”

That’s the sobering part.

Looking Ahead: What Success Looks Like Now

Industry forecasts from major agricultural lenders suggest continued consolidation toward something like 15,000 total U.S. dairy farms by 2030.

The industry’s brutal restructuring: Total farms plunged 60% from 43,000 to 26,000 while mega-dairies with 2,500+ cows surged 67%—a tale of two industries in one policy shift

Within that reality, though, success patterns are emerging from USDA and extension data:

  • Operations with multiple revenue streams show way better five-year survival rates
  • Technology adopters demonstrate clear margin advantages
  • Direct market relationships command premium pricing
  • Innovative cooperative structures are creating market access for mid-sized producers who work together

What’s encouraging is that these strategies were working before the whole milk policy changed. The policy shift provides favorable conditions, not a fundamental transformation.

The Bottom Line

Whole milk’s return validates what many of us have understood intuitively about nutrition and what kids actually want to drink. That vindication deserves recognition, and I’m genuinely glad we got here.

But the thirteen-year wait extracted enormous cost from our industry. The farms that made it through built resilient businesses that didn’t depend on policy alignment finally happening.

So yeah, pursue whole milk opportunities if you’re positioned for it. But build your operation assuming policy corrections might take another decade—or might never come at all.

That’s not pessimism. That’s just strategic realism based on what we’ve all watched unfold.

The industry emerging from this period will be different—more concentrated, more specialized, more technology-enabled. Whether that’s good or bad depends on your perspective and where you sit.

What’s certain is that adaptability, not policy dependence, determines who’s still farming five years from now.

This moment offers real opportunity for those positioned to capture it, validation for those who stuck it out, and lessons for all of us about how science, policy, and agricultural economics actually interact.

How we apply those lessons will shape what American dairy looks like going forward.

Your Next Steps

If You’re Considering School Milk Contracts:

  • Contact your cooperative before December 31, 2025
  • Request procurement specifications and compliance requirements
  • Evaluate administrative capacity against projected returns

For Value-Added Exploration:

  • USDA Value-Added Producer Grant program: rd.usda.gov/vapg
  • Your state dairy association for regional guidance
  • Extension dairy specialists for business planning

For Technology Investment Planning:

  • University extension technology adoption studies
  • Your equipment dealer’s ROI calculators
  • Peer producers who’ve implemented similar systems

For Cooperative Innovation:

  • Capper-Volstead Act resources through the USDA
  • State extension cooperative development programs
  • Regional producer alliance case studies

General Resources:

  • National Milk Producers Federation: nmpf.org
  • International Dairy Foods Association: idfa.org
  • Your state dairy association
  • Local extension dairy specialist

Based on legislative records, USDA data, industry reports, and conversations with producers through November 2025. For operation-specific guidance, talk with your advisors who know your situation.

KEY TAKEAWAYS

  • December 31, 2025, Deadline: Contact your cooperative now for 2026 school contracts, or wait 3 years
  • Scale Determines Success: 1,500+ cow operations gain $40-80K/year; farms under 300 cows are locked out
  • Science Was Always Right: Whole milk reduces childhood obesity 40%—but 17,000 farms closed waiting for policy to catch up
  • Better Options Exist: Mid-size farms seeing 30% revenue gains from value-added production vs. marginal school milk returns
  • Adapt or Wait: Surviving farms built businesses that don’t depend on policy victories

Complete references and supporting documentation are available upon request by contacting the editorial team at editor@thebullvine.com.

Learn More:

The Sunday Read Dairy Professionals Don’t Skip.

Every week, thousands of producers, breeders, and industry insiders open Bullvine Weekly for genetics insights, market shifts, and profit strategies they won’t find anywhere else. One email. Five minutes. Smarter decisions all week.
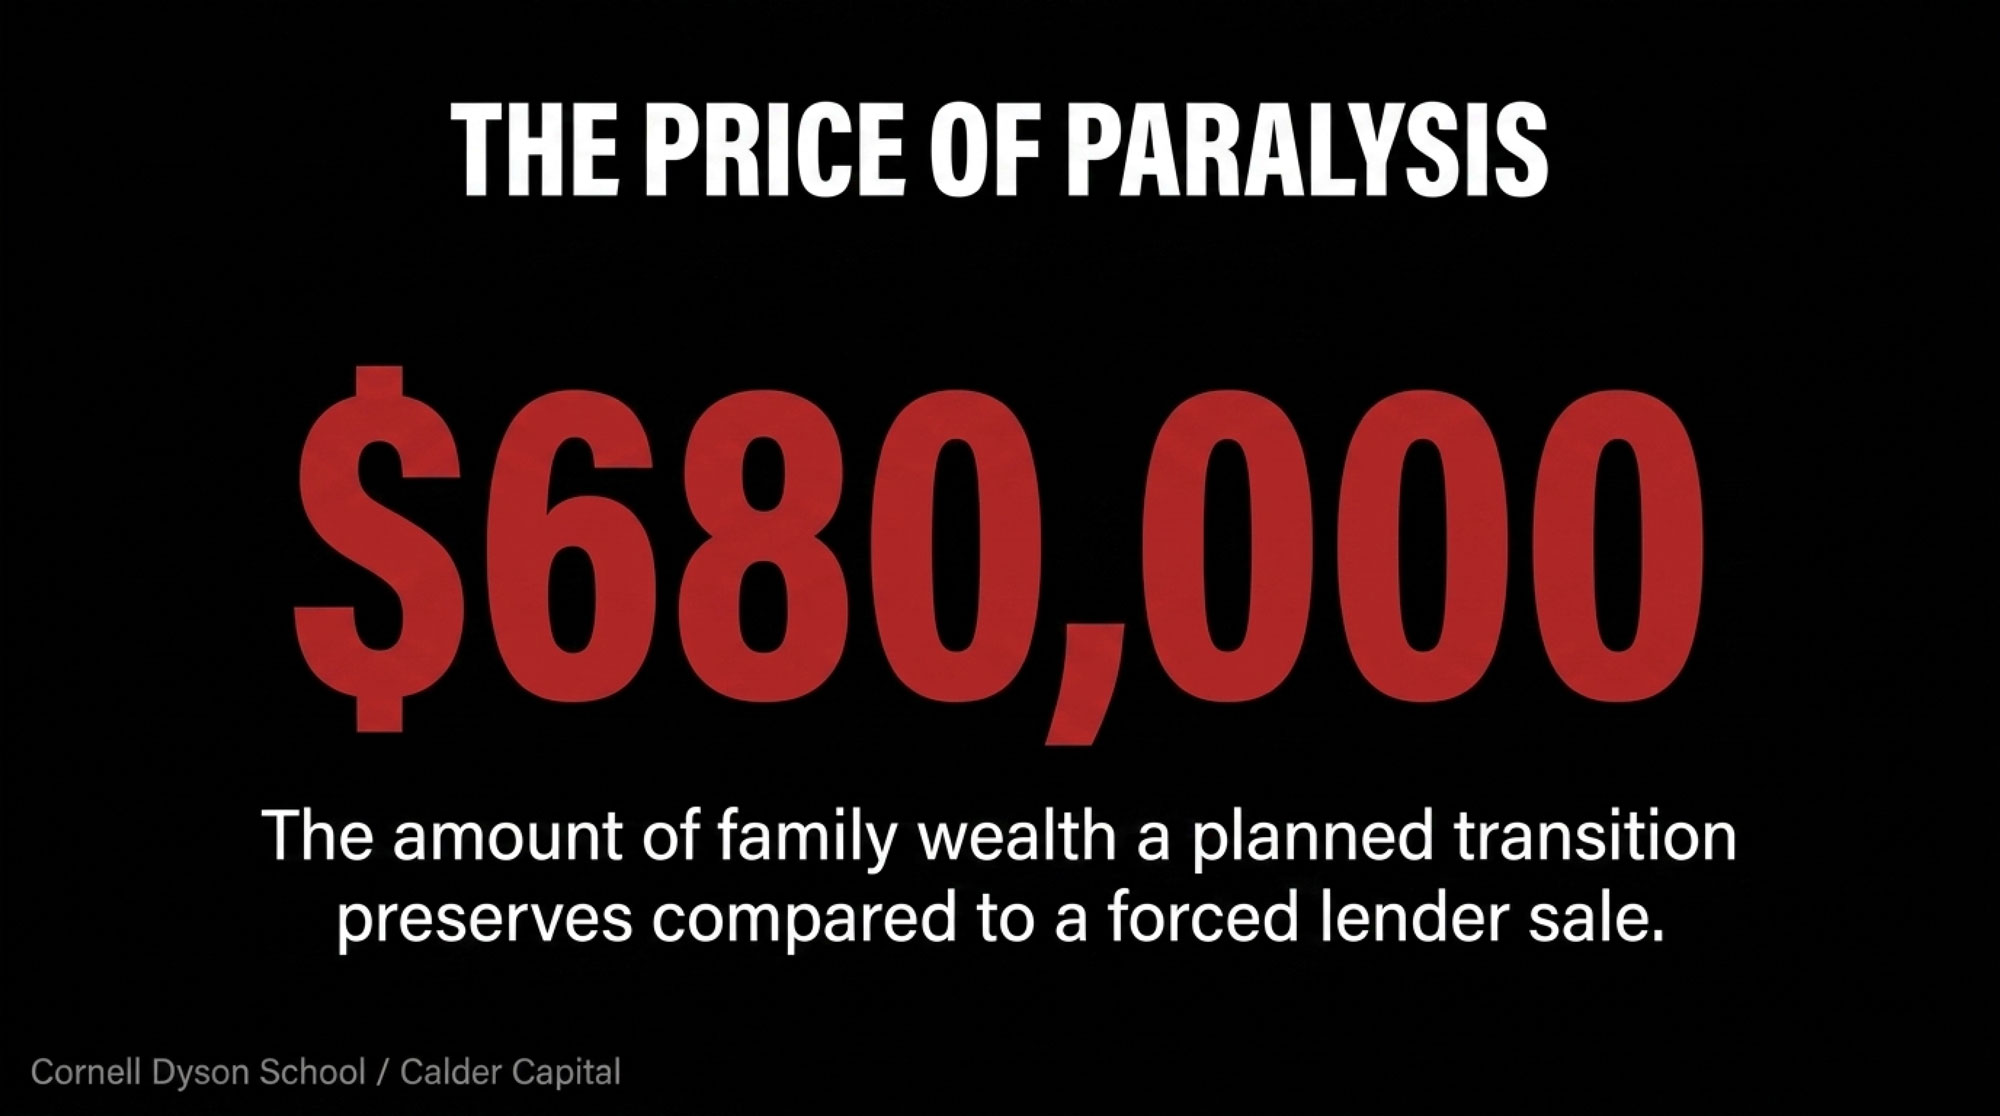
NewsSubscribe
First
Last
Consent

DFA’s Wisconsin Play: Why This Cheese Move Signals a Major Market Shift

Hispanic cheese sales jumped 8%, while American cheese dropped 5%; yet, most co-ops are still betting on commodity cheddar instead of demographic shifts.

EXECUTIVE SUMMARY: Here’s what caught my attention about DFA’s W&W Dairy pickup – this isn’t about milk volume anymore, it’s about reading demographic tea leaves. While most people are still focused on traditional American cheese, Hispanic varieties are growing at a rate three times that of the overall cheese category. DFA’s looking at $24.5 billion in annual revenue, and they’re betting big on a segment that has jumped 8% in sales, while American cheese has dropped 5%. The smart money sees what’s coming: demographic shifts that create sustained demand growth independent of economic cycles. According to recent data, Hispanic household formation is outpacing general population growth by significant margins – that’s not a trend, that’s a structural shift. If your co-op doesn’t have a clear strategy for specialty cheese markets, you’re missing the boat on profit opportunities that’ll compound for decades.

KEY TAKEAWAYS

  • Demographic dividend delivers sustained margins: Hispanic cheese varieties command premium pricing above commodity levels while growing 3x faster than traditional categories – position your operation now before market saturation hits in 2027-2028
  • Co-op strategy audit time: Ask your cooperative leadership directly if they have concrete plans for specialty cheese market entry or if they’re still betting everything on commodity cheddar pricing cycles
  • Operational scale advantage: DFA’s dual-facility network (Houston + Wisconsin) creates geographic flexibility and cost efficiencies of 50-75 cents per hundredweight – consider regional partnerships if you can’t achieve similar economies independently
  • Regulatory compliance creates consolidation opportunities: FDA enforcement actions like the Rizo Lopez consent decree are pushing smaller processors toward costly automation investments – larger operations with compliance infrastructure gain competitive positioning
  • Feed efficiency connection: Specialty cheese production requires different nutritional protocols than commodity manufacturing – operations implementing precision feeding systems can optimize milk components for premium cheese applications while reducing feed costs per unit of specialized output
Hispanic cheese market, dairy market trends, value-added dairy, dairy co-op strategy, dairy profitability

The key takeaway from Dairy Farmers of America’s acquisition of W&W Dairy in Monroe, Wisconsin, is that this isn’t just another addition to the consolidation news. This is DFA making a strategic play for the fastest-growing slice of America’s cheese market — and most folks are still sleeping on it.

We’re talking about the Hispanic cheese segment, and the numbers don’t lie. Circana’s data from early 2024, highlighted in Dairy Reporter, shows that deli specialty cheese sales increased by 8% in both dollars and volume, while traditional American cheese sales declined by nearly 5%. Hispanic varieties are driving that surge, and DFA’s Ken Orf puts it perfectly: “The growth trajectory for the Hispanic cheese market is more than three times that of the broader cheese category.”

The Strategic Puzzle Pieces Coming Together

Here’s what’s fascinating about this deal — it’s not just about adding production capacity. DFA already operates the La Vaquita brand in Houston, which, as anyone who has been watching the Hispanic market knows, is a real powerhouse. Now they’re pairing that with W&W’s Monroe operation, and suddenly you’ve got geographic coverage that makes sense.

W&W has a seven-day milk-to-market turnaround that’s pretty impressive, considering the complexity of authentic Hispanic cheeses. And their packaging flexibility? We’re talking everything from 5-ounce retail packs for specialty shops to 60-pound blocks for foodservice. That kind of range lets you serve everyone from the corner tienda to major grocery chains.

Smart move keeping all 97 W&W employees too. Anyone who has worked with Hispanic cheese varieties knows it’s not commodity stuff — those pH management tricks, salt brining techniques, and aging protocols… that’s institutional knowledge you can’t just replace overnight.

Broader Forces at Play

The timing of this acquisition is particularly noteworthy. The dairy landscape is currently shaped by ongoing Federal Milk Marketing Order discussions, where the USDA’s considering adjustments to make allowances. This is fueling an environment where processors feel more optimistic about expansion, even though it complicates the farmer pay picture.

And let’s be real about scale — DFA pulled in $24.5 billion in 2022 according to Rabobank’s latest rankings. They’re not just playing in the big leagues; they’re helping define what the big leagues look like.

Then there’s the regulatory pressure we’re all feeling. That FDA consent decree against Rizo Lopez Foods over the listeria outbreak? It’s a wake-up call. Smaller processors are either investing heavily in automation or… well, let’s just say the field’s getting narrower. Companies like DFA that can handle complex compliance? They’re positioned to benefit.

According to what Ken Orf told The Monroe Times, the operational synergies between Monroe and Houston are already showing promise — better milk utilization, smarter logistics, real cost efficiencies that add up.

Market Reality Check

Crucially, queso fresco is no longer a niche product. Neither is cotija, or any of these Hispanic varieties we used to think of as a specialty. The sales data show a clear trend — Hispanic cheeses are gaining market share, while American cheese is losing ground.

Now, I’ve heard some folks wondering about Mexico connections since they’re such a huge dairy customer for the U.S. — we’re talking billions in annual sales. But this acquisition is more about domestic market positioning than export strategy, at least for now.

What strikes me most is how this move reflects broader demographic shifts that aren’t slowing down. Data from university extension programs confirms that Hispanic household formation is outpacing general population growth by significant margins. That’s sustained demand growth independent of economic cycles.

Bottom Line: What This Means for Your Operation

If you’re a producer, it’s time for a real conversation with your co-op leadership. Do they have a concrete strategy for capturing value in high-growth categories, such as the Hispanic cheese market? Or are they still betting everything on commodity cheddar and hoping for the best?

For processors, the message is becoming clearer by the month — scale matters, specialization matters, and food safety compliance is no longer optional. If you can’t achieve all three independently, strategic partnerships might be your path forward.

Here’s what you should be asking yourself right now:

  • Does your current market positioning align with demographic trends?
  • Can your operation handle the complexity and compliance demands of specialty cheese production?
  • What’s your plan for the next five years when Hispanic varieties become even more mainstream?

DFA’s not just building a bigger cheese network — they’re building a smarter one. Production optimization, inventory management, customer service capabilities that smaller players struggle to match… it’s operational scale married to market intelligence.

This acquisition represents something more significant than just another line item in the consolidation headlines. It’s a declaration that Hispanic cheese is moving from the specialty aisle to center stage. The market’s not asking if this shift will continue — demographic trends have already answered that. The real question is whether your operation has the strategy to shift with it.

Complete references and supporting documentation are available upon request by contacting the editorial team at editor@thebullvine.com.

Learn More:

  • Unlocking Higher Milk Components: It’s More Than Just Genetics – This piece provides tactical feeding and management strategies for increasing butterfat and protein. It details how to produce the high-value milk that processors require for specialty products, allowing your operation to capture premiums and align with market demand.
  • Are Dairy Co-ops Helping or Hindering the Industry’s Future? – This strategic analysis questions the traditional co-op model in today’s market. It provides a critical framework for evaluating if your cooperative’s business strategy is truly positioned for growth or if it’s hindering long-term profitability in a consolidating industry.
  • Dairy’s Digital Frontier: Turning Data into Dollars – Moving beyond market trends, this article reveals how to leverage on-farm data for enhanced profitability. It demonstrates practical methods for turning herd management information into actionable financial insights, future-proofing your operation against market volatility and operational inefficiencies.

The Sunday Read Dairy Professionals Don’t Skip.

Every week, thousands of producers, breeders, and industry insiders open Bullvine Weekly for genetics insights, market shifts, and profit strategies they won’t find anywhere else. One email. Five minutes. Smarter decisions all week.
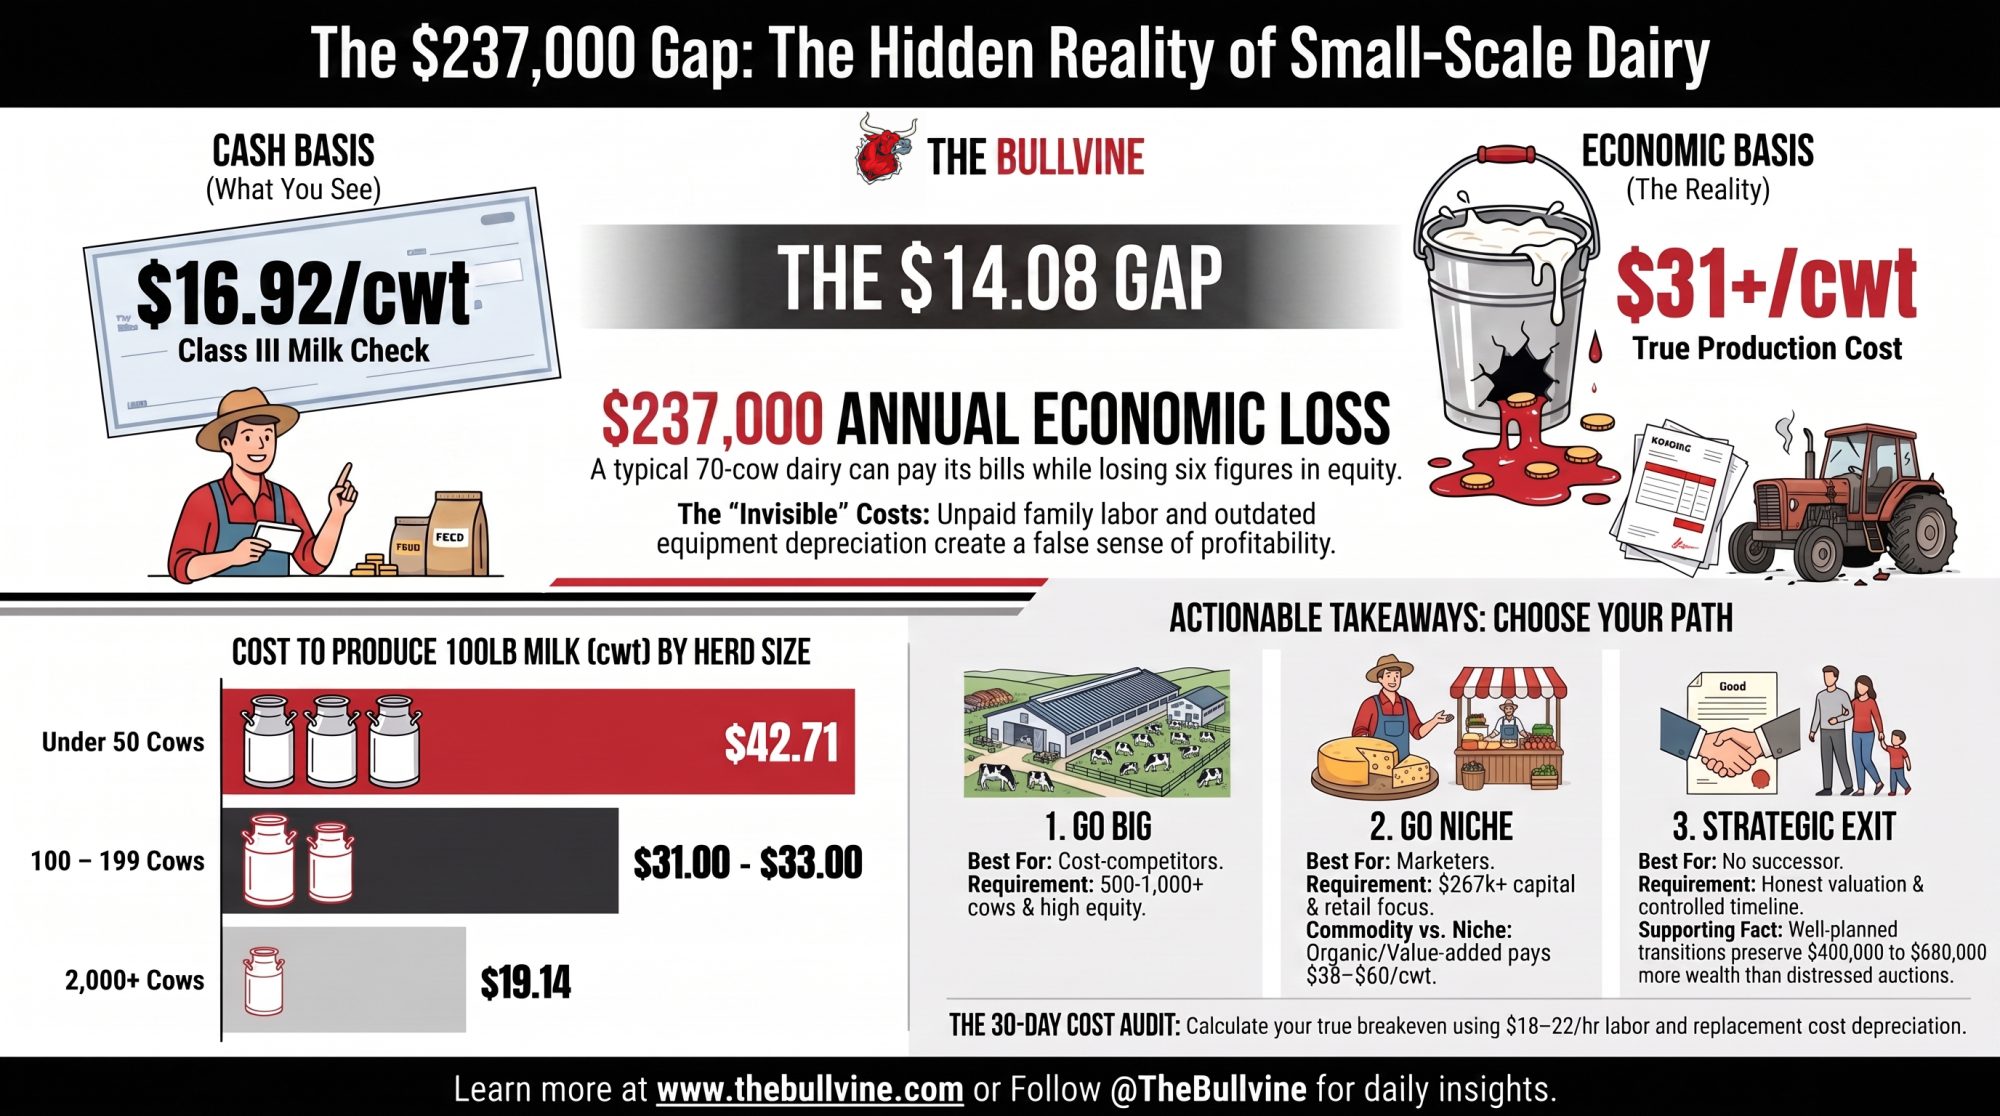
NewsSubscribe
First
Last
Consent
Send this to a friend