Archive for mid-size dairy viability

The 18-Month Window: Why Your Lender Knows Your Dairy’s in Trouble Before You Do

The math says 2,800 dairies will close this year. Your lender already knows if you’re one of them. Do you?

There’s a conversation happening in bank offices and cooperative boardrooms right now that most of us aren’t part of—at least not early enough to matter. I was reminded of this recently when talking with a 400-cow operator in central Wisconsin who’d just come from a meeting with his lender. “Nobody told me the runway was this short,” he said. That conversation is really what prompted me to put this piece together.

What I want to walk through today isn’t about whether dairy consolidation is coming, as many of us have observed over recent years, that question has largely been answered by economics. It’s about understanding the timeline and making decisions while meaningful choices still exist. Because there’s a real difference between strategic planning and crisis management, even when the underlying numbers look similar on paper.

What the Current Data Shows

Let’s start with what we actually know. Rabobank’s dairy analysts have been projecting 7 to 9 percent annual farm exits through 2027 in their global dairy outlook reports. On a base of roughly 39,000 U.S. dairy operations, that works out to approximately 2,800 farms closing in 2025 alone.

Now, I want to be clear—that’s a projection, not a guaranteed outcome. Projections have been wrong before, sometimes dramatically. But it aligns with what many of us are observing in our own communities. Wisconsin and Minnesota have seen steady attrition among mid-sized herds. California’s Central Valley operations are navigating their own pressures around water and labor costs. Northeast family dairies face familiar questions about scale and succession. Even in Texas, where dairy has been expanding, the growth is concentrated in larger operations, while smaller producers face the same margin pressures as elsewhere. Pacific Northwest dairies tell similar stories.

What’s particularly noteworthy about this cycle is the picture of processor investment. The International Dairy Foods Association announced in October 2025 that processors have committed more than $11 billion in new and expanded manufacturing capacity across 19 states, with more than 50 individual building projects scheduled through early 2028.

I spoke with a dairy economist last month who offered some useful context: those facilities aren’t being designed for the farm structure we have today—they’re being built for a landscape where the median supplier is considerably larger. That’s neither inherently good nor bad. It’s simply the direction capital is flowing, and understanding that helps inform planning decisions.

The timing also coincides with recent regulatory changes. The Federal Milk Marketing Order amendments took effect in June 2025, and according to American Farm Bureau Federation analysis from September, producers experienced more than $337 million in combined pool value reduction during the first three months under the new rules. Class price reductions from the make allowance changes ranged from 85 to 93 cents per hundredweight.

To put that in practical terms for daily planning: a 300-cow operation shipping around 680,000 pounds monthly is looking at roughly $5,800 to $6,300 per month in reduced revenue—before any operational changes. That’s meaningful money that affects everything from cash flow planning to equipment decisions.

Four Metrics Worth Watching

So how do you assess where your operation actually stands? What I’ve found helpful—and this comes from conversations with producers, lenders, and consultants across different regions—is focusing on four metrics that, taken together, give you a reasonable read on financial trajectory.

Financial MetricHealthy RangeMonitor CloselyHigh Risk
Margin Over Feed Cost$12.00+/cwt$8.50–$11.99/cwtBelow $8.50/cwt
Replacement Rate30–35% annually36–40% annuallyAbove 40% annually
Debt-to-Equity RatioBelow 60%60–75%Above 75%
Component Gap to PremiumWithin 5¢/cwt of threshold6–15¢/cwt below16¢+/cwt below
  • Margin over feed cost is probably the most familiar to all of us. The Dairy Margin Coverage program uses this calculation, and USDA Farm Service Agency data showed margins peaked at $15.57 per hundredweight back in September 2024. Since then, they’ve compressed in many regions. Extension economists generally suggest that when margins drop below about $12 per hundredweight, equity building slows significantly. Drop below $8.50, and many operations start drawing on reserves. But these are benchmarks, not hard rules—a farm with owned land operates on a different baseline than one that pays rent on everything.
  • Replacement rate deserves more attention in financial discussions than it typically receives. Extension programs benchmark healthy rates at 30-35%. When rates push above 35 to 38 percent, it often signals underlying challenges—fresh cow management issues, transition period problems, or breeding decisions that aren’t holding up. What makes this tricky during financial stress is the cascade effect: you keep marginal cows longer, which affects bulk tank components, further tightening margins.
  • Component position matters more now than it did five years ago. With the FMMO changes emphasizing component values differently, farms producing milk below regional butterfat and protein premium thresholds leave revenue on the table each month. The gap varies by market, but in some areas we’re talking 15 to 25 cents per hundredweight—over millions of pounds annually, that adds up fast.
  • The debt-to-equity ratio ultimately determines your lender flexibility. Generally, once you’re above 65 percent, lenders monitor more closely. Above 75 to 80 percent, you’re at the edge of most lenders’ comfort zone. What many producers don’t appreciate is that your lender sees trends in these ratios before you notice them—they’re benchmarking across their entire portfolio.
USDA Dairy Margin Coverage data shows margins peaked at $15.57/cwt in September 2024 and have compressed to the $8.50-$9.00 range by fall 2025—crossing from surplus territory into the crisis zone where operations draw on reserves rather than building equity. Extension economists consistently identify $12/cwt as the threshold where equity building slows significantly, and below $8.50 as the point where financial stress becomes acute. 

A producer I know in Michigan’s thumb region described the replacement rate trap perfectly:

“Trying to save money in ways that actually cost money.”

That observation has stuck with me.

The Scale Economics Question

This is probably the most difficult part of the conversation, but understanding the underlying economics matters for good decision-making. USDA Economic Research Service data has consistently shown that operations with 2,500-plus cows produce milk at roughly $3 to $4 per hundredweight less than farms running 300 to 500 head. Earlier ERS research found farms with 200 to 499 cows realized production costs about 21 percent above average costs at farms with at least 2,500 head.

I want to be thoughtful about how we interpret this, because management quality absolutely matters. A well-run 300-cow operation with excellent forage programs, tight fresh cow protocols, and careful cost control can achieve impressive efficiency. I’ve visited operations that size doing remarkable work—outstanding butterfat levels, minimal death loss, excellent transition cow outcomes. These farms demonstrate what’s possible with focused management.

But even excellent smaller operations typically face a structural cost advantage that’s difficult to overcome fully through management alone. The reasons are fairly intuitive: labor efficiency improves as herds grow, equipment costs spread across more production, feed procurement benefits from volume, and technology investments that don’t pencil at 300 cows become obvious choices at 2,000.

USDA Economic Research Service data reveals that operations with 2,500+ cows produce milk at $7.50/cwt, while 300-499 cow dairies average $10.50/cwt—a permanent structural disadvantage of $3-4/cwt that excellent management can narrow but not eliminate. This isn’t about working harder; it’s about physics: labor efficiency, equipment utilization, and purchasing power all scale non-linearly.

This doesn’t mean mid-sized operations can’t succeed—many do, and through various strategies. But pure commodity milk production at 300 to 700 cows does face structural headwinds that typically require either exceptional efficiency, premium market access, or diversified revenue streams to address effectively.

The scale reality in summary:

  • 2,500+ cow operations: approximately $7-8/cwt production cost
  • 300-500 cow operations: approximately $10.50-11/cwt production cost
  • The gap: $3-4/cwt regardless of management quality

That gap is structural. It doesn’t close on its own through harder work or better decisions.

How Exits Actually Unfold

U.S. Courts data shows 361 Chapter 12 bankruptcy cases were filed in the first half of 2025—a 55 percent increase from the previous year, according to American Farm Bureau Federation analysis. That’s significant, and it’s worth taking seriously.

But here’s some useful context: bankruptcies represent roughly 12 to 13 percent of total farm exits. The rest follow different paths, and the path matters considerably for what families ultimately preserve.

Some operations execute strategic exits—selling while herds are healthy, equipment is maintained, and there’s time to market properly. Farm transition specialists report these families typically preserve considerably more equity than those managing crisis liquidations. The difference often amounts to several hundred thousand dollars, depending on farm size and condition.

Exit PathwayTypical TimelineEquity PreservedDecision ControlFamily Legacy Impact
Strategic Exit(Proactive sale while healthy)12–18 months70–85% of farm valueFull control over timing, buyers, termsPositive: Exit on own terms, resources preserved
Crisis Liquidation(Forced sale under pressure)3–6 months30–45% of farm valueLimited: Time pressure forces discountsMixed: Reduced resources, stressful transition
Chapter 12 Bankruptcy(Court-managed)6–12 months (court-supervised)15–30% of farm valueCourt-supervised: Loss of autonomyNegative: Public record, damaged relationships

Others pursue operational pivots. Beef-on-dairy programs have gained traction across the Midwest, with operations reducing milking herds and breeding maternal animals to beef sires. I recently spoke with a 350-cow producer in eastern Iowa who made this transition 18 months ago—he’s cautiously optimistic about where it’s heading, though he’s quick to note the learning curve was steeper than expected. Some pursue organic certification, though that 18 to 36 month transition creates its own cash flow challenges. Northeast operations near population centers have explored direct sales and farmstead processing. California dairies have developed specialty cheese partnerships. Southwest grazing operations have found niches that work for their land and climate.

These pivots can work well—I’ve seen successful examples across regions. But they require capital investment when cash tends to be tight, and stabilization often takes 12 to 18 months or longer.

And then there are forced liquidations—equipment sold under time pressure, herds moved when buyers understand the circumstances, and real estate that can’t be marketed appropriately. The value erosion in these scenarios is substantial, and often avoidable with earlier planning.

The Information Timing Challenge

One pattern that’s become clearer through conversations with producers, lenders, and advisors is that most operators learn they’re in serious difficulty only late. The familiar progression: milk prices are down, but we’ve weathered down markets before. Margins are tight, but they’ll improve when feed costs moderate. The cooperative newsletter says conditions should stabilize…

Meanwhile, lenders are watching debt service coverage ratios and benchmarking against peer operations. Cooperatives analyzed the implications of the FMMO changes, while producers focused on getting hay put up. Processors investing $11 billion modeled which farm configurations will supply those facilities in 2028.

Farm financial research consistently shows lenders recognize deteriorating dairy operations 6-9 months before producers fully acknowledge the severity—they’re benchmarking your debt service coverage against hundreds of other dairies in their portfolio while you’re focused on daily operations. Processors and co-ops see trouble at months 2-4 through volume trends and quality patterns. By the time financial stress feels undeniable to the producer (months 6-9), the strategic decision window is already half-closed. 

This isn’t coordinated—it’s simply that different actors have access to different information at different times. Lenders see portfolio-wide trends. Cooperatives analyze regulatory changes as part of their core business. Processors model supply chains before major capital commitments.

Research on farm financial decision-making suggests that lenders often recognize deteriorating conditions 6 to 9 months before producers do. That gap represents real dollars—the difference between proactive planning and reactive crisis management.

What Canada’s Experience Suggests

There’s an interesting parallel north of the border worth considering. Dr. Sylvain Charlebois, a food policy researcher at Dalhousie University, has projected Canada could lose nearly half of its remaining dairy farms by 2030. What makes this striking is it’s happening under supply management—the system designed to prevent exactly this outcome.

The economics are instructive. Alberta quota costs have ranged from $52,000 to $58,000 per kilogram on the open exchange, according to provincial marketing board data. For a 100-cow operation, quota value alone can exceed $20 million—before purchasing animals or building facilities.

Consider succession in that context. A next-generation farmer faces quota obligations that can dwarf the productive capacity of what they’re acquiring. Even with Canada’s higher milk prices—roughly double U.S. levels—the math often doesn’t work. Quebec now produces roughly 40 percent of Canadian milk from a province with just over 20 percent of the population.

The insight for U.S. producers isn’t whether supply management is good or bad—reasonable people disagree, and there are legitimate arguments on multiple sides. It’s that price protection alone doesn’t automatically preserve mid-sized operations. Supply management changed the consolidation mechanism without preventing consolidation itself. The underlying economics still favor scale, just through different pathways.

Practical Steps Worth Considering

If you’re running a mid-sized operation and recent milk checks have been lighter than expected, what’s productive? Based on conversations with producers who’ve navigated similar situations, here’s what seems to help.

This week: Calculate your actual margin over feed cost using current figures. Pull recent milk statements, total feed invoices including purchased forages, and run the numbers. Know whether you’re at $11, $9, or somewhere else. This baseline matters before other conversations make sense.

Within a couple of weeks: Have a direct conversation with your lender. Ask specifically: “Based on my current numbers and what you’re seeing across your dairy portfolio, what’s my realistic runway? What trends should I understand? What options do you see for operations like mine?” Good lenders engage honestly with direct questions, and their perspective provides important context.

Within 60 days: Make a directional decision. Not necessarily final, but clarity about which path you’re exploring.

The paths vary by situation. Strategic exit while equity remains—preserving resources for retirement, education, or new directions. Operational pivot toward specialty markets or diversified production—requiring capital investment while credit remains available. Scaling to 1,200-plus cows, where region and finances support it. Partnership with larger operations—trading some independence for stability.

What tends not to work is continuing commodity production at 300 cows while waiting for prices to overcome structural cost differentials. That math rarely resolves through price alone.

The Decision Window

Based on farm financial data and exit patterns, the window for strategic decisions on mid-sized operations typically runs 12 to 18 months from when margins first compress below sustainable levels. After that, options narrow. By month nine or ten of sustained pressure, responses often become reactive rather than proactive.

European research published in the European Review of Agricultural Economics found that only about 5 to 8 percent of at-risk farmers make proactive decisions before circumstances force their hand. Most wait—sometimes for understandable reasons, sometimes because they lack good information earlier.

I mention this as context, not criticism. These decisions involve multi-generational history and deep personal identity. But recognizing your situation while options remain open positions you better than most.

The Bottom Line

The consolidation unfolding in dairy represents structural change—not simply cyclical pressure that patience will outlast. Processors are building infrastructure sized for larger suppliers. Scale advantages of $3 to $4 per hundredweight persist regardless of management quality. Information reaches different actors at different times.

None of this reflects poorly on anyone running a 300-cow operation. The business models that sustained earlier generations operated in different economic environments. That’s industry evolution, even when consequences feel personal.

The families who navigate this successfully will largely be those who recognized their situation early and made strategic choices—not those who recognized it later, when options had narrowed.

The math doesn’t care about your farm’s history. But you do. You have a 60-day window to look at the numbers before your lender makes the decision for you.

Current Dairy Margin Coverage data is available through the USDA Farm Service Agency at fsa.usda.gov. Regional cost-of-production benchmarks can be found through university extension programs, including the Center for Dairy Profitability at UW-Madison, Cornell PRO-DAIRY, and FINBIN at the University of Minnesota. California-specific analysis is available through UC Davis Cooperative Extension. Provincial marketing boards, including Alberta Milk and Dairy Farmers of Ontario, publish Canadian quota pricing. The International Dairy Foods Association tracks processor investment information at idfa.org.

Key Takeaways:

  • Your lender knows first: Financial trouble is visible to lenders 6-9 months before most producers see it—ask about your runway this week
  • The cost gap won’t close: 2,500+ cow operations produce milk $3-4/cwt cheaper; strong management helps, but the structural disadvantage remains
  • Your window is 12-18 months: From first margin compression to limited options—most families recognize trouble too late to act strategically
  • Decide within 60 days: Calculate your actual margins, talk to your lender, and choose a path—exit, pivot, scale, or partner
  • $11 billion says it all: Processor investment in new capacity is designed for larger suppliers; plan accordingly

Executive Summary: 

Your lender likely sees your dairy’s financial trouble 6-9 months before you do—and processors investing $11 billion in new capacity have already decided which farm sizes fit their future. This information gap is costing mid-sized producers critical decision-making time, as Rabobank estimates that 2,800 farms will close in 2025. The economics are structural: USDA data show that operations with 2,500+ cows produce milk at $3-4/cwt less than those with 300-500 cows, a disadvantage that excellent management can narrow but not eliminate. June 2025’s FMMO changes have intensified pressure, pulling $337 million from the producer pool value in three months. For operations experiencing compressed margins, the window for strategic decisions—exit, pivot, scale, or partner—runs 12-18 months before options narrow dramatically. The priority now: know your numbers, talk to your lender, and choose a direction within 60 days.

Complete references and supporting documentation are available upon request by contacting the editorial team at editor@thebullvine.com.

Learn More:

The Sunday Read Dairy Professionals Don’t Skip.

Every week, thousands of producers, breeders, and industry insiders open Bullvine Weekly for genetics insights, market shifts, and profit strategies they won’t find anywhere else. One email. Five minutes. Smarter decisions all week.

NewsSubscribe
First
Last
Consent

The Rules Changed and Nobody Told You: Three Paths Left for the 300-Cow Dairy

Seven dairy farms disappear. Every. Single. Day. If you’re under 500 cows, you have 18 months to choose: Scale, pivot, or exit.

EXECUTIVE SUMMARY: The dairy industry is experiencing a seismic shift: 7 farms disappear daily as we consolidate from today’s 24,500 operations toward just 8,000-12,000 by 2035, with 400 mega-farms controlling 75% of production. The $11 billion in new processing investment tells the real story—it’s pre-contracted to 5,000+ cow operations, leaving 300-cow dairies facing three brutal choices: invest $3-5 million to scale up, spend $600,000-1.2 million transitioning to premium markets, or exit now for $700,000-1.1 million before equity evaporates. Your cooperative has become your competitor, with DFA controlling 30% of US milk while operating processing plants that profit from keeping your milk prices low. The economics are undeniable: farms with over 1,000 cows achieve 20-25% lower costs, creating an unbridgeable competitive gap for mid-sized operations. Agricultural lenders confirm you have 18 months—credit is tightening, and consolidators’ appetite for acquisitions peaks in 2025-2026. The bottom line is stark: standing still guarantees slow financial death, making no decision the worst decision of all.

Dairy industry consolidation

You know, I was having a chat with a third-generation Wisconsin dairy farmer last week—runs about 280 cows, really solid butterfat performance, knows his genetics inside and out. He said something that’s been rattling around in my head ever since:

“I feel like I’m playing a game where the rules changed, but nobody sent me the new rulebook.”

He hit the nail on the head. This isn’t just another rough patch we’re working through; the whole game is structured differently now. What I’ve found in USDA Economic Research Service modeling is that we could see mega-operations producing somewhere between 70 and 75 percent of America’s milk by 2035. We’re talking about going from roughly 24,500 dairy farms today—that January NASS count was eye-opening—down to maybe 8,000 to 12,000 operations in about a decade.

Here’s what’s really striking: the International Dairy Foods Association documented something like $11 billion in processing investments announced between 2024 and 2028. That’s not your typical expansion—that’s the industry rebuilding itself from the ground up.

For those of you managing 300-cow operations—and I talk to so many of you at meetings—understanding what’s happening isn’t about being negative. It’s about seeing clearly where opportunities still exist.

Farm consolidation accelerates: The US lost 63% of dairy operations since 2003 while boosting production 41%, with projections showing only 10,000 farms by 2035—down from today’s 26,000

When Your Cooperative Became Something Else

What’s fascinating—and honestly, a bit troubling—is how organizations like Dairy Farmers of America have evolved from their original marketing cooperative model into vertically integrated processors. This completely changes how milk moves from your tank to the market.

Consider this: DFA now controls nearly 30 percent of US milk production according to their annual reports, while operating dozens of processing facilities across North America. Let’s call it what it is: a conflict of interest. When your co-op becomes a processor, their profit margin depends on keeping input costs low. Your milk is the input. Do the math.

I was talking to a producer from upstate New York—does beautiful rotational grazing, really innovative guy—and he put it perfectly:

“After 22 years shipping to the same cooperative, the relationship feels fundamentally different. The negotiating dynamics have shifted in ways that are hard to articulate but impossible to ignore.”

The data backs up what he’s feeling. We’re seeing more and more member milk processed in cooperative-owned facilities, a huge shift from the traditional marketing model. And here’s something that should make everyone pause: federal court records show settlements totaling nearly $200 million since 2013, with the 2016 Northeast case alone hitting $158.6 million. These aren’t just theoretical tensions we’re talking about.

Where That $11 Billion Is Really Going

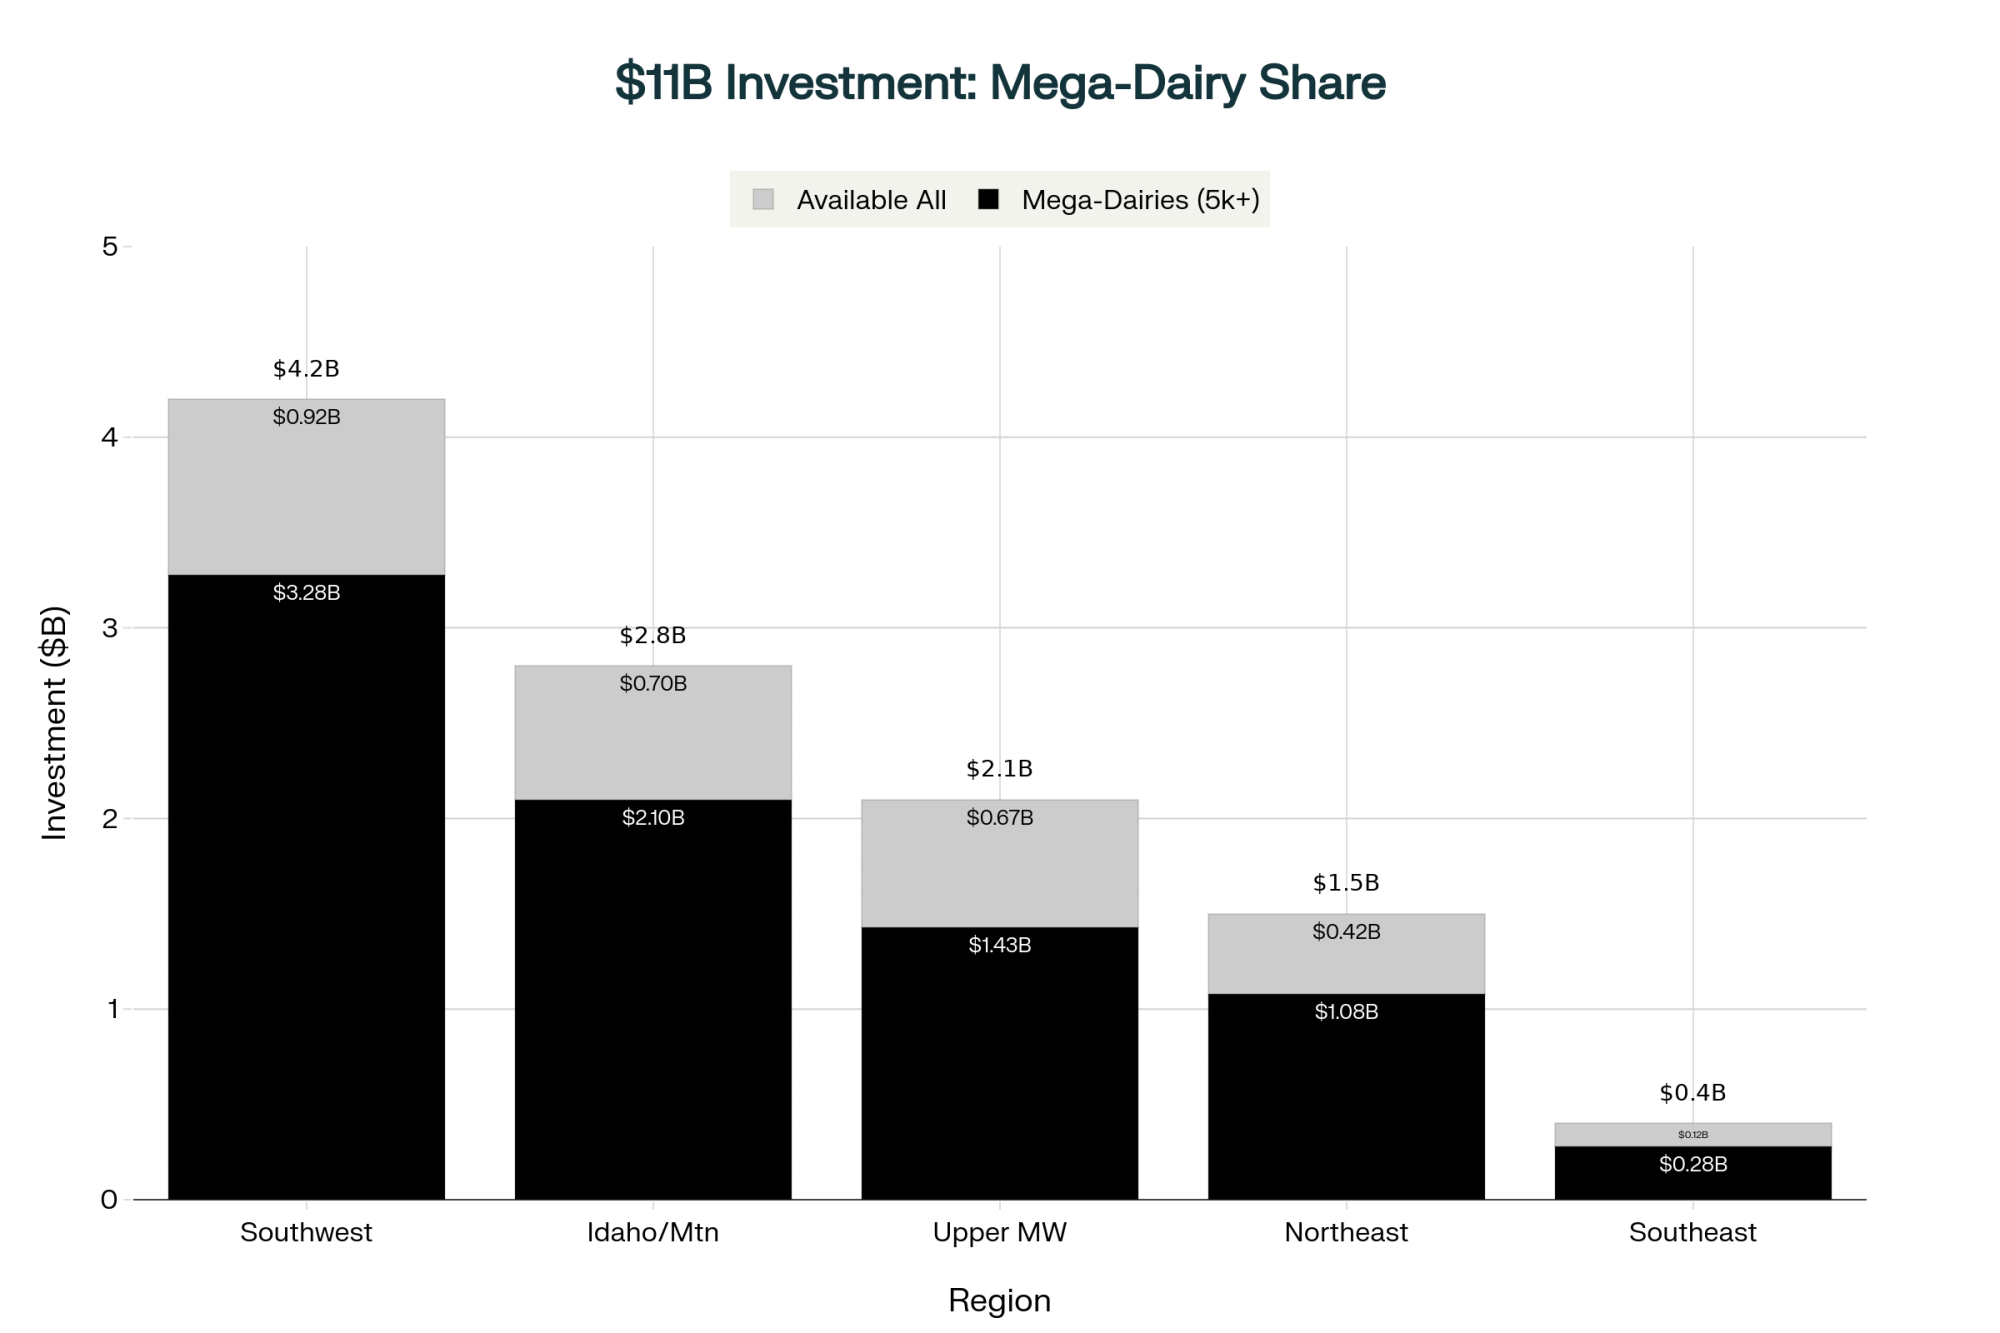
Everyone’s celebrating this $11 billion in processing investment. But let’s look closer at where that money’s actually flowing. IDFA’s October report details what they’re calling the largest dairy infrastructure investment in American history, and the geographic pattern tells you everything.

Chobani announced back in April that it’s building a $1.2 billion facility in Rome, New York. They’ve got another $450 million expansion going in Twin Falls, Idaho. Leprino Foods continues to expand in Texas, especially around Lubbock. These locations aren’t random—they’re following the consolidation that’s already happening.

Investment follows scale: Of $11B in new processing capacity, 70-78% is pre-contracted to mega-dairies before construction begins, leaving mid-sized operations competing for processing access in an oversupplied market

What industry analysts from Rabobank and CoBank have been telling us is that processors are increasingly locking up supply agreements with large-scale operations before they even break ground. They don’t publish exact percentages, but the pattern is crystal clear.

A Texas producer with 450 cows shared his experience trying to get into one of these new plants:

“The terms required a 10-year commitment for our entire production at annually-set prices. The minimum volume guarantee was 15 million pounds—more than double what we produce.”

These facilities… they’re not being built for folks like him. They’re designed for operations running 5,000 to 25,000 cows.

But here’s what gives me hope—in Pennsylvania’s Lancaster County, where you’ve still got lots of 100 to 300 cow operations, producers are finding creative solutions. A group of about 31 Amish and Mennonite farmers formed their own micro-cooperative last year, partnering with a local artisan cheese maker.

“We couldn’t compete on volume, but our grass-fed milk and traditional practices commanded premium prices in Philadelphia markets.”

Getting Out with Your Shirt On

NASS quarterly reports show we’re losing approximately 2,700 to 2,800 farms annually. That’s up from maybe 500 to 900 per year back in the early 2000s. Between 2017 and 2022 alone—and these census numbers are sobering—we lost 15,221 operations. Nearly a 38 percent decline in just five years.

The Center for Dairy Profitability at UW-Madison has been digging into these patterns, and its data show that operations with more than 1,000 cows achieve production costs roughly 20 to 25 percent lower than those of 500-cow farms. It’s basic economies of scale—same thing that reshaped retail, same thing that’s hitting us now.

Dr. Mark Stephenson from Wisconsin’s dairy markets program explained it to me this way: reaching competitive scale today requires approximately to 5 million in capital investment. For most mid-sized operations, accessing that capital while managing existing debt… well, you know how that math works out.

Economic modeling suggests we’ll stabilize somewhere between 8,000 and 12,000 operations by 2035. That’s a fundamental restructuring of the American dairy industry.

Three Paths Forward—What’s Actually Working

After talking to dozens of producers this past year, I’ve seen three main strategies emerge for operations in the 200- to 500-cow range. Each has its own opportunities and challenges.

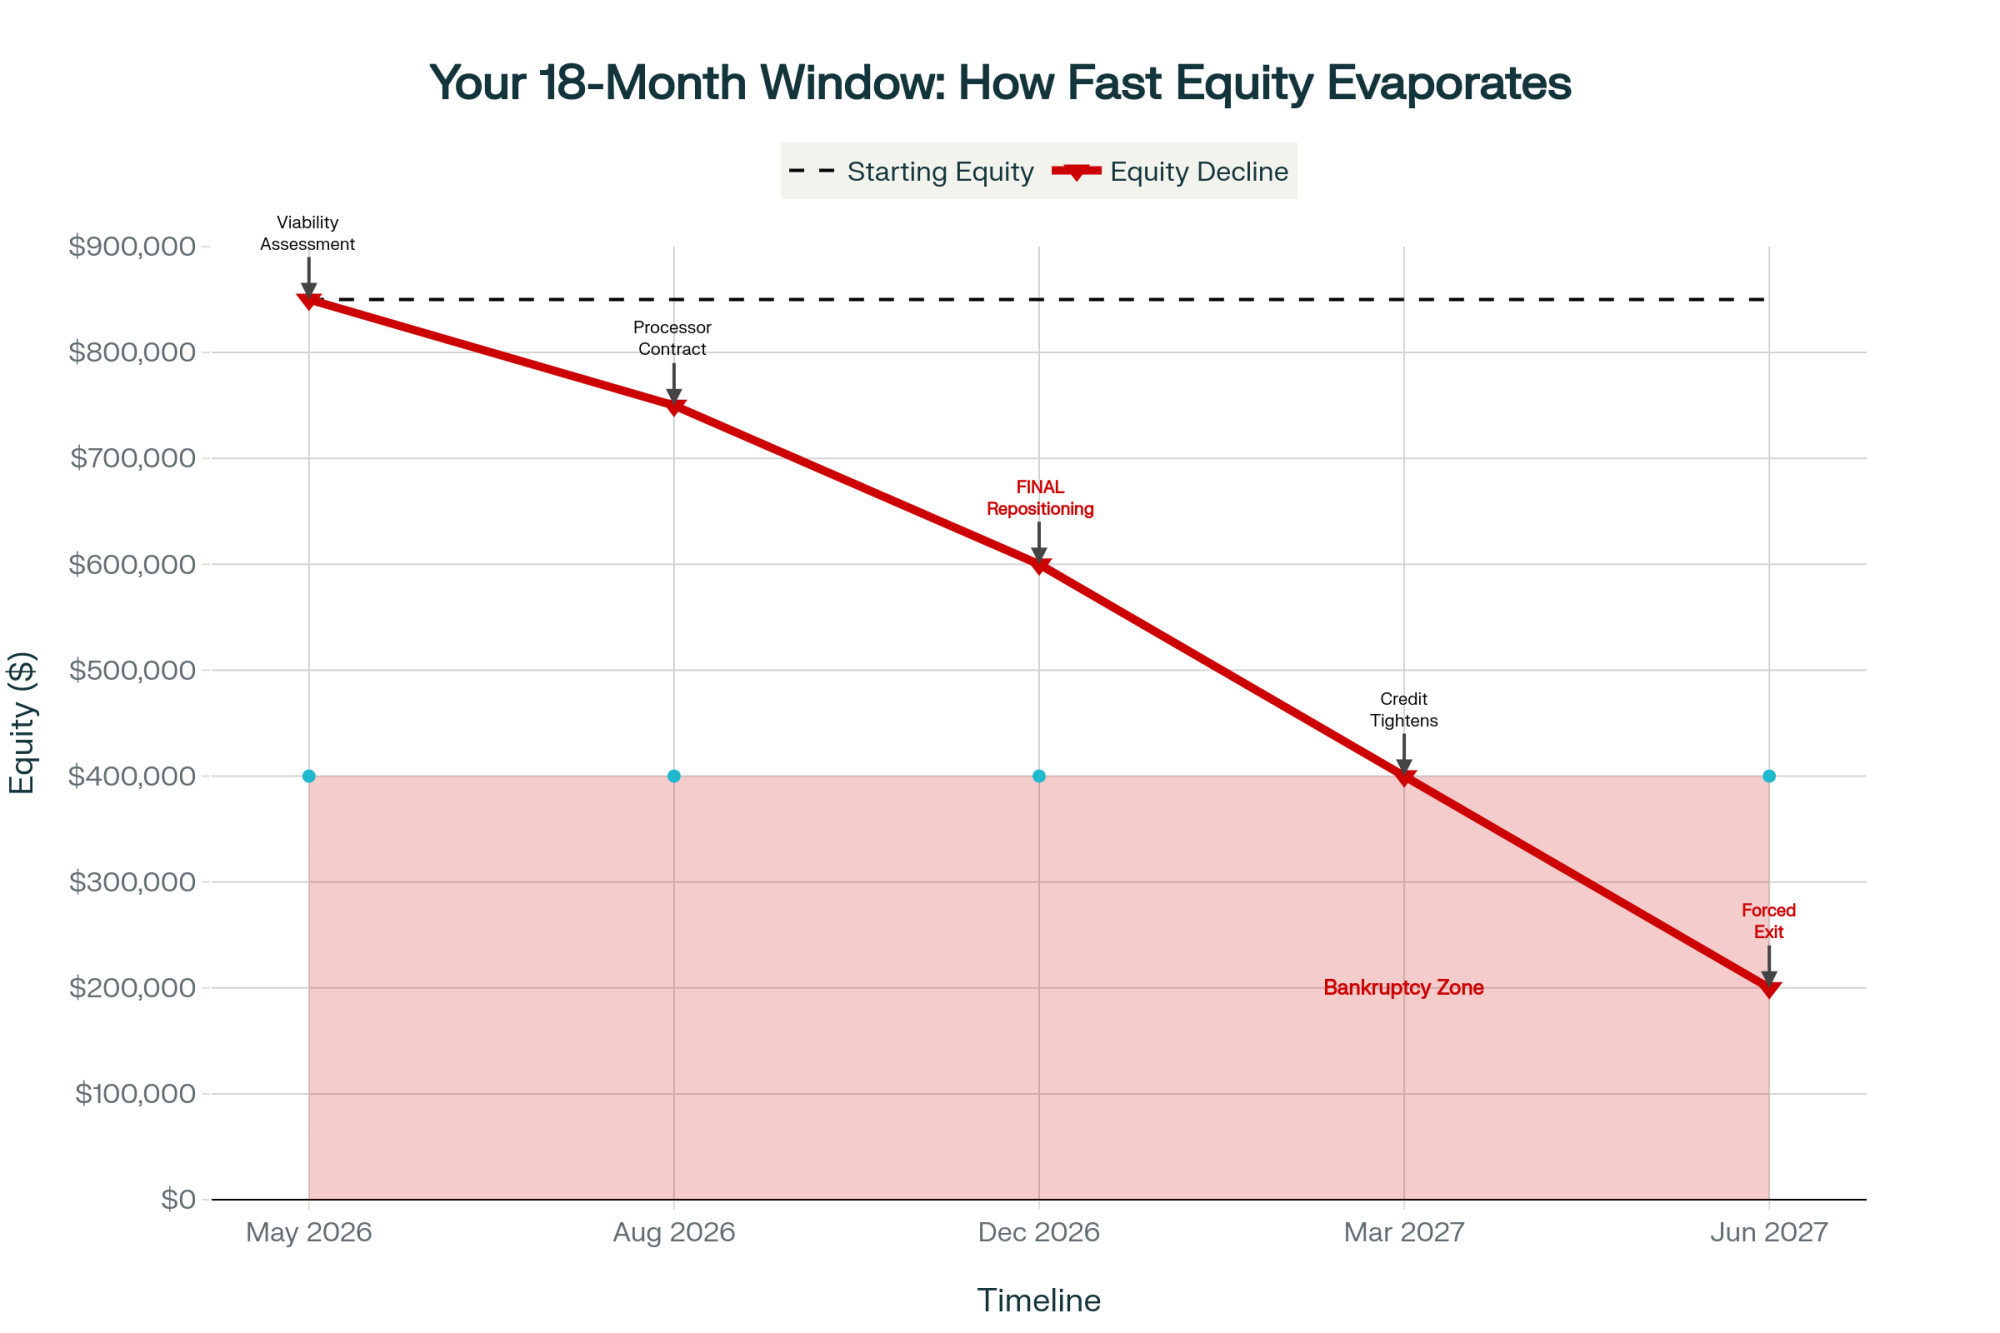
Time destroys options: Delaying decisions costs $650,000 in equity over 13 months—from $850K in May 2026 to $200K by June 2027—as lenders tighten credit and consolidators lose interest

Scaling to Competitive Size

An Idaho producer who expanded from 800 to 3,600 cows over two years shared some hard truths:

“At 800 cows, even with good management, we were losing $200,000 annually at prevailing milk prices. At 3,600, with updated parlor technology and improved feed efficiency, we’re profitable at those same prices. The fixed cost distribution makes all the difference.”

Here’s the reality of scale: You can’t just add cows; you have to add robots and data. USDA farm technology surveys show that robotic milking systems are now on nearly 3 percent of US dairy operations, yet those operations account for over 8 percent of national milk production. It’s mostly these scaling operations where labor efficiency becomes critical.

Based on what lenders are telling us and actual producer experiences, this pathway typically requires:

  • $3 to 5 million in capital for facilities, equipment, and genetics
  • At least 40 percent equity position for financing approval
  • Being close to processing—hauling costs will eat you alive beyond 100 miles
  • Committing to 15, maybe 20 years to recoup that investment

The success stories tend to be producers under 55 with strong equity and minimal debt. And timing? Critical. Expansions during favorable price cycles work. During downturns? Different story.

Premium Market Transition

An Alberta producer who transitioned her family’s 320-cow operation to organic five years ago offers another perspective:

“We experienced approximately 30 percent improvement in net farm income despite lower production volumes. The combination of reduced veterinary expenses, premium pricing, and eventually lower input costs created a sustainable model.”

Producers making this transition work report:

  • Transition costs of $600,000 to maybe $1.2 million
  • You need to be within about 50 miles of a metro market for direct sales
  • Need 3 to 5 years of capital reserves during transition
  • Marketing becomes just as important as production

“Those first two years nearly broke us. Year three reached break-even. Years four and five delivered the returns that justified the transition.”

A North Carolina producer adds another angle. His 180-cow operation transitioned to A2/A2 genetics and grass-fed production three years ago:

“The Research Triangle market—all those tech workers and university folks—they understand the value proposition. In our local market, we’re getting significantly more per hundredweight than commodity, and our production costs actually decreased once we optimized our grazing rotation.”

Some producers are also exploring renewable energy. A Vermont dairy with 400 cows installed an anaerobic digester system last year. “Between the renewable energy credits and reduced electricity costs, it’s potentially adding substantial value annually to our bottom line,” the owner reports. “It doesn’t solve everything, but it provides a crucial margin in tight years.”

Strategic Exit Planning

A Wisconsin producer who sold in early 2024 was refreshingly candid:

“With $850,000 in equity, I could have continued operating at marginal profitability for perhaps three more years. Instead, I accepted $720,000 from a consolidator. My neighbor, who waited, went through bankruptcy proceedings and retained maybe $100,000.”

Current market analysis from agricultural real estate specialists suggests:

  • Strategic sales to consolidators in 2025-2026: $700,000 to $1.1 million for typical 300-cow operations
  • Wait with continued losses: equity could erode to $200,000-400,000 by 2028-2029
  • Each year at break-even represents $100,000-200,000 in opportunity cost
Decision FactorSCALE UPPREMIUM PIVOTSTRATEGIC EXIT
Initial Investment$3-5M$600K-1.2M$0
Time to Profit8-10 years3-5 yearsImmediate
Year 5 Income+$180K+$95K$0
Equity Change-$1.2M (RED)-$300K (RED)+$750K (BLACK)
Risk LevelVERY HIGH (RED)HIGH (RED)LOW (BLACK)
Success RequiresYouth, debt, processingMetro proximityAccept reality
Best For<45 yrs, 40%+ equityNiche positioningPreserve wealth
Regional ViabilitySouthwest, Idaho onlyNortheast, MidwestAll regions

How Geography Is Reshaping Everything

Based on current investment patterns and USDA projections, American dairy production will concentrate in four primary regions by 2030-2035.

The Southwest—Texas, New Mexico, and Arizona—currently produces 32 to 34 percent of national milk, with projections suggesting a move toward 40 to 45 percent. These are your 5,000 to 15,000 cow dry-lot operations. But here’s the kicker—USGS data shows the Ogallala Aquifer dropping 2 to 3 feet annually. Water’s becoming the limiting factor.

Idaho has transformed remarkably in just one generation, now producing approximately 8 percent of the national milk. Chobani’s investments there… they’re following the consolidation, not driving it.

The Upper Midwest—Wisconsin, Michigan, Minnesota—that’s an interesting story. Still producing 18 to 20 percent of national milk, down from over 25 percent historically. What you’re seeing is bifurcation—either going mega or going specialty. The middle? That’s where the pressure is.

New York produces about 4 percent of the nation’s milk, yet its processing investment is massive. The capacity appears to exceed local milk supply, which creates interesting supply chain dynamics.

The Southeast faces unique challenges. A Georgia producer managing 400 cows told me:

“We’re seeing farms exit not because of economics alone, but because the next generation won’t tolerate the working conditions. The technology investments needed for heat abatement in our climate add another $500,000 to expansion costs that Northern operations don’t face.”

System Resilience—What Keeps Me Up at Night

Scale economics dictate survival: Mega-dairies (2000+ cows) produce milk at $16.16/cwt while mid-sized operations (300 cows) face $20.25/cwt costs—a $4+ structural disadvantage no management can overcome

The efficiency gains from consolidation are impressive, but when 40 to 45 percent of national milk production concentrates in water-stressed regions, we’re creating single-point vulnerabilities.

Dr. Jennifer Morrison from Cornell’s food systems program put it well: “Efficiency and resilience often exist in tension. We’re building remarkably efficient systems that may prove fragile under stress.”

Recent screwworm detections, shifting climate patterns, labor challenges… USDA APHIS has contingency plans, sure, but concentrated production carries fundamentally different risk profiles than distributed systems.

Collective Action Still Works

Here’s what’s encouraging: in September, approximately 600 Irish dairy farmers successfully pressed Dairygold for written accountability on pricing decisions. The Irish Farmers Journal covered it extensively. They didn’t tear anything down—they just demanded transparency through organized, professional engagement.

Back home, the American Farm Bureau Federation is pushing for modified bloc voting in their 2025 priorities—letting farmers vote individually rather than having cooperatives vote for them. The National Sustainable Agriculture Coalition mobilized over 130 advocates to engage Congress earlier this year.

Regional organizing is showing promise, too. Vermont producers have formed transparency coalitions to request detailed milk-check breakdowns. California’s Central Valley sees mid-sized dairies exploring collective negotiation.

Pennsylvania offers a particularly instructive example. Approximately 28 dairy farmers started meeting monthly to compare milk check deductions. After finding significant variations within the same cooperative and region, they presented consolidated data to their board and received substantive responses for the first time.

“Individual concerns get dismissed. But 28 farmers with documentation command attention.”

Key Questions for Your Cooperative

Start pressing for transparency with these specific requests:

✓ Request itemized breakdowns of all milk check deductions
✓ Seek written explanations of member versus non-member pricing
✓ Inquire about percentages of cooperative income from member versus non-member business
✓ Request voting records on significant pricing decisions
✓ Understand how board representation aligns with regional membership

What This Means for Different Operation Sizes

Survival margins vanish: A typical 300-cow operation generates $1.4M in revenue but nets just $62K after all costs—equivalent to $17/hour for 70-hour work weeks, before family living expenses

For operations with fewer than 250 cows, commodity-market math has become increasingly challenging without exceptional cost management. Premium market transitions offer possibilities if you’re geographically positioned right. Strategic exit planning may preserve more equity than extended marginal operation.

Producers in the 250- to 500-cow range face critical decisions. Scaling to a competitive size requires that $3 to 5 million, which we talked about. The premium market pivots demand, requiring different capital and marketing commitments. Maintaining the status quo typically means gradual equity erosion.

Operations running 500 to 1,000 cows are approaching the minimum viable commodity scale. Strategic partnerships with neighbors, collective arrangements, or, really, locking in processing relationships become essential.

Agricultural lending surveys from late 2024 show credit availability tightening as lenders see these exit rates. If you’re planning expansion, you’re looking at a 12- to 18-month window. M&A advisors specializing in dairy tell me that interest in consolidator acquisitions peaks in 2025-2026.

Addressing What We Don’t Like to Talk About

CDC and NIOSH research shows farmers face a suicide risk approximately 3.5 times higher than the general population. Financial stress is the primary factor, according to the University of Iowa’s agricultural medicine program.

Illinois has expanded mental health support for farmers through their Department of Agriculture wellness initiatives. Other states are developing similar programs. These aren’t just statistics—these are our neighbors, our colleagues, our friends.

A Minnesota farm widow shared something that stays with me:

“Watching three generations of work dissolve feels like personal failure, even when you understand it’s structural economics driving the outcome.”

The Bottom Line

American dairy is experiencing its most significant structural transformation since we mechanized. By 2035, we’ll have mega-operations, specialized premium producers, concentrated processing infrastructure—fundamentally different from the distributed system many of us grew up with.

What’s particularly interesting from a global perspective is how this consolidation positions American dairy internationally. As our production becomes more concentrated and efficient, we’re increasingly competitive in export markets—especially cheese and milk powder bound for Asia and Mexico. This global dimension adds another layer to domestic consolidation pressures.

Understanding these dynamics lets you make informed decisions while options remain. Success stories will emerge from this transition—producers who recognize patterns early and position accordingly. Solutions vary by region, operation size, life stage, and individual circumstances.

After covering this industry for over a decade and talking with hundreds of producers, one thing’s clear: the question isn’t whether to adapt—market forces have made that decision. The question is how to adapt, when to act, and what outcomes to target.

The consolidation reshaping American dairy is real, it’s accelerating, and it’s transformative. But producers who understand these dynamics, assess their positions honestly, and act decisively while maintaining strategic options can still chart successful paths forward.

The clock’s ticking, but opportunity windows remain open. The key is recognizing them and acting with purpose while time allows.

Your next step? This week, schedule time to honestly assess which of these three paths makes sense for your operation. Talk to your lender. Review your equity position. Have the hard conversations with family members. Because in this new game, the worst decision is no decision.

Resources for Industry Support

Mental Health Assistance:

  • Farm Aid Hotline: 1-800-FARM-AID
  • AgriSafe Network: 1-866-354-3905
  • National Suicide Prevention Lifeline: 988
  • State-specific farm stress hotlines

Financial and Transition Planning:

  • National Young Farmers Coalition: youngfarmers.org
  • Farm Financial Standards Council: ffsc.org
  • Center for Farm Financial Management: cffm.umn.edu

Industry Advocacy:

  • National Farmers Union: nfu.org
  • Organization for Competitive Markets: competitivemarkets.com
  • Farm Action: farmaction.us

KEY TAKEAWAYS:

  • The 400-farm future is inevitable: Daily losses of 7 farms are shrinking the industry from 24,500 to 8,000 operations by 2035, with mega-farms claiming 75% of production
  • Three paths remain—pick one: Scale to 3,000+ cows ($3-5M), pivot to premium markets ($600K-1.2M), or exit strategically now ($700K-1.1M before it drops to $100K)
  • Your co-op became your competitor: Organizations like DFA control 30% of milk AND processing—they profit from low milk prices that destroy you
  • Act within 18 months or lose everything: Credit markets are closing, consolidator interest peaks in 2025-2026, and standing still means bleeding equity until bankruptcy

Complete references and supporting documentation are available upon request by contacting the editorial team at editor@thebullvine.com.

Learn More:

The Sunday Read Dairy Professionals Don’t Skip.

Every week, thousands of producers, breeders, and industry insiders open Bullvine Weekly for genetics insights, market shifts, and profit strategies they won’t find anywhere else. One email. Five minutes. Smarter decisions all week.
NewsSubscribe
First
Last
Consent
Send this to a friend