A day-old beef calf paid you a few hundred bucks in 2023. The dairy heifer it replaced now runs $3,010 — up 75% in 27 months. CoBank’s Corey Geiger says that spread decides who’s still milking in 2030.
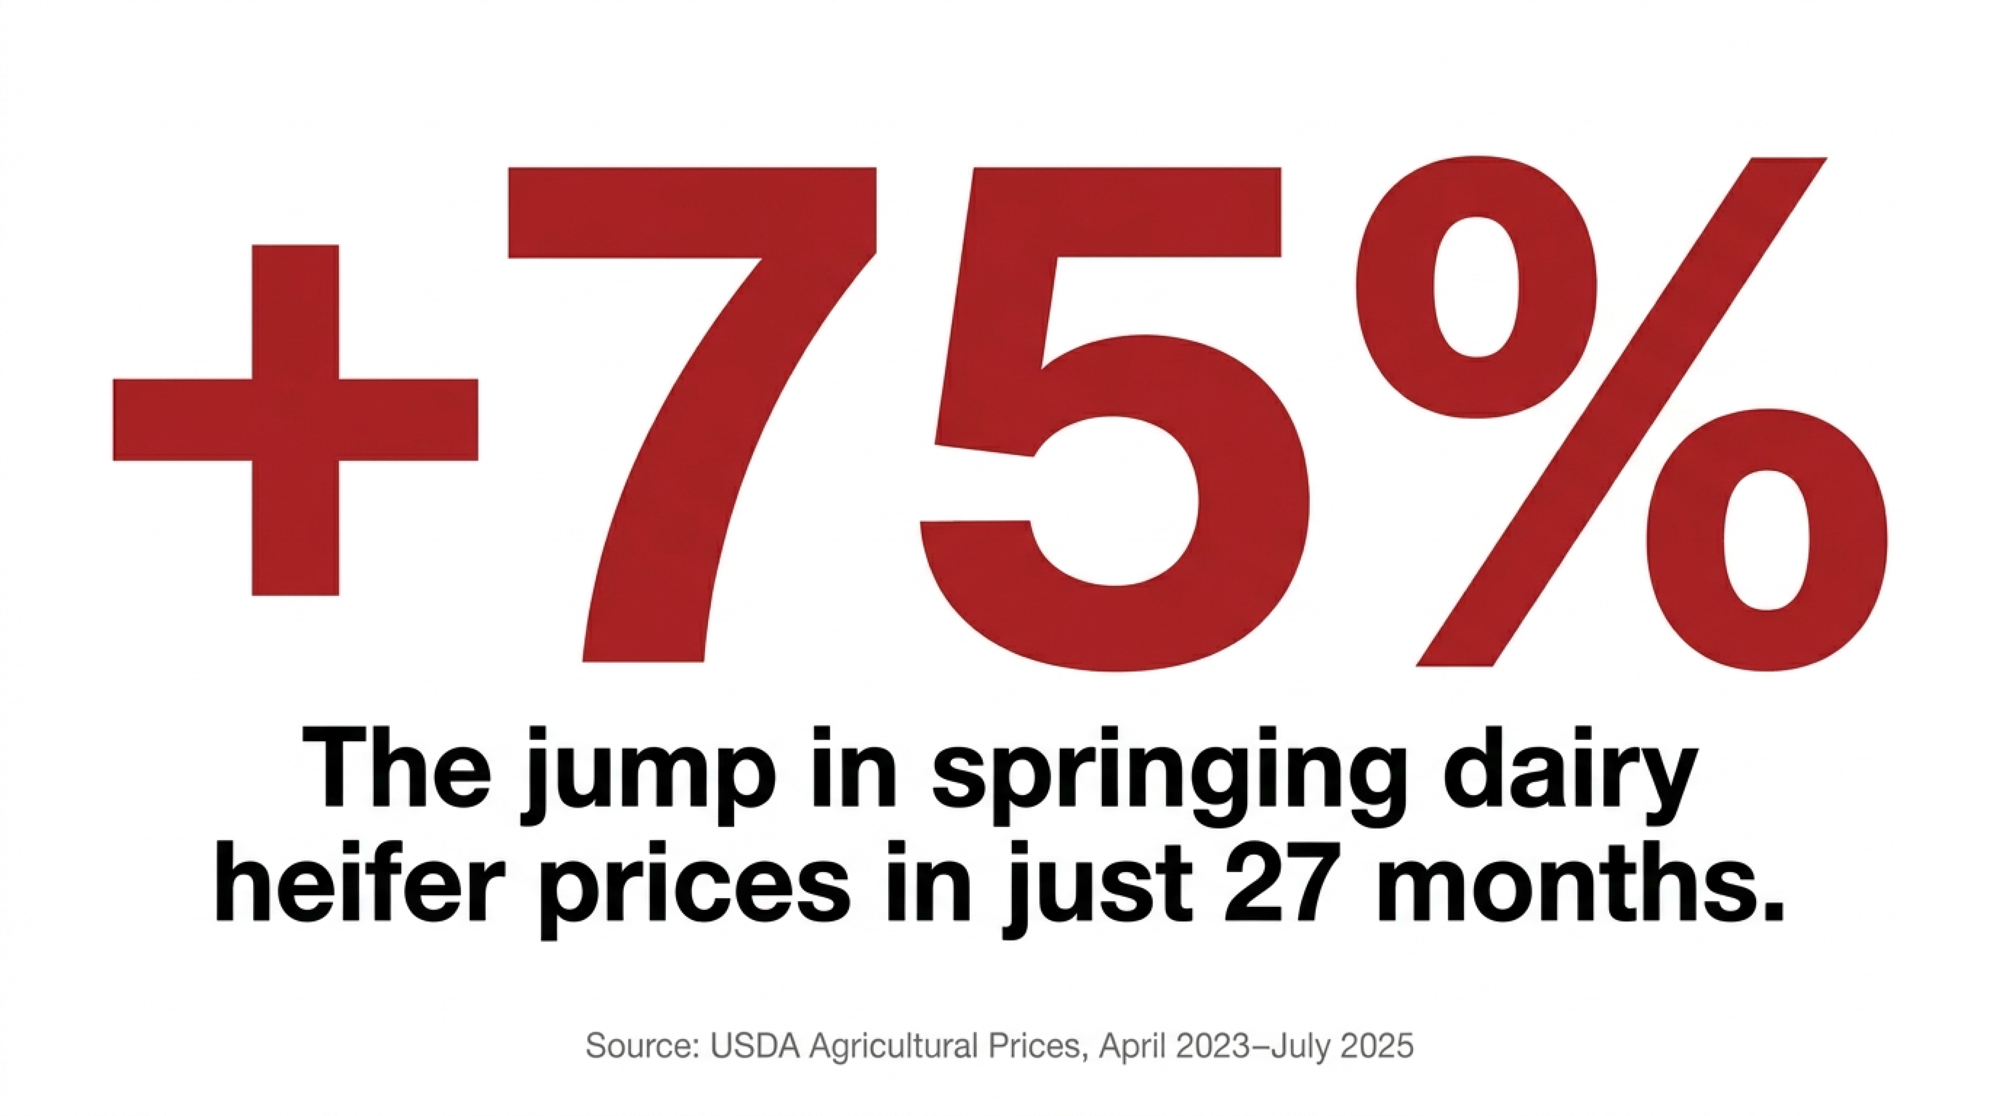
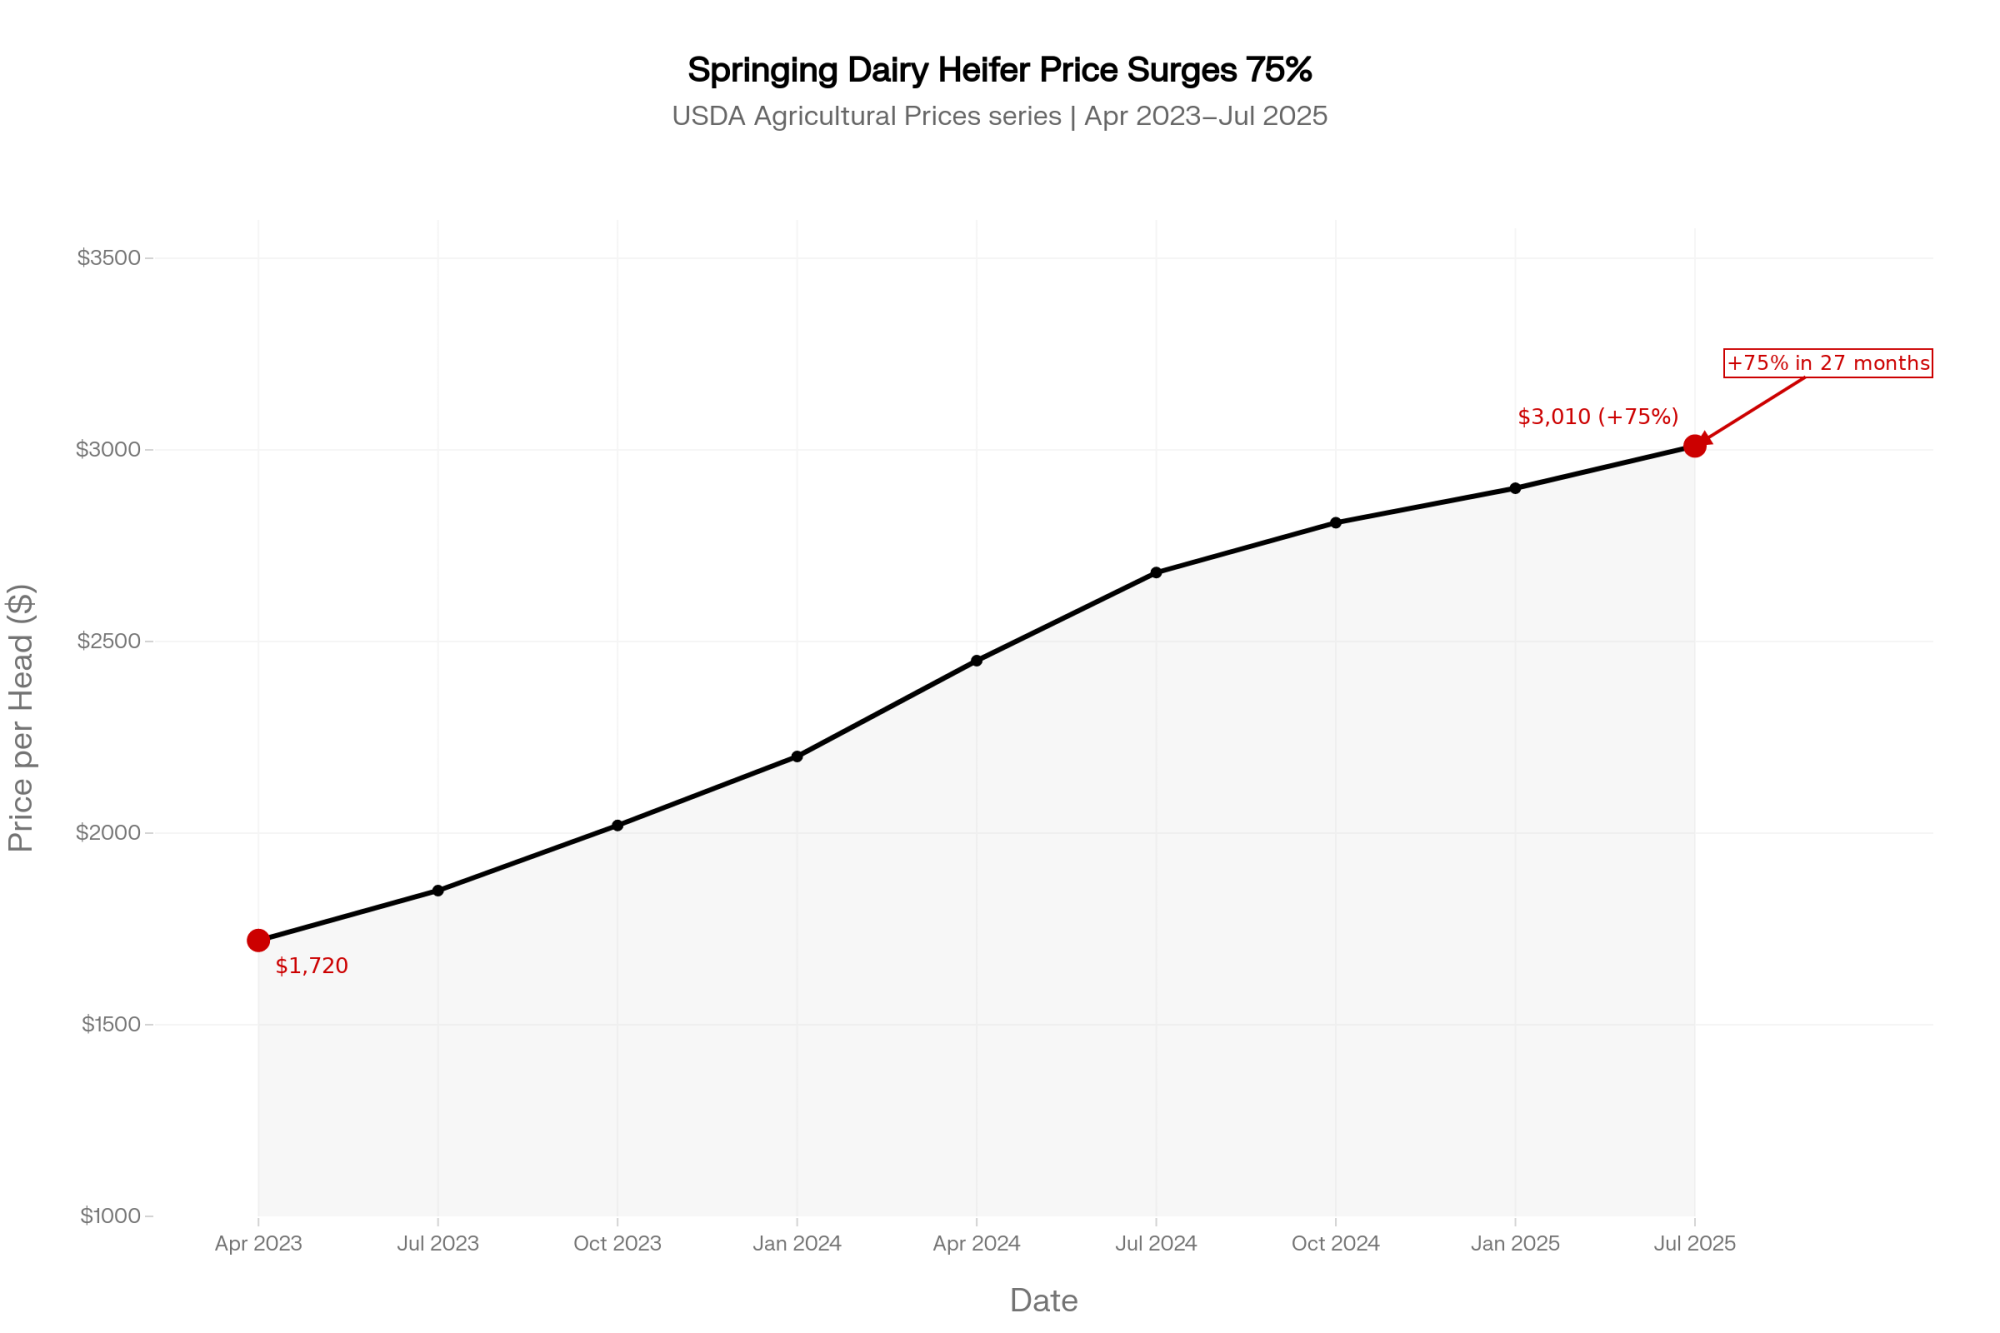
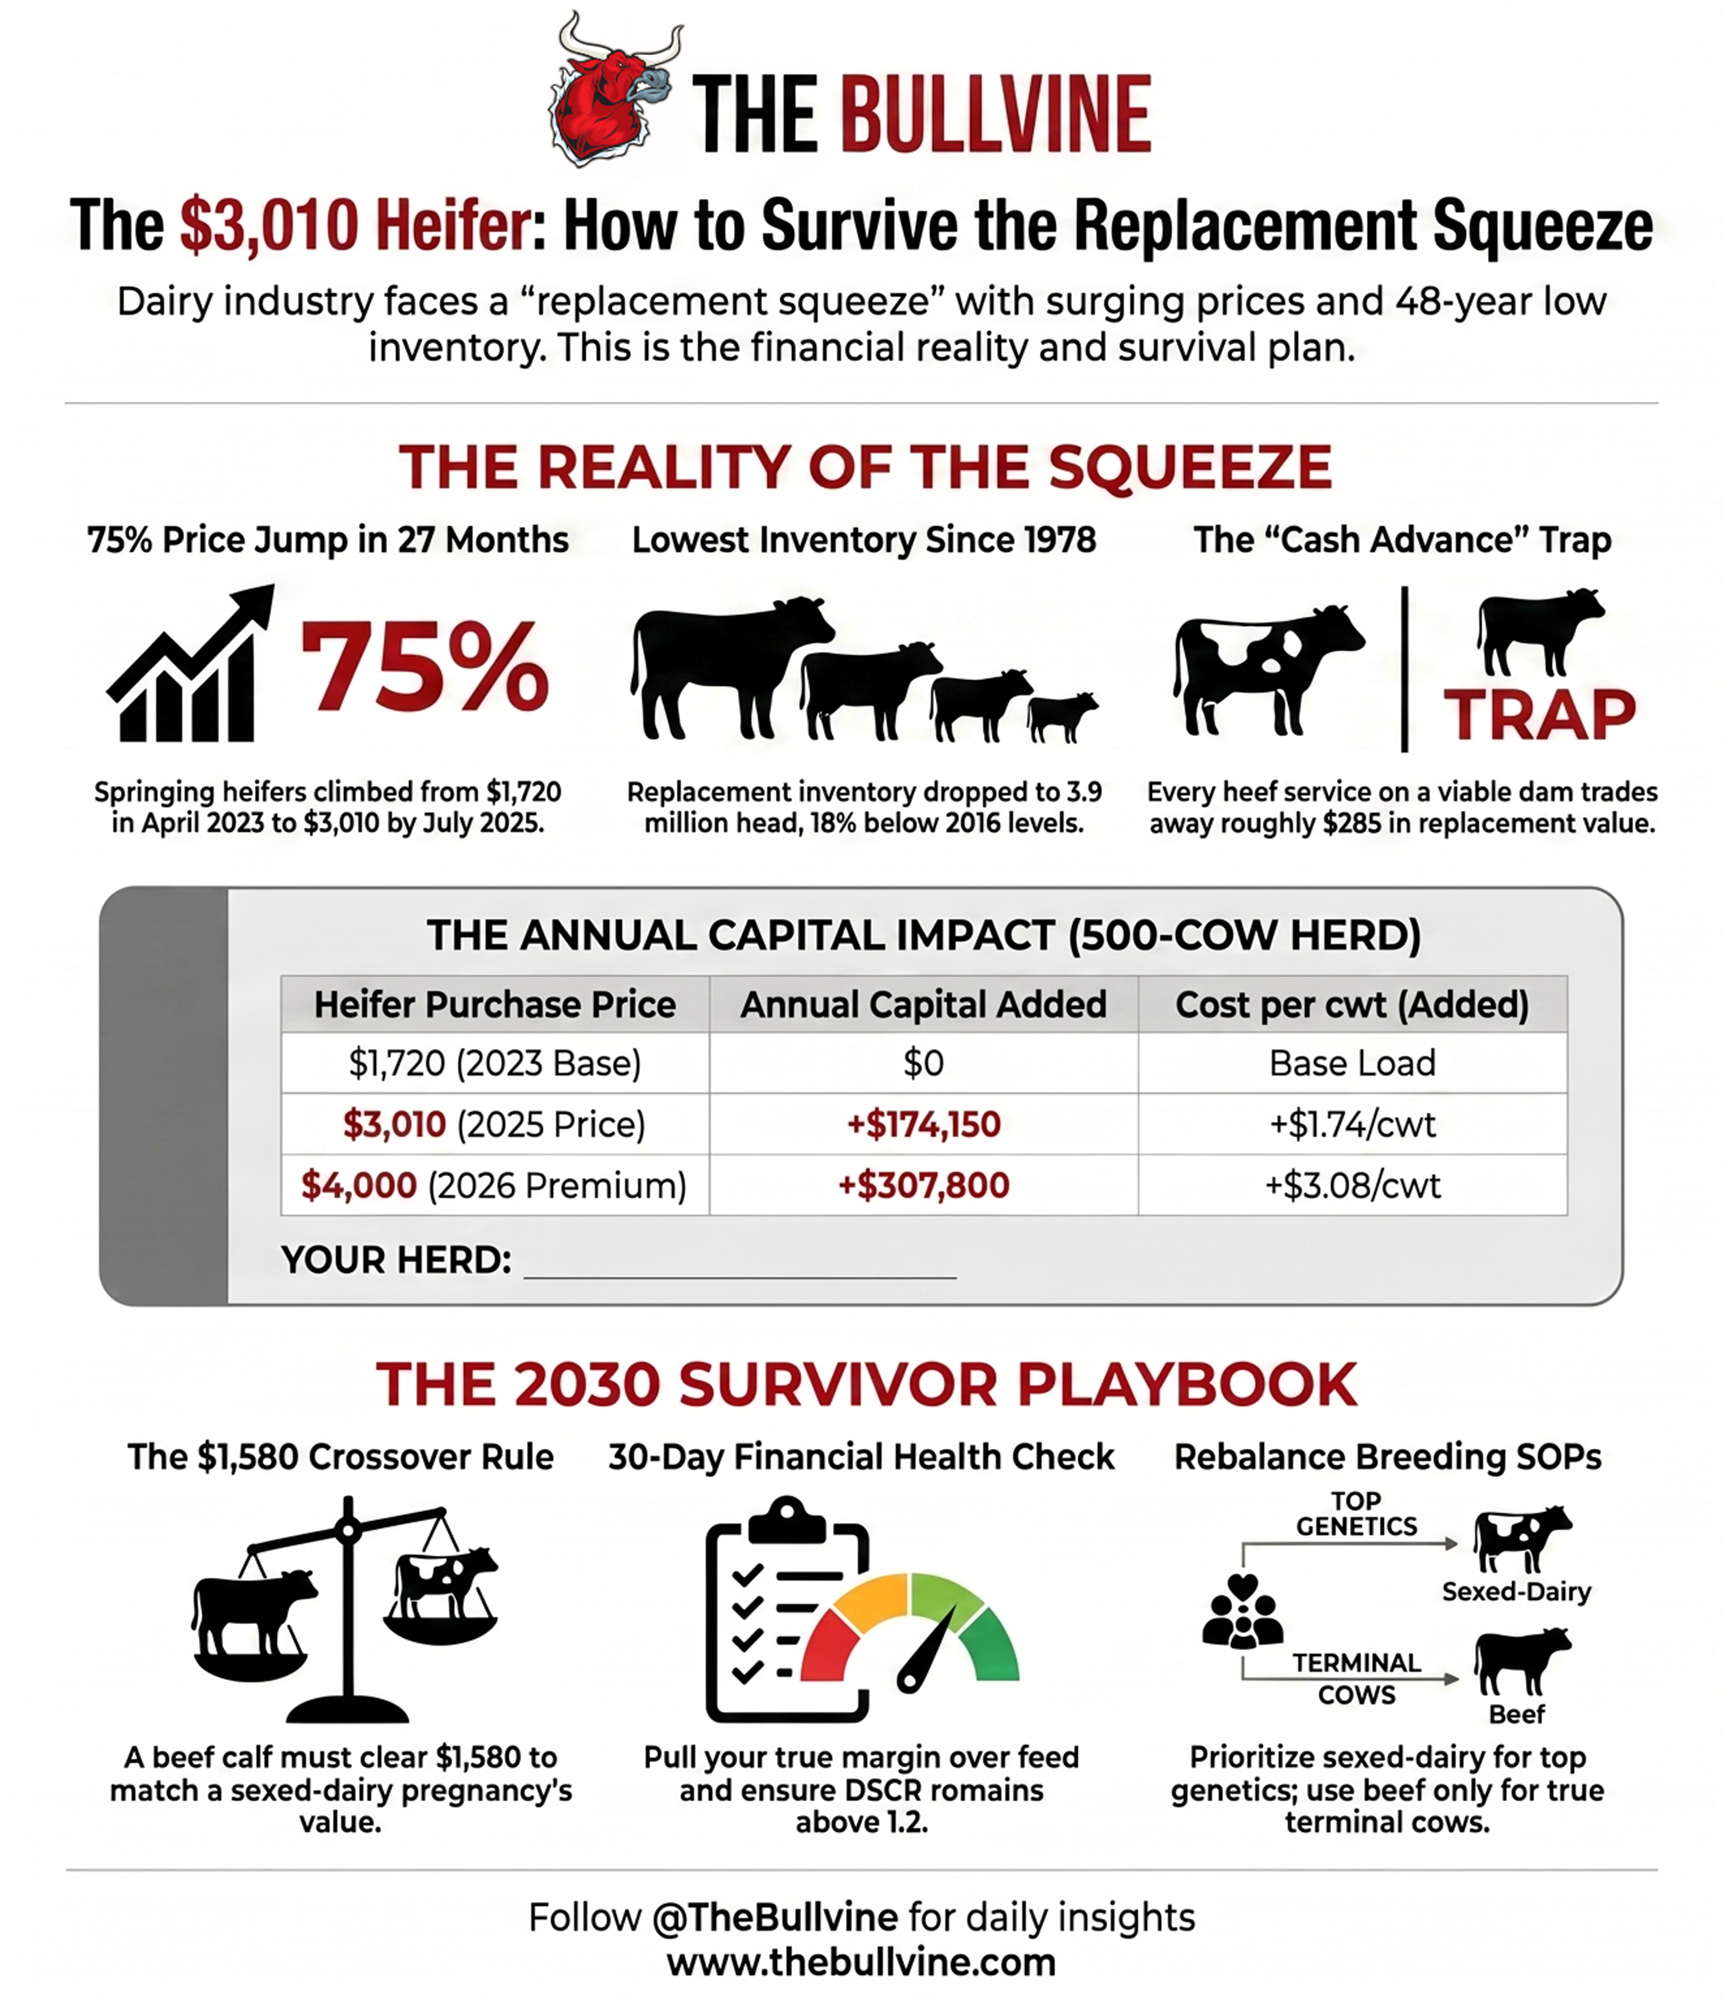
Executive Summary: A springing dairy heifer went from $1,720 in April 2023 to $3,010 by July 2025 — a 75% jump in 27 months, per USDA’s Agricultural Prices series — and CoBank’s Corey Geiger reads that number as the signal for which mid-size herds still own their cows in 2030. The squeeze hits 250-to-600-cow operations hardest, because the replacement inventory sits at 3,914,300 head, the lowest since 1978, and there’s no cheap way to refill the pipeline. Here’s the trap: that beef-on-dairy check you banked was never free money — every beef service on a viable dam trades away roughly $585 in replacement value, and a beef calf has to clear $1,580 to match a sexed-dairy pregnancy on the same cow. Run it on a representative 500-cow Panhandle herd needing 135 replacements a year, and the price jump alone adds $174,150 to $307,800 annually — an extra $1.74 to $3.08/cwt on 100,000 cwt shipped, before you touch the interest on financing them. With Class III stuck at $14–$16/cwt through early 2026 against a mid-size breakeven near $21/cwt, that added replacement load is the difference between tight-but-surviving and your lender running the numbers before you do. The herds getting sorted out aren’t the smallest — they’re the ones running volume economics with value-farm overhead and no plan to hold DSCR above 1.0 into 2028. The full piece runs the barn math and a 30/90/365 playbook, including the $1,580 crossover that should govern every beef breeding you book this season.
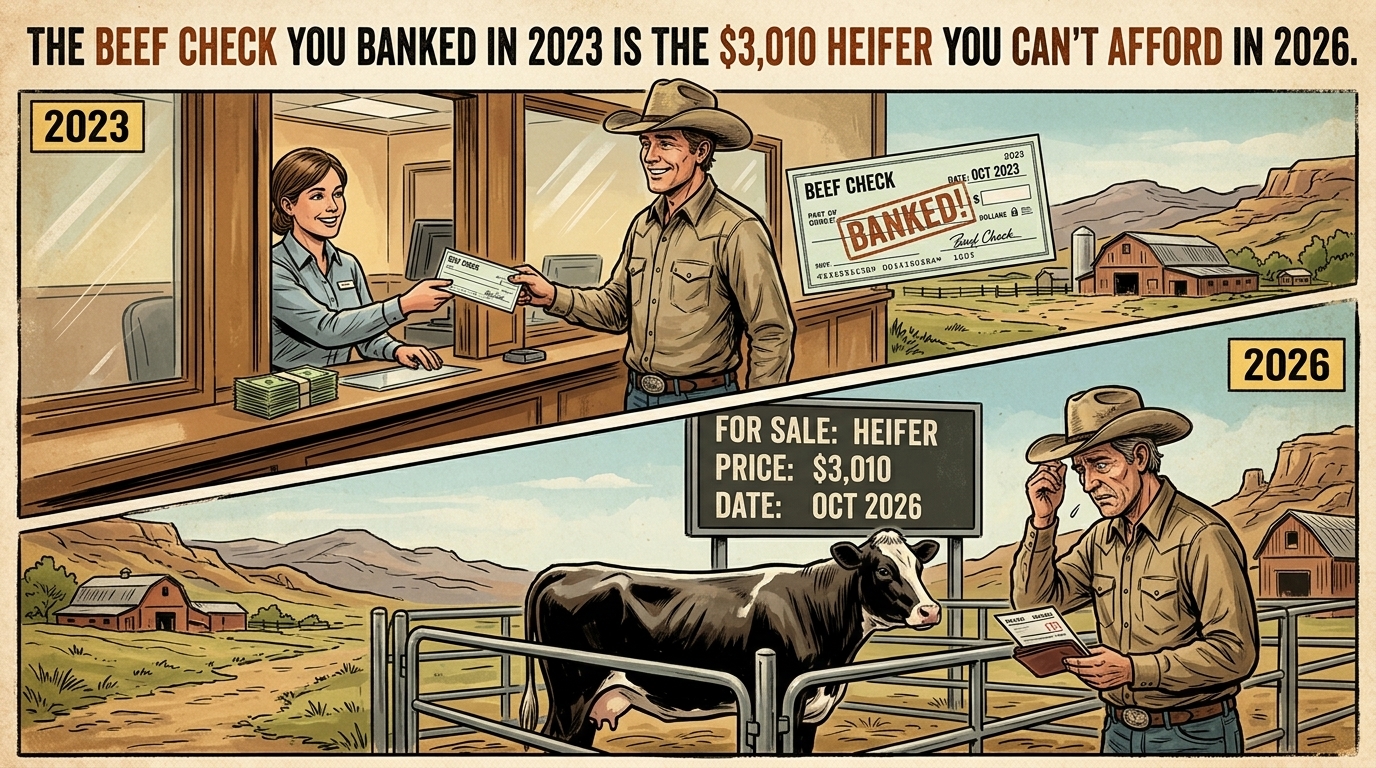
In April 2023, a springing dairy heifer ran $1,720 a head on USDA’s Agricultural Prices series. By July 2025, that same animal cost $3,010 on the same series — a 75% jump in 27 months — and premium springers were fetching $4,000 to $4,500-plus at California sale barns. CoBank dairy economist Corey Geiger’s reports keep returning to that move, because it’s the dairy heifer price in 2026 that decides which mid-size herds still own their cows in 2030 — and which ones quietly get sorted out. The beef-on-dairy math that looked smart in 2022 is sending the biology bill now, and it’s landing hardest on the 250-to-600-cow operations least able to absorb it.
This isn’t expansion. It’s a sort.
What’s Actually Behind the Record-Milk Headline
Start with the dashboard everyone’s reading off. According to the USDA NASS Milk Production report released in February 2026, U.S. milk production hit 232 billion pounds last year — a 2.6% climb over 2024. The milk-cow herd ran near 9.6 million head in early 2026, the largest in roughly three decades. Per-cow output keeps grinding higher. Every light on that row reads green.
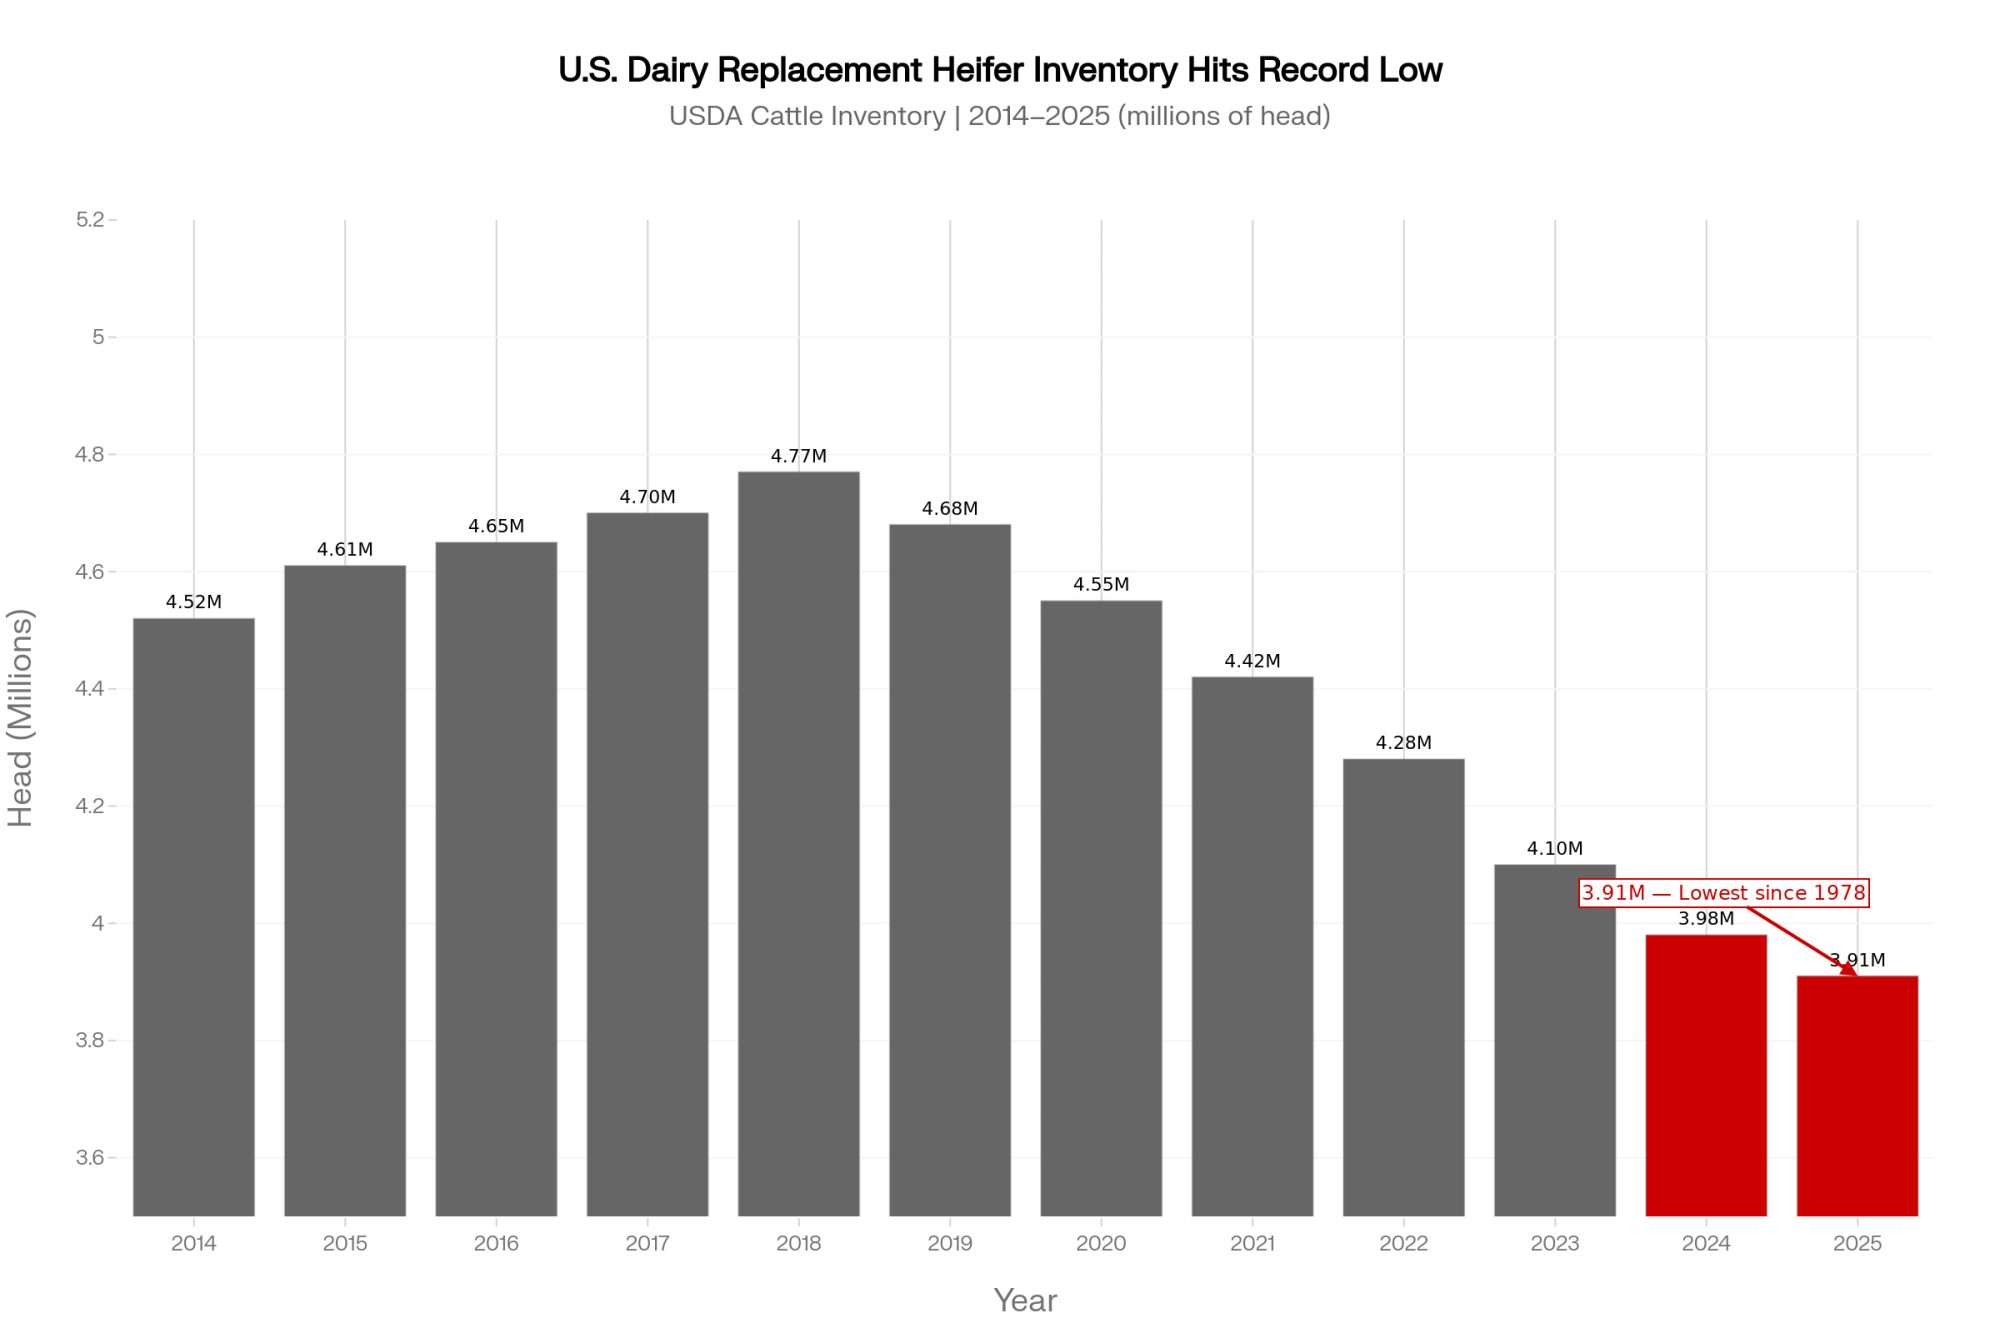
Drop down one row. USDA’s Cattle inventory report, out at the end of January 2025, counted just 3,914,300 dairy replacement heifers — the fewest since 1978, and about 18% below the 4.77 million head on hand in 2018. Dairy cow slaughter totaled near 2.53 million head through 2025, a decade low, suggesting producers held onto older cows rather than culling them, per the American Farm Bureau’s January 2026 Market Intel analysis.
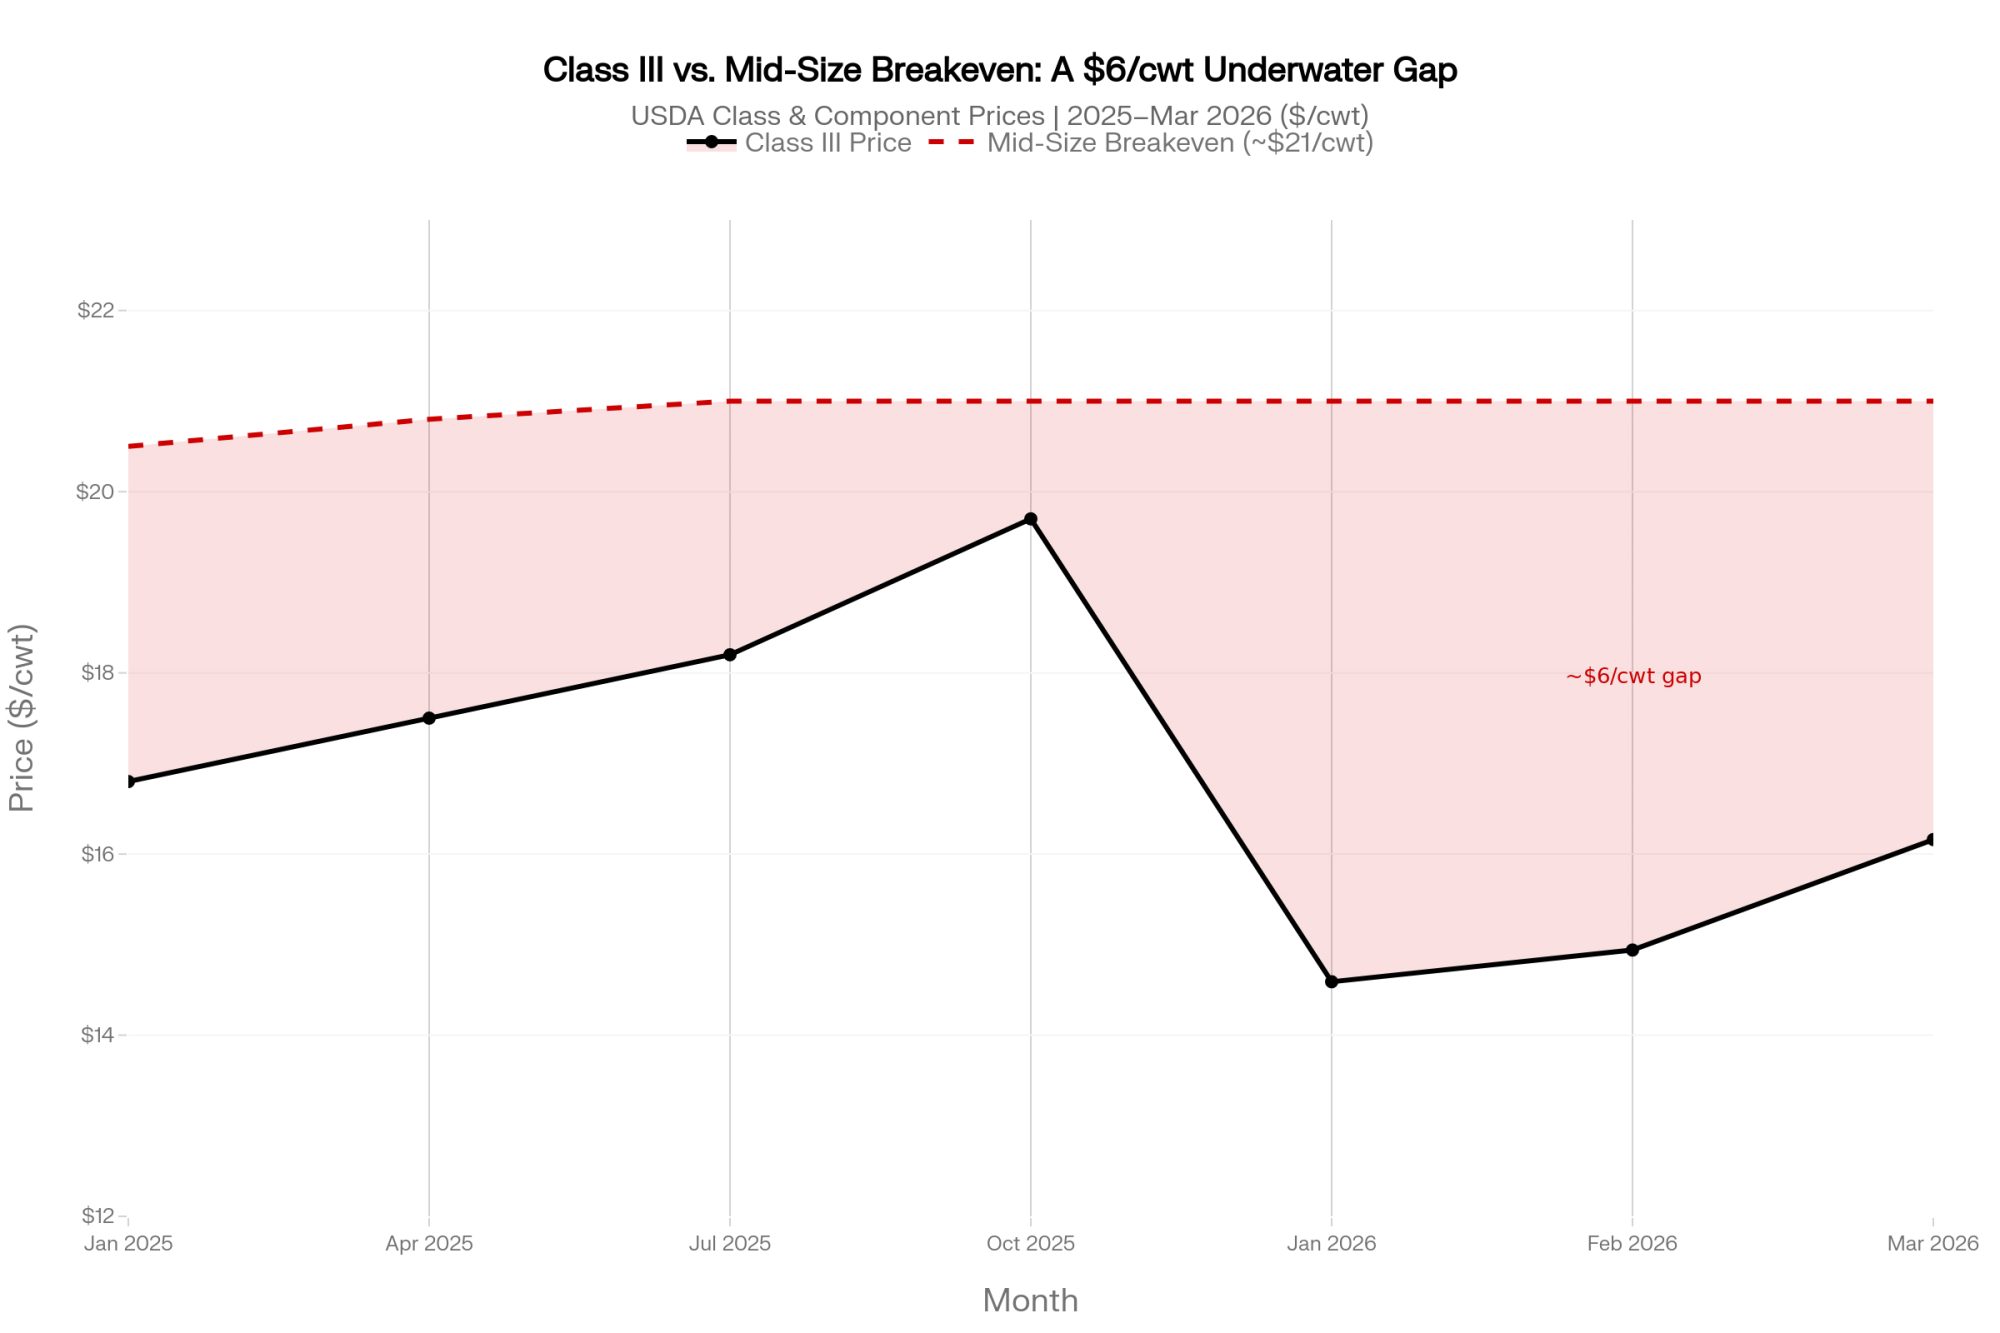
Then the milk check turned. USDA’s Class and Component prices put Class III at $14.59/cwt in January 2026, $14.94 in February, and $16.16 in March — a long way below the $19.70 all-milk average of late 2025 that Farm Bureau flagged. The green production light and the red margin light are on simultaneously. That’s the whole problem.
Geiger laid out the pipeline read in CoBank’s August 2025 report: the shortage moved replacement prices from $1,720 a head in April 2023 to $3,010 by July 2025 — that 75% climb — with the national herd at 3,914,300 head, 18% thinner than 2018.
Why does a sale-barn number matter this much to a dairy economist? Because it’s the price of staying in the cow business. At $1,700 to $2,000 a head, a 30% replacement rate stings but pencils for most family operations. At $3,000 to $4,000, the capital math changes who can afford to keep the pipeline full. That’s the lens Geiger’s using. Most of the trade conversation still isn’t.
The Assumption Was Free Money. The Math Says It Was a Cash Advance.
Rewind to when beef-on-dairy actually was the smart play. The spread was real, and it was big. By late 2024, a day-old beef-on-dairy cross calf was worth several hundred dollars more than a pure Holstein bull calf, and Farm Bureau’s Market Intel work showed the large majority of dairies capturing that premium.
University of Wisconsin dairy economist Victor Cabrera ran the break-evens early. As Progressive Dairy summarized his 2022 DairyMGT modeling in June 2023, the break-even on a beef-on-dairy calf sat near $69 a head for herds with exceptional fertility and climbed toward $300 a head for poor-fertility herds — and Northeast calf prices were clearing those break-evens with room to spare. The beef check kept growing. CoBank’s June 2026 follow-up notes beef sales now contribute roughly 12% to 15% of revenue on many dairy farms, approaching 20% per hundredweight on some.
So the industry assumption was simple: beef-on-dairy is free money on calves you didn’t want anyway.
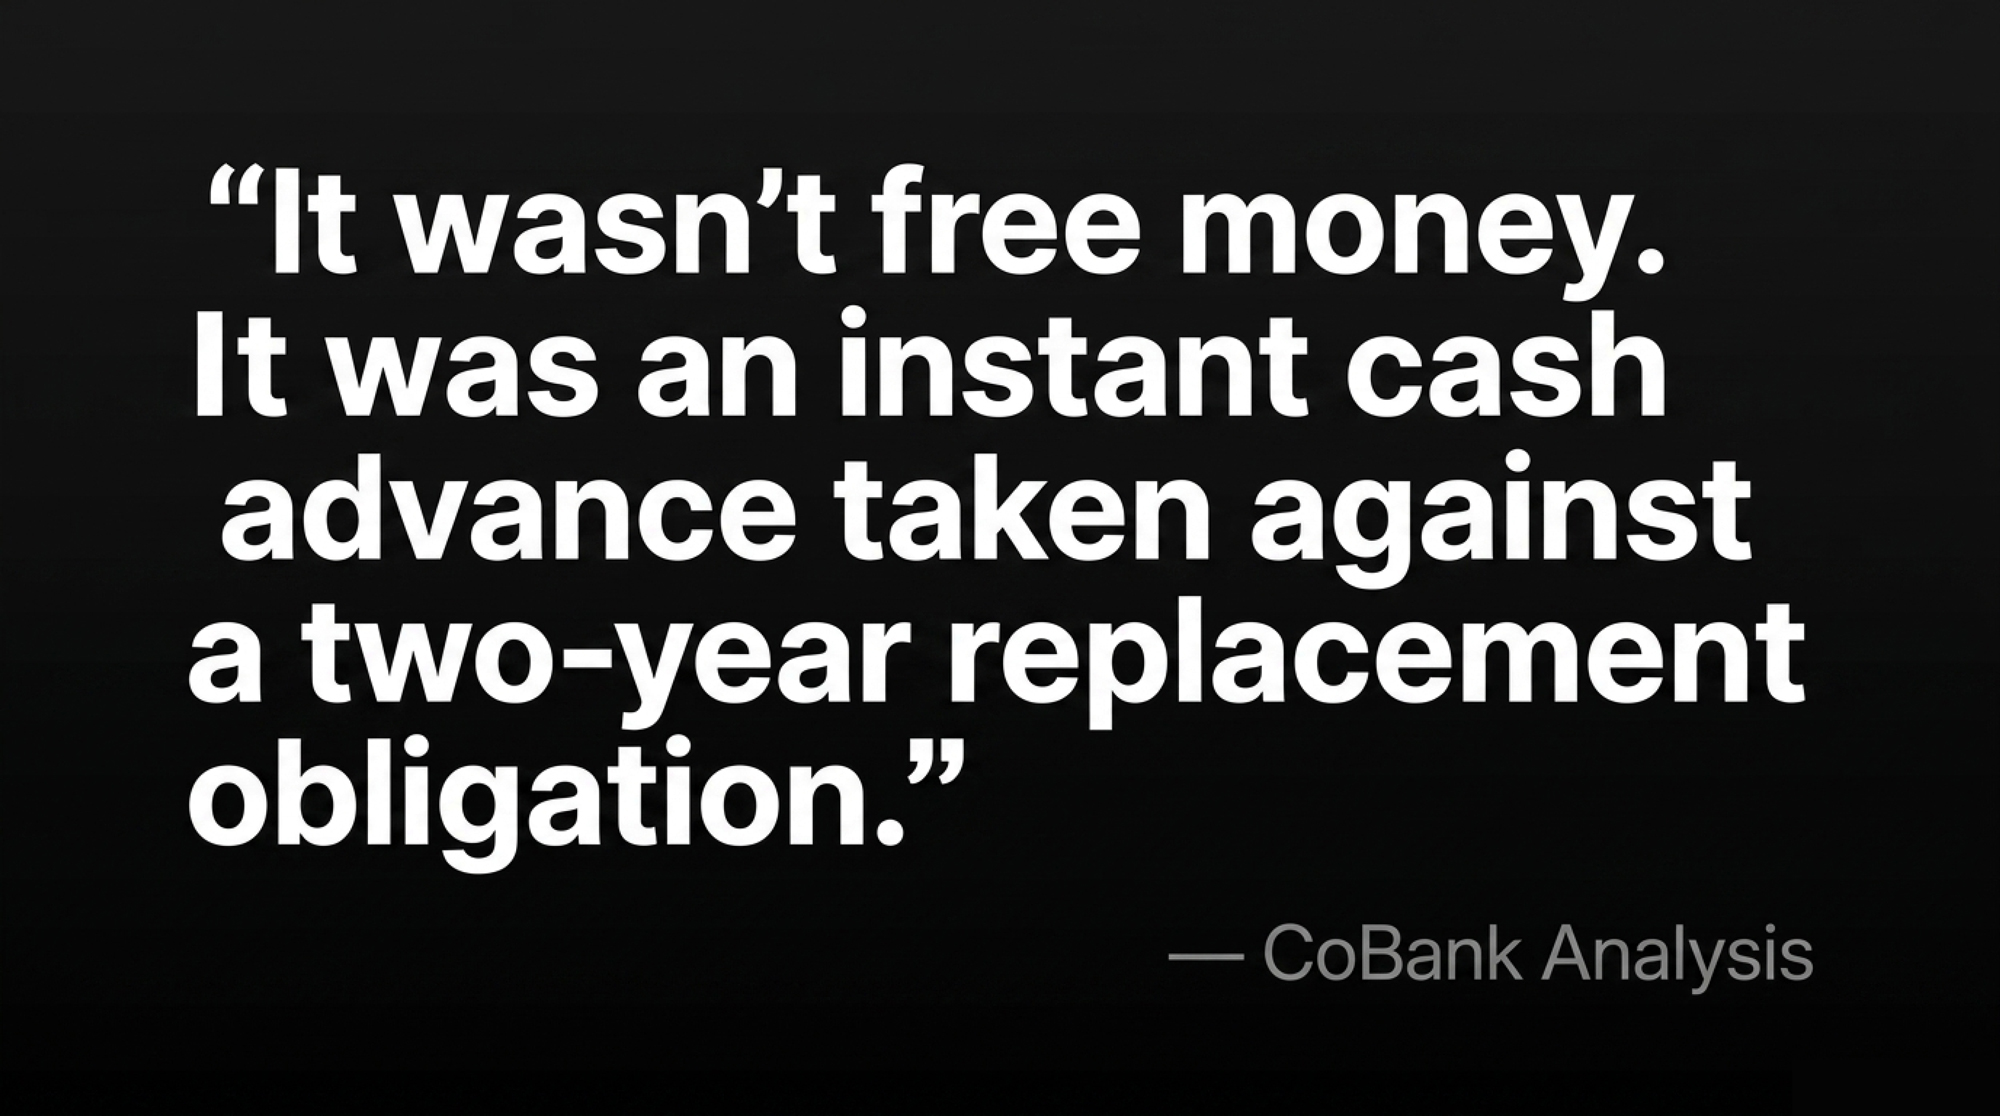
The math says otherwise, and the framing in CoBank’s analysis is the line that belongs taped to every farm lender’s monitor. In essence: a beef-on-dairy cross calf is a one-time check today, while a dairy replacement is a two-year build. Read that again. It wasn’t free money. It was an instant cash advance taken against a two-year replacement obligation — and the obligation comes due whether you budgeted for it or not.
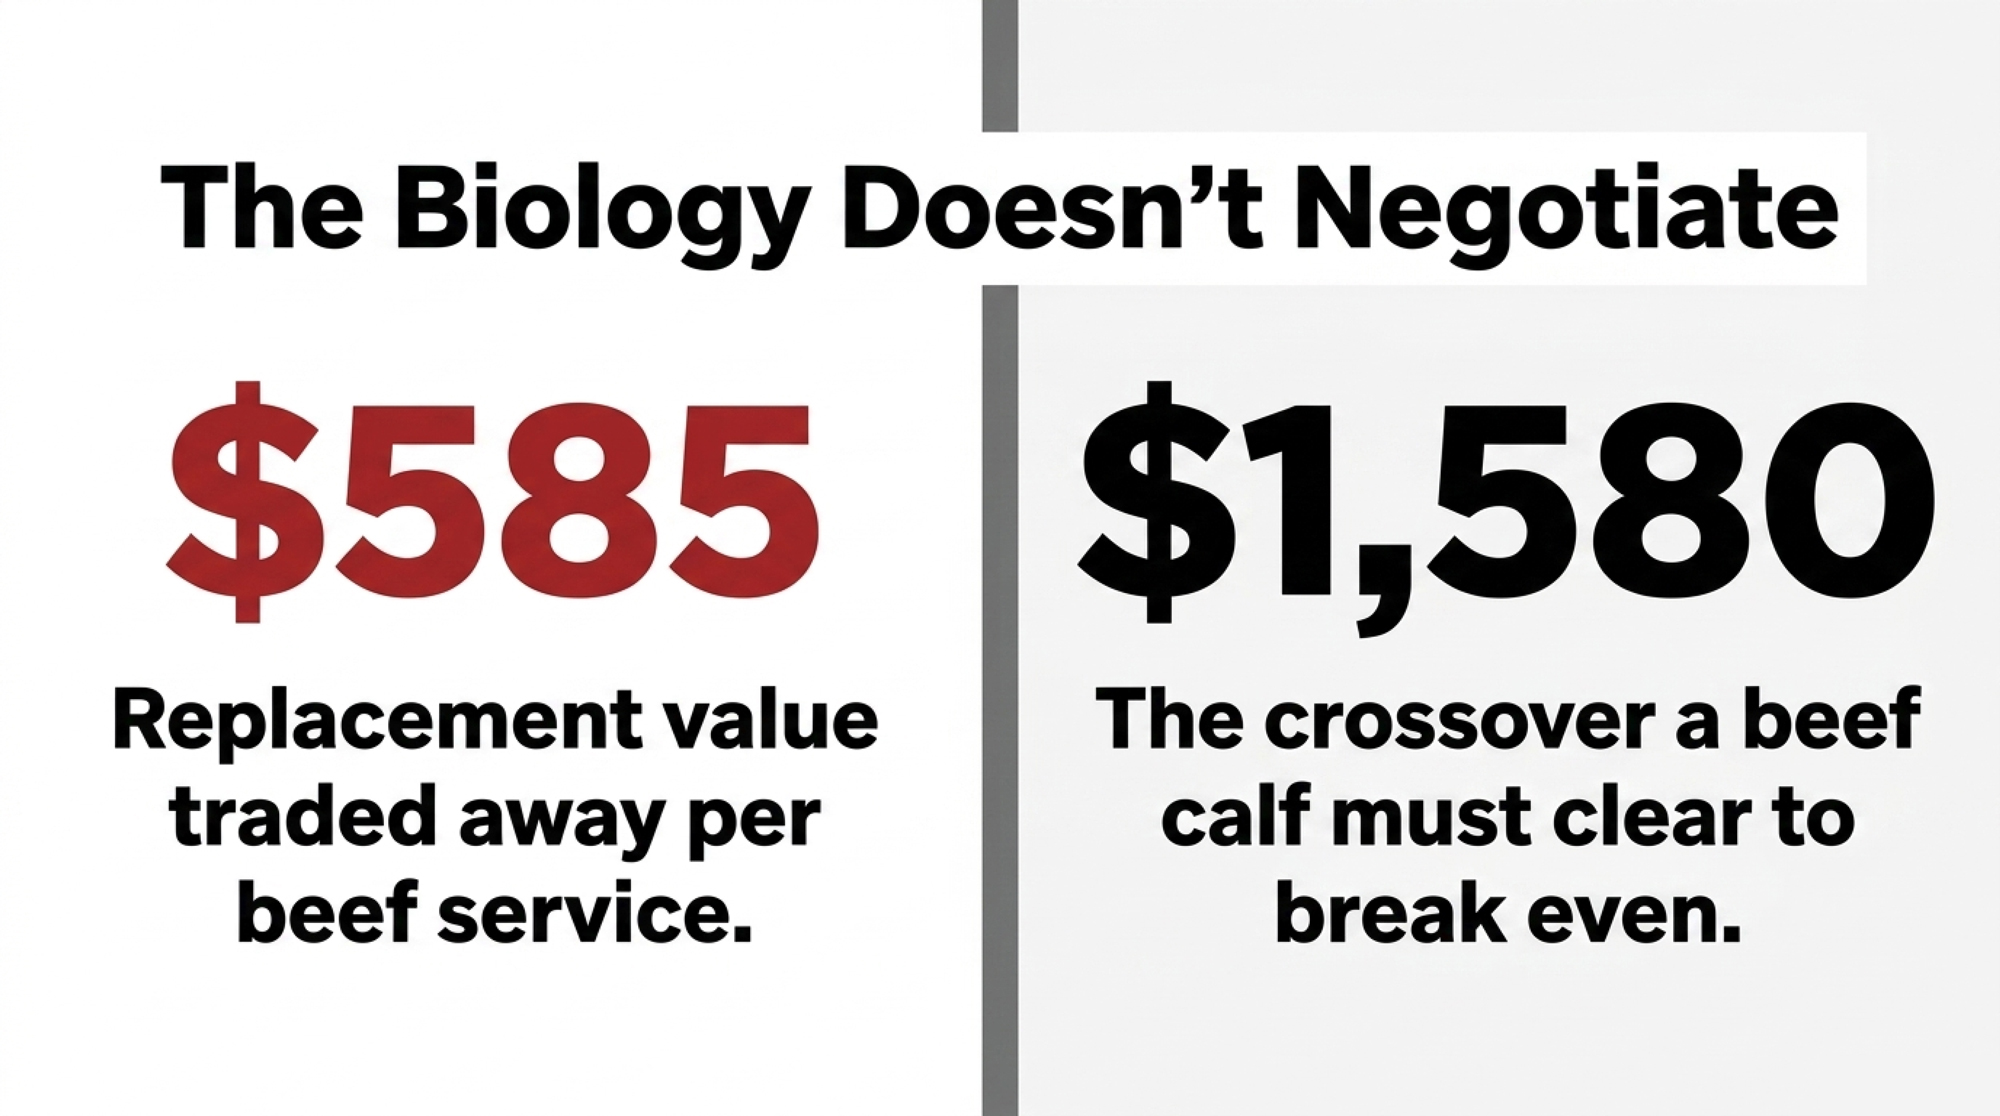
Our own Replacement Pipeline Tracker put a number on that trade. At a $3,010 replacement, every beef service on a viable dairy dam trades away roughly $585 in expected replacement value — and a beef calf has to clear $1,580 a head to match what a sexed-dairy pregnancy is worth on that same cow. Below that crossover, you’re not capturing a premium. You’re selling a future cow at a discount.
| Metric | Beef-on-Dairy Cross | Sexed Dairy Heifer Pregnancy |
|---|---|---|
| One-time calf revenue (avg.) | ~$400–$600 | $0 at birth |
| Replacement value foregone (per service) | -$585 | $0 |
| Crossover to match sexed-dairy value | Must clear $1,580 | $1,580 baseline |
| Time to revenue (heifer path) | N/A — terminal | 24–26 months to first milk |
| Pipeline impact (2023–24 heavy beef) | −796k heifers by end 2026 | Inventory preserved |
| DSCR risk by 2028 | HIGH if beef % > viable threshold | Lower with balanced breeding |
| Best candidate cows | True terminal / low-index | Top 30–40% of herd |
| Worst use case | Viable dairy dam, top genetics | N/A |
The biology doesn’t negotiate. A replacement heifer takes about 24 to 26 months from conception to first milking. Heavy beef breeding in 2022 and 2023 showed up as missing dairy heifers in 2024 and 2025, and it rolls forward as tighter fresh-cow supply into 2026 and 2027. “This year we’re going to have 438,000 fewer dairy replacements becoming milk cows compared to last year, and this won’t rebound until 2027, when we see an improvement of 285,000,” Geiger told Iowa PBS’s Market to Market in May 2026. CoBank’s modeling puts the two-year hole at 357,490 fewer dairy heifers in 2025 and 438,844 fewer in 2026 — a combined shortfall near 796,000 head before any rebound. Enough of a rebuild ahead to stop the bleeding. Not enough to reverse the sort.
What Does the $1,720-to-$3,010 Heifer Jump Mean for a 500-Cow Herd in 2026?
This is where beef-on-dairy stops being a calf-check conversation and turns into a balance-sheet one. The heifer move isn’t just expensive. It’s selective. It separates the barns that can refill their pipeline from cash flow from the ones that have to borrow to do it — or stop doing it.
The cost bands frame the squeeze. Working from its most recent full ARMS cost series (2021 base year), USDA’s Economic Research Service puts total economic cost — cash expenses plus unpaid labor, depreciation, and opportunity cost — at $42.71/cwt for herds under 50 cows and under $20/cwt for herds with 2,000-plus cows. Herds in the 100-to-499-cow range interpolate into roughly the $19 to $21/cwt band. Set that against Class III sitting in the $14 to $16/cwt range through early 2026, and a mid-size herd carrying a true $21/cwt breakeven is deep underwater on the milk side alone.
The Canadian read is different, and worth saying plainly. Under supply management, Ontario and other provincial producers price milk through the quota system rather than through a volatile mailbox check, which softens the price-collapse risk that drives the U.S. sort. The heifer-supply squeeze and the beef-on-dairy breeding tradeoff still apply north of the border — the cash-flow timing hits differently.
That’s not hypothetical in the sense that matters. Our Replacement Pipeline Tracker ran the same trap on a representative 500-cow Panhandle dairy shipping to new Panhandle processing capacity: it needs 135 replacement heifers a year at a 27% turnover rate, and after running 35% beef through 2023–24, it’s trading away roughly $117,000 in expected replacement value annually on beef services that could’ve carried dairy pregnancies. That’s the barn where the theory stops being theory.
Editor’s disclosure: the Panhandle herd figures are modeled from the Bullvine Replacement Pipeline Tracker using representative Panhandle inputs — not a single named operation.
Now put the price move in a table you can read off in ten seconds.
| Heifer Purchase Price | Annual Cost (135 head) | Capital Added vs. 2023 Base | Cost per cwt (~100,000 cwt/yr) |
| $1,720 (USDA, April 2023) | $232,200 | — (base year) | $2.32/cwt* |
| $3,010 (USDA, July 2025) | $406,350 | +$174,150 | +$1.74/cwt added |
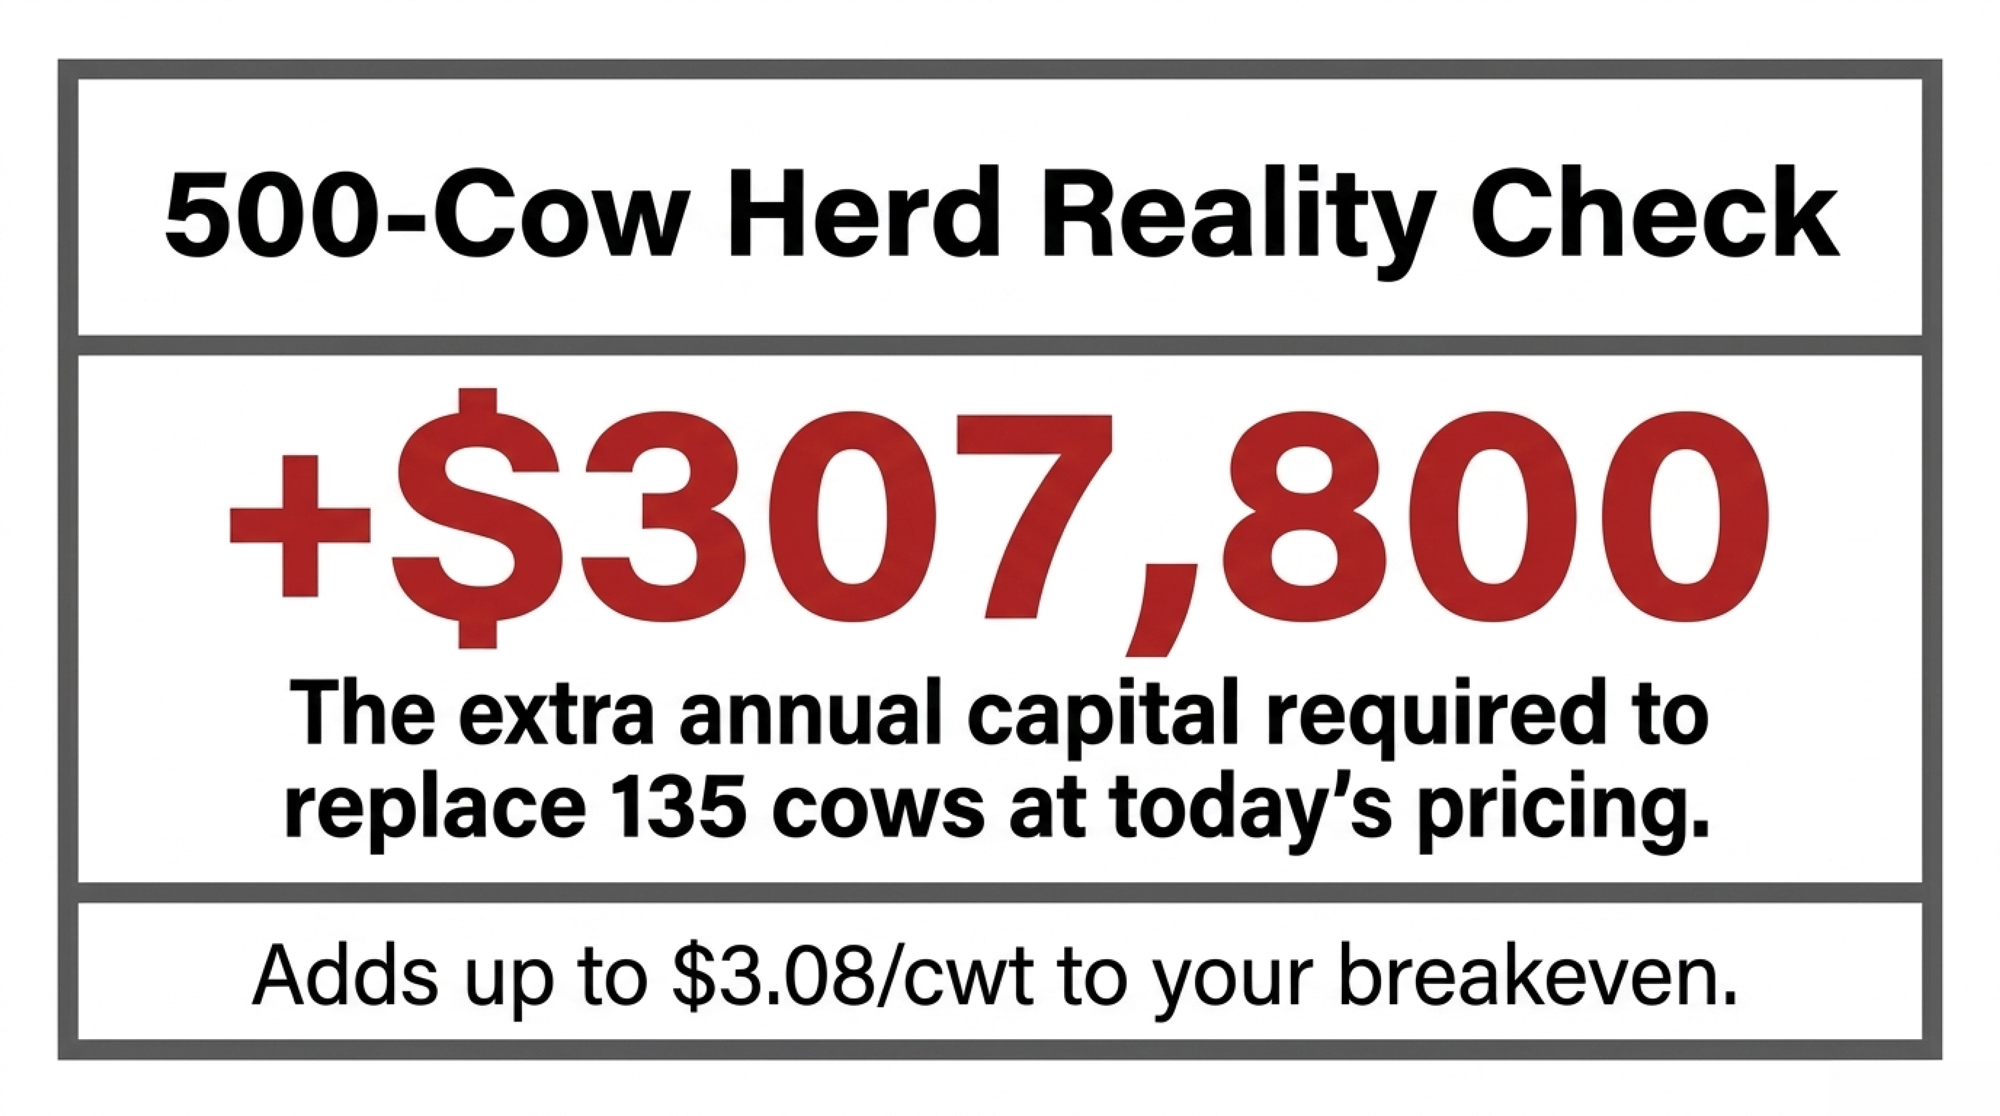
| $4,000 (CA premium springers, 2026) | $540,000 | +$307,800 | +$3.08/cwt added |
*The $2.32/cwt is the total base replacement load, not an add-on. The $1.74 and $3.08 figures are what the price jump adds on top of that base — don’t stack them on the $2.32.
Running the Numbers — The 500-Cow Replacement Line
Take the Panhandle herd: 500 cows, 27% turnover, 135 replacements a year.
Same herd. Same cull rate. The price move from the 2023 base alone adds $174,150 to $307,800 a year in replacement capital — an extra $1.74 to $3.08/cwt on roughly 100,000 cwt shipped (≈ 200 cwt per cow; swap in your own rolling herd average).
Now finance them. Put 135 head at $3,010 on a note and the interest stacks on top of the purchase price — at 7% simple, that’s roughly $28,500 a year; at 9%, closer to $36,500. Run it at your own note rate and term, because a multi-year amortized loan spreads it differently than a one-year operating line.
Plug in your herd size, your cull rate, and the heifer price your local barn is printing this month.
That extra $1.74 to $3.08/cwt is the gap between tight-but-surviving and the bank running your numbers before you do. The trigger is mechanical. When replacement and interest drag push your debt service coverage ratio below 1.0 — the point where farm income no longer covers principal and interest without off-farm money or an equity draw — your options have already narrowed. Lenders generally want to see a DSCR near 1.5 and get nervous between 1.0 and 1.2.
Why the $3,000 Heifer Floor Punishes the Middle Tier
Here’s the turn. The reflex answer to a cost squeeze has always been scale — get big, spread overhead, grind out commodity milk. The $3,000-plus heifer floor breaks that reflex for the operations in the middle, and it does it through cash, not size.
For decades, a mid-size family farm could coast through a down cycle on paid-off equity. Cows die or leave, you replace them out of the herd or buy a few at a manageable price, and you ride out the low milk check on a clean balance sheet. That escape hatch is closing. When the asset you have to replace — the cow — costs $3,010 to $4,000 instead of $1,720, coasting isn’t an option. You’re forced to lay out serious cash to keep the same stalls full, and if you don’t have it sitting there, you borrow it.
Run it against the Panhandle box: 135 replacements at $3,010 is a $406,350 replacement line, versus $232,200 at the old price — and interest on the gap on top of that. A high-volume operation at sub-$20/cwt cost can absorb that. A value-model operation capturing more dollars per gallon can absorb it. The herd caught in between — running volume economics with value-farm overhead — can’t, and that’s the operation getting sorted out.
The split isn’t small-versus-large anymore. It’s disciplined-versus-not. Even some large herds bled in the last down cycle by running costs their scale couldn’t outrun. Big and undisciplined still bleeds.
As agricultural financial experts recently warned Northeast producers, the industry overall may survive, but many individual farms won’t — and producers don’t have the luxury of waiting for things to get better. They have to manage risk and make strategic calls now to stay among the survivors.
The question stopped being “how many cows?” It became “which business am I actually in — and do my numbers match it?”
What Are the 2030 Survivors Doing Now That Their Neighbors Aren’t?
The instinct in a squeeze is to do something dramatic. The data says the survivors are doing something almost boring. They measure more often than everyone else.
On the ground, that’s three disciplines. First, they pull the true cost of production every month — not the Dairy Margin Coverage proxy, which can sit well off real-world costs — counting unpaid family labor at local rates, depreciation at replacement cost, current interest, and heifers at their actual cost today. Second, they rebalanced breeding early, holding a meaningful share of matings on dairy semen and putting sexed dairy on their best cows instead of maxing the beef calf check. Third, they treat the beef check as revenue to hedge rather than a windfall.
Recent agricultural outlooks emphasize a critical shift for 2026: protect predictable cash flow rather than chasing high prices. Financial experts urge producers to maximize Dairy Margin Coverage and Dairy Revenue Protection for milk. Furthermore, as beef-on-dairy genetics become a staple revenue stream, utilizing Livestock Risk Protection to cover beef revenue is now just as essential as protecting milk margins.
You’ve seen this consolidation arc build before, and the human cost of it up close.
The 30/90/365-Day Playbook for Herds Like the Panhandle 500
This reads like a plan for a 300- to 1,500-cow operator or the advisor across the table, not a pep talk.
30-Day actions — urgent checks
- Pull your last three milk checks and calculate your real margin over feed per cwt — same components, same hauling, every time. Requires: settlement sheets and feed invoices. Trigger: if your true breakeven sits above your rolling 12-month mailbox price, this goes to the top of the list. Watch for: omitting unpaid family labor and depreciation, which inflates the number.
- Run your pipeline math. Pull 12 months of heifer-calf births, multiply by a realistic survival-to-first-calving rate for your herd (many well-managed herds run near 0.79; use your own if you track it), and compare to herd size × replacement rate. Trigger: if you’re short, that gap is baked into 2027–2028 regardless of where prices go. Watch for: counting beef-cross calves as replacements — they aren’t.
- Run your DSCR using your lender’s or CPA’s method. Trigger: if it’s been under 1.2 for three straight months, this is your first call, not your last. Watch for: one-time income masking a structural cash shortfall.
90-Day actions — structural moves
- Tier your herd and write it into your breeding SOPs: top genetics to sexed dairy, the middle tier a mix, true terminal cows only to beef. Requires: index and repro data. Backfire risk: letting beef creep back onto viable dams because the straw’s cheaper that day — that’s the $585 trade repeating itself.
- Decide which game you’re in — volume engine or value model — and test your cost structure against it. Requires: a full ERS-style cost build and an honest read on your market access. Backfire risk: half-committing leaves you with value-farm overhead and commodity-milk revenue, the worst of both.
- Layer revenue protection across both milk and beef. Requires: a conversation with your DRP and LRP provider before the coverage window closes. Watch for: sales-period deadlines that move; confirm the current date with your agent.
365-Day moves — strategic positioning
- Align your herd plan to your plant. If you’re near new Panhandle processing capacity, decide whether you’re growing, holding, or shrinking, and match your pipeline, beef percentage, and culling to that call. Requires:refinancing conversations and a hard look at debt structure. Opportunity signal: if your margin over feed holds positive and your basis stays firm while neighbors exit, you may have room to add cows from someone else’s dispersal rather than buying $4,000-plus springers.
- Set hard floors and ceilings: the minimum beef-calf price where beef services still make cash-flow sense, and the maximum share of breedings you’ll put to beef on viable dairy dams. Watch for: the $1,580 crossover — that’s your north star, not the calf buyer’s mood that week.
The Number That Forces the Question
The thing about that heifer price is it won’t let you headline your way out of the decision. Twenty-seven months took a springer from $1,720 to $3,010 on the USDA series, and that move is quietly naming who still owns dairy cows in 2030.
You gain cash today from every beef-cross calf you sell. You give up a future cow you’ll have to buy back at replacement-market prices — roughly $585 of her per service, at today’s spread. That’s the trade at the center of this whole story.
So pull your beef-on-dairy plan for this breeding season and set it next to your replacement inventory by age group. Does the calf check you’re banking this year leave you enough dairy heifers to hold your DSCR above 1.0 in 2028 — or are you taking another cash advance on cows you won’t have?
From $1,720 to $3,010 a head in 27 months — CoBank’s data says that heifer price isn’t a feed-yard story; it’s a signal about who still owns dairy cows in 2030. Which side of the sort do your replacement numbers put you on?
Key Takeaways
- Every beef service on a viable dairy dam trades away about $585 in replacement value, and a beef calf has to clear $1,580 to match a sexed-dairy pregnancy on that same cow — that crossover, not the calf buyer’s mood, should govern your breeding plan.
- At $3,010 a head, a 500-cow herd needing 135 replacements is carrying an extra $174,150 to $307,800 a year versus 2023 — roughly $1.74 to $3.08/cwt — before you touch the interest on financing them.
- With Class III stuck at $14–$16/cwt against a mid-size breakeven near $21/cwt, the herds getting sorted out aren’t the smallest — they’re the ones running volume economics with value-farm overhead and no plan to hold DSCR above 1.0 into 2028.
- In the next 30 days, run your real margin over feed, check your heifer pipeline against your cull rate, and pull your DSCR — if it’s been under 1.2 for three straight months, that’s your first call, not your last.
Complete references and supporting documentation are available upon request by contacting the editorial team at editor@thebullvine.com.
Learn More
- The $585‑Per‑Service Beef‑on‑Dairy Trap: What a 500‑Cow Herd Reveals About Your Replacement Pipeline— Arms you with precise genomic and reproductive math to halt capital hemorrhaging. Explores how the 21% non-completion rate among heifer calves silently compounds genetic deficits before they reach the milk string.
- CoBank Says the Heifer Rebuild Starts in 2027. Run the Numbers, and It’s a 5.3-Point Crawl, Not a Comeback.— Delivers a sobering 3-to-5-year economic forecast tracking the slow recovery of the national inventory. Exposes why regional processing expansions keep heifer values near historical highs through 2028 despite a minor supply uptick.
- 9.57 Million Cows, 3.9 Million Replacements: Genetics Built This Dairy Herd Paradox – and 2027 Ends It — Reveals an unconventional approach to the replacement crunch by capturing an extra lactation via targeted longevity genetics. Connects biological lifespan to a measurable $8,000–$9,000 mature-cow margin dividend.
 The Sunday Read Dairy Professionals Don’t Skip.
 The Sunday Read Dairy Professionals Don’t Skip.
Every week, thousands of producers, breeders, and industry insiders open Bullvine Weekly for genetics insights, market shifts, and profit strategies they won’t find anywhere else. One email. Five minutes. Smarter decisions all week.