










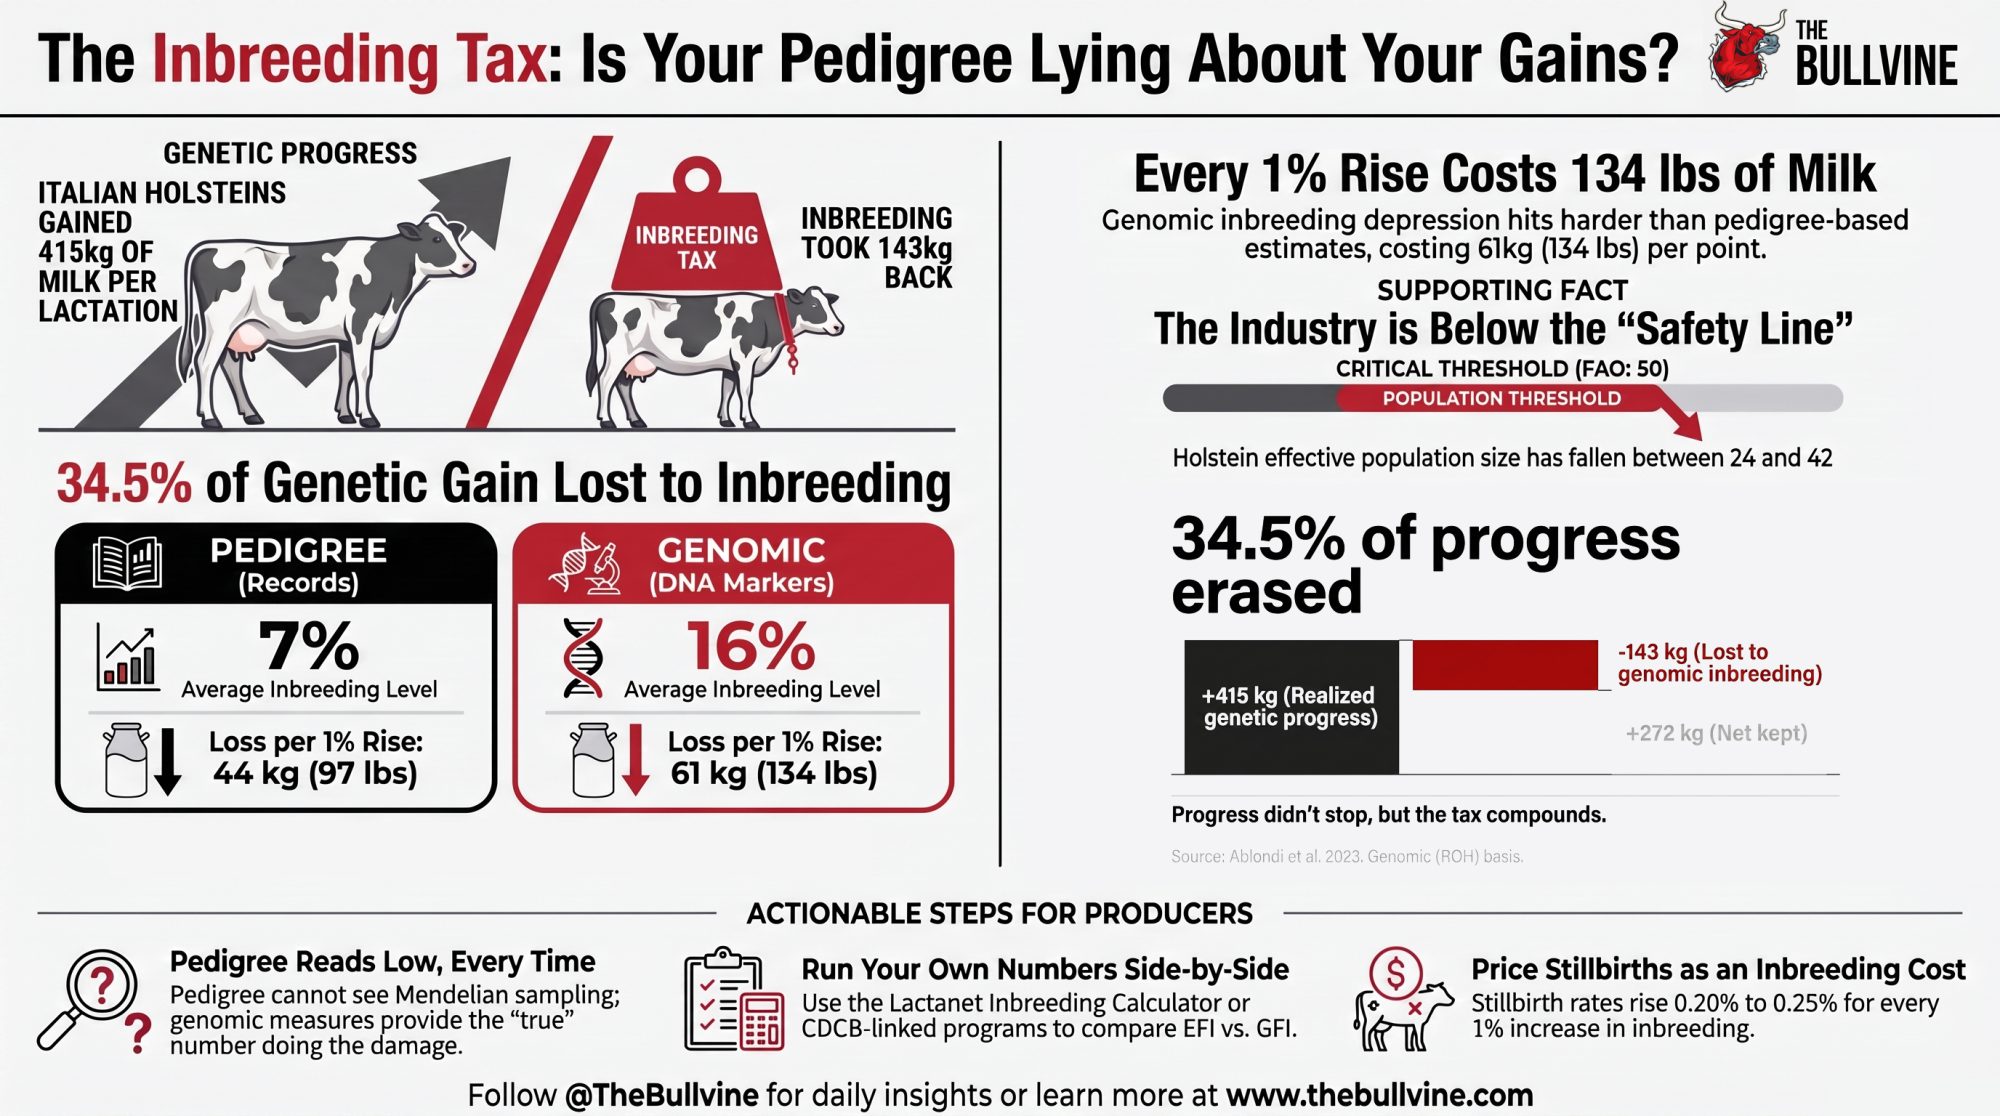
Italian researchers tracked 27,735 Holsteins for five years. The breed earned 415 kilos of genetic gain per lactation. Inbreeding took 143 back. Do you know your own herd’s number?
Executive Summary: Ablondi’s Parma team measured the same 27,735 Holsteins twice, and pedigree said 7% inbred while the genome said 16% — with the milk loss tracking the bigger number, 61 kg per point against 44. That gap matters to anyone genomic-testing females and still running matings off pedigree EFI, because you’re managing to the instrument that reads low. Across 2015 to 2020 the Italian Holstein banked 415 kg of genetic gain per lactation and inbreeding depression took 143 of it back, though the authors are careful to say the breed still kept 272 kg net; the worry is the trajectory, not a bill already due. Run Pryce’s scaling on your own operation — 0.4 to 0.6% of your rolling herd average per point of inbreeding — and a decade at the U.S. rate of 0.36 points a year costs a 12,000 kg herd 170 to 260 kg per cow, per lactation. North American Holstein’s genomic-era effective population size sits somewhere between 24 and 42, and even the optimistic end is under the FAO’s critical threshold of 50. Four major studs built internal elite-female programs between 2008 and 2015, only Select Sires has published a sourcing split, and none of the eight organizations we contacted responded — so nobody outside those companies can say where your next bull came from. The tools that fixed this in the 2000s are still available; the open question is whether anyone uses them at a 2.2-year generation interval, and whether you’ve ever seen your own two numbers side by side.
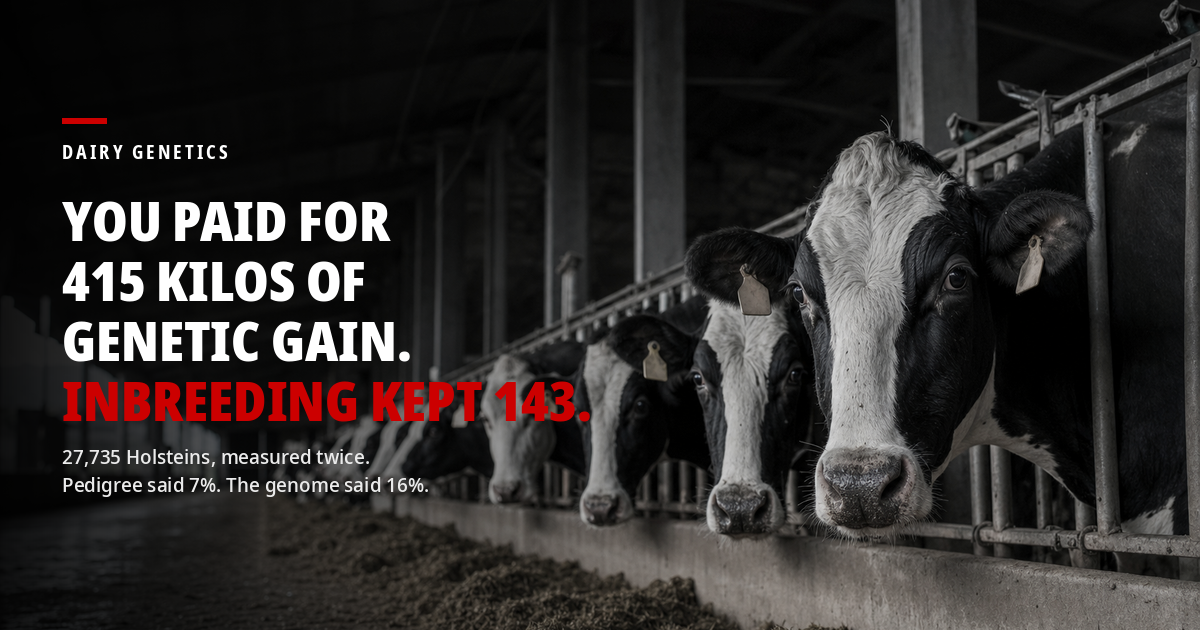
Michela Ablondi’s team at the University of Parma did something most inbreeding studies skip. They measured the same 27,735 Holstein cows twice.
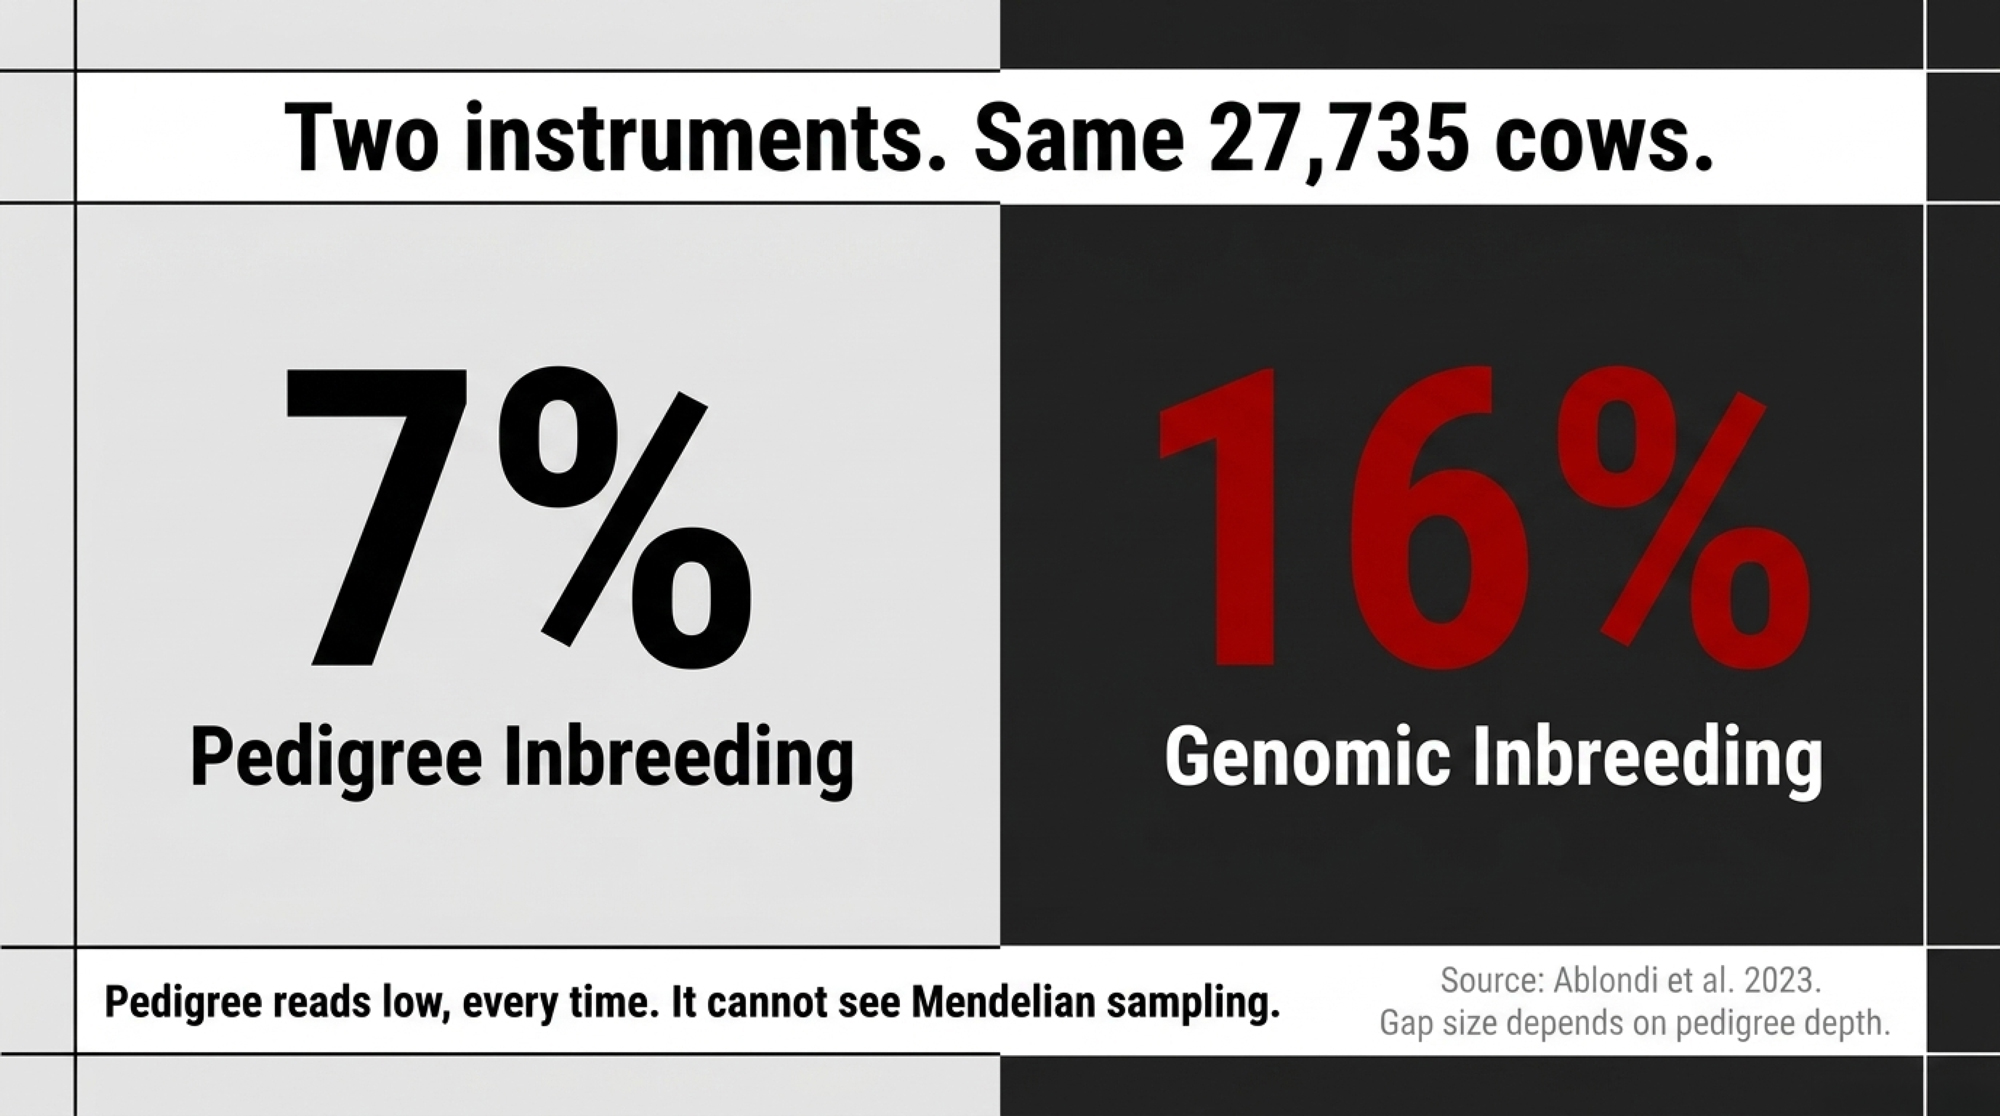
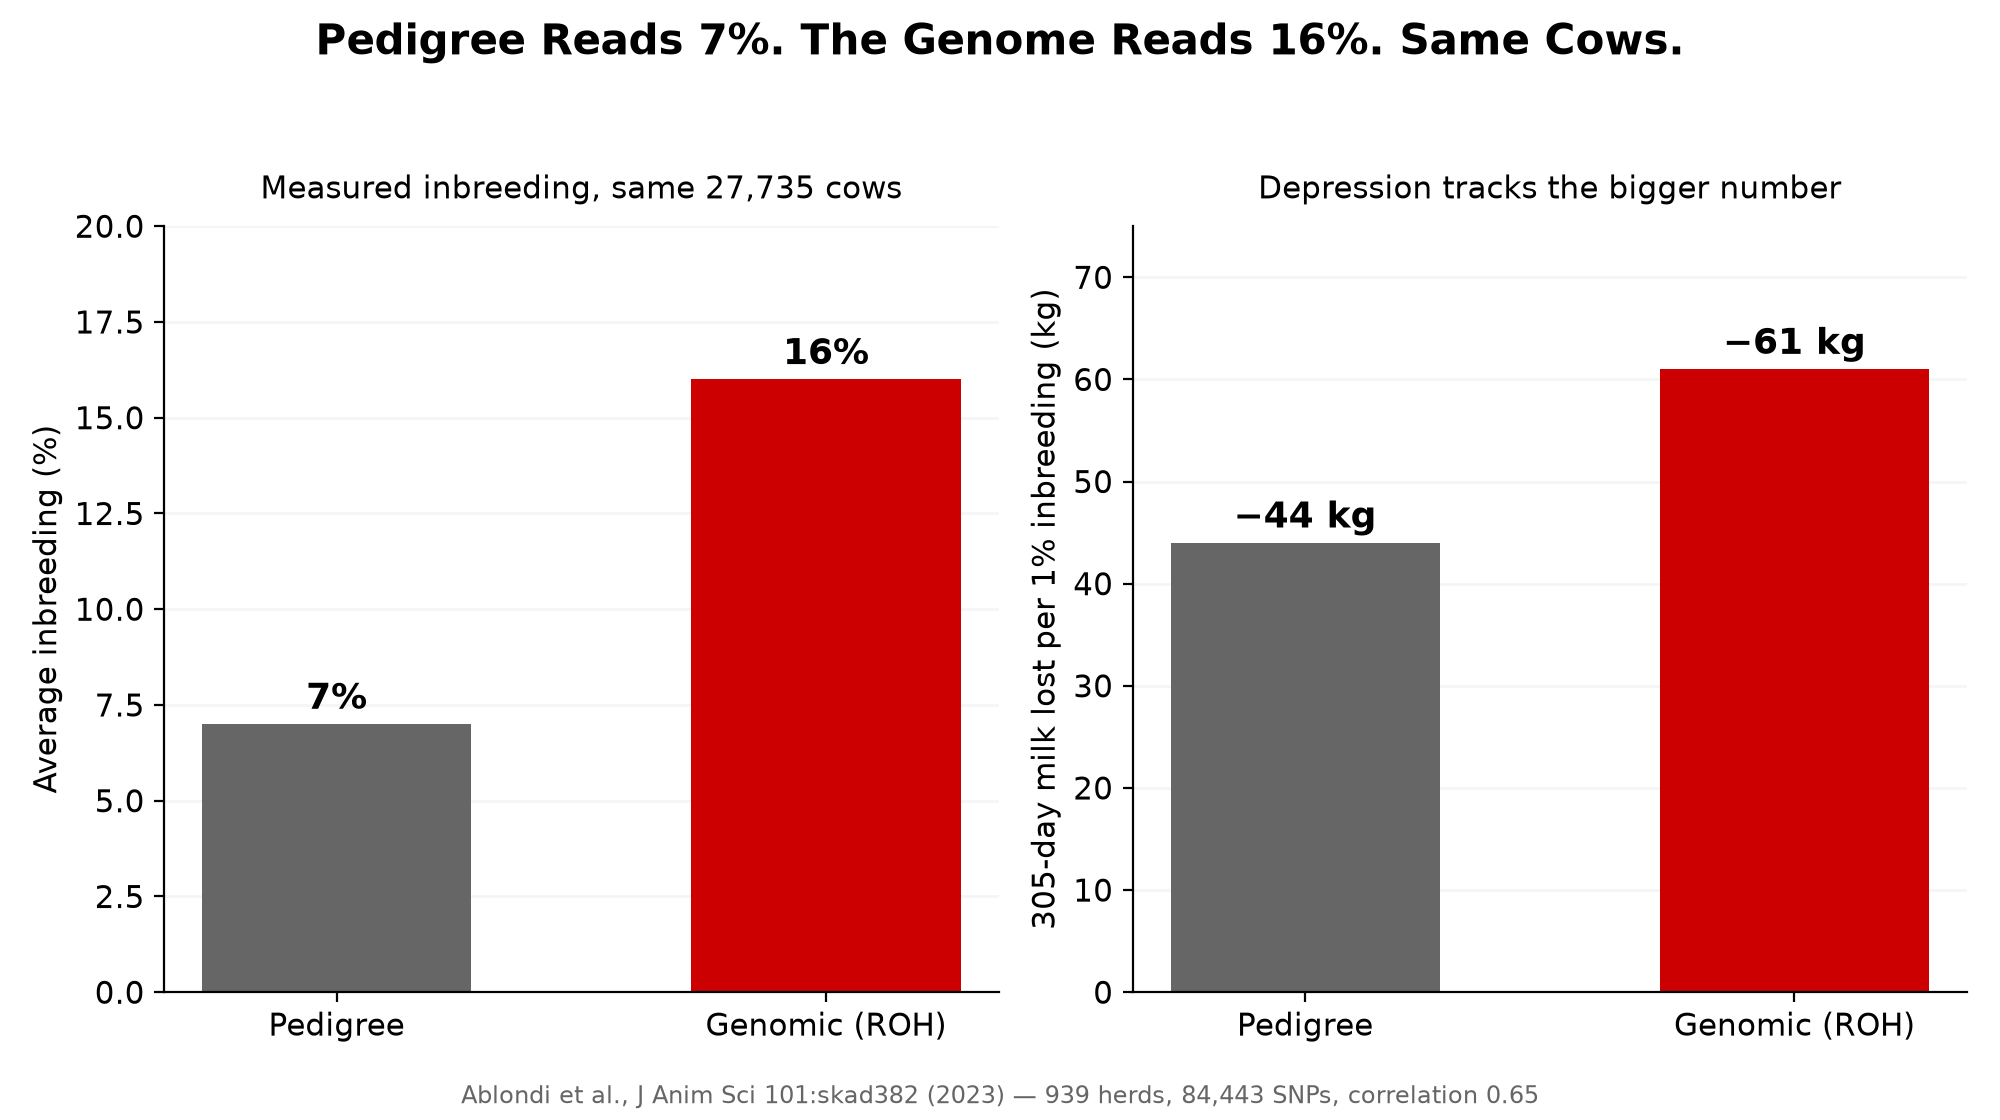
Once on pedigree — the way most mating programs still calculate it, working back through recorded ancestors. Once on genome, marker by marker across 84,443 SNPs. Pedigree came back at 7% average inbreeding. The genome came back at 16%.
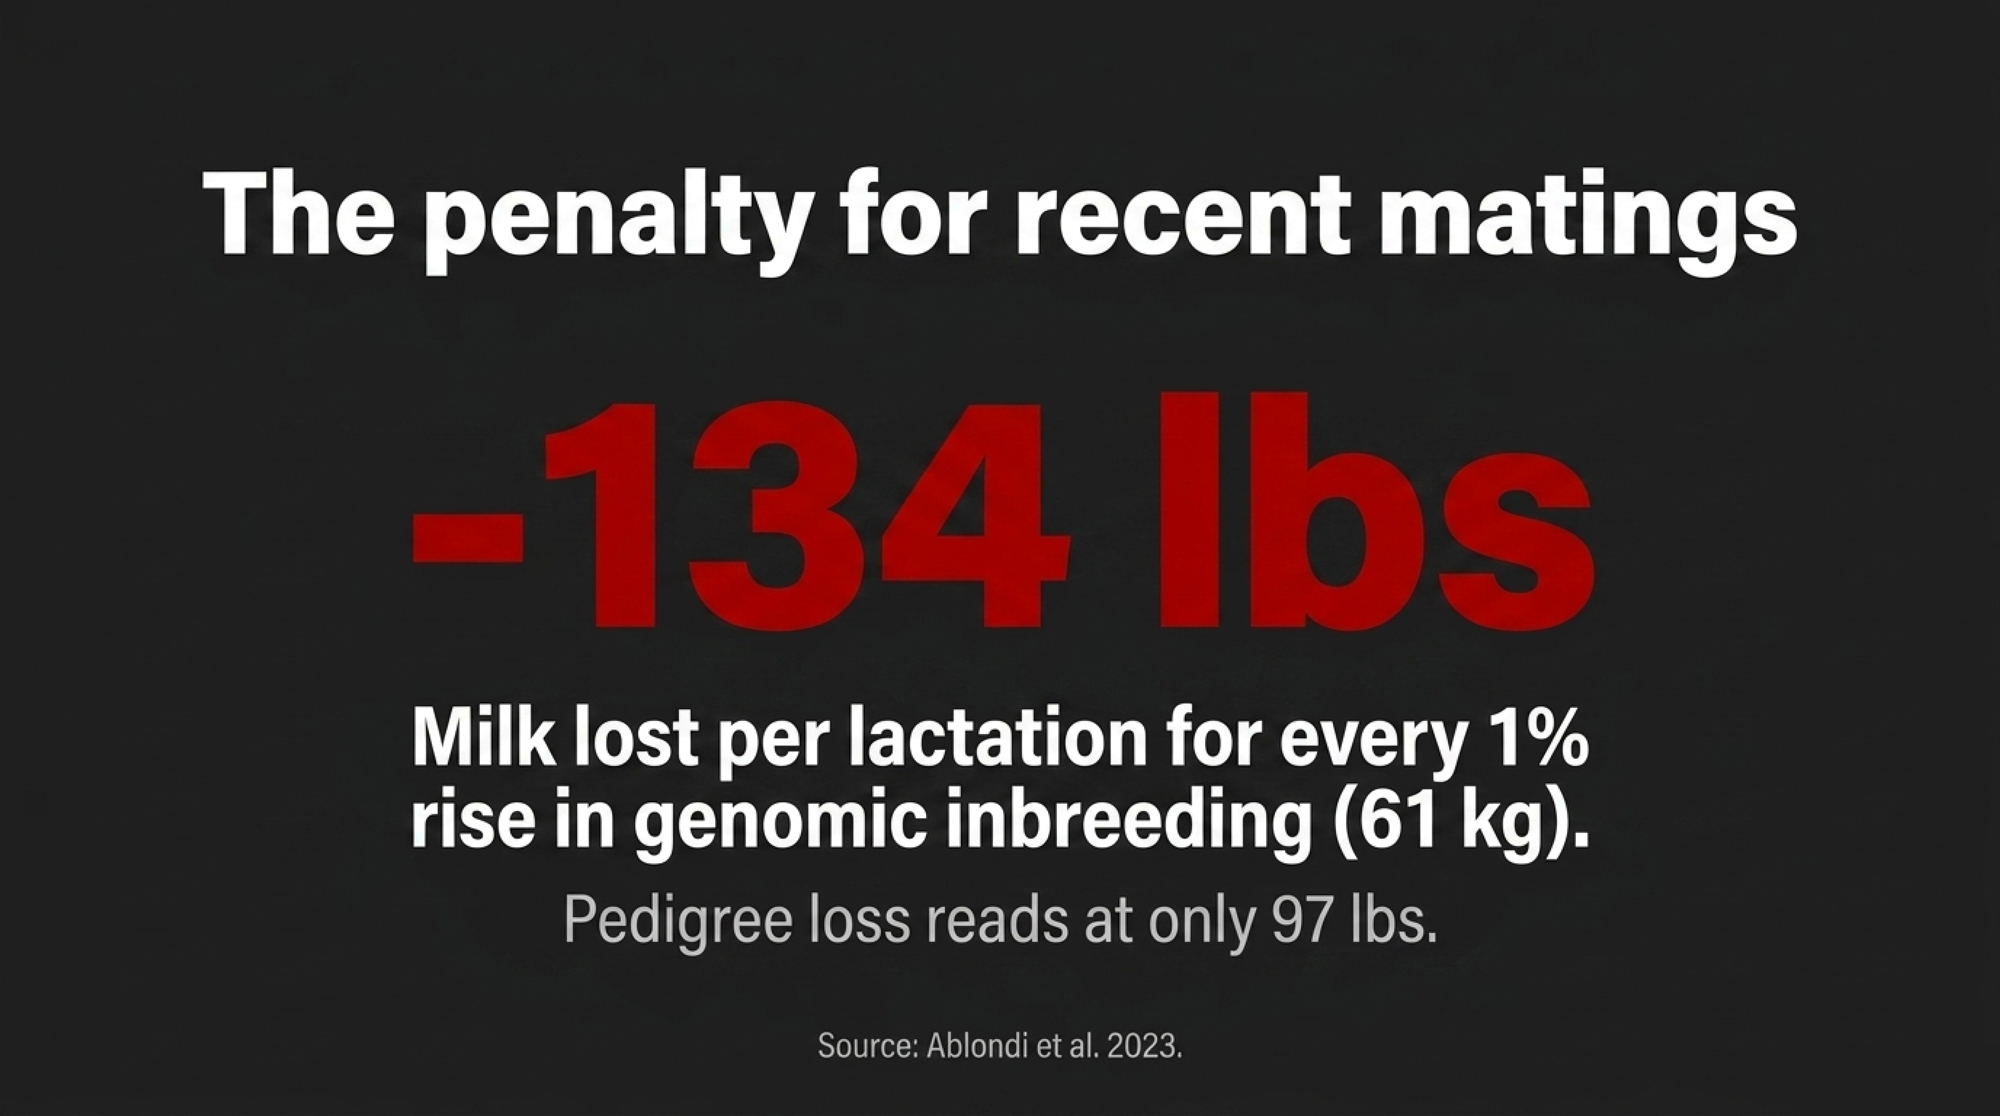
Then they checked which number the cows agreed with. Each 1% rise in pedigree inbreeding cost 44 kg (97 lbs) of 305-day milk. Each 1% rise in genomic inbreeding cost 61 kg — 134 lbs. Same animals, same lactations, and the depression tracked the bigger figure.
That’s the part worth sitting with, because Lactanet’s August 2025 figures put average inbreeding for Canadian Holstein heifers born in 2024 at 9.99%, climbing about a quarter point a year on a pedigree basis. If pedigree is the instrument reading low, then the number most producers are watching is not the number doing the damage.
Two Instruments, Same Cows, One Reads Low
The correlation between the two measures came in at 0.65. Related, nowhere near interchangeable. The reason matters: pedigree can’t see Mendelian sampling, and it’s only as good as the records behind it. Ablondi’s group had 24 generations to work with and a complete generation equivalent of 10.6 — deep by any standard — and pedigree still read less than half what the genome showed.
Your own two numbers won’t be 7 and 16 exactly. Ablondi’s herds had unusually complete records, and the size of your gap depends on your pedigree depth and how much recent breeding runs back through the same bulls. What won’t change is which direction the error runs. Pedigree reads low, every time.
Ablondi’s group also split inbreeding by age. Runs of homozygosity longer than 8 Mb — the fingerprint of recent inbreeding — carried the negative effect across every trait. Pryce and colleagues found the same thing in Australia a decade earlier with 8,853 Holsteins and 4,138 Jerseys: ROH over 3 Mb cut milk yield and captured recent inbreeding independently of overall homozygosity. Two teams, two continents, ten years apart. Recent inbreeding is what hurts.
In the U.S., Steyn and colleagues documented the annual increase accelerating from 0.11 percentage points a year between 2000 and 2008 to 0.36 between 2013 and 2021, working from CDCB data in the Journal of Dairy Science in 2022. Three continents, same direction.
The 143 Kilos You Paid For and Didn’t Keep
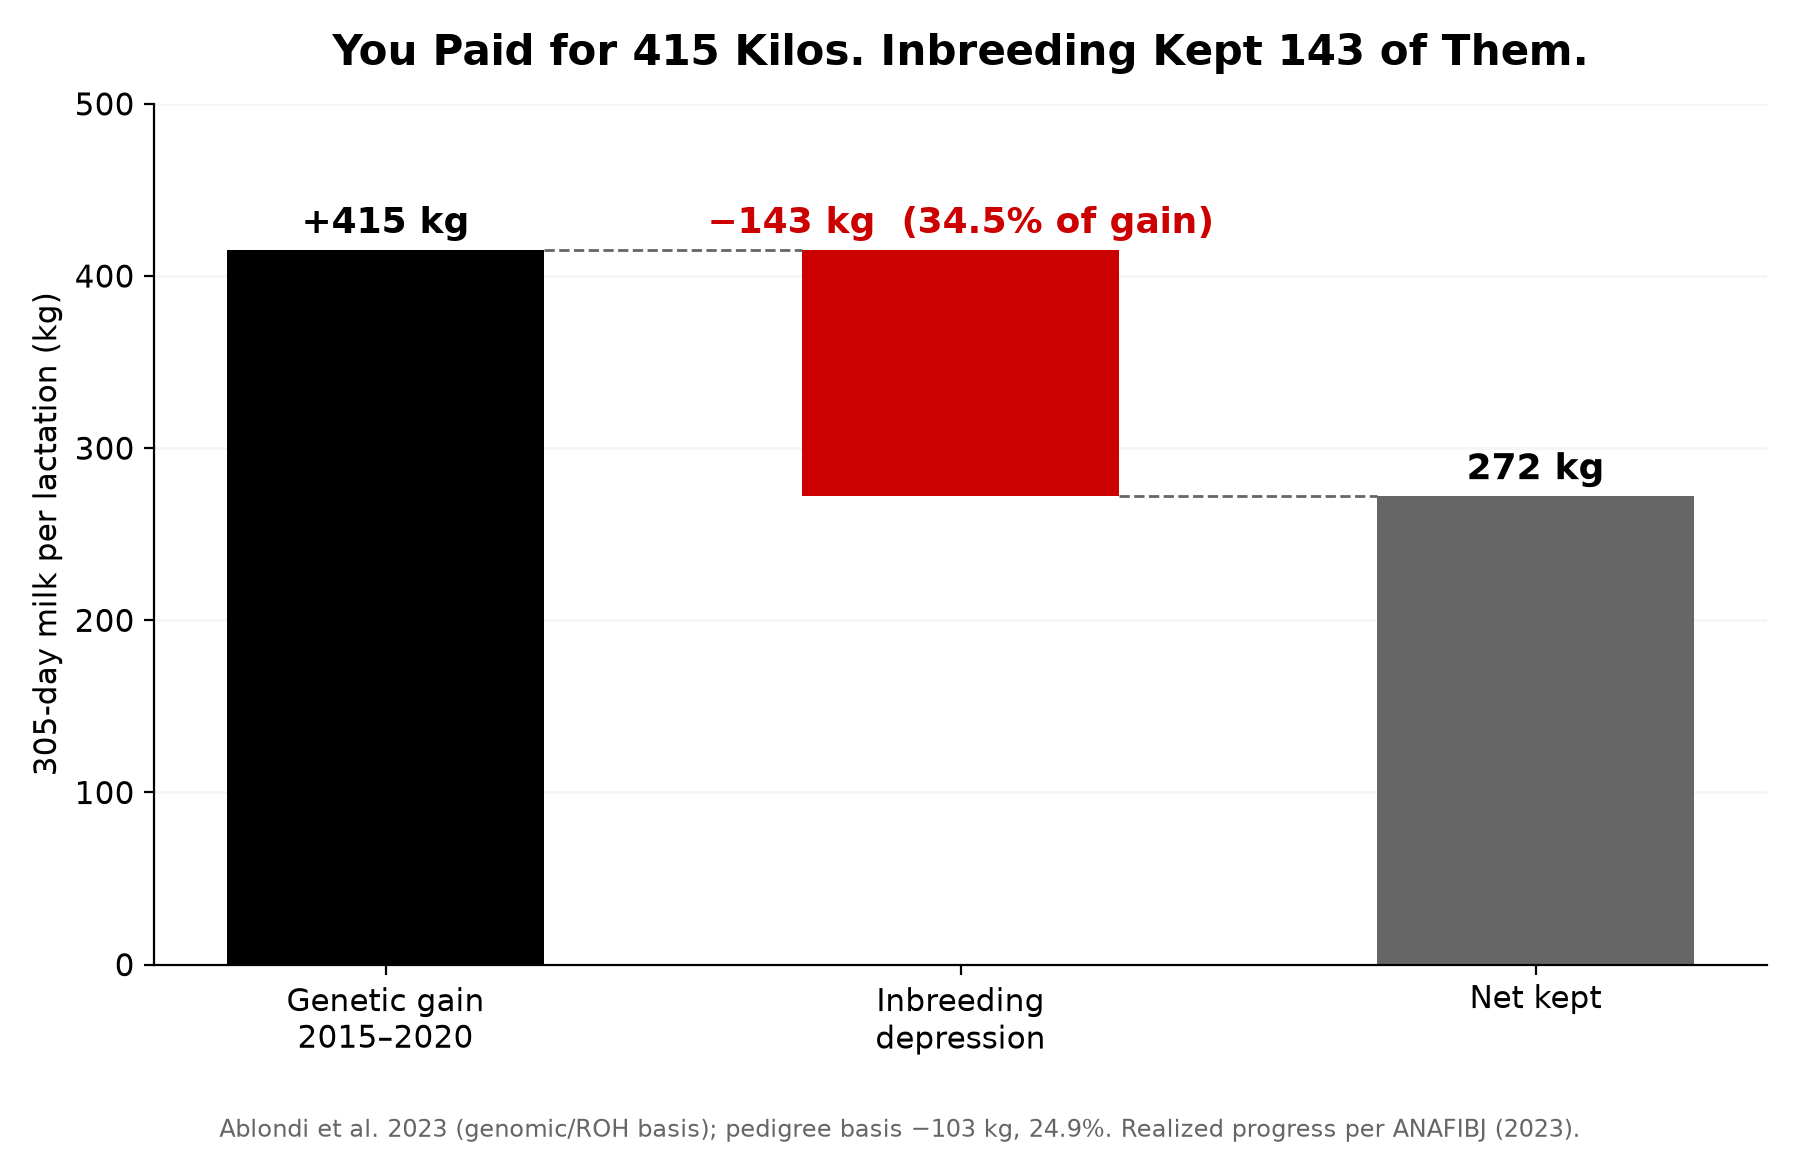
Now the cost at breed scale. Between 2015 and 2020, the Italian Holstein’s pedigree inbreeding climbed 2.35%. Realized genetic progress for milk came in at +415 kg (915 lbs) per lactation.
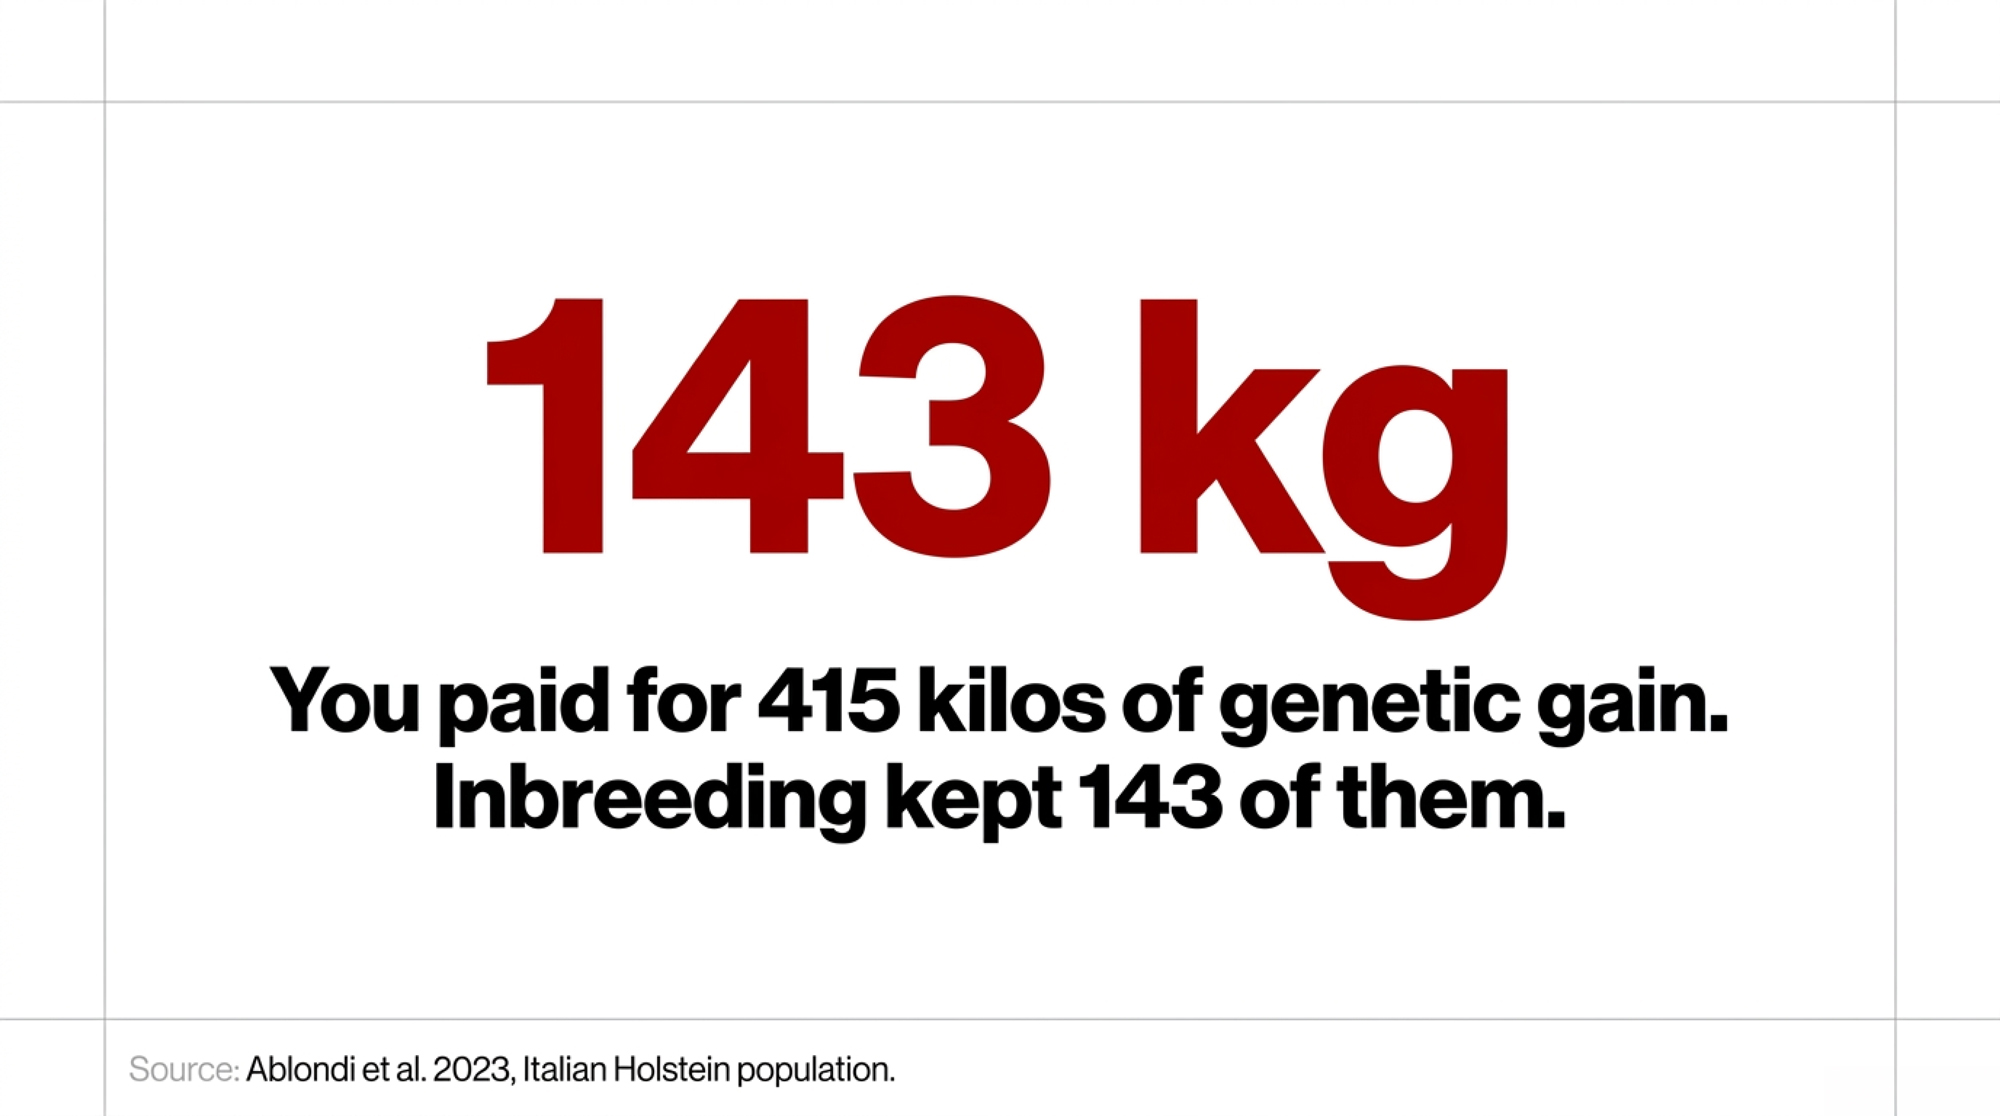
Inbreeding depression took back 143 kg — 315 lbs. That’s 34.5% of the gain.
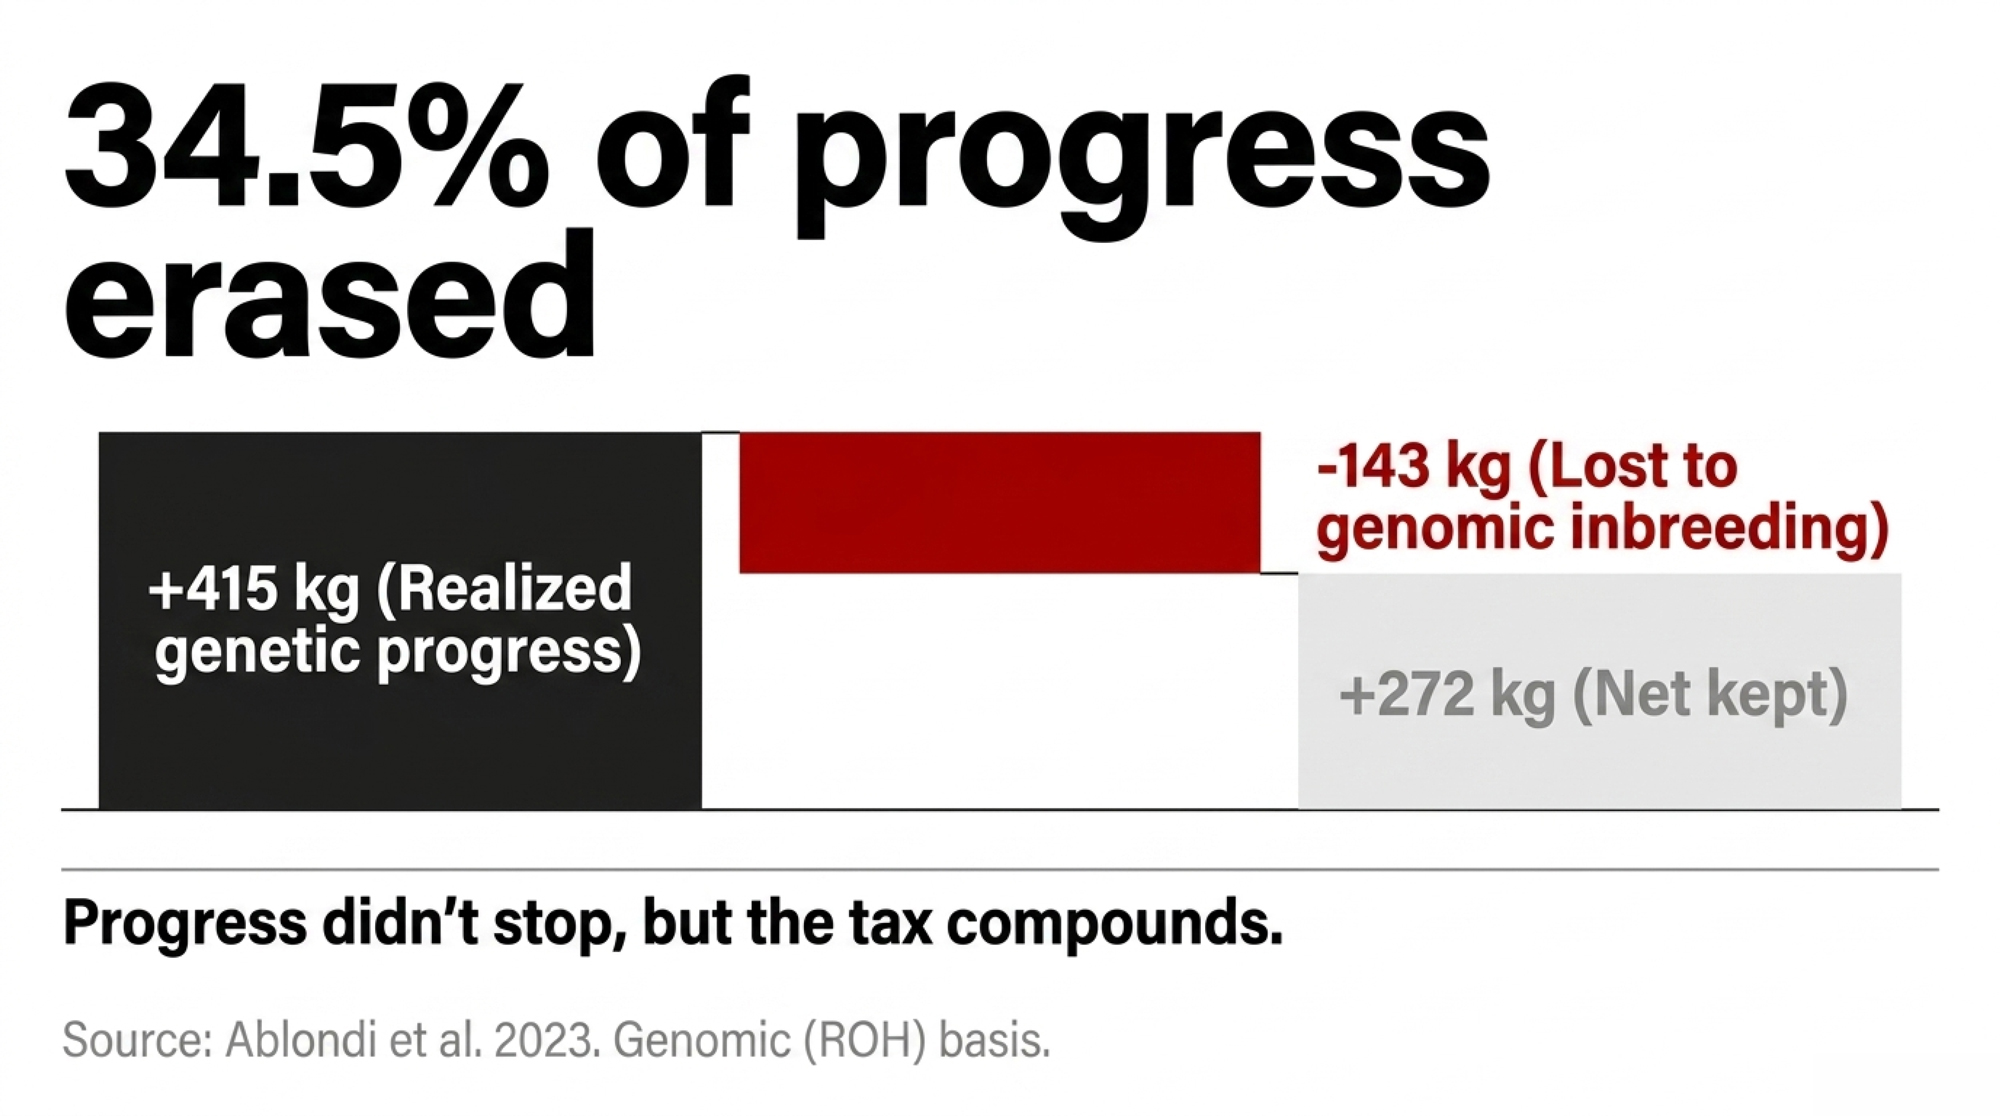
Be precise about what that means, because the authors are. Their own conclusion is that “the realized genetic progress has so far successfully counterbalanced the negative effect of inbreeding” for milk yield. The breed kept 272 kg net. Progress didn’t stop, and anyone telling you the Holstein is going backwards isn’t reading the paper.
What worries Ablondi’s group is the trajectory. The tax compounds, it lands on fitness traits this study didn’t even measure, and inbreeding is projected to climb faster in the generations ahead. Run the same arithmetic on the pedigree measure and you get a smaller bill — 103 kg, 24.9%. Two instruments, two answers again, and only one of them is telling you what your matings actually cost.
Compare the extremes and it gets uglier. Moving from the 5th-lowest to the 95th-highest inbreeding percentile cost 263 kg (580 lbs) per lactation on pedigree — 2.4% of the herd average — and 561 kg, 1,237 lbs, on genomics, or 5.2% of the herd’s 10,836 kg (23,890 lbs) average. Fat dropped 1.31 kg and protein 2.45 kg on the genomic measure.
What nobody can measure is which bulls are driving it, because no public database records where an AI sire came from.
Below the Line Where Fitness Erodes
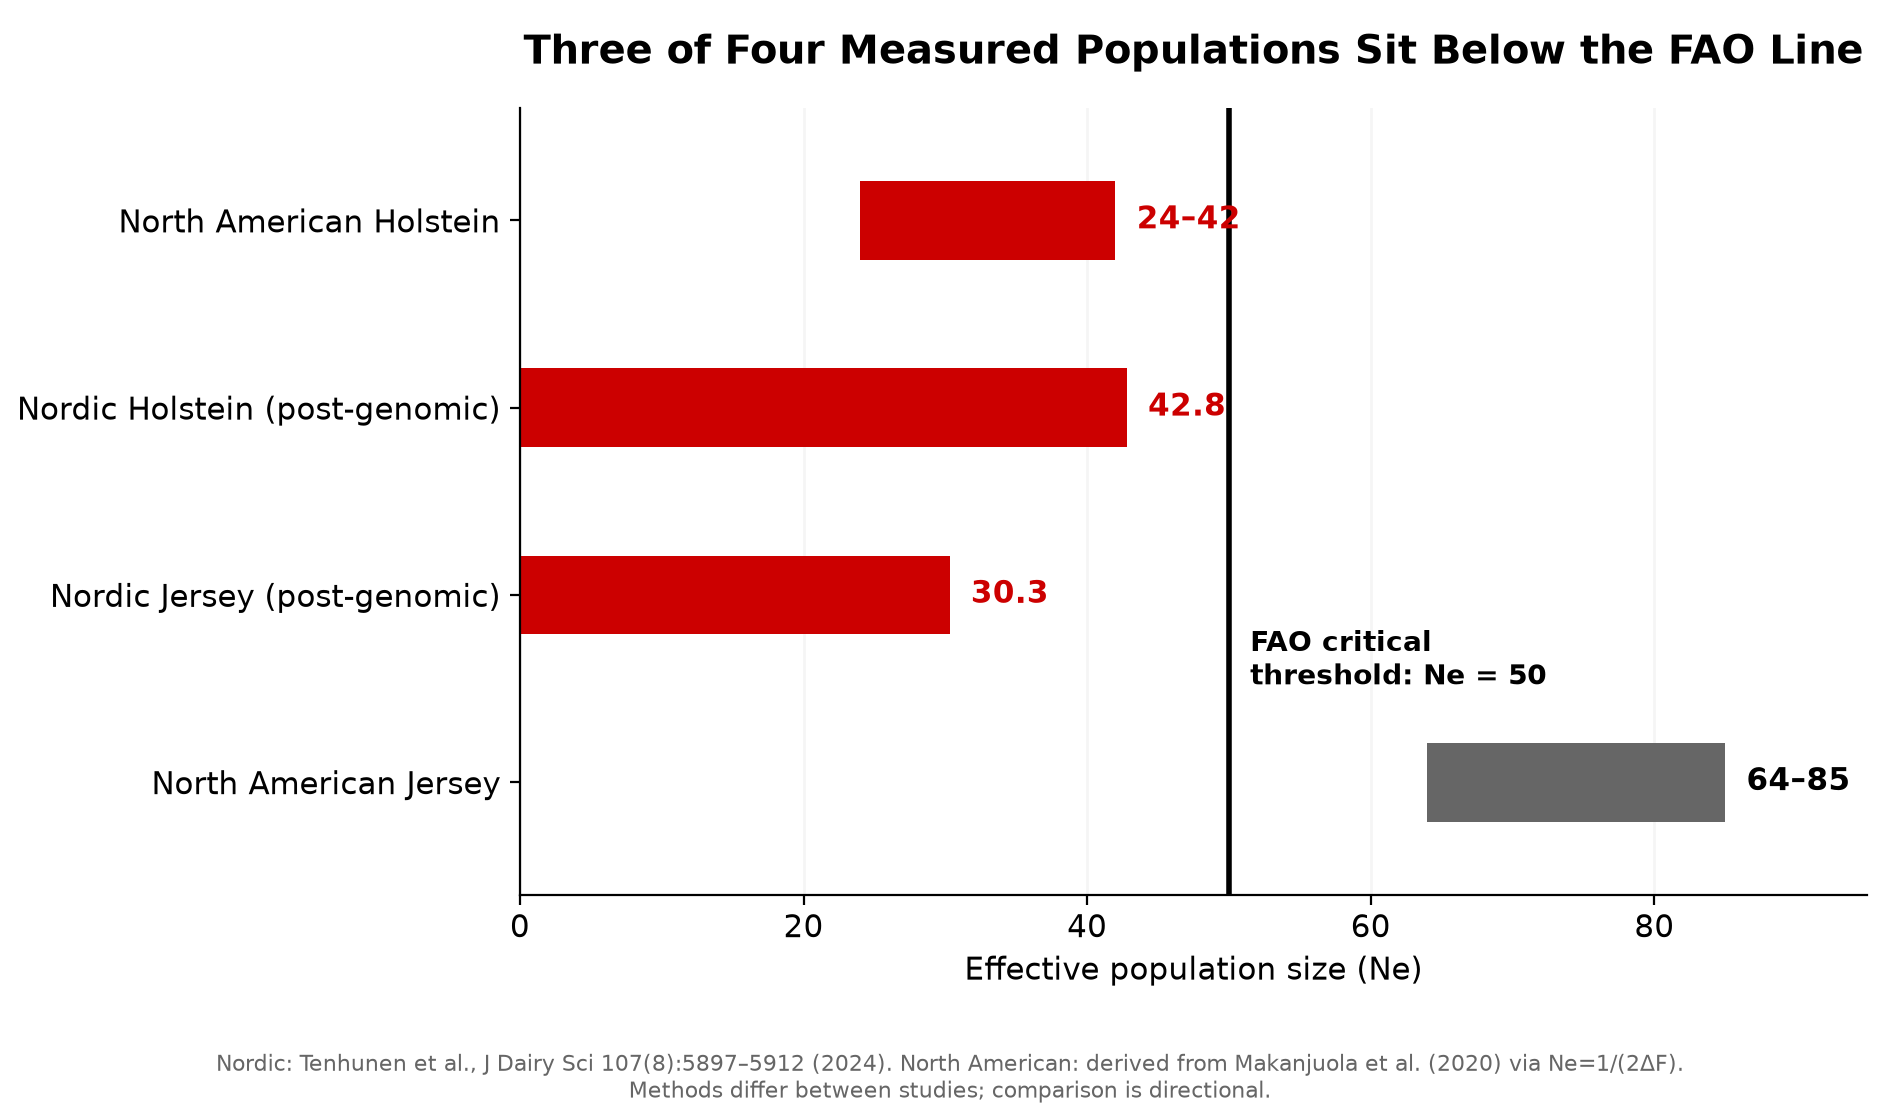
The FAO puts the critical effective population size at 50. Not 50 cows in a barn — 50 in the genetic sense, the number of breeding animals that would produce the inbreeding rate you’re actually seeing.
Makanjuola and colleagues measured it for North American Holstein and Jersey using Canadian Dairy Network records on 676,594 Holsteins, publishing in the Journal of Dairy Science in 2020. Across 1990 to 2018, Holstein Ne came in at 66 on pedigree and 43 to 46 on genomic measures. Jersey held up better at 64 to 85.
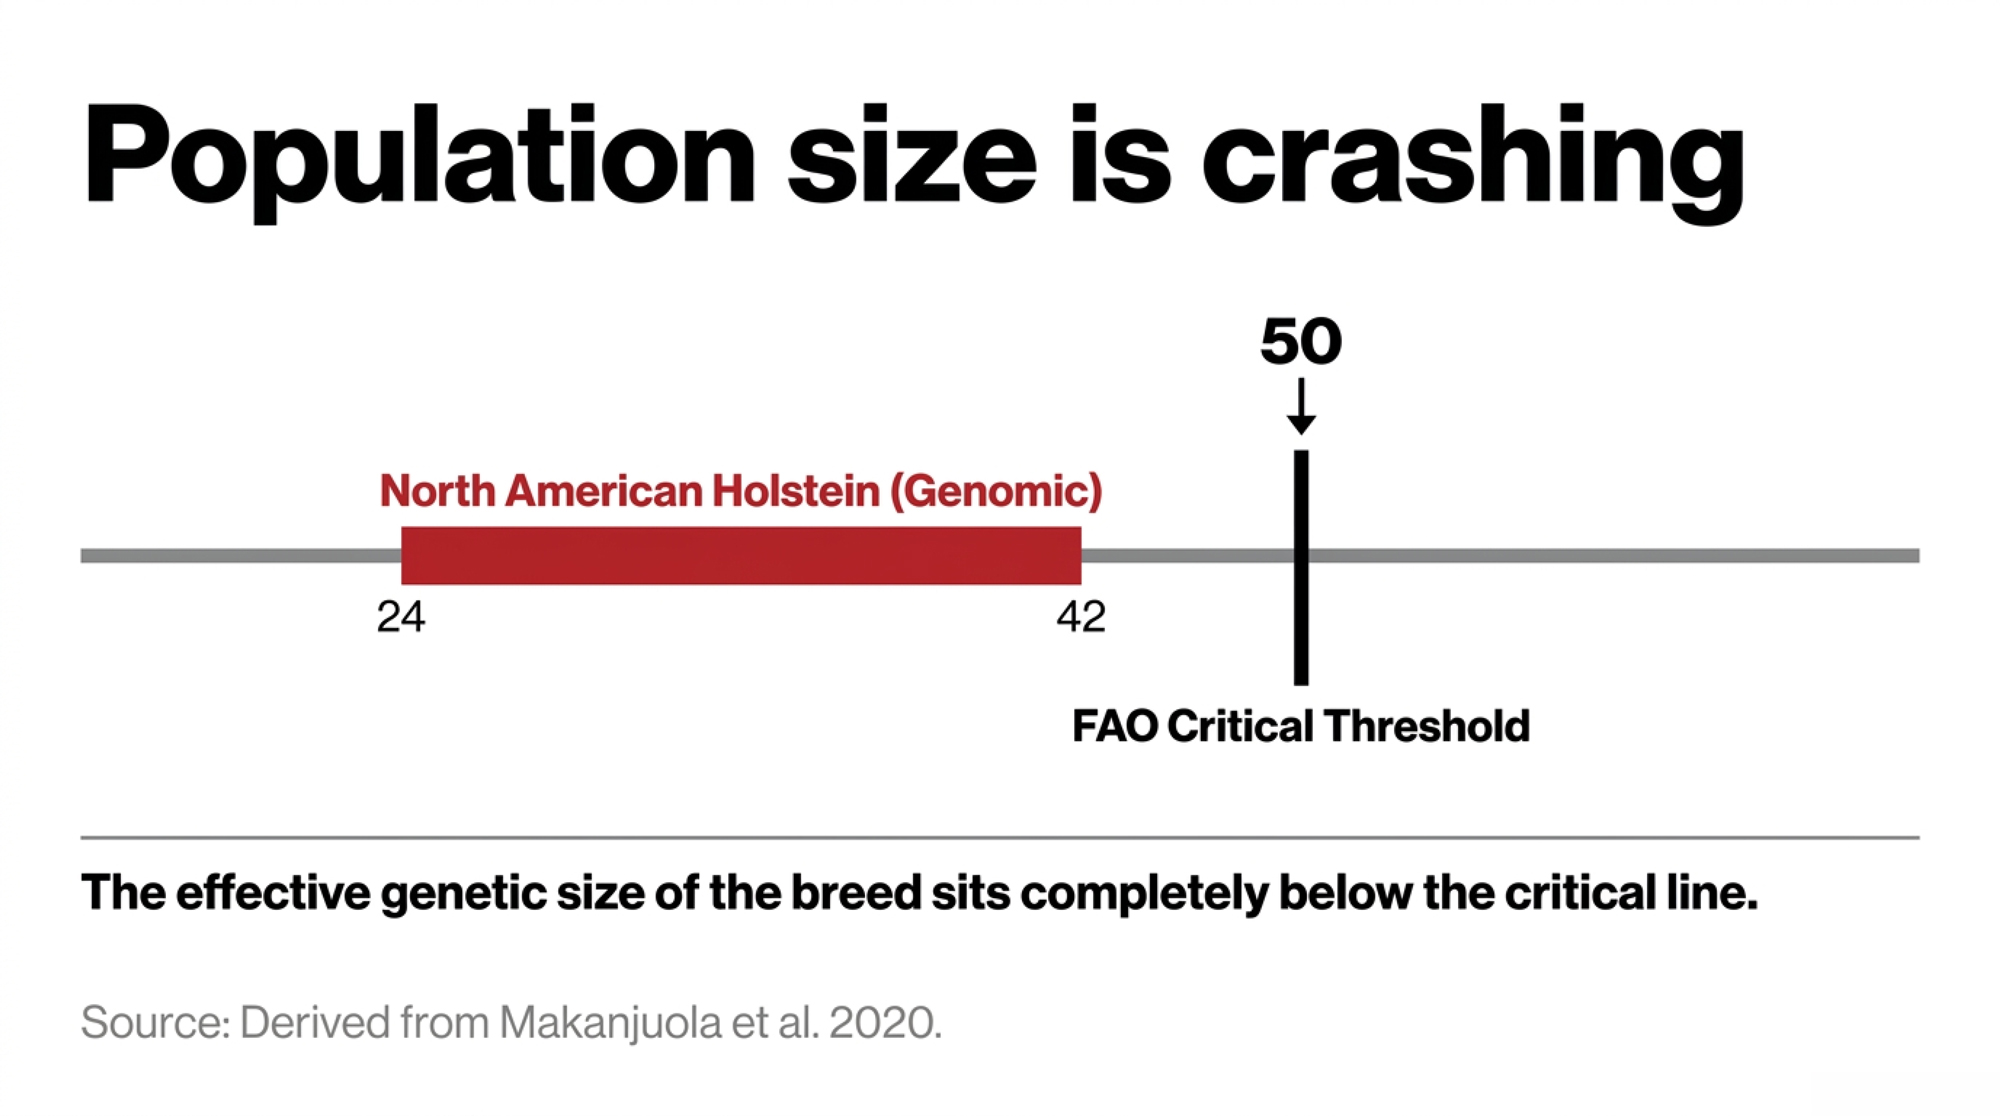
Narrow to the genomic-selection era and the rate of inbreeding per generation climbs to between 1.19% and 2.06%, depending on the measure. That puts Holstein Ne somewhere between 24 and 42.
Which is why you’ll never see an honest single number here. Pedigree and genomic measures disagree on the rate of inbreeding per generation by nearly a factor of two, so North American Holstein Ne isn’t a dot — it’s a corridor running from 24 to 42, and both ends sit under the FAO line. Same argument as the 7-versus-16 gap, one level up.
Behind it sits a generation-interval collapse. Holstein sires of bulls averaged 8.08 years in 1990 and 2.32 by 2016 — a 71% reduction. Guinan and colleagues documented the same trajectory in U.S. data on the sire-of-bulls pathway, 7.1 years down to 2.2.
Nordic populations get held up as the counterexample, and the picture is genuinely mixed. Tenhunen and colleagues found Nordic Holstein Ne falling from 54.3 before genomic selection to 42.8 after, with future Ne dropping from 198.8 to 42.7 and female coancestry rising from 0.02% to 0.39%. Their conclusion: Nordic Holstein “faces more pressing concerns.”
But read that comparison carefully. At 42.8, Nordic Holstein sits at the optimistic end of North America’s 24-to-42 corridor — better than the pessimistic read, roughly level with the generous one. Methods and study periods differ between the two papers, so treat it as directional, not a scoreboard. Nordic Jersey held essentially flat at 29.4 before and 30.3 after.
Against the FAO line the pattern is blunt. North American Holstein on genomic measures, Nordic Holstein, and Nordic Jersey all sit below 50. North American Jersey is the only measured population that clears it.
Can Anyone Tell You Where Your Next Bull Came From?
Not from anything published.
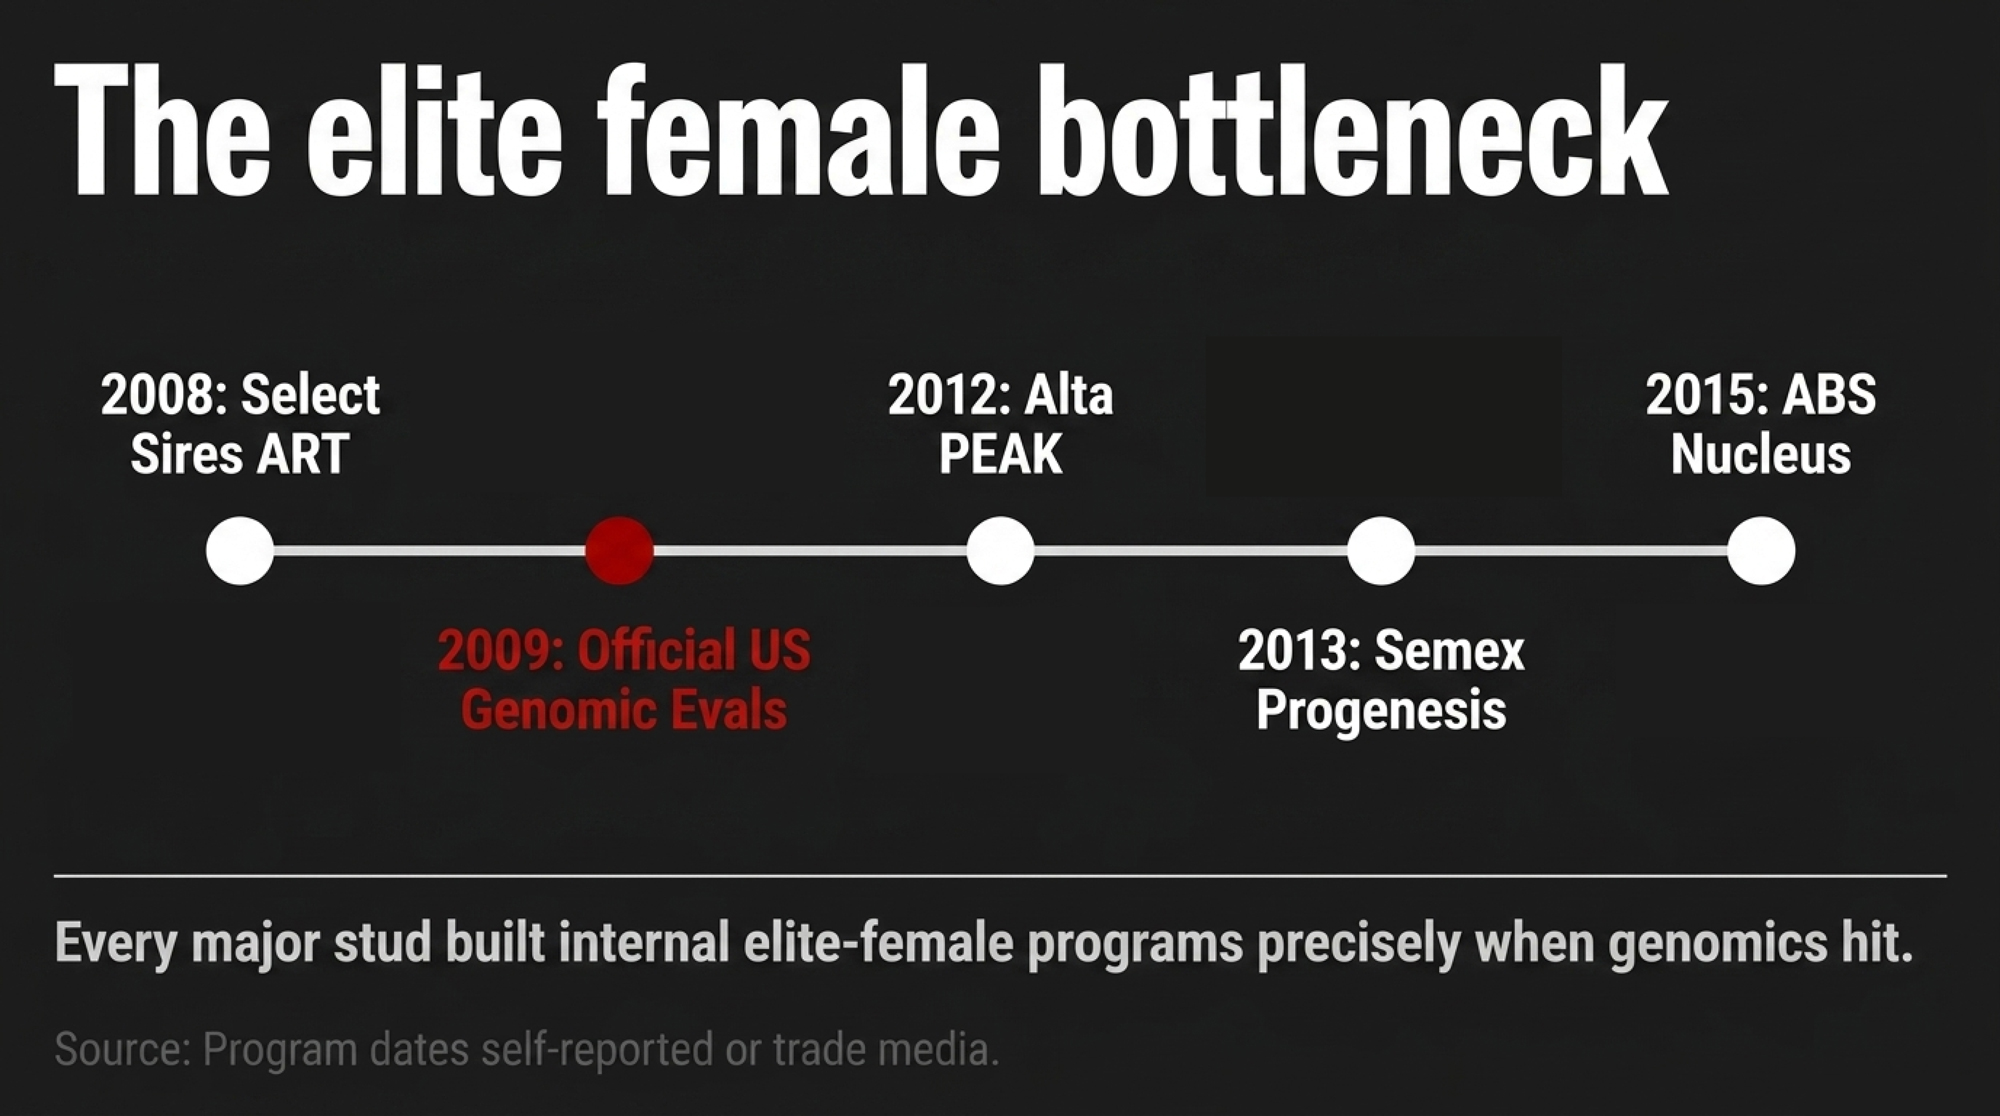
Every major stud runs an internal elite-female program now, and most say so openly. Select Sires launched ART in 2008, targeting Holsteins “genetically unique compared to those found in the general population.” Alta started PEAK in 2012 as its genetics development arm during a restructuring built around genomics, and PEAK joined URUS when that holding company formed in October 2018 — PEAK’s own materials date the entity to 2018. Semex founded Progenesis in 2013, calling it “Semex’s industry-leading internal dairy breeding program.” ABS Global shipped its first commercial units from an elite female nucleus herd in 2015.
Look at the dates. 2008, 2012, 2013, 2015 — every major stud built an internal elite-female program inside a seven-year window, and that window opens the year before USDA-AIPL published the first official U.S. genomic evaluations in January 2009. Four companies didn’t independently arrive at the same structure by coincidence. They read the same new tool the same way.
Four programs. One published split.
Select Sires puts roughly 40% of the Holstein bulls it samples each year as ART graduates, with 60% acquired from producers across the U.S. and Canada. That figure appeared in a January 2024 company post, and ART program manager Mark Kerndt repeated it on the record in a July 2025 Select Sires podcast, describing an internal female donor program running since 2008 and transferring roughly 15,000 IVF embryos a year. Two independent company sources, one of them a named executive speaking on tape.
Credit where it’s owed. That’s the only proportional sourcing figure any of the four has put in public, nobody made them do it, and it’s now better documented than anything else in this section. ABS, Semex and PEAK describe their programs without quantifying what share of released sires come through them — which leaves the one company that disclosed as the only one whose disclosure can be picked apart.
Semex says the Progenesis team “continues to add bloodlines that diversify the program.” That sentence is the whole problem in miniature. It’s substantive, it’s checkable in principle, and it’s unverifiable from outside. Semex may be entirely right. Nobody outside Semex can confirm it.
Past what companies volunteer, the trail goes cold. NAAB’s Semen Sales Report tracks units by breed and category, and we found no field recording origin. CDCB publishes proof runs and reliability figures on every sampled bull in the U.S. system, and we located no public output sorting sires by nucleus, contracted, or open-market origin.
The Counterweight Nobody Expected
Here’s what complicates everything above.
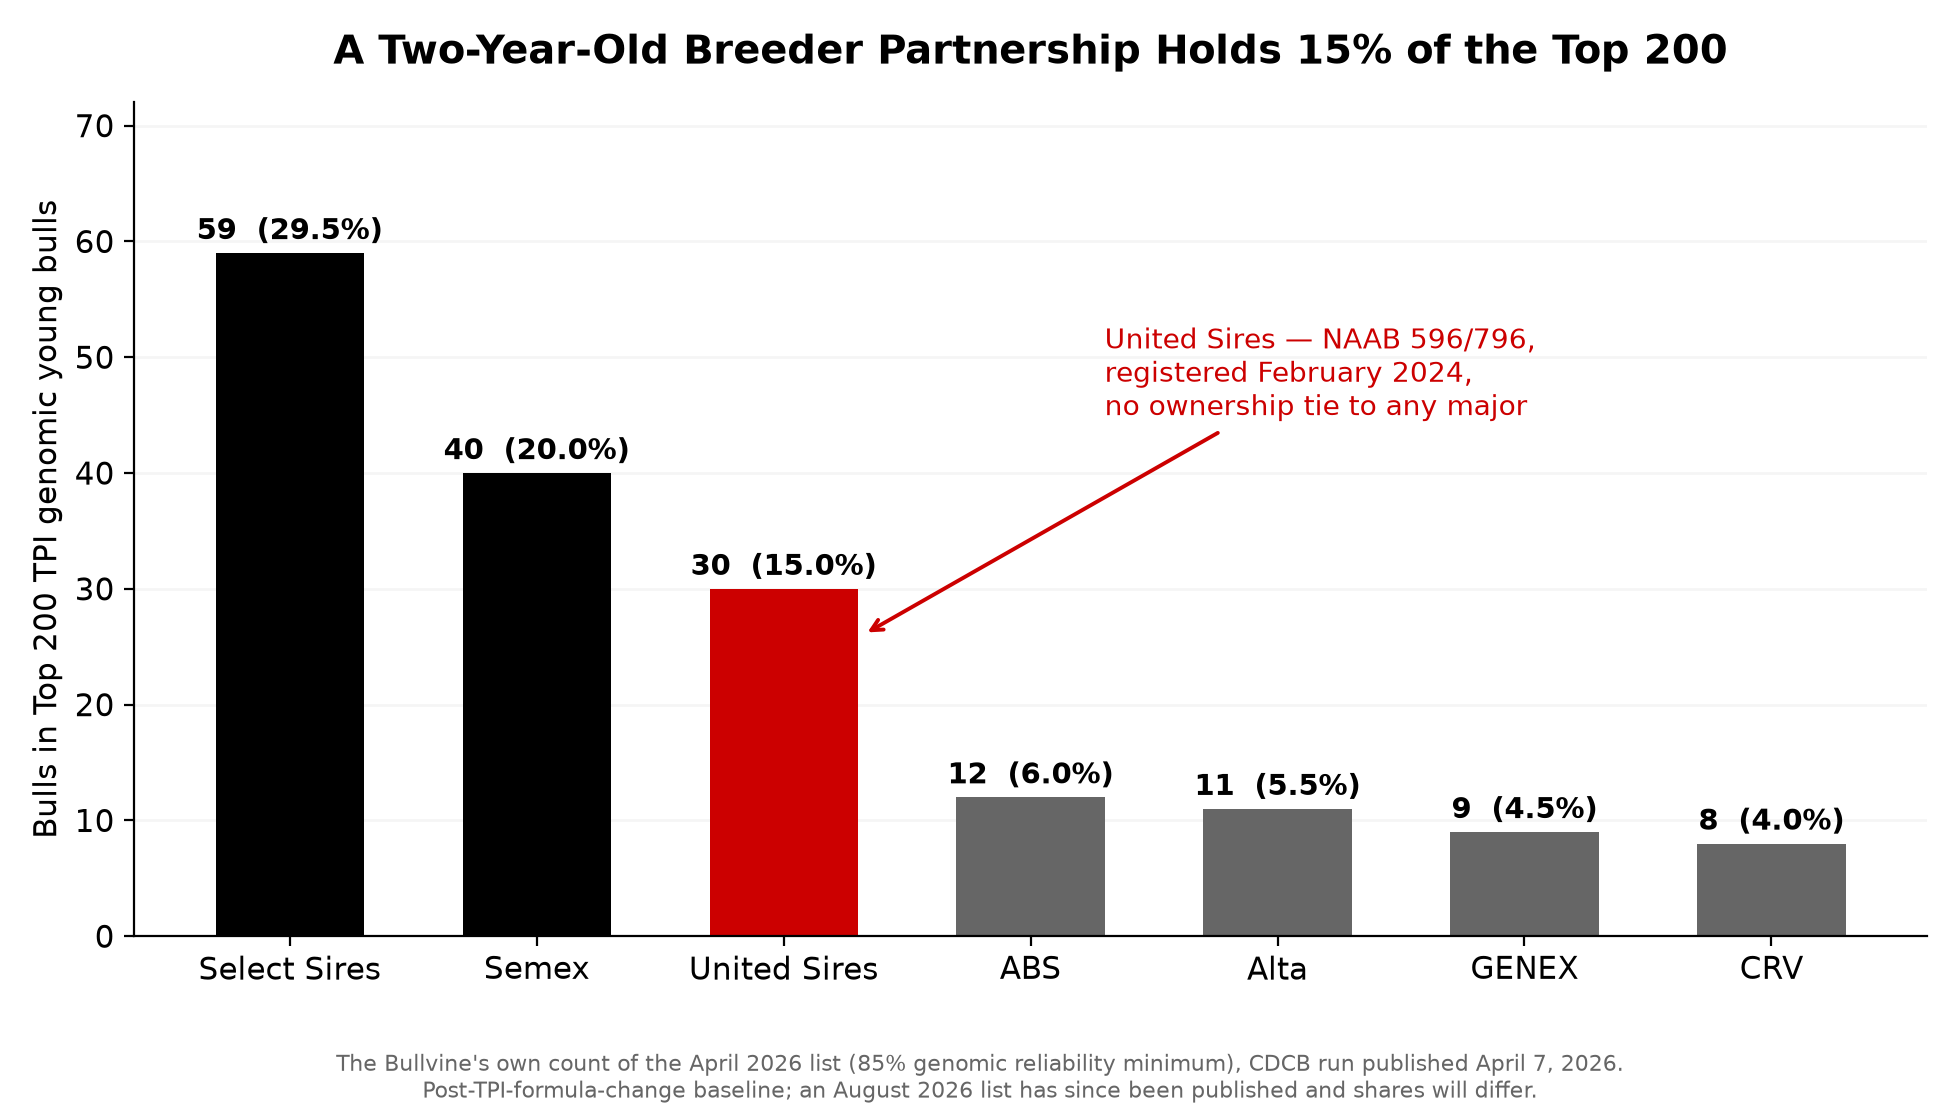
United Sires — NAAB codes 596 and 796, registered with NAAB in February 2024 — is an independent breeder partnership with no ownership tie to any of the majors. By The Bullvine’s count of Holstein Association USA’s top 200 TPI genomic young bulls — 85% genomic reliability minimum, from the CDCB run published April 7, 2026 — it holds 30 of them, 15%. That’s third behind Select Sires’ 59 (29.5%) and Semex’s 40 (20%), and ahead of ABS at 12, Alta at 11, GENEX at 9 and CRV at 8.
We’re citing April rather than the August 2026 run on purpose. April is when Holstein Association USA changed the TPI formula, shifting production weights from 19% protein and 19% fat to 24% protein and 14% fat, and it’s the snapshot that isolates what that change did to the standings. Bulls moved as much as 125 points in either direction without a single new daughter. Same bulls, same daughters, different instrument — the third time in this article that swapping the measuring tool has swapped the answer. Holstein Association USA has since published an August 2026 list, and the shares will have shifted some with it; treat the April figures as the post-formula-change baseline rather than today’s standings.
So whatever’s happening to the independent breeder, “shut out” doesn’t cover it. The pipeline is concentrating and a two-year-old breeder-owned partnership just took 15% of the top of the list. Both are true. Neither reconciles without the origin data nobody publishes — if the nucleus programs are as dominant as their scale implies, United Sires shouldn’t rank where it does.
Worth knowing what the modelling said before any of this got built. Dekkers and Shook, at Wisconsin-Madison, modelled nucleus schemes for commercial AI firms in the Journal of Dairy Science in 1990 (73:1920). Their finding, replicated since and echoed in Roden’s 1994 review: opening a nucleus raises both the intensity and the accuracy of female selection, and open systems deliver a higher rate of genetic gain than closed ones. They also found closed schemes could stay competitive at large nucleus sizes — so the easy version, closed bad and open good, is only half right. Design matters more than the label, which is exactly why the design should be public.
What It Costs, Country by Country
Four populations have been measured for inbreeding depression. Every one is negative:
| Study | Population | Per 1% inbreeding increase |
| Ablondi et al. 2023 | Italian Holstein, 27,735 cows | −61 kg 305-day milk (ROH); −44 kg (pedigree) |
| Doekes et al. 2019 | Dutch Holstein-Friesian, 38,792 first-parity cows | −36.25 kg (ROH); −37.95 kg (pedigree); −48.07 kg (genomic relationship) |
| Bjelland et al. 2013 | U.S. Holstein, University of Wisconsin | −20 kg 205-day milk (ROH); −47 kg (genomic relationship); −53 kg (percent homozygosity) |
| Pryce et al. 2014 | Australian Holstein and Jersey, 12,991 genotyped cows | −0.4% to −0.6% of phenotypic mean for milk, fat and protein |
Figures as published. Multiply kg by 2.205 for pounds — 61 kg is 134 lbs, 36.25 kg is 80 lbs, 20 kg is 44 lbs.
Pryce’s framing is the one to run on your own operation, because it scales to whatever you produce. At 0.4 to 0.6% of the mean per 1% of inbreeding, a decade at the U.S. rate — 0.36 points a year, 3.6 points total — costs 1.4% to 2.2% of your herd average. On a 12,000 kg (26,455 lbs) herd, that’s 170 to 260 kg — 375 to 573 lbs — per cow, per lactation.
Ablondi’s team costed it in terms their readers feel immediately. Eighty percent of Italian milk goes into cheese, so they priced the loss in Parmigiano Reggiano — the country’s second-largest PDO consortium, 160,097 tonnes in 2022. Between the most and least inbred 5% of cows, the difference came to over half a wheel per cow per lactation on pedigree and more than a full wheel on genomics. Roughly €310 and €600 — about $360 and $700 USD, or $495 and $960 CAD, at 24-month-aged prices.
Pryce’s group mapped the damage to specific regions, finding stretches that cost up to 260 L of milk and 12.5 days of calving interval when fully homozygous. Ablondi’s team saw the same chromosome by chromosome — 16 of 29 autosomes carried a measurable hit to milk yield, with BTA14 the worst at −3.53 kg per 1% of homozygosity on that chromosome alone.
Bjelland’s U.S. work adds a cost that usually gets filed under calving management: stillbirths rose 0.25% for bull calves and 0.20% for heifer calves per 1% increase in inbreeding.
Doekes explains why recent matings matter most. New inbreeding — alleles identical-by-descent for the first time — cost 2.42 kg (5.3 lbs) of fat per 1%. Ancestral inbreeding cost essentially nothing, +0.03 kg. The damage lives in the matings you’re making right now.
The Tools You’re Probably Underusing
| Tool | What It Measures | Data Basis |
| CDCB Expected Future Inbreeding (EFI) | Population-level inbreeding impact | Pedigree relationship to heifers born in the past 48 months; adjusts PTA accordingly |
| Genomic Future Inbreeding (GFI) | True genomic relationship | Direct DNA marker overlap; consistently higher and more realistic than EFI |
| Lactanet Inbreeding Calculator | Mating-specific inbreeding and parent average | Pedigree-based; flags haplotypes and genetic conditions (LactanetGen.ca) |
The EFI-versus-GFI choice isn’t academic. Makanjuola’s team found the correlation between pedigree and genomic inbreeding in Holsteins weakening materially across the period they studied — pedigree is getting worse at tracking reality, not better. Pryce’s conclusion was blunt: genomic measures can replace pedigree for estimating depression, using either the genomic relationship matrix diagonal or the proportion of homozygous SNPs.
Genomic-testing your females and then mating off pedigree inbreeding means managing to the number that understates the problem. That’s the whole finding, in one sentence.
One stud has published constraint evidence. C. Sun and colleagues at STgenetics presented Chromosomal Mating at ADSA in 2019 — a linear-programming system built on CDCB genomic relationship files covering 5,731 bulls and more than 1.3 million females, against a pedigree database of over 5 million animals. They reported average progeny predicted producing value up 17% and inbreeding down 30% against random mating.
Their design choice is the interesting part. Rather than setting a hard inbreeding ceiling, the system prices inbreeding as an economic penalty inside the optimization — a defensible way to handle a variable nobody has set a herd-level limit for. It’s also a company-authored conference abstract, seven years old and not independently validated, which is how you should read it.
Two Ways to Buy Pedigree Distance
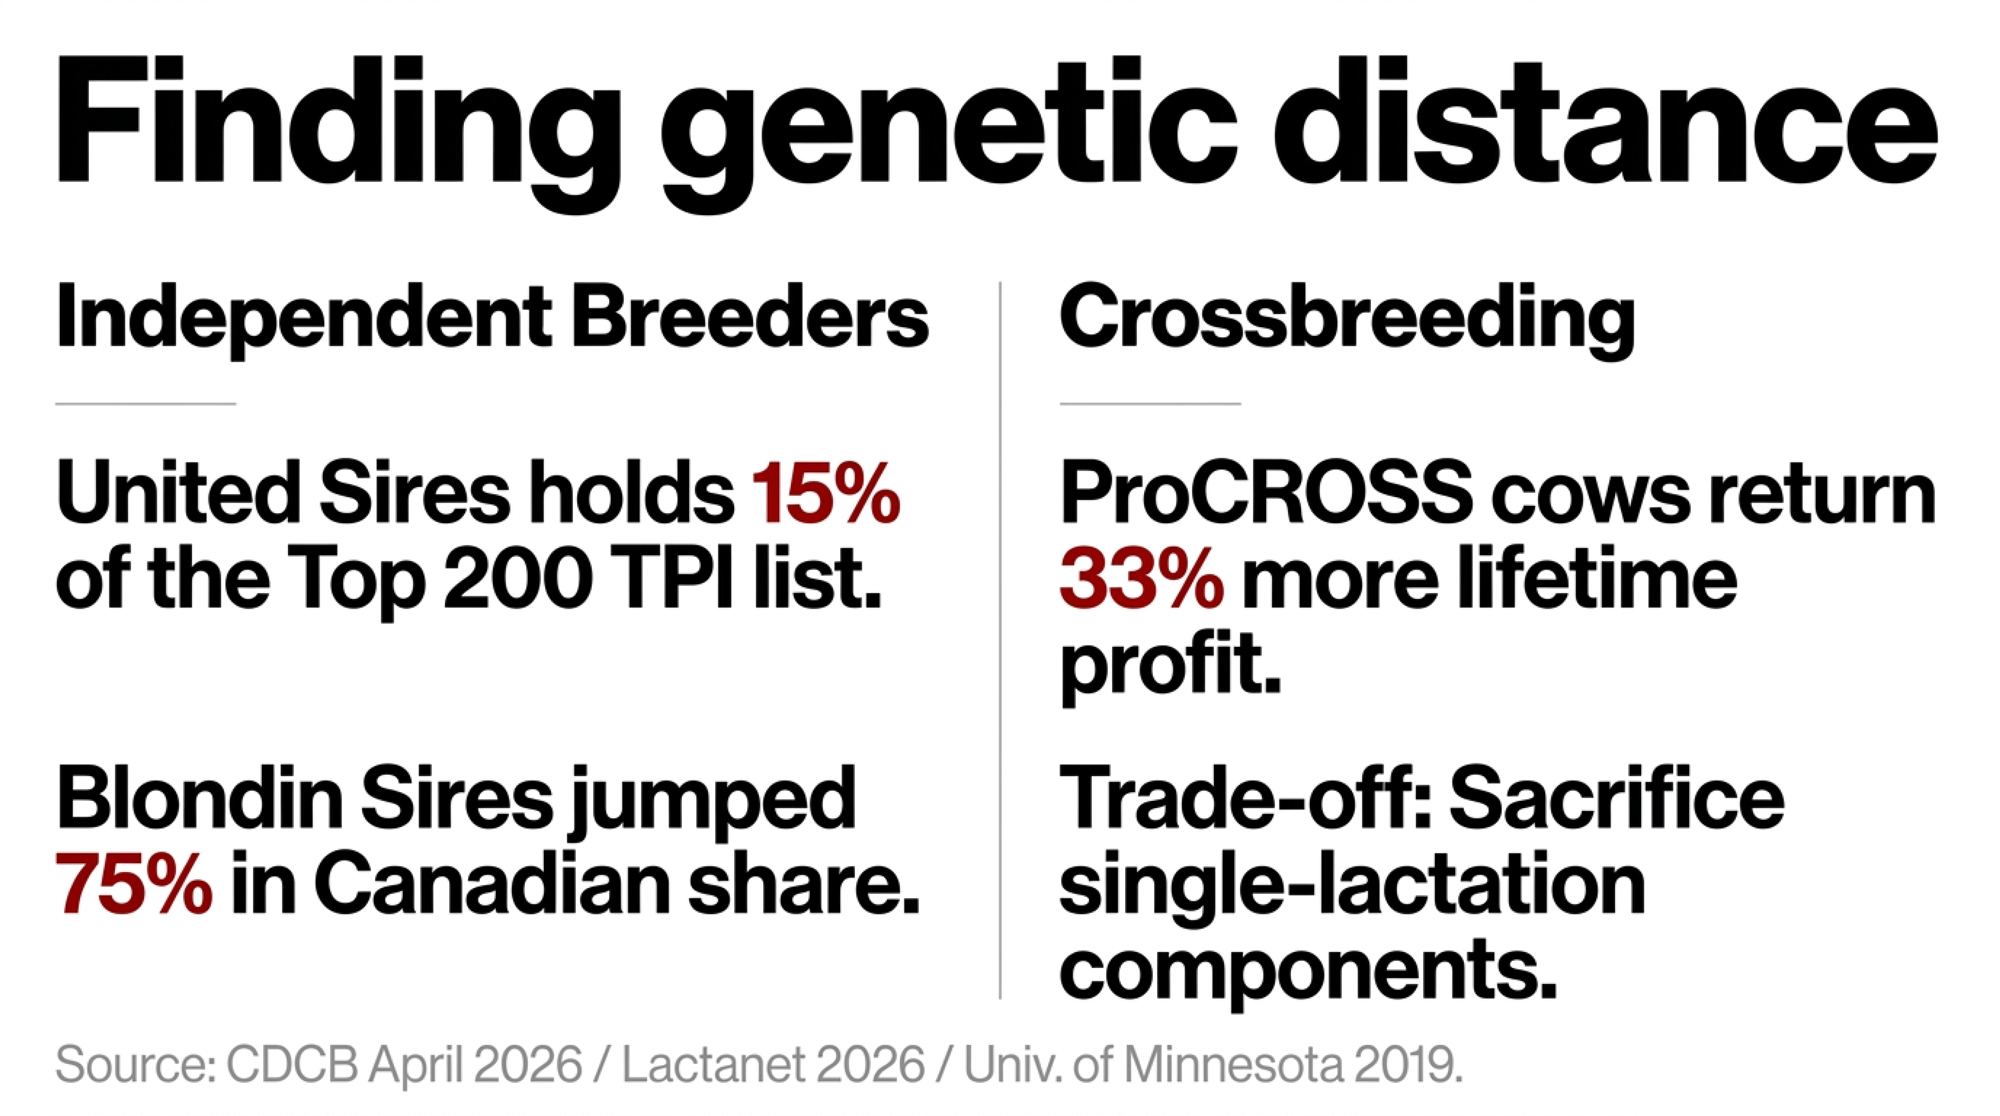
One route stays inside the breed, and there’s a working example of it in Quebec. Blondin Sires — NAAB code 799, owned by Simon Lalande, Dann Brady and Nicolas Lalande — grew its share of Canadian sire usage from 2.8% in 2022 to 4.9% in 2023, a 75% jump in one year per Lactanet market data reported by The Bullvine in February 2026. The pitch is separation from the mainstream stack while staying Holstein; they prioritize proven performance in both conformation and productio, and use different sires than those targeting the top TPI or NM$ lists.
Be sure to check out our article with Dann Brady and team on their breeding strategy tomorrow.
United Sires’ 15% share of the top 200 says there’s more room in that lane than the concentration story implies. The trade-off is real, though: independent-sourced bulls may carry lower reliability figures, and you’re still drawing from a gene pool whose effective size sits under the FAO line.
Going across breeds has a decade of peer-reviewed production data behind it. VikingGenetics’ ProCROSS rotates VikingHolstein, VikingRed and Coopex Montbéliarde, and a ten-year University of Minnesota study led by Les Hansen with Amy Hazel and Brad Heins measured it in high-performance Minnesota herds. ProCROSS cows returned 33% more lifetime profit and more daily profit — 13% for two-breed crosses, 9% for three-breed. Forty-one percent reached a fourth lactation against 21% of the Holsteins.
They also stayed 147 days longer, though Hansen’s own conference presentation of the combined two- and three-breed groups puts that at 153. Conception rate to first service in second and third lactation ran 45% against the Holsteins’ 35% — 1.9 services instead of 2.4. Health treatment costs came in 23% lower for two-breed crossbreds and 17% lower for three-breed across their lifetimes, with cull value 16% higher.
What does all that do to income over feed cost? Shonka-Martin and colleagues published twice in the Journal of Dairy Science in 2019, and the numbers favour the crossbreds. First-lactation crossbreds ate 2,807 kg (6,189 lbs) of dry matter over 4 to 150 days in milk against the Holsteins’ 2,948 kg (6,499 lbs) — about 5% less — with a further 6.5% reduction later while producing the same fat plus protein. Income over feed cost ran $0.34 to $0.60 higher per cow per day.
Read the inbreeding claim carefully, though. VikingGenetics’ ProCROSS material tells producers there are “no worries about inbreeding,” and for the crossbred animal in front of you that’s essentially right — heterosis does the work. It doesn’t mean the source populations are exempt. “No worries” is marketing shorthand, and the company’s own researchers documented real pressure on those source populations. They documented it in a peer-reviewed journal, which is the opposite of hiding it.
The component question depends entirely on your basis, and this is where a lot of crossbreeding arguments go sideways. On a single 305-day lactation, crossbreds produced less fat plus protein than purebred Holsteins in the Minnesota work — 24 kg (53 lbs) less for Montbéliarde crosses, 29 kg (64 lbs) less for Scandinavian Red. Across a lifetime the picture flips: daily fat plus protein ran 1% higher for two-breed crossbreds and 1% lower for three-breed, because they stuck around long enough to make it up. A rotation is also a multi-year commitment you can’t reverse next season, and crossbred replacements are harder to move if you sell breeding stock.
Then weigh all of it against a replacement market that punishes mistakes. USDA put the U.S. national average for milk cows sold as dairy herd replacements at $3,130 per head in April 2026, up from $2,980 in January and $2,860 a year earlier — 5% on the quarter, 9% on the year. USDA NASS put milk replacement heifer inventory at 3.90 million headon January 1, 2026, down slightly from the prior year. Fixing a genetic misstep costs more than it did two years ago, which argues for care in both directions.
Your Pre-Breeding Action Checklist
- Pull your inbreeding report in the next 30 days. Run your last three years of sire selections through the Lactanet Inbreeding Calculator or your CDCB-linked mating program and count how many trace to a shared maternal grandsire. A few hours of records work, no new spend, before breeding starts.
- Run both measures on the same animals, then move your matings to the genomic one. Ablondi’s cows read 7% on pedigree and 16% on genomics, and the depression tracked the bigger figure — 61 kg per point against 44. If you’ve never seen your own two numbers side by side, you don’t know which one your program has been deciding from.
- If more than two of your last ten sire picks share a maternal grandsire, raise it with your mating consultant. Editorial rule of thumb, not a published standard — no threshold defines “too much overlap” at herd level, so you’re setting a baseline rather than measuring against one.
- Check whether your TPI cutoff still means what it meant last year. The April 2026 formula change moved bulls up to 125 points without new daughter data. If your program screens on a fixed threshold, some sires dropped off your list on arithmetic alone.
- Run Pryce’s scaling on your own rolling herd average — 0.4 to 0.6% per point of inbreeding, rather than borrowing an Italian or Dutch figure measured on a different population. At the U.S. rate, a decade costs a 12,000 kg herd 170 to 260 kg per cow per lactation. Multiply your own average by 1.4% to 2.2% to get your version.
- Ask your supplier for its sourcing split at proof-run specificity, then log the answer or the non-answer. Not proof of anything on its own — but a pattern across several suppliers should shape how much of your lineup comes from one place. Select Sires has published 40% and put an executive on tape saying it; the others haven’t.
- Before you compare any crossbreeding numbers, establish the basis. Single-lactation and lifetime daily figures point opposite directions on components: 24 to 29 kg less fat plus protein in one lactation, 1% more across a lifetime. Quoting one while meaning the other is the most common way that pitch gets made.
- Price stillbirth rate as an inbreeding cost, not a calving-management line item. Bjelland’s work puts it in the first column.
Between 2000 and 2009 the industry drove Holstein rate of inbreeding down to 0.37% per generation and pushed Ne up to roughly 135, using optimum contribution selection, expected future inbreeding, and publicly posted relationship values. Those tools worked. Then genomic selection outran them, and they’re still sitting there unused at scale.
The measurement problem is the cheaper of the two fixes. Nobody has to build an origin database or rewrite an index for you to run both numbers on your own females and see which one your matings have been following. Ablondi’s team needed 84,443 markers and 939 herds to prove it at breed scale. You need an afternoon and a report you’re already paying for. The question is whether you’ll like what it says — and whether you’d breed differently if someone finally published where those bulls came from.
Run Your Numbers
Genomic Testing ROI Calculator — This article says pedigree reads low and only genomics shows the real number. The calculator prices what testing is worth on your farm, and flags the families where inbreeding risk needs tighter control. Run the conservative scenario first.
Methodology note: The 7% and 16% figures in this article’s headline are the pedigree and genomic inbreeding averages for Ablondi’s Italian Holstein population and are not presented as a universal read on any individual herd; the size of the divergence depends on pedigree completeness and recent breeding patterns. Nucleus program descriptions and dates are self-reported or from trade media: Select Sires ART (company history page, January 4, 2024 blog post, and a July 2025 Select Sires podcast interview with ART program manager Mark Kerndt, in which the roughly 40% figure refers to bulls sampled each year); PEAK (2012 program start, though official as PEAK in 2018); Semex Progenesis (company pages, founded 2013); ABS Global (company history, first commercial units 2015). USDA-AIPL published the first official U.S. genomic evaluations in January 2009; CDCB assumed responsibility for U.S. genetic evaluations in 2013. Only Select Sires has published a proportional sourcing split.
Stud-share counts are The Bullvine’s own independent count of the Holstein Association USA Top 200 TPI Genomic Young Bulls list, April 2026 (85% genomic reliability minimum), drawn from the CDCB run published April 7, 2026, with stud assignment by the official NAAB marketing codes table. The April run is cited rather than a later one because Holstein Association USA implemented a TPI formula change in that run, moving production weights from 19% PTA Protein and 19% PTA Fat to 24% PTA Protein and 14% PTA Fat; individual bulls moved up to 125 TPI points with no new daughter data, so April 2026 shares are not comparable to earlier runs and represent the first post-change snapshot. An August 2026 list has since been published and current shares will differ. United Sires, LLC (NAAB 596/796) registered with NAAB on February 8, 2024. Blondin Sires Inc. (NAAB 799, St. Placide, Quebec) is owned by Simon Lalande, Dann Brady and Nicolas Lalande.
Italian figures: Ablondi, M., A. Summer, G. Stocco, R. Finocchiaro, J.-T. van Kaam, M. Cassandro, C. Dadousis, A. Sabbioni and C. Cipolat-Gotet, Journal of Animal Science 101:skad382 (2023), doi:10.1093/jas/skad382 — 27,735 cows, 939 herds, 84,443 autosomal SNPs, 24 generations of pedigree depth. The 2.35% five-year rate is drawn from Ablondi et al. (2022) and the +415 kg realized progress from ANAFIBJ (2023). Three co-authors are affiliated with ANAFIBJ, which supplied the data and part-funded the work; the authors declare no conflicts of interest. The Parmigiano Reggiano comparison appears in Results and Discussion, using 24-month-aged wheel prices per CLAL (2022), and reflects the difference between the most and least inbred 5% of cows — not a typical per-cow loss. USD and CAD equivalents are editorial conversions at approximately €1 = $1.16 USD and €1 = $1.60 CAD as of September 3, 2026; because the underlying euro figure derives from 2022 cheese prices, the conversion is indicative of present-day value rather than a 2022 dollar equivalent.
Other depression studies use different lactation bases and are not directly interchangeable. Doekes, H.P. et al., Genetics Selection Evolution 51:54 (2019), doi:10.1186/s12711-019-0497-z. Bjelland, D.W., K.A. Weigel, N. Vukasinovic and J.D. Nkrumah, Journal of Dairy Science 96(7):4697–4706 (2013), doi:10.3168/jds.2012-6435 — 205-day, not 305-day. Pryce, J.E., M. Haile-Mariam, M.E. Goddard and B.J. Hayes, Genetics Selection Evolution 46:71 (2014), doi:10.1186/s12711-014-0071-7.
North American population figures: Makanjuola, B.O. et al., Journal of Dairy Science (2020), doi:10.3168/jds.2019-18013 — 676,594 Holstein and 304,676 Jersey pedigree records from the Canadian Dairy Network. Genomic-era Ne is derived from the paper’s reported 1.19–2.06% rate of inbreeding per generation using Ne = 1/(2ΔF), which is why it is reported here as a range rather than a point estimate; an earlier ADSA abstract from the same group reported 30 to 48, differing from the published paper. FAO critical Ne of 50 cited therein (FAO, 2015). Nordic figures: Tenhunen, S., J.R. Thomasen, L.P. Sørensen, P. Berg and M. Kargo, Journal of Dairy Science 107(8):5897–5912 (2024), doi:10.3168/jds.2023-24553; four of five authors are affiliated with VikingGenetics, and the study is open access and peer-reviewed. Methods and periods differ between Makanjuola and Tenhunen, so comparisons are directional.
Generation interval: Guinan, F.L. et al., Journal of Dairy Science 106(2):1110–1129 (2023), doi:10.3168/jds.2022-22205, with corrigendum; figures are for the sire-of-bulls pathway. García-Ruiz et al., PNAS 113(28) (2016), independently found that interval falling from roughly 7 years to under 2.5 between 1975 and 2015. U.S. inbreeding rates: Steyn, Y. et al., Journal of Dairy Science 105(12):9810–9821 (2022), doi:10.3168/jds.2022-22143, citing CDCB (2021).
Crossbreeding: ten-year University of Minnesota study of high-performance Minnesota herds led by L.B. Hansen with A.R. Hazel and B.J. Heins, published 2019. Single-lactation 305-day and lifetime daily component figures use different bases and are reported separately above. Shonka-Martin, B.N., A.R. Hazel, B.J. Heins and L.B. Hansen, Journal of Dairy Science 102:871–882 (2019), doi:10.3168/jds.2018-15318; and Shonka-Martin, B.N., B.J. Heins and L.B. Hansen, Journal of Dairy Science 102:3661–3673 (2019), doi:10.3168/jds.2018-15682. See also Hazel, A.R., B.J. Heins and L.B. Hansen, Journal of Dairy Science (2020). VikingGenetics’ “no worries about inbreeding” statement is a company marketing claim, not independently verified.
Mating programs: Sun, C., S. Westberry, D. Kendall and D. Castellani (STgenetics, Navasota, TX), ADSA Annual Meeting 2019, Abstract #365 — company-authored, not independently validated. Nucleus modelling: Dekkers and Shook, J. Dairy Sci. 73:1920 (1990). Replacement price: USDA, April 2026, U.S. national average with significant regional variation. Heifer inventory: USDA NASS Cattle, released January 30, 2026.
Learn More
- Stop Breeding by Color: Genomics, Heat Stress and Beef‑on‑Dairy Math That Can Add Over $4/cwt to Holstein Margins — Protects a $2,000 heifer-rearing bet by swapping visual coat-pattern bias for economic index rankings, showing how combining genomic culling with beef semen captures over $4/cwt in margin relief.
- Stud Wars April 2026 — The Empire Strikes Back — Exposes how major studs and corporate lab mergers consolidate breeding power, revealing why formula shifts moved bulls 125 TPI points overnight without a single fresh daughter.
- 9.99% Inbreeding and Rising: How Blondin Sires Turned a Holstein Bottleneck into 75% Growth — Follows the money on an independent Quebec operation that monetized the pedigree bottleneck, arming commercial dairies with actionable allocation rules to claw back $400-plus in lifetime inbreeding drag.
The Sunday Read Dairy Professionals Don’t Skip.

Every week, thousands of producers, breeders, and industry insiders open Bullvine Weekly for genetics insights, market shifts, and profit strategies they won’t find anywhere else. One email. Five minutes. Smarter decisions all week.
