One $4,400 heifer calf in 1987 became the most copied type sire of his generation — and a 1.3kb APOB insertion that reached 17% of Canadian heifers and 4.4% of CDCB’s 2015 run.
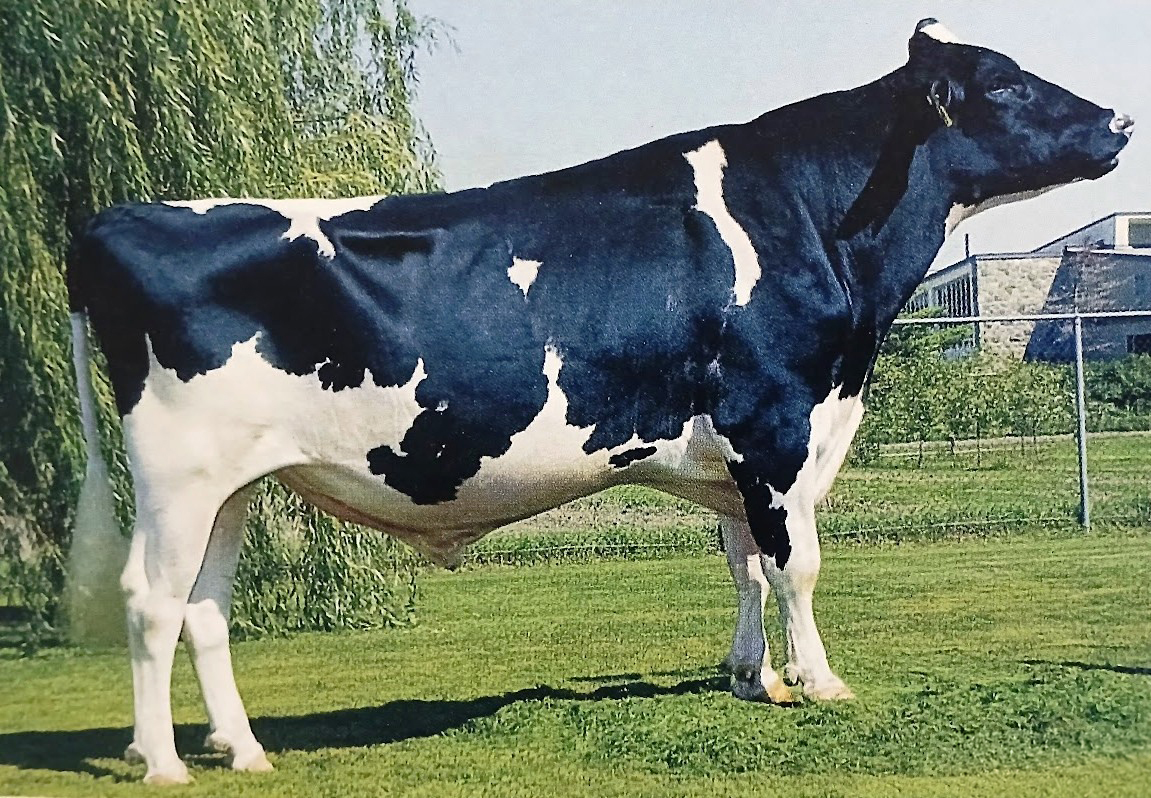
Prologue — Orlando, July 2015
You can picture the room. The kind of hotel conference space where Interbull holds its summer meetings — bad coffee on a side table, the hum of overworked HVAC, a screen at the front that’s been showing variations of the same haplotype slide for two days running. Outside, Florida is doing what Florida does in July. Inside, a researcher from VIT Germany clicks to his next slide.
That slide changes the Holstein breed.
Kipp and his colleagues had been chasing a pattern of unexplained calf losses across multiple countries — chronic diarrhea, emaciation, mortality before six months — and the pedigree work had finally converged. Every line, every affected calf, every confirmed case ran back through generation after generation to one bull. A Canadian. Born in 1991. Class Extra at C.I.A.Q. A name every breeder in that room knew by heart, because his sons and grandsons were standing in their barns and walking their show rings at that very moment.
Maughlin Storm.
You can imagine how the air shifted in that room. Not panic — geneticists don’t panic — but the quiet click of recognition that comes when a mystery you’ve been chasing for two years finally has a face on it.
And here’s what’s worth holding onto from the start. Storm hadn’t done anything wrong. Storm had done everything right. He’d been bred from one of the great cow families on the continent. He’d transmitted exactly what breeders asked him to transmit. His sons led the LPI rankings. His grandson Goldwyn was, at that very moment, the most decorated show-ring sire in Holstein history.
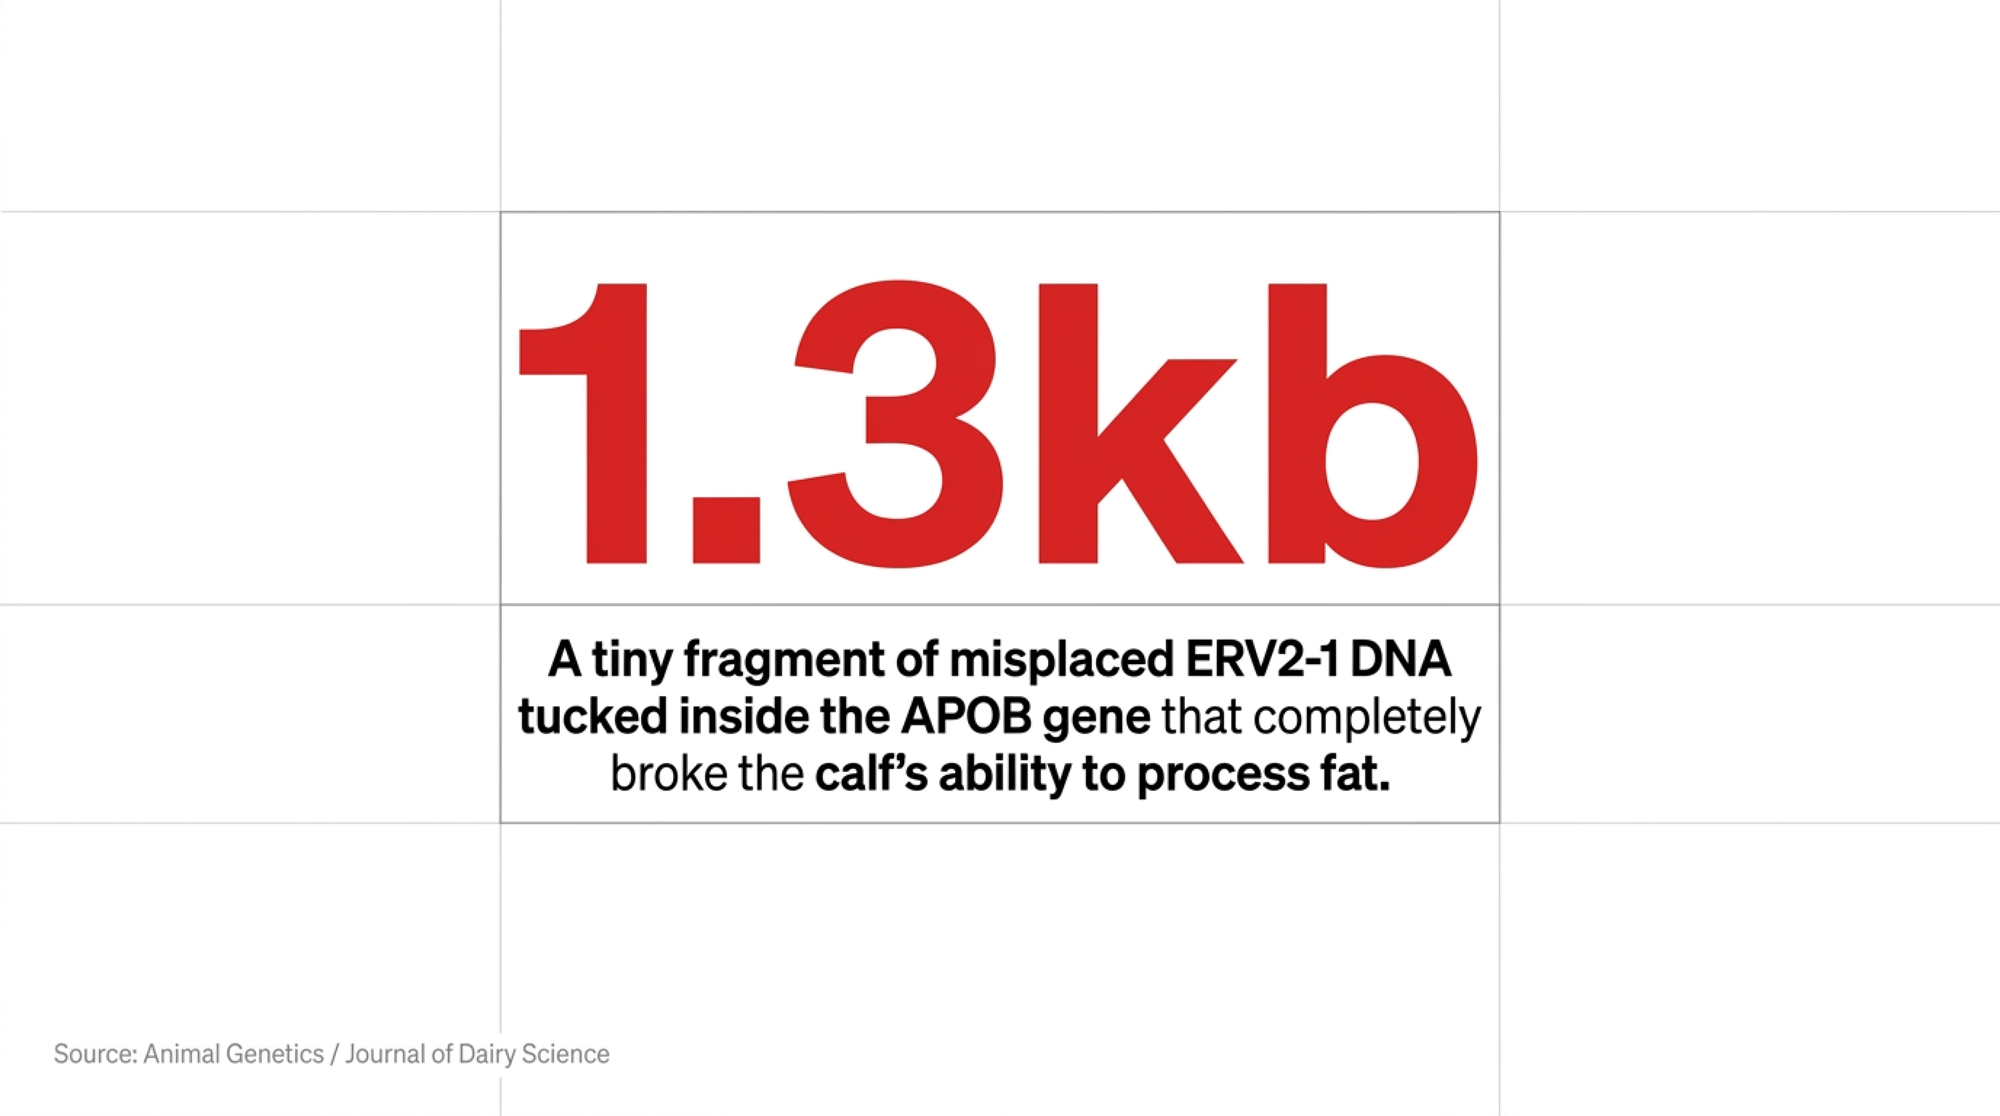
What Storm had also done — invisibly, silently, across two decades and into pedigrees on every dairy continent — was carry a 1.3 kilobase fragment of misplaced DNA tucked inside the APOB gene on chromosome 11. A piece of code so small you’d never see it on a 50K SNP chip without knowing exactly where to look.
This is the story of how that bull got built, and how he conquered a generation. And how, decades later, he taught the breed something it desperately needed to learn.
Act I — How You Build a Legend (Without Knowing You’re Doing It)
Two Brothers and a Steamship
Long before there was a Maughlin Storm, there were two Dutch brothers on a boat.
Ted and John VanWyk crossed from Holland to Canada in 1951. They didn’t bring much with them. Working capital? None. Connections? None. What they brought was a work ethic forged in postwar Europe and a faith that good cows reward patient people.
For two years, they worked the rough edges of southwestern Ontario agriculture — tobacco, sugar beets, and tomatoes. The kind of stoop-labor that ages a man’s hands fast. By 1953, they’d scraped together enough to buy a farm at Woodstock, and the Wykdale herd was born.
The part that ought to stop every breeder cold is the foundation of that herd — the genetic floor on which everything that came after was built. Three cows. Three. Bought at three different sales in 1953 for a combined $885.
One of those three was a registered female by the name of April Expectation Dewdrop (GP).
She wasn’t flashy. She’d never have caught your eye in a sale ring crowded with imports. But she was deeply bred, structurally sound, and — as the VanWyks would discover, lactation by lactation — she could milk. April finished her career with 107,526 lbs of milk at 3.91% fat and made the Honor List in 1956.
In 1956, those numbers were extraordinary. April’s real value, though, wasn’t in her own record. It was in what she could throw, and what her daughters could throw, and what their daughters could throw. Cow families work that way. The matriarch is just the first chapter.
The Dewdrop Cows
What followed in the VanWyk barn over the next two decades reads almost like a tall tale — except every number is documented.
April’s maternal granddaughter, Wykdale Cavalier Dewdrop, knocked out 198,933 lbs of milk at 4.0% fat across ten lactations and earned five Star Brood Cow points. Her daughter, Wykholme Dewdrop Debbie, went and posted 274,487 lbs at 4.0% across her own ten lactations. Ten lactations. Two hundred and seventy-four thousand pounds. In an era when most cows were lucky to see four lactations, the Dewdrops were treating longevity like a family heirloom they refused to lose.
Word got around. Breeders started making the drive to Woodstock to walk the barn. The Dewdrops weren’t show cows in the catalog-cover sense — they were farm cows, the kind that quietly built equity for thirty years while the flashier herds blew up and dispersed. Classifiers respected them. Economists envied them.
In 1978, the breed made it official. At the Canadian Holstein annual meeting that year, Dick Brooks — President of the Holstein Association of America at the time — handed Ted and John VanWyk the Master Breeder Shield. Two immigrants who’d arrived twenty-seven years earlier with empty pockets and dirty fingernails were now standing on the breed’s highest stage.
That should have been the end of the story. Master Breeder Shield, a great cow family, applause, and a quiet retirement to the porch.
It wasn’t.
Sandy McPhedran’s $4,400 Bet
The Cormdale High Index Sale rolled through Ontario in 1987 the way these sales did back then — a few hundred breeders crowded into a sale arena, a catalog thumbed soft at the corners, and a kind of tense, half-joking energy that said somebody here is going to overpay, and somebody else is going to steal one.
A breeder from Rockwood, Ontario, named Sandy McPhedran, was reading his catalog carefully.
The lot in front of him: a two-month-old heifer calf. Wykholme Dewdrop Tacy-ET. Sired by Hanover-Hill Inspiration (EX-Extra) — a name that, in 1987, made type-minded breeders sit up straight. Out of Wykholme Dewdrop Gail (EX-10*), 6 lactations, 180,490 lbs of milk, 6,992 lbs of fat. The kind of dam record that made experienced breeders mark their catalogs and sit back in their chairs.
Deep Dewdrop blood, Inspiration on top, type and production stacked. McPhedran knew what he was looking at.
What it cost him to take her home was $4,400.
For a two-month-old calf in 1987, that was real money. You could buy a working cow for that. McPhedran wasn’t buying a cow, though. He was buying a maternal line, with the patience to wait three years to see what she could give him.
When Tacy reached three, McPhedran did what any breeder in his shoes would have done — contract-mated her to the hottest production sire in the country, Madawaska Aerostar (EX-Extra), through the Centre d’Insémination Artificielle du Québec at St-Hyacinthe.
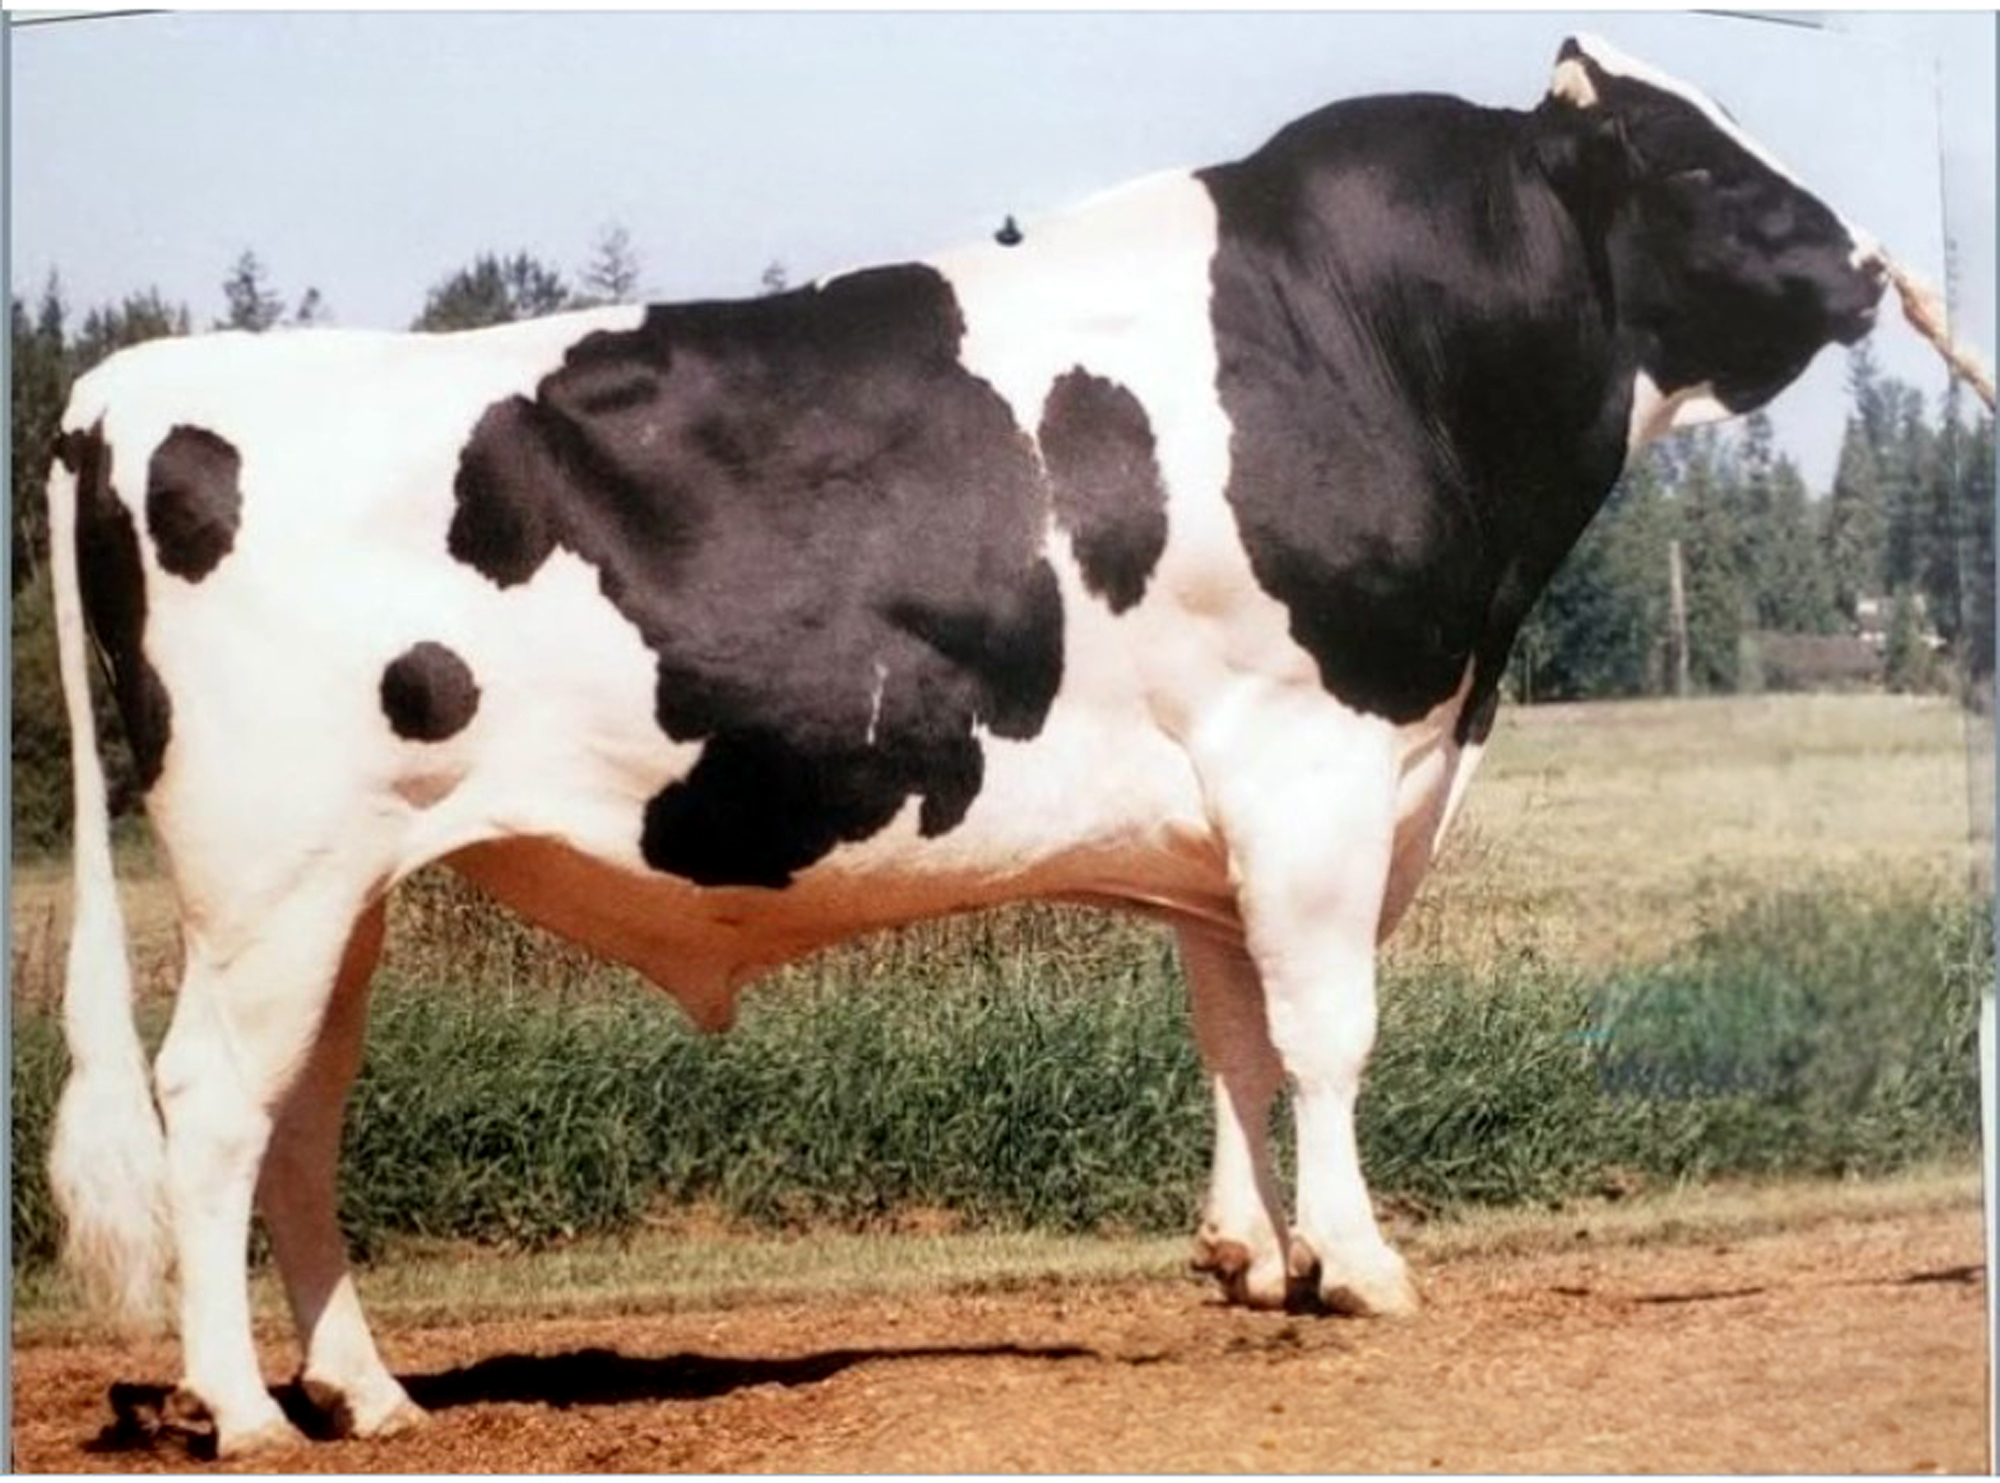
A bull calf hit the ground in August 1991.
McPhedran and his son were Guelph Storm fans — the OHL hockey team had just been founded the year before. The calf got named for the team.
A bull named after a hockey franchise. A foundation cow bought for less than three hundred bucks at a roadside sale forty years earlier. Hard to script that.
What was about to happen next, though, was forty years of patient cow-family breeding meeting the right outcross at the right moment in history.
Act II — Class Extra: When Storm Took Over the Holstein World
What “Class Extra” Actually Meant
The dairy industry of the mid-1990s was deep in what the trade press called the Type Revolution. Production alone wasn’t enough anymore. Breeders wanted depth. They wanted a dairy character. They wanted udders that hung correctly into a sixth lactation, and cows that could win at Madison and still milk as they meant it.
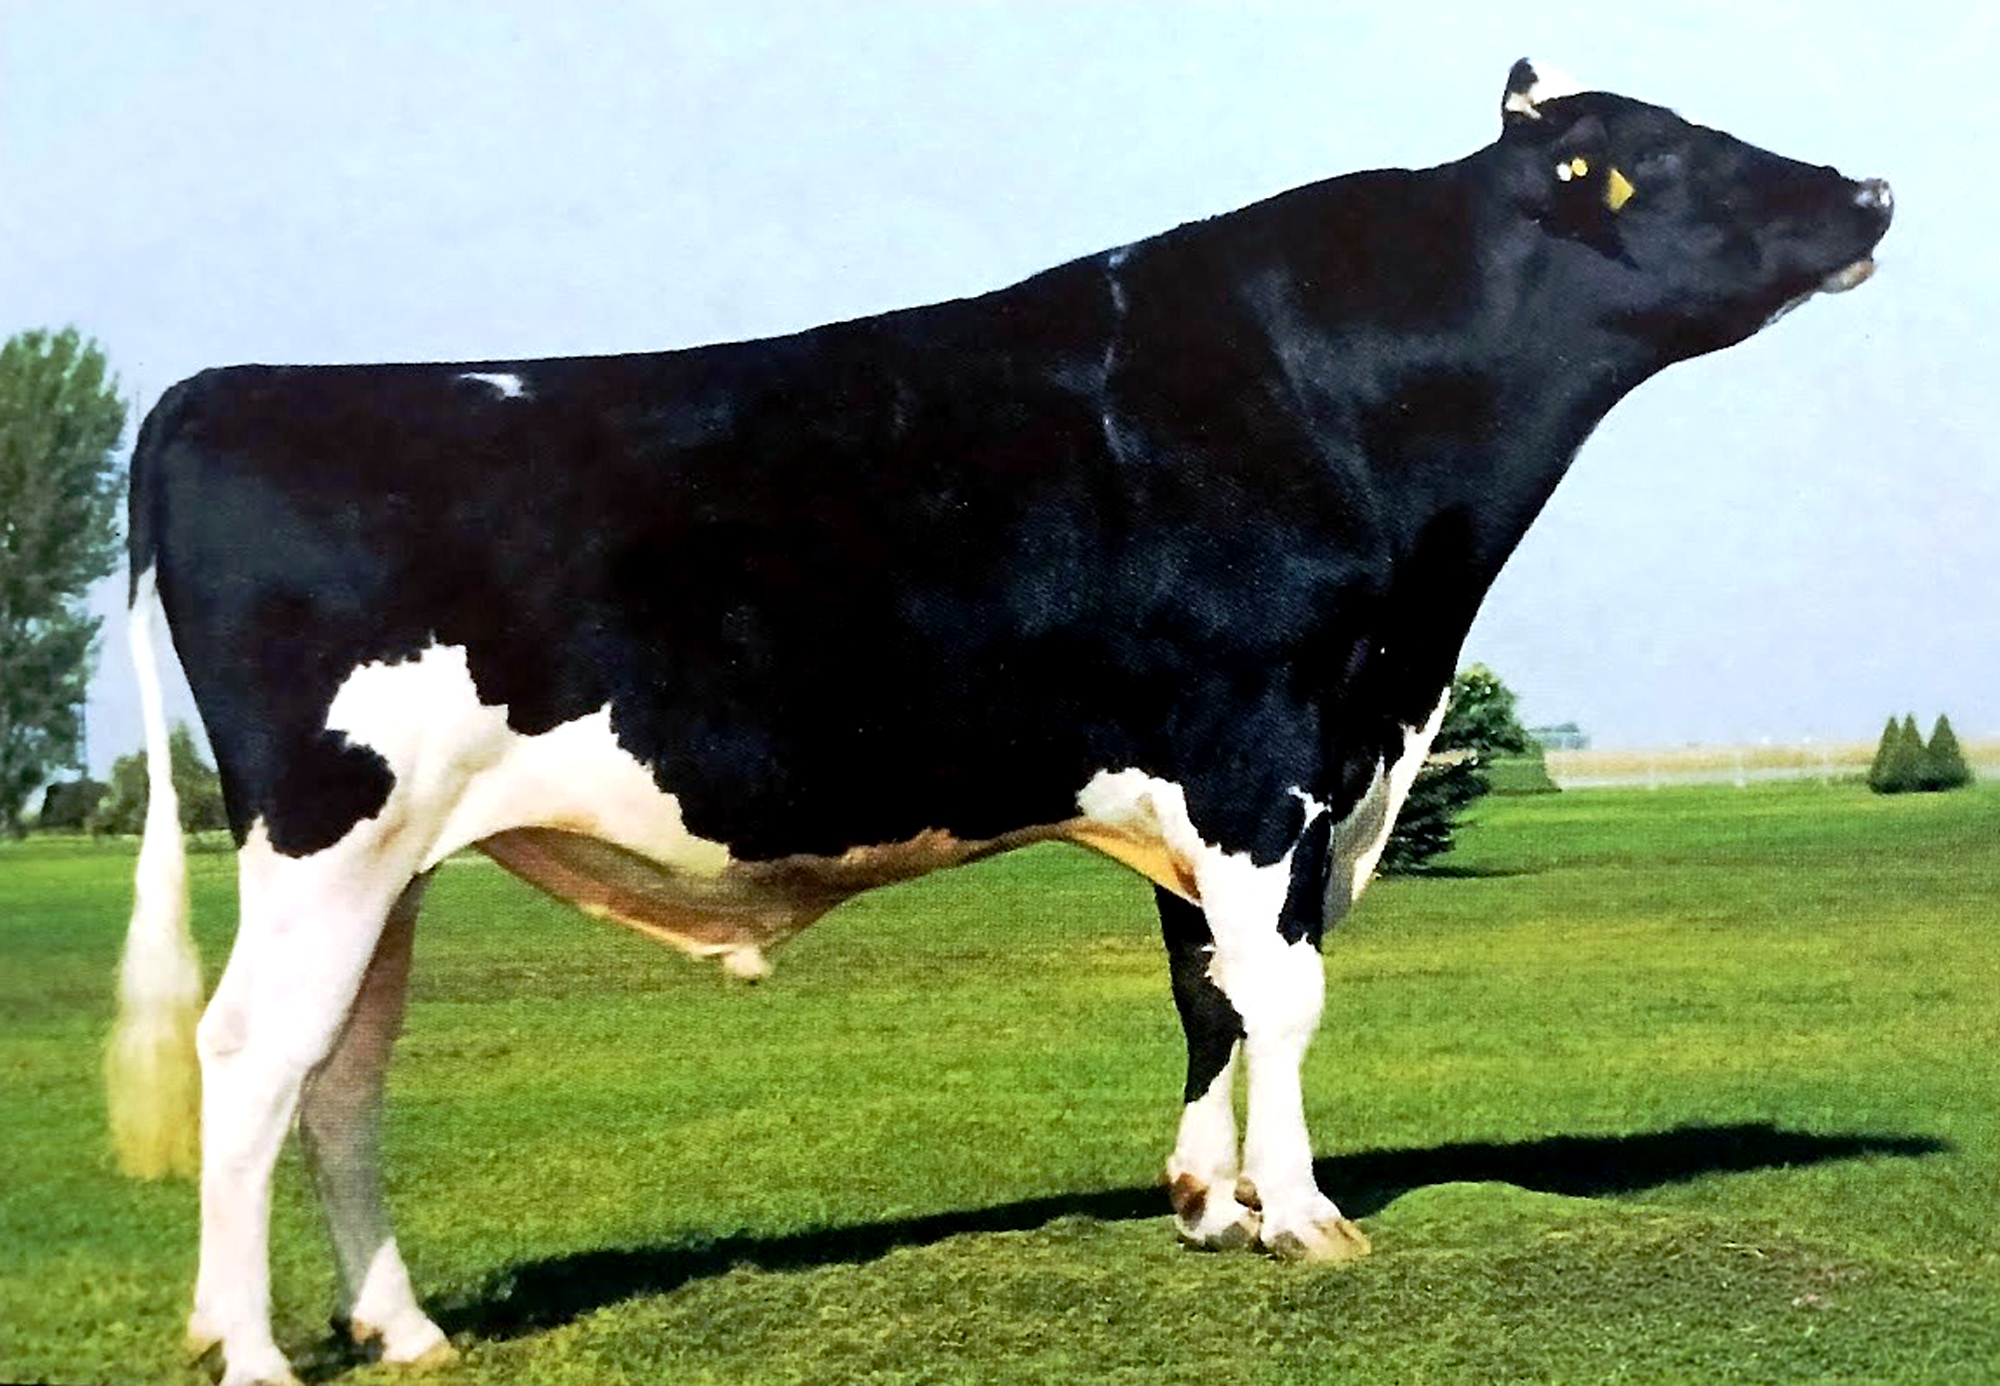
When Storm joined the C.I.A.Q. proven sire lineup in 1996 — that being the era when Quebec’s stud was effectively setting the elite-type standard for the whole country, exporting semen worldwide — he carried the designation “Class Extra,” the top tier the organization handed out, and one not given lightly. He came onstage alongside his paternal half-brother Startmore Rudolph (EX-Extra), and from day one, breeders gravitated to Storm.
Why?
Two reasons, really. He excelled for rump — flat, wide, correctly set, the structural foundation classifiers love, and udders need. And he transmitted a high fat percentage from an Aerostar son. Most breeders did a double-take when those proofs came back, because Aerostar daughters weren’t supposed to be fat-test cows. Atypical meant valuable.
Stack on top of that the maternal grandsire — Hanover-Hill Inspiration (EX-Extra) — and you had a sire whose pedigree read like a wish list. Breeders ordered. And ordered. And ordered.
The Sons That Built the Empire
By the early 2000s, Storm wasn’t just popular. His sons were rewriting the Canadian sire lineup almost yearly.
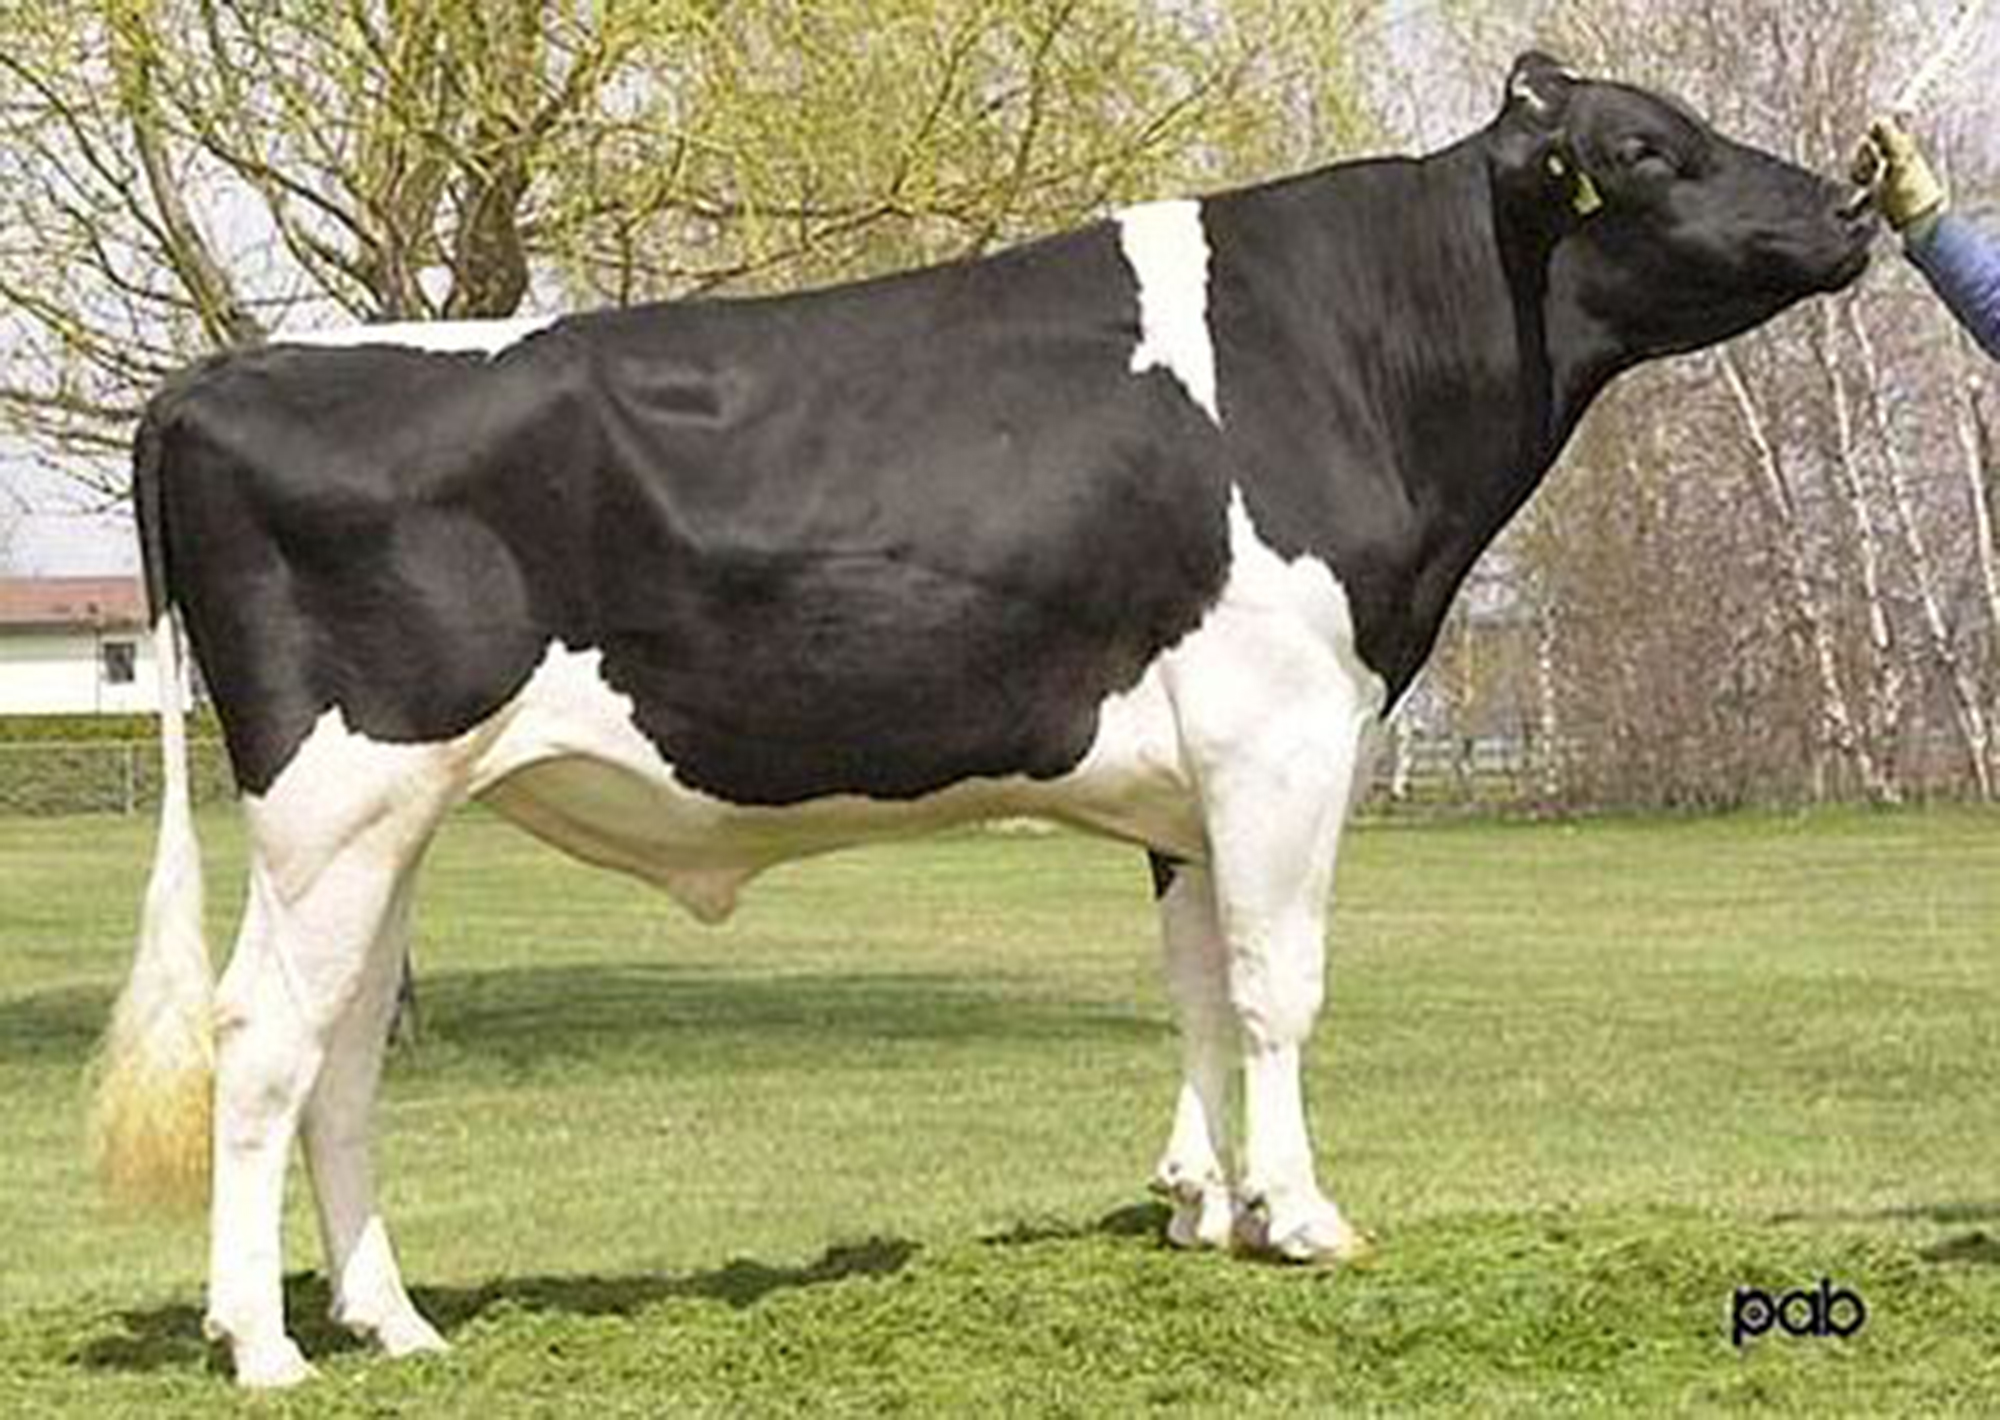
Comestar Stormatic (EX-Extra) was the first Storm son progeny-tested in Canada, and he did something nobody had done before — set the C.I.A.Q. record for the most first-crop Very Good 2-year-olds, with nine in a single proof. He hit #1 LPI in Canada twice. His daughters carried the Storm look forward into a whole new generation, and his own sons — Golden-Oaks ST Alexander and Gen-Mark Stmatic Sanchez — kept the chain moving.
Hartline Titanic (EX-Extra), out of Docu Leadman Tenacious (VG-88), hit #1 LPI in Canada in November 2003. In the LPI-obsessed Canadian breeding culture of that era, that wasn’t a ranking. It was a coronation. Titanic semen moved.
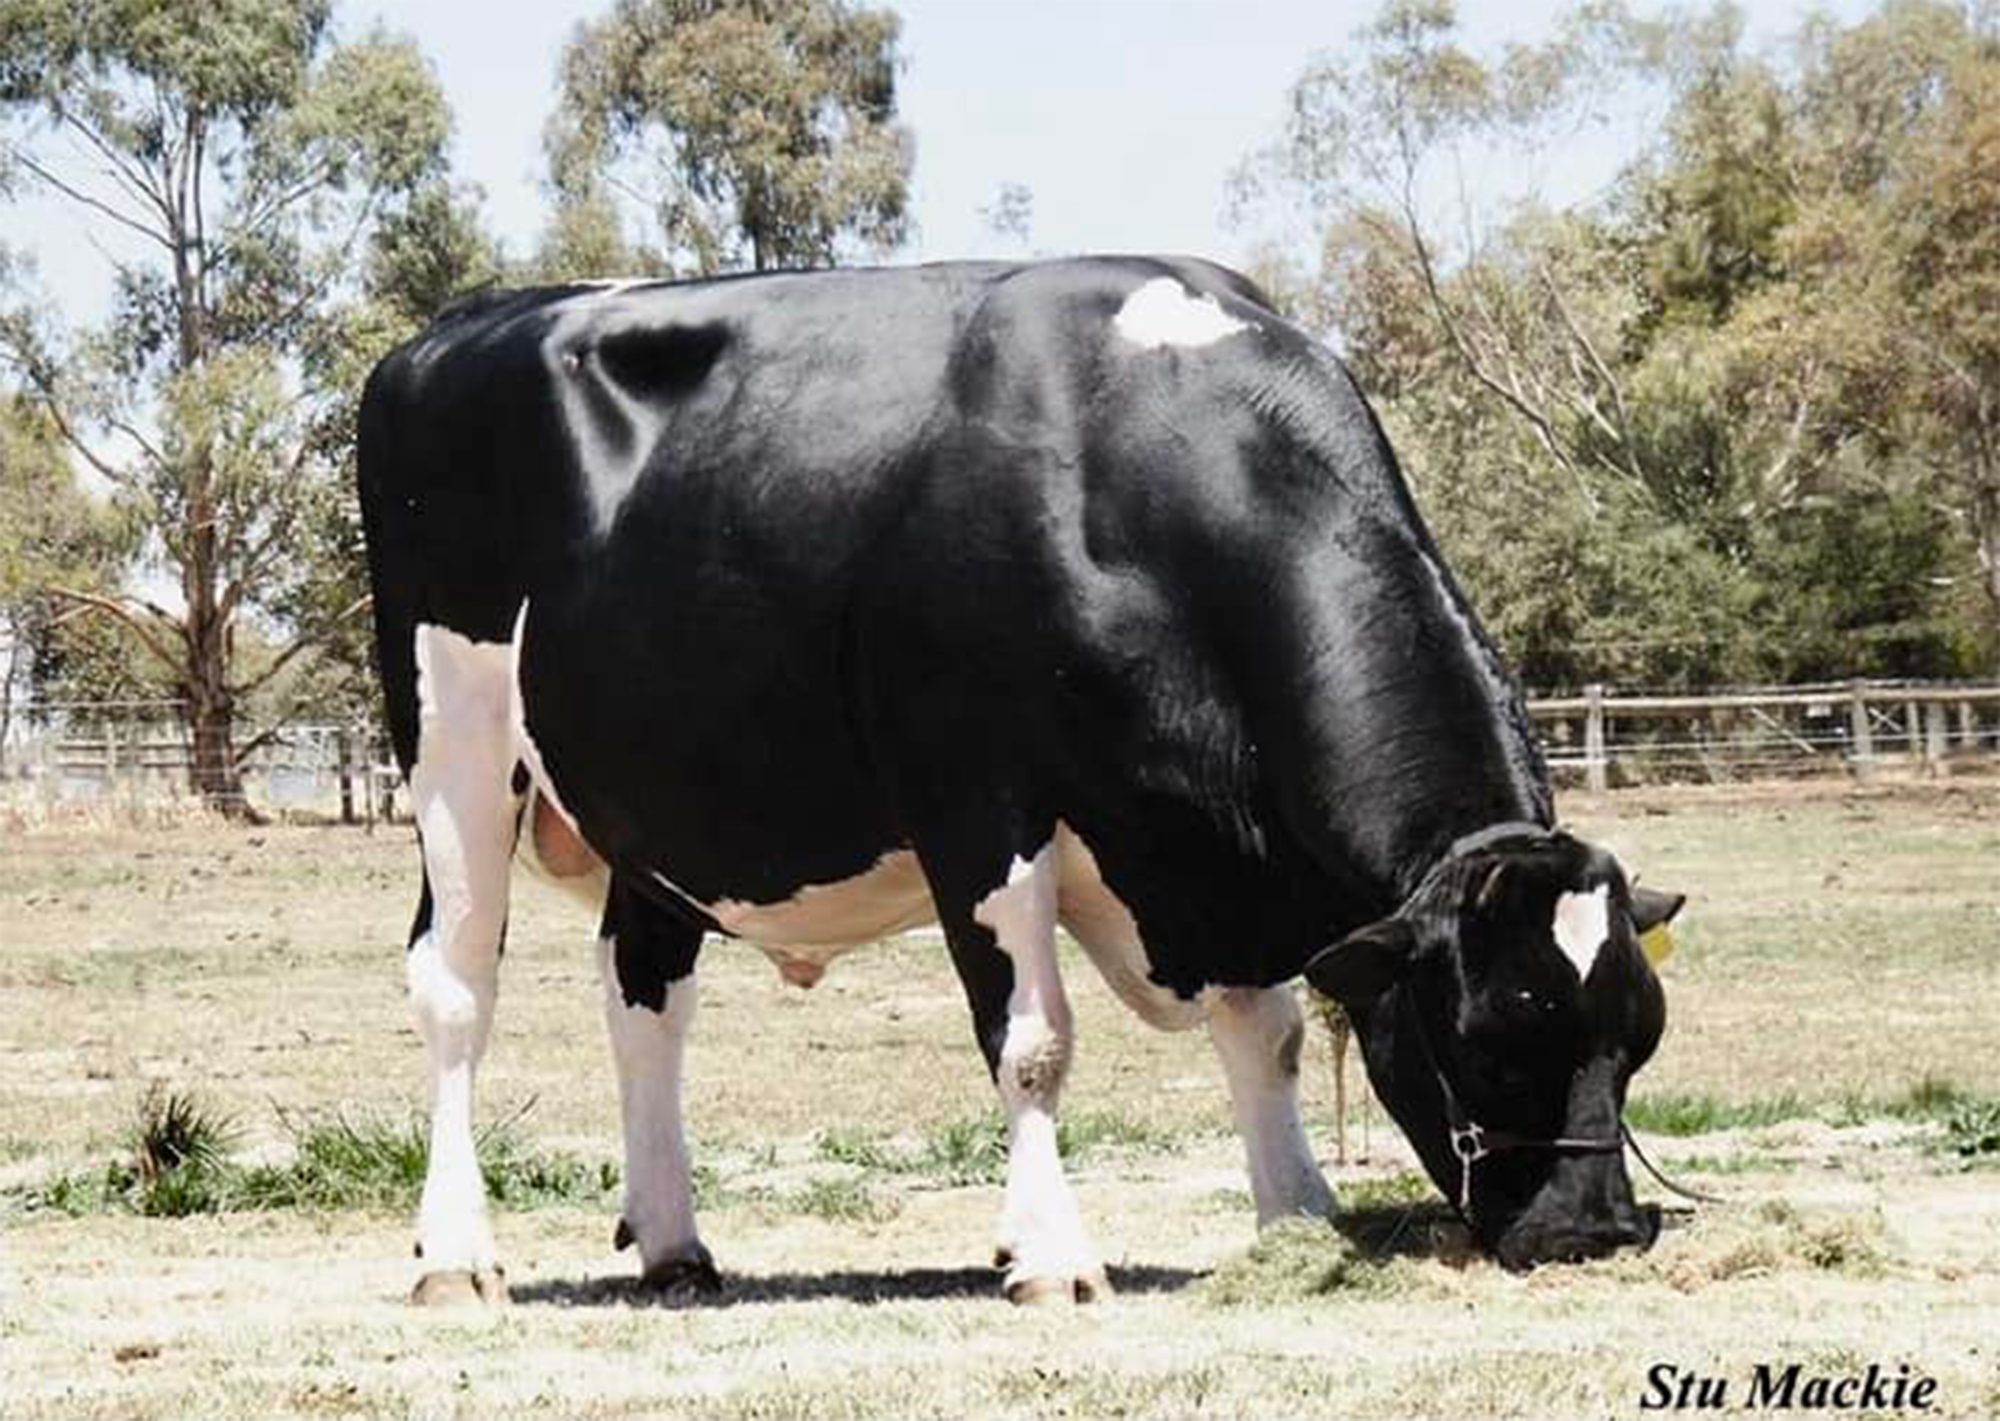
Ladino Park Talent (EX-ST), a red-factor Storm son out of Markwell Leader Rose-ET (EX-91-2E) — herself the Kinglea Leader daughter of the legendary Stookey Elm Park Blackrose, the red-and-white matriarch every R&W breeder of that era could name from memory — was sampled simultaneously by Semex in Canada and Australia. At one point, he was the top-rated bull for type in both countries at the same time, and in 2004, he was Canada’s #1 bull for mammary systems. His daughters included Rainyridge Talent Barbara (EX-95), a unanimous All-American and All-Canadian 5-year-old in 2010.
Pursuit September Storm (EX-ST), another red-factor son, came out of a sixth-generation VG-or-better tail-female line — Glen Drummond Shimmer, by Starbuck, out of Glen Drummond Shower (EX-10*). That kind of pedigree depth on a red carrier opened doors into the colored-Holstein market that had been mostly closed before.
And on it went. Granduc Tribute. Braedale Spy. Braedale Freeman. Brigeen Givenchy. Blondin Courage. Each one a different mating, a different cow family, a different breeder’s bet — and every one of them landed. Storm sons broke into the Canadian Top 100 LPI list with the regularity of weather reports.
None of that prepared the industry for what came next.
Then Goldwyn Happened
Storm had a daughter named Braedale Baler Twine (VG-86) — a Canadian 33-Star Brood Cow, eventually, out of the 2003 Cow of the Year Braedale Gypsy Grand (VG-88-31*). Baler Twine herself put up a 2-year-old record of 30,906 lbs of milk at 4.9% fat. Most herds in 1995 didn’t have a single mature cow doing 30,000 pounds at any test percentage. A 2-year-old doing it at nearly five percent fat? You read that proof twice and called somebody to confirm it wasn’t a typo.
Bred to Shoremar James, Baler Twine produced a bull calf who would become Braedale Goldwyn (GP-Extra). The Braedale prefix — the Beaton family’s program in Ontario, the same operation that had bred Gypsy Grand herself — had stacked the deck on this mating, and the deck delivered.

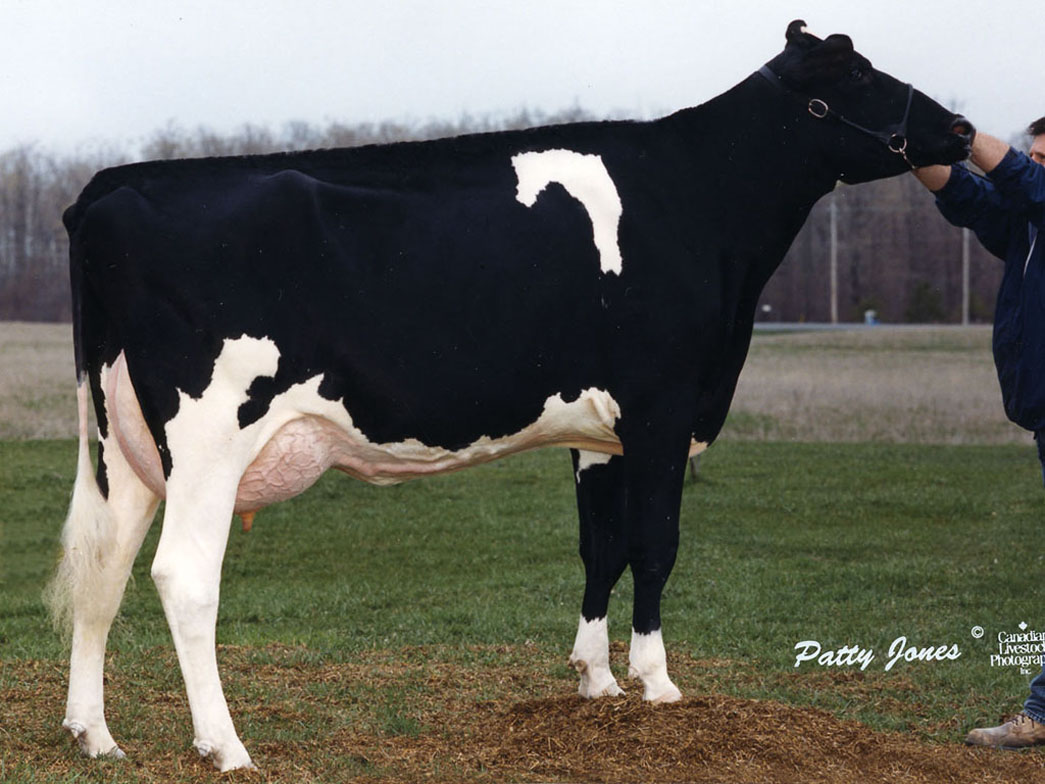
Bonaccueil Maya Goldwyn EX-95 — Supreme Champion of the 2013 World Dairy Expo. Look at the rump, the dairy strength, the udder. Every line of her traces back through Goldwyn to Baler Twine, and through Baler Twine to Maughlin Storm. This is what “Goldwyn daughters owned the ring” actually looked like on the colored shavings at Madison.
You don’t need a long explanation of what Goldwyn became. He was the dominant show-ring sire of his era — perennial Premier Sire at World Dairy Expo, his daughters stacking up championships from Madison to Cremona to Sydney. When Goldwyn straws moved, they moved by the thousands. When his daughters walked into a ring, judges leaned forward.
Running through every single one of those daughters, woven into the maternal half of every Goldwyn pedigree, was Maughlin Storm.
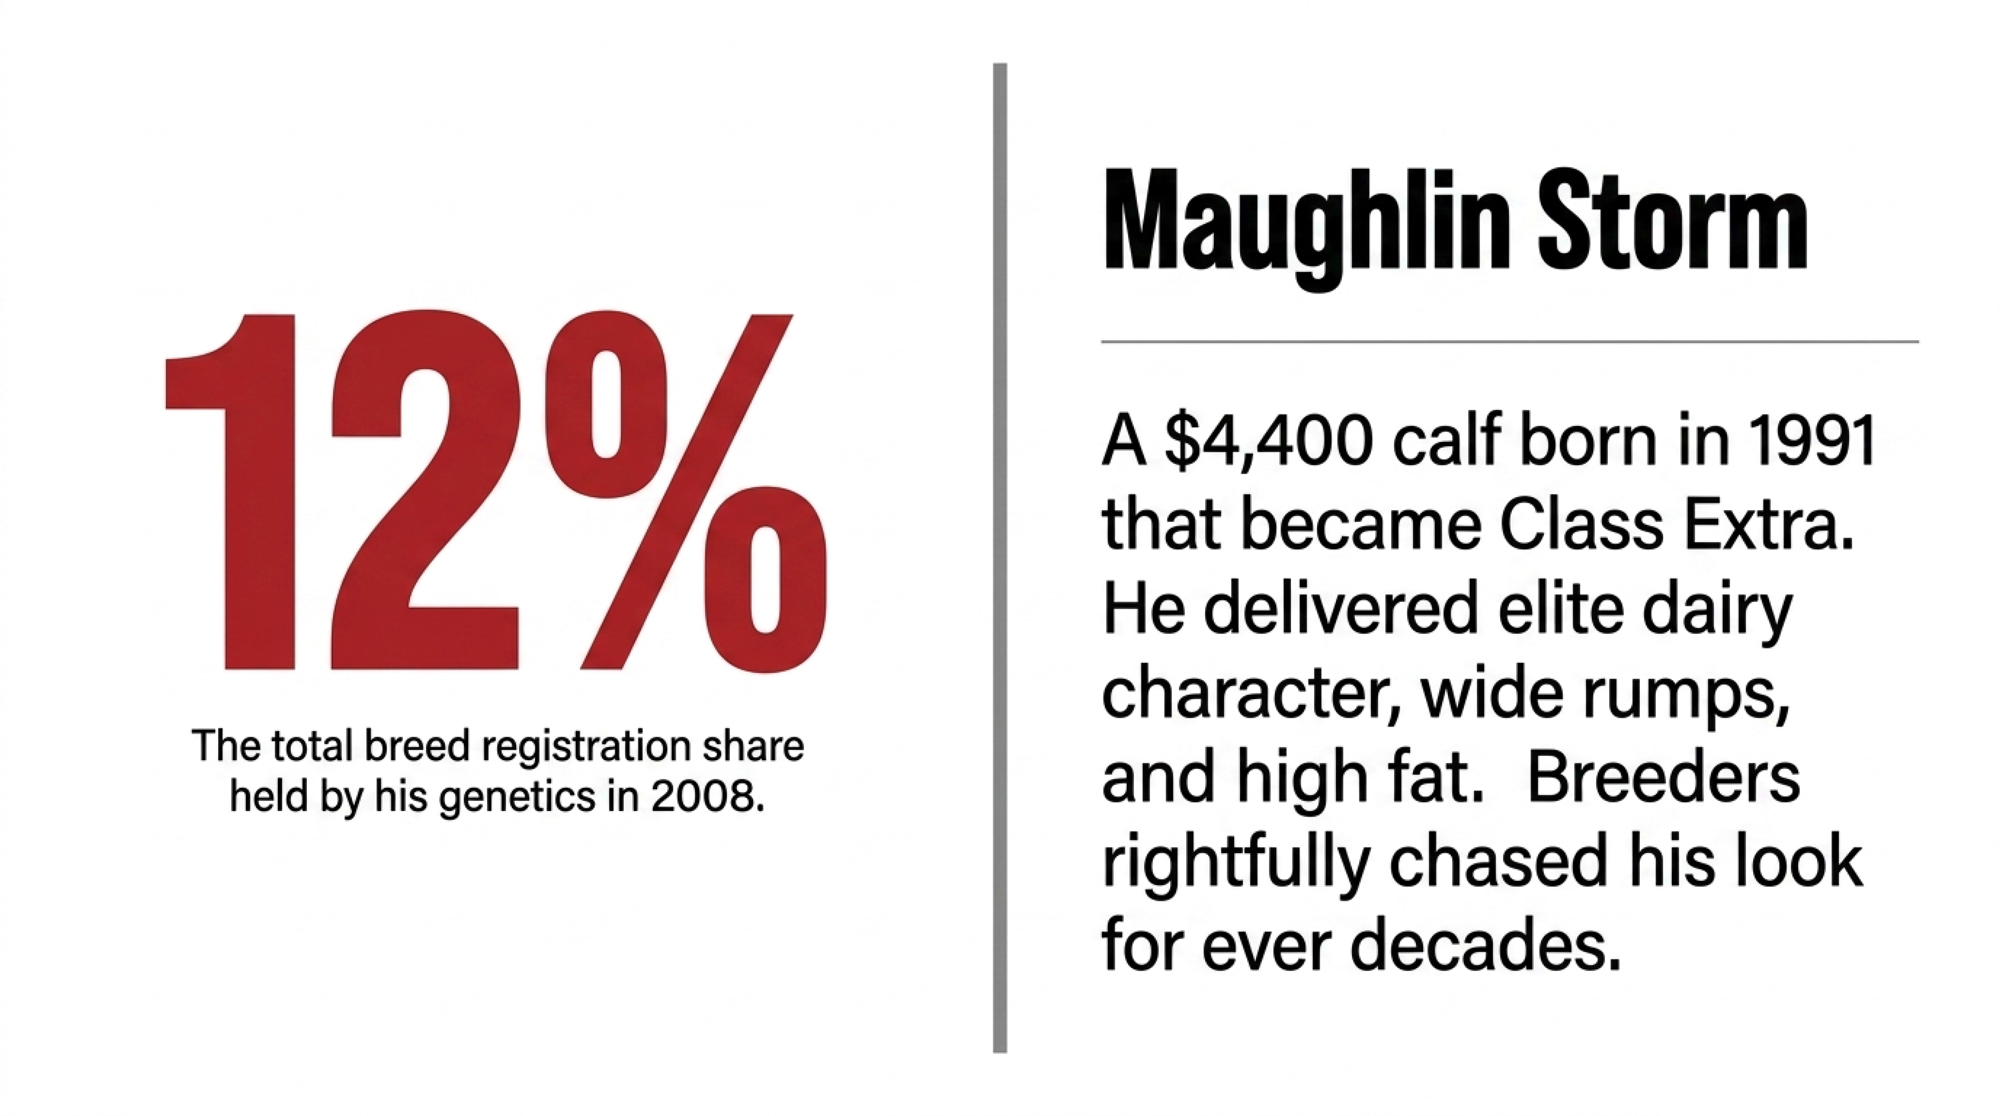
By the late 2000s, the “Storm line” wasn’t a preference anymore. It was an assumption. If you were breeding for elite type in the Holstein breed, you almost couldn’t avoid Storm if you tried. Goldwyn, Buckeye, and Dolman together held roughly 12% of all Holstein registrations in 2008. That isn’t influence. That’s a genetic monoculture.
What nobody knew yet — what the eye had no way of seeing, what no classification card could score — was that the same maternal pathway delivering the rump, the fat percent, the dairy character, and the championship banners was also delivering something else.
And somewhere in a Bavarian barn, a calf was already dying.
Act III — The Calf That Wouldn’t Thrive
A Veterinary Mystery
Before Orlando 2015, before VIT Germany figured it out, before any of it — there were the calves.
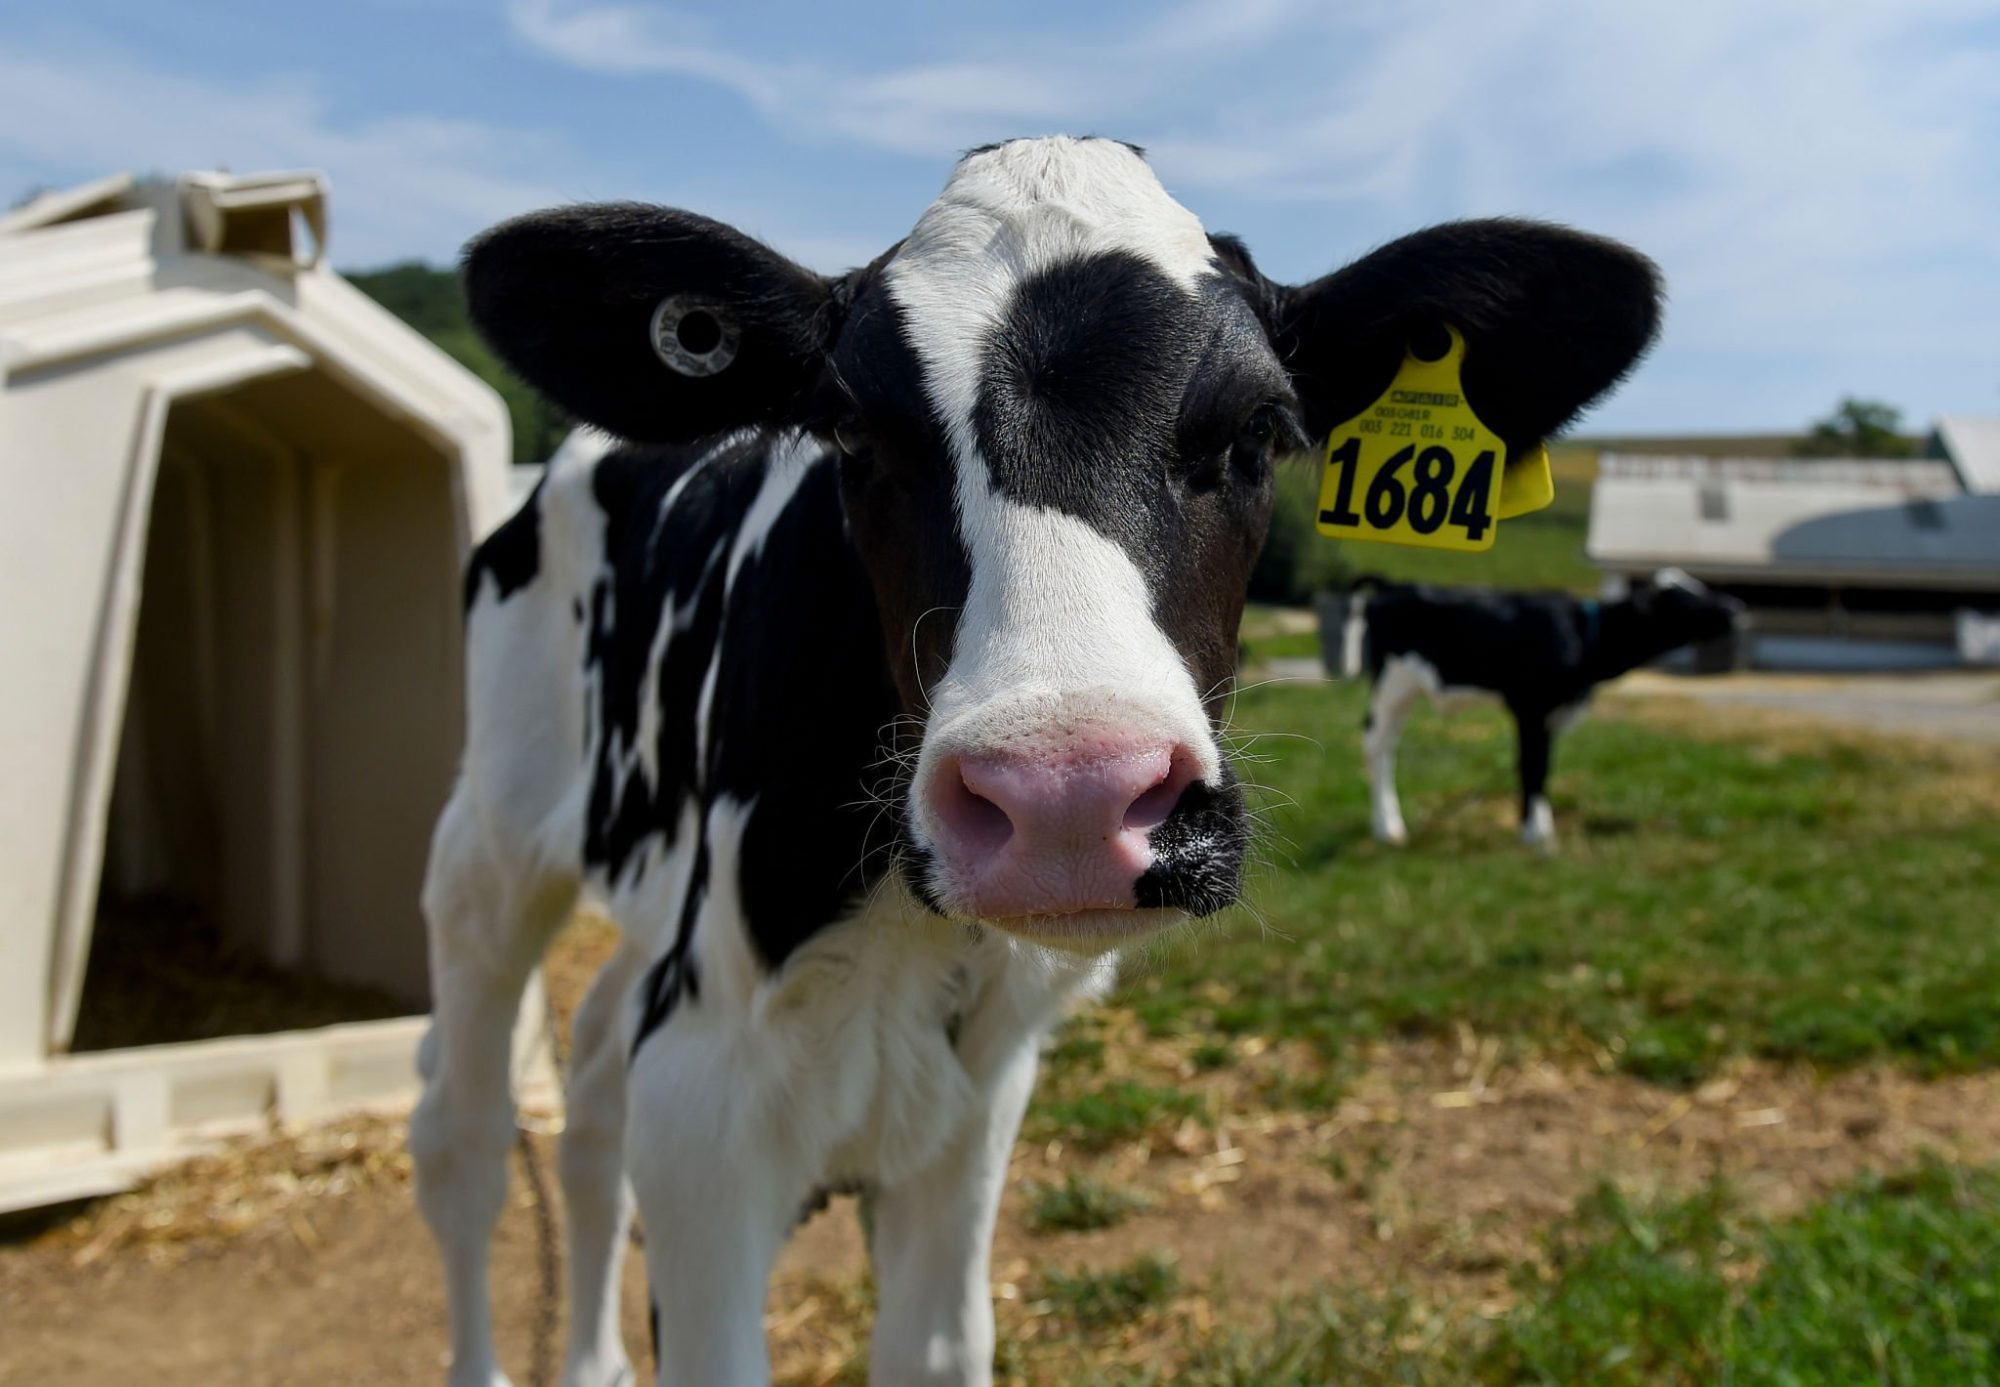
Picture a herd manager in Bavaria. Or Ontario. Or Wisconsin. Doesn’t matter where. A heifer calf hits the ground from a high-end Goldwyn-line mating. Looks normal. Nurses well. The first week, fine. The second week, fine.
Then the diarrhea starts.
Not the kind that responds to electrolytes. Not the kind that responds to antibiotics. Not the kind that responds to anything you’ve got in the medicine cabinet, the vet’s truck, or the consultant’s playbook. The calf keeps eating. Keeps trying. By six weeks, she looks like a different animal than the one you pulled out of the calving pen. By twelve weeks, she’s emaciated despite an appetite that won’t quit.
And then, somewhere before her sixth month, she’s gone.
Then it happens again. Same line, same progression, and the next clean-blooded calf you raise grows like she’s supposed to. You start checking everything — colostrum protocol, milk replacer, pen sanitation, water source. Twice. Nothing’s wrong with any of it. The mystery sits there unanswered while you bury another one.
That’s what HCD looked like from the barn floor — not a statistic but a grief, a budget loss, a quiet shame some farmers carried for years before anyone had a name for it. As one carrier-herd manager later put it in trade-press coverage of the discovery — and any breeder who lived through those losses will recognize the sentiment — we were chasing the look, and the look was carrying something.
What VIT Germany Found
The biology, when it finally came clear, was almost cruel in its simplicity.
The APOB gene on bovine chromosome 11 codes for apolipoprotein B, the protein the body uses to package and ship dietary fat through the bloodstream. Two forms: APOB-48 in the gut for absorbing dietary lipids, APOB-100 in the liver for moving fats out as VLDL and LDL particles. Without working APOB, an animal cannot absorb fat from its food. Cannot mobilize fat from its liver. Cannot convert energy into tissue.
What Kipp and his team identified, and what was confirmed in the peer-reviewed Animal Genetics literature shortly after, was a 1.3-kilobase ERV2-1 transposable element — a piece of ancestral retroviral DNA — wedged into exon 5 of APOB. The result is a truncated, non-functional protein.
In a heterozygous animal — a carrier — one good copy of the gene is enough. The animal is healthy, productive, and often exceptional. In a homozygous animal — two bad copies — the system collapses. Total cholesterol drops below 15 mg/dL, sometimes near zero. The calf cannot make fat. The calf cannot absorb fat. The calf, eventually, cannot live.
Source: Maughlin Storm. The mutation traced cleanly back to him.
The Goldwyn Paradox
Where the story gets uncomfortable — and important — is what happens when researchers start measuring the carriers themselves.
A 2015-era study in the Journal of Dairy Science looked at heterozygous animals (one bad copy, one good) and found something nobody expected. Carriers had blood cholesterol levels roughly 25–30% lower than non-carriers. They milked faster. And — the kicker — they tended to place better at World Dairy Expo than their non-carrier herdmates.
Sit with that for a moment.

RF Goldwyn Hailey EX-97 — Supreme Champion of World Dairy Expo in 2012 and 2014, the bookends to Maya’s 2013 crown. Three Supreme banners in three years, all Goldwyn daughters, all carrying Maughlin Storm’s blood through their dam side. The “Storm line” wasn’t a preference by then. It was the breed’s idea of a champion.
The very phenotype the breed had been chasing for thirty years — the refined skin, the angular dairy character, the openness of rib, the milking speed — was, at least in part, being driven by the sub-clinical effects of carrying a single copy of a lethal mutation.
“Every time a judge tapped a refined cow over a meatier one, the breed’s HCD frequency edged a little higher. Every time a breeder reached for the catalog and ordered the sharper-looking sire, the math got a little worse.”
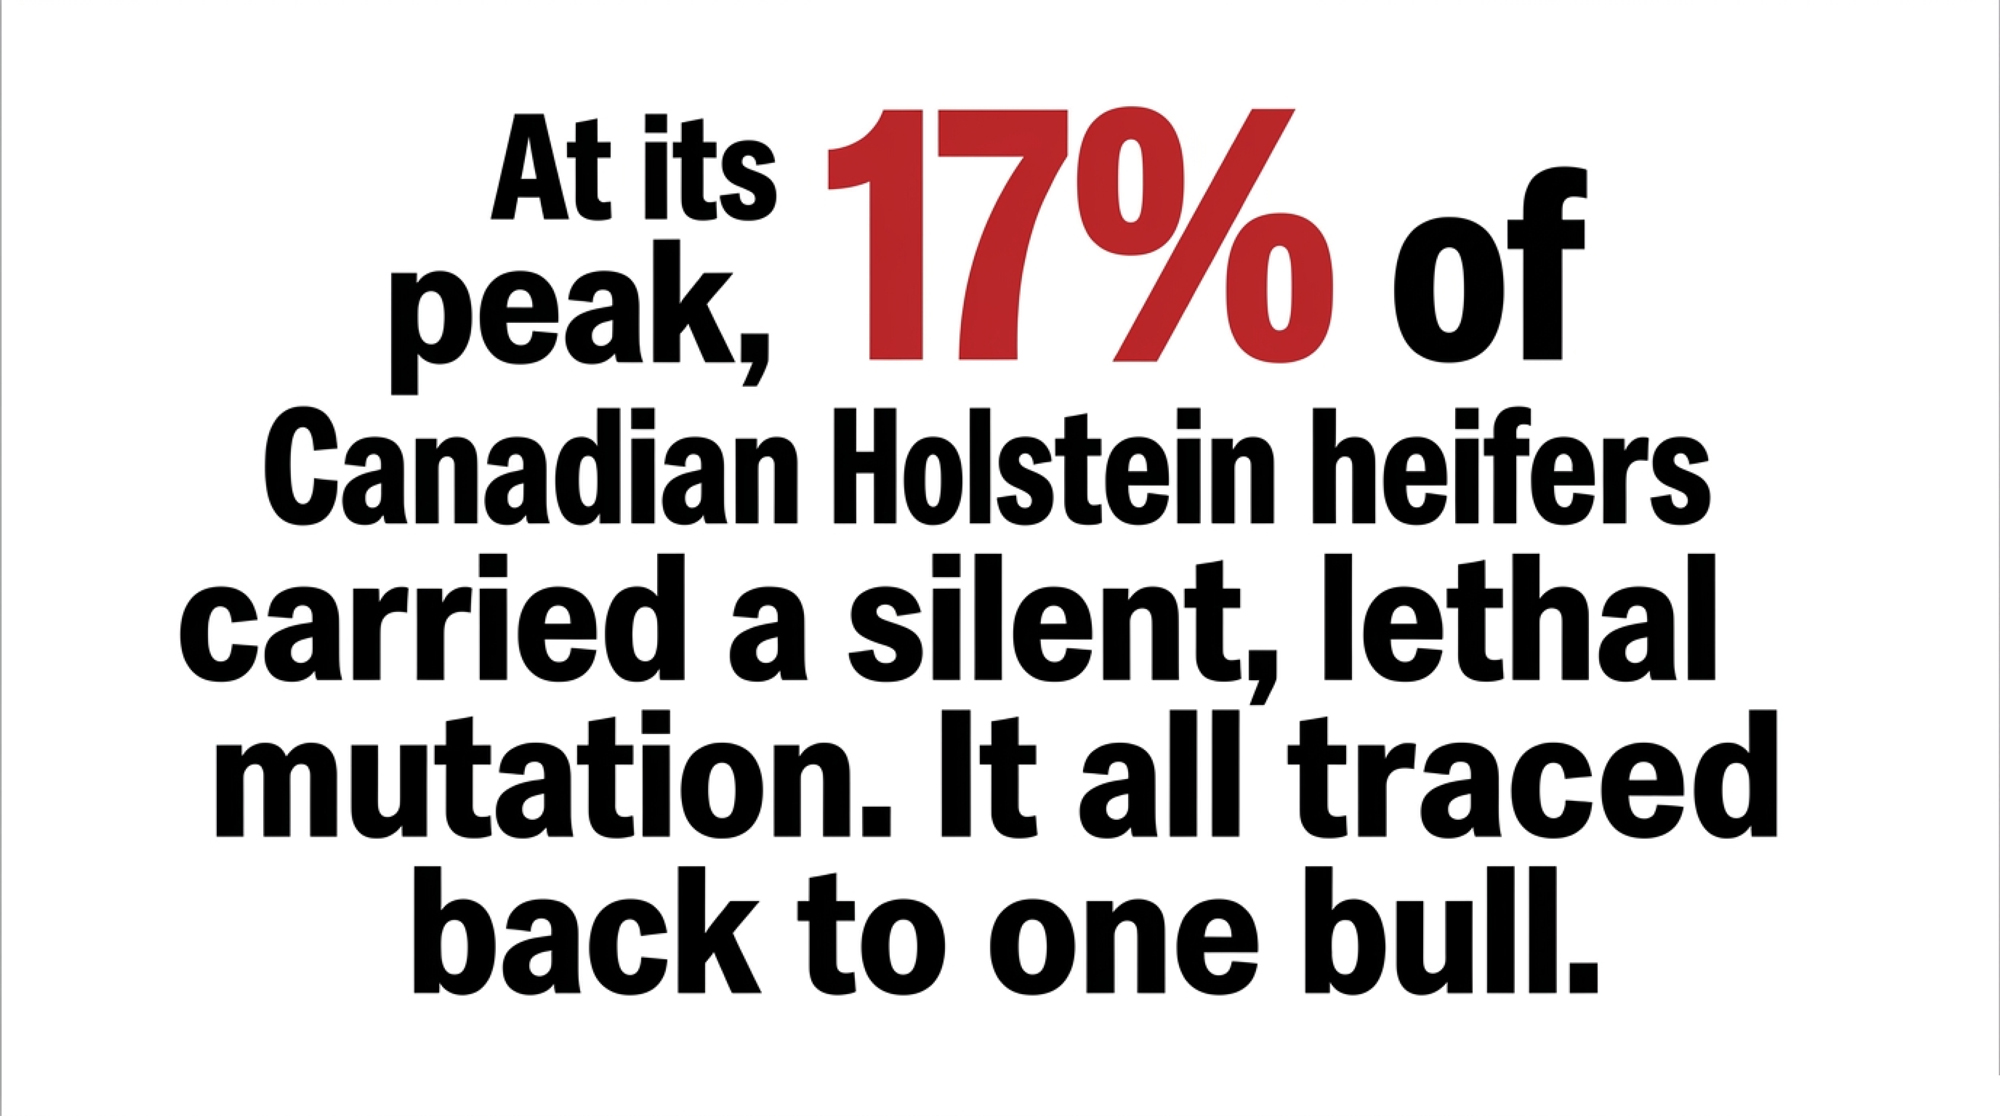
By 2012, HCD carrier frequency among Canadian Holstein heifers peaked at roughly 17%. In some heavily Storm-and-Goldwyn-concentrated herds, it cleared 40%. When CDCB ran the population in June 2015, 35,793 confirmed carriers showed up across roughly 822,000 evaluated animals — 4.4% of the population, with another 1.6% sitting in “suspect” status because of a genetic technicality.
That technicality matters. Worth a moment to unpack it.
The Mark Anthony Problem
Deep in Storm’s maternal line sits a bull called Fairlea Royal Mark (VG-Extra) — Wykholme Dewdrop Gail’s sire, and therefore Storm’s third-dam sire. Royal Mark also sired Willowholme Mark Anthony (born 1975), a bull who carried what geneticists now call the normal version of the relevant chromosome 11 haplotype.
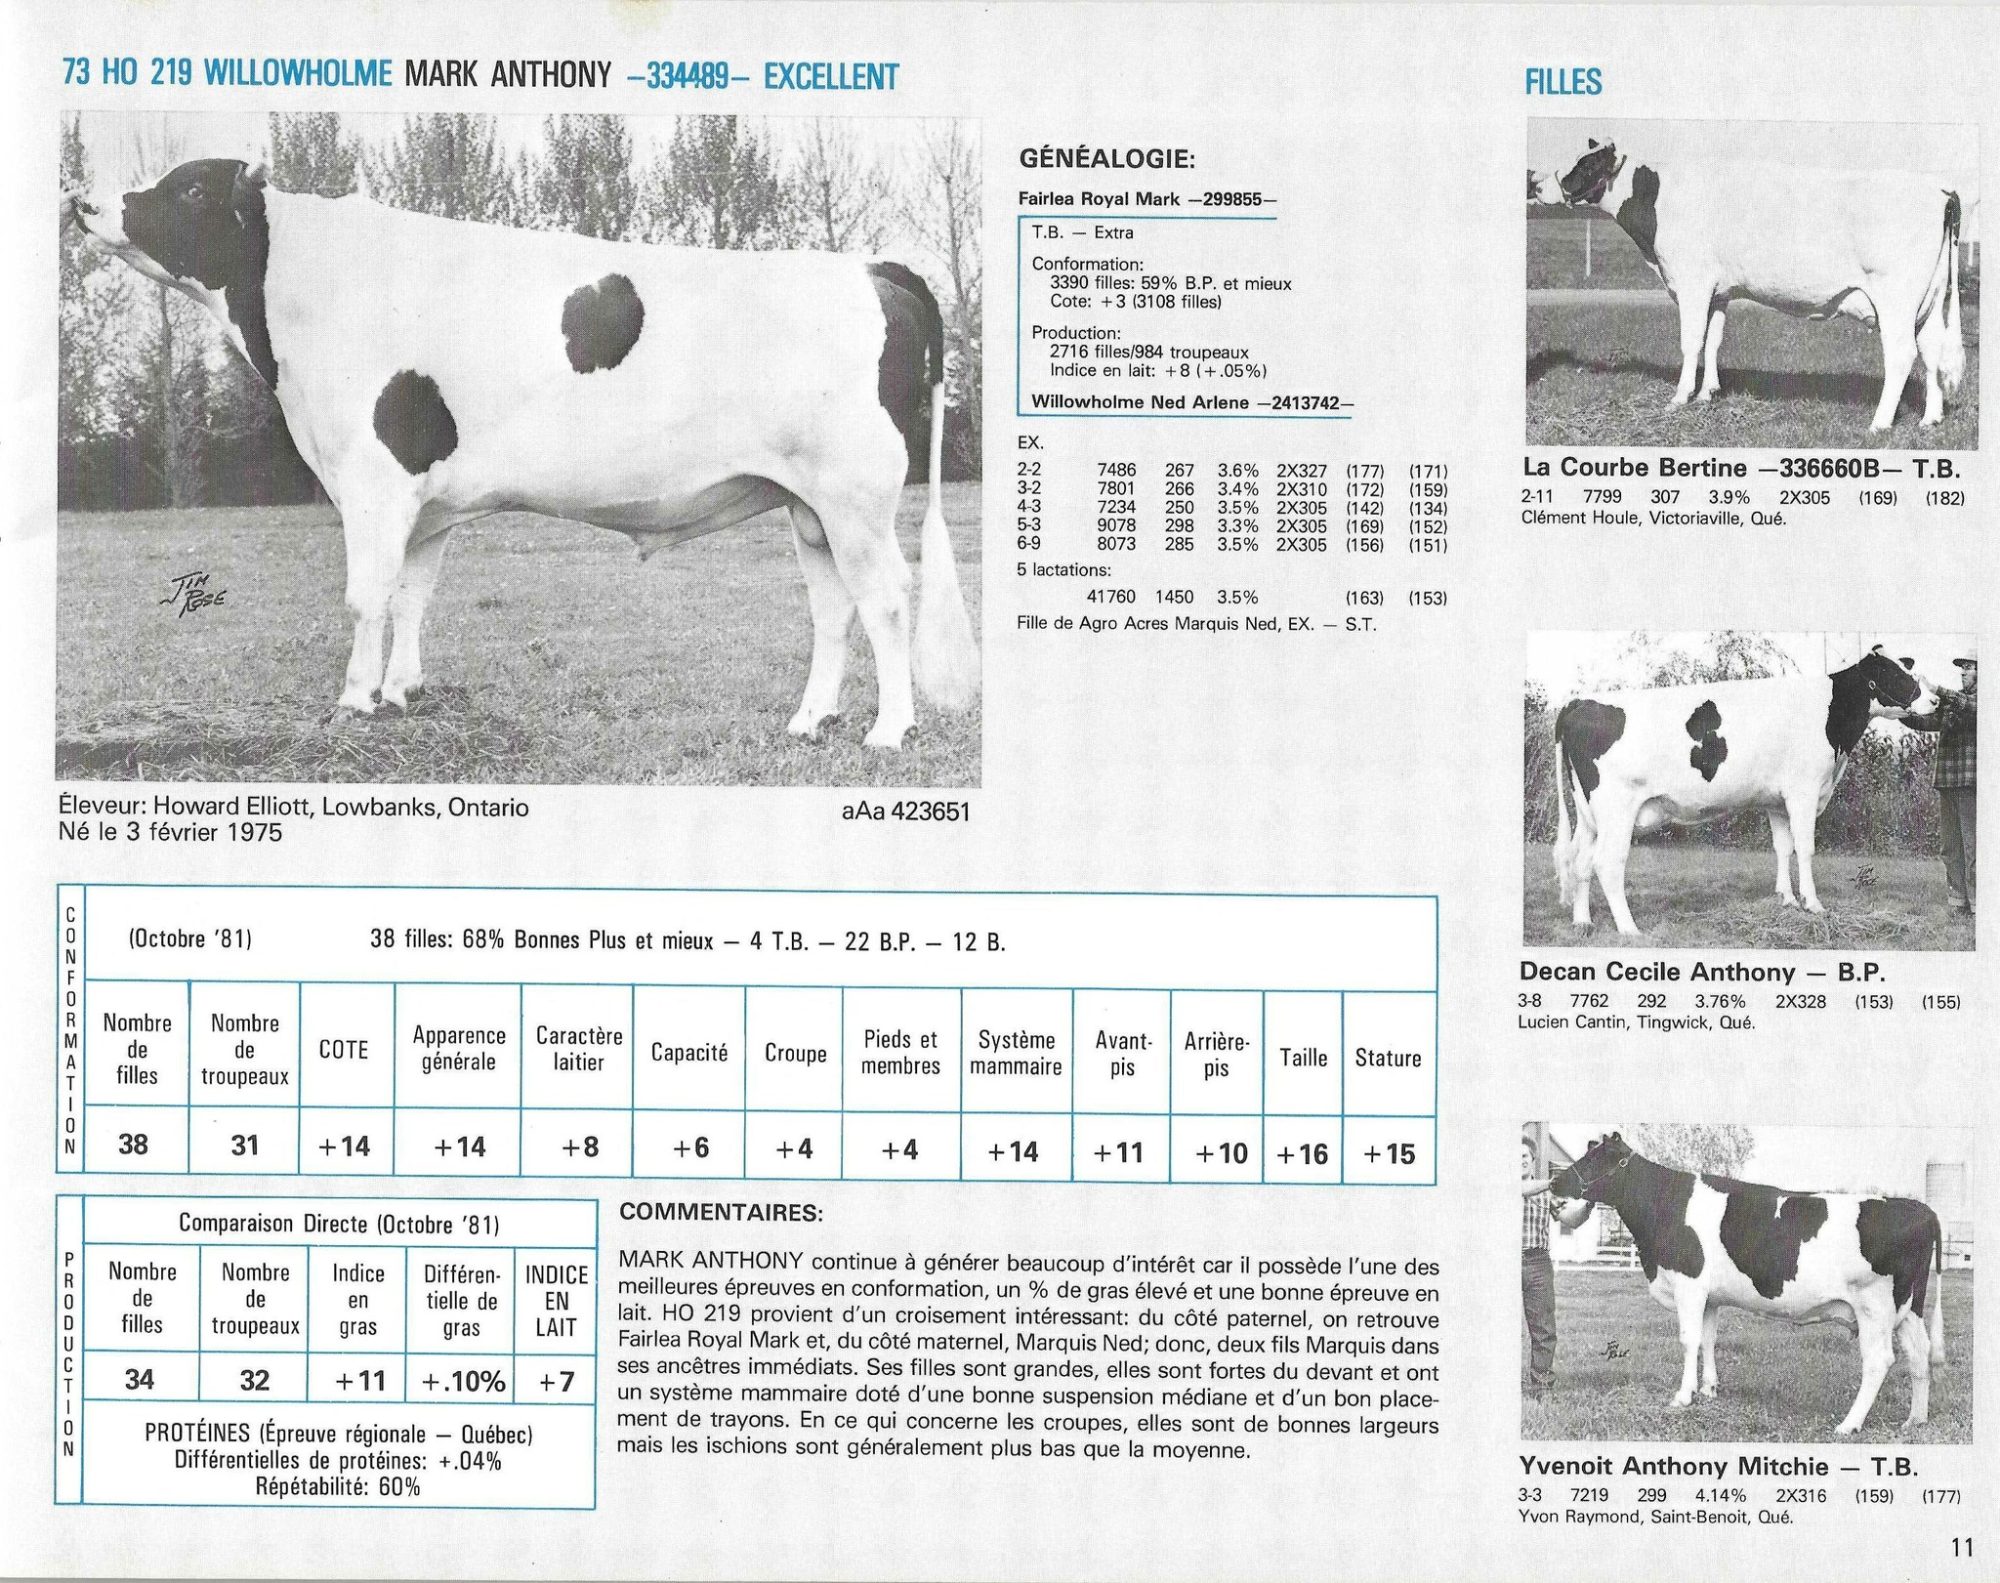
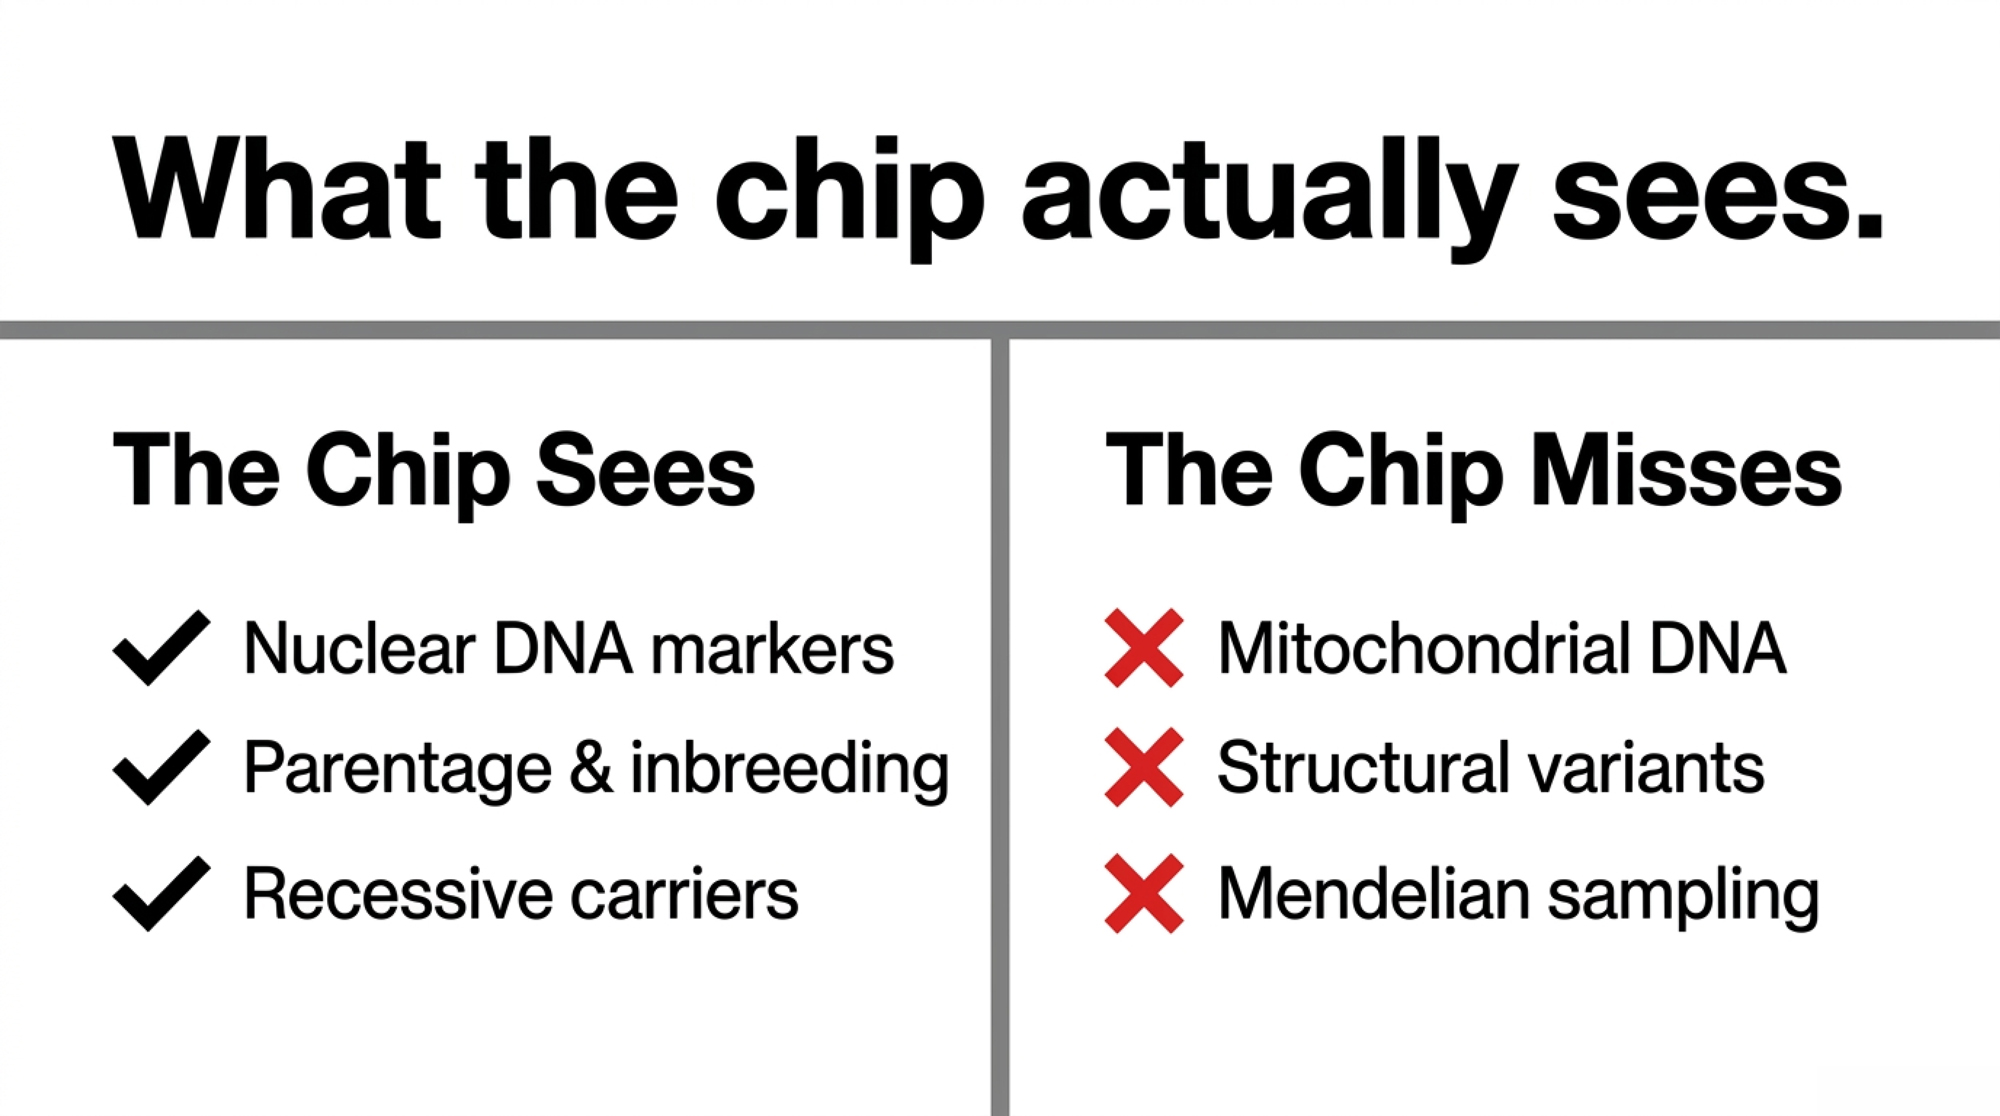
The mutated version — the one in Storm — looks almost identical to the normal Mark Anthony version on a standard 50K SNP chip. Same surrounding markers. Same haplotype block. The lethal insertion sits in a place the chip can’t see.
So when CDCB started haplotype reporting in 2015, a whole population of high-end cattle that traced back to bothMark Anthony and Storm got flagged as “suspect” — Code 3, suspect carrier; Code 4, suspect homozygous. Roughly 13,000 animals. Bulls like Comestar Leader, Lee, Outside, and Lheros, who’d received the Mark Anthony version through their dam lines, got falsely lit up before targeted research could clear them. The Dudoc Mr. Burns case became a famous example of probability models needing to catch up to reality.
The fix, eventually, was the direct gene test — a sequencing-based assay that looks specifically for the 1.3kb APOB insertion rather than the surrounding markers. Today, it’s available through Holstein Association USA and Lactanet, and it resolves Code 3 status definitively.
The lesson is worth tattooing on every breeder’s mating program: until science had a tool sharp enough to see the difference, the safe and the lethal looked exactly the same.
Act IV — What This Means for Your Barn
Don’t Blame, Manage
Let’s get this part out of the way clean.
Sandy McPhedran didn’t do anything wrong in 1987 when he paid $4,400 for Tacy. C.I.A.Q. didn’t do anything wrong in 1996 when they certified Storm as Class Extra. The thousands of breeders who used Storm in the late ’90s and his sons through the 2000s were using the best science available to them. The mutation had been hiding in plain sight for who knows how many generations before Storm — possibly all the way back through the maternal line to Musette 3213 H.H.B., the B.B. Lord import who anchors the family tree. Storm didn’t create HCD. He inherited it, and because he was extraordinary, he transmitted it everywhere.
What changed in 2015 wasn’t the breed’s character. It was the breed’s eyesight. Genomic sequencing finally got sharp enough to see what classification cards never could. Call that what it actually is — progress.
HCD Code Quick Reference
Before you read the playbook, this is the chart to bookmark. Print it, screenshot it, tape it inside the cabinet door above the breeding-records book.
| HCD Genetic Code | Designation | Breed Impact & Meaning | Required Management Action |
| Code 0 | Confirmed Non-Carrier | Free of the 1.3kb APOB insertion. | Safe to mate to any bull or cow family. |
| Code 1 | Confirmed Carrier (HCD-C) | Single-copy carrier. Healthy and often highly productive, but transmits the mutation. | Can be used safely on Code 0 animals. Never mate to another Code 1 or Code 3 animal. |
| Code 3 | Suspect Carrier | Haplotype matches Storm, but may be a false positive from the clean Mark Anthony line. | Run a direct APOB gene test immediately to verify status before any culling or elite mating decision. |
| Code 4 | Suspect Homozygous | Probability models indicate two copies of the mutation. | High calf-mortality risk. Direct gene test immediately to confirm; do not breed forward until cleared. |
The Practical Playbook
Storm’s story isn’t a cautionary tale you tell and walk away from. It’s a working manual. What every serious Holstein breeder should have running in 2026:
- Verify the HCD code on every sire, every mating. Code 0 is safe anywhere. Code 1 is fine on non-carrier cows but never on another carrier. Code 3 gets treated as a carrier until the direct gene test says otherwise.
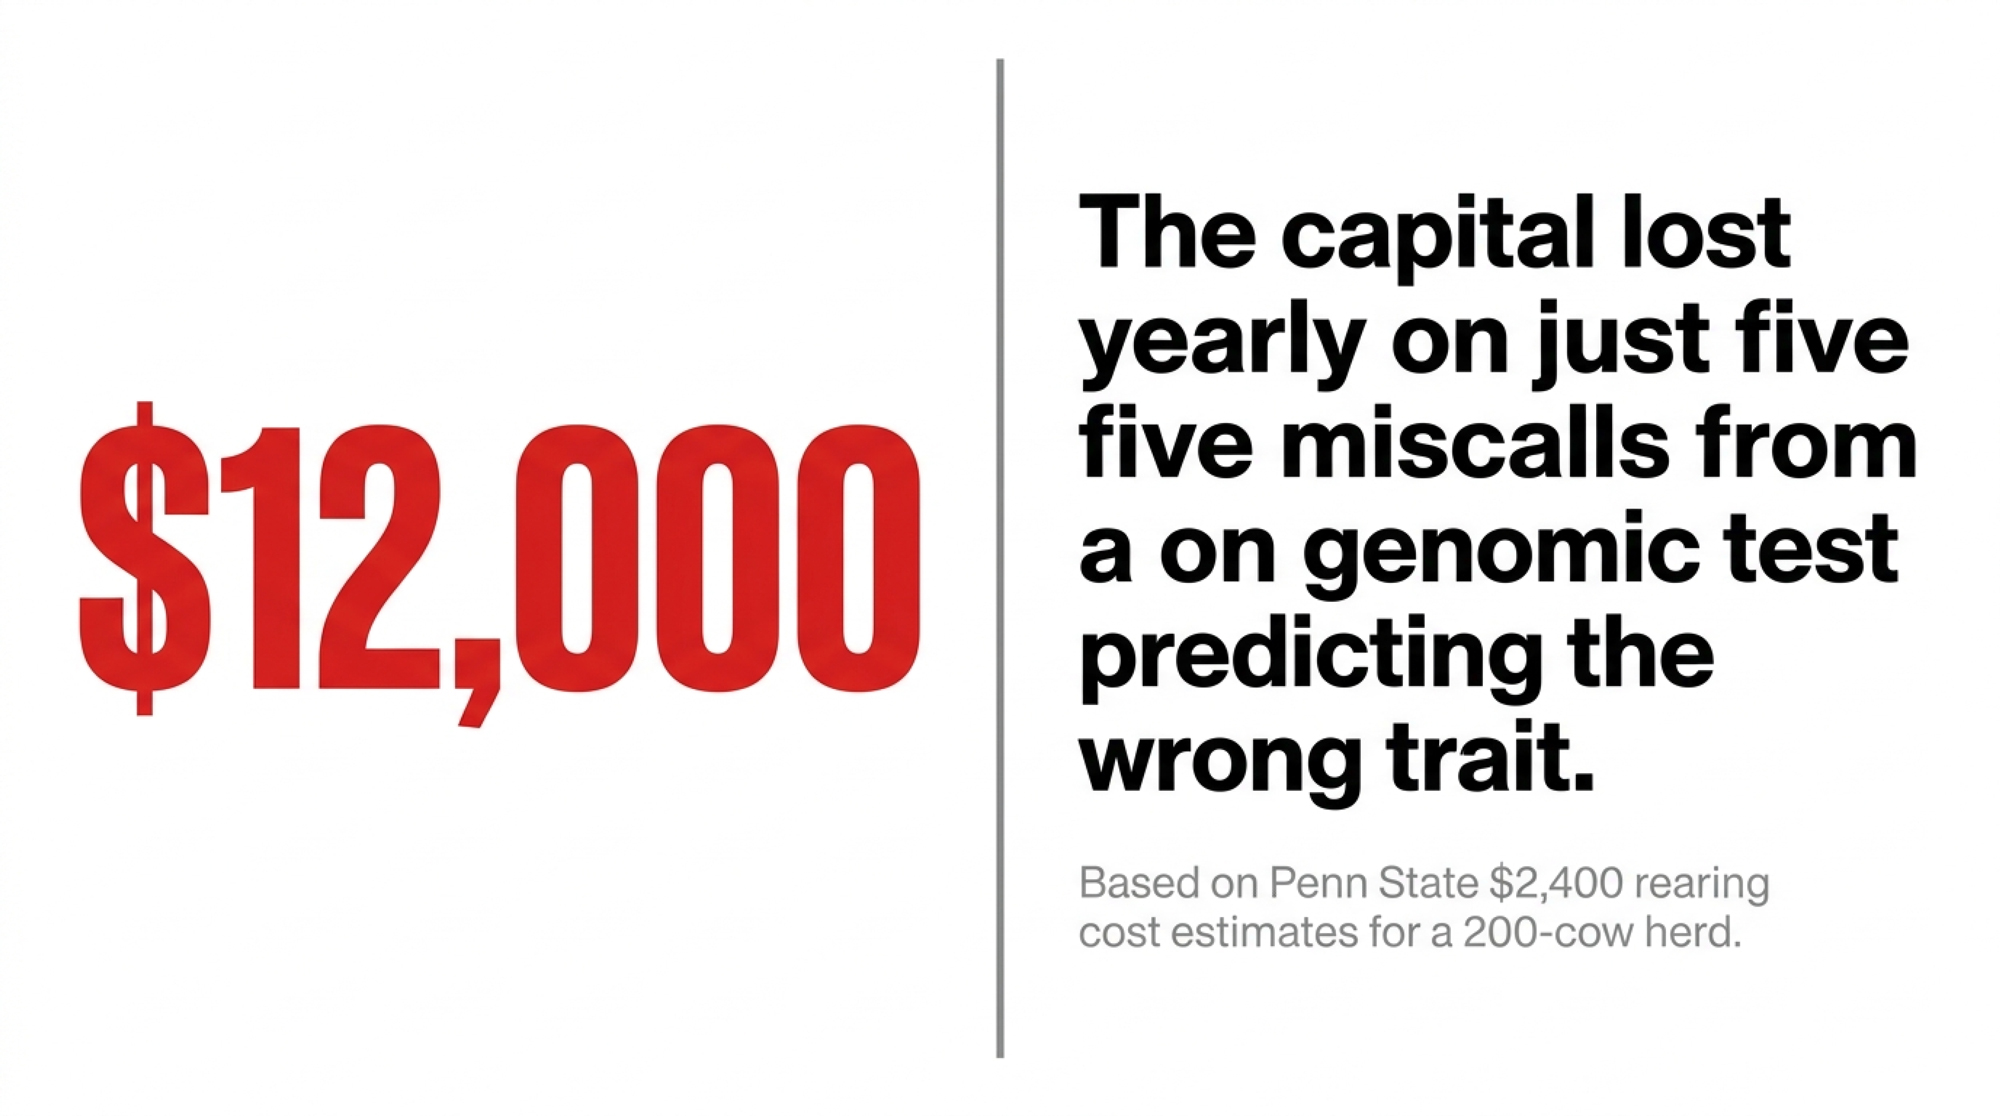
- Screen your cow families. If your herd is heavy in Barbie, Roxy, or Apple blood — and most elite-type herds are — you’ve got Storm and Goldwyn in there somewhere. Genomic test every heifer. The ROI on testing-to-avoid versus losing a four-month-old calf runs about 5:1.
- Cap expected inbreeding at 9.5%. With Holstein genomic inbreeding pushing past the 10% threshold globally in recent CDCB and Lactanet runs, this isn’t an aspiration anymore. It’s a brake pedal.
- Don’t disqualify carriers with elite merit. A +3,200 GTPI HCD-C bull is more valuable than a +2,800 GTPI clean bull, full stop. The trick is carrier management — using him only on Code 0 cows. You harvest the genetics; you sidestep the homozygous risk.
- Watch your calves. Chronic, treatment-resistant diarrhea in a two-to-eight-week-old calf, especially out of a Storm-line mating? Pull a serum chemistry panel. Total cholesterol under 40 mg/dL is a strong HCD tell.
That’s the whole defense. None of it is rocket science, and all of it is the difference between an industry that learns from its history and one that repeats it.
Epilogue — The Standing Stones
Storm’s own ending isn’t well-documented in the public record — typical for an AI sire of his era. By all accounts, the bull himself faded out of active service in the late 1990s as his sons came online and made him obsolete. His straws kept moving, though. They moved through the Goldwyn revolution of the 2000s, into the maternal sides of bulls like Buckeye and Dolman that, alongside Goldwyn, anchored that 12% registration share in 2008.
You can’t unwind that. You wouldn’t want to. The Storm line is also why your barn is full of cows that classify well, milk persistently, and look like the breed standard rather than something a hundred kilos heavier from the 1970s. Every refined topline you can run a hand along, every well-attached fore udder, every cow that walks correctly into a sixth lactation — Storm earned a piece of that, and it belongs to him as fully as the carrier code does.
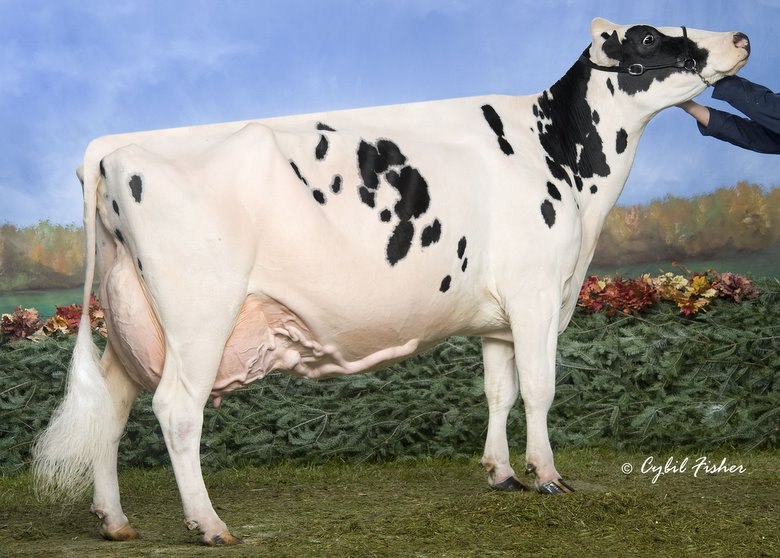
Walk into a modern Holstein barn — any of them, anywhere — and run your hand along a topline. Look at the rump on that fresh second-calver. Watch how a Goldwyn-line cow moves into the parlor. Storm is in there. The VanWyk brothers are in there, too, and so is the Master Breeder Shield they earned in 1978. Sandy McPhedran’s $4,400 hunch is in there. April Expectation Dewdrop’s hundred-thousand-pound lifetime is in there, six and seven and eight generations deep.
So is the lesson the breed had to learn the hard way — that what you can see is never the whole picture. The most important thing about a great bull is sometimes the thing you need a microscope to find. That genomics didn’t replace the breeder’s eye. It completed it.
Storm’s not in the Hall of Fame in spite of HCD. He’s there, and he’s the reason we have the tools to manage HCD. Both of those truths belong on the same plaque.
That’s the legacy.
Honor him by reading the codes.
Maughlin Storm (HOCAN000005457798), VG-Extra. Born August 26, 1991. Bred by Sandy McPhedran & Family, Rockwood, Ontario. Proven at C.I.A.Q., St-Hyacinthe, Quebec. Sire: Madawaska Aerostar (EX-Extra). Dam: Wykholme Dewdrop Tacy-ET (VG-89-5*). Maternal granddam: Wykholme Dewdrop Gail-ET (EX-10*) by Fairlea Royal Mark. Haplotype status: HCD-C. Genetic codes: B/R TV TL. Tail-female line traces to April Expectation Dewdrop (GP), the VanWyk foundation cow purchased in 1953 for less than $300.
Key Takeaways
- If your herd carries Goldwyn, Buckeye, or Dolman blood — and most elite-type herds do — you’ve got Storm in there somewhere. Genomic-test heifers and treat HCD codes as non-negotiable on every mating sheet.
- Don’t blacklist carriers with elite merit. A +3,200 GTPI HCD-C bull beats a +2,800 GTPI clean bull all day, as long as you mate him only to Code 0 cows. That’s harvesting the genetics without buying the risk.
- Code 3 (suspect) traces back to Mark Anthony, not necessarily Storm. Run the direct APOB gene test through Holstein Association USA or Lactanet before you cull a bull or a cow family on a haplotype flag alone.
- Chronic, treatment-resistant scours in a calf two to eight weeks old, especially out of a Storm-line mating? Pull a serum chemistry panel. Total cholesterol under 40 mg/dL is a strong tell — and the 5:1 ROI on testing versus losing that calf is the only barn math that matters.
Continue the Story
- The Cow That Built an Empire: Comestar Laurie Sheik’s Unstoppable Genetic Legacy — Built in the same era as the Dewdrop line, this legendary matriarch fueled the 1990s type revolution. She produced the millionaire sires that dominated LPI charts while navigating the identical pedigree lines caught in HCD crosshairs.
- Durham vs. Goldwyn: A Clash of Two Titans — Shaped by the same forces that prioritized extreme type, this retrospective details the titanic 2000s breeding wars. It exposes how the global obsession with show-ring style built the very genetic monoculture that accelerated the HCD crisis.
- When Lightning Strikes: The Braedale Goldwyn Story That Changed Everything — Carrying forward what Storm started, his grandson Goldwyn took global Holstein architecture to its absolute zenith. This profile tracks that historic lineage from a singular Canadian lightning strike to the complex genomic realities we manage today.
 The Sunday Read Dairy Professionals Don’t Skip.
 The Sunday Read Dairy Professionals Don’t Skip.
Every week, thousands of producers, breeders, and industry insiders open Bullvine Weekly for genetics insights, market shifts, and profit strategies they won’t find anywhere else. One email. Five minutes. Smarter decisions all week.