


April’s CDCB reset moved every Holstein PTA in your inbox. It didn’t touch the three things the $45 chip was never built to see — and one of them quietly prices every embryo you sell.
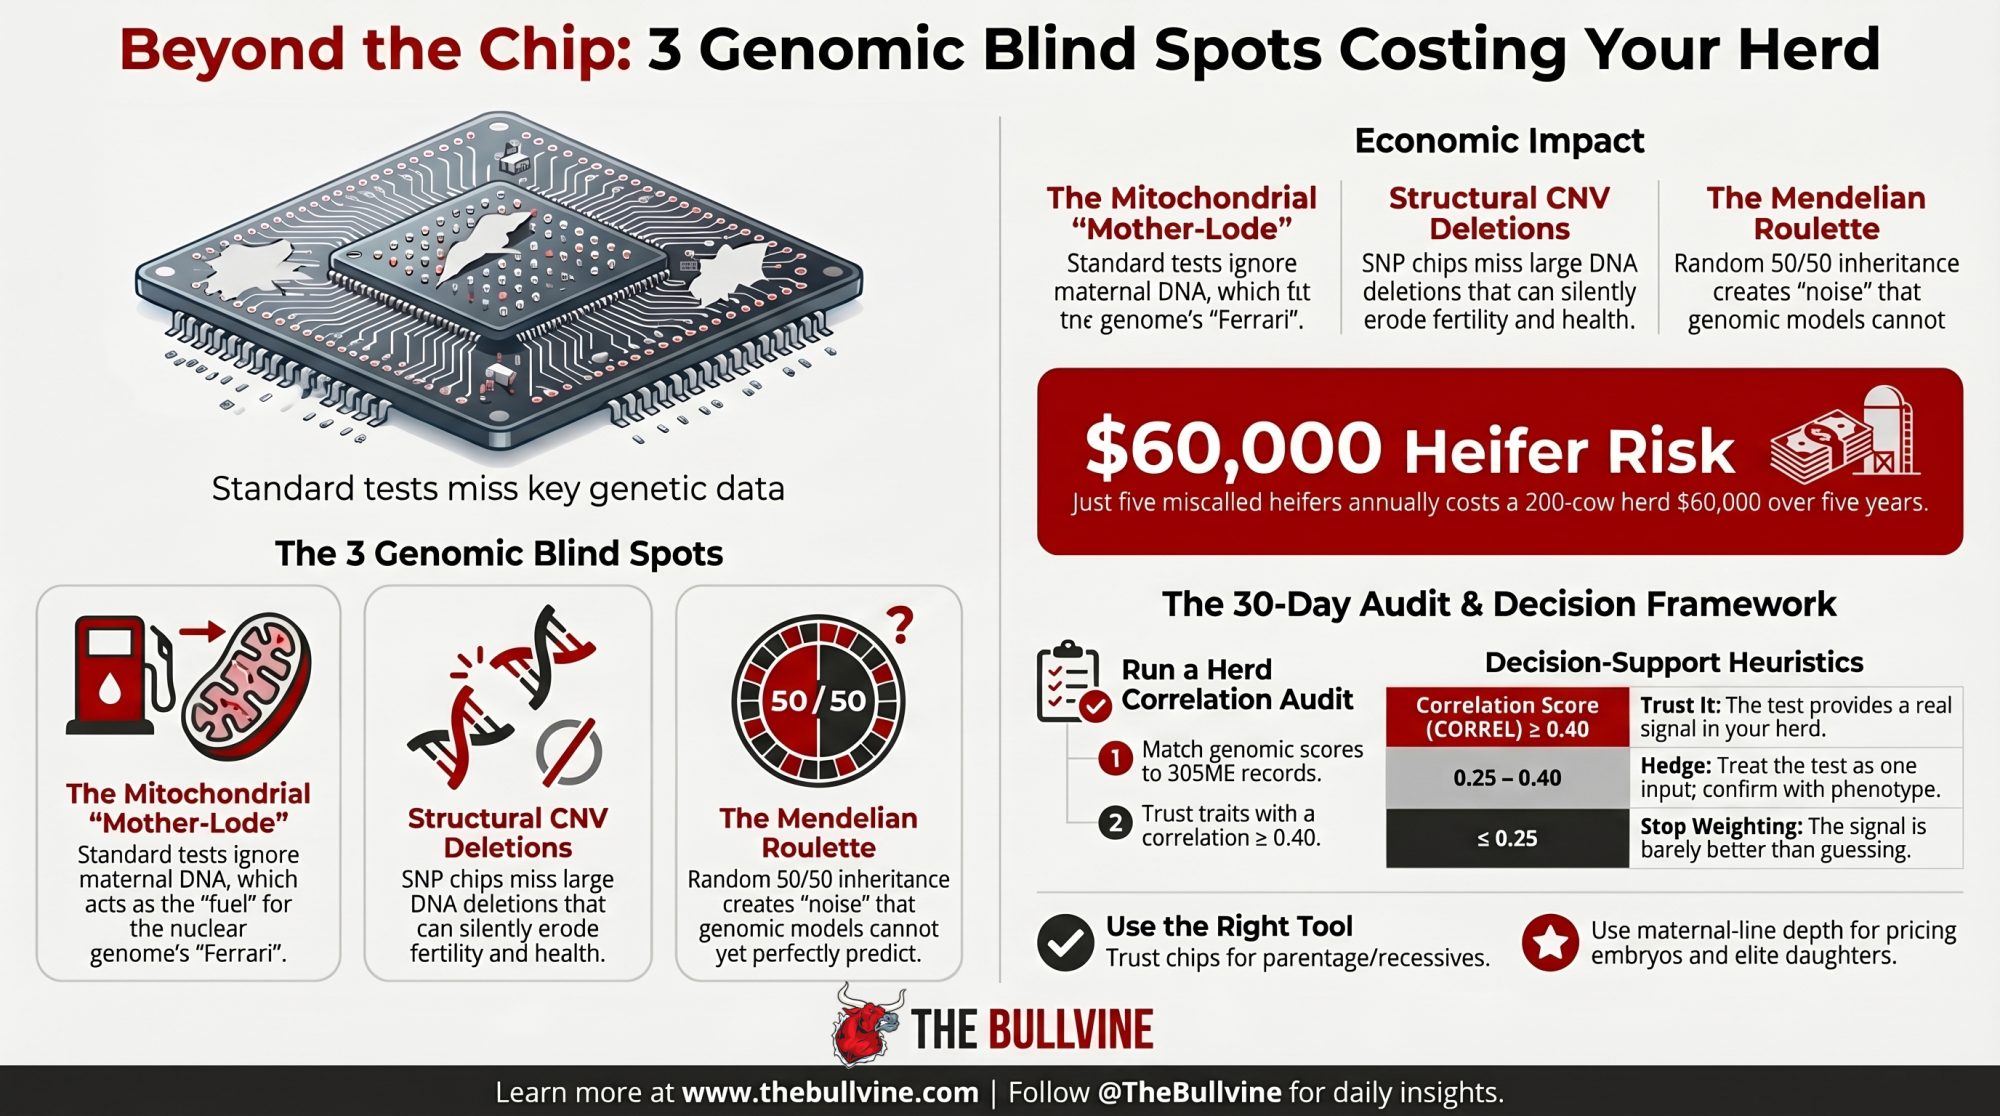
Executive Summary: CDCB’s April 2025 base change reset every Holstein PTA in your inbox, but it left three structural limits of the $45 SNP chip untouched — mitochondrial DNA, copy number variations, and Mendelian sampling. None of them show up on a commercial genomic report, and all three are quietly costing capital on heifer pens and embryo sales right now. On a 200-cow herd raising 60 replacements at Penn State’s $2,400 cost-to-first-calving, just five miscalls a year on a trait your test doesn’t actually predict is $12,000 gone — $60,000 over five years, before opportunity cost. The fix isn’t more testing; it’s Path 3, a 30-day CORREL audit matching your last two years of genomic scores to classification and 305ME records, with farm-level thresholds of ≥0.40 (trust it), 0.25–0.40 (hedge), and ≤0.25 (stop weighting). Peer-reviewed work (Wiggans et al., 2017; Kadri et al., 2014; Schutz et al., 1994) backs every limit — and a 660-kb deletion carried at 13–23% in Nordic Red is the cautionary tale Holsteins haven’t fully reckoned with. Where genomics still wins unambiguously: parentage, recessive carriers, haplotypes, and inbreeding control. Everywhere else, the breeders pricing the cow family separately from the composite index are the ones still getting paid.
April 2025 quietly reset U.S. dairy genetics. CDCB’s scheduled April update re-anchored Holstein production PTAs to a refreshed reference base. Every breeder’s index landed in the inbox reading differently than it had in January. No cow on the ground changed. The yardstick did.
For a commercial breeder running a cull sheet, that’s an annoyance. For a seedstock operation selling embryos, marketing young sires, or pricing flush pregnancies on composite index, it’s something else.
“The number you paid $45 a head to generate is a model output — not a measurement.”
And that model gets rebuilt on a schedule nobody in your barn controls. The April 2025 recalibration is at least visible. It lands in your inbox. The three structural limits this article is actually about don’t.
| Blind Spot | What It Is | Why the Chip Misses It | Real-World Cost | Fix |
|---|---|---|---|---|
| Mitochondrial DNA | Maternal genome, passed intact dam-to-daughter, no recombination | SNP chips scan nuclear DNA only; mtDNA is a separate genome entirely | Proven cow families carry a production signal buyers pay a premium for — the index can’t price it | Price cow families separately from composite index; don’t treat two embryo lots as interchangeable |
| Copy Number Variations (CNVs) | Deletions or duplications of whole DNA chunks during meiosis | Flanking SNP markers stay intact; the chip reads “marker present” even when the gene is gone | Nordic Red: 660-kb deletion at 13–23% frequency dragged fertility down for years before discovery (Kadri et al., 2014) | Run herd-level correlation audits; investigate structural variants when phenotype consistently diverges from index prediction |
| Mendelian Sampling Variance | The random 50% each calf actually inherits from each parent | Models predict average transmission, not which half was drawn; genomic models capture only a fraction of this variance | Two full sisters from same elite flush can draw very different genetic hands — test can’t tell you which | Use genomics to flag the bottom quartile; walk the pens and use maternal-line depth for the middle 60% |
The “Base Change” Illusion
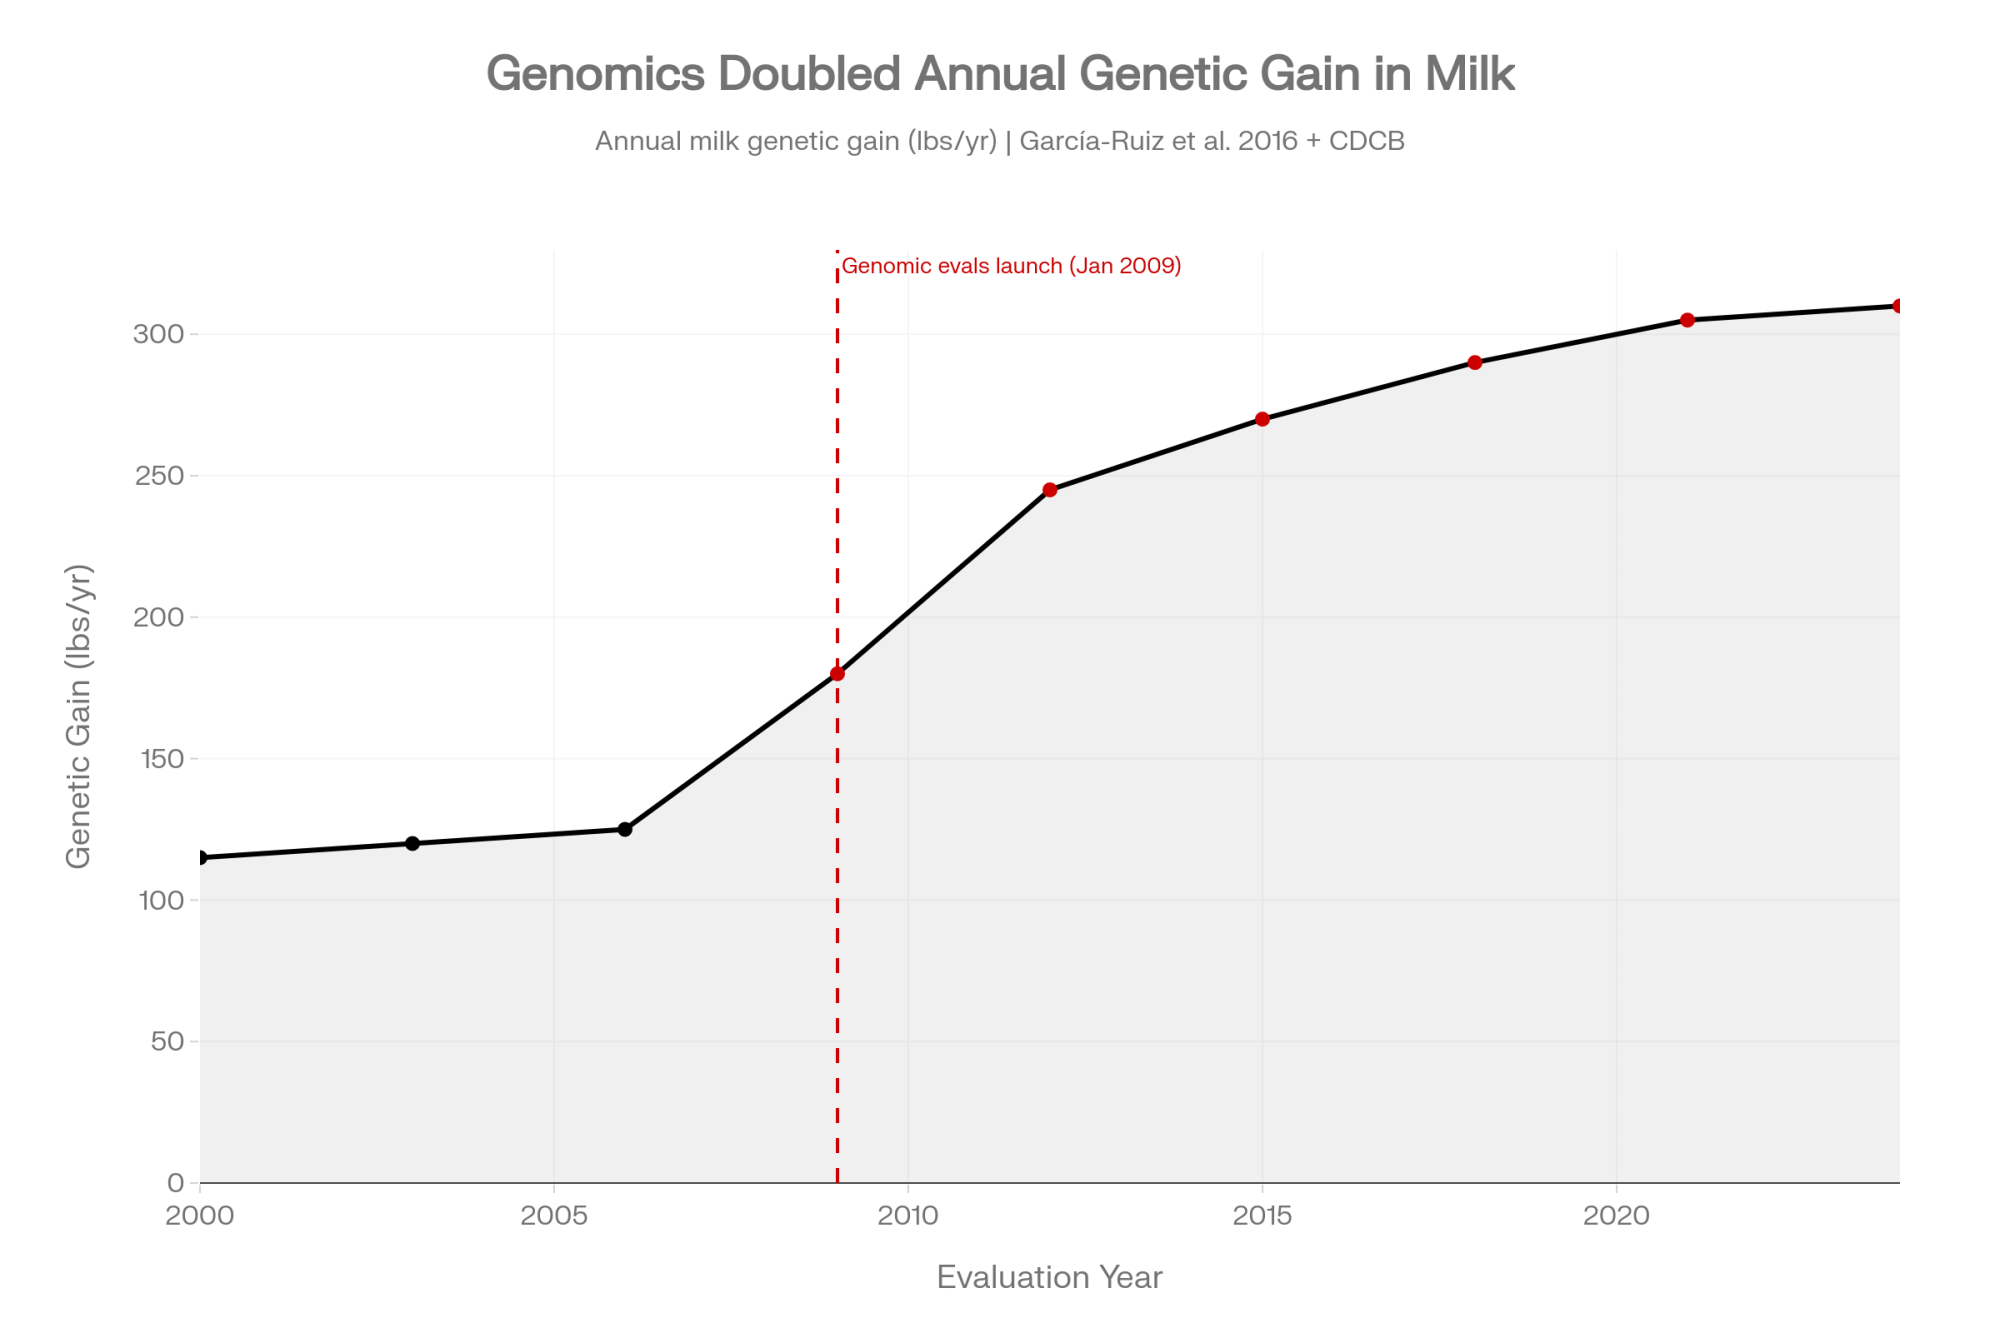
Before the critique, the credit. Genomic testing has genuinely changed dairy breeding. Since USDA’s AIPL rolled out official U.S. genomic evaluations in January 2009, and CDCB took over in 2013, Holstein genetic gain has accelerated substantially. Sire-path generation intervals fell from roughly seven years to under three, with annual gains across yield and health picking up sharply (García-Ruiz et al., 2016). Breeders who built reputations in the 1980s and 1990s on eight-year sire turnaround are watching the same genetic ground covered in under half the time.
That part isn’t in dispute. What’s less discussed — in producer conversations, in industry press, in day-to-day mating decisions — are three structural limits built into the tool itself. They’re not defects. They’re properties of how SNP-based testing works. And they’re the reason the breeders with the deepest cow families, the ones still moving flush daughters into sale rings at premiums the composite can’t explain, don’t treat the $45 report as gospel. They treat it as one input out of three.
Is it a $45 insurance policy or a $45 gamble? Honestly, that depends on what traits you’re weighting on your cull sheet — and whether the test is actually predicting them in your herd. Most breeders have never checked.
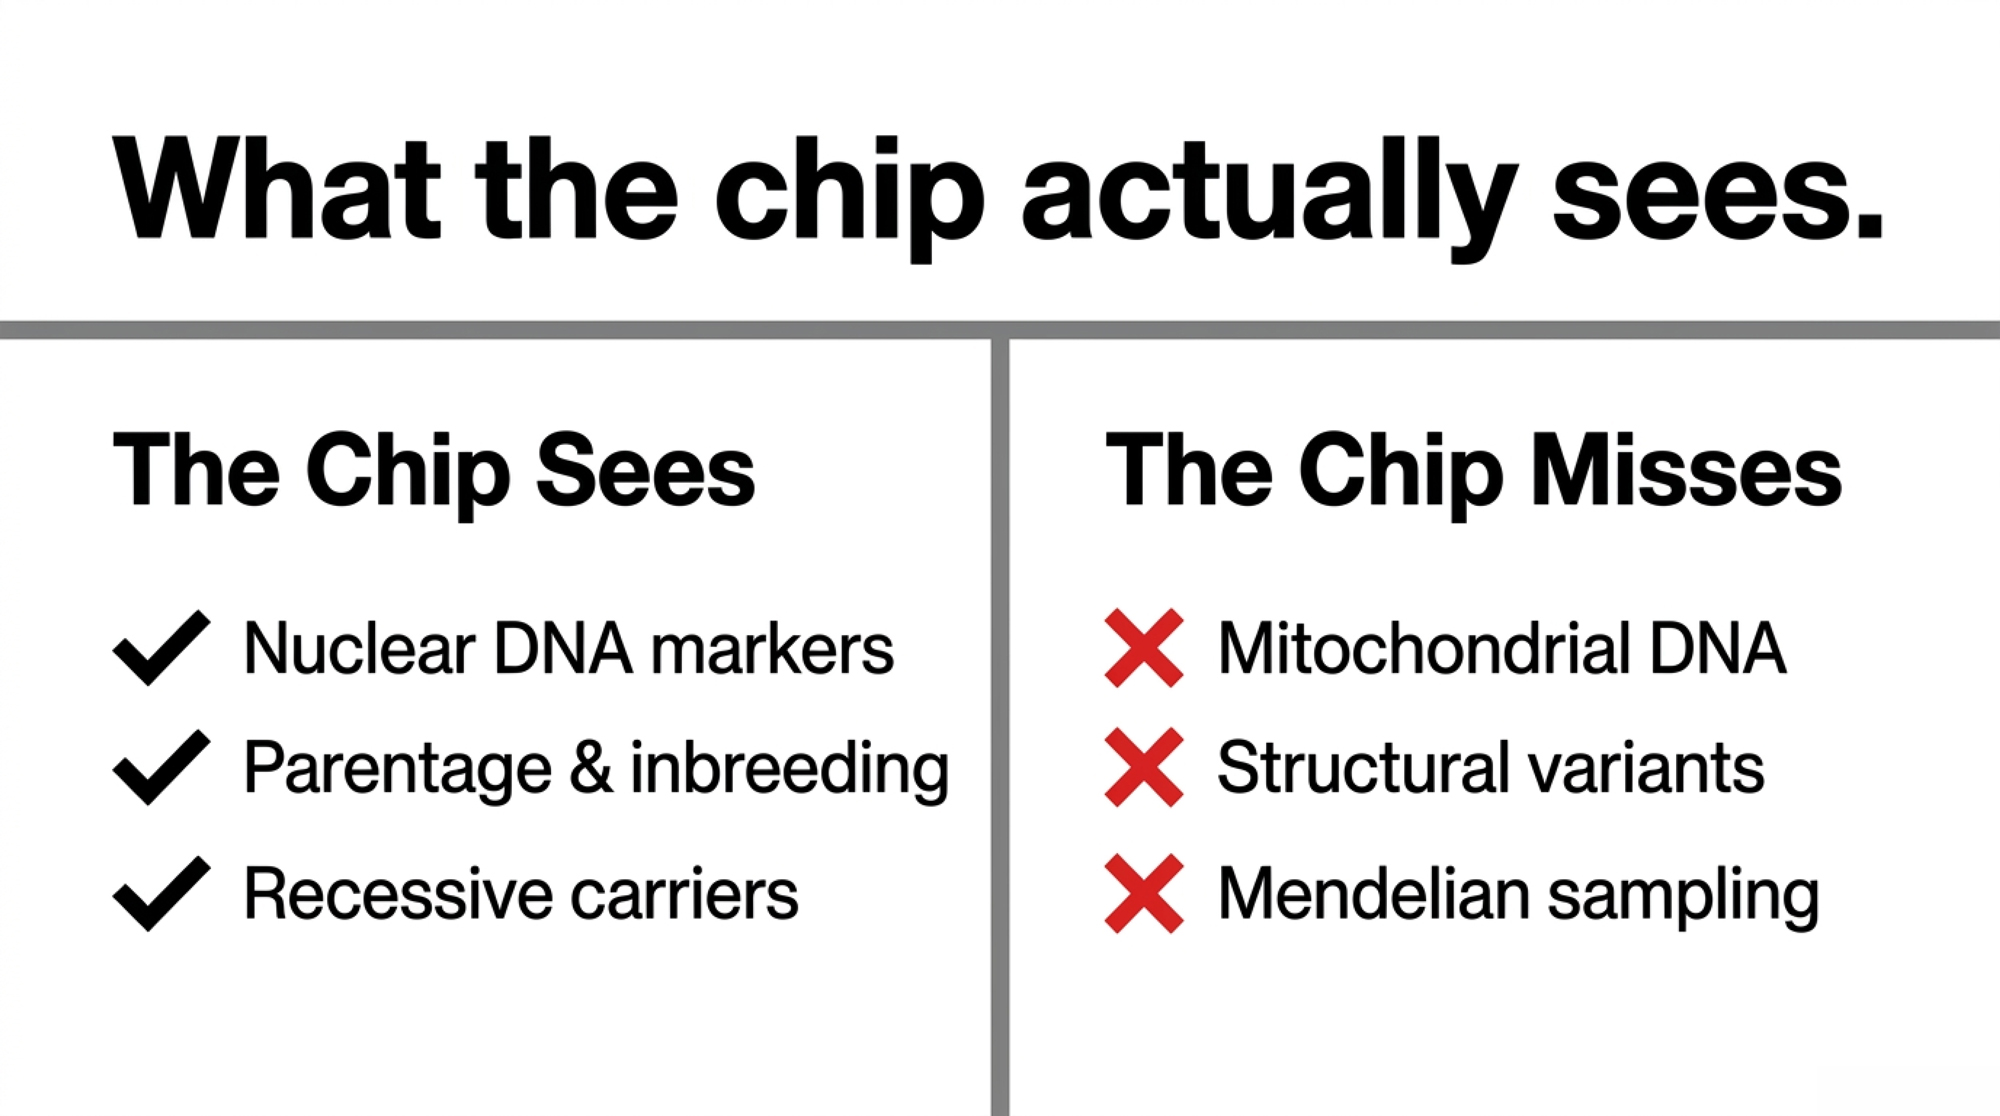
What the SNP Chip Sees vs. What It Misses
| What the $45 SNP chip captures | What it doesn’t |
| Single-letter nuclear DNA changes across ~60–80k markers | Mitochondrial DNA (the maternal genome, in full) |
| Parentage verification | Structural variants — deletions, duplications, CNVs |
| Recessive carrier status (haplotypes, BLAD, CVM, HH1–HH6) | Which specific 50% a calf actually inherited |
| Inbreeding estimates via genomic relatedness | Individual Mendelian sampling variance for polygenic traits |
| Predicted transmitting abilities for published traits | Trait performance your herd actually delivers on those same animals |
That right-hand column is the whole article.
Limit 1 — The Mitochondrial “Mother-Lode”
The first blind spot sits inside every cow in your barn and has never shown up on a commercial genomic report. It’s mitochondrial DNA — the maternal genome passed intact from dam to daughter to granddaughter. No recombination. No shuffling. No sire-side contribution.
Every commercial test on the market scans nuclear DNA. None measure mtDNA. The foundational work by Schutz et al. (1994) established that cytoplasmic line effects account for a measurable share of production variance in dairy cattle. Magnitudes vary by study, population, and trait. But the signal is real, repeatable, and outside the scope of SNP-based commercial testing. For anyone watching the pedigree world shift toward genomic superstars with thin maternal records, it’s part of the hidden economics of proven maternal lines the index can’t price.
Here’s where it walks into a mating decision you’re already making. Two embryo lots. Same sire. Identical gTPI. One donor comes from a four-generation proven maternal line — classified daughters at every step, documented production, health records that hold up. The other is a two-year-old genomic superstar with no daughters on the ground yet.
On paper, those embryos are interchangeable. They aren’t. You’re buying two different mitochondrial genomes, and every female descendant will carry that maternal lineage unchanged, forever. You can upgrade nuclear DNA every generation. You can’t breed the mtDNA out.
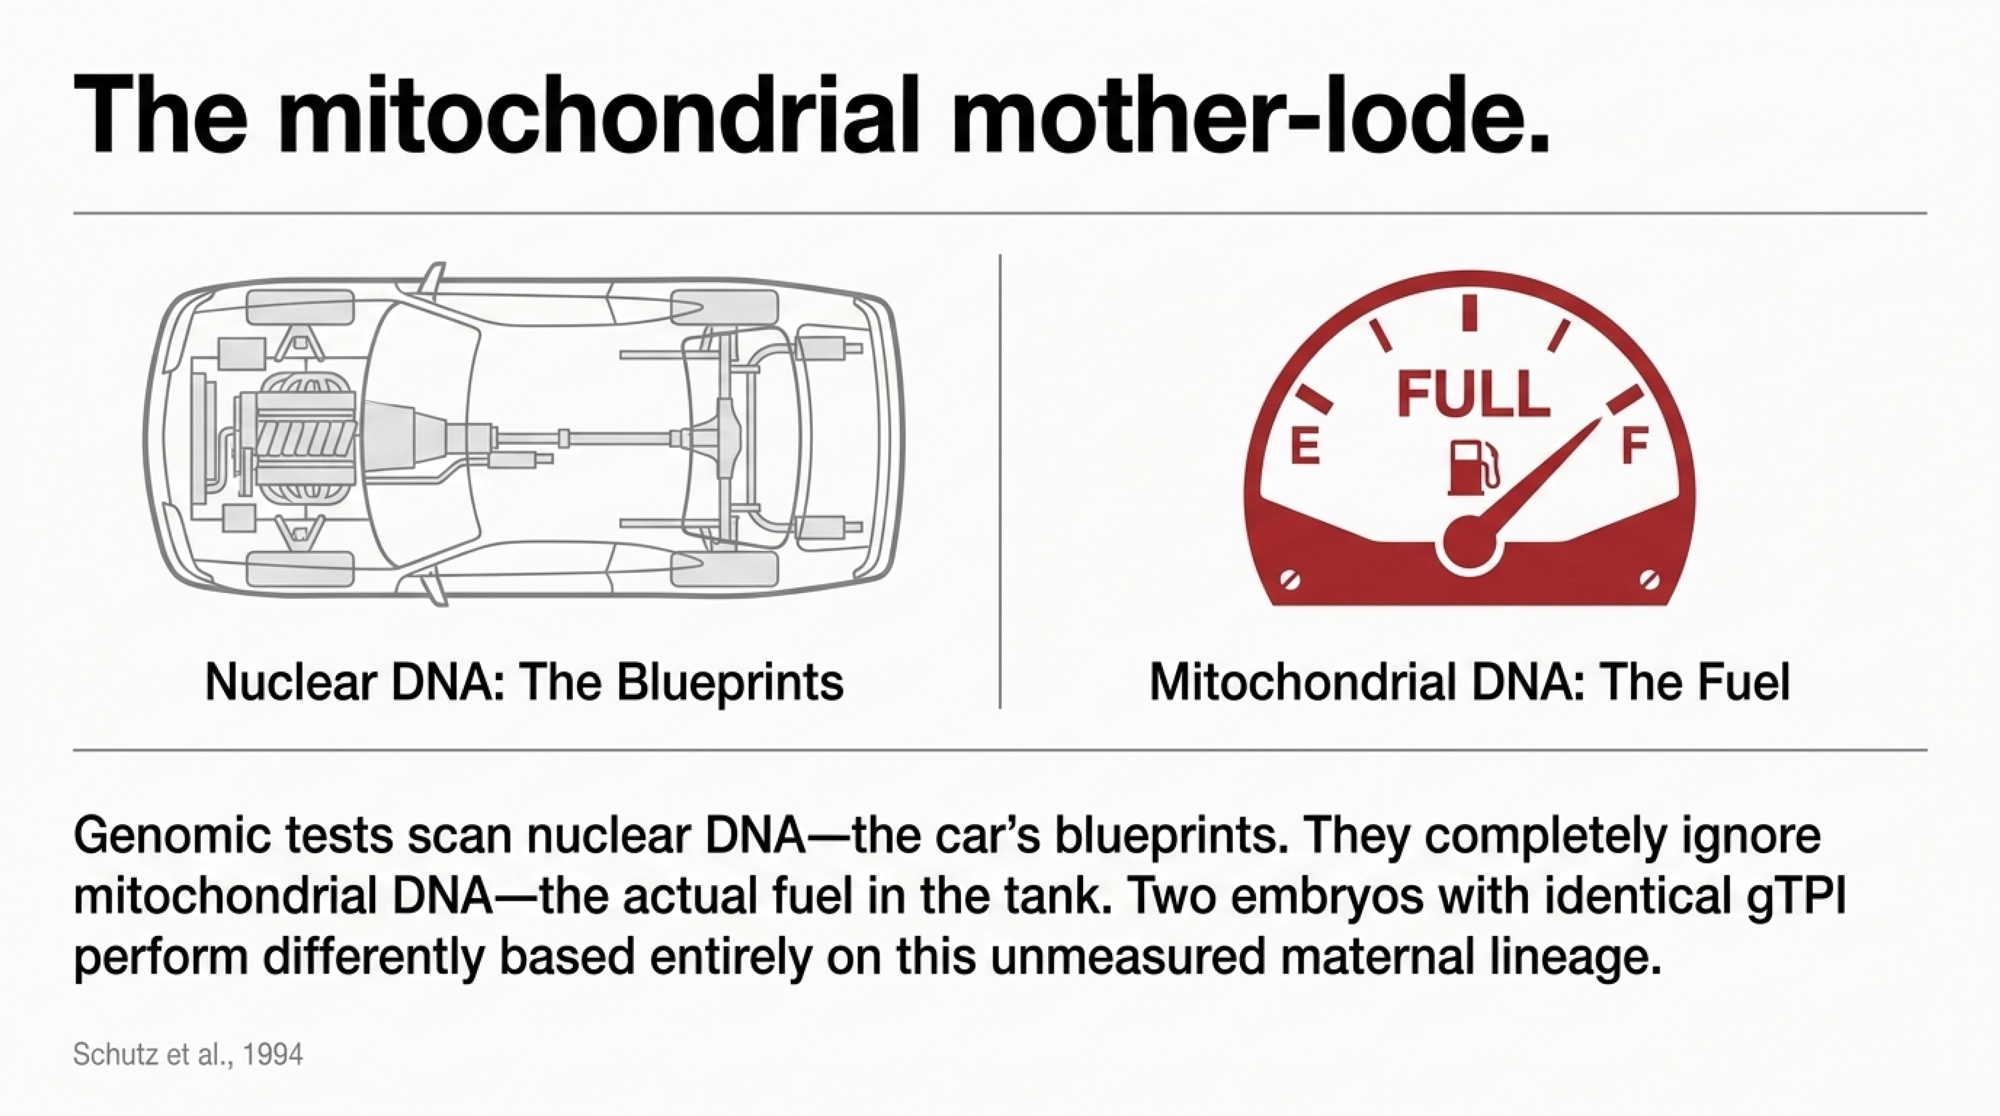
Think of the nuclear genome as the blueprints for the car — the engine size, the leather seats, the aerodynamics. The mitochondrial DNA is the quality of the fuel in the tank. The $45 test tells you that you’ve built a Ferrari. But if the maternal line has “low-octane” mitochondria, that Ferrari is going to underperform what the blueprints suggested. The breeders who stick to proven cow families are essentially ensuring they have a high-octane fuel supply that the genomic report isn’t even checking for.
The old-school breeders who kept flushing inside proven cow families weren’t being sentimental. They were capturing a signal the $45 test can’t see. The ones who held on to that practice while everyone else chased the newest genomic top-list are — quietly, one sale at a time — still getting paid for it.
Limit 2 — The CNV Ghost in the Machine
The second blind spot is copy number variation — and it produced one of the most documented breeding disasters in recent European dairy genetics.
SNP chips are built to detect single-letter changes in DNA. They aren’t built to see when an entire chunk of DNA has been deleted or duplicated during meiosis. When that happens inside a CNV region, the flanking markers often stay put. The test still reports “marker present.” The functional gene it was supposed to tag? Gone.
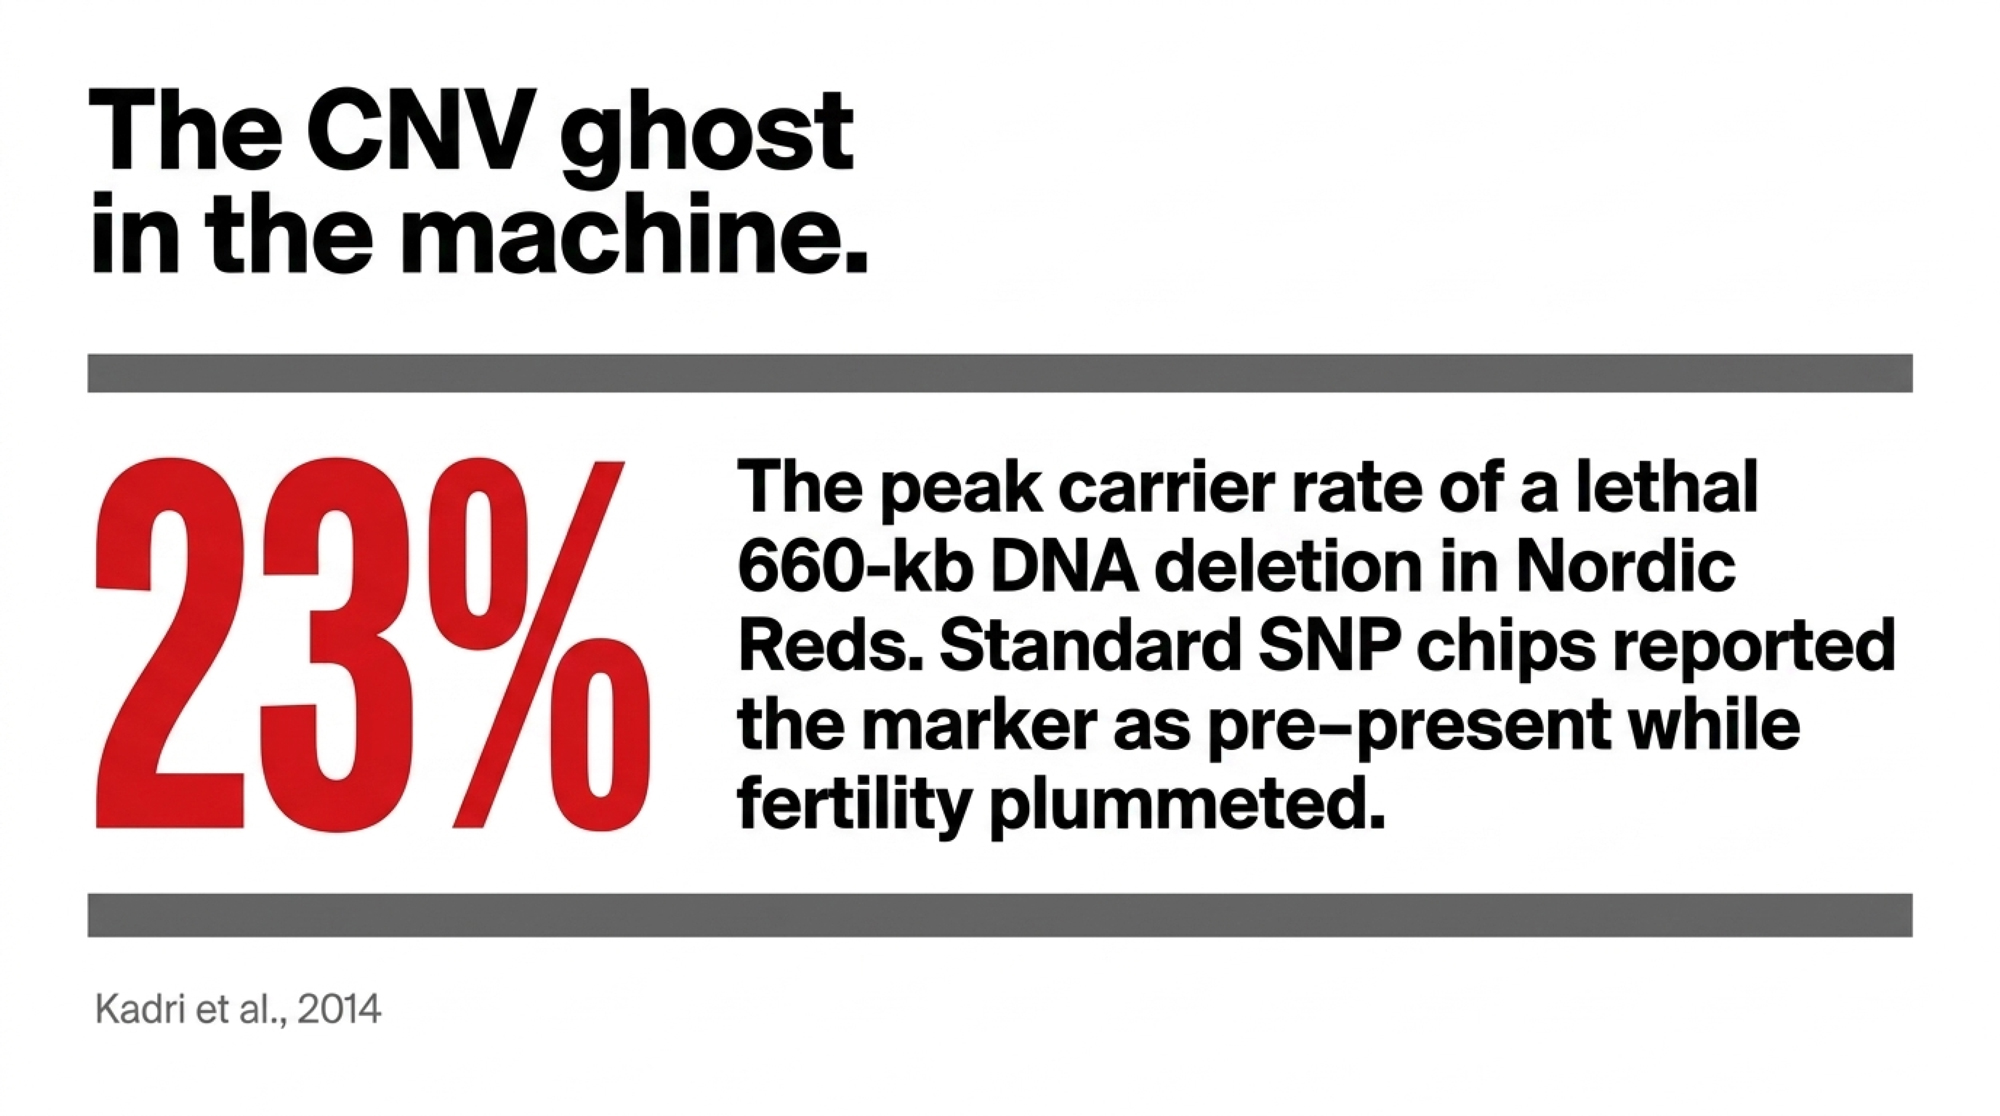
In Nordic Red cattle, researchers fine-mapping a major fertility QTL found the real culprit wasn’t a SNP — it was a 660-kb deletion on chromosome 12 that caused embryonic lethality when two carriers were mated. The deletion carried at high frequency across Nordic Red populations — roughly 13–23% of animals in some Finnish, Swedish, and Danish Red subpopulations (Kadri et al., 2014). It stayed there precisely because it was linked to markers that boosted milk yield. Selection dragged it along for the ride.
Same structural mechanics are silently taxing Holsteins today. CNV discovery work in Holsteins by Bickhart et al. (2012, and follow-on studies) has identified structural variants linked to production and health traits that standard SNP-based evaluation doesn’t fully capture. That’s before you get to the known Holstein haplotypes (HH1–HH6, HCD) that CDCB does track — which are themselves a reminder that structural and haplotype-level effects have a documented history of riding hidden inside elite pedigrees until somebody goes looking.
Picture a Nordic Red breeder in 2013, running genomic evaluations, watching conception rates erode, blaming synch protocols, heat stress, the AI tech. The answer was sitting in a structural variant the SNP chip wasn’t designed to find. If your Holstein herd has chronic hoof issues or a fertility slump that doesn’t line up with what the health indexes predicted, there’s a reasonable chance part of that gap lives in structural variation the chip can’t resolve either.
Limit 3 — The Mendelian Roulette
The third piece is the one breeders running flush programs have been complaining about for thirty years — and now have a mechanistic explanation for.
A calf inherits 50% of her DNA from each parent, but which 50% is random. For single-gene traits like polled, red factor, kappa-casein, or recessive defects, this is manageable. For polygenic traits like udder composite, feet and legs, or fertility, it’s the largest single source of individual prediction error.
Current genomic models capture only a fraction of that variance. Gains from more sophisticated methods like single-step GBLUP remain incremental for individual Mendelian sampling prediction (Mrode, 2014). The rest is noise you can’t model away.
Two full sisters from the same elite flush, with similar composite indexes, can draw very different genetic hands. The test can’t reliably tell you which drew well and which didn’t — and that matters most in the middle 60% of a heifer crop, where most keep-or-cull decisions actually live. Any breeder who’s flushed a cow twice and watched one calf become a dam of merit while her full sister never classified above GP has been living inside this reality for a career.
Can You Actually Trust the Rank?
Every genomic index is a model output. Every evaluation cycle, the reference population grows, trait weightings get revisited, and the base population resets on CDCB’s routine rotation. The April 2025 base change updated Holstein production PTAs to reflect the new reference base and revisited Net Merit $ as part of the ongoing formula review (CDCB, “Evaluation Changes, April 2025”). A breeder comparing an old index score to a current animal is comparing against a moving reference.
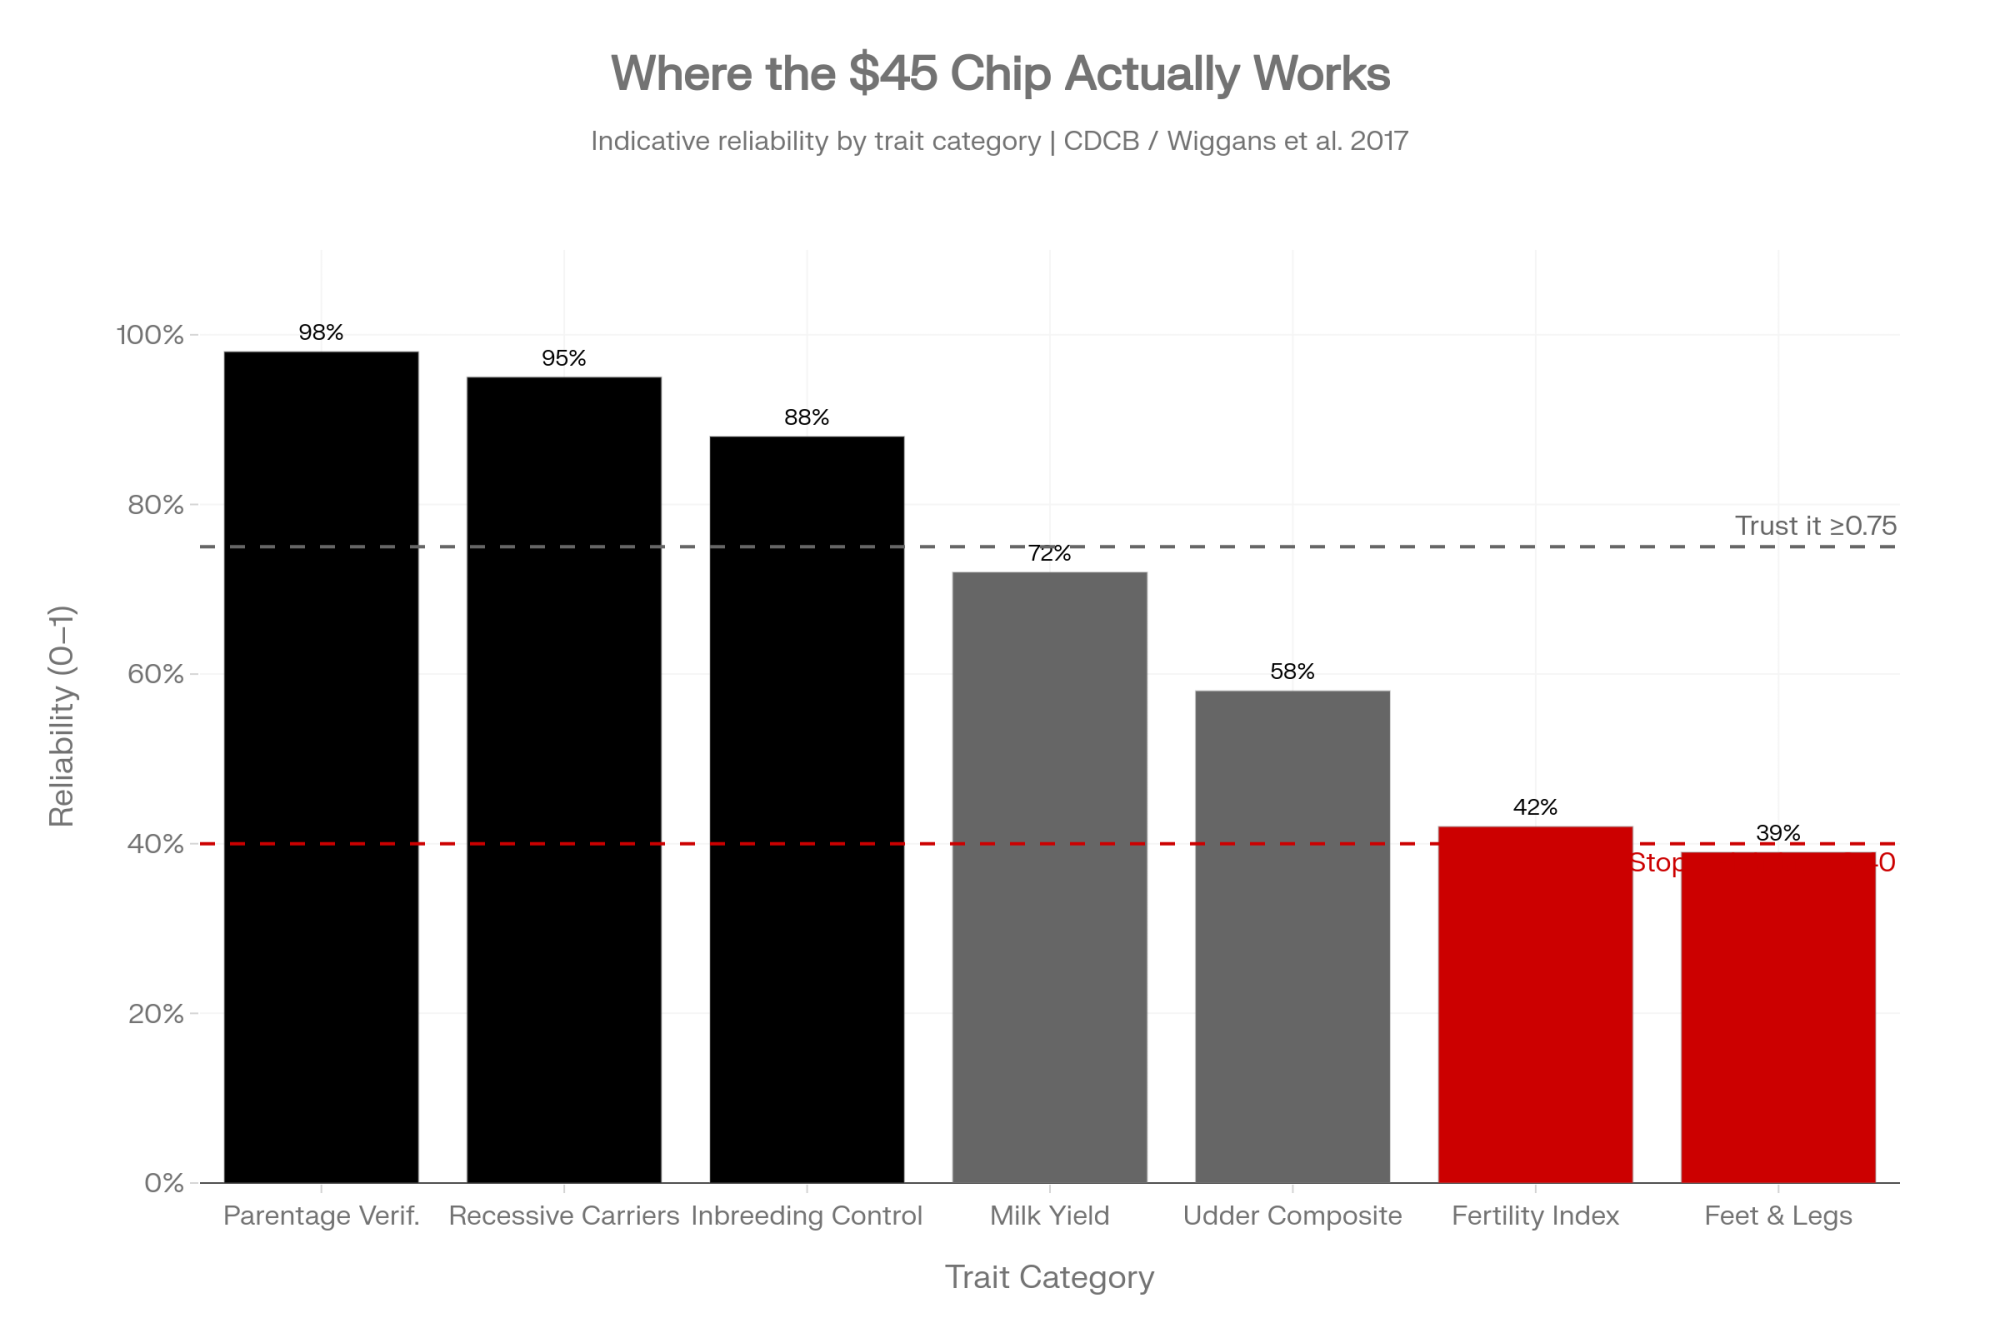
For young genomic bulls, peer-reviewed research has repeatedly documented meaningful re-ranking between initial genomic evaluation and daughter-proven status. Wiggans et al. (2017), reviewing the USDA genomic selection experience, documented that a measurable share of top-quintile genomic bulls drop out of the top quintile once daughter data lands. That’s not a criticism of the tool. It’s a property of predicting complex traits from limited information.
The bull that tops the April proof run is rarely the same bull that tops the December proof. If your mating plan only works when your top three sires all hold through their daughter-proven runs, your strategy has a timing problem the genomics didn’t cause but can’t fix either.
What Does This Cost on a Real Heifer Pen?
Published heifer-rearing-cost estimates from Penn State Extension put total cost to first calving in the range of $2,200–$2,600, with OMAFRA reference budgets tracking similarly. Assume $2,400 for a round-number illustration.
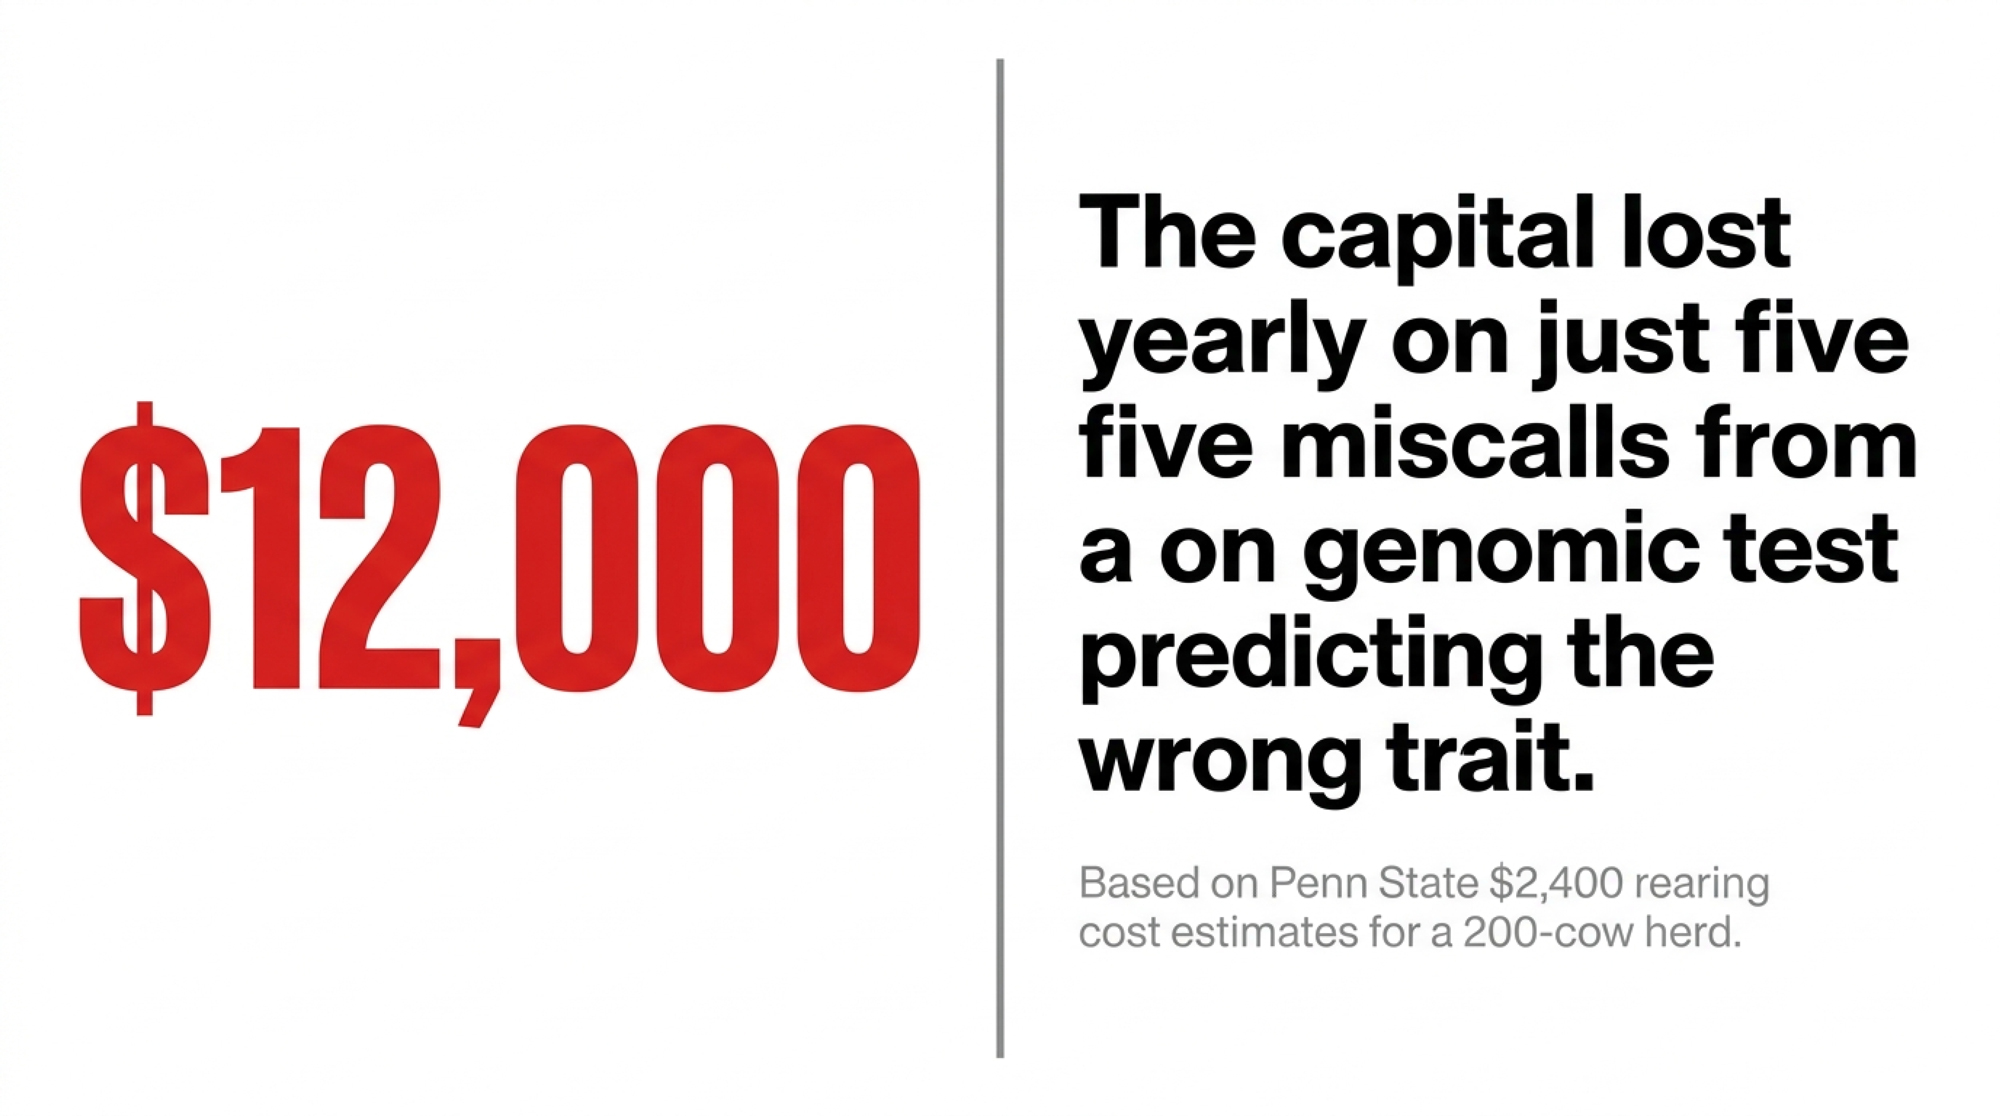
You run 200 cows. You raise roughly 60 replacements a year. If even five heifers a year get kept or cut on a low-reliability trait signal that isn’t actually predictive in your herd, that’s ,000 in capital tied to animals the test couldn’t validate for the trait you weighted most heavily. Over five years, straight-line, that’s $60,000 — before the opportunity cost of the better replacements you didn’t keep.
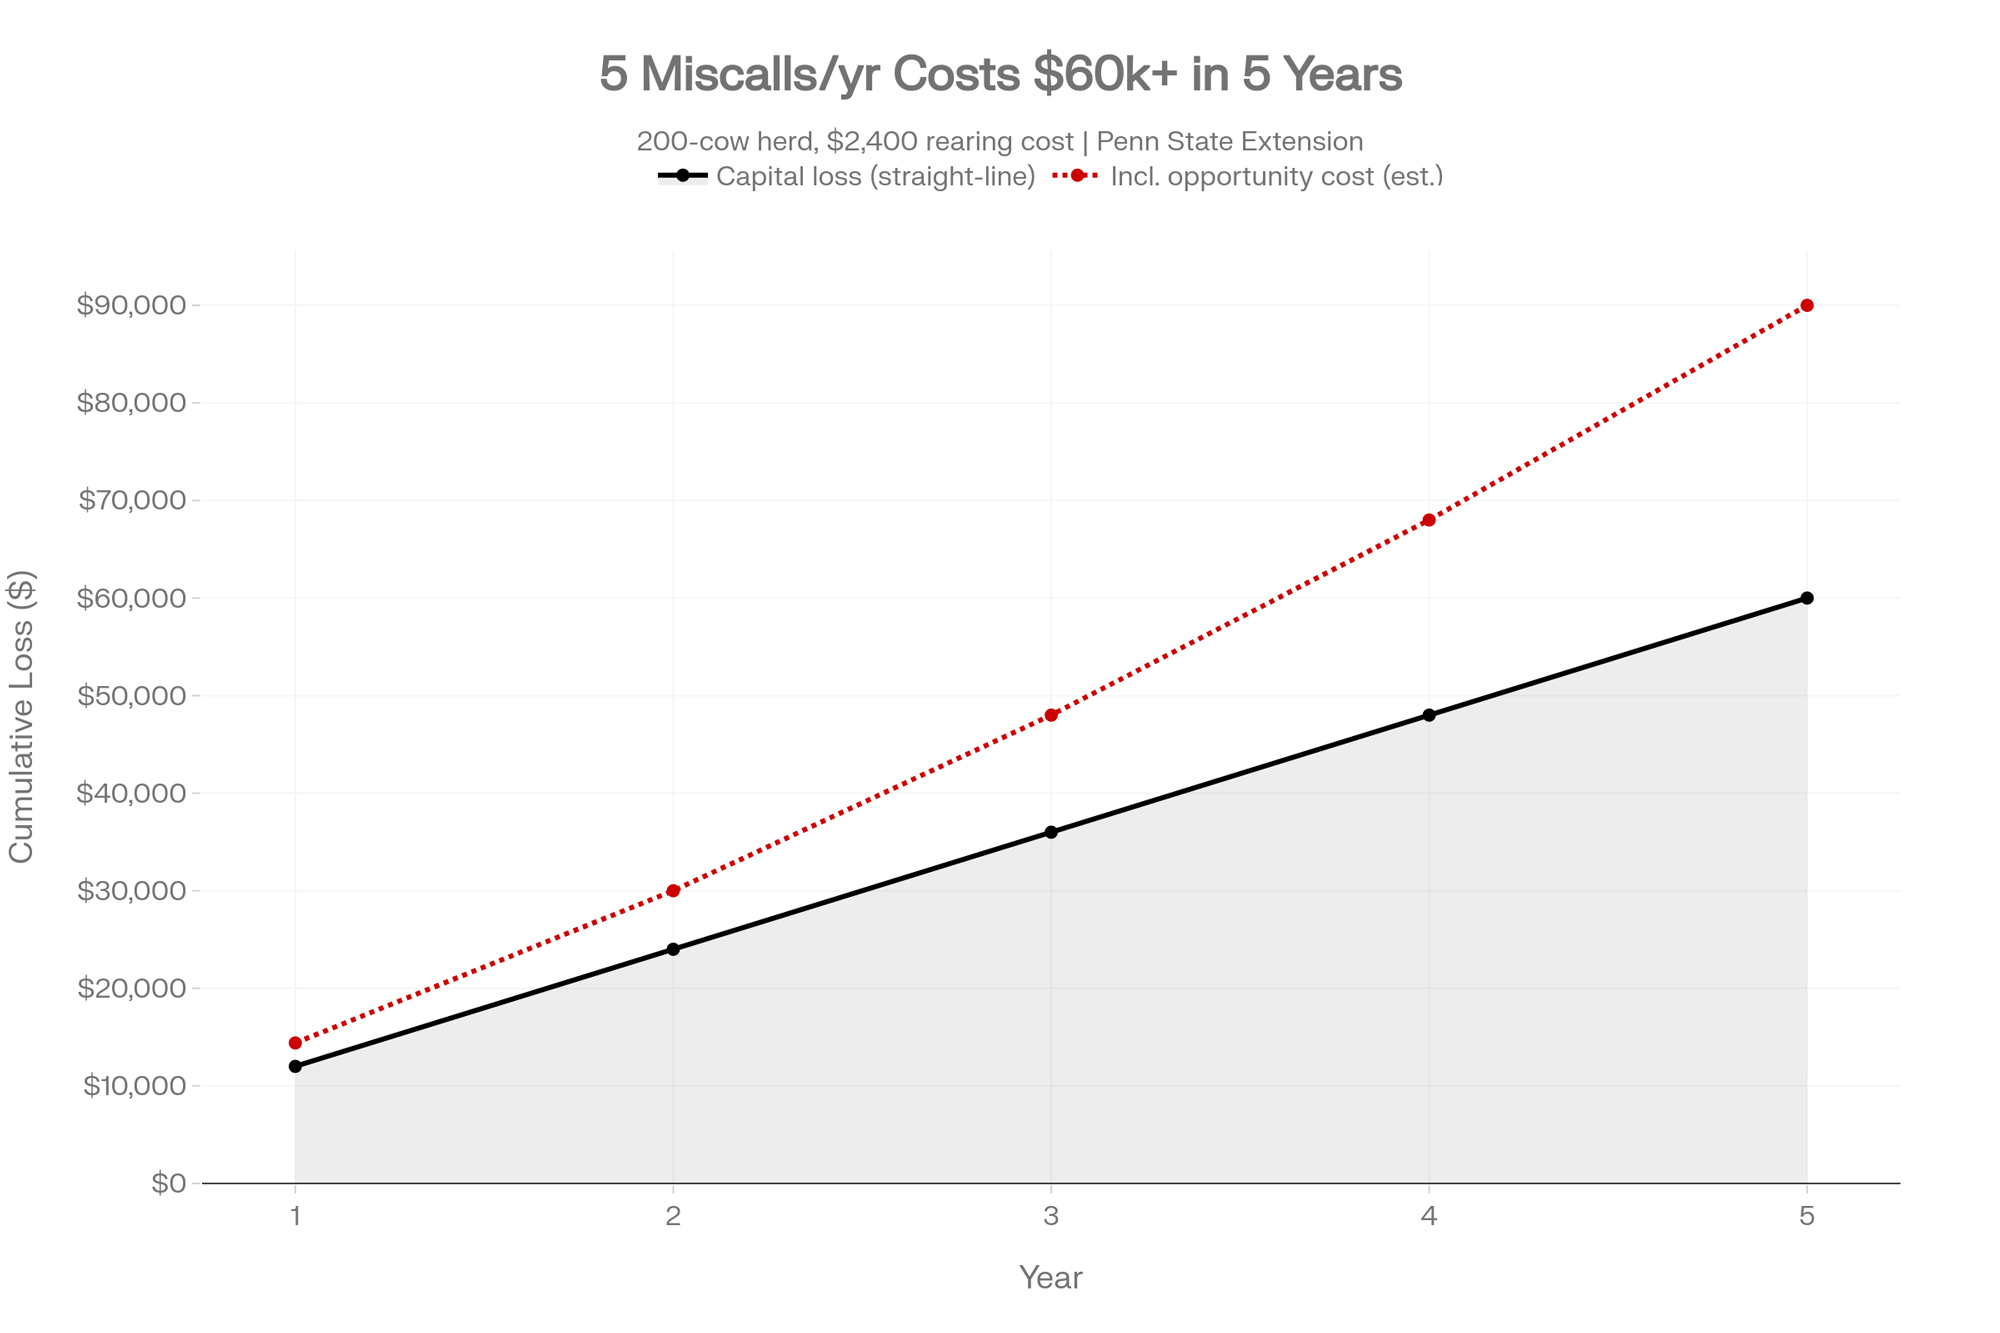
The scenario is illustrative, not prescriptive. Your rearing cost, replacement rate, and miss rate will differ. The point is the order of magnitude. For a seedstock operation selling embryos and pregnancies, the same logic runs on embryo pricing instead of rearing cost, with the miss rate showing up at the sale instead of the parlour. Different columns. Same math.
What Top Breeders Are Actually Doing
Producers are handling this three ways right now. Each works in some situations and fails in others.
| Path 1: Trust the Composite | Path 2: Genomics + Phenotype + Maternal Line | Path 3: CORREL Audit First | |
|---|---|---|---|
| Best for | Commercial operations prioritizing speed | Pedigree operations, ET programs, seedstock | Any operation before next cull round |
| Speed | Fast | Slow | One-time 30-day investment |
| Works best at… | Extreme top & bottom of heifer crop | Middle 60% of the crop | Validating which traits to trust in your own herd |
| Fails when… | Confidence intervals overlap in the middle 60% | Requires strong records infrastructure | Data gaps exist (no DHI, no classification) |
| Capital risk | High — miscalls invisible until phenotype shows | Low — family depth catches what the chip misses | Low — reveals chip blind spots before capital is committed |
| Captures mtDNA signal? | ❌ No | ✅ Yes | Partial — flags divergence |
| Genomics role | Primary decision tool | Filter only — flags clear bottom | Validation benchmark |
Path 1 — Trust the composite, cull by rank. Fast, simple, defensible. Works reasonably well at the extreme top and bottom of a heifer crop, where signals converge. Fails in the middle 60%, where confidence intervals overlap. Best fit: commercial operations prioritizing speed over precision. The limit: you’ll misallocate capital on individual animals more often than the rank order suggests — and you won’t know which ones because you stopped tracking.
Path 2 — Layer genomics with phenotype and maternal-line depth. Use genomic scores to flag the bottom quartile. Walk the pens for the rest. Retain animals whose dam families have proven themselves across multiple generations — not just those with the flashiest single-generation index. Weight classification and production history alongside the number, especially for the middle of the crop. Slower, more judgment-intensive, but captures the mtDNA and maternal-line signal the test can’t see. Best fit: pedigree-focused operations, ET programs, and anyone marketing breeding stock where a buyer pays a premium for documented depth.
The breeders running Path 2 aren’t rejecting genomics. They’re using it to filter, not to decide. They trust the chip to flag what it does well — recessive carriers, parentage, the clear bottom of a heifer crop — and they trust their eyes, their records, and four generations of maternal-line data for everything the chip can’t see.
🔧 THE 30-DAY AUDIT: Path 3 — Run Your Own Herd Correlation
The single highest-leverage move any breeder can make this month.
You already own the data. It’s sitting in your DHI reports, classification files, and original genomic panels. Here’s the protocol:
- Pull your last two years of genomic test reports (trait-level scores, not just composite).
- Pull first-lactation classification scores and 305ME production records for those same animals.
- Match them in a spreadsheet — one row per animal, columns for predicted and actual.
- Run Excel’s CORREL function on each trait individually.
Read the result as a farm-level rule of thumb — not a formal statistical cutoff:
| CORREL Result | Signal Strength | What It Means | Culling Action | Mating Action |
|---|---|---|---|---|
| ≥ 0.40 | ✅ Strong | Test is predicting this trait in your herd | Weight heavily in keep/cull decisions | Include in mating software at full reliability |
| 0.25 – 0.40 | ⚠️ Marginal | Useful but not decisive; confirm with phenotype | Use as a tiebreaker, not a primary cut signal | Weight at 50%; layer with classification and dam record |
| ≤ 0.25 | 🔴 Weak | Barely better than guessing for your genetics | Stop weighting this trait on your cull sheet | Remove from mating formula; use family data instead |
- ≥ 0.40 → The test is giving you real signal in your herd. Weight it.
- 0.25 – 0.40 → Treat the test as one input among several. Confirm with phenotype.
- ≤ 0.25 → Barely better than guessing. Stop weighting this trait.
These are decision-support heuristics; your genetics advisor can help with borderline traits. Path 3 doesn’t replace Paths 1 or 2 — it tells you which of them to use for which trait.
What This Means for Your Operation
- If you breed for a sale or a show ring, maternal-line depth carries a value your composite index doesn’t price. The mtDNA your cows carry doesn’t appear on any commercial genomic report. Buyers who know that pay for the cow family.
- If your young-sire strategy depends on April’s top-five bulls still being top-ten in December, it’s a timing strategy, not a genetic one. Peer-reviewed work consistently shows meaningful re-ranking. Build your plan assuming your top sires will move.
- If you classified, production-tested, and genomic-tested the same animals, you already own the data to validate your tool. Herd-specific correlation tells you which traits to trust, hedge, or stop weighting.
- If your herd has a chronic problem — hoof breakdown, fertility drop, udder failure — that doesn’t line up with what the indexes predicted, assume a structural or maternal-line signal the chip can’t see is part of the gap. More testing won’t fix it. Different data will.
- If you’re pricing embryos on composite index alone, you’re selling against the buyers who value depth and undercutting yourself against the buyers who don’t know the difference. Price the cow family separately.
- If you’ve been tempted to drop DHI or classification to save money, run the math before you do. Every genomic prediction depends on phenotype from operations that keep recording. Drop out of the feedback loop, you degrade the tool you’re paying for.
- Where genomics still wins, unambiguously: parentage verification, recessive carrier status, haplotype management, and inbreeding control. Lean on it aggressively there. Be more cautious with individual rankings on low-heritability traits.
Key Takeaways
- If you haven’t matched your last two years of genomic scores to your classification and 305ME records, do it this month. One afternoon with a spreadsheet tells you which traits the test is actually predicting — before your next cull round.
- If you’re not already archiving trait-level genomic scores at time of testing, start today. Base changes like April 2025 will otherwise obscure your validation work 18 months from now.
- If you weight udder composite and milk yield equally on your cull sheet, but one has substantially lower published reliability in CDCB tables, you’re weighting a weaker signal as if it were stronger. Reweight.
- If you’re pricing embryos primarily on composite, and one donor comes from a four-generation proven maternal line and the other doesn’t, the proven line is worth a premium the test price doesn’t capture. Ask about maternal line depth, not just gTPI.
The Cow Family Still Matters
Here’s the one to sit with before your next cull round or flush plan. If you matched your last two crops of genomic scores to the cows those heifers became, which traits would surprise you, and which decisions would you make differently next time?
The breeders who’ll be ahead in five years aren’t the ones buying the densest chip or chasing the flashiest flush. They’re the ones who figured out — quietly, one heifer crop at a time — which traits their genomic tool actually predicts for their genetics, and which ones it doesn’t. That knowledge isn’t on the test report. It’s on a spreadsheet they built themselves, alongside a pedigree they’ve been curating since long before genomics arrived.
Run Your Numbers
Genomic Testing ROI Calculator — Stop guessing whether your $45-per-head investment is actually paying off. This tool puts a dollar value on your testing strategy, revealing the real-world ROI of your heifer culling decisions and flagging exactly where low-reliability traits are draining your capital.
Complete references and supporting documentation are available upon request by contacting the editorial team at editor@thebullvine.com.
Learn More
- Did Genomics Really Deliver What We Think It Did? $238,000 Says Yes – If You Steer It Right — Secure the massive profit gap between your top and bottom genetic quartiles by capturing a $238,000 lifetime advantage. Breaks down the shift from passive testing to aggressive, data-driven heifer management to maximize your return.
- The Decade Rule: Francisco Rodriguez on Breeding Champions — Master the patience required for world-class results by adopting a ten-year vision for your breeding program. Reveals why heat tolerance and protein efficiency are the defining traits of this decade for elite, high-margin herds.
- Stop Breeding by Color: Genomics, Heat Stress and Beef‑on‑Dairy Math That Can Add Over $4/cwt to Holstein Margins — Unlock hidden margins by ignoring the myth that visual coat color predicts genetic merit. Exposes the $4/cwt profit boost found in beef-on-dairy math and heat-stress resilience, pivoting your herd toward traits that actually pay.
 The Sunday Read Dairy Professionals Don’t Skip.
 The Sunday Read Dairy Professionals Don’t Skip.
Every week, thousands of producers, breeders, and industry insiders open Bullvine Weekly for genetics insights, market shifts, and profit strategies they won’t find anywhere else. One email. Five minutes. Smarter decisions all week.
