Roughly 1,600 Danish herds. Seven months on Bovaer. Zero published efficacy data. Wageningen’s year-long field number ran 21–27%. Your contract assumes 30%. Who eats the gap?
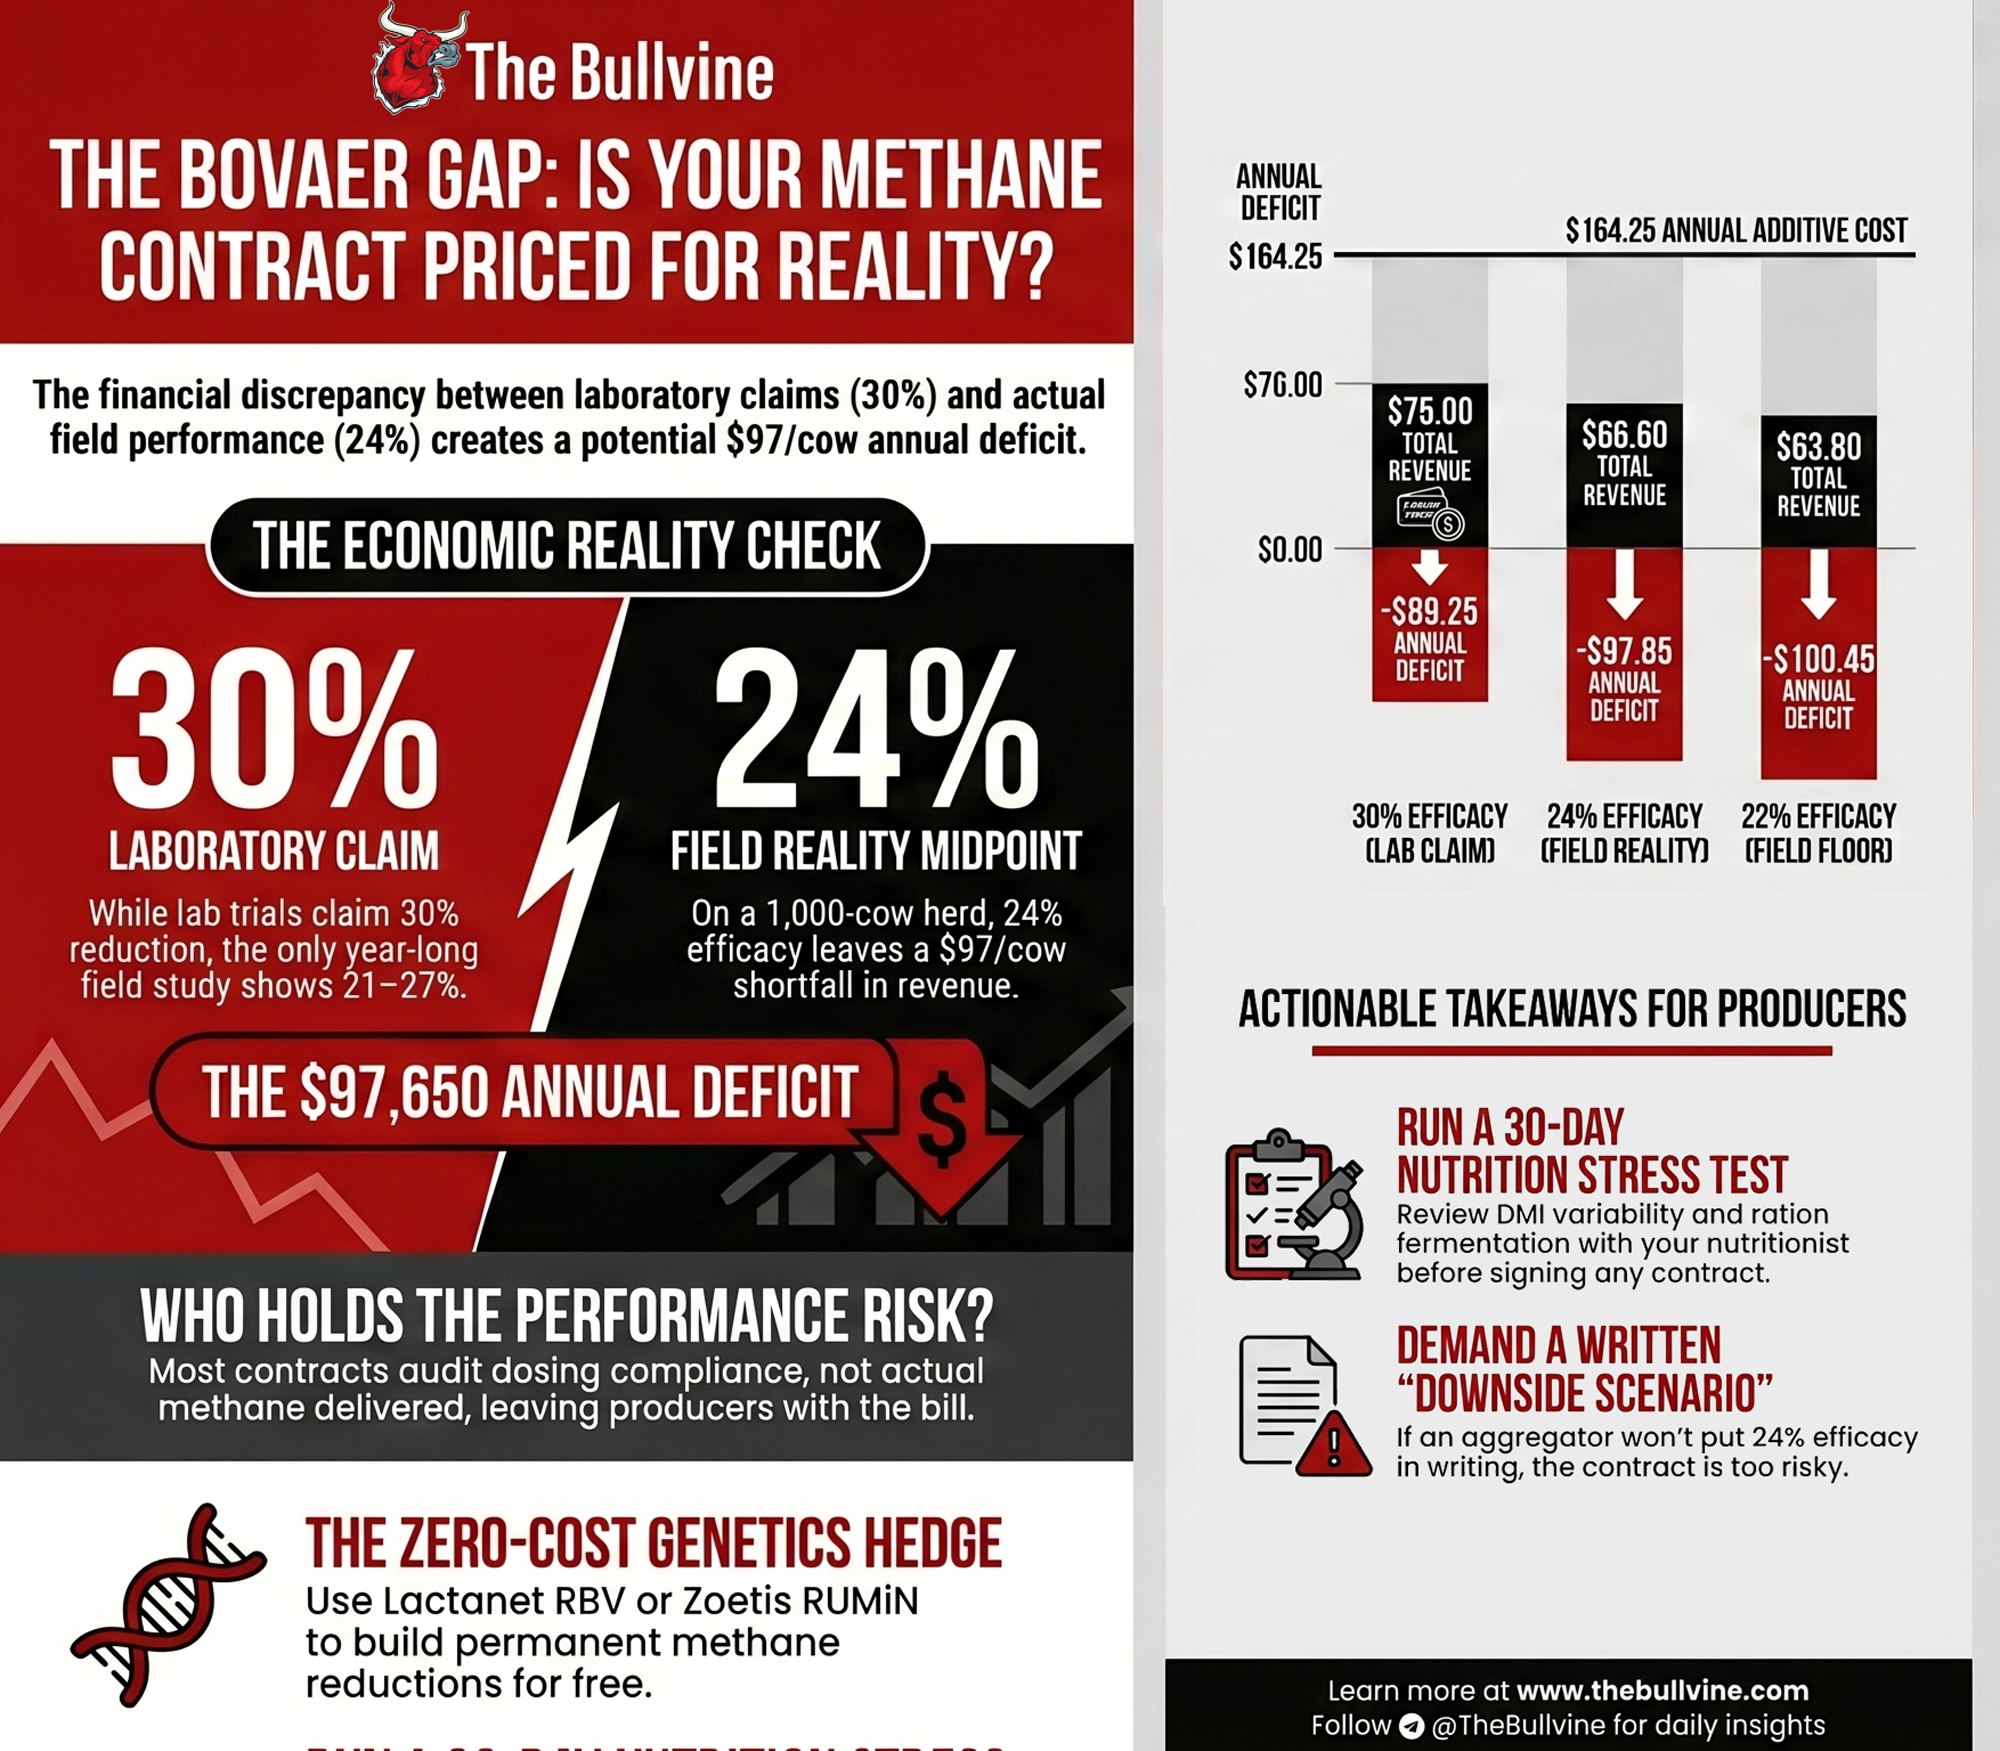
Executive Summary: Denmark mandated Bovaer across roughly 1,600 conventional herds starting October 1, 2025, and seven months in, the commercial methane reduction figure North American 2027 contracts are pricing against still hasn’t been published — not by Aarhus, not by SEGES, not by EFSA. The 30% claim driving those contracts is an EFSA controlled-trial figure; the only year-long field measurement that exists, Wageningen’s, ran 21–27%, and FrieslandCampina’s 158-farm Netherlands pilot landed at 28%. A late-April 2026 Science paper helped explain why: a newly identified rumen ciliate organelle called the hydrogenobody runs upstream of where 3-NOP can reach, making 28–30% a structural ceiling rather than a target. At $0.45/cow/day — $164.25/cow/year on a 1,000-cow herd — the deficit at field-realistic 24% efficacy lands near $97/cow, or about $97,000/year a producer absorbs unless the processor backstops the input cost the way FrieslandCampina and the Danish government did. Verra’s VM0041 audits dosing, not delivered methane, so an ERF set at 30% on a herd delivering 22% is invisible to verification until a downstream buyer commissions independent supply-chain checks. Producers signing 2027 contracts now are pricing a regulatory necessity Denmark won’t actually measure until the 2030 climate-tax deadline forces it, while Lactanet RBV (April 2023), Zoetis RUMiN (April 2026 DWP$ update), and VikingGenetics’ Nordic Methane Index already let you build a permanent genetic reduction at zero incremental cost. If your aggregator can’t put 24% in writing as a downside scenario, the contract isn’t priced for your barn.
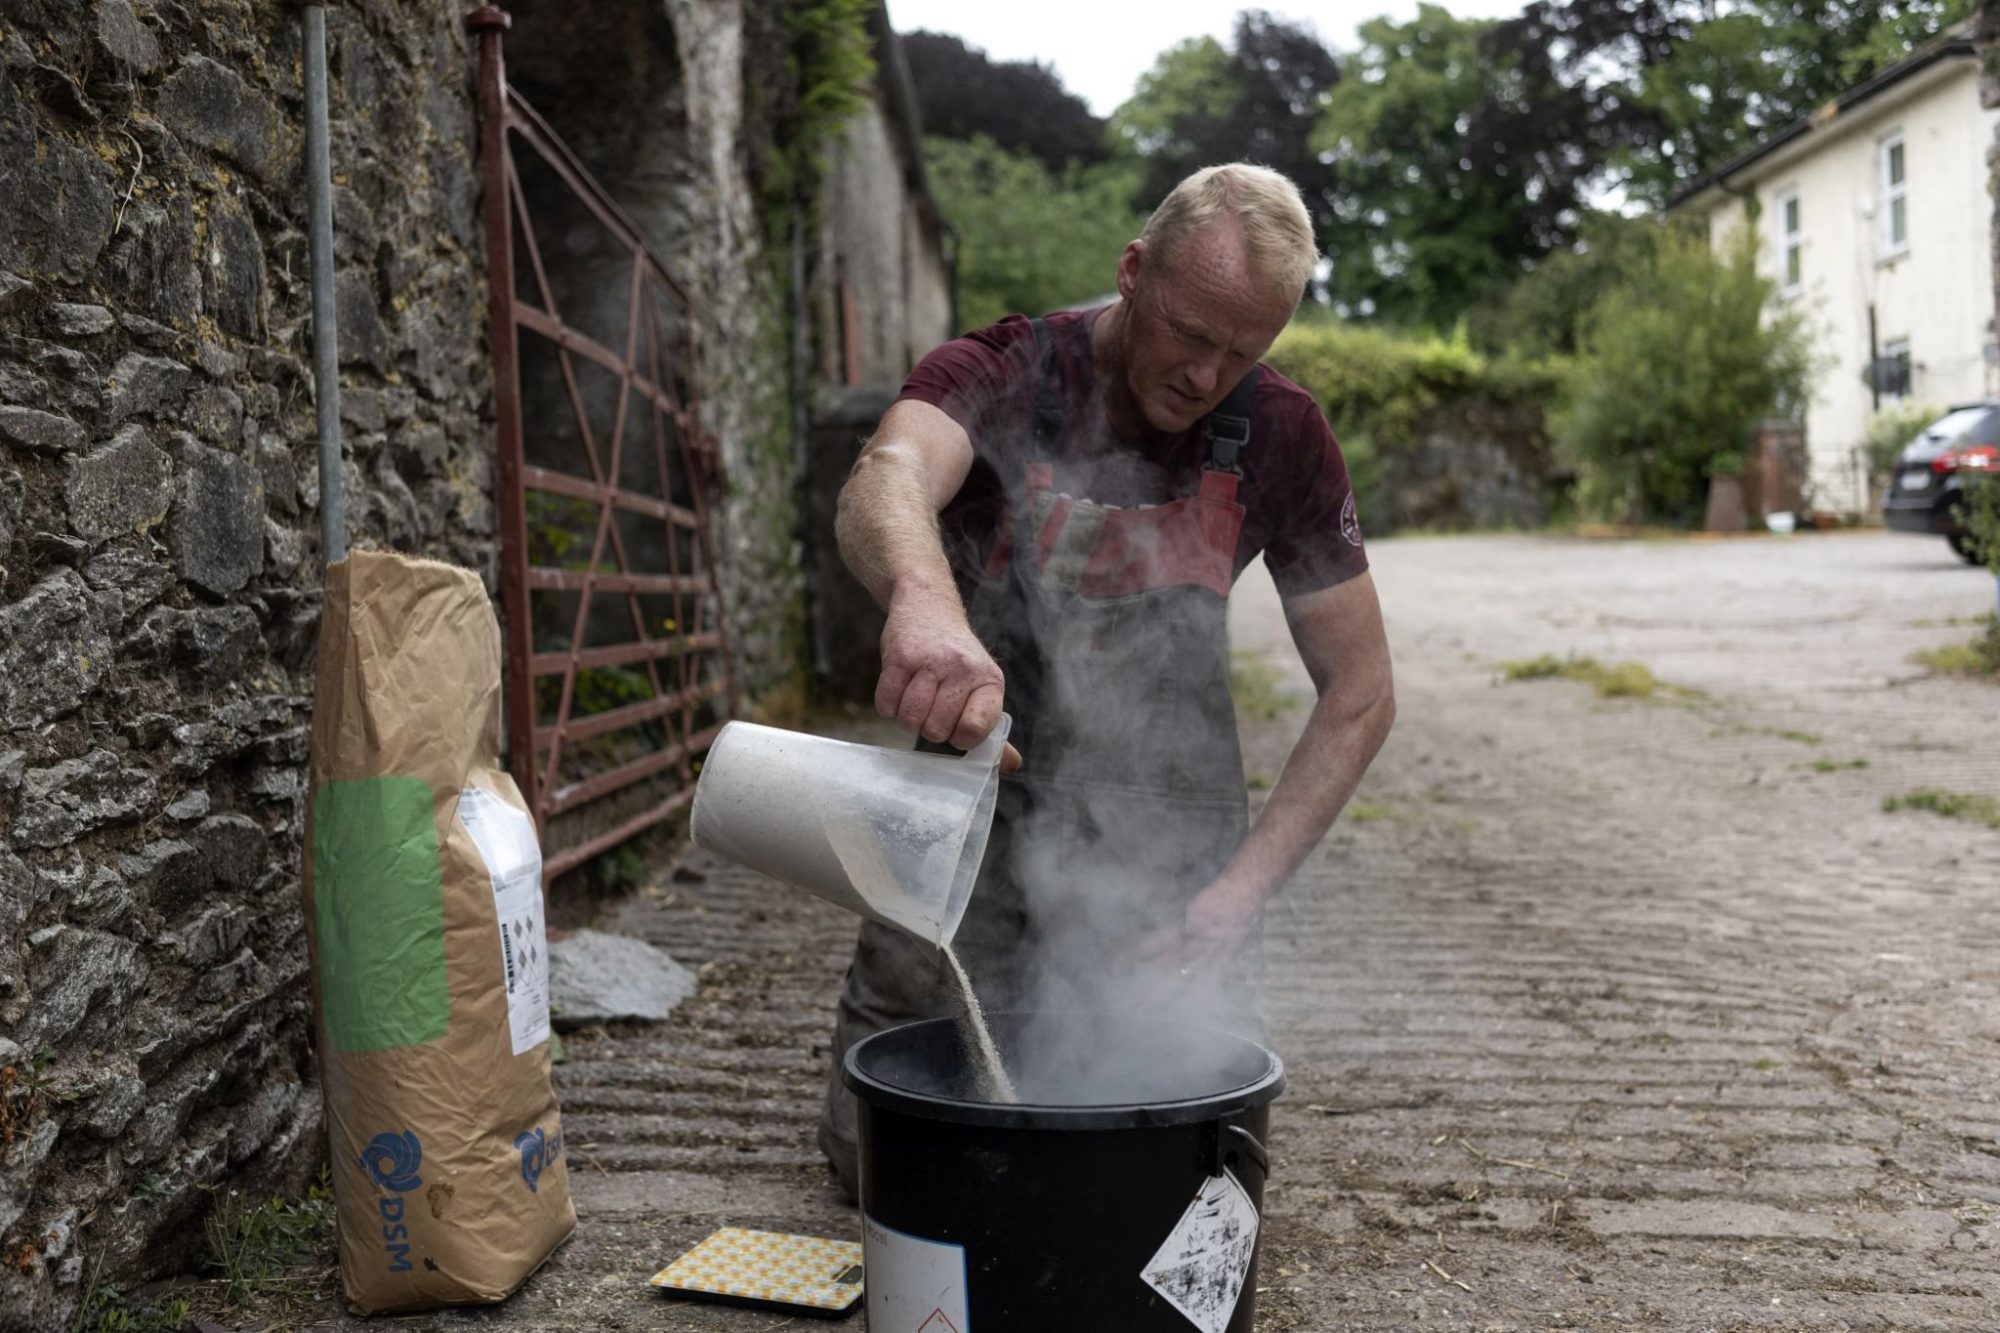
There’s a 2027 Bovaer contract sitting in dairy mailboxes from Wisconsin to Ontario right now, priced against a 30% methane reduction assumption. Meanwhile, in Europe, roughly 1,600 conventional Danish herds have been on the additive for seven months under a regulatory mandate — and the commercial efficacy figure that would actually validate those North American contracts hasn’t been published. Not by Aarhus. Not by SEGES. Not by EFSA. Not in peer-reviewed form anywhere.
That’s the strange shape of the largest real-world test of an enteric methane additive ever run. The mandate started on October 1, 2025. Compliance was legally required. A national subsidy softened the additional cost — the structure of North American contracts notably doesn’t replicate. By any measure, this should have produced the field efficacy figure that aggregators have spent two years promising producers. It hasn’t. And the contracts being offered for 2027 are priced as if they had.
What Denmark’s Mandate Actually Tested
The Danish climate law required conventional herds with 50 or more cows to feed Bovaer for at least 80 days a year, or switch to a high-fat diet. Compliance checks. Fines for non-compliance. National subsidy on the additional cost.
Here’s the part most coverage has missed: the mandate was designed around climate tax compliance, not methane measurement. Farms weren’t required to install GreenFeed units, SF6 tracer systems, or any direct enteric measurement device. So the world’s biggest commercial Bovaer deployment is producing exactly the data the mandate asked for — proof of dosing — and not the data the contracts in your inbox depend on.
What did show up: a SEGES Innovation survey of several hundred Danish dairy herds in autumn 2025 reported hundreds of farms describing milk yield declines and reduced dry matter intake, with substantial overlap reporting both at once. Self-reported, not peer-reviewed. The European Commission ordered EFSA to reassess safety, with a data deadline of April 10, 2026, and as of mid-May, the reassessment opinion was still pending.
In May 2026, Aarhus University released the first formal study from the deployment. An Aarhus team examined 73 farms and concluded that within the available data, there was no clear influence of Bovaer on production, disease rate, or mortality. The team hedged the finding explicitly. The study could not prove the opposite either, and the herds studied varied greatly.
The Aarhus team studied welfare and mortality. Not methane.
Where Does the 30% Number Actually Come From?
The 30% figure didn’t fall from the sky. EFSA established it through its 2021 safety and efficacy opinion, drawing on DSM-Firmenich’s controlled trial submissions. EFSA evaluated efficacy under defined conditions: consistent TMR, label dose, controlled feeding systems. That figure became the EU authorization basis, the sales deck headline, and now the contract pricing assumption.
DSM-Firmenich has consistently maintained the 30% figure as a controlled-trial result under EFSA-evaluated conditions, and the company is participating in EFSA’s ongoing reassessment process. That’s the public position the contract math rests on.
The Ceiling Nobody’s Pricing Around
In late April 2026, four weeks before Aarhus was published, the science changed.
A team reporting in Science cataloged rumen ciliate genomes and identified a previously undescribed organelle inside those single-celled microbes — the hydrogenobody. It produces hydrogen and scrubs oxygen from its immediate environment, creating a perfect microenvironment for methanogens operating right at the cell surface.
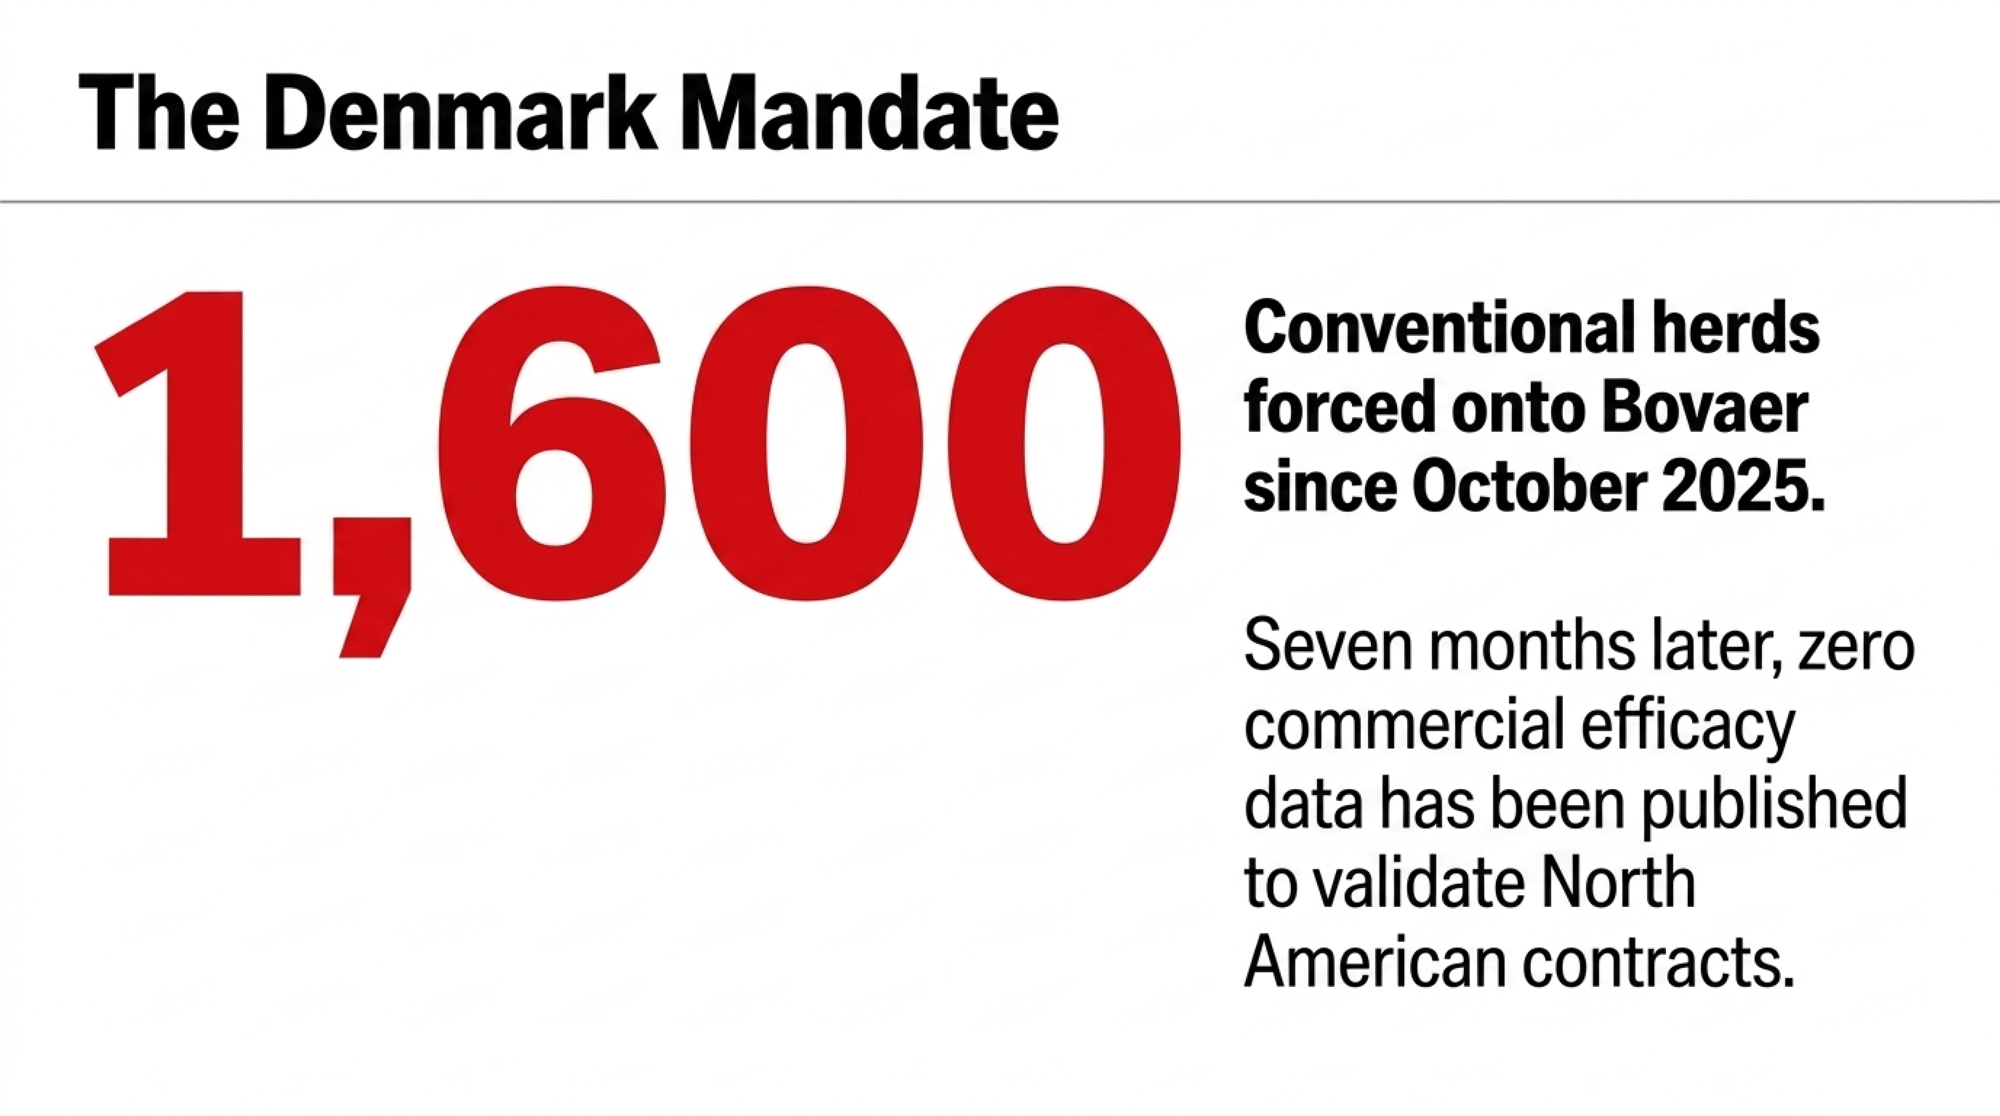
Bovaer (3-NOP) targets the methanogens floating in bulk rumen fluid. The hydrogen body sits upstream, at the hydrogen supply origin, where 3-NOP concentrations don’t reach therapeutic levels.
The sheep data carries the punchline. High-methane animals on identical rations carried far more Dasytricha ciliates — a high-hydrogenobody genus — than low-methane animals on the same feed. Penn State research has separately documented that 3-NOP suppresses methanogenesis effectively while free rumen hydrogen accumulates rather than dissipating. The downstream engine gets partially suppressed. The upstream supply keeps running.
That’s the practical 28–30% ceiling, mechanistically explained. It’s not a dosing problem. It’s a structural one — the Science finding maps why field results consistently land below the controlled-trial number, and why animal-genetics researchers are already framing the work as an opening to modulate the rumen microbiome more precisely rather than as a verdict on Bovaer itself.
The Field Record Versus the Sales Number
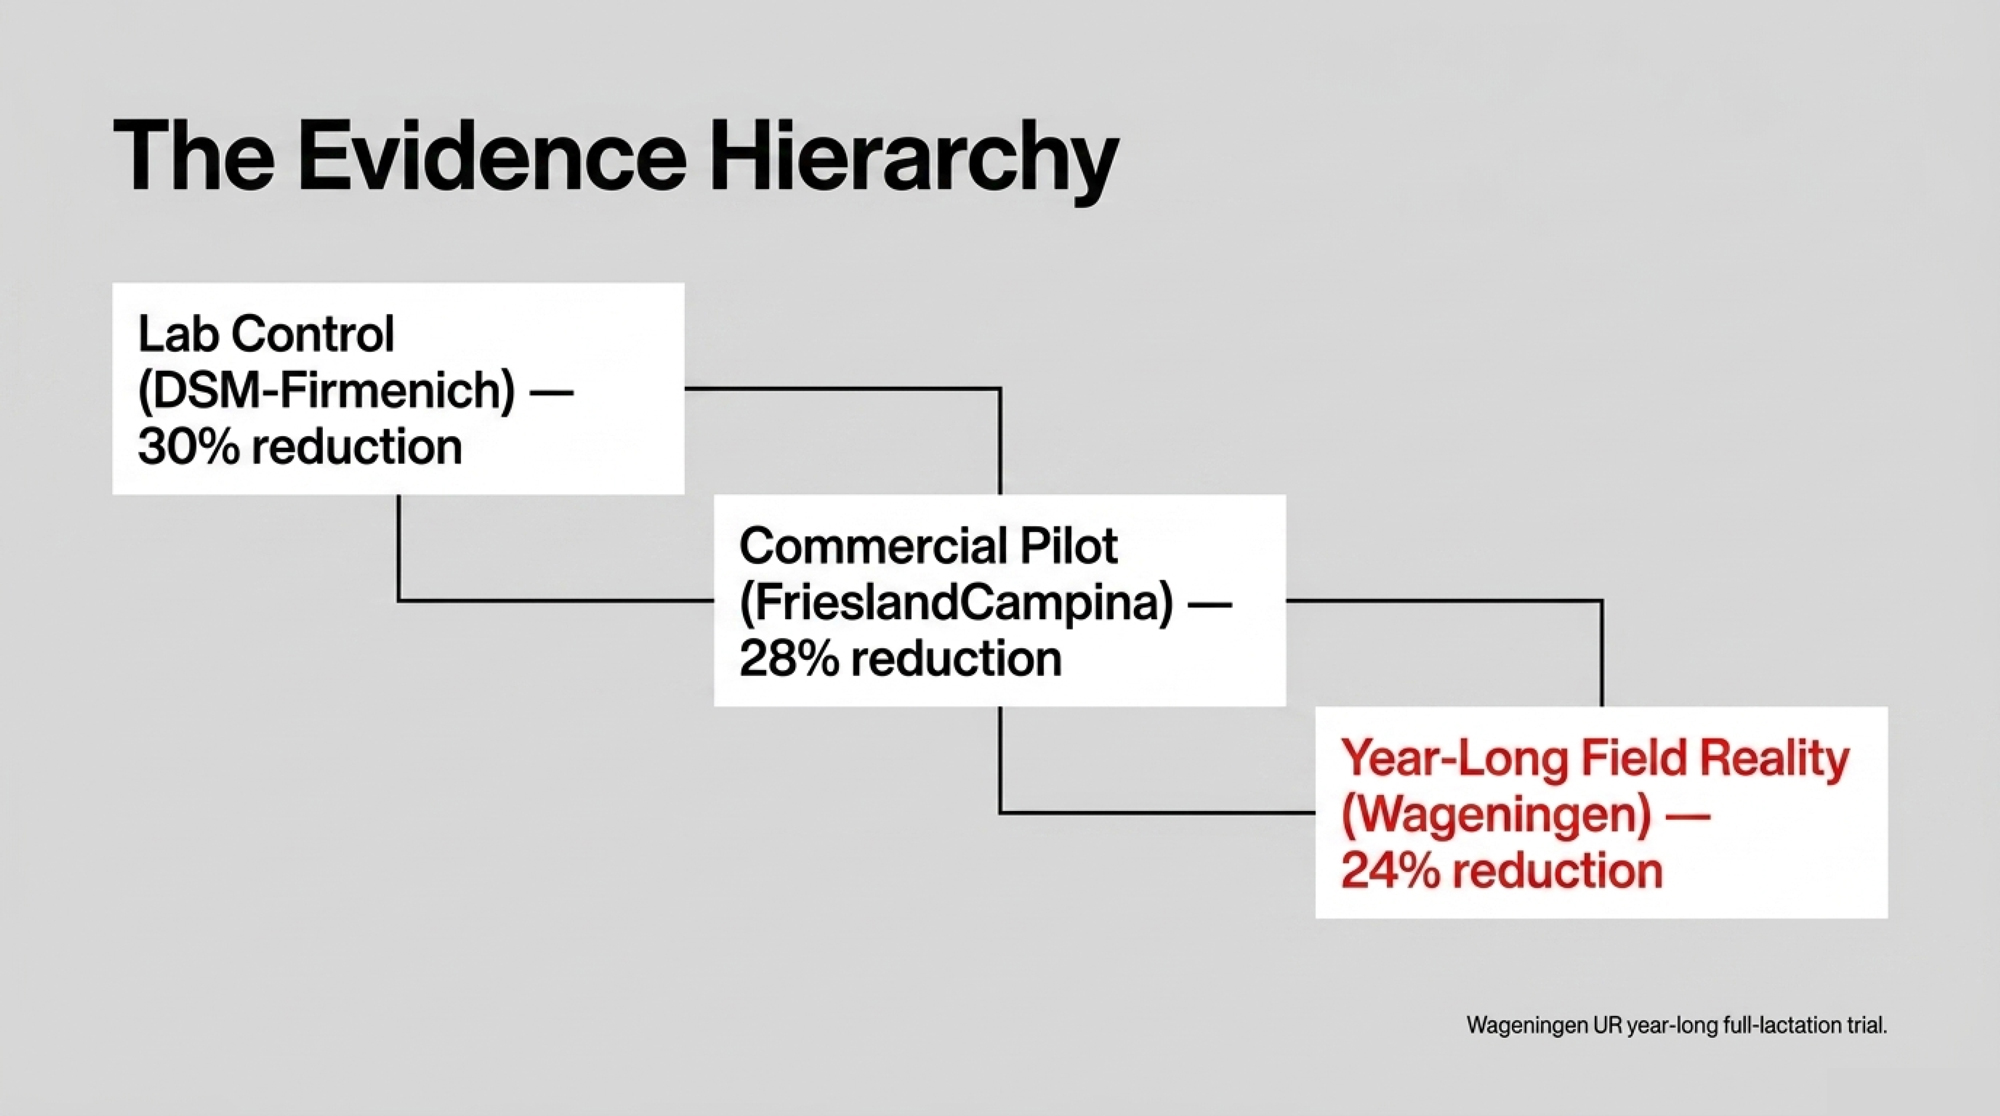
Here’s the evidence hierarchy a producer should weigh before signing:
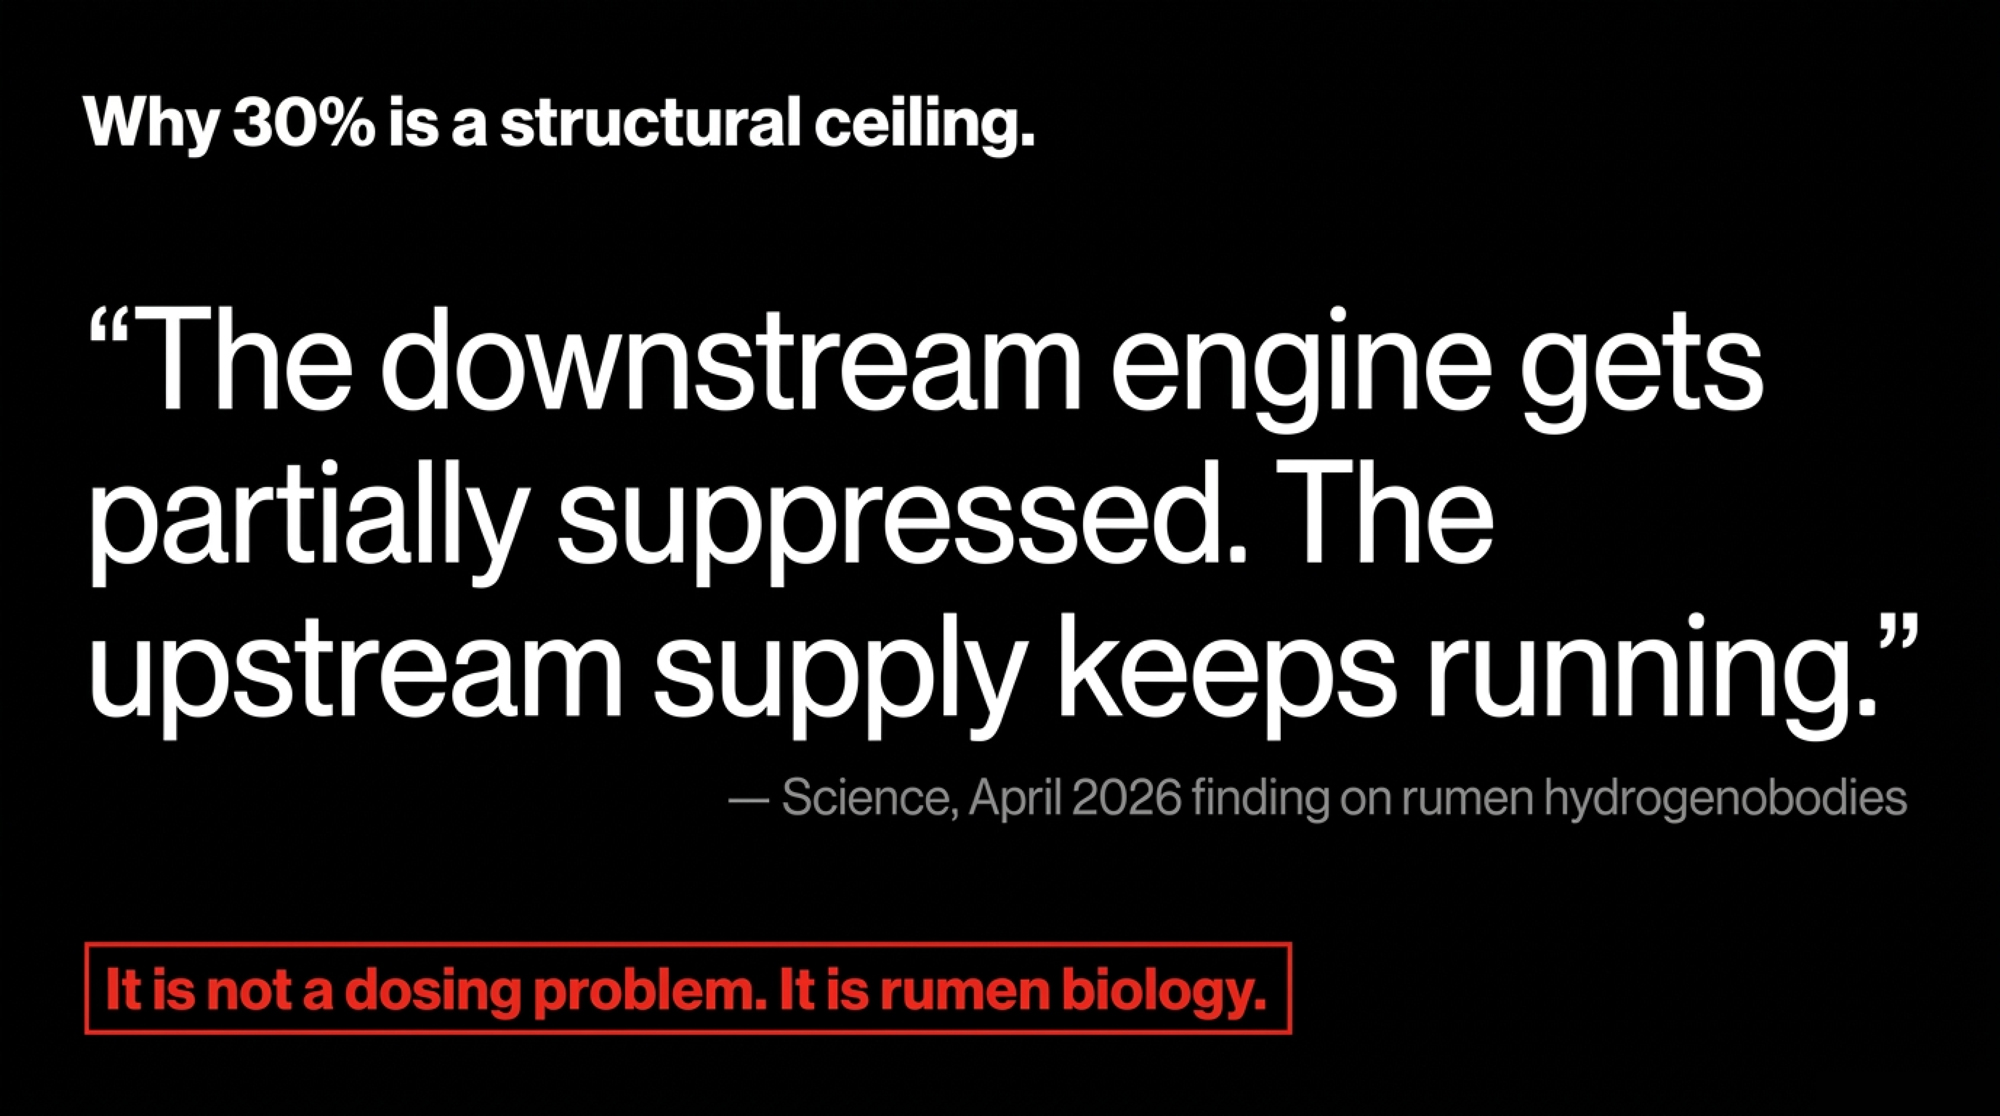
- DSM-Firmenich published claim, controlled trials: 30%
- Elanco/Athian via FDA review (September 2025), controlled: ~30%, or 1.2 MT CO2e/cow/year
- Kebreab et al. controlled-trial meta-analyses: results cluster in the high twenties to low thirties
- FrieslandCampina Netherlands pilot, 158 farms, six months: 28% — the best large-scale commercial figure that exists
- Wageningen year-long full-lactation trial: 21–27%, with efficacy declining within the lactation
- Denmark mandatory deployment, ~1,600 herds, seven months: not measured, not published
The Wageningen year-long study is the outlier precisely because it was long enough to capture what short controlled trials can’t — efficacy drift across a full lactation as ration composition, lactation stage, and microbial population shift.
The Barn Math at $0.45 Per Cow Per Day
Run the numbers honestly on a 1,000-cow herd. Annual additive cost at $0.45/cow/day, the contract pricing The Bullvine has modeled across this franchise: $164.25 per cow, $164,250 total.
Revenue side, modeled at $35/tonne supply-chain inset pricing (mid-market) plus a sustainability premium of $0.10–$0.15/cwt typical of current US program structures. Using the midpoint ($0.125/cwt) at 75 lbs/day, the premium works out to about $34/cow/year, rounded to $33 in the table for readability:
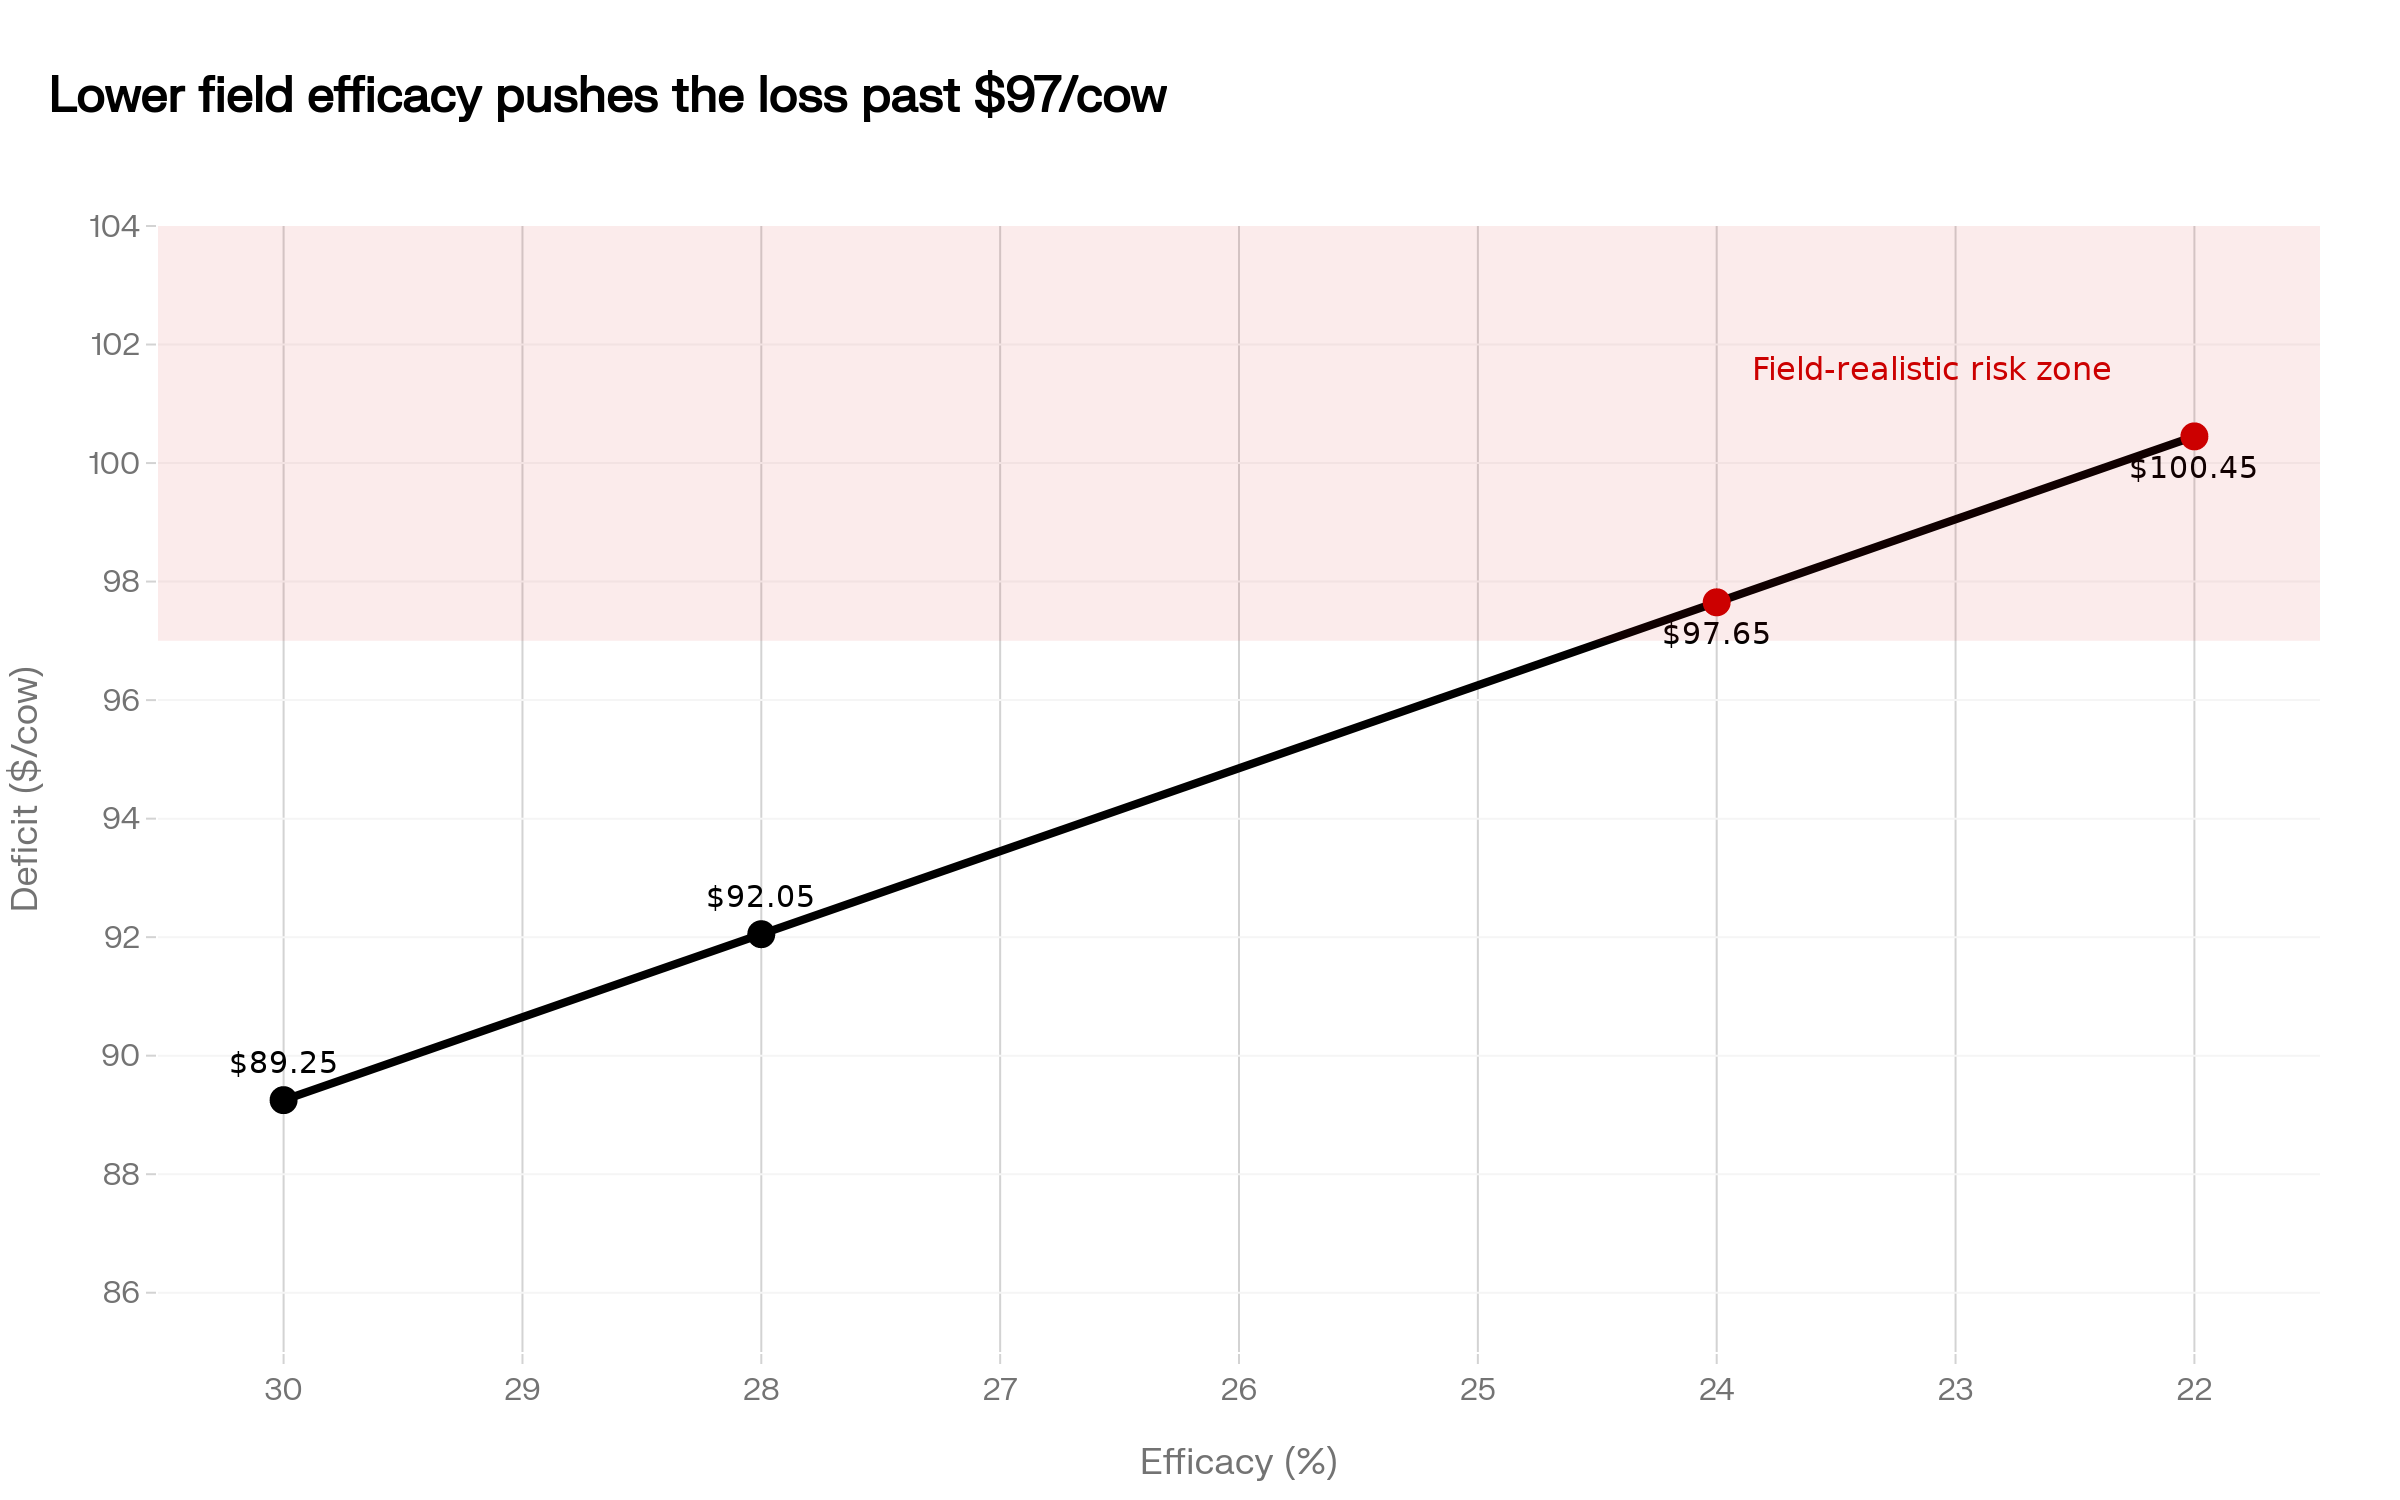
| Efficacy Level | Delivered CO2e / Cow / Yr | Carbon Revenue (@ $35/T) | Sustainability Premium | Total Revenue | Annual Deficit / Cow |
| 30% (Claimed) | 1.20 MT | $42.00 | $33.00 | $75.00 | $89.25 |
| 28% (NL Pilot) | 1.12 MT | $39.20 | $33.00 | $72.20 | $92.05 |
| 24% (Wageningen Midpoint) | 0.96 MT | $33.60 | $33.00 | $66.60 | $97.65 |
| 22% (Field Floor Model) | 0.88 MT | $30.80 | $33.00 | $63.80 | $100.45 |
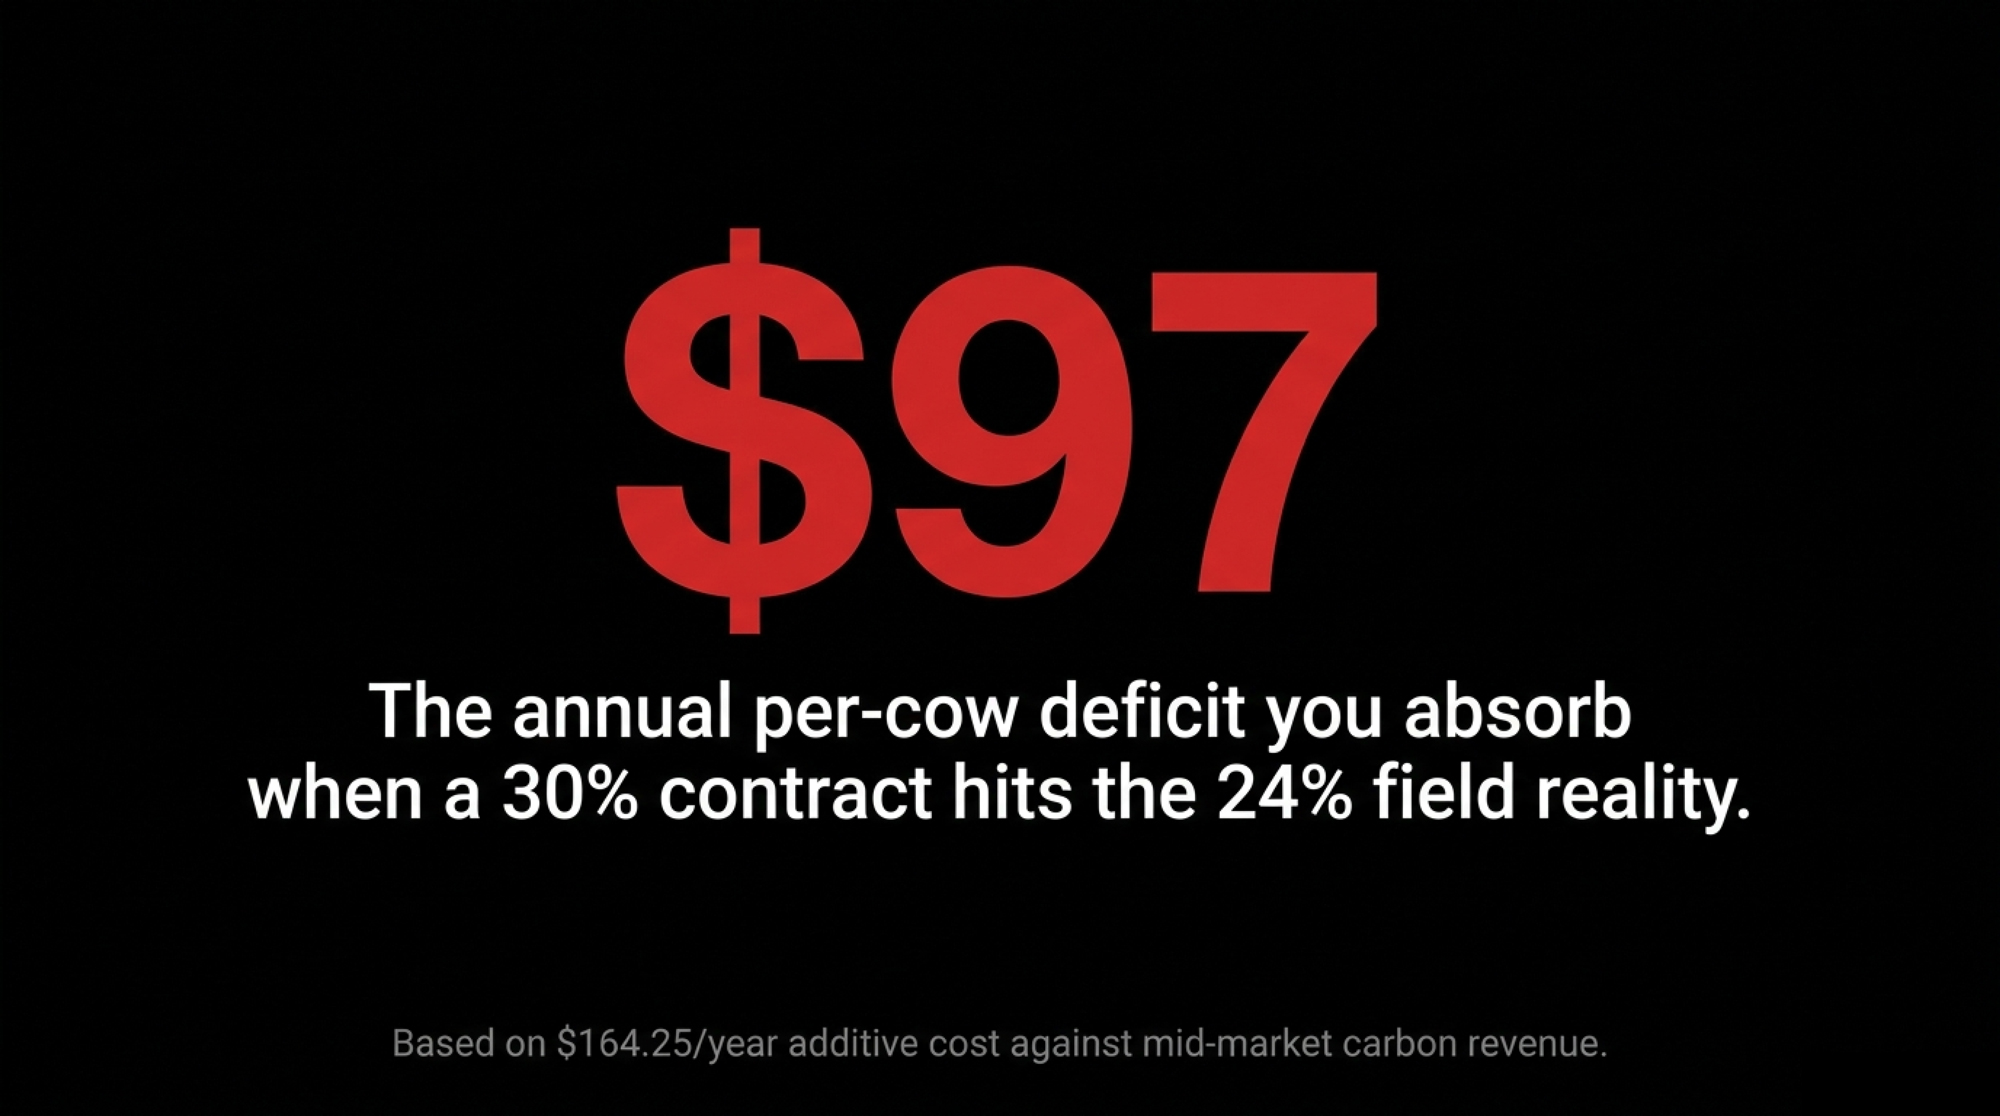
The honest number to model isn’t 30%. It’s 24% — the midpoint of the only year-long full-lactation field measurement that exists. That puts the deficit at roughly $97/cow on a 1,000-cow operation, or about $97,000 a year that has to come from somewhere outside the carbon revenue stack. Stress-test it at 22%, and the deficit climbs past $100/cow.
If the contract uses Elanco’s projection of approximately $20/cow through Athian instead of $35/tonne tonnage pricing, the deficit is fixed at roughly $111/cow regardless of efficacy, which makes the efficacy risk invisible until verification fails.
Who’s Bearing the Performance Risk
VM0041 — Verra’s dominant methodology for enteric methane credits — calculates issuance from an emission reduction factor (ERF) that the project proponent establishes at project start. Not from real-time methane sensors on your farm. Auditors verify dosing compliance, not delivered performance.
If your herd delivers 22% but the ERF is set at 30%, the gap is structurally invisible to the verification process — until a downstream credit buyer commissions independent supply-chain verification and discovers their Scope 3 claim is overstated. Verra is acknowledging this gap. The proposed VM0041 v3.0 revision, currently under expert review, would tighten how ERFs get established. It is not in force.
That revision helps producers in one specific way and creates a new exposure in another. Tighter ERFs shrink clawback risk — a 24% ERF with verified 22% delivery is a 2-point gap, not 8. But fewer credits per cow means lower carbon revenue. The additive cost doesn’t change. Marginal contracts that pencil out at 30% ERFs may no longer be commercially viable to offer at all under the revised framework.
What the Six Pre-Enrollment Questions Look Like
The Danish field reports that should sit on every nutritionist’s desk are the severe ones. Whole-herd diarrhea. Milk drops that pulled production materially below baseline. Cattle losses on individual operations. Recovery shortly after Bovaer was discontinued, according to Danish reporting — a pattern more consistent with pharmacological clearance than lasting microbiome damage, though the specific day-by-day timelines haven’t been published.
Worth keeping in proportion: those severe cases are real, but the broader Aarhus safety study across 73 farms found no clear influence of Bovaer on production, disease rate, or mortality at the population level. The severe pattern represents extreme herd-specific management and ration interactions, not a universal baseline. The point isn’t that Bovaer breaks every herd. The point is that some herd contexts are far worse candidates than others, and the contract structure makes that distinction the producer’s risk to identify.
The mechanism researchers are working through: 3-NOP suppresses the final step of methanogenesis, hydrogen accumulates in the rumen, and what happens next depends on whether the resident microbial population can productively redirect that hydrogen toward propionate. In a tightly managed TMR herd, it usually can. In a herd with variable intake, recent antibiotic exposure, or a forage-heavy ration, that buffer thins fast — and falling intake creates a feedback loop where the cows still eating receive a higher effective dose per kg DMI than the trial protocol assumed.
That’s why the FrieslandCampina Netherlands pilot reported no production changes while Denmark’s mandated, speed-ramped deployment generated hundreds of yield-decline reports. The molecule didn’t change. The deployment context did.
Before enrollment, the conversation a 1,200-cow operator should be having with their nutritionist:
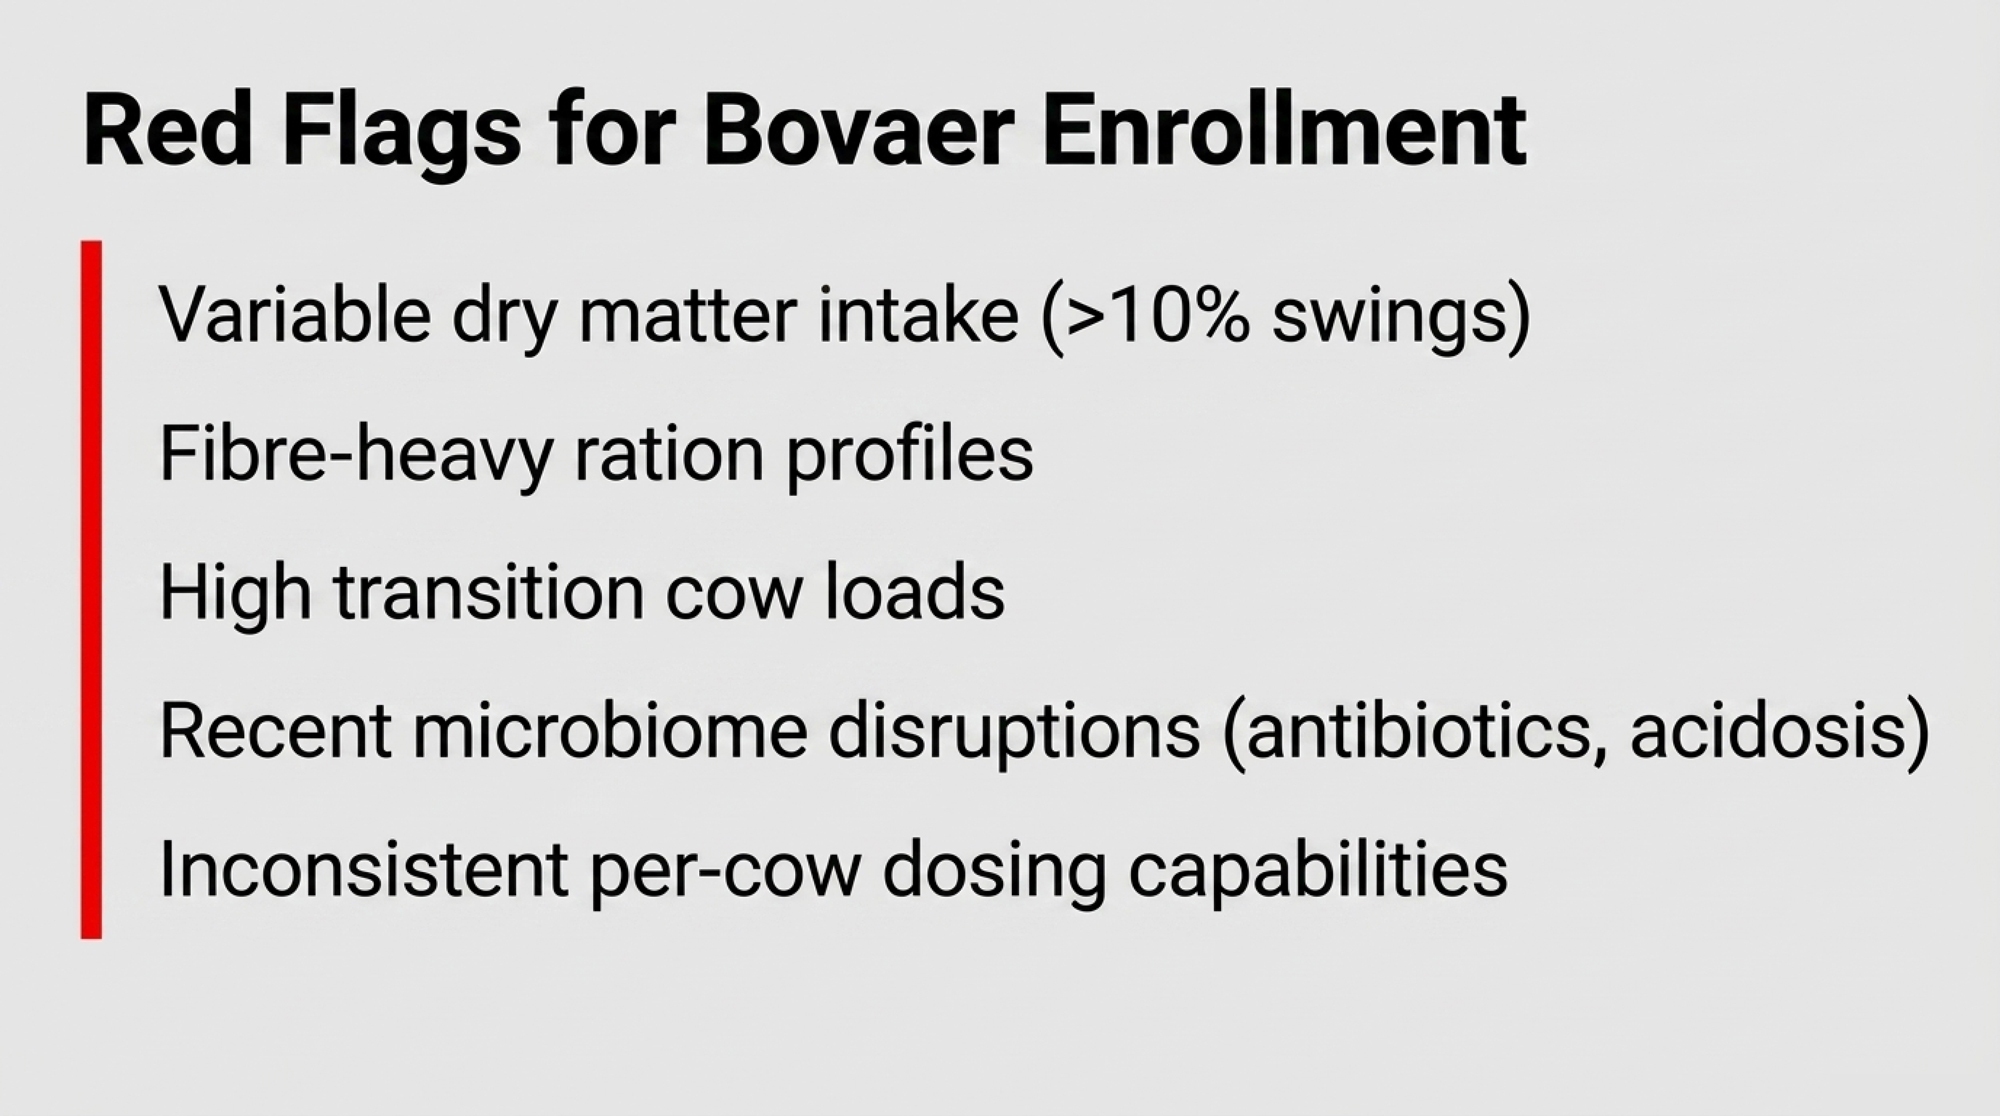
- Baseline dry matter intake variability. What’s our DMI coefficient of variation, and does it move more than 10% seasonally? Tight, consistent intake gives you a buffer. Wide variation doesn’t.
- Ration fermentation profile. Is our fermentation pattern starch-driven (more propionate-producing capacity, better hydrogen capture) or fiber-driven (closer to the Danish grass-clover diet that didn’t deliver the same results)?
- Transition cow load. What percentage of the lactating group is within 60 days of freshening at any given time? Fresh cows are the worst candidates for an initial intake suppression event.
- Recent microbiome disruptions. Have we had broad-spectrum antibiotic treatments, ration reformulations, or acidosis events in the last 90 days?
- Per-cow dose consistency. If intake drops 15% in a cohort, what happens to their effective 3-NOP concentration — and can our delivery system respond in real time?
- Exit protocol if intake signals show in the first 21 days. What’s the threshold that triggers protocol review, who makes the call, and what’s the contract penalty for early exit?
If more than two of those answers are “we’d have to watch and see,” that’s a signal to pause enrollment, not push through it.
What Closes the Gap — and Who Actually Has That Lever
Three things can close the $97-per-cow deficit at 24% efficacy. Only one of them sits in the producer’s control.
The first is a processor subsidy on the input cost. The contracts that pencil, pencil because the processor is absorbing part of the additive cost directly — flat per-cow subsidy, milk price premium that offsets additive spend, or full input coverage with the producer taking a smaller credit revenue share. FrieslandCampina structured it that way in the Netherlands. Denmark’s government did it via national subsidy. North American contracts where the producer eats the full $164.25/cow don’t pencil at any realistic efficacy number under current carbon pricing. Ask in writing: what’s my net additive cost after program subsidies?
The second is the OFCAF cost-share. USDA’s program covers 65–85% of practice costs, but caps at $75,000 per farm. On a 1,000-cow operation’s annual $164,250 additive cost, the cap covers roughly 46% — closing about half the gap in year one. Larger herds hit the cap faster. The program is competitive, requires application and conservation activity documentation, and depends on appropriations. A contract that pencils only with OFCAF is a contract that doesn’t pencil without it — and that risk lands on the producer, not the aggregator.
The third is carbon price appreciation, and most operators don’t realize they’re making this bet. For the gap to close on carbon economics alone, inset pricing would need to roughly double from current mid-market levels while additive costs hold flat. That’s a market call, not a farm economics calculation.
The Genetics Hedge That Costs Nothing Incrementally
Bovaer rents a reduction. Genetic selection builds a permanent one. The two strategies aren’t mutually exclusive — and treating them as either-or usually serves the seller more than the producer.
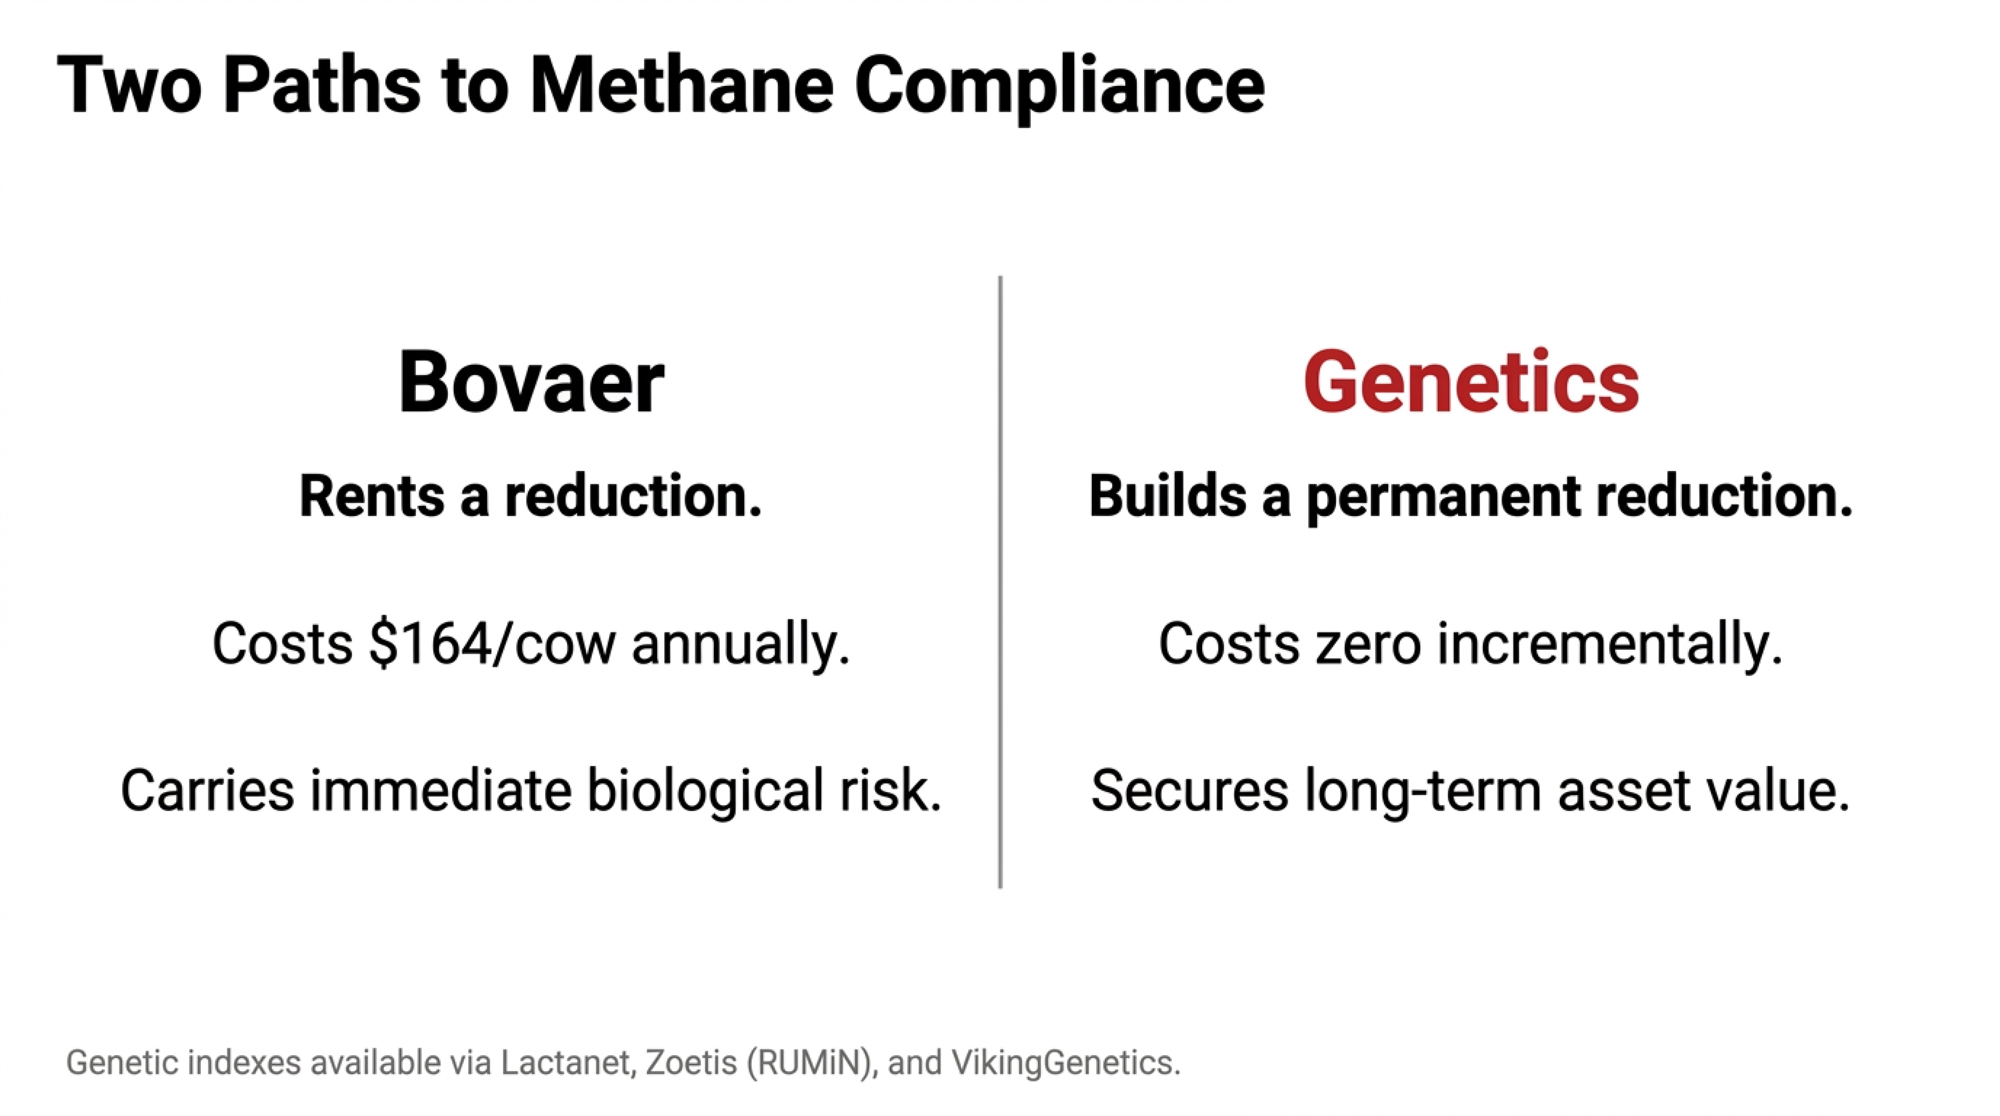
Lactanet’s Methane Efficiency RBV has been published on Holstein females in eDHI since April 2023, with genomic reliability strong enough on young bulls to drive sire selection decisions. Zoetis RUMiN was integrated into the April 2026 DWP$ update. VikingGenetics’ Nordic Methane Index draws on automated sniffer data from a large-scale commercial database across Denmark, Sweden, and Finland, producing breeding values with strong correlation to directly measured methane.
Timeline to herd-level expression: 5–7 years from a sire selection change. Not fast. But filtering 2026 sire decisions on methane breeding values costs nothing incrementally — and it builds a documented genetic trajectory that will matter when outcome-based verification standards tighten in the late 2020s, with no recurring additive spend attached.
The April Science paper makes the genetics path more interesting, not less. If high-hydrogenobody ciliate density is genetically influenced — which the paper implies but hasn’t yet quantified in cattle at scale — then selecting against high-methane phenotypes may also be selecting against the ciliate composition that caps Bovaer’s ceiling. That’s a hypothesis, not a confirmed finding. But it’s worth carrying into the next conversation about what your herd is being bred for.
What This Means for Your Operation
- If your contract assumes 30% efficacy, model it at 24% before you sign. The midpoint of the only year-long full-lactation field study puts the deficit at roughly $97/cow on a 1,000-cow operation. If the math doesn’t work at field-realistic numbers, the contract isn’t priced for your barn.
- If your payment trigger is delivered methane performance, not dosing compliance, you’re holding 100% of the biological risk. Confirm in writing which structure your contract uses. Verra’s VM0041 verification audits dosing — your contract may not.
- If your processor is not absorbing part of the additive cost, the contract probably doesn’t pencil.FrieslandCampina did it in the Netherlands. Denmark did it via national subsidy. North American producers signing without that backstop are eating the full $164.25/cow.
- If you can’t answer four of the six pre-enrollment nutrition questions with certainty, pause the enrollment. The herds that reported problems in Denmark weren’t randomly distributed. Variable DMI, fiber-heavy rations, recent microbiome disruptions, and high transition cow load are the risk markers.
- If your 2026 sire decisions don’t already filter on methane breeding values, change that in this proof run.Lactanet RBV, Zoetis RUMiN, and VikingGenetics Methane Index cost nothing incrementally. The genetic trajectory you build now is the asset you’ll have when outcome-based verification tightens in the late 2020s.
- If EFSA’s reassessment opinion lands during your contract term, who absorbs the regulatory cost? The April 10 data deadline has passed. The opinion is still pending. Build a 90-day exit-with-cause clause before you need it.
- If VM0041 v3.0 passes during your contract term, who bears the ERF adjustment cost? Tighter ERFs shrink clawback risk and shrink credit revenue at the same time. Get the answer in writing.
Key Takeaways
- If the contract pencils only with OFCAF cost-share, it doesn’t pencil. USDA’s $75,000 per-farm cap covers roughly 46% of a 1,000-cow operation’s annual additive cost in year one. Year two depends on appropriations that the aggregator can’t guarantee.
- If your aggregator quotes 30%, ask them to put 24% in writing as a downside scenario. A refusal tells you which side of the table is holding the efficacy risk.
- Within 30 days, pull your last six months of DMI records and run the six pre-enrollment questions with your nutritionist. That’s the lowest-cost stress test of your herd’s candidacy that exists.
- Within 30 days, filter your next proof run’s sire shortlist on methane breeding values. Lactanet RBV, Zoetis RUMiN as integrated into the April 2026 DWP$ update, and VikingGenetics Methane Index are all available now at no incremental cost.
- If a contract structure makes the efficacy risk invisible until verification fails, that’s the structure — not a feature. The 1,600-herd Danish dataset will eventually surface a real commercial efficacy number. North American producers signing now are pricing against laboratory conditions, not real-world barns.
So here’s where this lands. The 1,600-herd Danish dataset will eventually give us the real commercial efficacy numbers we need. Denmark’s tax structure makes that measurement a regulatory necessity by 2030. Until those figures land in peer-reviewed form, every offer being signed in North America is pricing against a flawless laboratory environment, not a real-world barn. If your aggregator can’t tell you in writing what you’re paid on at 24% delivered efficacy, what’s the contract really pricing — and which side of the table is holding the bag?
Run Your Numbers
Health ROI Calculator — Before you sign a 2027 Bovaer contract, pressure-test the math at field-realistic 22–24% efficacy, not the 30% on the sales sheet. The tool puts a per-cow dollar value on the additive spend, the credit revenue, and the gap your processor isn’t backstopping — so you walk into the contract conversation knowing exactly which number has to move.
Learn More
- Carbon Credits: $150,000 for Large Dairies, $3,000 for Family Farms – Here’s Why — Eighty percent of U.S. family farms are structurally locked out of current climate revenue. This financial breakdown follows the money on carbon payouts, revealing exactly why only operations milking 2,000+ cows can justify the required $28,000 upfront verification investment.
- The Carbon Credit Goldmine: How Forward-Thinking Dairy Producers Are Turning Methane Reduction into Cash Flow — Arm yourself with a concrete framework to evaluate processor insetting versus independent registry sales. Mastering these baseline requirements protects your 10-year strategic horizon before you sign away your operation’s emission rights to binding, decade-long corporate commitments.
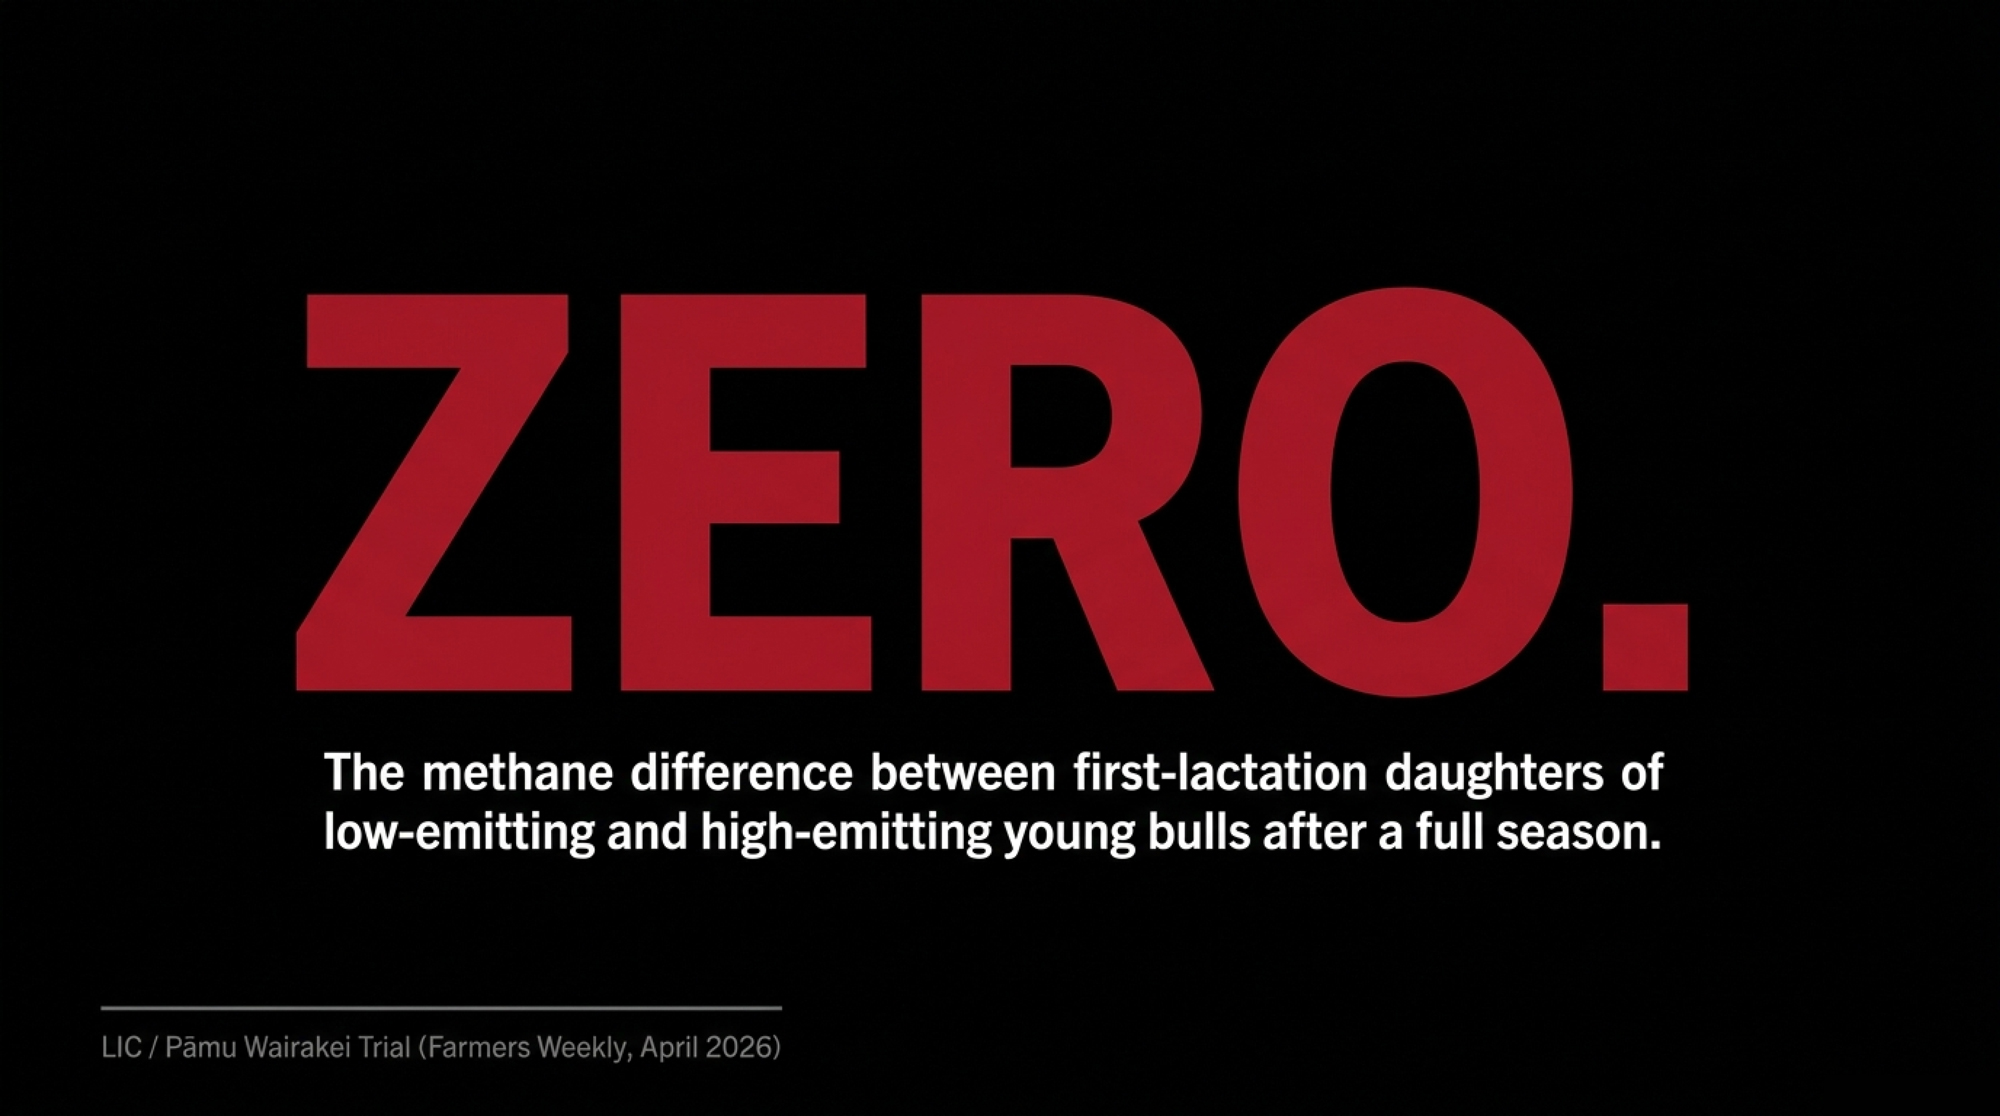
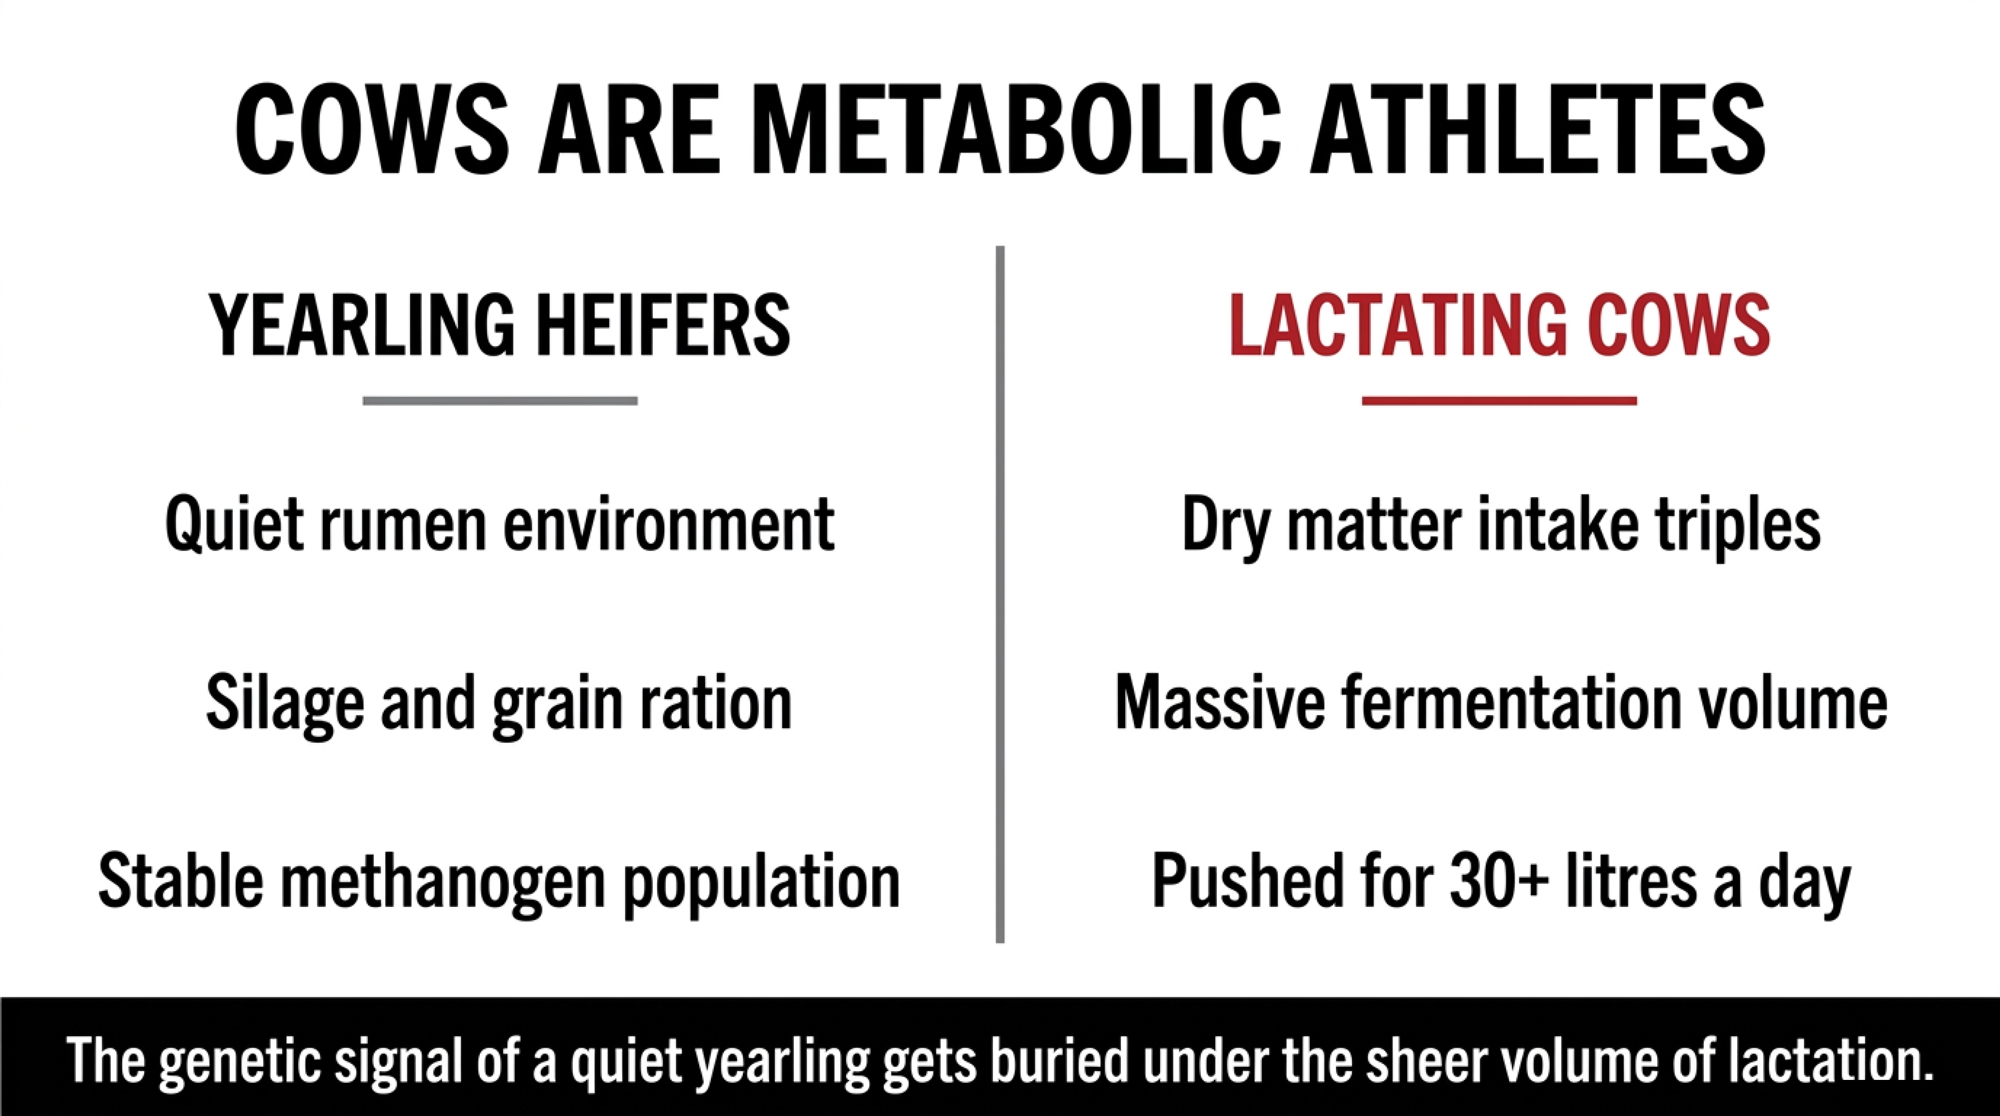
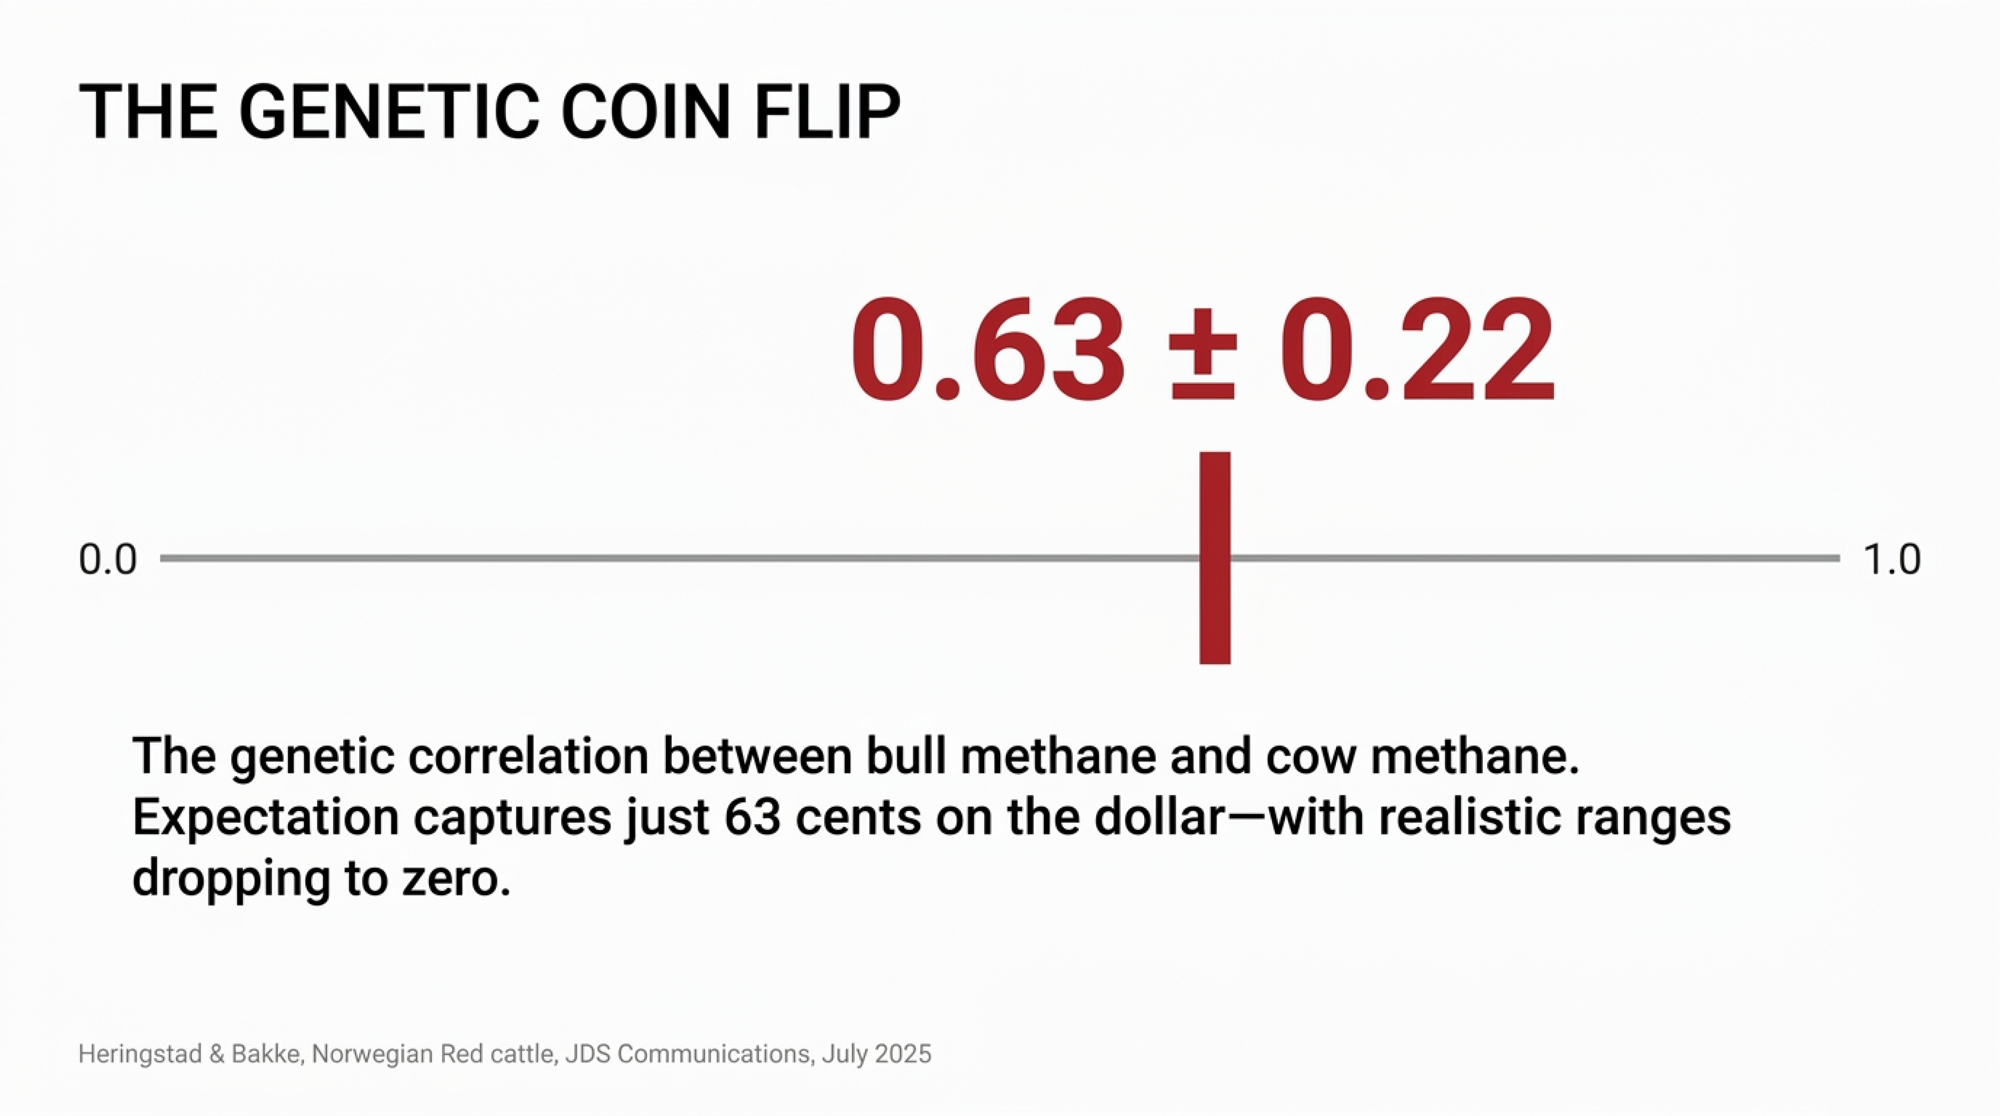
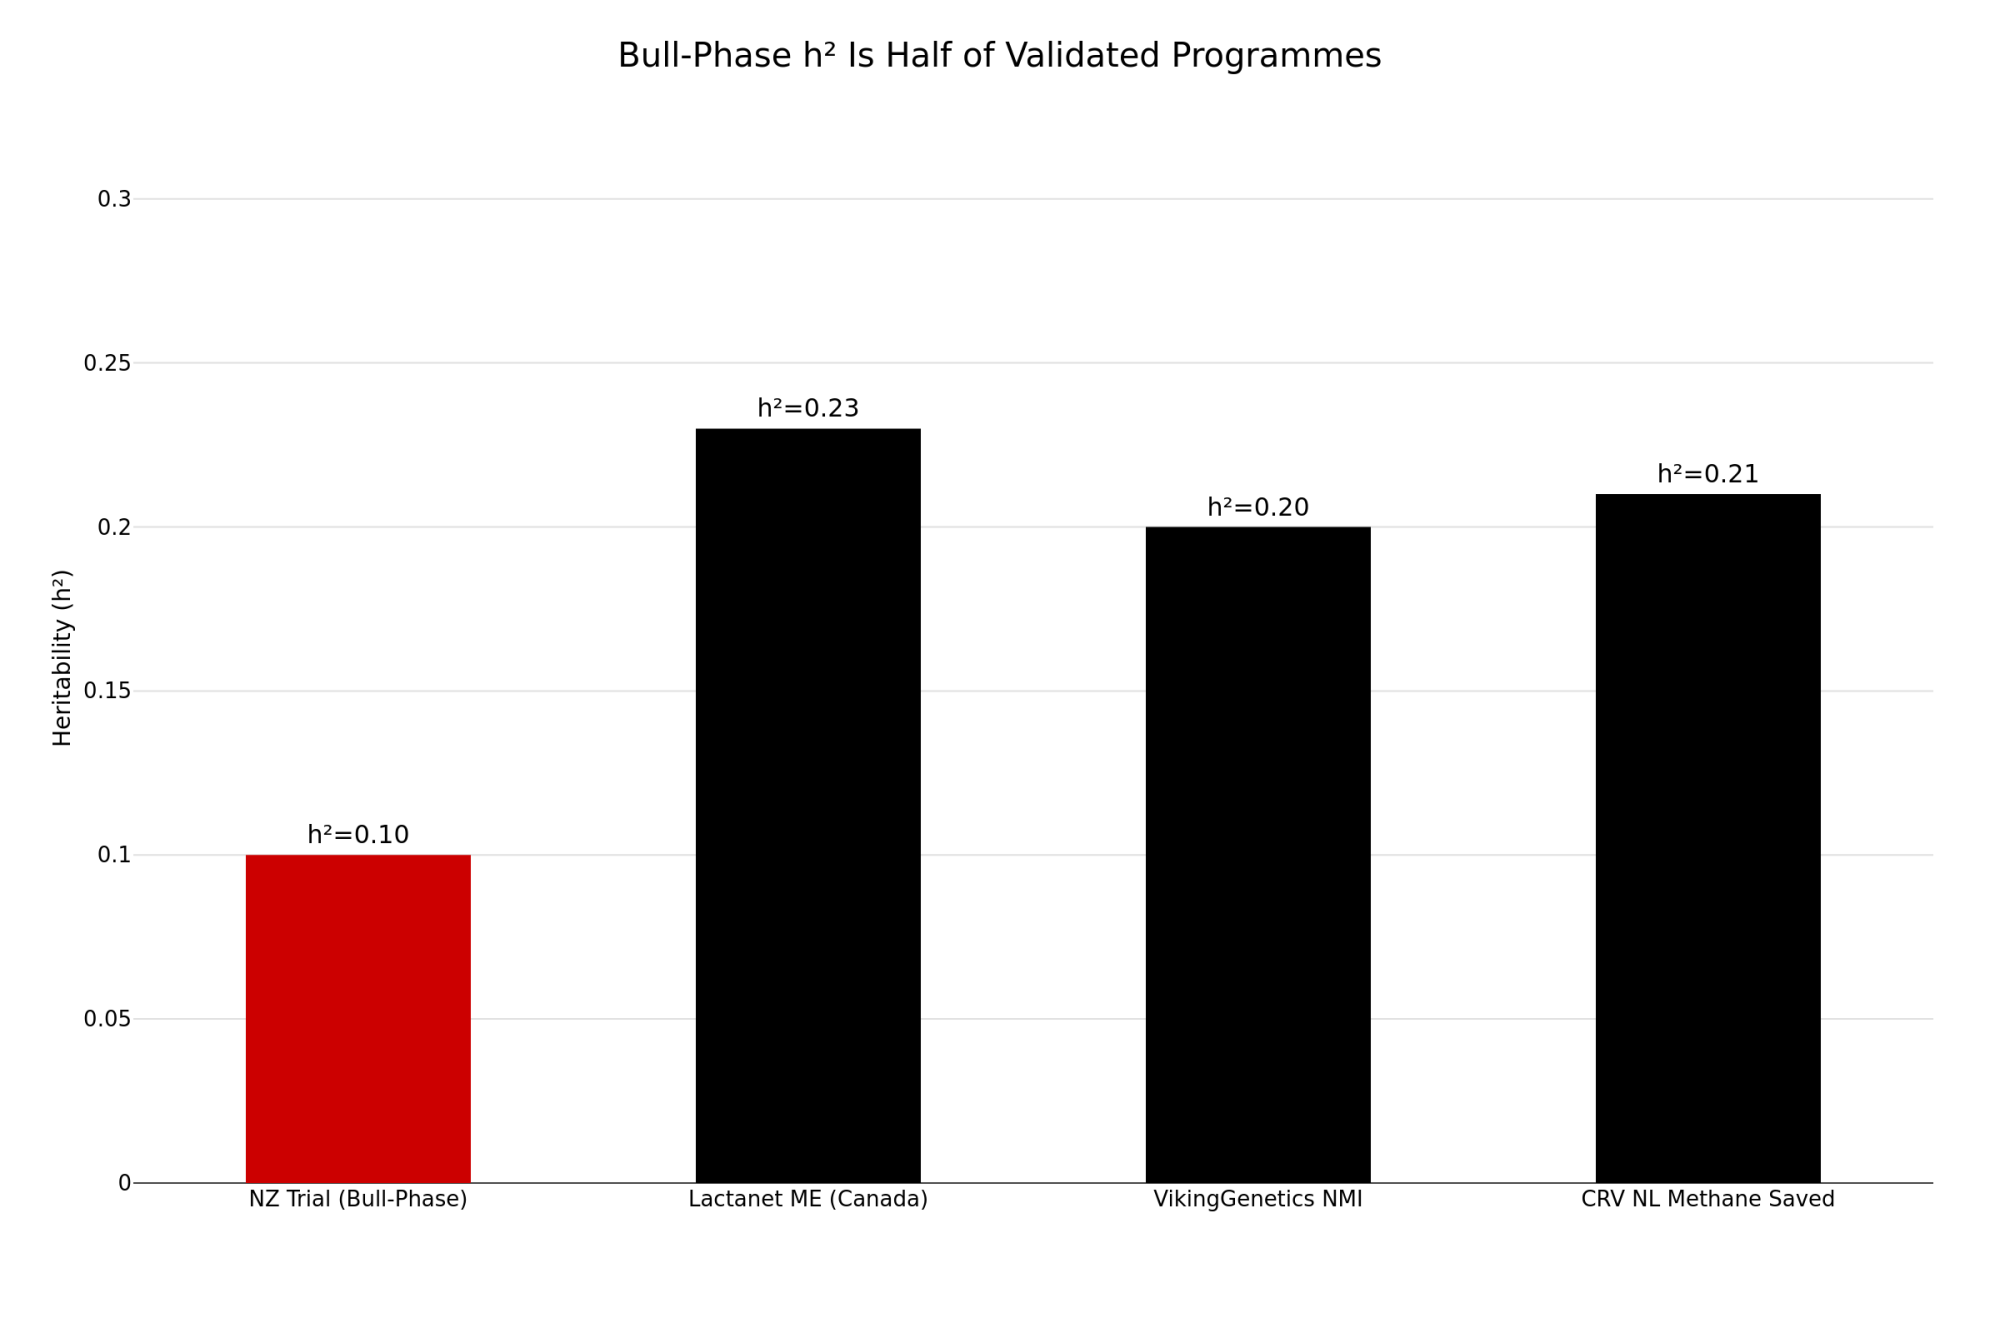
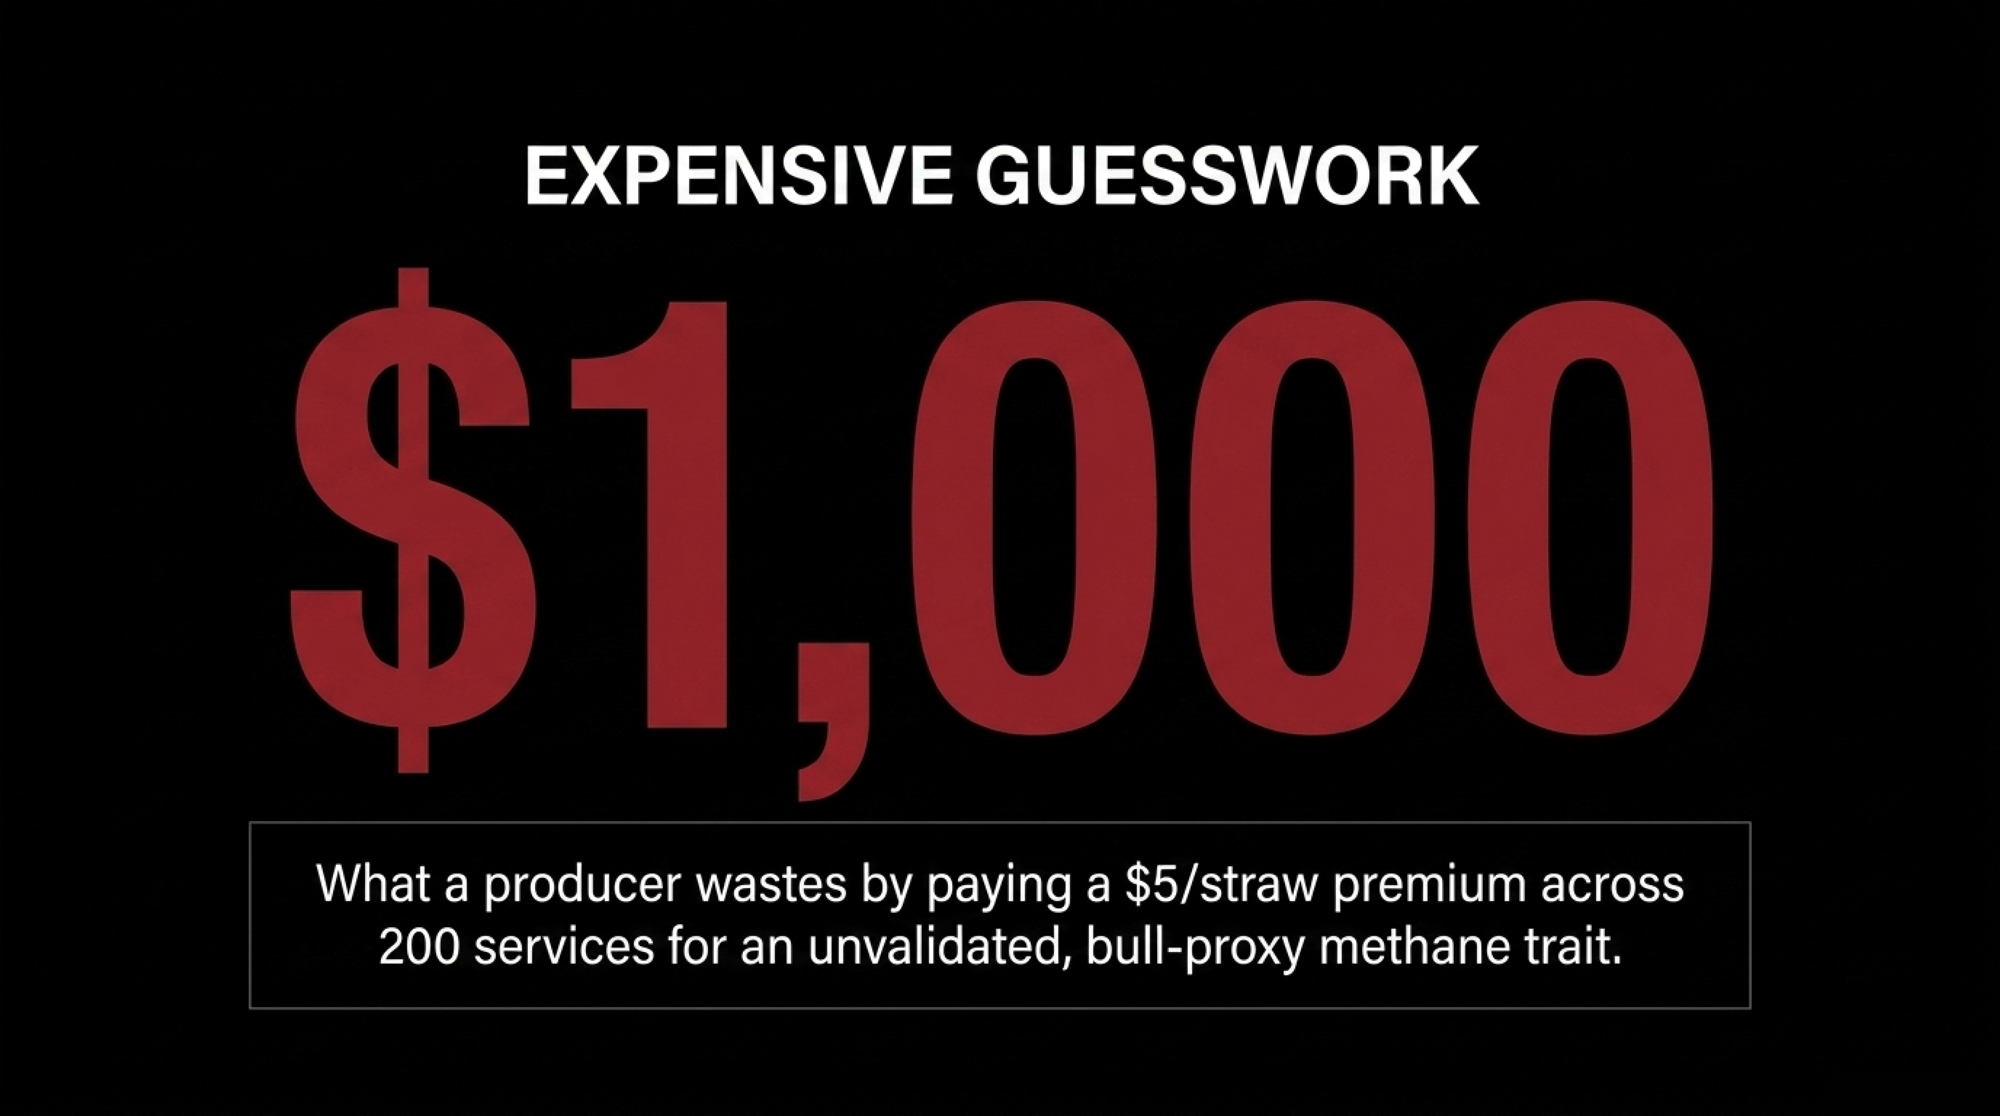
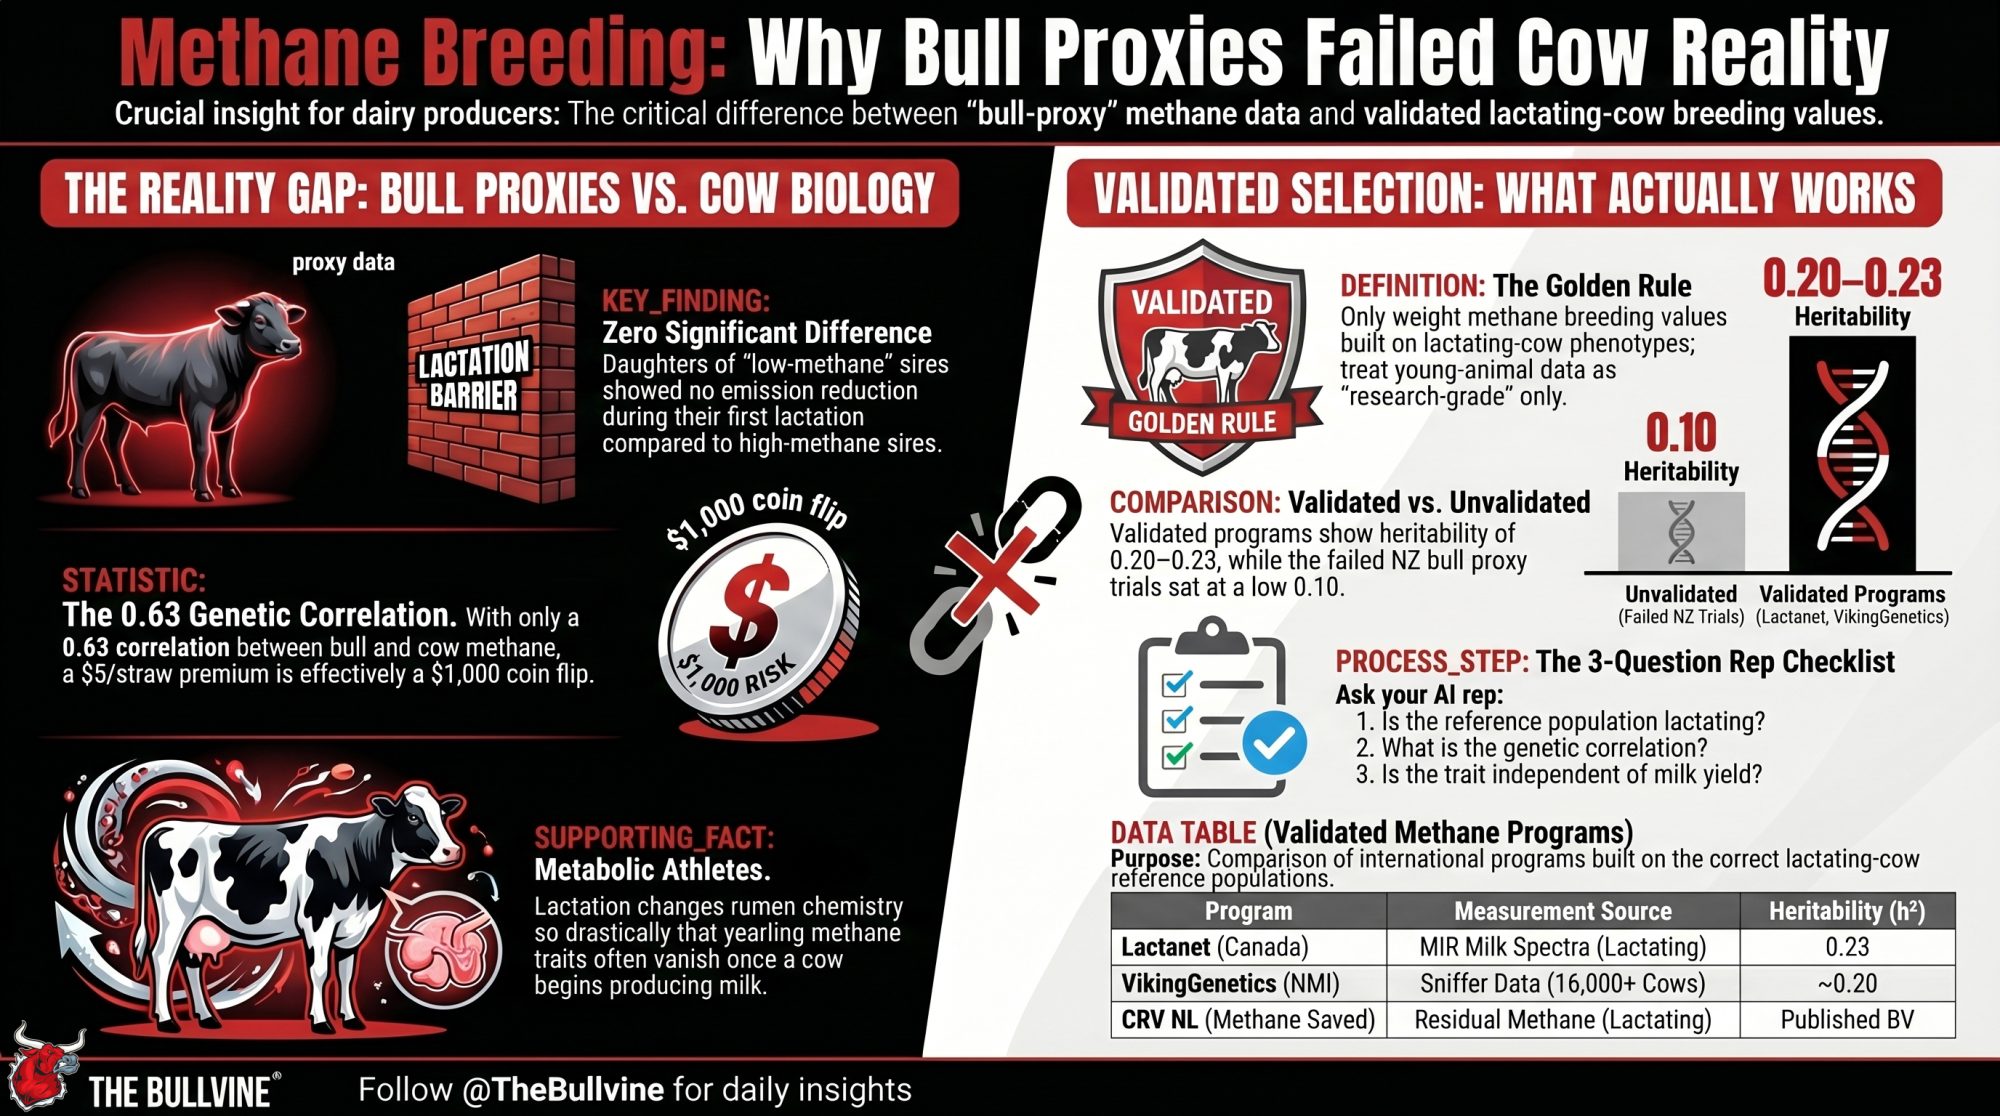
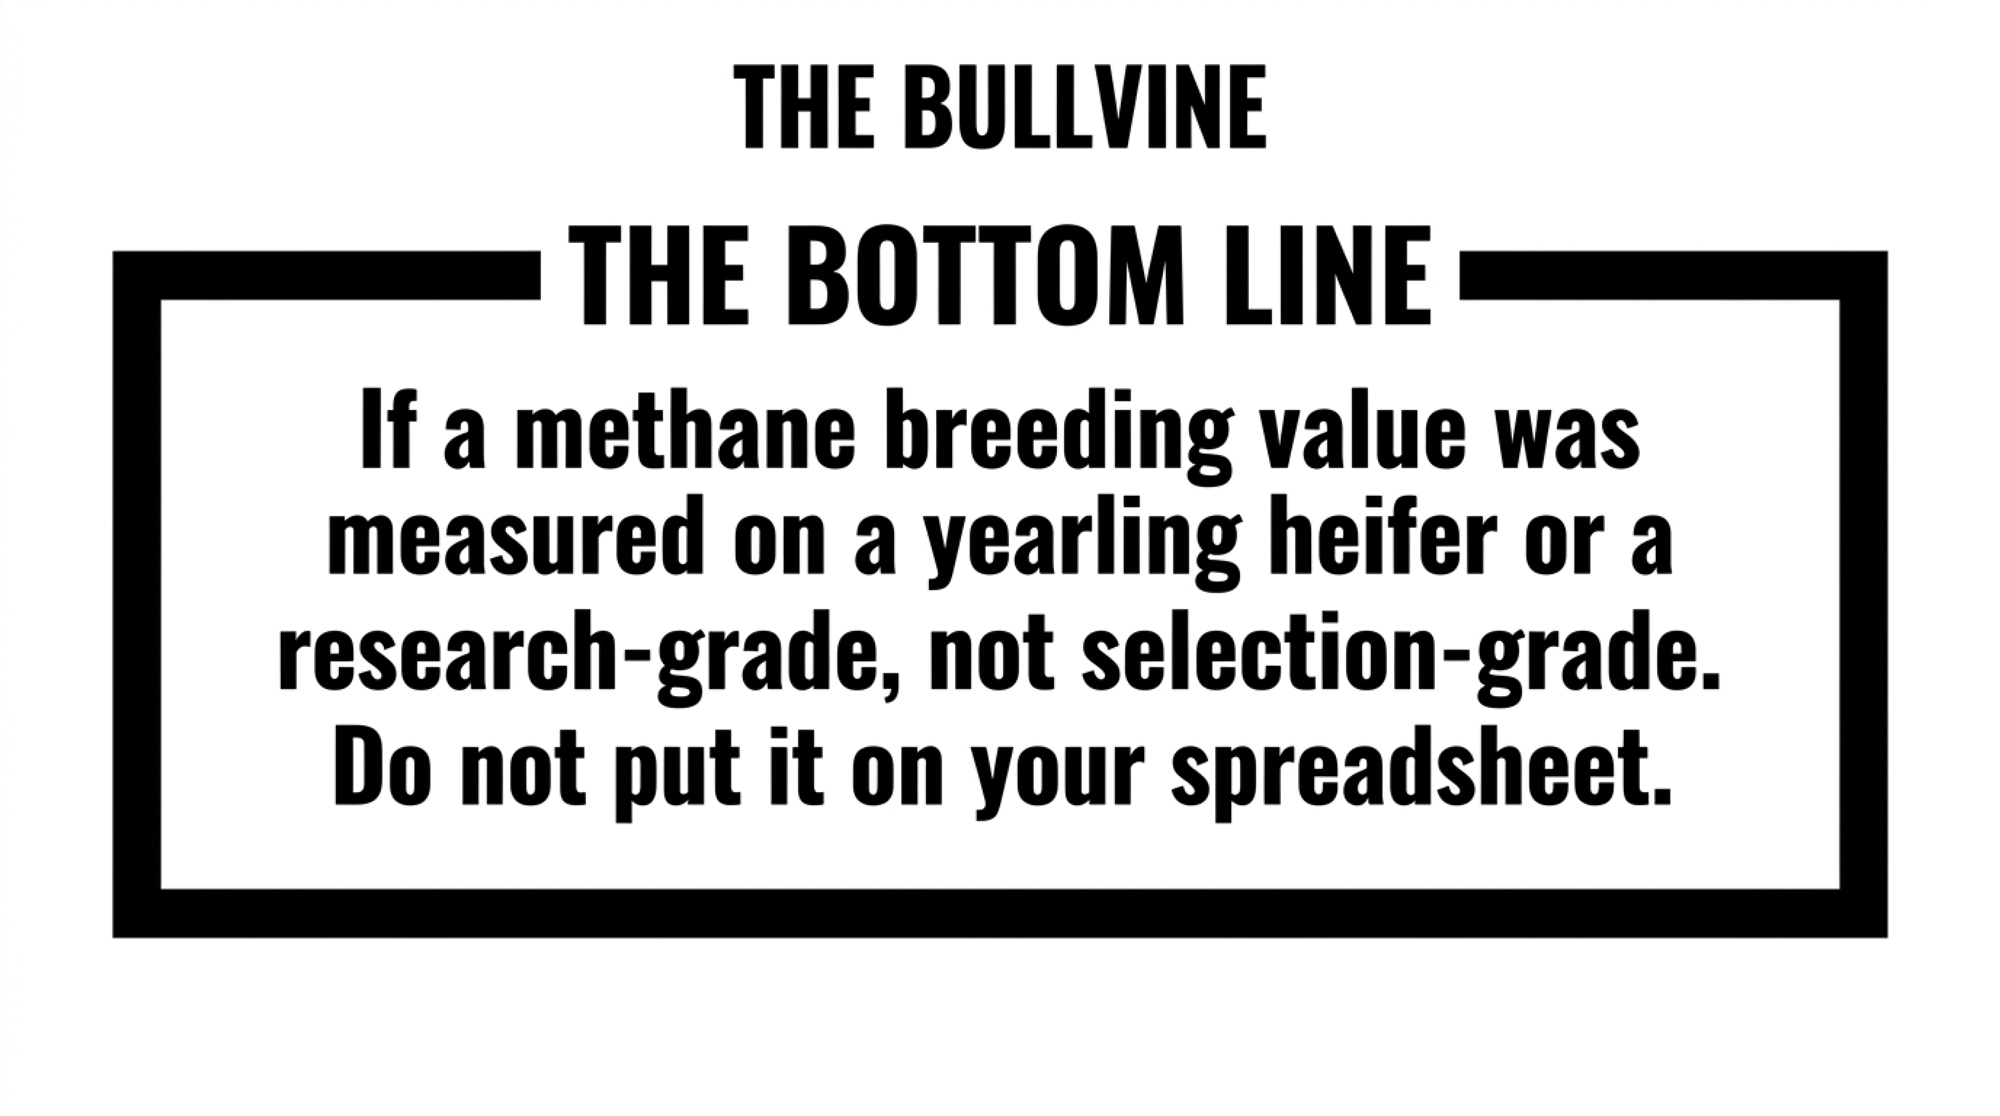
- New Zealand Bred Years of Low-Methane Bulls. Their Daughters Didn’t Inherit a Thing. — Avoiding expensive genetic guesswork requires knowing how sires were tested. Analyzing New Zealand’s flagship trial dismantles the assumption that yearling methane phenotypes transfer to the milking string, delivering a stark warning for semen buyers.
 The Sunday Read Dairy Professionals Don’t Skip.
 The Sunday Read Dairy Professionals Don’t Skip.
Every week, thousands of producers, breeders, and industry insiders open Bullvine Weekly for genetics insights, market shifts, and profit strategies they won’t find anywhere else. One email. Five minutes. Smarter decisions all week.