









UW–Madison’s 2026 model pushed the best sexed-plus-beef stop point from 270 to 330 DIM as calf values rose. New Holland’s beef-cross bulls topped its highest tested value on Oct. 5, but only $260 over Holstein bulls by our math.
Market data current through the Oct. 5, 2026 New Holland sale.
The short version
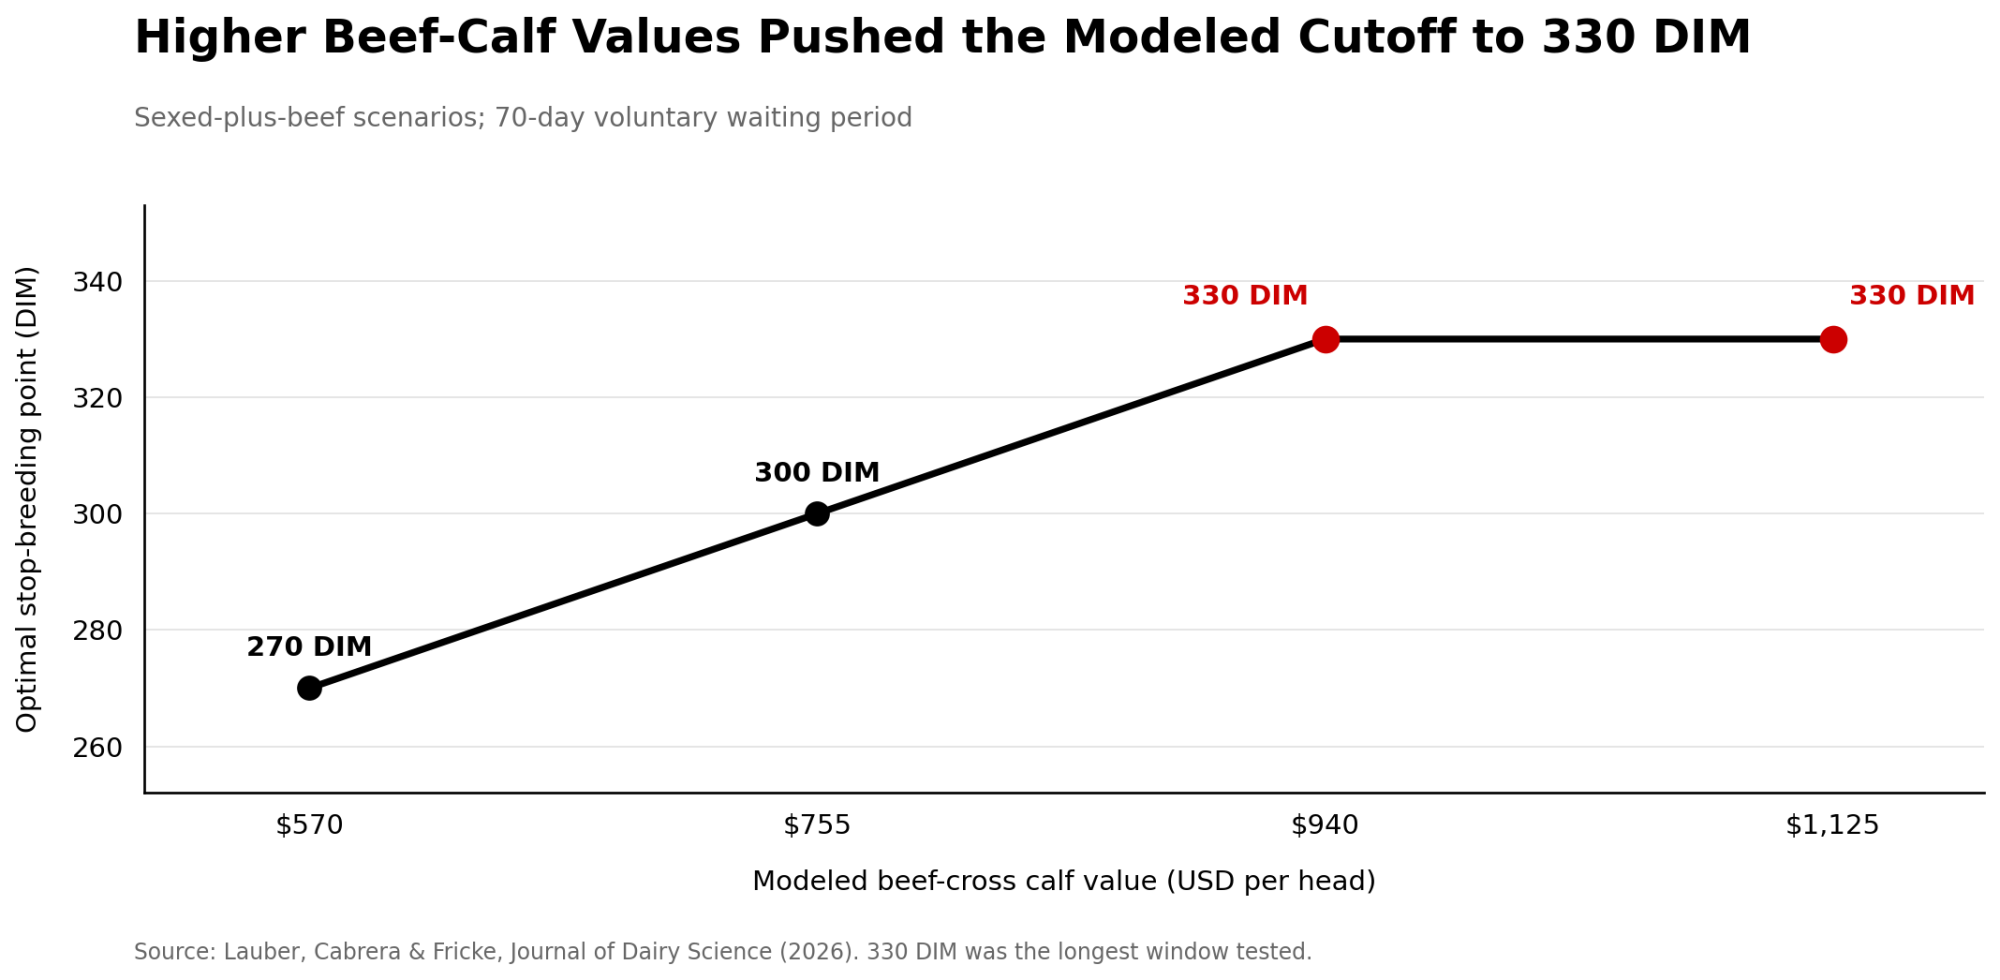
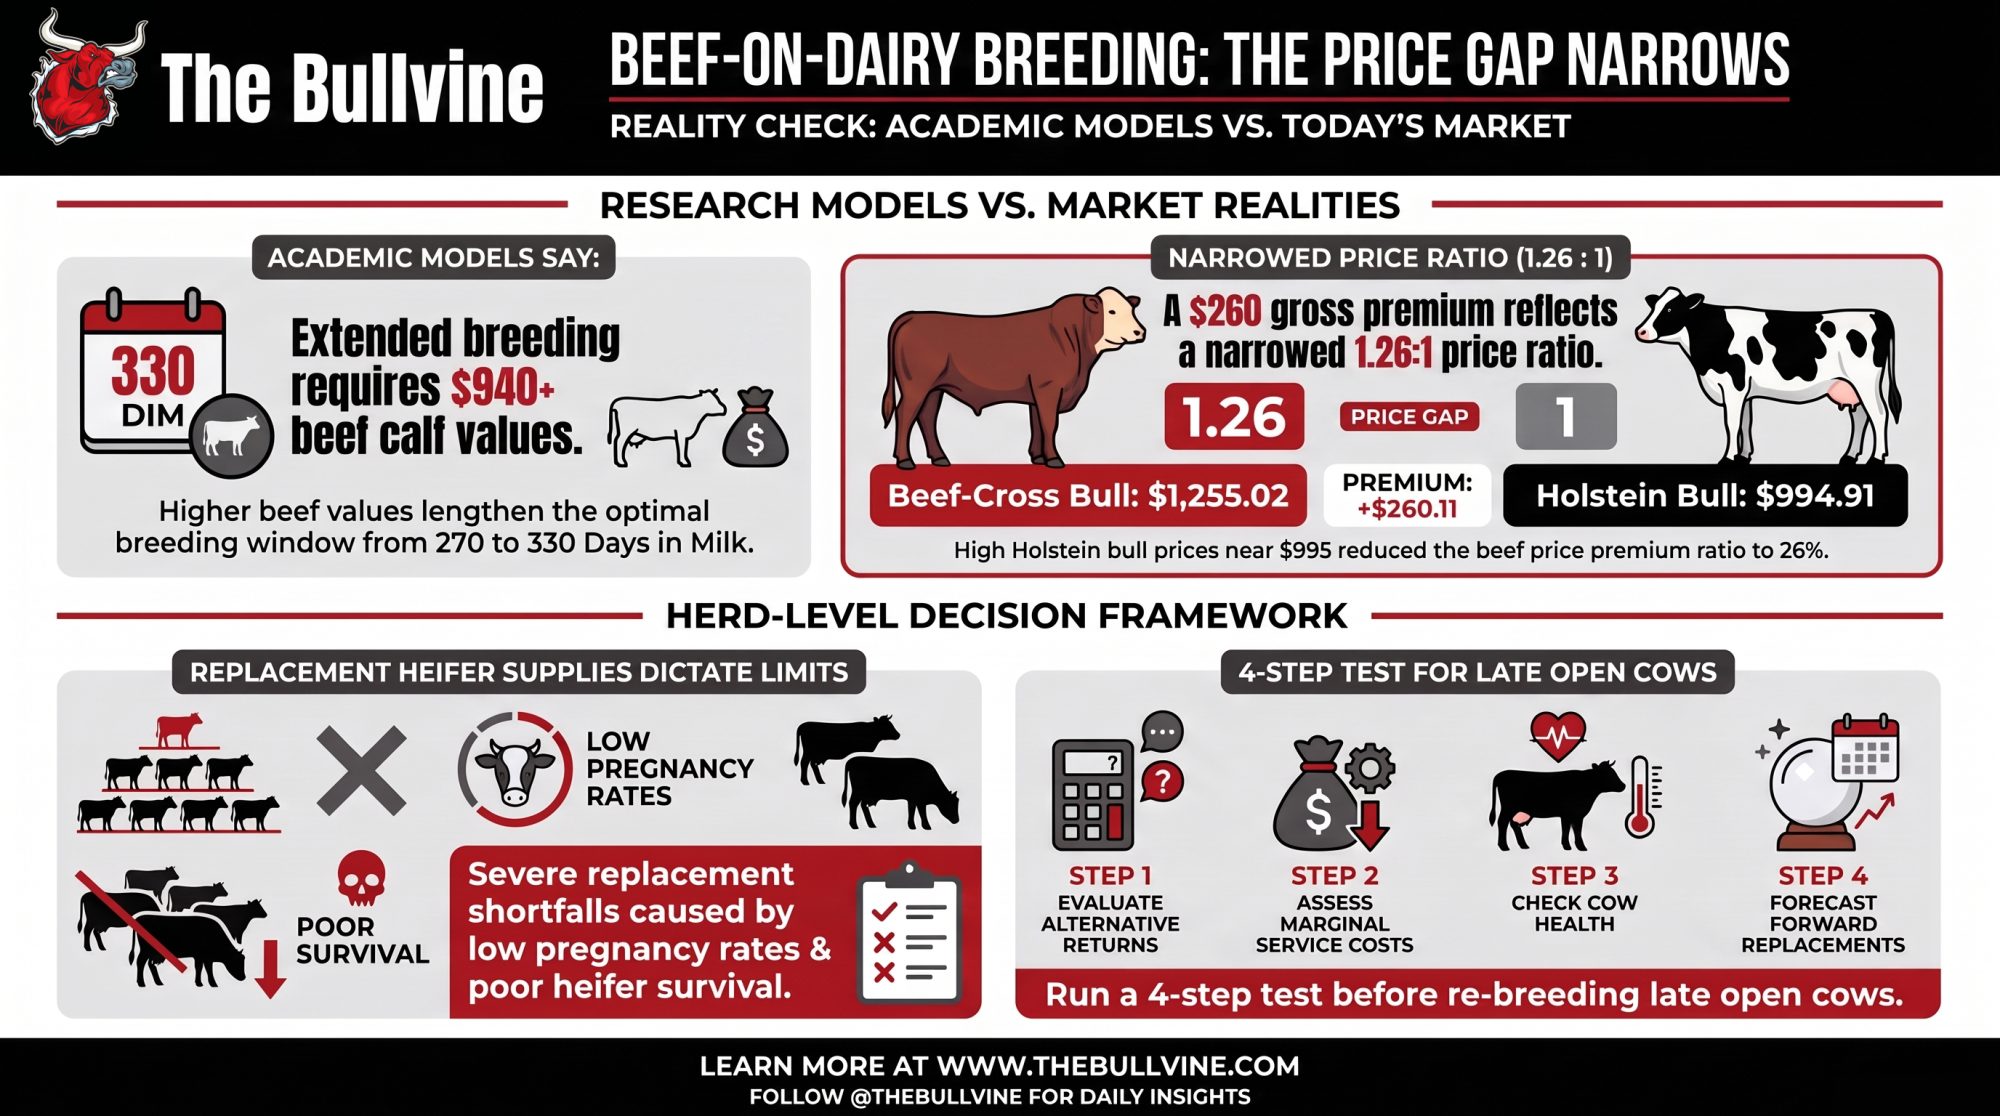
- The model: at a $570 beef-cross calf, sexed-plus-beef herds did best breeding to 270 DIM. When the researchers raised the calf value, the optimum moved to 300 DIM at $755 and to 330 DIM at $940 and up, the longest window they tested.
- The market: New Holland’s No. 1 beef-cross bulls brought $1,232.86 a head on Sept. 28 and $1,255.02 on Oct. 5. All are above the $1,125 top price the model tested.
- The catch: the premium over a Holstein bull was $260 to $303, a ratio of only 1.26 to 1.33. And the model never tested a world where the Holstein bull was worth nearly $1,000 too.
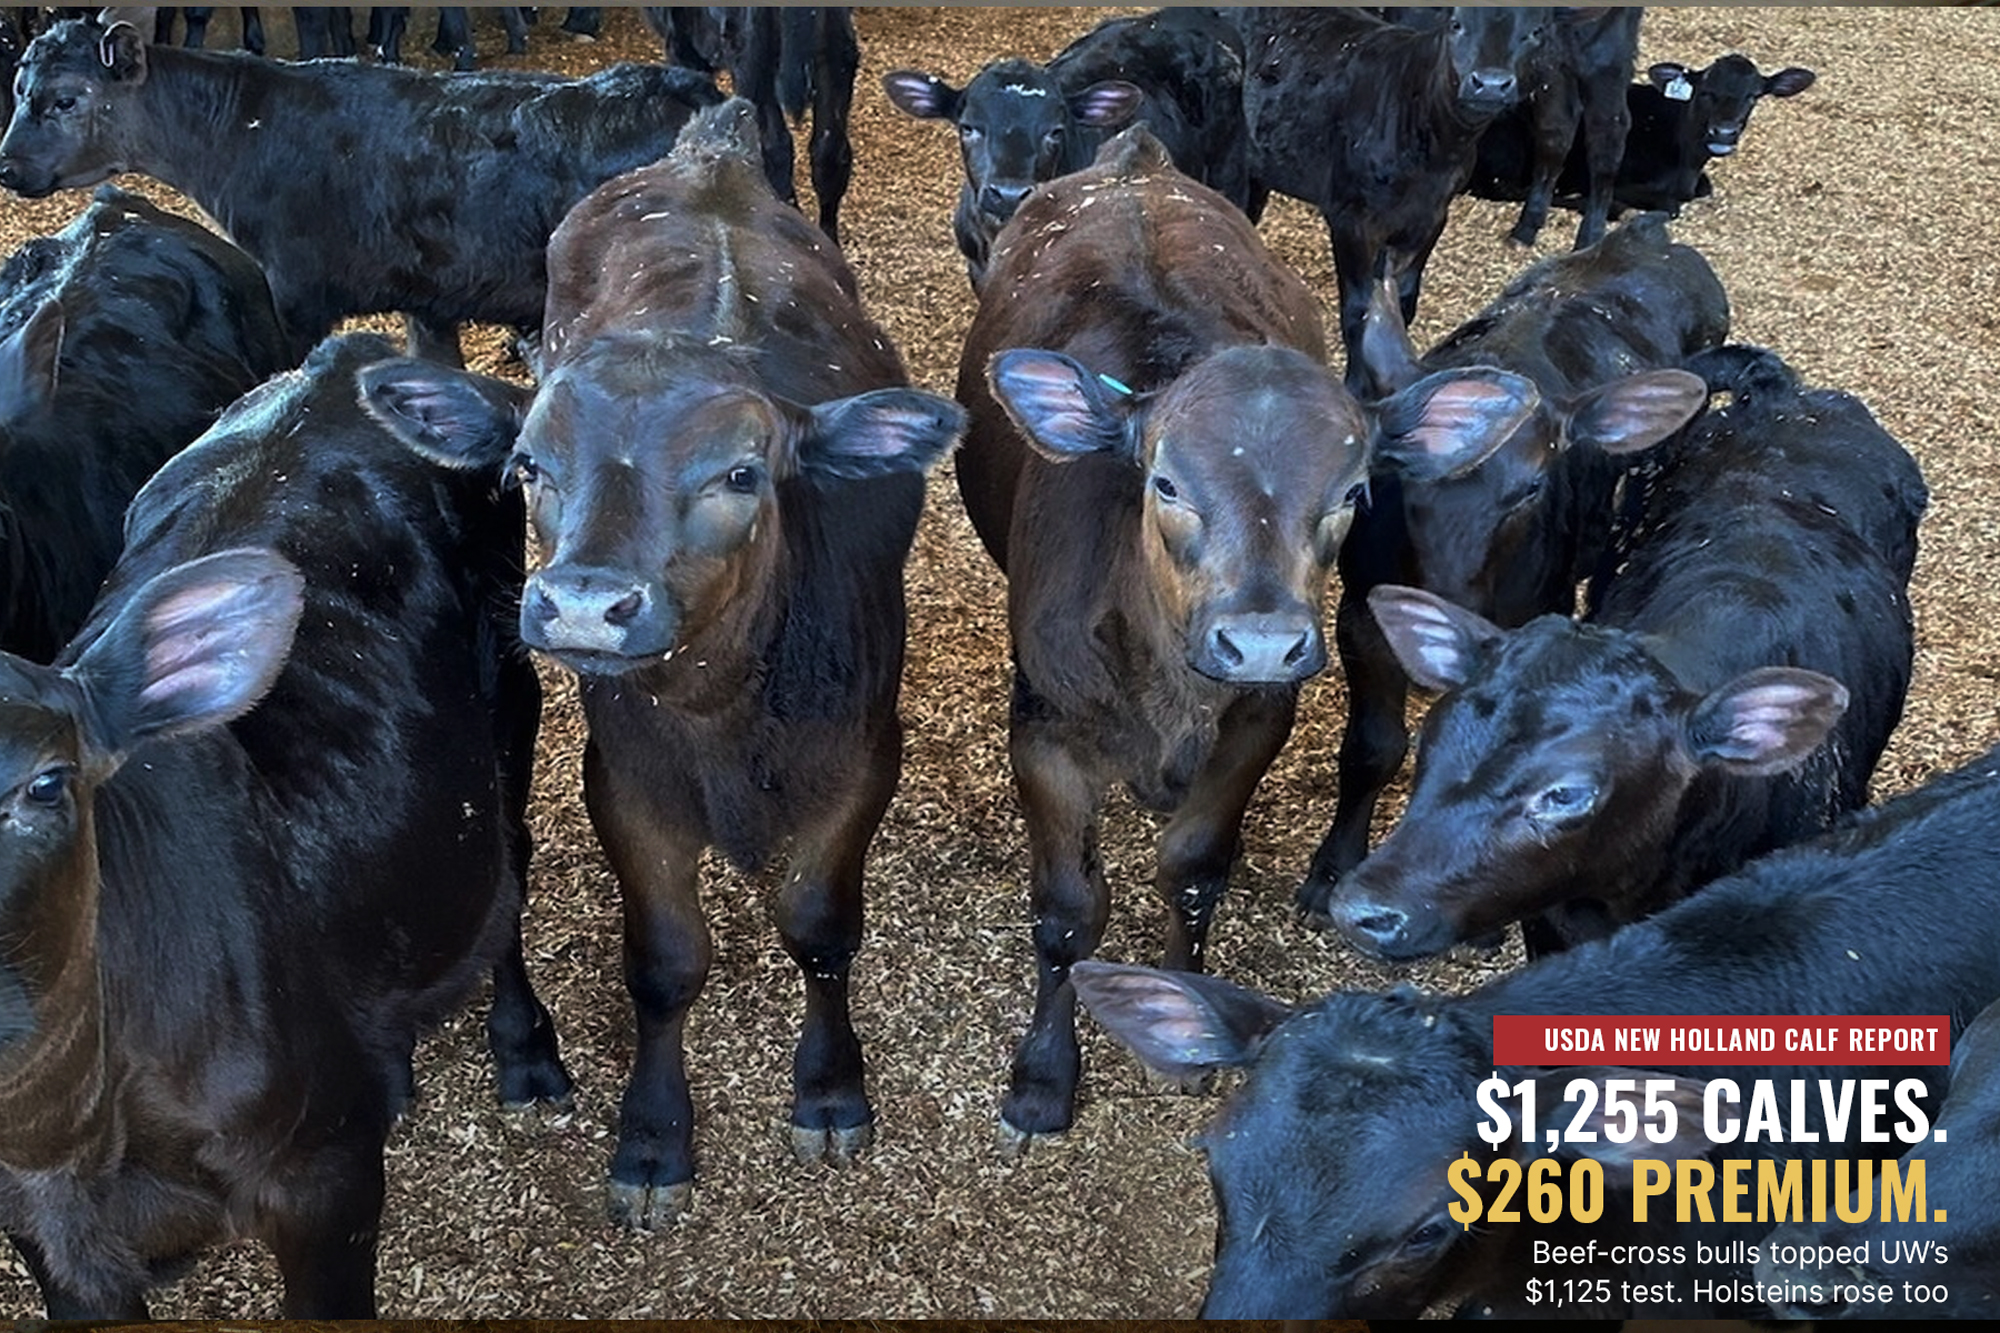
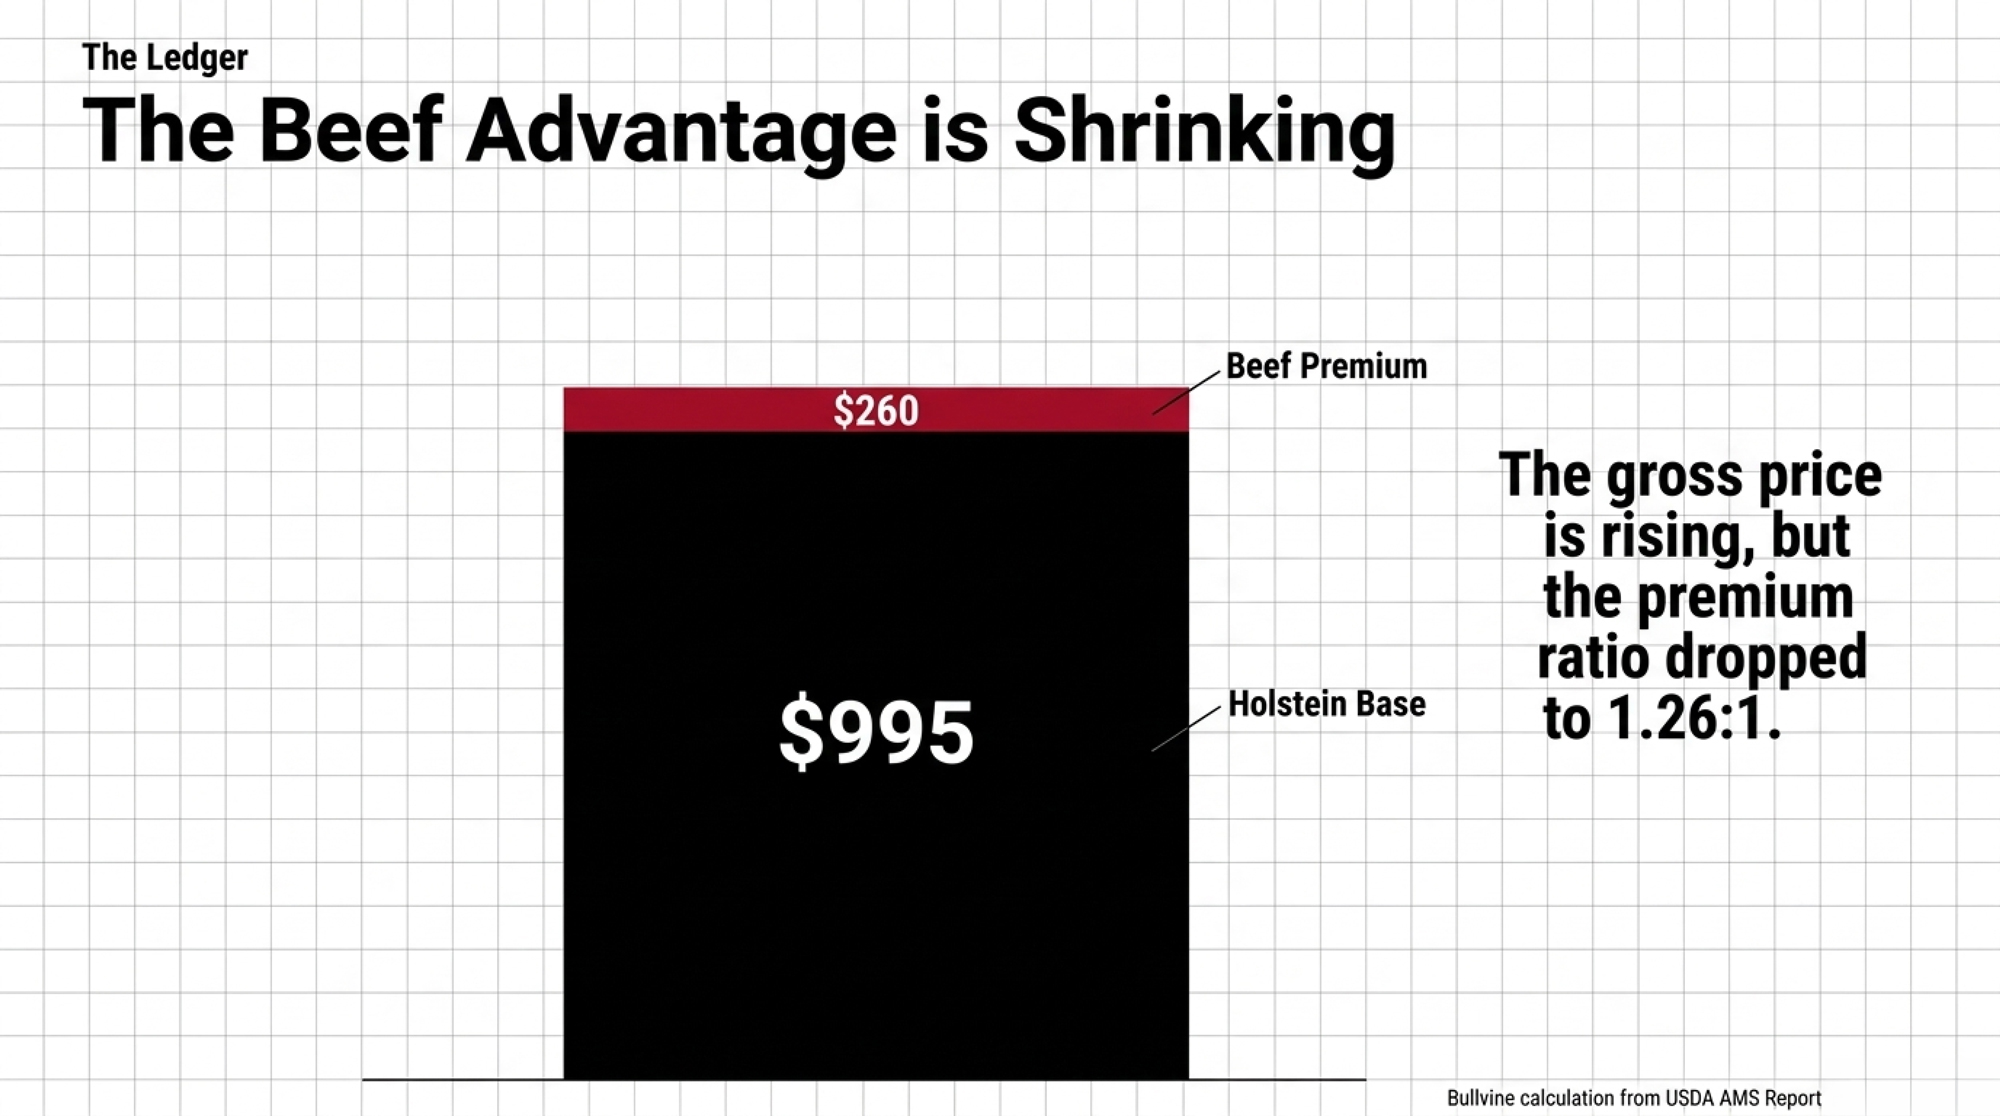
Two numbers came out of New Holland on Oct. 5. By our conversion of USDA’s report, No. 1 beef-cross bull calves averaged $1,255.02 a head . Their premium over No. 1 Holstein bulls was just $260.11.
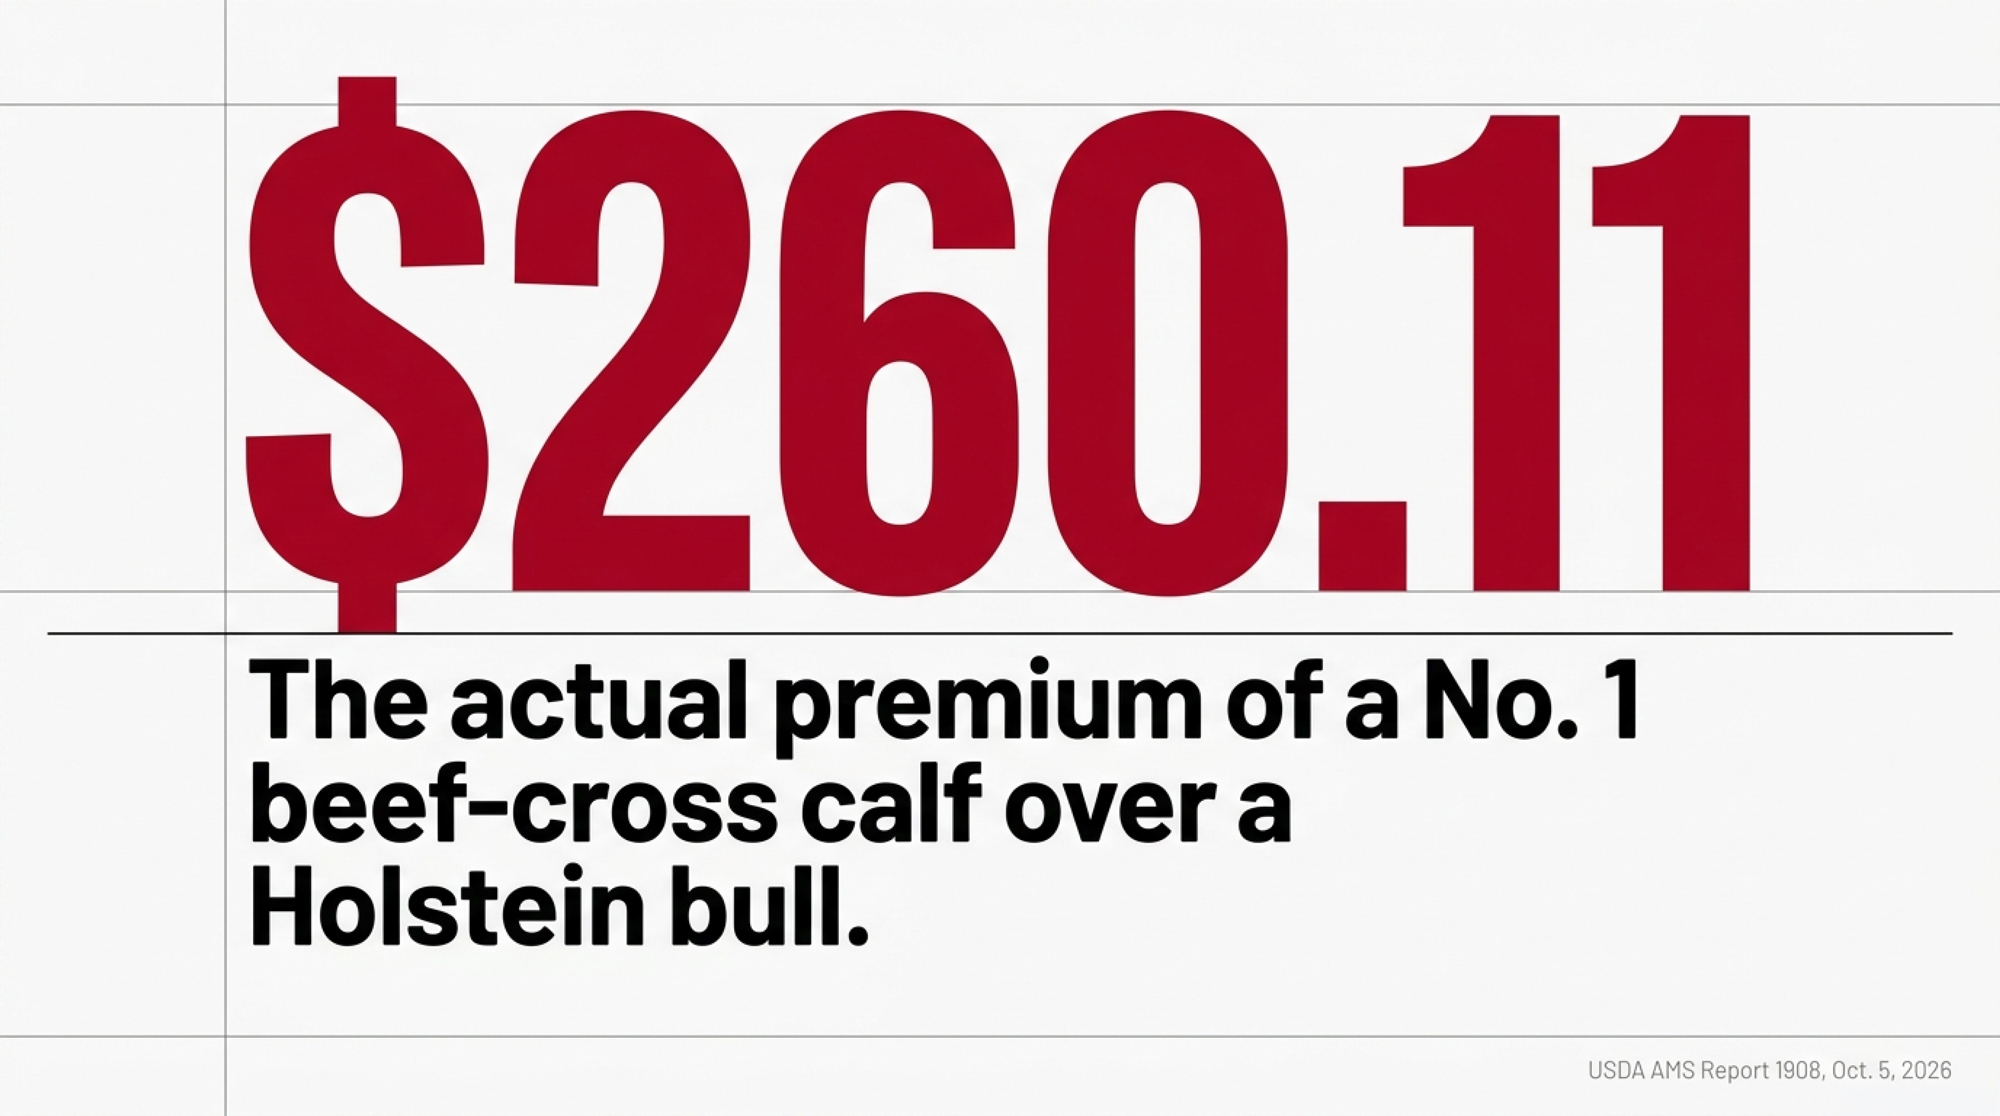
The $260 premium isn’t small in dollars. It’s small next to the nearly $995 Holstein bull underneath it. In the 2026 model’s base case, the beef-cross calf was worth about 48% more than the dairy bull. At New Holland on Oct. 5, the gap was about 26% (our math). Neither number on its own tells you how long to keep breeding an open cow. That depends on the expected value of another pregnancy, what you’d do instead, and whether your herd has enough replacements.
What UW–Madison’s Beef-on-Dairy Model Actually Found
Megan Lauber, Victor Cabrera and Paul Fricke of UW–Madison simulated a 1,000-cow herd in the January 2026 Journal of Dairy Science. For each scenario, they found the breeding window with the highest net return that still produced enough replacements to maintain herd size. That window is the insemination eligibility period after a 70-DIM voluntary waiting period, and they tested lengths from 50 to 260 days.
The base case used Feb. 5, 2024 prices: a beef × dairy calf at $570, a dairy bull at $385 and a dairy heifer calf at $167.50. The model sold every calf at market value and bought replacements at a $2,355 rearing cost. At those prices, sexed-plus-beef herds did best at a 200-day window, about 270 DIM. Net return there was $1,455 a cow at a 20% pregnancy rate, $1,514 at 30% and $1,549 at 40%. The exceptions were herds with low or below-average pregnancy rates and poor heifer survival, which ran short of replacements.
The researchers then re-ran the beef calf from $385 to $1,125 in $185 steps, holding the other inputs constant. The optimal window moved. In the paper’s words, “the optimal IEP extended to 230 and 260 d when beef calf market values were $755 and ≥$940, respectively”.
| Semen program and calf value | Optimal window after 70-DIM VWP | Stop-breeding point (our conversion) |
| Conventional | 80 days (high PR) to 170 days (low PR) | 150–240 DIM |
| Sexed-plus-beef, $570 base-case calf | 200 days | 270 DIM |
| Sexed-plus-beef, $755 calf | 230 days | 300 DIM |
| Sexed-plus-beef, $940 through $1,125 calf | 260 days | 330 DIM |
So the 270-DIM optimum was gone well before the calf reached $1,125. By $940 it had already hit 330 DIM, the longest window the model tested. No window past 330 DIM and no calf above $1,125 was tested. The 330-DIM result is a modelled optimum under the paper’s assumptions, including its culling rules. It isn’t permission to breed every open cow that long.
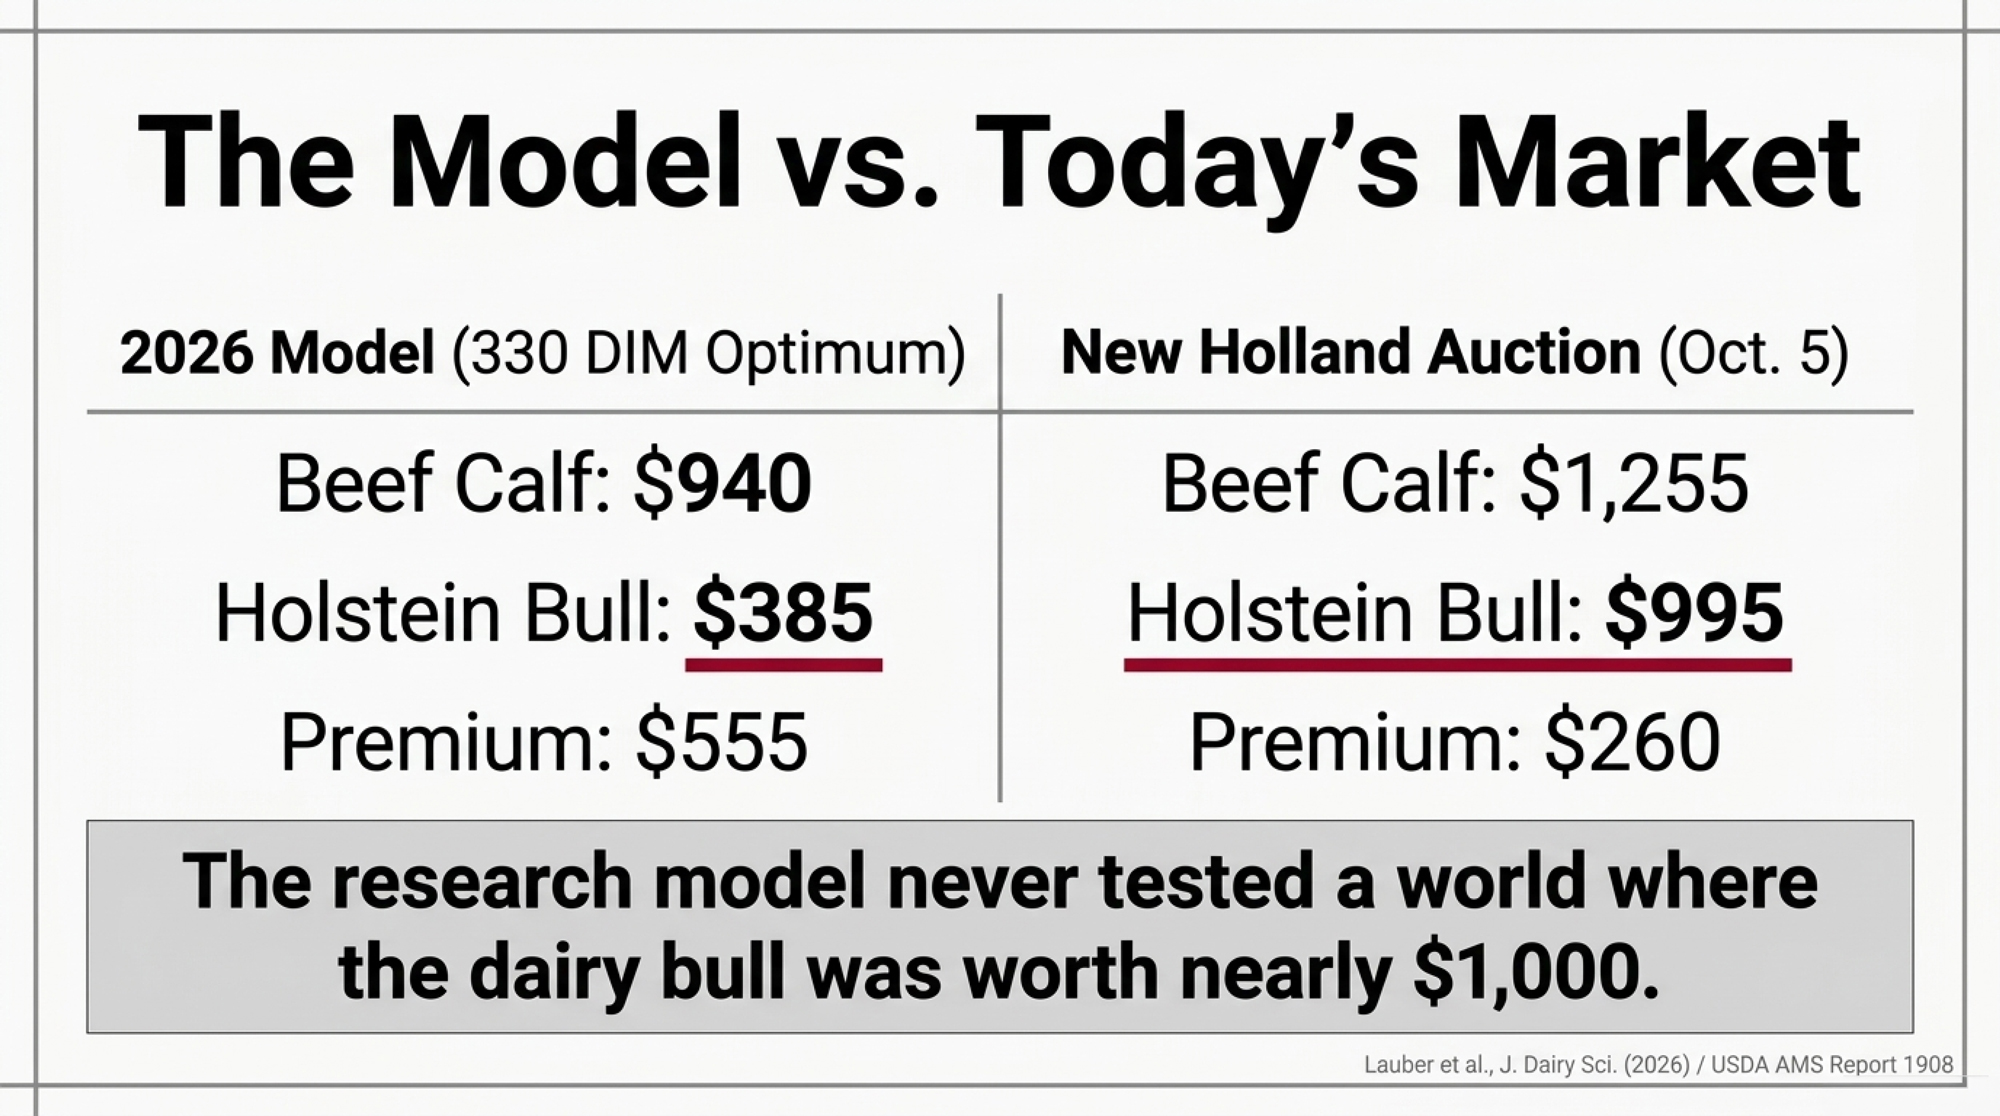
One important limit: the researchers raised beef-cross calf values while holding their other economic assumptions constant, including the $385 dairy bull. At $940, that meant a $555 gross premium and a 2.44:1 ratio (our math). New Holland’s Oct. 5 No. 1 Holstein bulls averaged nearly $995, and the premium was $260.11. Today’s market isn’t simply the model’s high-beef-price scenario with a bigger number plugged in, because both sides of the calf-price comparison have moved. The research shows that higher beef-calf values can extend the optimal breeding window under its assumptions. It doesn’t calculate the optimal window under today’s combination of beef-cross and Holstein bull prices.
| Scenario | Beef-cross calf | Holstein bull | Gross premium | Price ratio |
|---|---|---|---|---|
| 2026 JDS base | $570.00 | $385.00 | $185.00 | 1.48:1 |
| 2026 JDS high-price test | $940.00 | $385.00 | $555.00 | 2.44:1 |
| New Holland, Sept. 28 | $1,232.86 | $929.96 | $302.90 | 1.33:1 |
| New Holland, Oct. 5 | $1,255.02 | $994.91 | $260.11 | 1.26:1 |
Sources: Lauber et al. (2026), USDA AMS Report 1908 and Bullvine calculations. Model inputs and observed graded bull-calf prices represent different populations.
Conventional semen worked differently. Net return peaked at the 80-day window in every pregnancy-rate scenario: $1,423 a cow at 20%, $1,465 at 30% and $1,475 at 40%. The optimal window still ran from 80 days in high-pregnancy-rate herds to 170 days in low ones, and it lengthened as heifer survival fell. Replacements, not profit, pushed those low-pregnancy-rate herds past 80 days.
Two Sales at New Holland
USDA’s AMS Report 1908 prices New Holland calves per cwt by grade and weight band. Bullvine converted each band to dollars a head.
| New Holland | Beef-cross bulls | Holstein bulls | Premium | Ratio |
| Sept. 28, No. 1 | 85 hd, $1,232.86/hd | 136 hd, $929.96/hd | $302.90 | 1.33:1 |
| Oct. 5, No. 1 | 81 hd, $1,255.02/hd | 141 hd, $994.91/hd | $260.11 | 1.26:1 |
| Oct. 5, all grades | 84 hd, $1,234.01/hd | 156 hd, $947.50/hd | $286.51 | 1.30:1 |
Bullvine calculation from USDA AMS Report 1908, Sept. 28, 2026 and Oct. 5, 2026, New Holland, Pa.. For each band, $/cwt × average weight ÷ 100, then weighted by head count. “All grades” = No. 1–3 plus Utility, Jersey bulls excluded.
These are observed prices for graded bull calves, not a herd-wide average for every beef-cross calf born. The study’s calf values were model inputs. So this shows observed bull-calf prices above the tested range. It doesn’t show an entire herd’s average calf revenue would do the same.
The all-grades beef-cross average of $1,234.01 also clears $1,125. But 81 of its 84 head were No. 1, and 141 of the 156 Holsteins were too (our math). It’s mostly the same animals, so it says little about lower-grade calves. And it’s one Pennsylvania auction, not a national average.
The market moved in both directions:
- Sept. 28: feeder dairy bull calves sold $15.00–20.00 lower, and beef-cross calves $10.00–15.00 lower.
- Oct. 5: feeder dairy calves traded “$50.00 to $80.00 higher” .
Treat $260.11 as a recent observed benchmark from two sales, not a floor. Your calf mix, buyer, deductions and destination market can all put your own number below it.
A Smaller Ratio Doesn’t Settle the Profit Question
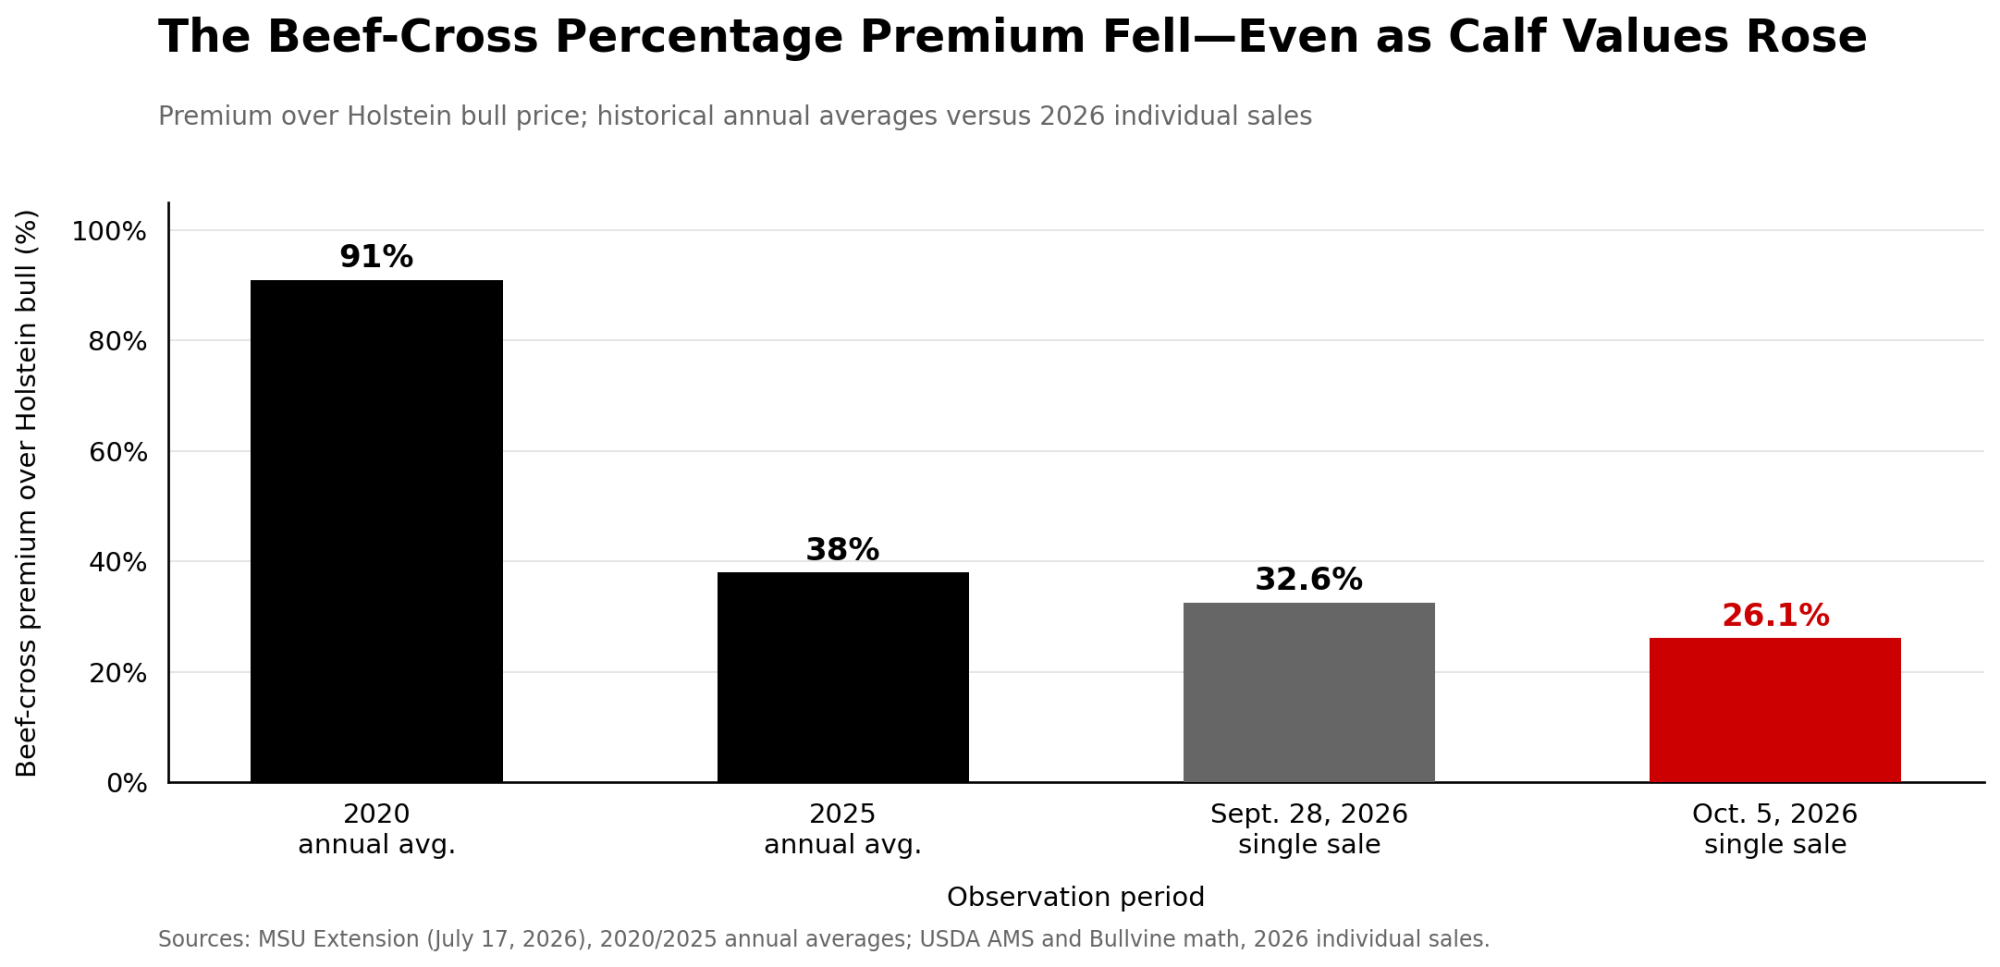
Two sales show a one-week move, from 1.33:1 to 1.26:1, not a trend. The longer record comes from Michigan State Extension. Jaime Luke and Jerad Jaborek analysed 67 months of quantity-weighted USDA prices, mid-2020 through 2025, from Kentucky and both New Holland sales (MSU Extension, July 17, 2026). For Pennsylvania No. 1 bulls, the beef-cross premium rose from $96.78 a head in 2020 to $341.32 in 2025. In percentage terms it fell from 91% to 38%. Oct. 5’s 26% sits below that 2025 average, though MSU’s figures are annual means and ours come from a single sale.
The two UW models start from very different calf prices:
- Lauber, 2026: a $570 beef-cross calf against a $385 dairy bull is 1.48:1, a $185 gap (our math). The model also valued a dairy heifer calf at $167.50.
- Cabrera, 2022 (JDS Communications): a $225 beef-cross calf against a $57.50 Holstein bull is 3.9:1, a $167.50 gap (our math) . That’s in line with his “~4 times” beef-to-dairy calf price. His baseline heifer calf was $45 .
New Holland’s 1.26–1.33 ratio is below both studies’ baselines. It isn’t below everything the 2026 model tried, though: its lowest test put the beef calf at $385, equal to the dairy bull, a 1.00:1 ratio (our math).
These are comparisons of market values, not a recalculation of either model’s profitability. Both simulations also account for dairy heifer calves and replacement supply. New Holland’s figures compare selected bull calves, so on their own they can’t establish the net return of either semen strategy.
What they do show is a gap that cuts both ways. New Holland’s ratio sits below both baselines, while its $260–$303 dollar premium sits above both models’ dollar gaps. Cabrera ties the economics to four things: the market value of beef-cross and dairy calves, semen prices, herd reproductive performance and semen strategy. His model also nets out semen costs and tracks the replacement balance.
Put plainly: a falling price ratio doesn’t mean beef breeding has stopped paying. And a bigger gross dollar premium doesn’t prove it’s still the most profitable choice.
Cabrera’s breakeven figures need the same care. With Holstein bulls at $110, his best protocol broke even at $100 per beef-cross calf for a ~20% pregnancy-rate herd and $69 for a ~30% herd. Those breakevens are on his income-from-calves-over-semen-costs measure, at his market and semen prices. They aren’t current breakeven calf prices, premiums or whole-farm profit thresholds.
The Missing Numbers on Your Own Farm
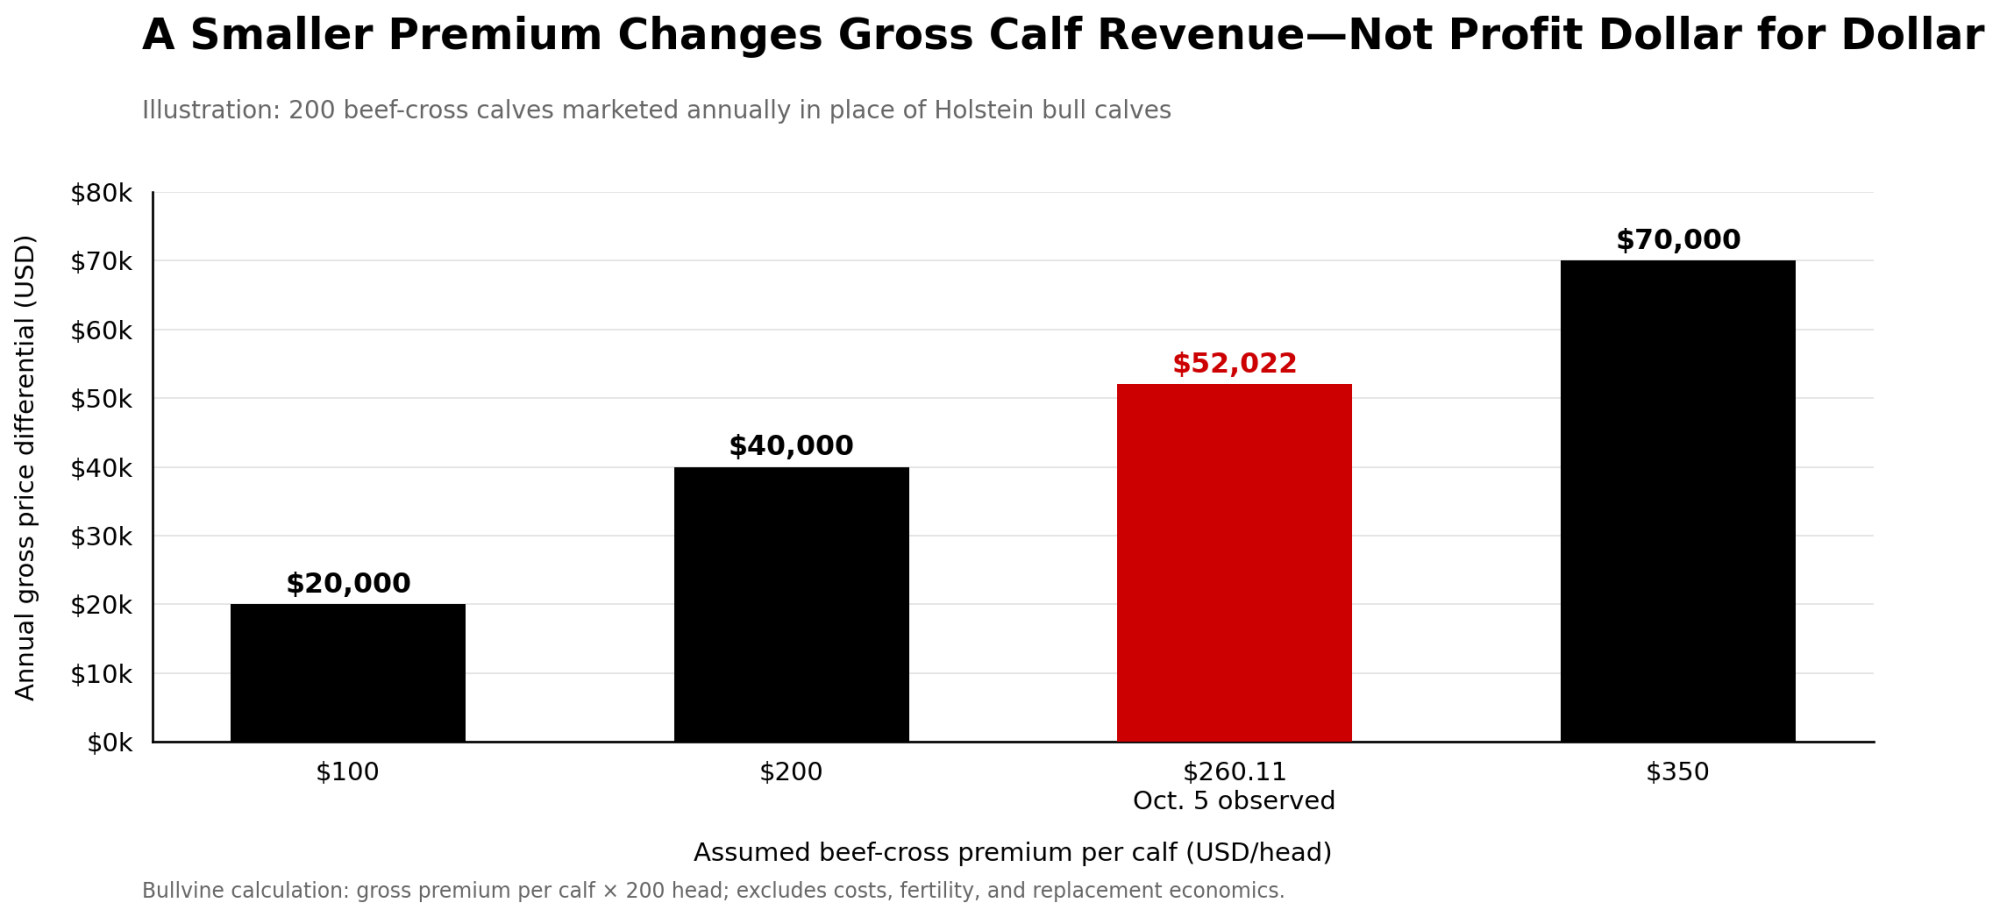
Bullvine calculation. The left column is the gross premium per calf over a Holstein bull.
| Gross premium per calf | 150 calves/yr | 200 calves/yr | 250 calves/yr |
| $100 (narrowed market) | $15,000 | $20,000 | $25,000 |
| $200 | $30,000 | $40,000 | $50,000 |
| $260.11 (Oct. 5 No. 1s, observed) | $39,017 | $52,022 | $65,028 |
| $350 | $52,500 | $70,000 | $87,500 |
Each column assumes a fixed number of comparable beef-cross calves marketed. It isn’t a prediction of how many beef-cross calves a given herd will produce. Swap in your own calf sheet.
These are gross market-value differences, before commission, trucking, calf care and contract deductions. They assume each beef-cross calf would otherwise have been a Holstein bull, which is roughly true only for cows you’d never breed for replacements. On 200 calves, a premium falling from $260.11 to $100 cuts the gross differential by $32,022 (our math). That isn’t a $32,022 profit loss, because this simple price math leaves out the farm’s other costs and returns.
The paper’s own figures are modelled net return, not gross calf value. A 170-day window was viable on replacements for both semen types. There, at a 20% pregnancy rate, sexed-plus-beef beat conventional by $51 per cow per year. Under unchanged model assumptions, that’s $15,300 for 300 cows or $25,500 for 500 (our math). It isn’t a guaranteed edge for every sexed-plus-beef herd. Don’t add it to the calf table either, because the model’s net return already counts calf revenue.
Replacements set the limit. In the 2026 model, sexed-plus-beef herds ran short of replacements when low pregnancy rates combined with poor heifer survival. Cabrera’s ~30% herd needed 33 dairy heifer calves a month and his ~15% herd needed 47. His best protocols left just 1 extra replacement a month at ~30% and 2 at ~20%. We priced what one short heifer costs in our CoBank breakdown.
The two models also differ on genetics. Cabrera tested a strategy that put sexed semen on the top 20% of cows by genetic merit. The 2026 model’s heifer survival rate excluded removals for genetic selection, and it didn’t use genetic selection to allocate semen.
Should You Breed That Open Cow Again?
The model produces optimal eligibility windows under defined assumptions. It can’t hand your next open cow an automatic stop-breeding date. The researchers concluded the optimum depends on pregnancy rate, semen type and heifer survival, “making it herd specific”.
Start with what the $260.11 actually is. It’s a price per calf, not a return per straw. The question for any service is marginal:
Marginal expected return = expected return with the service − expected return without it.
Both sides need the chance she conceives and holds the pregnancy, the calf’s value when it’s sold months from now, and semen and service costs. They also need what the pregnancy does to her milk, her culling date and your replacement supply. The model discounted calves 5.7% for stillbirths alone. If the choice is beef versus dairy semen, compare the expected returns of those two services instead. Choosing a semen type and deciding whether to breed at all are different decisions.
Then run each open cow through four tests:
- What’s the alternative, and what does it return? If you swap beef in for a dairy service, compare expected calf value under each semen type, conception rates, semen and service costs, and the replacement heifer you give up (here’s what that heifer costs per straw). If you add a beef service to a cow otherwise marked do-not-breed, you don’t directly give up a dairy-bred calf, but the pregnancy may change her culling date, herd turnover and replacement needs. Most herd plans blur the two.
- Does one more service pay? Run the marginal comparison above with your numbers, not the sale-barn average.
- Is she a good candidate? Weigh current production, parity, body condition, lameness, reproductive history and culling risk.
- Do you have the heifers? Use a forward replacement forecast (see the 30-day list below).
About the 30 kg rule: in the model, open cows past the window were marked do-not-breed and replaced once milk fell to 30 kg a day or less. That’s a culling assumption that applies after breeding stops. It isn’t a rule for when a commercial cow gets her last service, and it isn’t a validated culling threshold for every herd.
Start the herd-level math with Bullvine’s pregnancy-rate calculator and Cabrera’s free Premium Beef on Dairy tool at DairyMGT.info.
What to Check in the Next 30 Days
- Net calf price. Pull 12 months of beef-cross cheques, starting with the most recent four sales. Work out net per head after commission, trucking and calf care, by sire group, and compare it with your Holstein bull net.
- Re-run trigger. Whenever your net beef-cross differential narrows enough to change the marginal return on a late service, re-run the four tests. No study sets a universal premium cutoff, so set yours from your own budget.
- 24-month replacement forecast. Count heifers due to calve, expected replacement pregnancies and future heifer births from your current semen program. Account for age at first calving, stillbirths, heifer mortality, expected removals and purchased replacements.
- Pregnancy rate by parity. The model’s replacement shortfalls hit low-pregnancy-rate herds. A herd average near 29% can hide an older-cow group closer to 20%, the same trap we laid out in our beef-on-dairy pregnancy-rate breakdown.
- Buyer terms. Get premium schedules and deductions in writing before you change the breeding window.
A $1,255 beef-cross calf is a powerful incentive to keep looking for another pregnancy. But it isn’t a breeding plan. When a Holstein bull is worth nearly $995, the gap between another calf and another profitable decision gets a lot smaller. Before you extend the breeding window, work out what that next pregnancy is expected to earn and what it could cost your replacement program.
What did your beef-cross calves net per head after the trucker was paid, and how many heifers are you actually short?
Editor’s note: Our March coverage described the model’s optimal window as about 260 days in milk. The base-case optimum was a 200-day eligibility period after a 70-day waiting period, or 270 DIM. A 260-day period, or 330 DIM, became optimal only at modelled calf values of $940 and up.
Sources: USDA AMS Report 1908, New Holland, Pa., Sept. 28 and Oct. 5, 2026 · Lauber, Cabrera & Fricke, J. Dairy Sci. 109(1):452–468 (2026) · Cabrera, JDS Communications 3(2):147–151 (2022) · Luke & Jaborek, MSU Extension (July 17, 2026)
Learn More
- The 18% Trap: One Pregnancy Rate, Two Completely Different Diseases — Separate an 18% pregnancy rate into service rate and conception rate before changing your breeding strategy. This practical diagnostic exposes whether missed heats or failed pregnancies are draining returns—and where to spend first.
- 9.57 Million Cows, 3.9 Million Replacements: Genetics Built This Dairy Herd Paradox – and 2027 Ends It — Look beyond today’s calf cheque. With 9.57 million milking cows and just 3.9 million replacements, this analysis reveals why heifer shortages, cow longevity and processing expansion could reshape breeding economics through 2027 and beyond.
- Falling Semen Sales Aren’t Bad News – They’re Proof You Bred Better — Discover how genomics, sexed semen and mixed-sire beef straws are rewriting breeding decisions. With U.S. semen sales down 6% in 2025, the next advantage comes from smarter female selection, stronger fertility and fewer wasted services.
 The Sunday Read Dairy Professionals Don’t Skip.
Every week, thousands of producers, breeders, and industry insiders open Bullvine Weekly for genetics insights, market shifts, and profit strategies they won’t find anywhere else. One email. Five minutes. Smarter decisions all week.
