









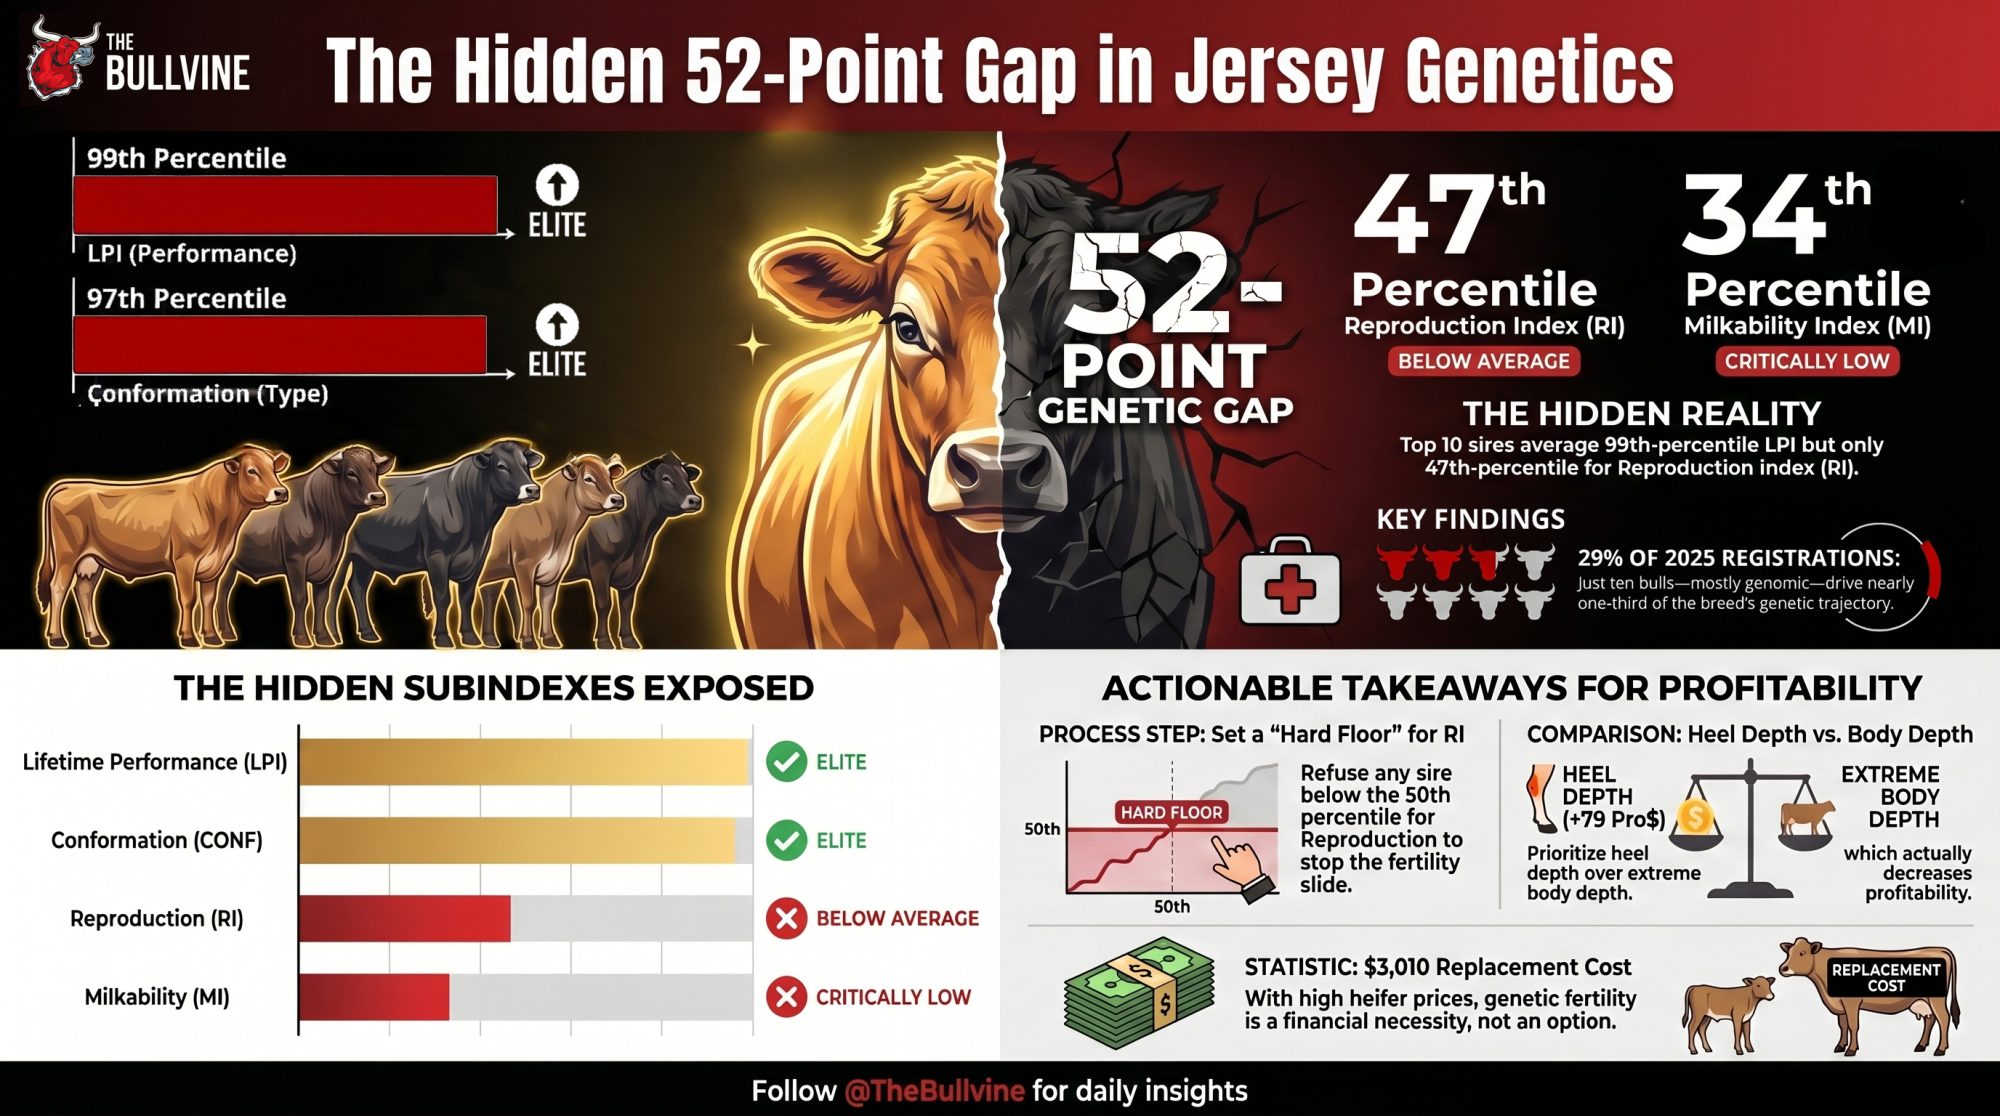
Canada’s top ten Jersey sires average 99th-percentile LPI and 47th-percentile Reproduction. That 52-point gap sired 29% of 2025 registrations — and never shows up on a single catalog page.
Jersey Canada’s record registration year produced a top ten sire group with elite LPI and conformation. Yet a look under the hood, and the Reproduction and Milkability subindexes tell a very different story for the future cows filling Canadian barns.
When I sat down in March 2026 with Jersey Canada’s 2025 registration data and Lactanet’s December 2025 genetic evaluations, I expected to see what the catalog pages were already shouting. Record registrations, up 9.74% over the previous high. Ten sires averaging Lifetime Performance Index (LPI) at the 99th percentile. Conformation at the 97th. Every bull A2A2. On paper, the Canadian Jerseys looked like they were winning on every front.
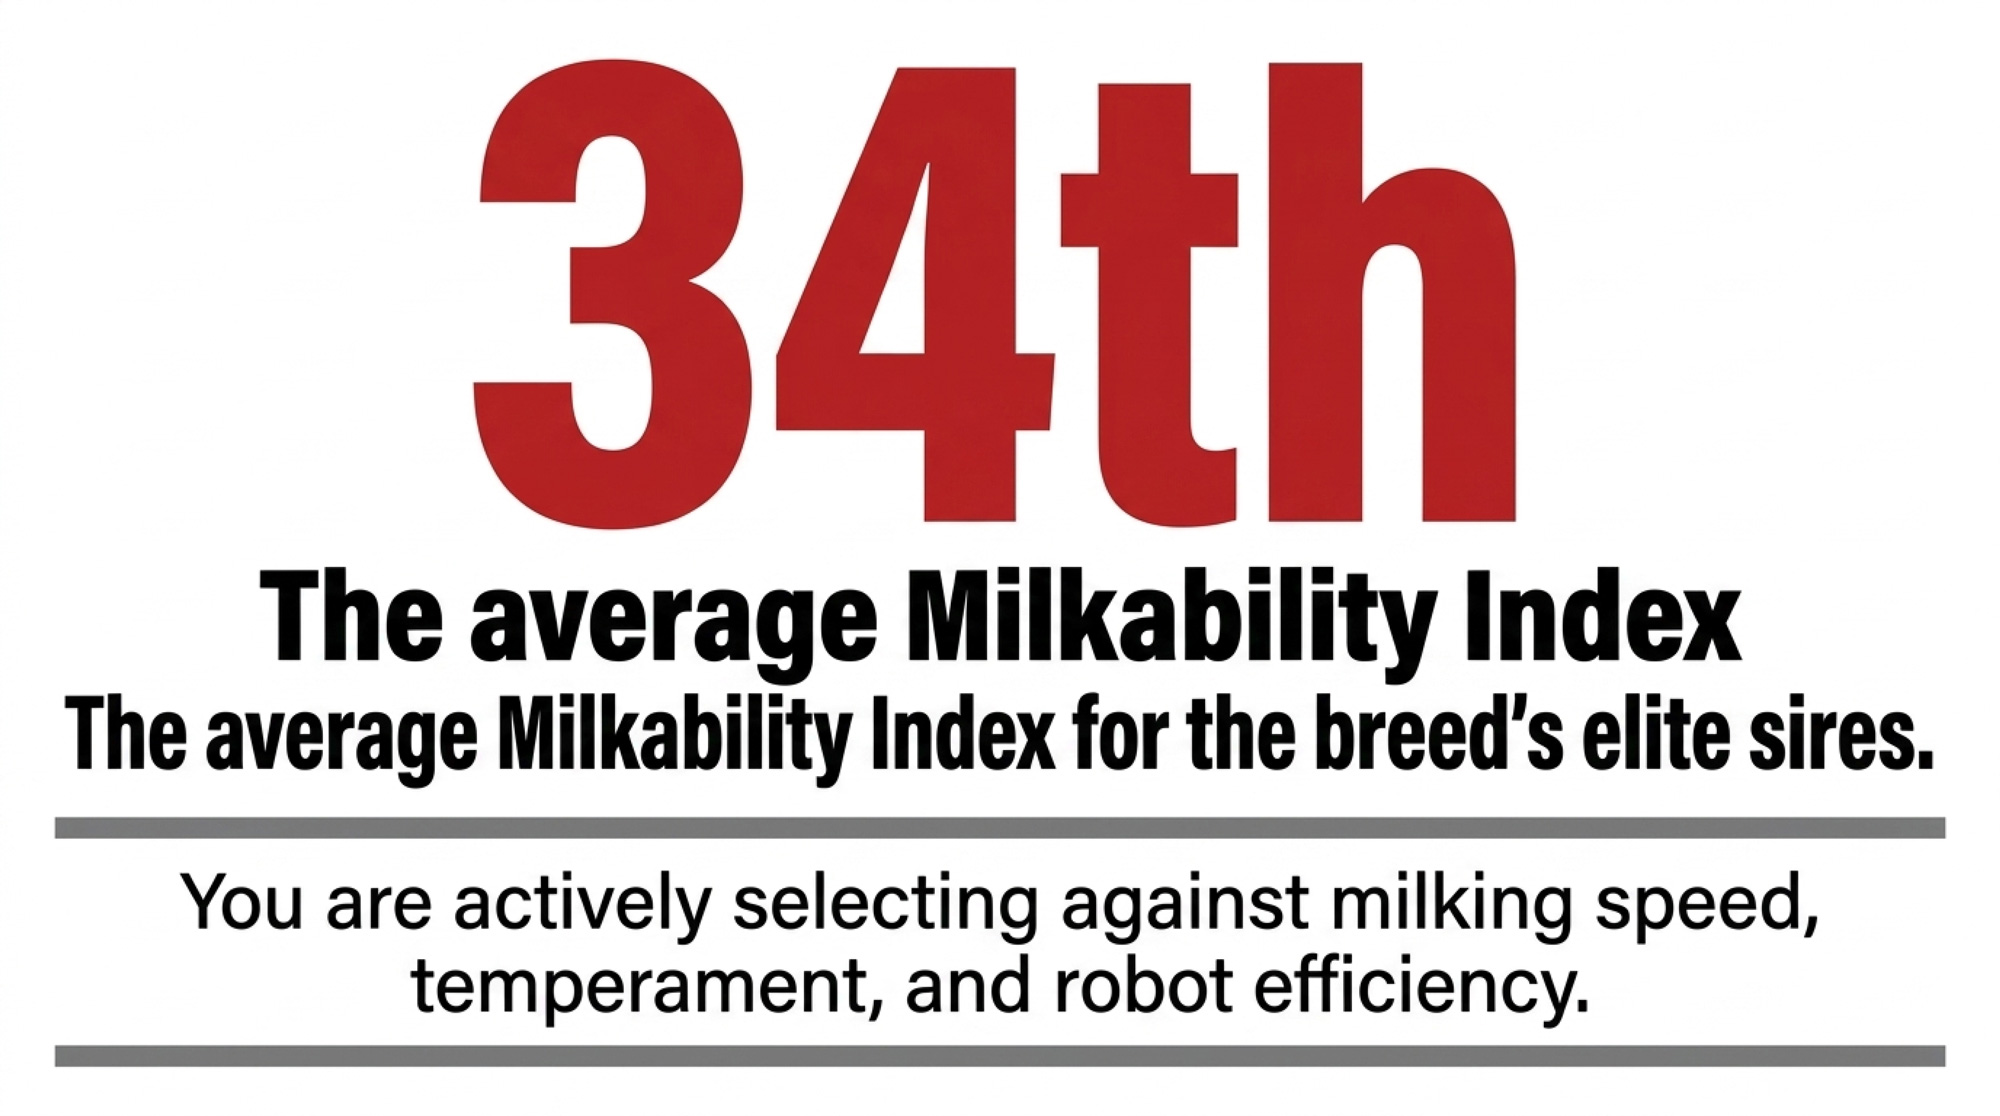
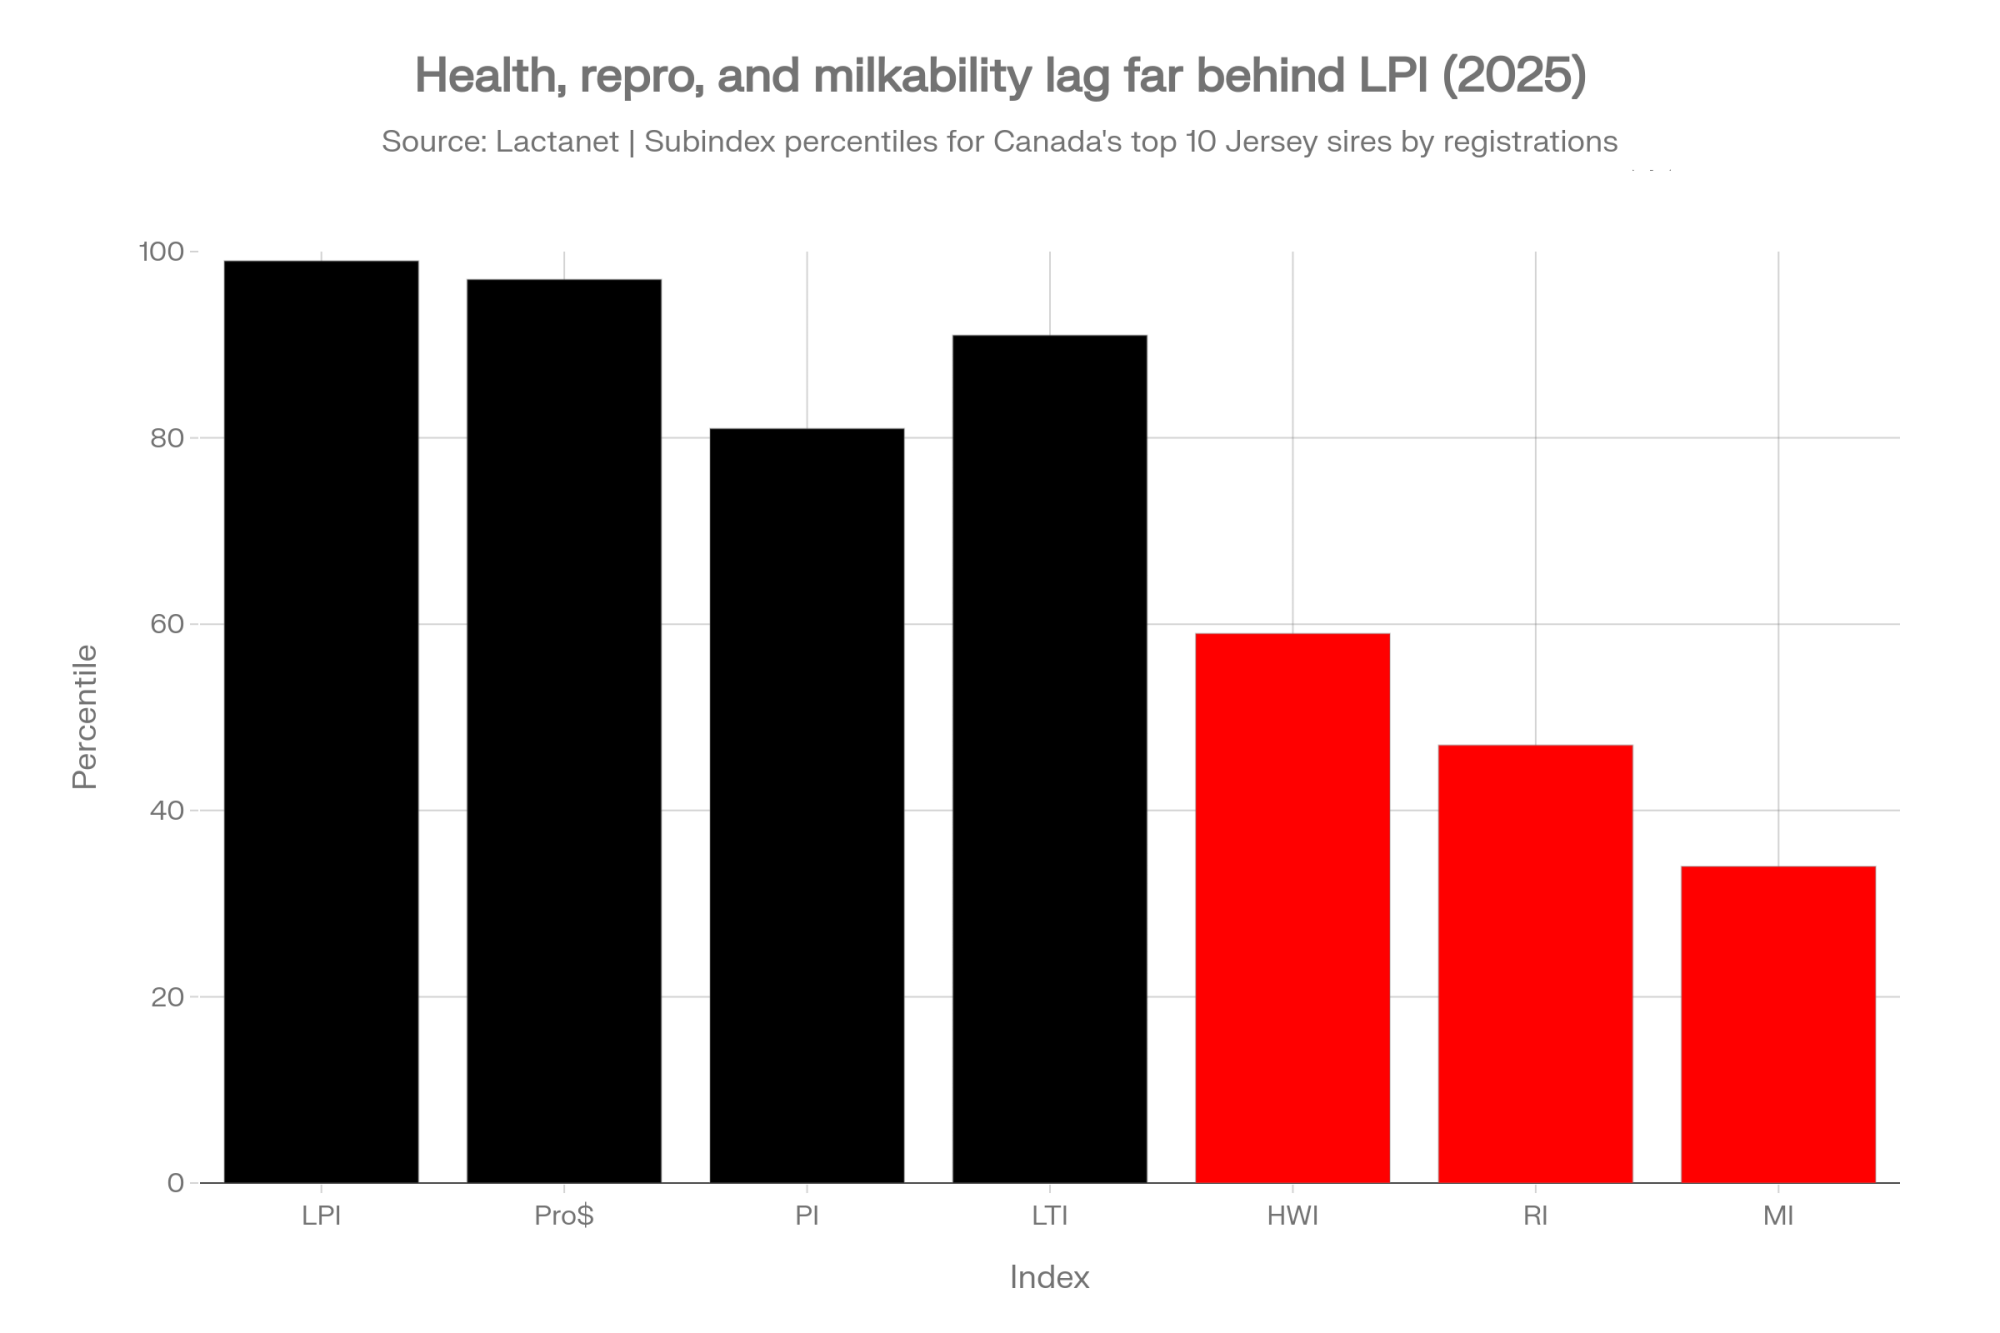
Then I pulled the LPI subindex profile on that same top ten group. The Reproduction Index (RI) across those bulls averaged the 47th percentile — below breed average. Five of ten fell below the median for fertility. The Milkability Index (MI), Lactanet’s subindex covering milking speed, temperament, and mammary milking traits, sat at the 34th percentile. And the Health & Welfare Index (HWI) — the one that captures Metabolic Disease Resistance, Mastitis Resistance, and Cystic Ovaries — averaged just the 59th percentile, with four bulls below the 50th.
Let me say this plainly: neither the breed associations nor the A.I. companies are publishing or promoting subindexes, and very little has been published on understanding or using them. After six decades of breeding cattle and working on dairy cattle improvement — including the original Dollar Difference Formula and Holstein Canada’s Type Classification overhaul in the 1980s — I’m still pushing the industry to look past the numbers it celebrates and toward the economically important ones it quietly ignores.
That’s not breeders failing to read the fine print. That’s a system that never printed it.
What Do Canada’s Top 10 Jersey Sires Actually Look Like Genetically?
Let’s start with which sires are actually driving the breed.
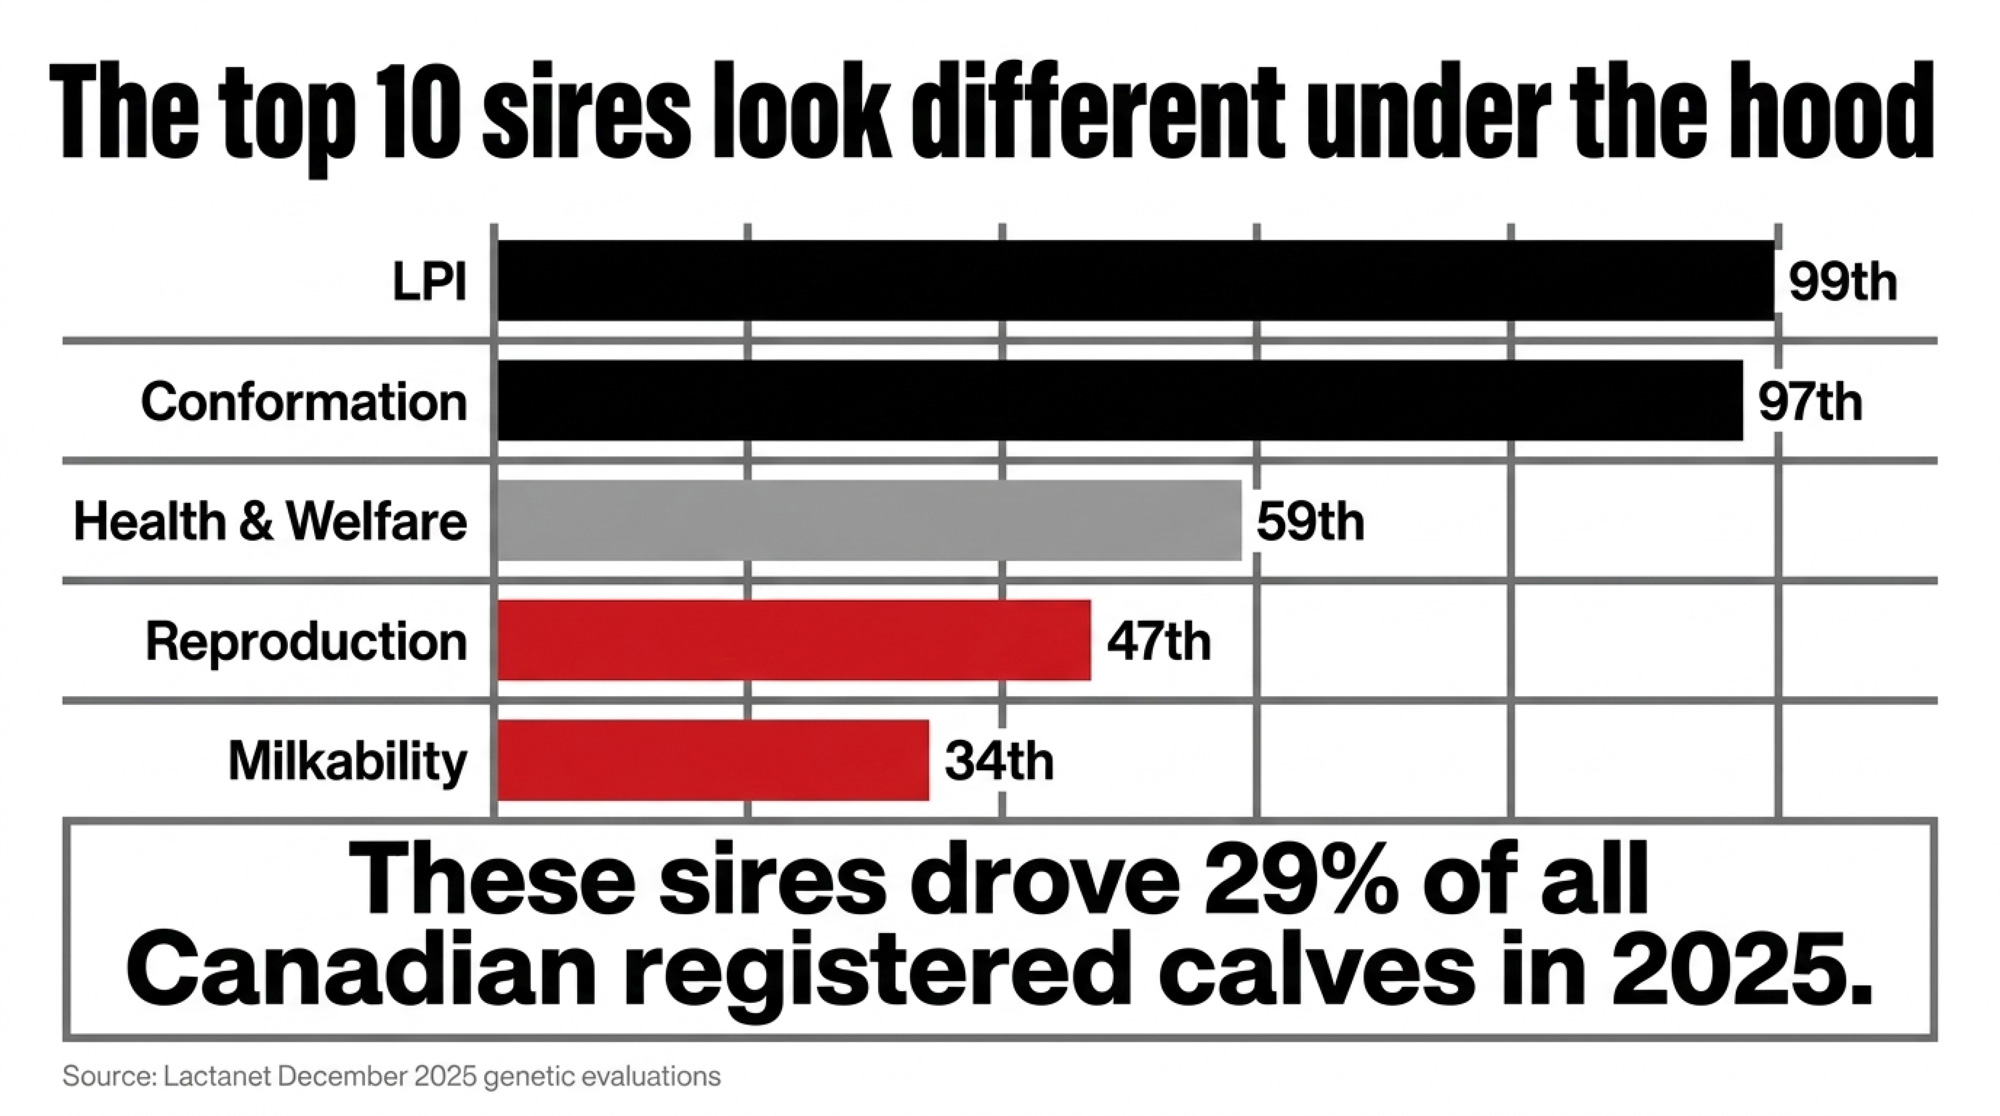
The ten bulls leading Jersey Canada’s 2025 registrations — ToBeFamous and Ghost tied at No. 1, followed by Victorious, Skyfall, Xenial, Artemis, Goldorak, Honeymoon, Cinnamon, and Tekashi — averaging 402 registered daughters each. Together, they sired 29% of all Jersey registrations in Canada that year. Eight of the ten were genomic sires when used, and those eight alone account for 81% of the group’s registered daughters.
When eight genomic bulls shape roughly one in four registered calves in a country, their genetic profile isn’t just interesting. It’s the trajectory of the breed.
Here’s how the Lactanet December 2025 evaluations stack up for that top ten:
| Index | Average | Percentile Rank | Range | Bulls Below 50th |
| LPI | 1,918 | 99th | 39th–99th | 1 of 10 |
| Pro$ | $1,542 | ~97th | — | — |
| Production Index (PI) | — | 81st | 56th–99th | 0 of 10 |
| Longevity & Type (LTI) | — | 91st | 21st–99th | 1 of 10 |
| Health & Welfare (HWI) | — | 59th | 17th–88th | 4 of 10 |
| Reproduction (RI) | — | 47th | 19th–84th | 5 of 10 |
| Milkability (MI) | — | 34th | 2nd–90th | 5 of 10 |
| Milk | 358 kgs | 50th | −121 to 1,071 | 6 of 10 |
| Fat | 49 kgs | 79th | 12–84 | 2 of 10 |
| Fat % | +0.37% | — | 0.07–0.83 | 0 of 10 |
| Protein | 25 kgs | 60th | 12–52 | 4 of 10 |
| Protein % | +0.16% | — | 0.07–0.31 | 0 of 10 |
| Conformation (CONF) | +11.4 | 97th | −2 to +18 | 1 of 10 |
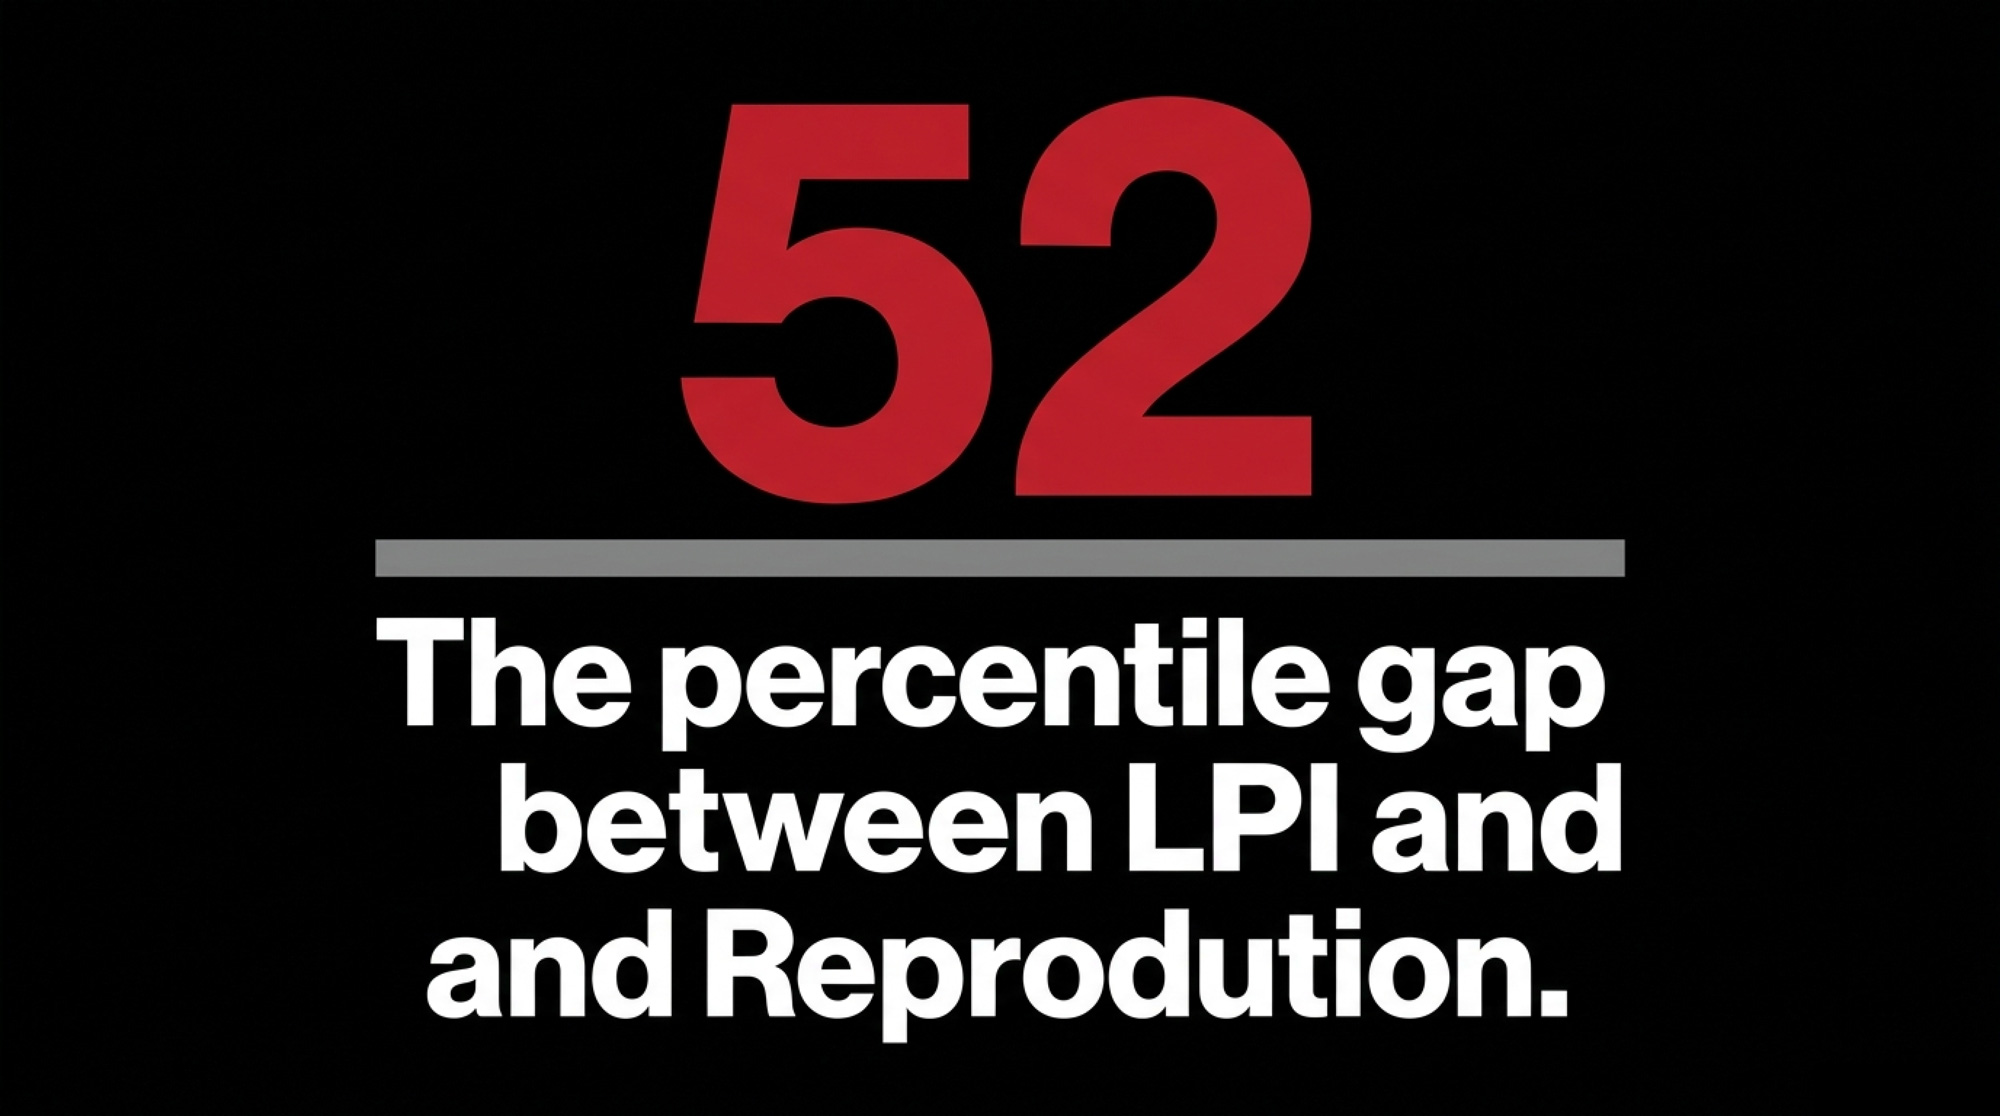
The gap between the 99th-percentile LPI and the 47th-percentile RI — 52 percentile points — might be the most revealing number in this dataset. It also never shows up on a sire card.
Why Don’t Breeders See the Fertility and Milkability Gap?
The short version: nothing in the current sire selection pipeline forces RI, HWI, or MI onto the table when you’re actually ordering semen.
Fat percentage is loud. When a bull adds +0.83%F — the high end of this top ten’s range — the economic reward shows up on every milk settlement. The A2A2 and BB casein story works the same way: processors put a premium on paper, breeders respond, and by 2025, the breed hit 100% A2A2 and 90% BB kappa-casein among its most-used sires. That’s the market signal doing exactly what it’s supposed to do.
Fertility costs are quiet. When a cow takes an extra cycle or two to settle, the penalty spreads across the vet bill, the semen line, the replacement purchase, and a longer calving interval that drags down lifetime milk and drives up lifetime days dry. None of those line items show up with a bold “this is what 47th-percentile RI genetics cost you this month” stamped on them.
Timed AI programs like Double-Ovsynch and Presynch-Ovsynch deepen the blind spot. They override a cow’s own biology, delivering conception rates that hide genetic fertility deficits. The protocol works — but it costs more to maintain with every percentile point of genetic fertility you give away. More shots. Tighter labour timing. More resynchronization cycles.
The Milkability Index gap tells its own story. MI combines milking speed, temperament, and milking-related mammary traits — exactly the traits that determine how quickly and smoothly cows move through a parlour or a robot box. A 34th-percentile MI average means the daughters of the breed’s most popular sires are, on balance, below average for the traits that drive milking efficiency and robot throughput. That’s real money in labour and robot capacity, especially as more Canadian herds adopt automated milking.
Fat Gains Up, Fertility Drifting: Five Years of Jersey Genetic Trends
Zoom out to the five-year trend for the top ten registration sires from 2020 to 2025, and the selection pattern comes into focus:
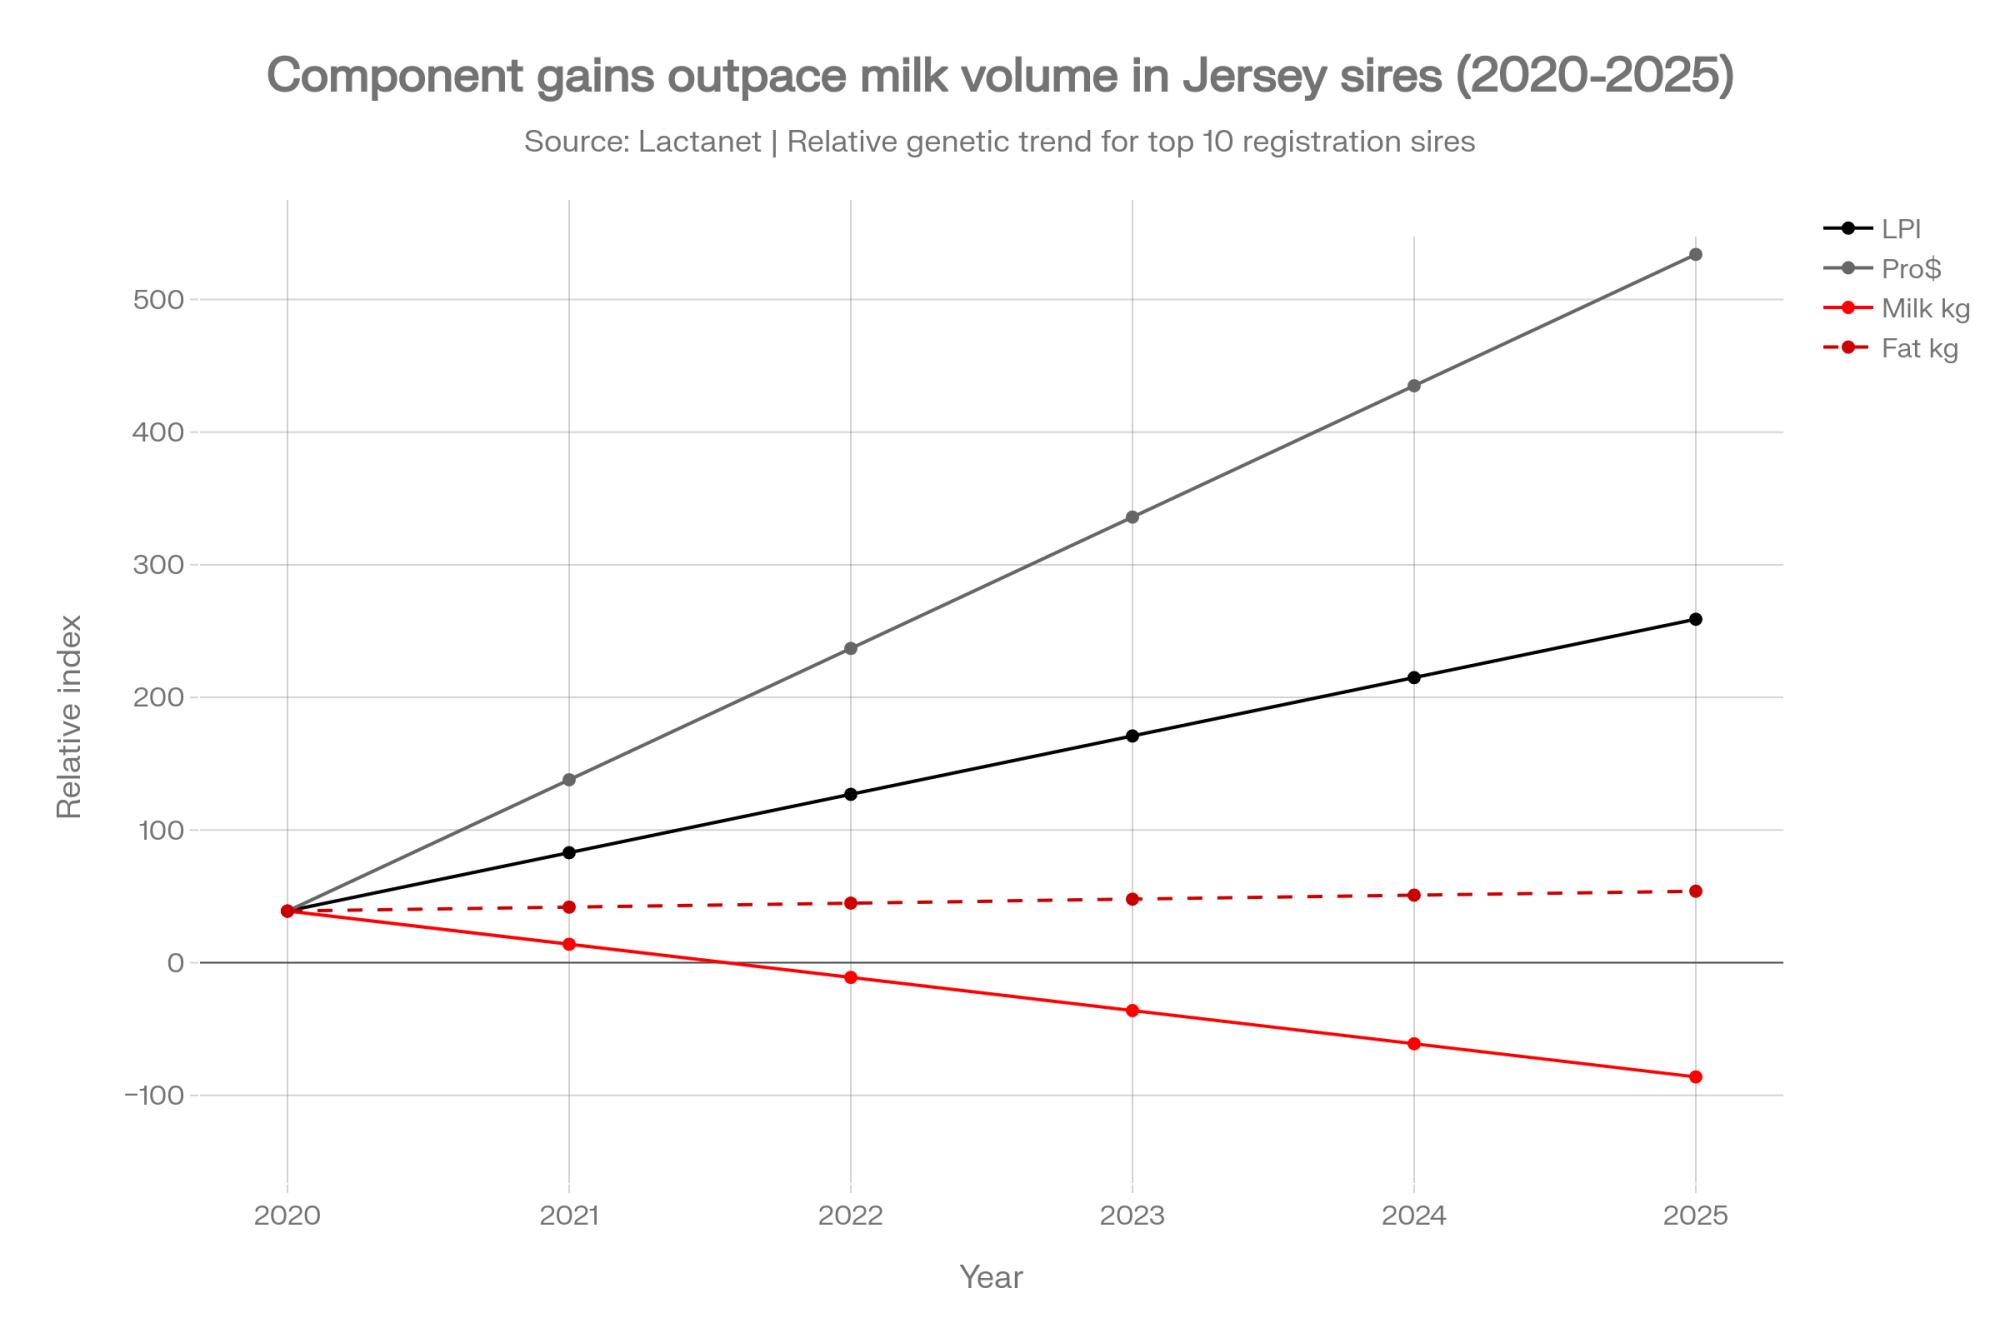
| Trait | Annual Gain (Top 10 Registration Sires, 2020–2025) |
| LPI | +44 points/year |
| Pro$ | +$99/year |
| Milk Volume | −25 kgs/year |
| Fat Yield | +3 kgs/year |
| Fat % | +0.05%/year |
| Protein Yield | +1 kg/year |
| Protein % | +0.03%/year |
| Conformation | +0.8/year |
| Mammary System | +0.8/year |
| Dairy Strength | +0.90/year |
| Feet & Legs | +0.75/year |
| Rump | +0.66/year |
| Inbreeding | −0.28%/year |
Milk volume is deliberately sliding while fat and protein percentages climb. That’s component pricing at work, and breeders are delivering exactly what processors reward.
What’s missing in that trend table are equivalent progress numbers for RI, HWI, or MI. The traits everyone tracks, publishes, and celebrates are the ones getting selected. The ones buried in PDF footnotes are drifting. The 47th-percentile RI average is a pretty good hint of which direction.
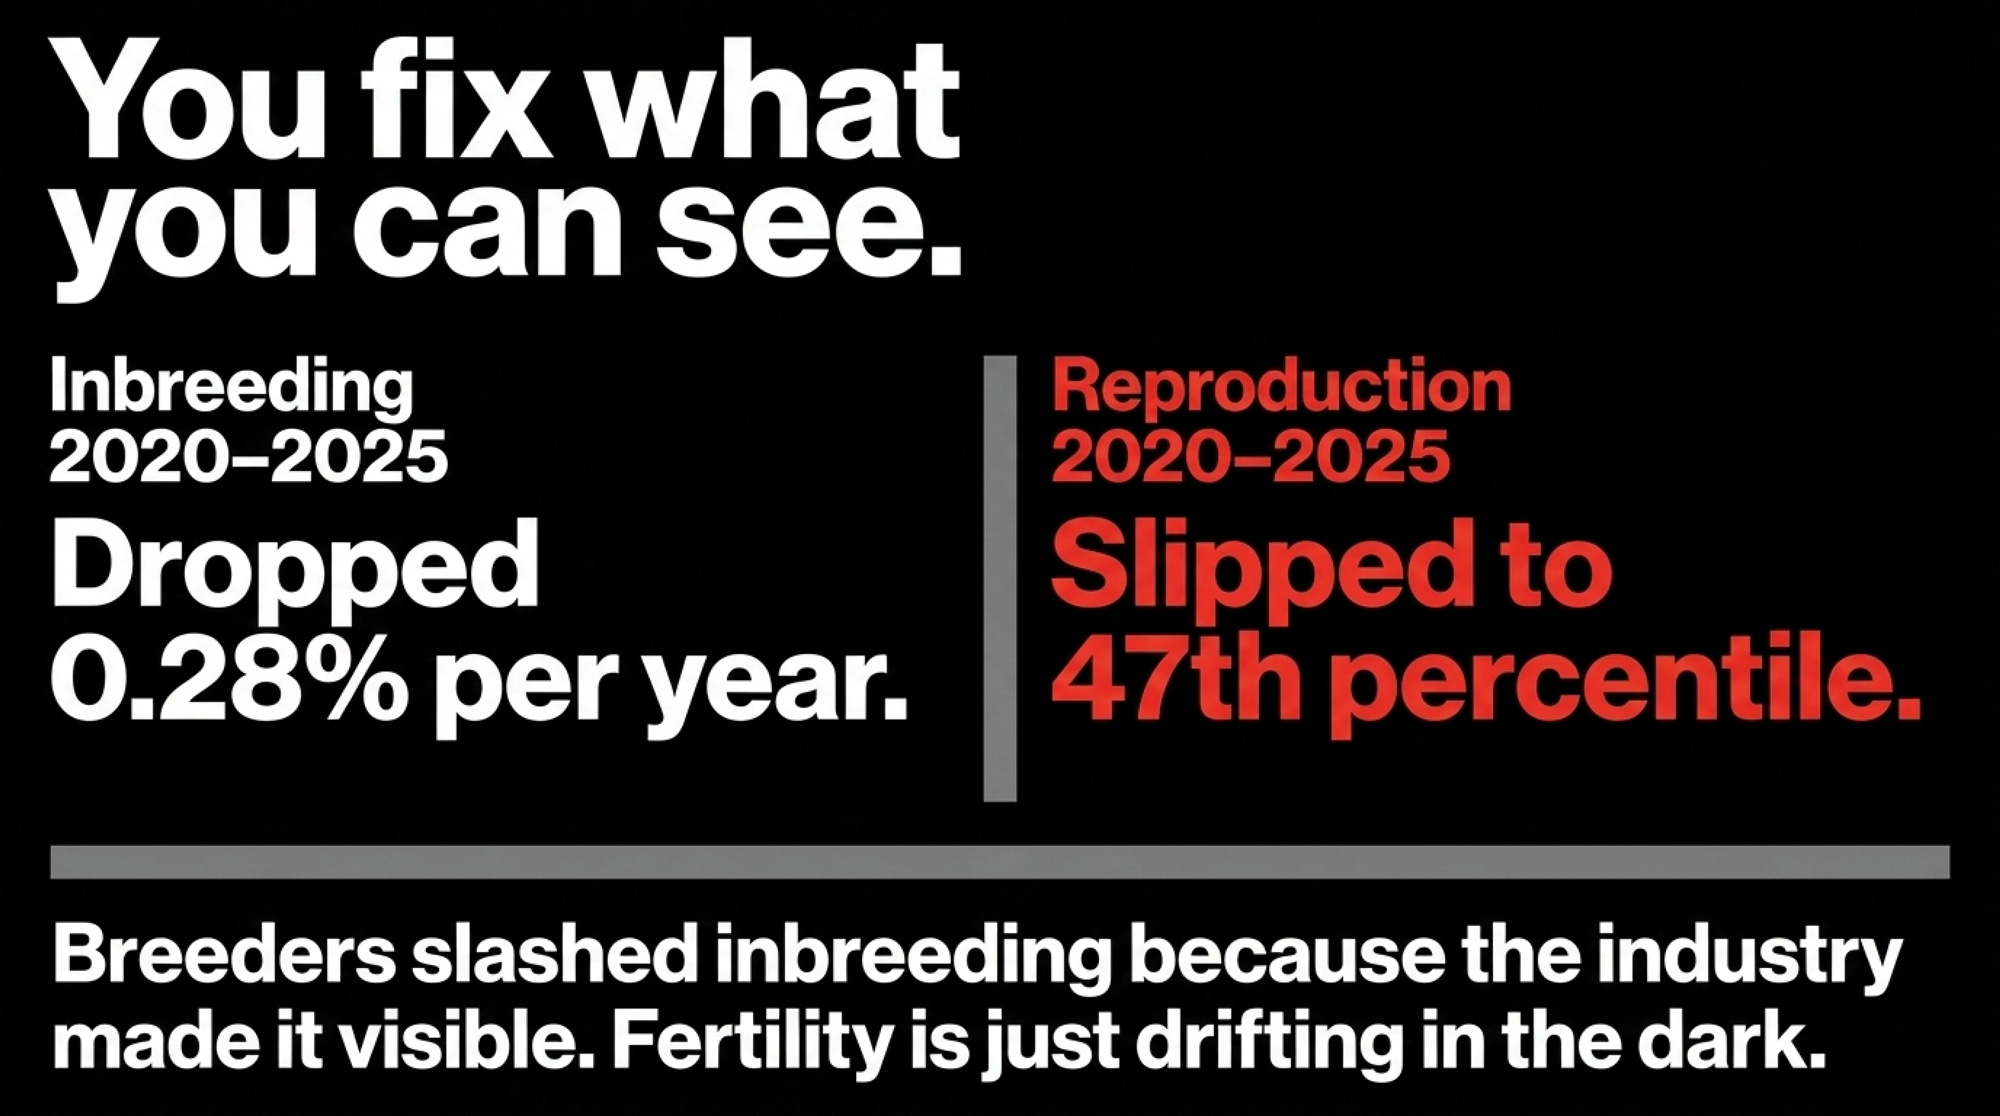
On the positive side, the inbreeding story is exactly what you’d hope to see. The average for the top ten drops from 9.77% in 2020 to 8.10% in 2025 — a reduction of 0.28% per year, with seven of ten bulls sitting under 9.0%. That proves something important: Canadian Jersey breeders can manage a trait that isn’t on the milk cheque when the industry makes it visible and gives them tools. It’s fair to ask why the same thing hasn’t happened for reproduction, health, and milkability yet.
The Barn Math Behind 47th-Percentile Fertility
Here’s where you can feel it in your own numbers.
A 200-cow Jersey herd turning over 35% annually needs about 70 replacement heifers a year. That’s just barn math: 200 × 0.35 = 70.
On the cost side, U.S. dairy replacement prices hit about $3,010 per head in July 2025, up 164% from the 2019 bottom of around $1,140, with top heifers bringing $4,000 or more in some auction barns. In Ontario, replacement heifers over 900 lbs were selling around $326–$328 per hundredweight at recent auctions — not the same absolute price, but the direction of travel is similar.
Now layer in genetics. If below-average RI bulls add even one extra service per conception across your dairy-bred matings, that’s more semen, more time open, and more risk that cows fall out of the dairy pipeline and into beef because they didn’t settle. It’s not just a $30–$50 sexed semen straw that didn’t stick. It’s a heifer that never existed, and a cow that probably gets bred to beef because everyone’s tired of missing her.
My read of the Production Index adds another twist. The PI averages the 81st percentile across the top ten — good, but notably lower than the LPI at the 99th and the LTI at the 91st.. In other words, the composite LPI for these bulls is being carried more by longevity and type than by yield. That raises a fair question: how much of that 1,918-point LPI reflects real lifetime profitability, and how much is the formula letting strong CONF and LTI paper override weak RI and MI?
Does 97th-Percentile Conformation Actually Drive Jersey Profitability?
On paper, this top ten group is a type breeder’s dream. The average conformation score sits at +11.4 — the 97th percentile — with a range from −2 to +18. Mammary system averages +8.9. Feet and legs average +8.5. Those are big numbers.
The real question is what those numbers actually buy you.
Canadian work from Agriculture and Agri-Food Canada on longevity found that udder depth and milking ease accounted for 84% of the total contribution of type traits to functional longevity, and that rear teat placement, udder depth, and udder texture had a significant influence on functional survival. Cows with tight, well-attached udders stayed in the herd longer.
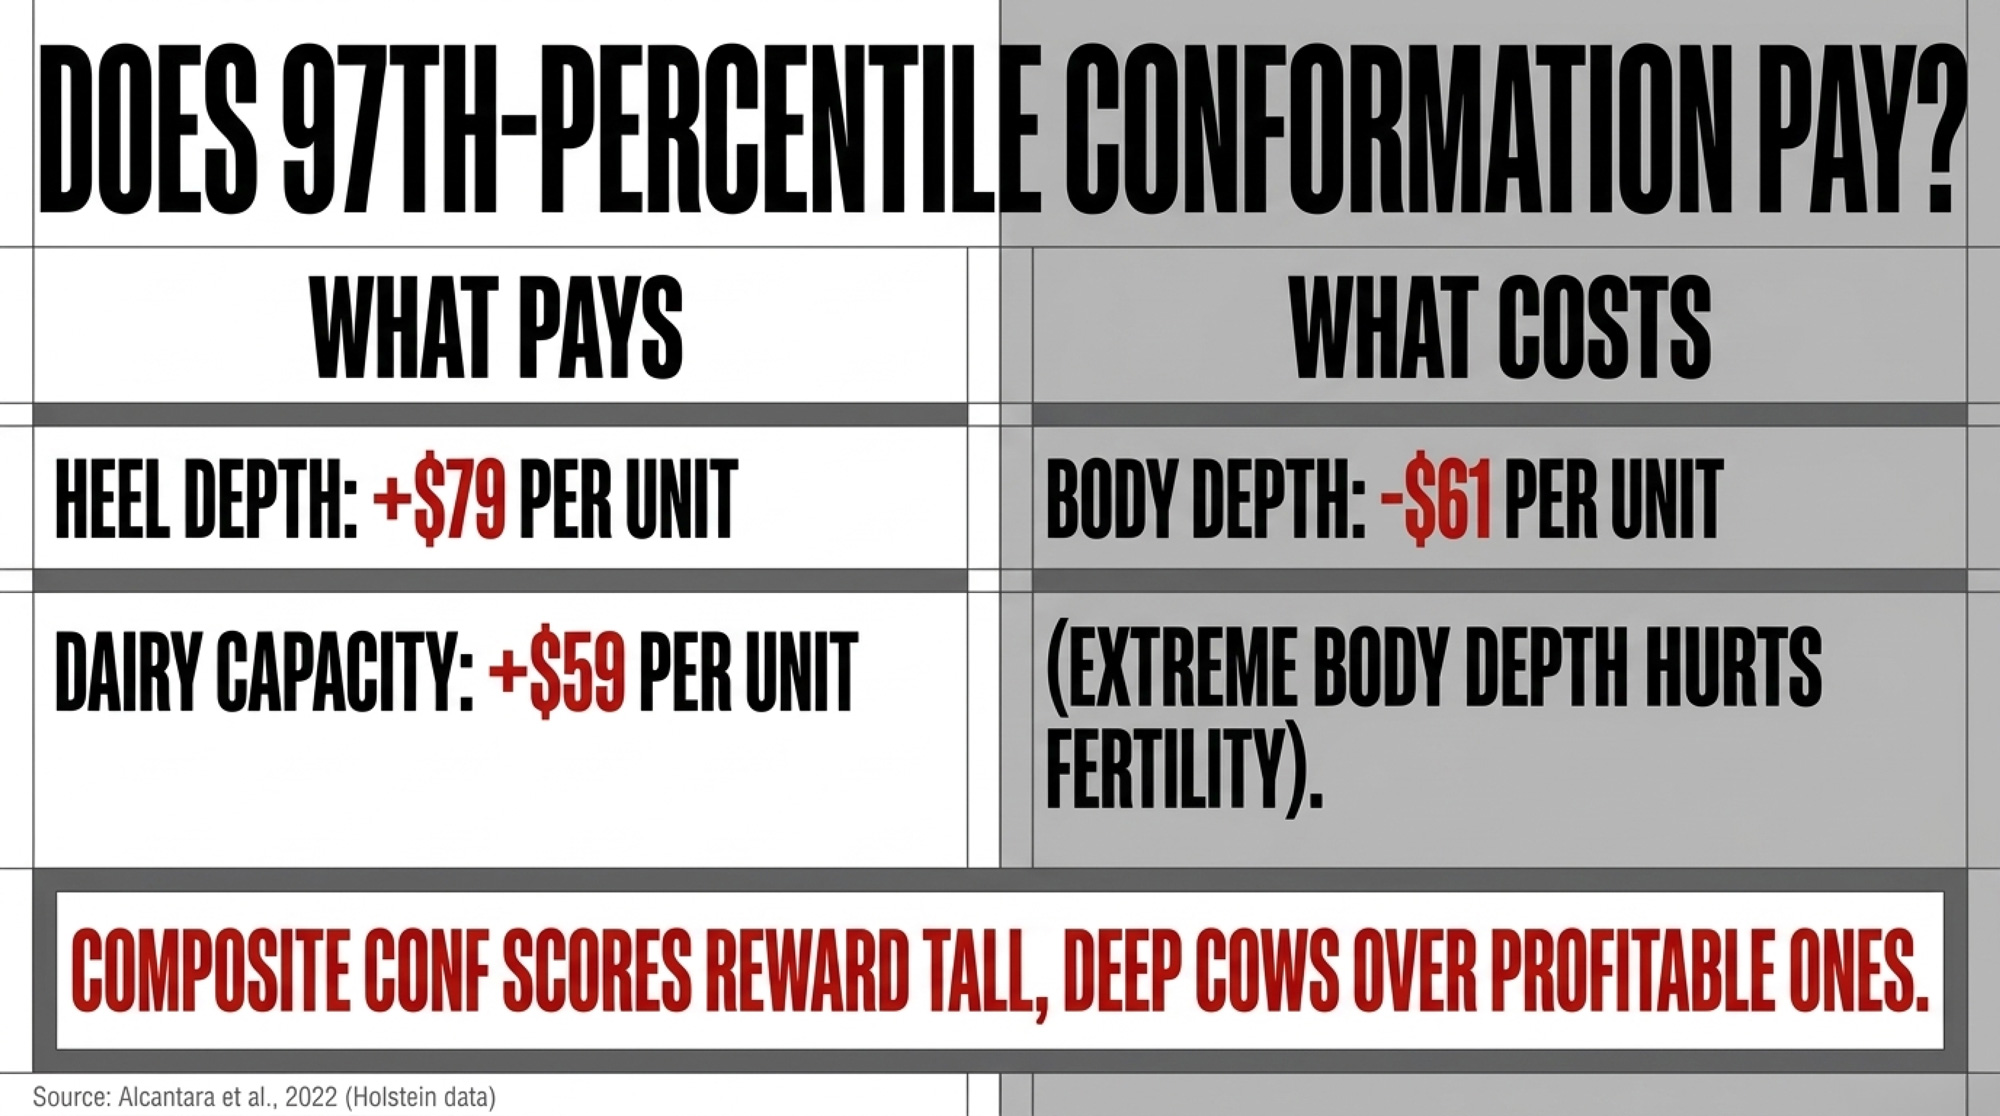
Alcantara, Baes, de Oliveira Junior, and Schenkel (2022), in the Canadian Journal of Animal Science, put hard-dollar values on the type traits involved. Analyzing 9,351 proven Holstein bulls, they found heel depth had the strongest positive effect on Pro$ of any conformation trait, at +$79.13 per unit RBV increase.
In plain terms: heel depth pays you; extreme body depth costs you.
That same paper showed dairy capacity (especially body length) was also positive, at +$59.00 per unit RBV. More capacious, angular cows tended to stay productive longer. But body depth told the other side of the story: it had the largest negative effect on Pro$ at –$61.95 per unit RBV because deeper-bodied cows ate more, tended to lose condition more quickly after calving, and showed poorer fertility in later lactations.
The problem is that composite CONF rewards all of it. Stature, angularity, body capacity, and dairy character are assigned the same number as functional mammary and feet-and-legs traits. So, a bull could rank in the 97th percentile for CONF largely on height and style, while another sits in the 72nd percentile with rock-solid udders and feet. The composite score doesn’t tell you which one actually puts more money in your pocket over five lactations. And neither does the catalog page.
What Would a Balanced Jersey Sire Stack Look Like in 2026?
The 2025 data doesn’t say you need to blow up your sire list and start over. It says you need an index floor when selecting sires. And you need it on traits and subindexes where no one has put one to date.
- Set a hard RI minimum at the 50th percentile for every bull in your stack. That’s not aggressive — it just means refusing to use sires whose daughters carry below-average fertility genetics. Apply this filter to the current top ten, and five of the ten drop out immediately. If you actually want to improve fertility, not just stop the slide, aim for RI in the 65th percentile or better. This month, pull the Lactanet subindex breakdown for every sire in your current mating plan. If any bull sits below the 50th-percentile for RI, flag him for replacement or for use only on your most fertile cows.
- Give HWI a seat at the table. The top ten average just the 59th percentile for the Health & Welfare Index, with four bulls below the median. HWI is where Metabolic Disease Resistance, Mastitis Resistance, and Cystic Ovaries live in the modernized LPI. A 55th percentile floor keeps you from actively weakening your health genetics; 65th and up start building a real health advantage into your replacements.
- Use MI as a robot and labour filter. With a 34th-percentile average, MI is the weakest subindex for this top ten group. Suppose you’re milking with robots — or thinking about it — milking speed, temperament, and teat placement matter just as much as litres. Even in a parlour, slow or difficult milkers chew up labour. Set your own MI floor at the 45th percentile, so you’re not selecting against milkability. In a robot environment, you might want a higher percentile.
- Cap CONF expectations and target the right pieces. Instead of chasing 97th-percentile CONF across your whole stack, think in a 65th–80th percentile window and focus on mammary and feet-and-legs sub-scores. The Alcantara et al. work backs this up: heel depth and dairy capacity drive Pro$, while body depth drags it down. Select accordingly.
- Use high-LPI/low-RI sires as specialty tools, not blanket-herd bulls. A bull sitting at 99th-percentile LPI with poor subindex scores might still earn a place, on the 15–20% of cows with outstanding fertility and health backgrounds where you can safely chase an outcross, special pedigree, or type shot. He shouldn’t be breeding 80% of the herd.
- Before your fall semen order (90-day action), write a simple sire selection protocol. One page. Minimum RI and HWI percentiles. Plus a desired MI floor. Target range for CONF with mammary and feet/legs priorities. Share it with your AI rep and your genetic advisor. If they can’t work within it, that’s a data point too.
- By spring 2027 (365-day action), pull services-per-conception data by sire group from your own herd records. That’s where you’ll see RI genetics and timed AI protocols separate. A bull who looks fine on paper but needs 3.2 services per conception in your barn is telling you something your sire catalog won’t.
What This Means for Your Operation
You don’t have to be running a big registered show string for this to matter. If you’re milking Jerseys and buying semen in Canada, you’re already living with the top ten bulls’ subindex profile. The only question is whether you’re steering it or just going along for the ride.
- Run the subindex numbers on your current sire stack. Pull RI, HWI, and MI for every active bull you’re using. Calculate the weighted averages across your stack. If RI or HWI sits below the 50th percentile, you’ve quantified your genetic risk for fertility and health.
- Decide what you’re actually willing to tolerate. A 47th-percentile RI average is what you get if you follow the registration leaderboard without asking questions. The minute you set a hard floor — even just at the 50th — you’re back in control.
- Look at your conformation priorities through an economic lens. How much of your type selection pressure is going into the mammary system and feet/legs, and how much is chasing body depth and stature that the research says doesn’t pay? Adjust your eye accordingly.
- If you’re running robots, treat MI as a non-negotiable. A 34th-percentile MI stack is basically selecting against robot efficiency. Put a line in the sand. Then ask yourself how many of your current sires clear it.
- Double-check your replacement economics. On your own numbers, what does it cost to buy a bred Jersey heifer, with profit potential, right now? What’s your actual replacement rate? How much room do you have to play with fertility genetics before you start buying more herd replacements than you’d like?
- Ask your AI rep better questions. Before you talk pedigrees or price, start with: “What are the RI, HWI, and MI percentiles on your top five Jersey sires for my herd?” If the answers come quickly — with printed subindex charts — you’re dealing with someone who’s reading the full proof sheet. If not, you’ve learned something about whose problems are being solved by that catalog page.
Key Takeaways
- If half of the ten most-used Jersey sires in Canada sit below breed average for reproduction, the problem isn’t that breeders don’t care about fertility — it’s that the system never put RI, HWI, and MI on equal footing with LPI and CONF. I’ve been making that argument in one form or another for years: the numbers the industry promotes are the numbers that get selected. The numbers it buries get ignored.
- The A2A2 success story proves breeders respond fast when the signal is clear. Processors put a premium on paper; within a few proof runs, the top ten registration bulls went 100% A2A2 and 90% BB. There’s no reason the same can’t happen for RI and MI once those numbers get the same font size in sire marketing and herd discussions.
- The inbreeding trajectory shows it can be done. Dropping from 9.77% to 8.10% in five years didn’t happen by accident. It happened because inbreeding became visible and manageable. RI, HWI, and MI are sitting where inbreeding was a decade ago — important, but underused.
- The Milkability Index might be the quietest and most expensive number on the page for robot herds. A 34th-percentile MI stack means you’re effectively selecting against milking speed and temperament in a system where every extra minute per cow at the robot is lost throughput. That’s not a small leak.
- If you can write your sire selection protocol on one page — with hard subindex floors and a clear role for each bull — you’re ahead of most of the industry. The herds that do that over the next five years will be the ones with the replacements, the robot-friendly udders, and the health genetics that give them room to experiment elsewhere.

Five years from now, the real test of whether this analysis mattered won’t be on a Bullvine page. It’ll be in your own Lactanet login when you pull up your 2030 sire stack and see where your RI, HWI, and MI averages landed. Pull that same screen up tonight. What’s your average RI percentile — and are you honestly okay living with that number for the next five years?
Learn More
- The Profit Index Paradox: Choosing Dollars Over Rankings — Arms you with the $869-per-cow lifetime profit gap data needed to override generic sire rankings. Rebuild your selection filter to prioritize Net Merit over LPI and stop leaving thousands on the table.
- The Triple Cushion Trap: Why 2025’s Strong Margins Won’t Save You in 2026 — Dismantles the false security of 2025’s high margins by exposing the looming replacement heifer shortage. Prepares your operation for 2026 by mapping out critical moves for beef-on-dairy revenue and herd right-sizing.
- Did Genomics Really Deliver What We Think It Did? $238,000 Says Yes – If You Steer It Right — Reveals how to capture the $238,000 genomic advantage by utilizing often-ignored subindexes like Milkability and Health. Breaks down the new LPI weighting to ensure your high-index daughters actually fit modern automated milking systems.
Complete references and supporting documentation are available upon request by contacting the editorial team at editor@thebullvine.com.
 The Sunday Read Dairy Professionals Don’t Skip.
 The Sunday Read Dairy Professionals Don’t Skip.
Every week, thousands of producers, breeders, and industry insiders open Bullvine Weekly for genetics insights, market shifts, and profit strategies they won’t find anywhere else. One email. Five minutes. Smarter decisions all week.





