


 When genetic evaluations for Productive Life (PL) were introduced by USDA’s Animal Improvement Programs Laboratory in 1994, U.S. dairy producers were handed an extraordinary opportunity to produce healthier cows. The good news is, it actually happened; when Predicted Transmitting Abilities (PTA) for Productive Life were incorporated into selection programs, the deterioration occurring in pregnancy rate for five decades (16 percentage points1) was soon reversed. In addition, genetic increases that were occurring in somatic cell score (SCS) that were revealed when PTA for SCS was initiated also were reversed and udder health improved as well. Now another genetic evaluation will be provided in August 2016 so producers will have a new tool to help even more. The new evaluation is PTA for Cow Livability (PTA C.LIV) which predicts cow’s transmitting ability to remain alive while in the milking herd. In contrast, PTA for Productive Life (PL) predicts transmitting ability for how long a cow is expected to remain in the milking herd before dying or being culled. Livability is just one of the several traits that determines Productive Life, yet one with a high economic influence that to date had not been accounted for adequately.
Populating US dairy herds with cows capable of longer productive life gave producers more opportunity for voluntary culling as they needed to dispose of fewer animals for health or management reasons. When a cow is sold for dairy or beef (voluntary or involuntary culling), the sale income is returned to the owner. In contrast, if a cow dies, or is euthanized as a consequence of ‘downer cow syndrome’, there is total loss of income. Just knowing which cows are likely to remain in the herd the longest is not the entire story. Instead, additional benefit comes from knowing which cows are likely to provide income at disposal. Because cow mortality rate averages 7% each lactation, death claims 20% of the U.S. cows while in the milking herd2. Conversely, 80% of cows remain alive permitting the producer to recoup their disposal income when they exit the herd. The lost ‘disposal income’ from current U.S. cows that will die is about $2.2 billion (20% × 9.2 U.S. million cows x $1200/cow) or $800 million per year.
Fortunately, in spite of the fact the heritability of mortality is low at 1.3%3, accuracy of PTA for Cow Livability is quite high as termination codes have been recorded in DHIA for decades. Over 92 million lactation records for 32 million cows have termination codes in the national database. As a result, genomic predictions having high accuracy can be derived for AI bulls for the new trait. Even the Reliability for young genomic tested bulls without daughters averaged 56%. Correlations between PTA for Cow Livability and PTAs for other traits have been calculated and vary considerably. For bulls having Reliability of 80% or higher, the correlation was 0.70 with Productive Life, 0.45 with Daughter Pregnancy Rate, but was rather low with the milk traits.
Cow Livability is defined such that if the cow died this lactation, the trait was set to 0%; if the cow lived through this lactation, it was set to 100%. To place it on a lifetime scale, the results are multiplied by 2.8 since average lactations per cow is 2.8. The table below show the average PTAs of animals that fall into the quintiles for Lifetime Net Merit $.
Table 1. Average PTAs of AI Holstein bulls with birthdates since January 1, 2000 for a number of traits* grouped by percentiles for Lifetime Net Merit Dollars (NM$).
| Percentile | NM$ | PTAMilk | PTAFat | PTAProt | PTADPR | PTASCS | PTAPL | PTAC.LIV |
| 80 to 99 | +588 | +1043 | +52 | +38 | +1.3 | 2.2 | +5.6 | +2.1 |
| 60 to 79 | +423 | +944 | +34 | +30 | +.9 | 2.2 | +3.8 | +1.4 |
| 40 to 59 | +310 | +612 | +25 | +22 | +.4 | 2.2 | +2.6 | +.9 |
| 20 to 39 | +197 | +432 | +18 | +16 | 0 | 2.3 | +1.4 | +.2 |
| 0 to 19 | -53 | -164 | -2 | -2 | -.8 | 2.4 | -.8 | -1.1 |
*PTA=Predicted Transmitting Ability, Prot=Protein, DPR=Daughter Pregnancy Rate, SCS=Somatic Cell Score, PL=Productive Life, C.LIV=Cow Livability
The top quintile of bulls for Net Merit Dollars had PTAC.LIV that averaged +2.1% while the bulls in the lowest quintile averaged -1.1%. This indicates the top quintile bulls will have about 3.2% more daughters that will not die during their milking life than will the lowest quintile bulls. Because the average of cow remaining alive throughout their entire milking life is 80%, a bull that is +2.1 is expected to have 82.1% of his daughters that remain alive while a bull from the lowest quintile is expected to average 78.9% (breed average of 80.0 – 1.1 = 78.9% that remain alive). This 3.2% difference in a 244 cow herd (the average DHIA herd size) would produce $9,400 in additional income.
Eventually the PTA for Cow Livability will be incorporated into all 4 lifetime merit indexes, but this will be completed after users become more familiar with the new trait. When this happens, the weight given to Productive Life is expected to decline from about 19 to 14%, and the emphasis assigned to Cow Livability will be near 7%. Thus, the total emphasis of cow longevity would increase to 21%.
Having Cow Livability is one more step toward adding value to the genetic information that will improve dairy producers’ profitability. Producers participating in DHIA can help to improve the reliability of this trait by accurately reporting the reasons why cows leave their herds.
Duane Norman works for the Council on Dairy Cattle Breeding; Janice Wright and Paul VanRaden are employees of USDA’s Animal Genomics and Improvement Laboratory.
1 Council of Dairy Cattle Breeding. 2016. Trend in Daughter Pregnancy Rate for Holstein or Red & White Calculated April 2016. Accessed June 1, 2016. https://www.cdcb.us/eval/summary/trend.cfm
2 Norman, H.D., L. M. Walton, and João Dürr. Reasons that cows in Dairy Herd Improvement programs exit the milking herd (2014). CDCD Res. Rpt. (16-02). 2016. (Popular Publication)
3 Miller, R.H., M.T. Kuhn, H.D. Norman, and J.R. Wright. Death losses for lactating cows in herds enrolled in Dairy Herd Improvement test plans. J. Dairy Sci. 91(9):3710-3715. 2008.


![Eurogenomics[1]](https://www.thebullvine.com/wp-content/uploads/2016/05/Eurogenomics1.png) Seven key players have formed a co-operative aimed at exchanging genomic data in the Holstein breed as well as improving genomic evaluation techniques. The seven organizations are Viking Genetics from Scandinavia, Evolution and Origin Plus from France, CRV from the Netherlands, CONAFE from Spain and MCB Krasne and the Polish Federation of Cattle Breeders and Dairy Farmers. The newly formed co-operative EuroGenomic will use reference population that consists of over 33,000 genotyped bulls and will be looking for new ways to improve the effectiveness of bovine breeding. The EuroGenoimcs Co-operative will also provide genomic test results on AI bulls over 10 months of age that are owned by third parties.
Seven key players have formed a co-operative aimed at exchanging genomic data in the Holstein breed as well as improving genomic evaluation techniques. The seven organizations are Viking Genetics from Scandinavia, Evolution and Origin Plus from France, CRV from the Netherlands, CONAFE from Spain and MCB Krasne and the Polish Federation of Cattle Breeders and Dairy Farmers. The newly formed co-operative EuroGenomic will use reference population that consists of over 33,000 genotyped bulls and will be looking for new ways to improve the effectiveness of bovine breeding. The EuroGenoimcs Co-operative will also provide genomic test results on AI bulls over 10 months of age that are owned by third parties.
 Some believe genomics is the be-all and end-all of the opportunity for genetic improvement. In reality, genomics is a by-product of solid traditional genetic evaluation systems and would not work without them as input. For this reason, Canadian Dairy Network (CDN) is continually improving both genomic AND traditional genetic evaluations to provide you with the most accurate overall genetic information possible for each animal. Read about some recent changes that have been made, as well as about some exciting things to come on the horizon.
![clarifideplus_1200x834[1]](https://www.thebullvine.com/wp-content/uploads/2016/03/clarifideplus_1200x8341-600x417.png)
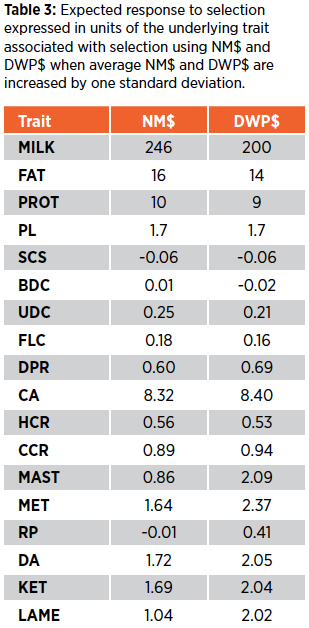 The economic indexes in CLARIFIDE Plus were derived using standard selection index theory. Economic assumptions were derived from those used in NM$ for the case of core traits, and from a review of peer-reviewed literature for wellness traits. Economic values for health traits that are considered in the derivation of NM$ were removed to avoid double-counting of the contributions of disease to dairy profitability. Economic values were then adjusted within the range of reported values based on the covariance among traits to achieve the final index weights.
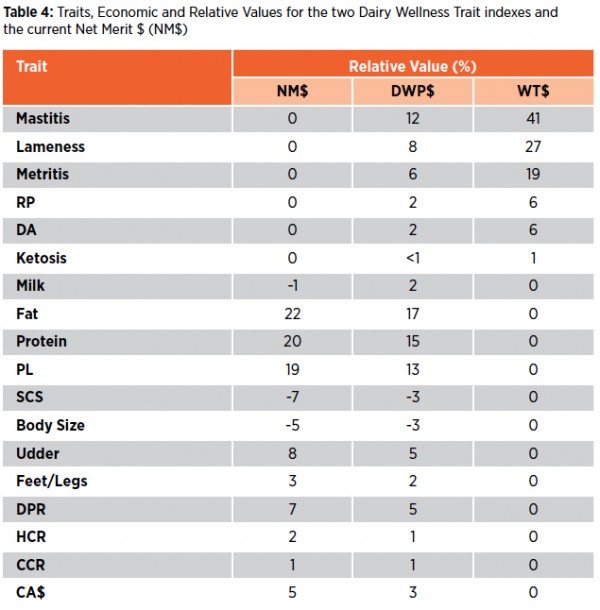
 The Irish Cattle Breeding Federation (ICBF) has appointed Weatherbys Ireland DNA Laboratory working in conjunction with Eurofins Genomics to test one million cattle samples over the next 2 years.
![image001[1]](https://www.thebullvine.com/wp-content/uploads/2015/11/image0011.png) The Council on Dairy Cattle Breeding (CDCB) is now accepting applications for non-voting, advisory members of the CDCB Board of Directors who are able to provide meaningful insight, guidance and perspective to the Board’s work within dairy industry and fulfill usual board member responsibilities regarding attendance and participation.
The Council on Dairy Cattle Breeding (CDCB) is now accepting applications for non-voting, advisory members of the CDCB Board of Directors who are able to provide meaningful insight, guidance and perspective to the Board’s work within dairy industry and fulfill usual board member responsibilities regarding attendance and participation.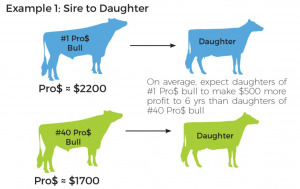 Pro$ for Sires
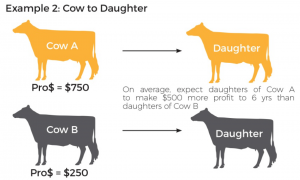 Pro$ for Females
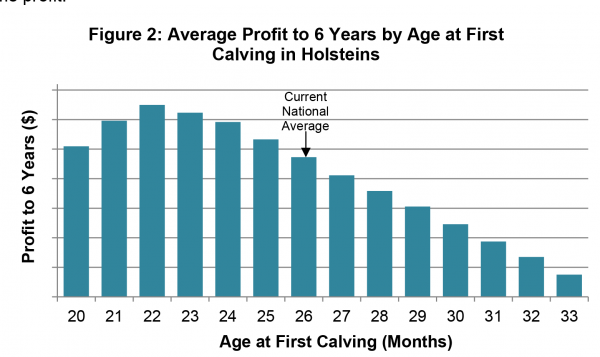
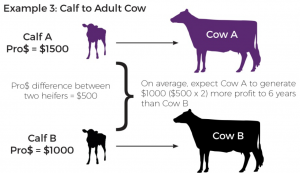 A second way to use Pro$ values for females is to compare them for heifers born within the same months or year. In this context, the goal is to identify heifers that are expected to be more profitable over their lifetime to six years of age. When comparing Pro$ values for heifers, the differences in Pro$ values need to be doubled to reflect the expected differences in realized accumulated profit to six years. For example, a heifer that has a Pro$ value that is $500 higher than another one is expected to accumulate, on average, $1000 more profit over its lifetime up to six years of age (Example 3).

 There is a new #1 PFT sire in Italy and it’s Heidenskipster Selleck with a +3537 gPFT. He is a Cashcoin son out of the Heidenskipster Silver’s, going back on the American brood cow, Morningview Converse Judy. He is followed by KNS Brasilero a Balisto son from the Epic daughter KNS Reality. The former #1 gPFT bull Holbra Doorman Rodanas will be find on the 4th place currently.
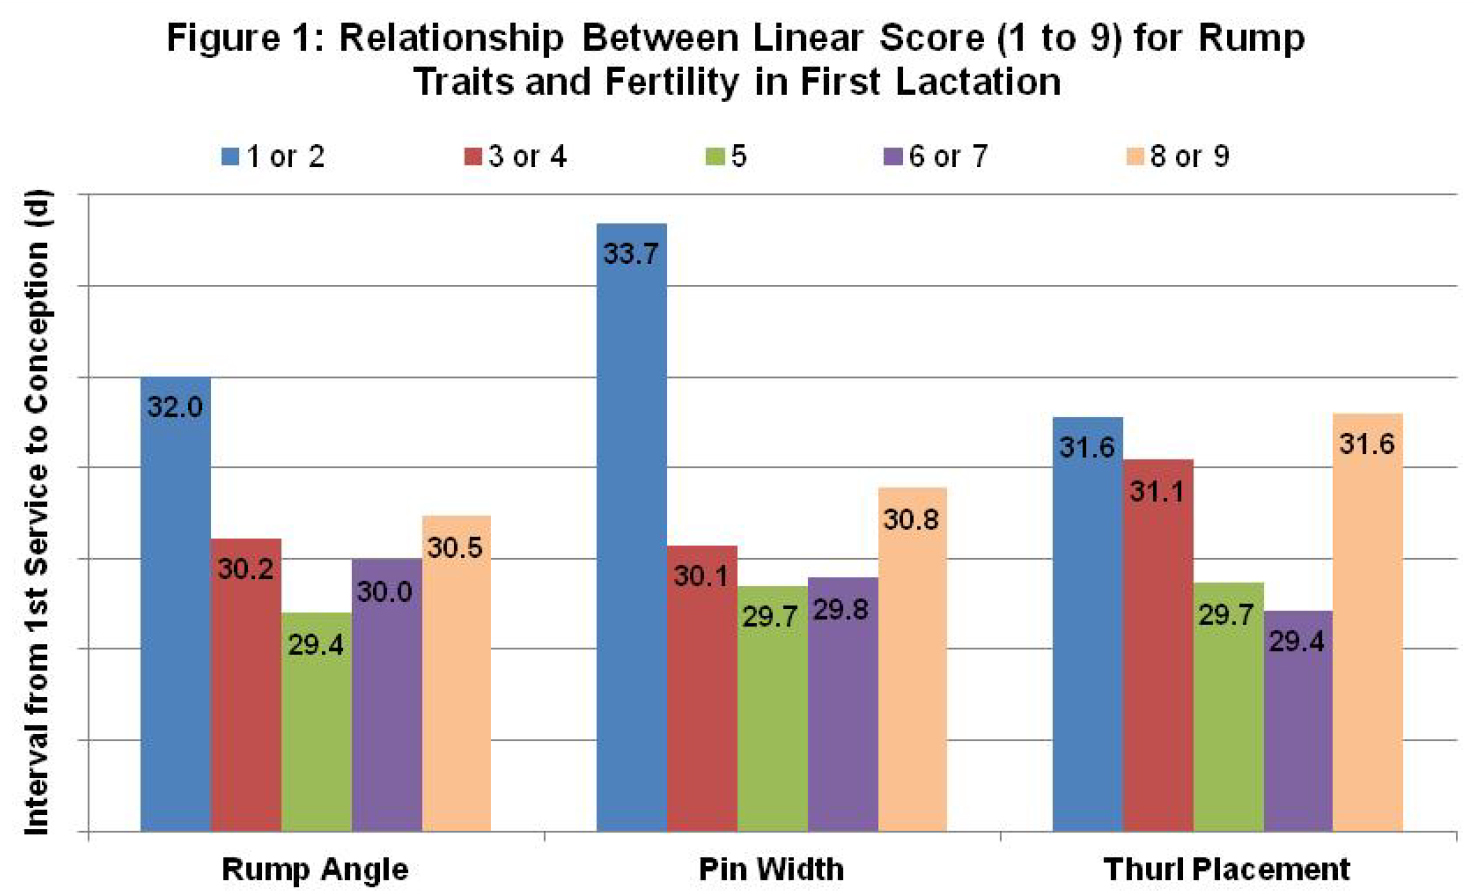
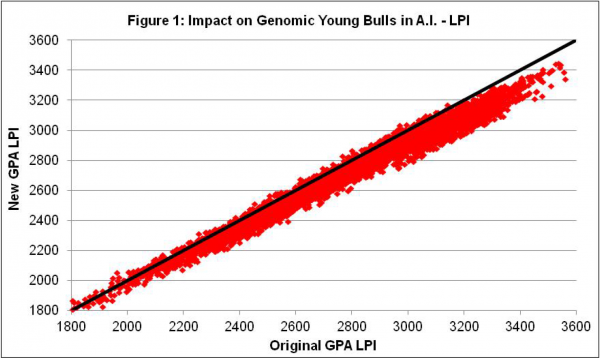
![CDN-Graph1-Figure1[1]](https://www.thebullvine.com/wp-content/uploads/2015/06/CDN-Graph1-Figure11-600x486.png)
![CDN-Table1[1]](https://www.thebullvine.com/wp-content/uploads/2015/06/CDN-Table11-600x345.png)


![CDE-photo-300x191[1]](https://www.thebullvine.com/wp-content/uploads/2015/04/CDE-photo-300x1911-300x191.jpg)
 Welcome – Jeff Butler -Butlerview
 Joao Durr – CEO of the Council on Dairy Cattle Breeding – Update on U.S. Genetic Evaluations: What’s to come?
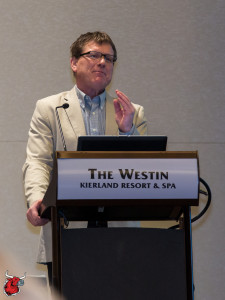 Brian Van Doormal – GM Canadian Dairy Network – Profitable Genetics in Canada: What are your priorities?
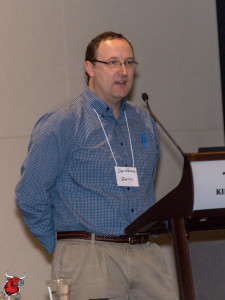 Dr. Dan Weigel, Zoetis – Genomics and the Commercial Dairyman
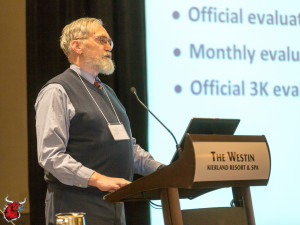 Dr George Wiggans – Research Leader, AIPL/ARS/USDA – Genomics and Where it Can Take Us
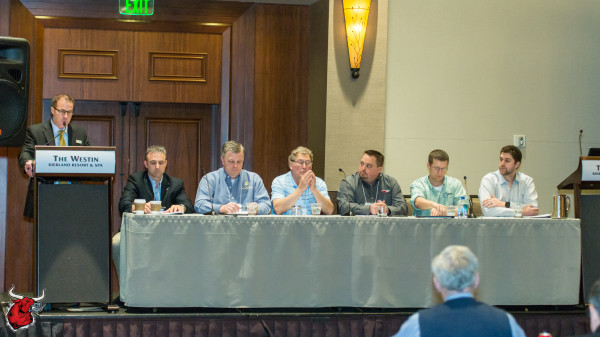


![figure1[1]](https://www.thebullvine.com/wp-content/uploads/2015/01/figure11-600x369.jpg)
![table1[1]](https://www.thebullvine.com/wp-content/uploads/2015/01/table11.jpg)


