A 500‑cow freestall realized more than 85% of the EPA and 75% of the DHA on their feed tag were being destroyed in the rumen. Here’s how a stuck fresh‑cow sheet started looking like a fat‑program problem.
Editor’s Note: The 500‑cow Midwest dairy in this piece is a composite scenario modeled on common transition and heat‑stress patterns reported by progressive Midwest freestall operations. The disease rates, ration components, dialogue, and decision sequence are illustrative and representative of multiple herds, not drawn from a single named farm. All cited research, USDA prices, and published cost‑of‑disease ranges are real and sourced.
The calves were coming easy that February. The fresh‑cow sheet still looked ugly.
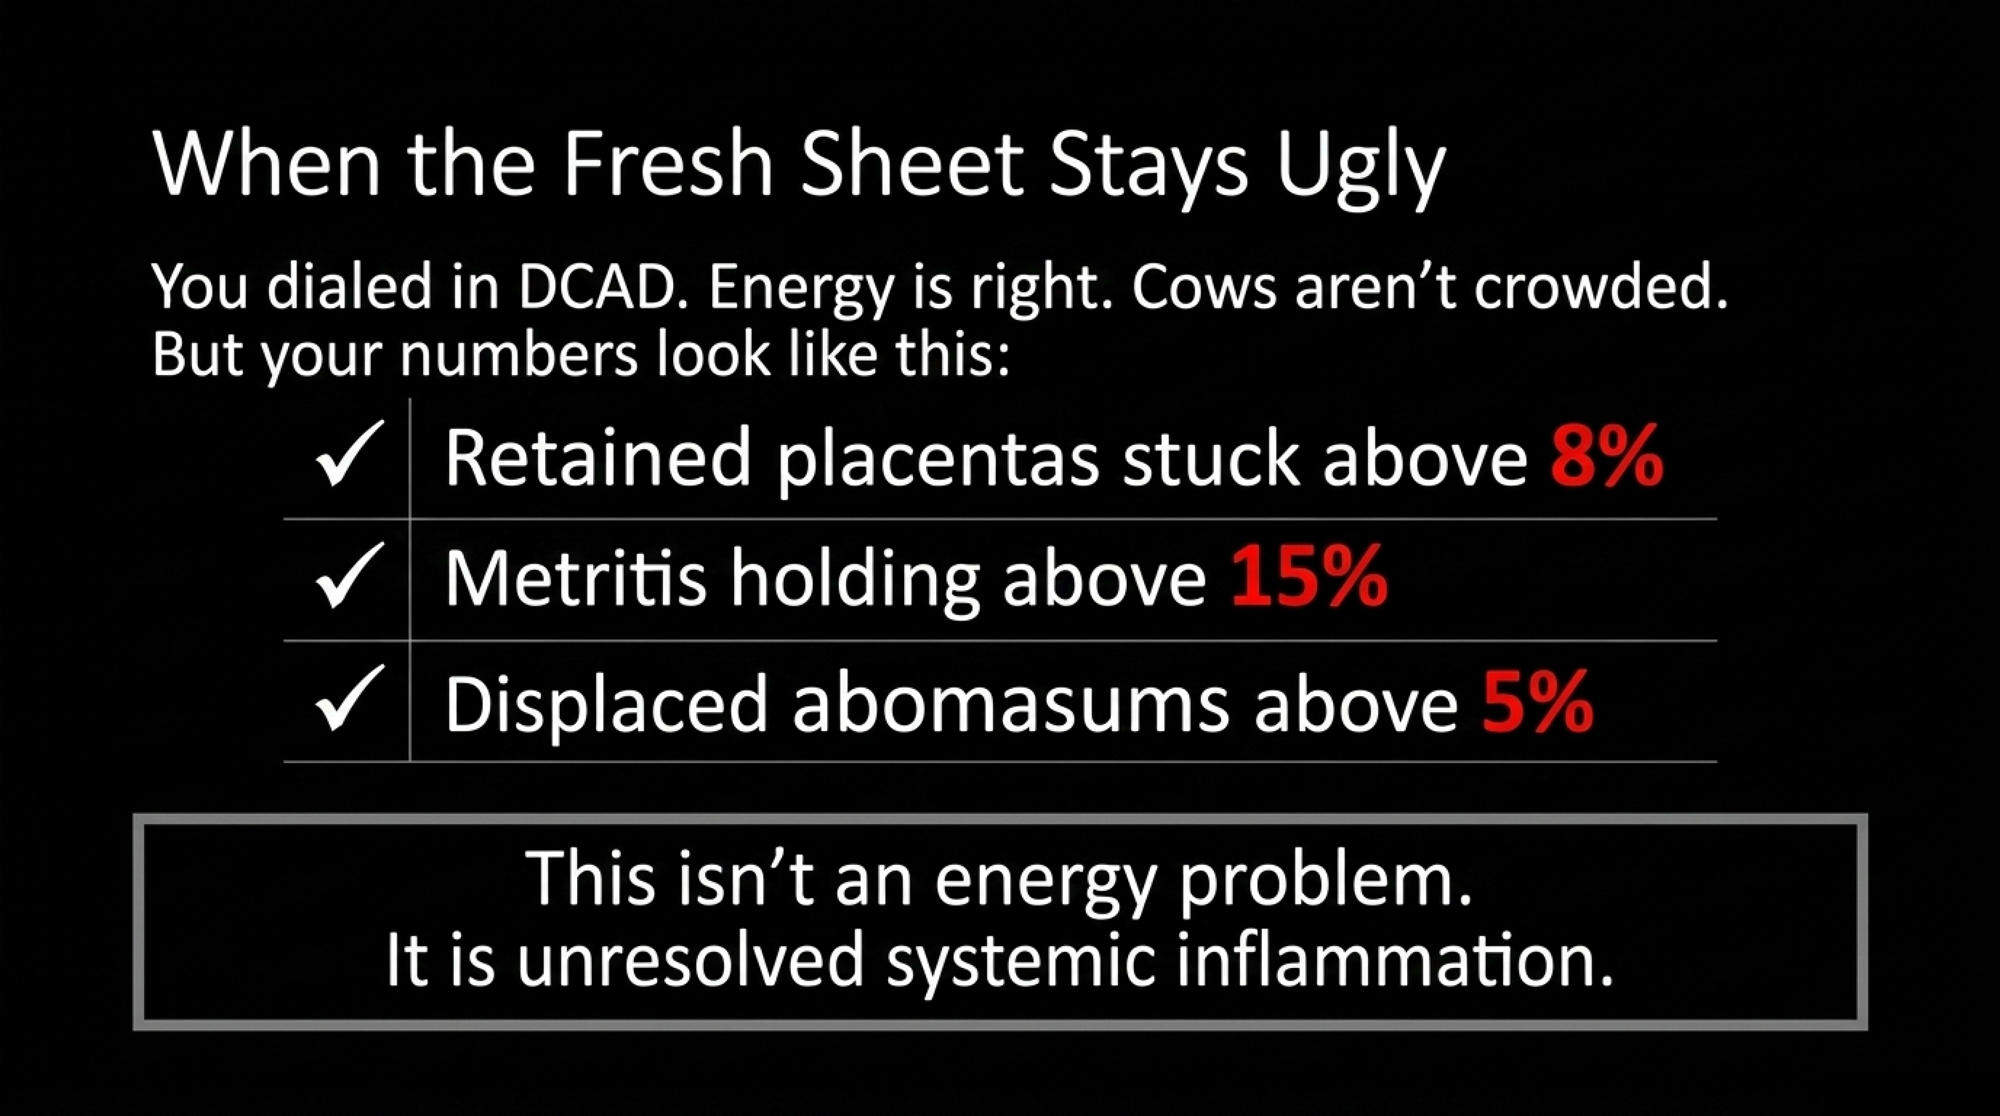
In the farm office, the owner, the herd vet, and the nutritionist leaned over a laptop. DCAD was dialed in. Rumen‑protected methionine sat in both close‑up and fresh rations. Energy density matched targets. Cows weren’t overstocked or overfat. The numbers wouldn’t move. Retained placentas wouldn’t drop into single digits. Metritis hung high. Every summer, milk fell harder than feed refusals could explain.
Then the vet pointed at one line on the ration sheet and asked the question nobody around that table had a clean answer for: what was the actual in‑vivo rumen bypass rate for EPA and DHA in their omega‑3 product, at the dose they were feeding?
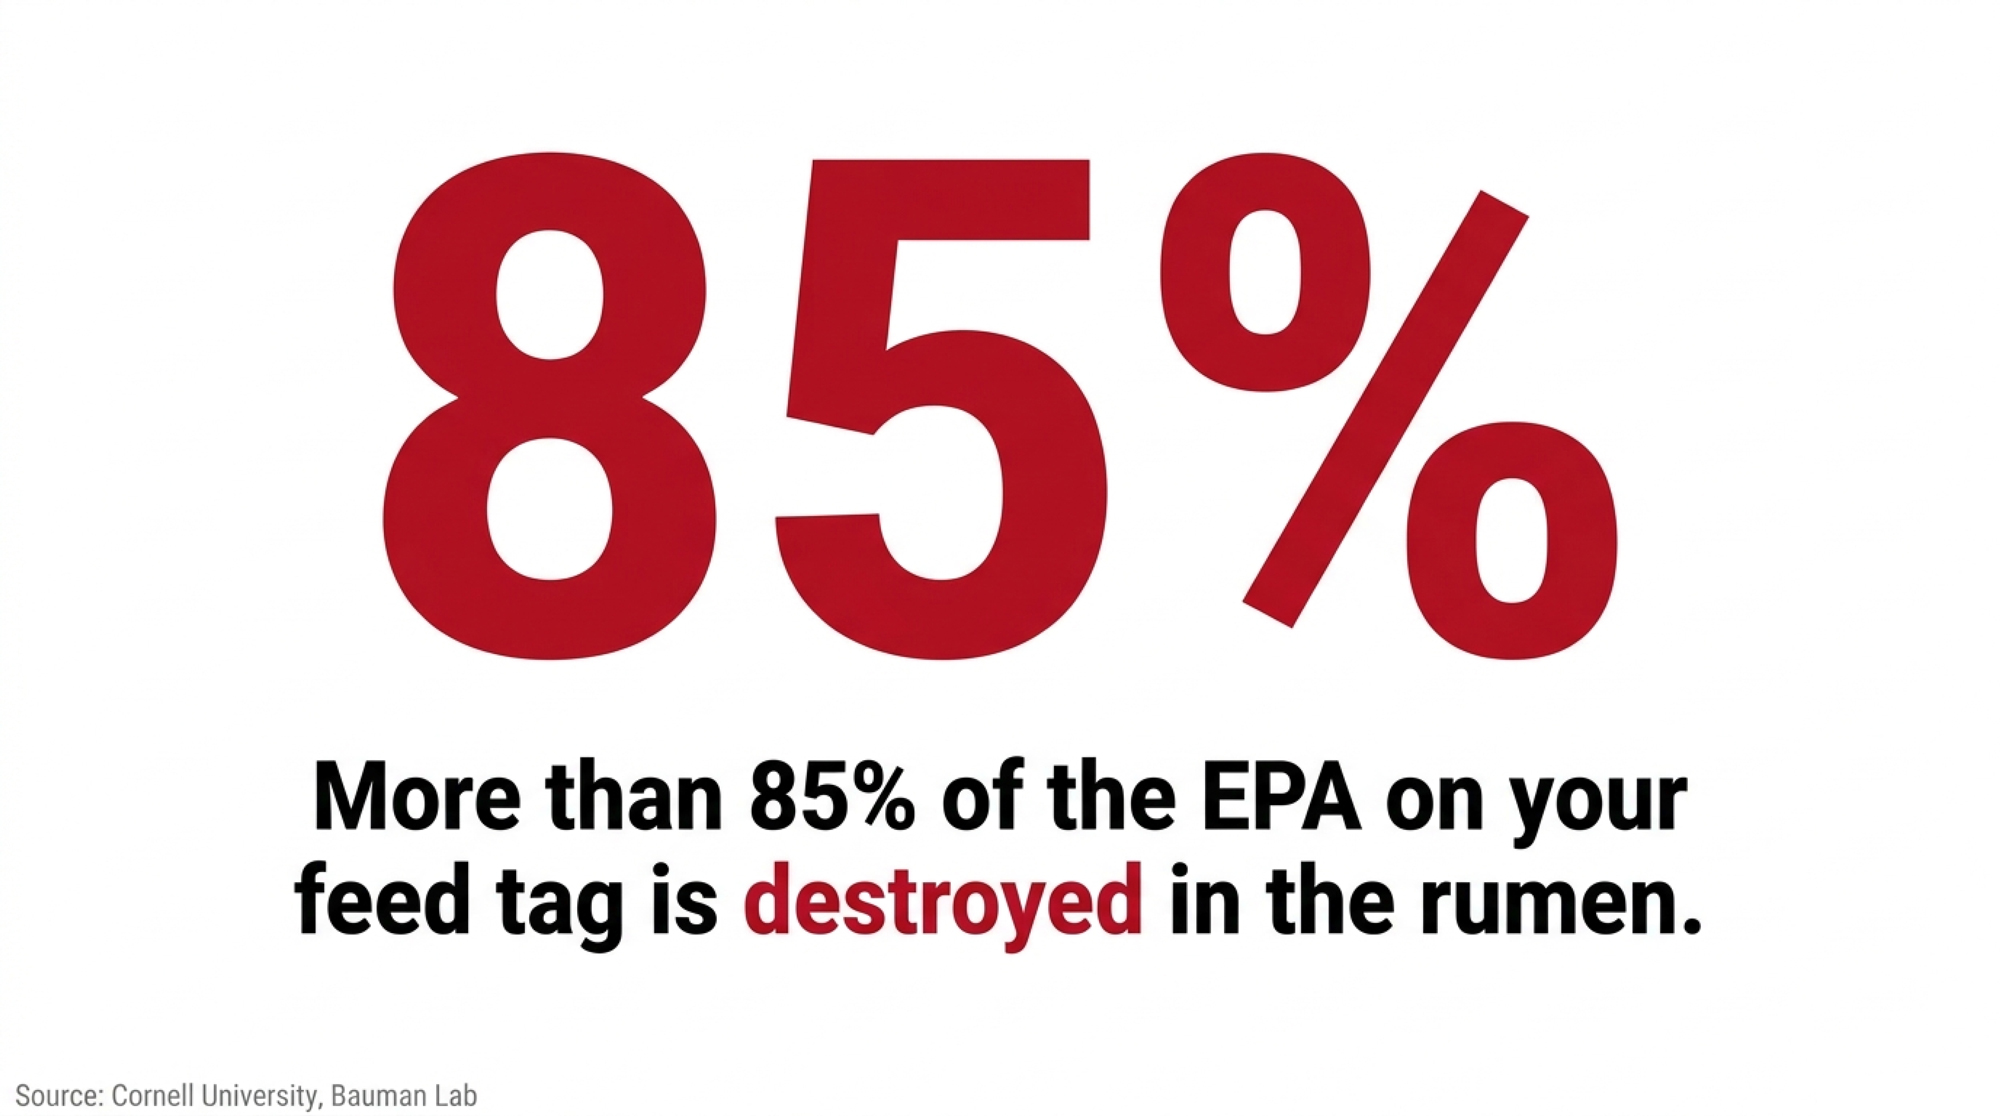
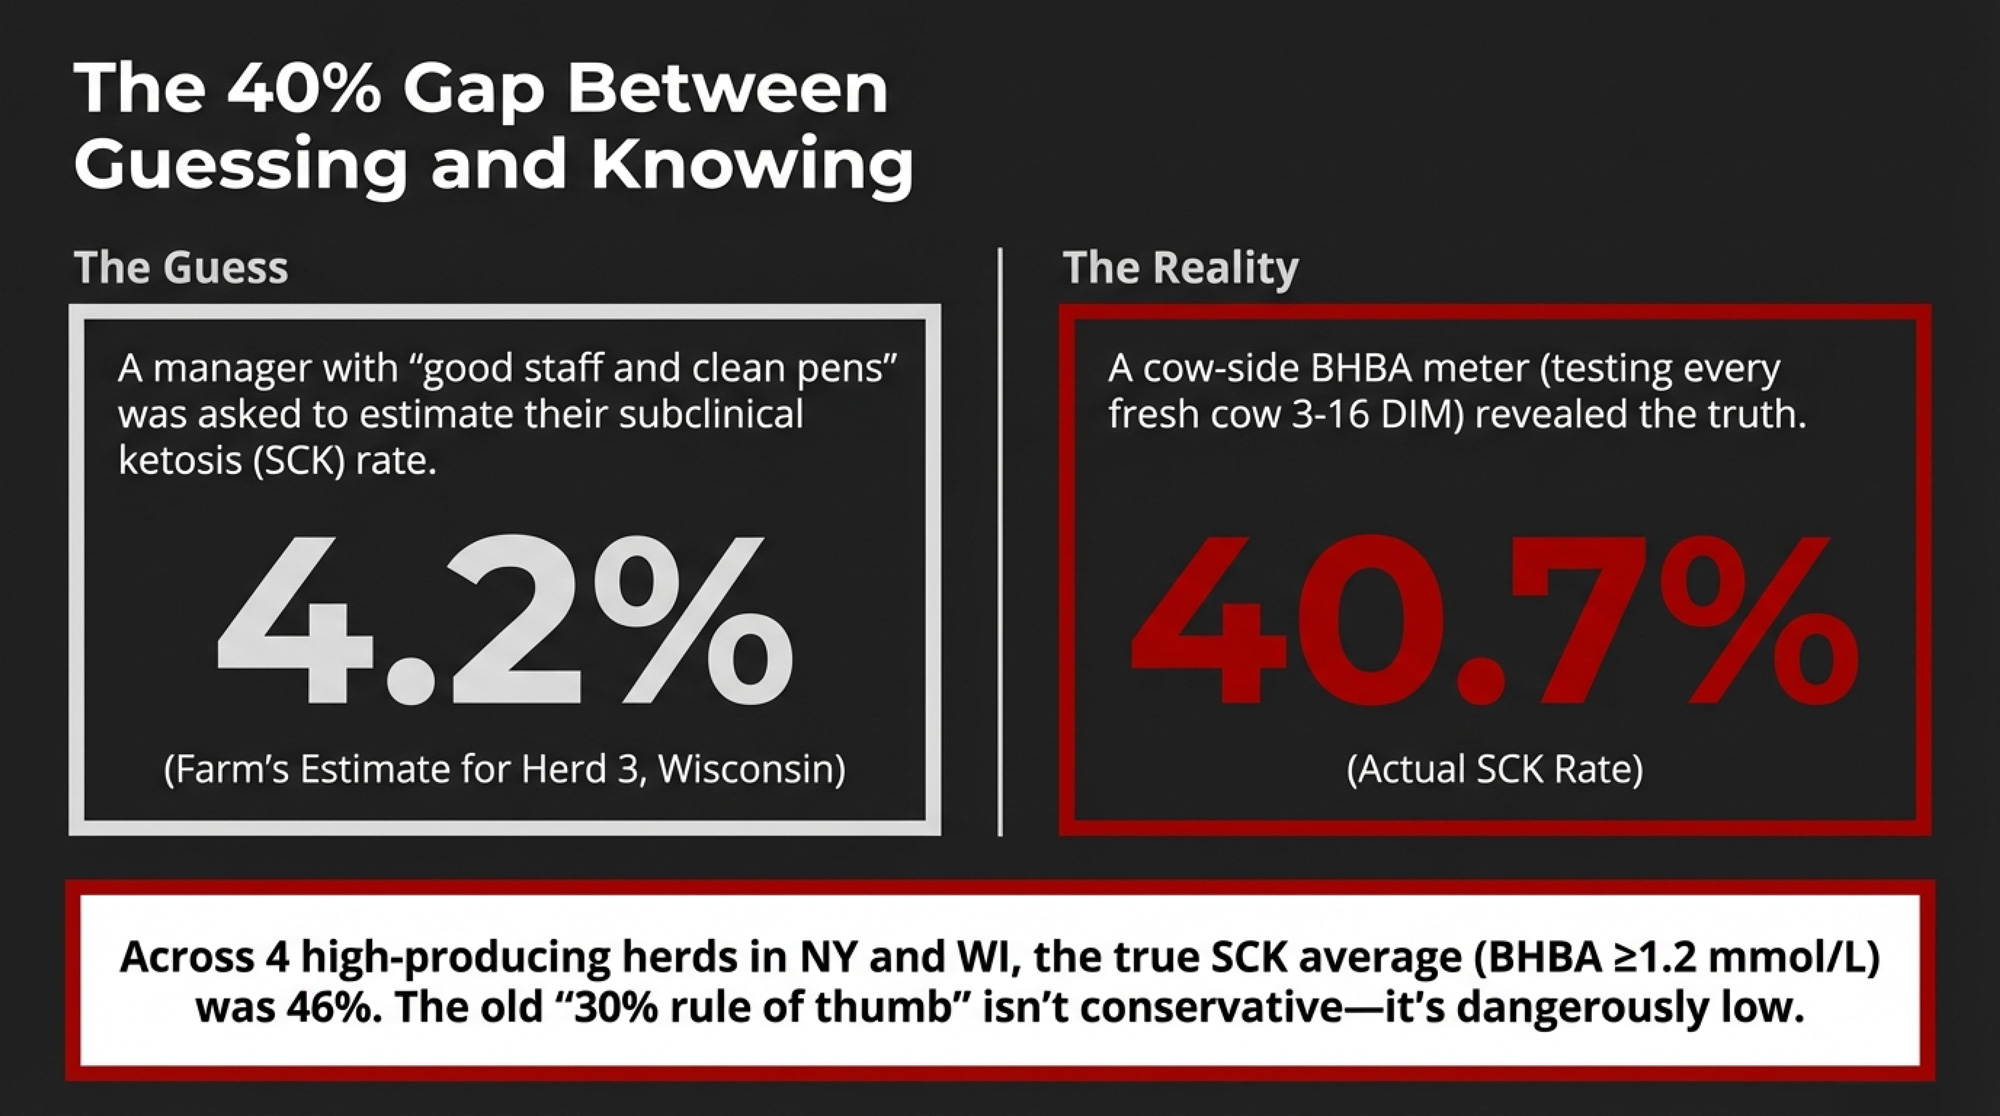
When the team went digging, work from Cornell’s Bauman lab on calcium salts of fish oil showed rumen biohydrogenation of EPA above 85% and DHA above 75% in cows fed those products. More than three‑quarters of the omega‑3 they thought they were buying for inflammation control wasn’t getting past the rumen.
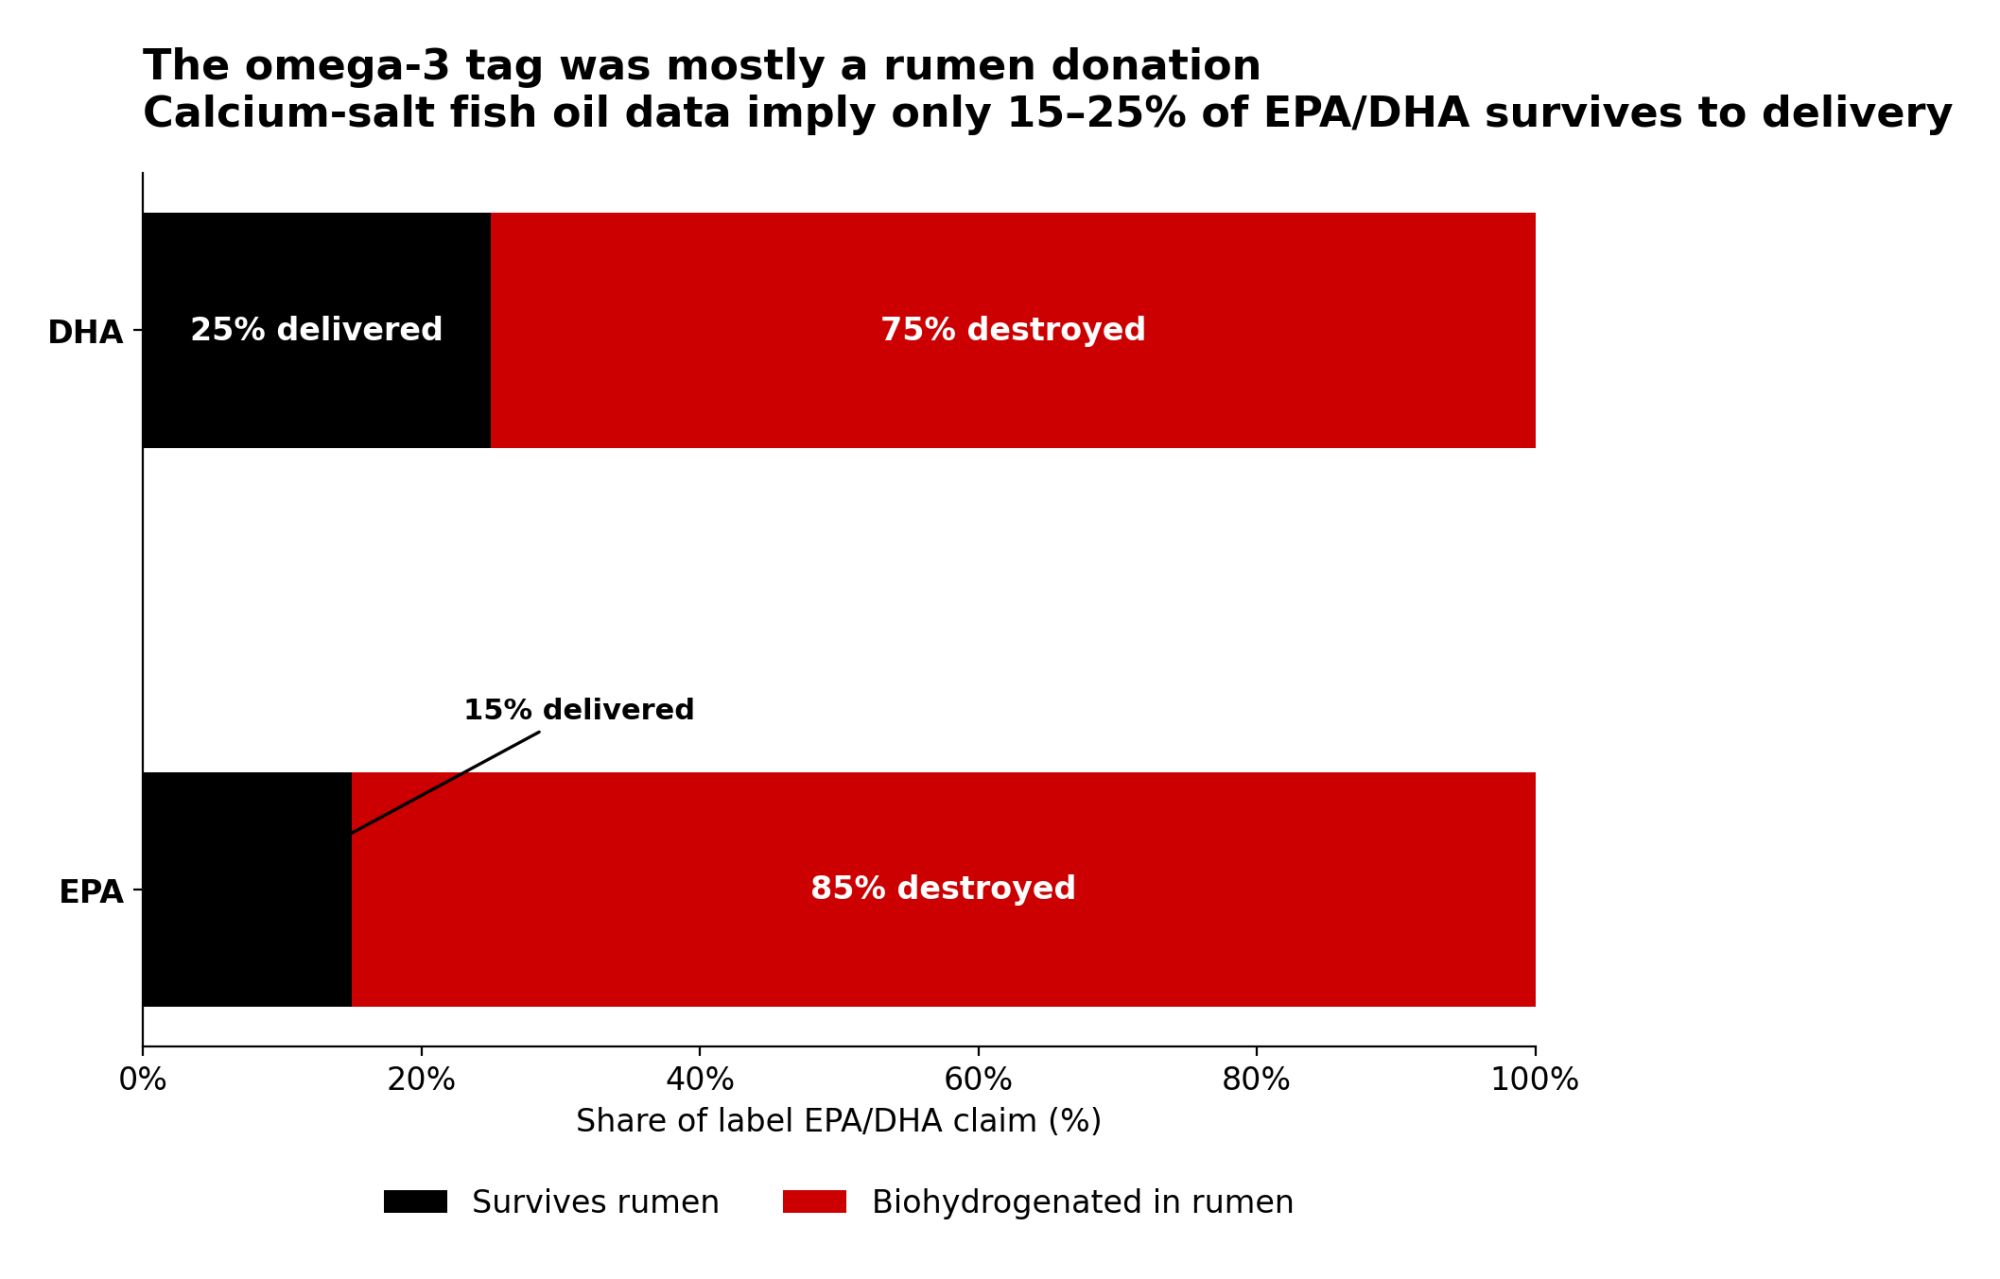
The product was protecting the rumen from the fat. It wasn’t protecting the fat from the rumen.
The Double Standard Hiding in Their Fat Program
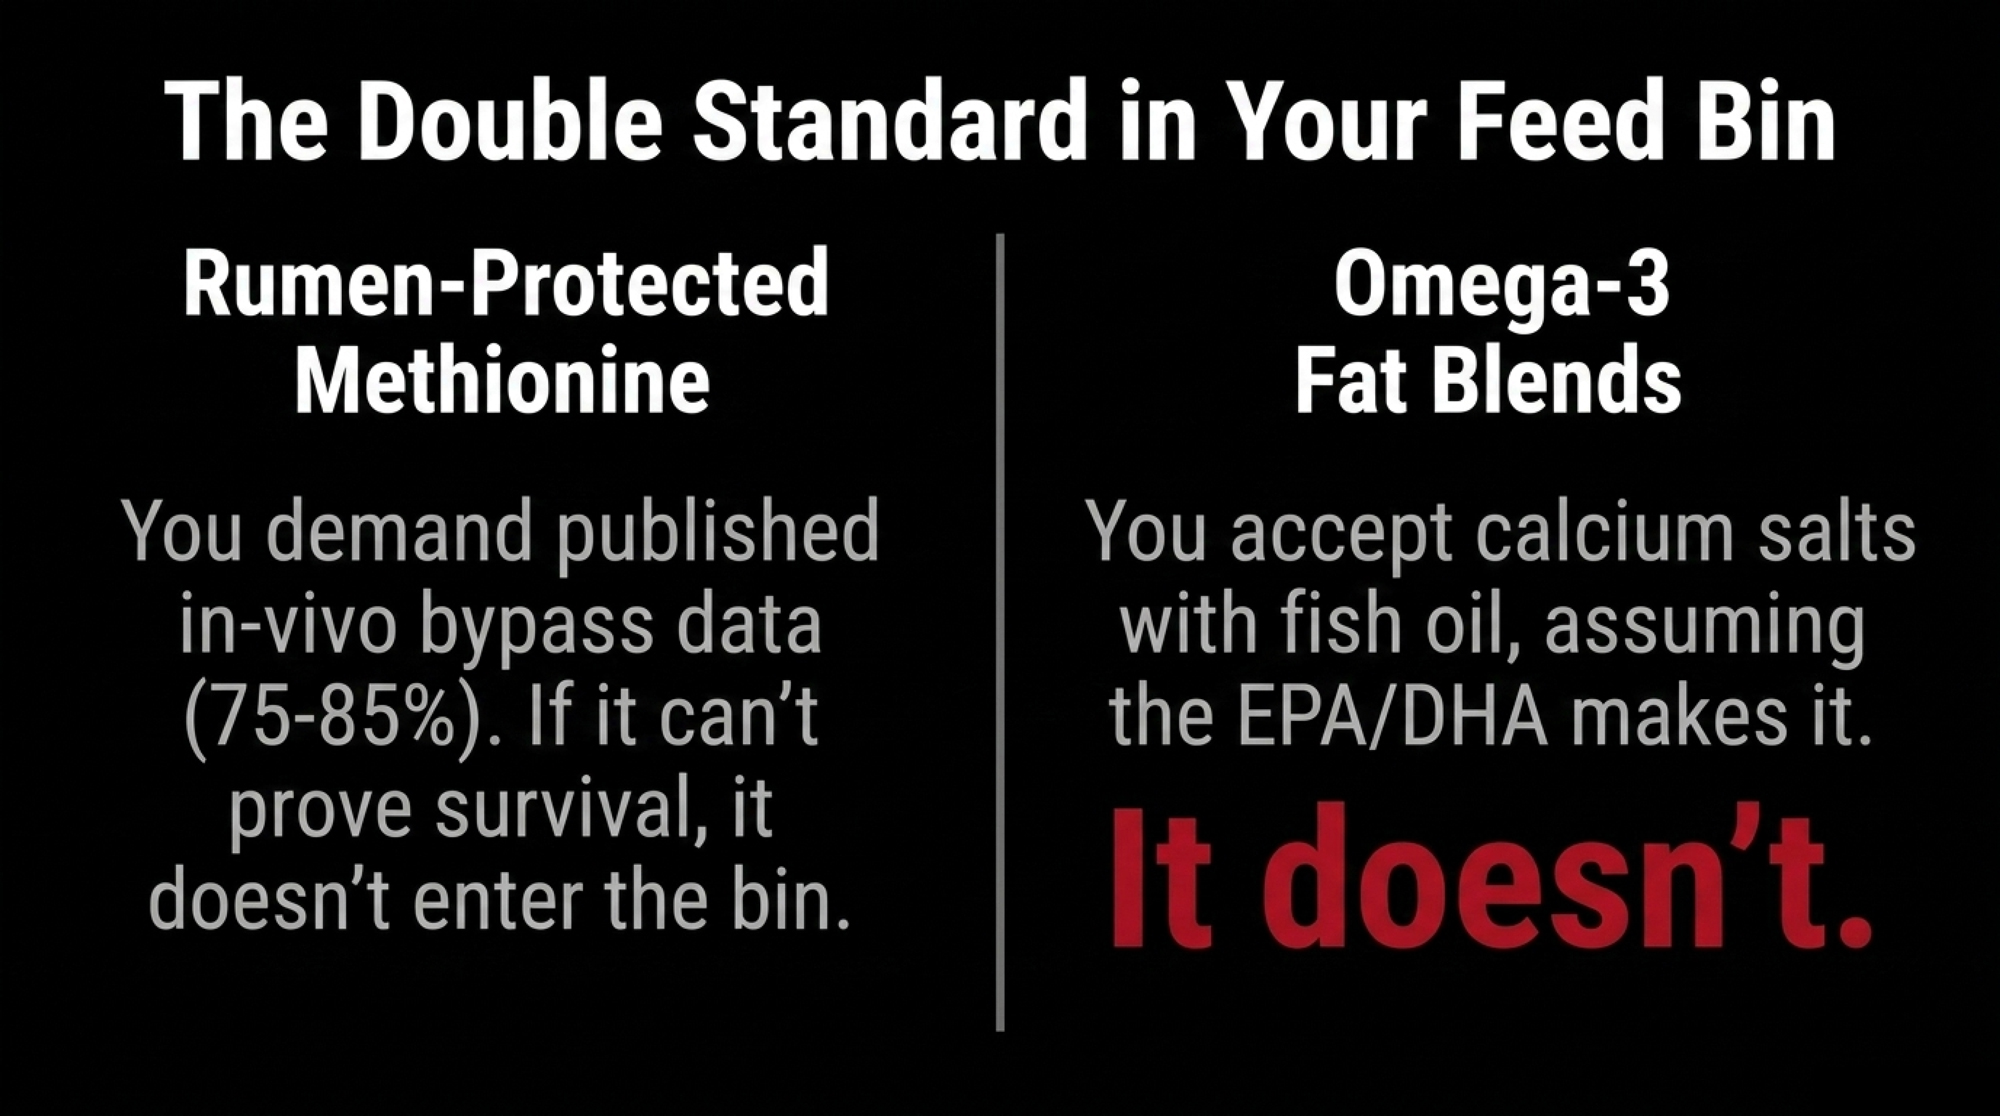
By the time this dairy added rumen‑protected methionine, they were already treating bypass data as non‑negotiable. The nutritionist could rattle off the target — published in‑vivo bypass values land in the 75–85% range for the major RP‑Met products. If a Met source couldn’t show how much survived the rumen, it never made it into their bins.
The fat program ran on a fuzzier standard. The herd used a common calcium salt blend that included fish oil, and the tag listed EPA and DHA alongside palmitic and other fatty acids. For years, everyone around that office table assumed that ticked the omega‑3 box for retained placenta, metritis, and inflammation control.
Then they sat down with the Cornell biohydrogenation data and the Resolution of Metabolic Inflammation review out of Penn. Two things became hard to argue with. Calcium salts are excellent at keeping fat from burning the rumen. But published biohydrogenation data — including Cornell Bauman‑lab work on calcium salts of fish oil — show they’re substantially less efficient at delivering intact EPA and DHA than technologies designed specifically for omega‑3 protection.
Why Doesn’t the Calcium Salt Carry EPA and DHA Through?
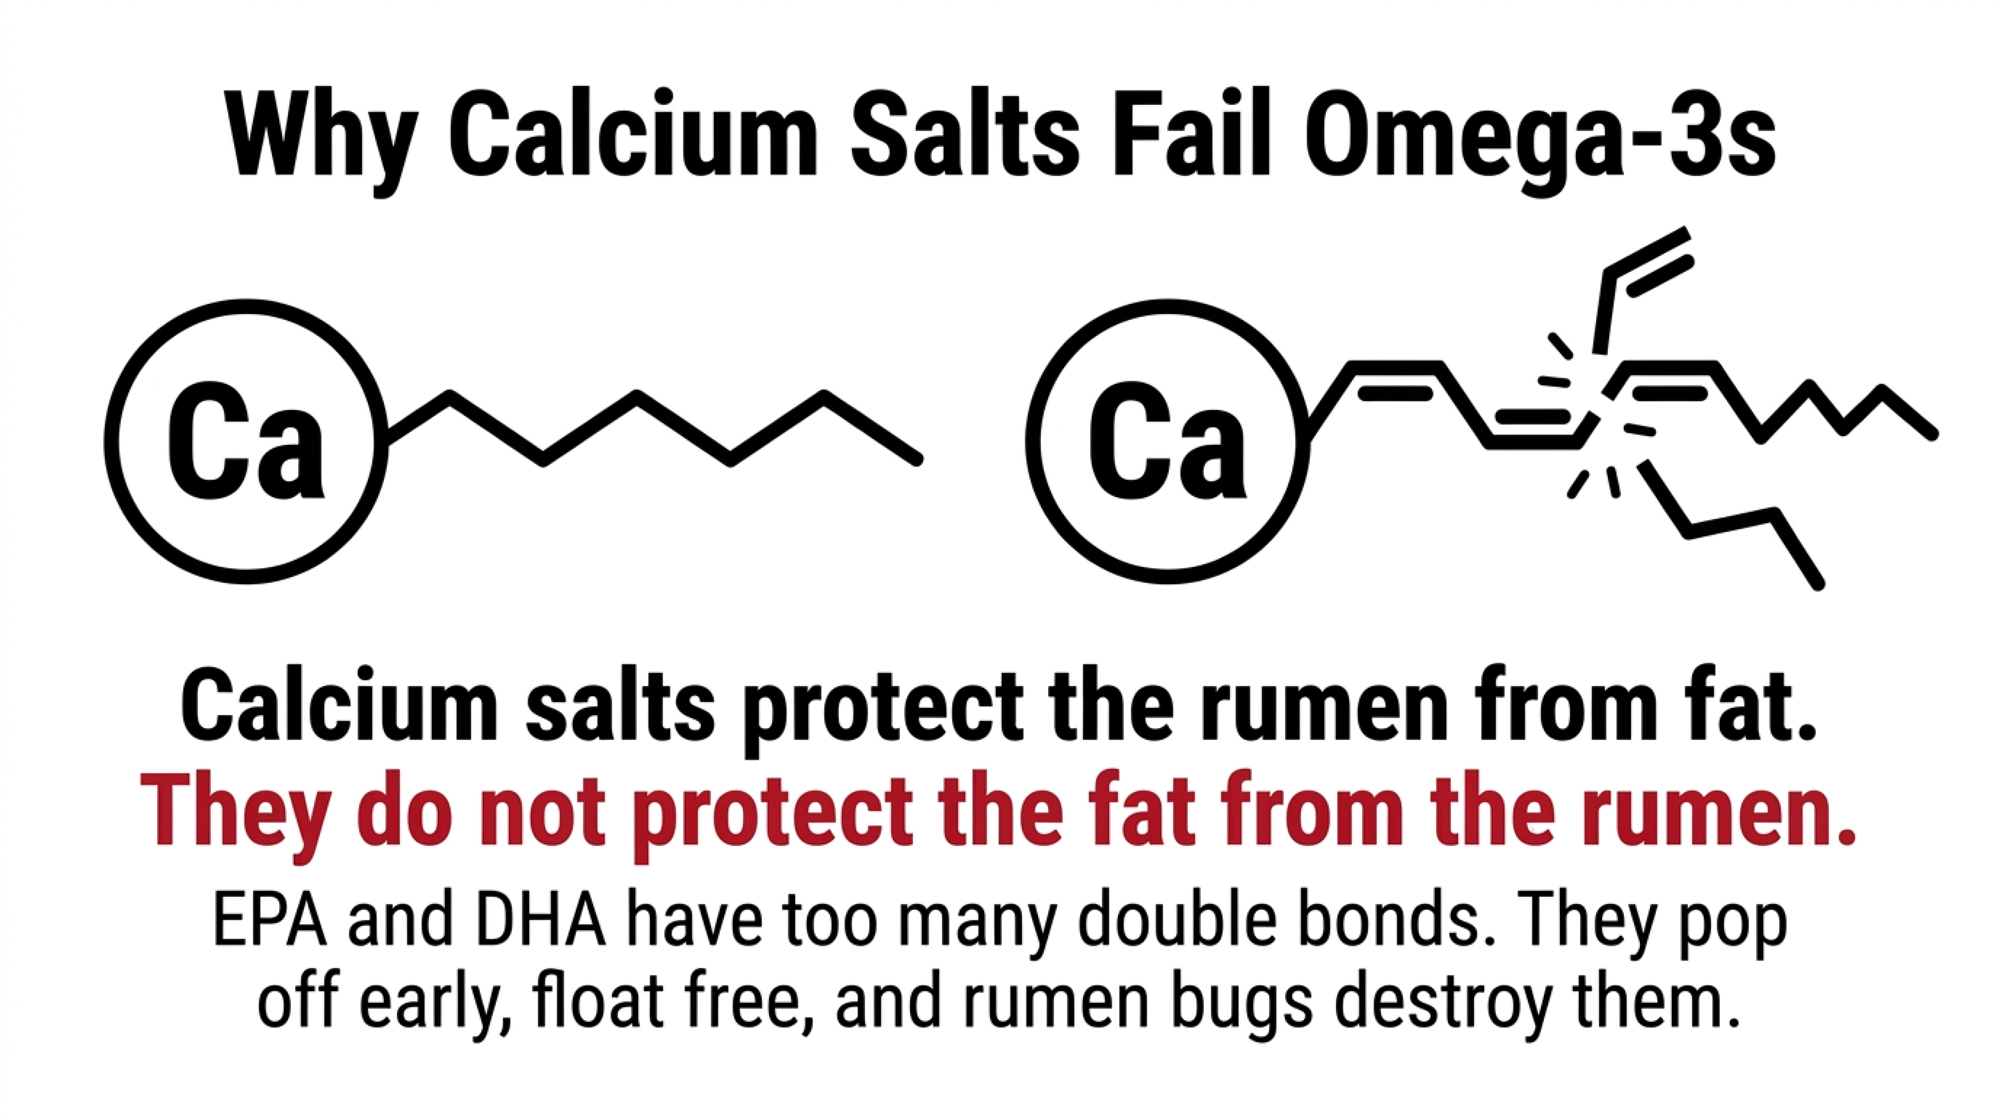
The chemistry isn’t exotic. Rumens don’t like free polyunsaturated fats. Bugs like Butyrivibrio fibrisolvens hydrogenate double bonds to protect themselves, turning unsaturated fatty acids into saturated stearic acid. Calcium salts help by binding fatty acids at rumen pH so they don’t float free and nuke the microbes.
That works fine for palmitic and other less‑unsaturated fats. EPA carries five double bonds. DHA carries six. The more double bonds a fatty acid has, the weaker its bond with calcium at rumen pH gets. EPA and DHA pop off the calcium early, float free, and become exactly the kind of toxin rumen bacteria rush to saturate.
Some Ca‑salt manufacturers are working on improved omega‑3 protection chemistry, and that work may close part of this gap over time. The decision facing this herd today, though, was based on what their current product was actually delivering.
The end result is simple. Plenty of calories make it past the rumen as saturated fat. Very little EPA or DHA reaches the small intestine or gets built into tissue membranes. For this Midwest herd, the math suggested they were spending omega‑3 dollars and mostly getting saturated fat energy — while still living with sticky uteruses, summer milk loss, and DAs that wouldn’t budge.
That raised the harder question. If you’d never accept a methionine product with 15–25% bioavailability, why are you letting an omega‑3 product off the hook with the same profile?
How an Omega‑3 Failure Showed Up in the Fresh‑Cow Pen
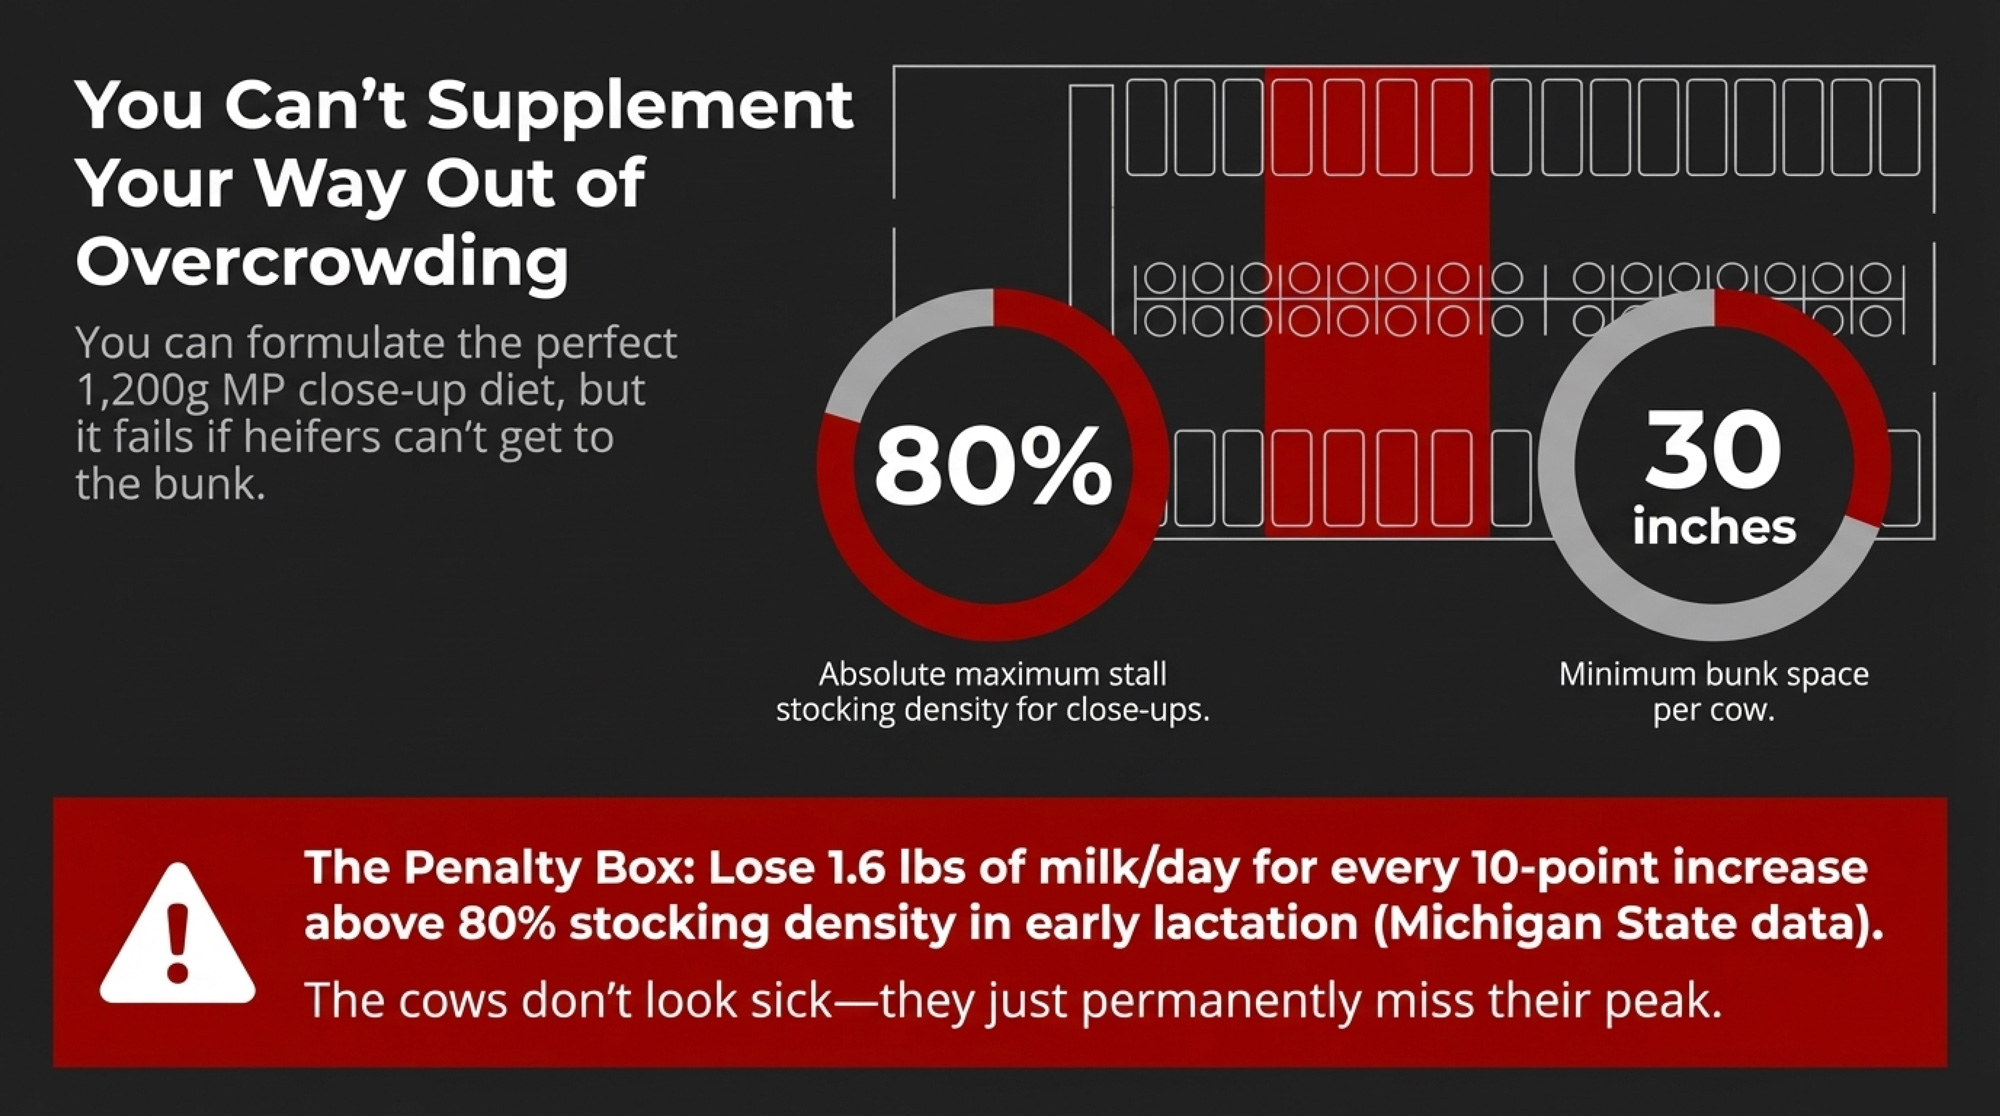
On paper, this herd looked like a lot of progressive Midwest dairies. Close‑up DMI was steady. Body condition wasn’t a problem. Transition pens weren’t overcrowded. Fans and soakers were in. RP‑Met went in at the right rate. A fat blend with fish oil hit the mixer every day.
The fresh sheet kept telling a different story. Retained placentas wouldn’t get into single digits no matter what they tried with DCAD or close‑up grouping. Metritis stayed stubbornly high through whole calving stretches. DAs picked off cows who had given them no warning at all on the feed pad. None of it was catastrophic. It was just persistently “not where we want them.” Familiar?
The vet kept asking the same question every month at the meeting. If we’re doing all the obvious things right, what are we missing? Cow comfort wasn’t it. Energy wasn’t it. The team was running out of obvious answers.
When Heat Stress Stops Looking Like an Intake Problem
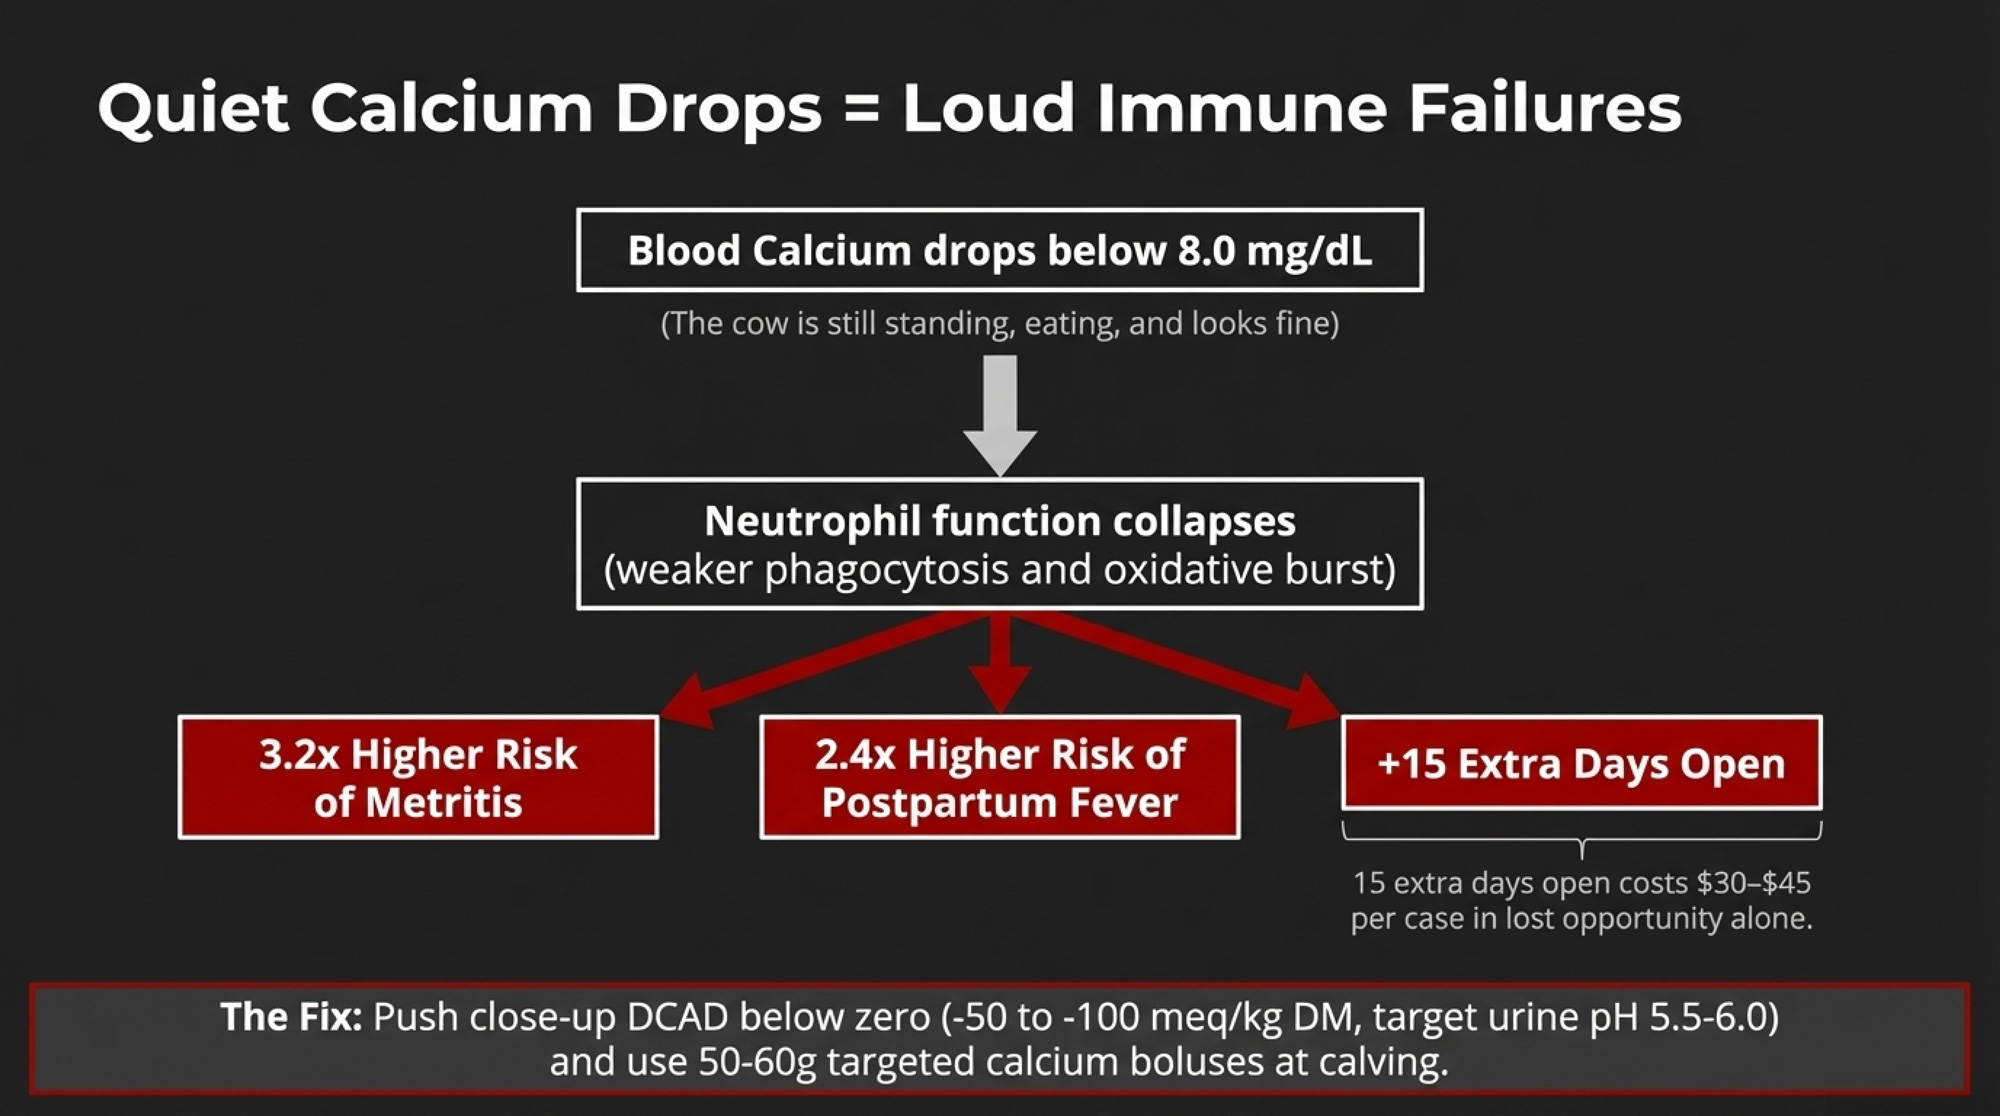
The vet’s question clicked into place with something else they’d been reading. Reviews on transition biology show systemic inflammation is almost universal right after calving, even when cows don’t look sick. That early fire is necessary; it helps deliver the calf and clear the uterus. The problem is what happens if the cow doesn’t have enough raw material to put it out.
Modern TMRs don’t help her. With corn silage, grains, and by‑products, omega‑6:omega‑3 ratios in dairy diets regularly run 10:1 to 25:1 instead of the 1–2:1 a grazing cow on lush pasture sees. Plenty of arachidonic acid to drive inflammatory pathways. Not much EPA or DHA to compete at the same enzymes.
Pasture‑heavy and graziers’ herds start in a different place. Fresh forage delivers meaningful baseline alpha‑linolenic acid, and the omega‑3 gap this herd was chasing is narrower in those systems. The math in this article is built for confinement and freestall operations whose cows see little or no grass.
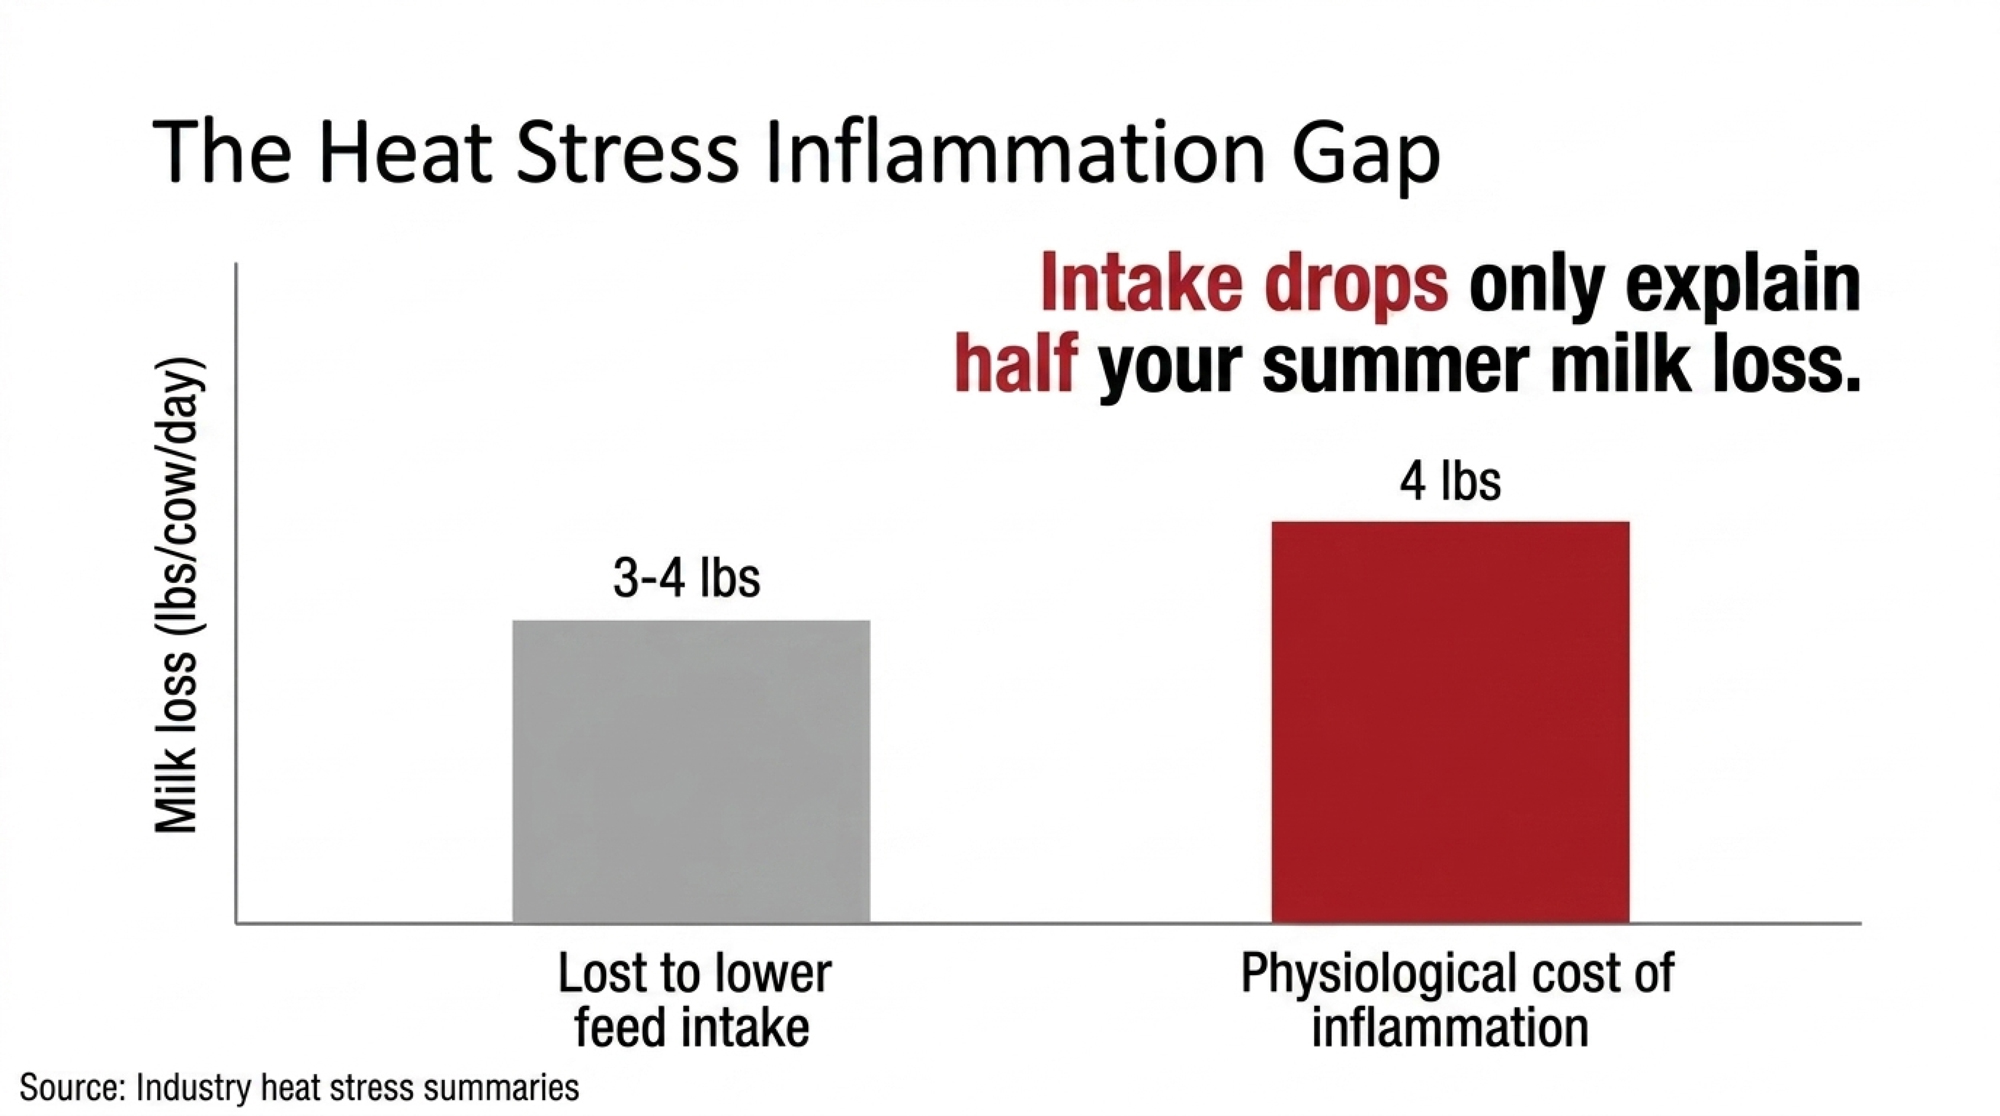
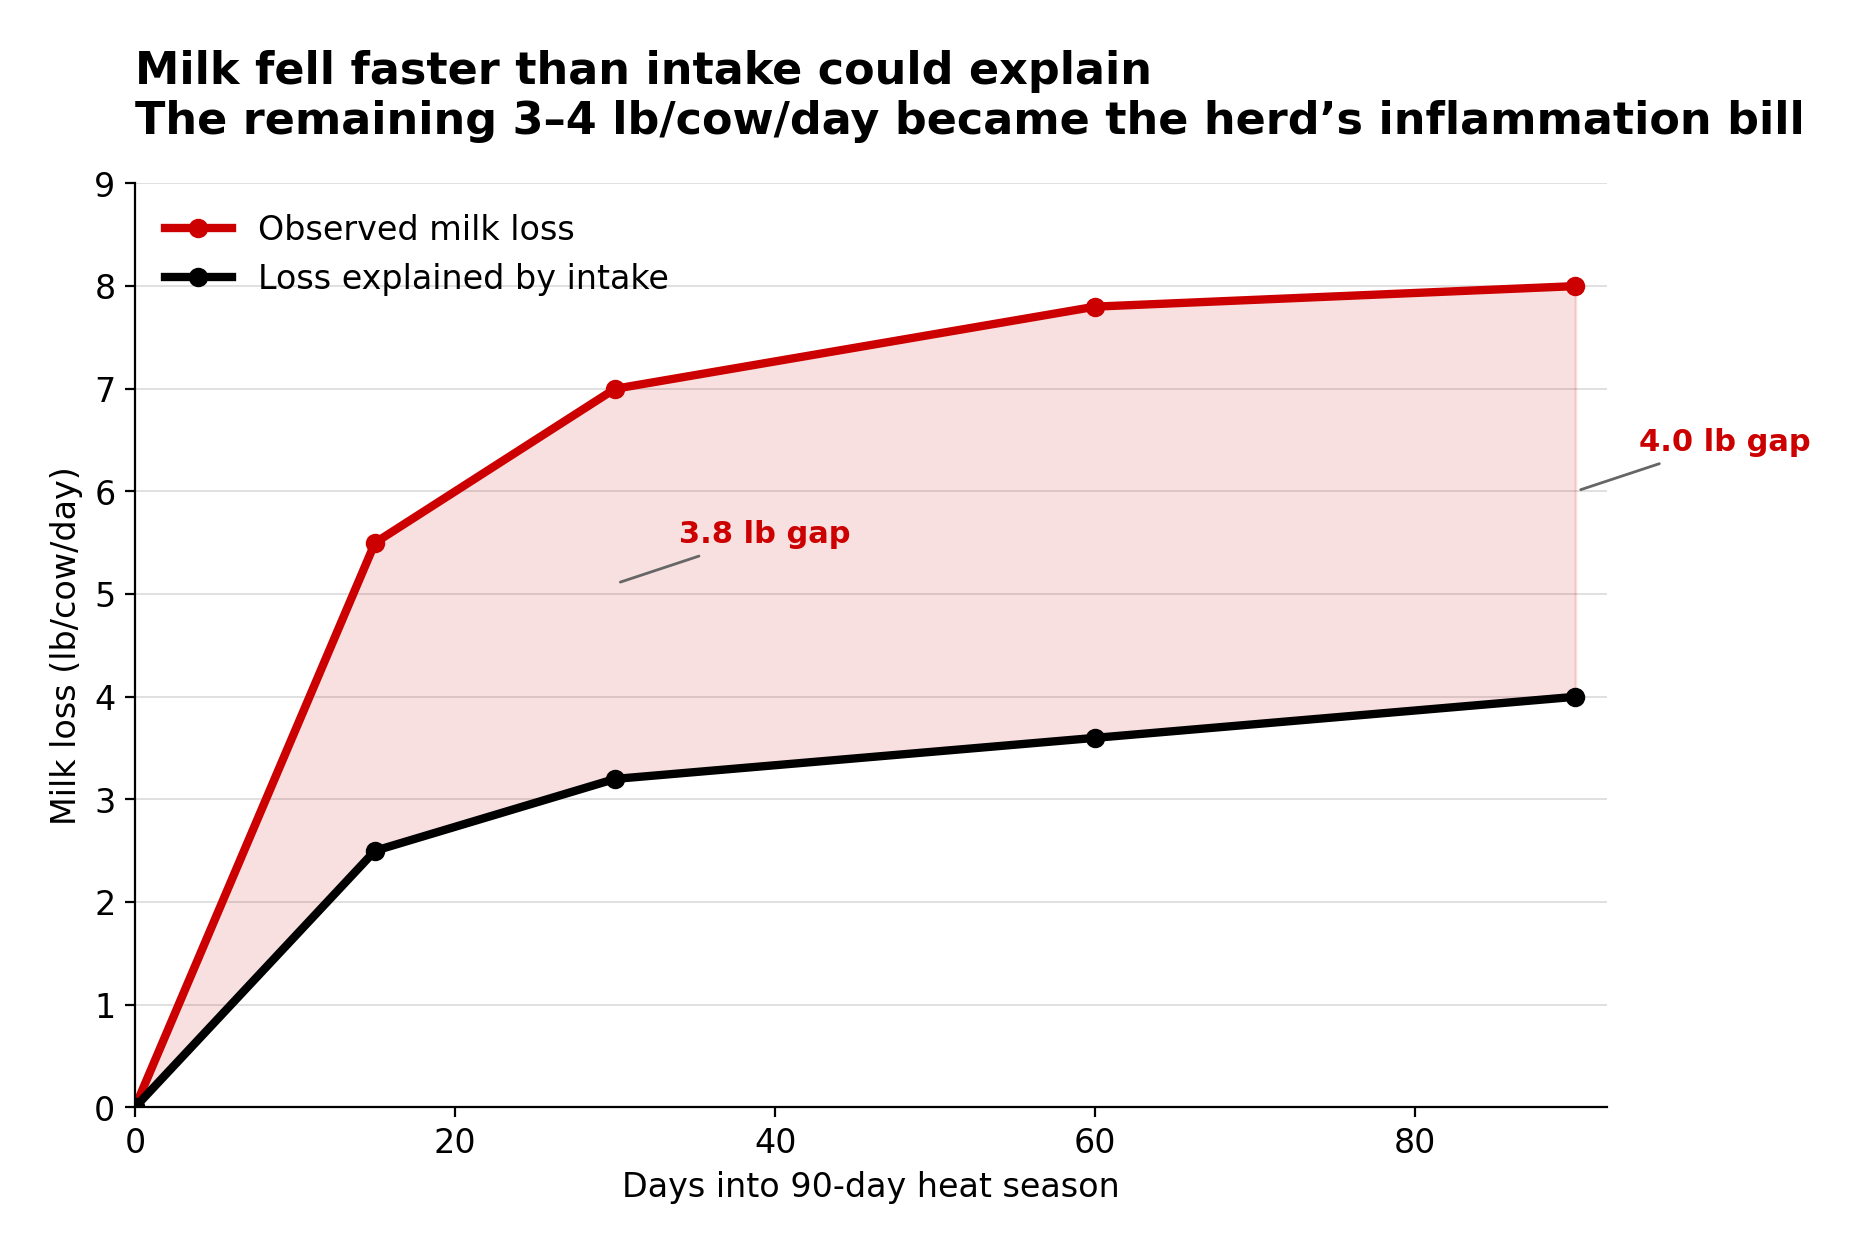
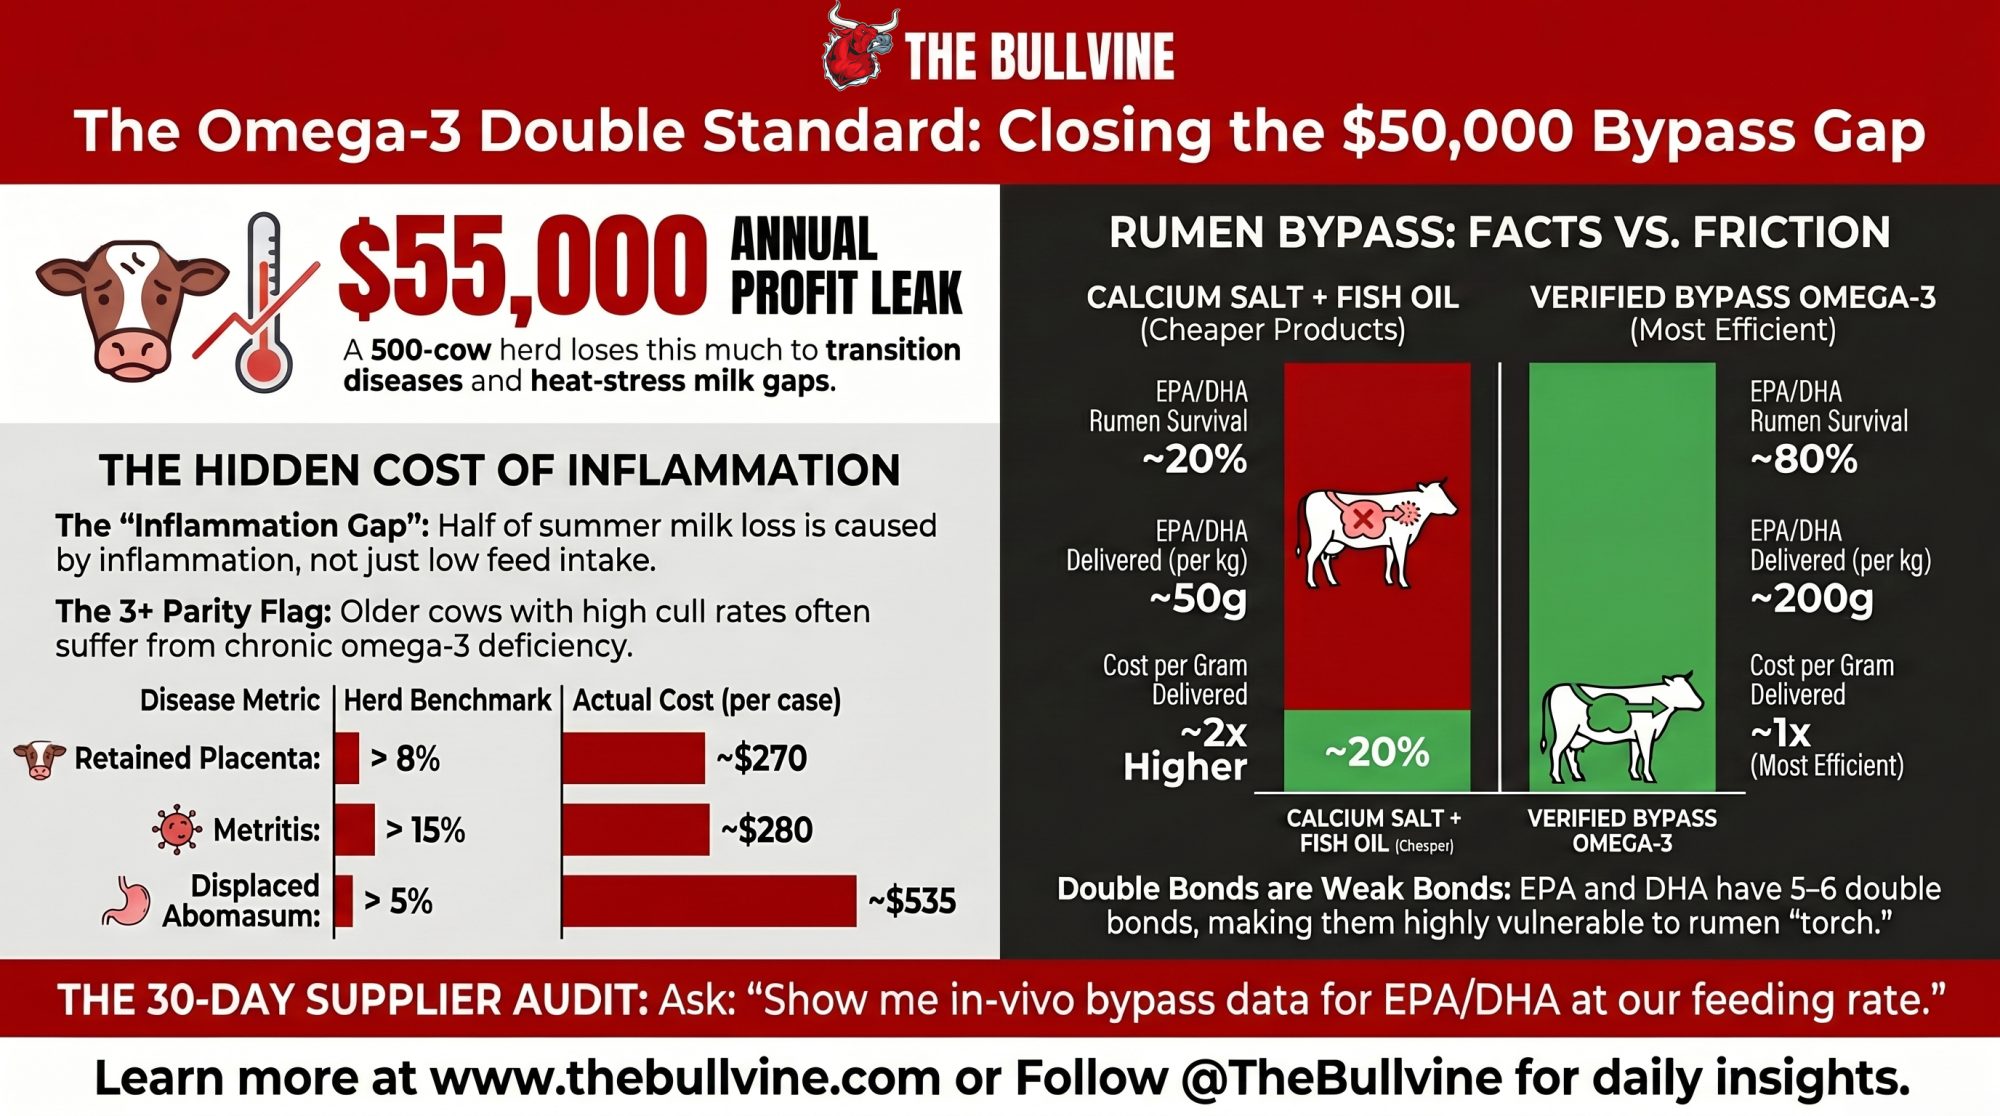
Pair‑feeding research keeps showing only about half of heat‑stress milk loss is explained by intake. The other half is the physiological and inflammatory cost of being hot. Industry write‑ups summarizing recent heat‑stress trial work cite roughly 4.4 lb more milk per day and about 50% lower LBP — a blood marker of endotoxin load — in cows receiving abomasally infused or highly protected EPA/DHA. Treat those figures as a directional indicator drawn from secondary industry summaries rather than a fixed expectation pulled from a single named trial.
That sounded a lot like the “extra” milk this herd kept losing every July. They stopped assuming the fish oil line on the tag meant inflammation was covered.

The Day They Put Real Numbers to the Problem
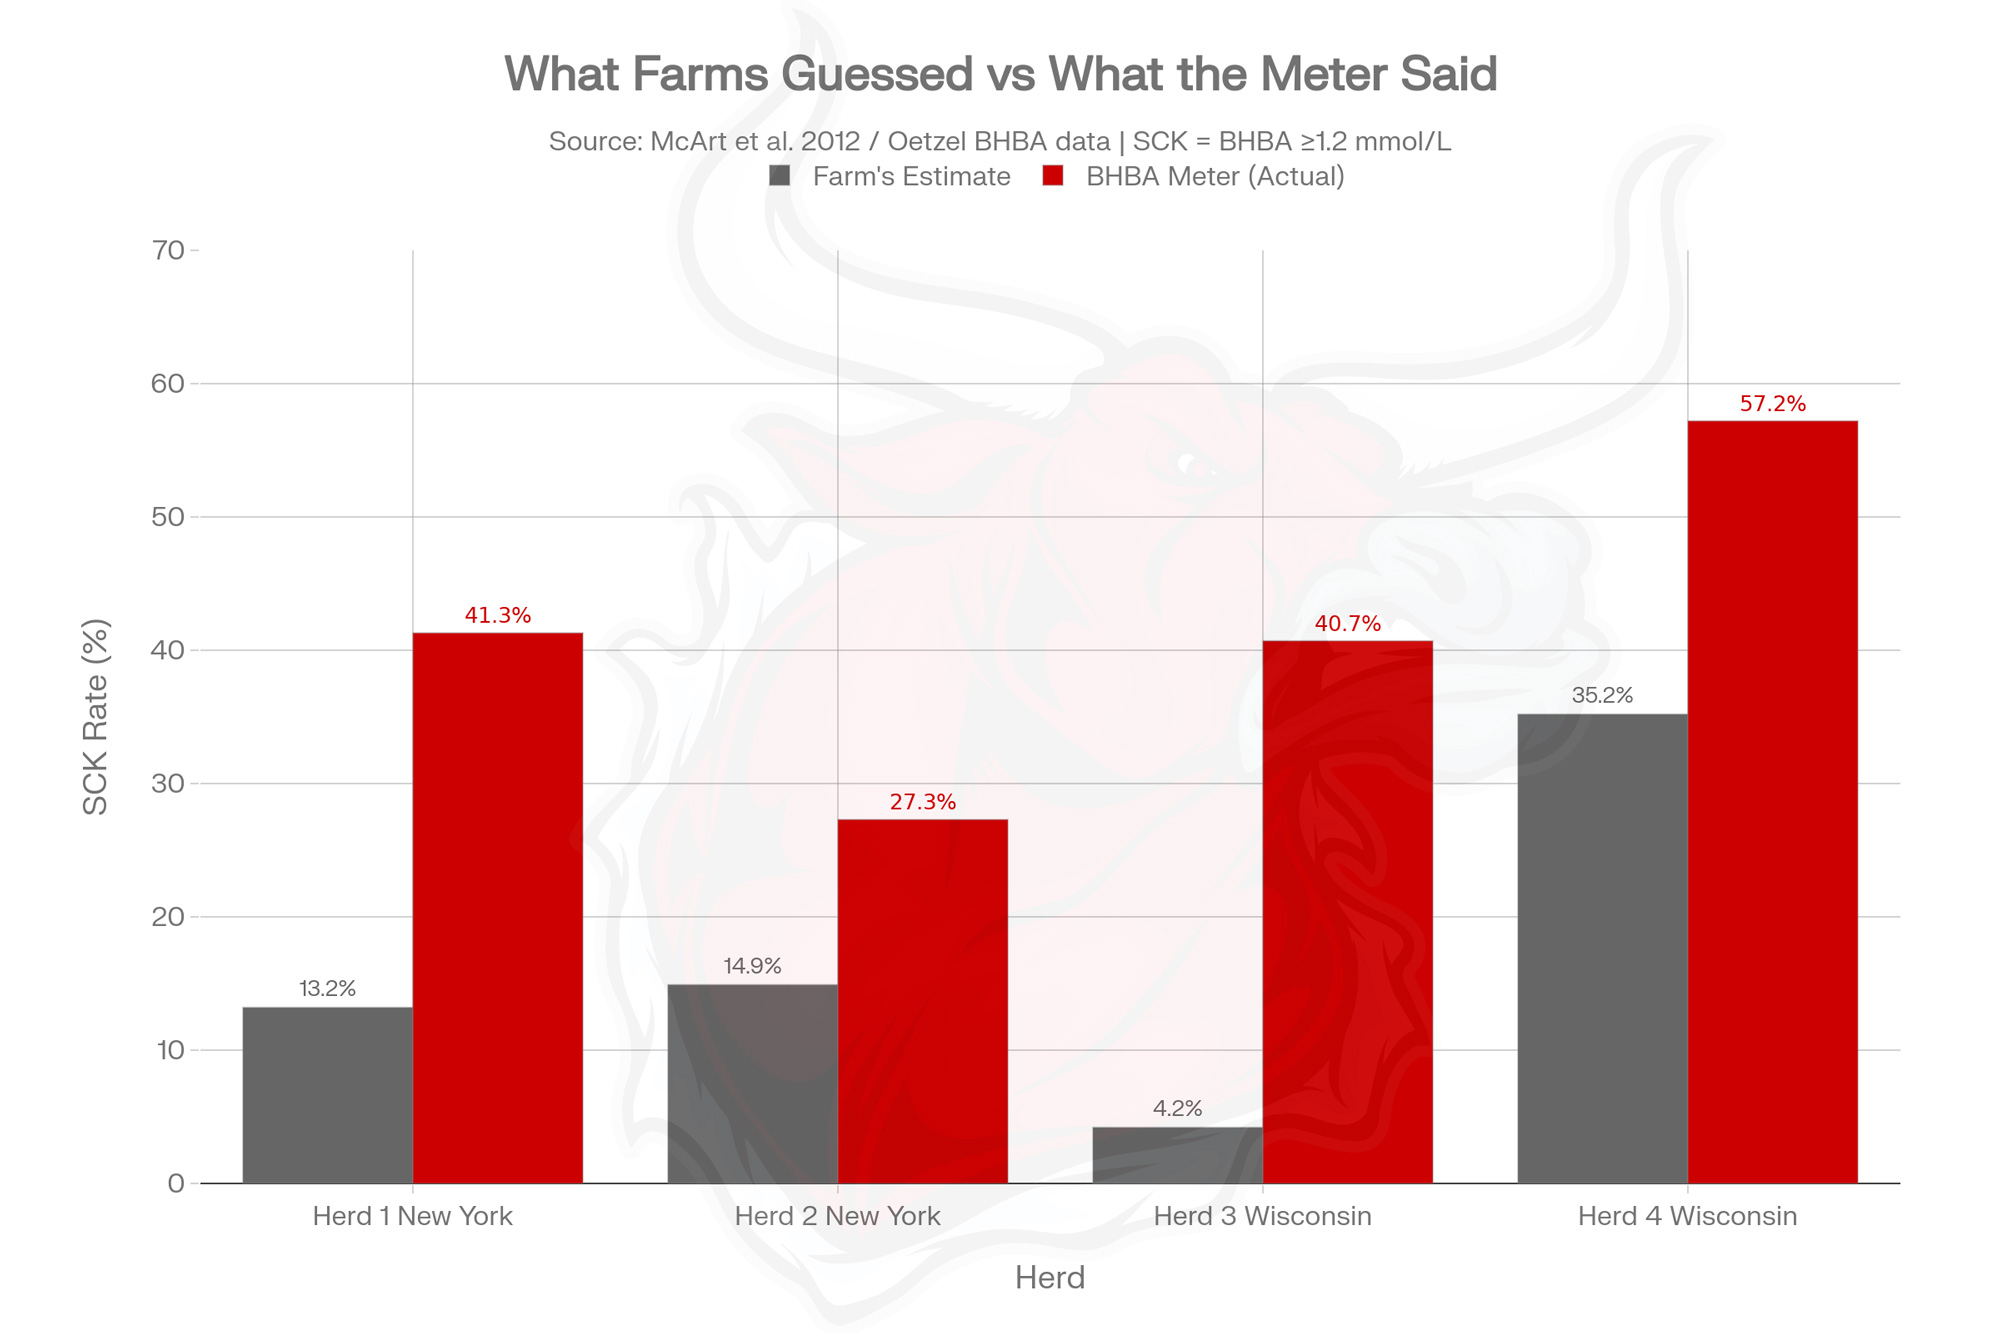
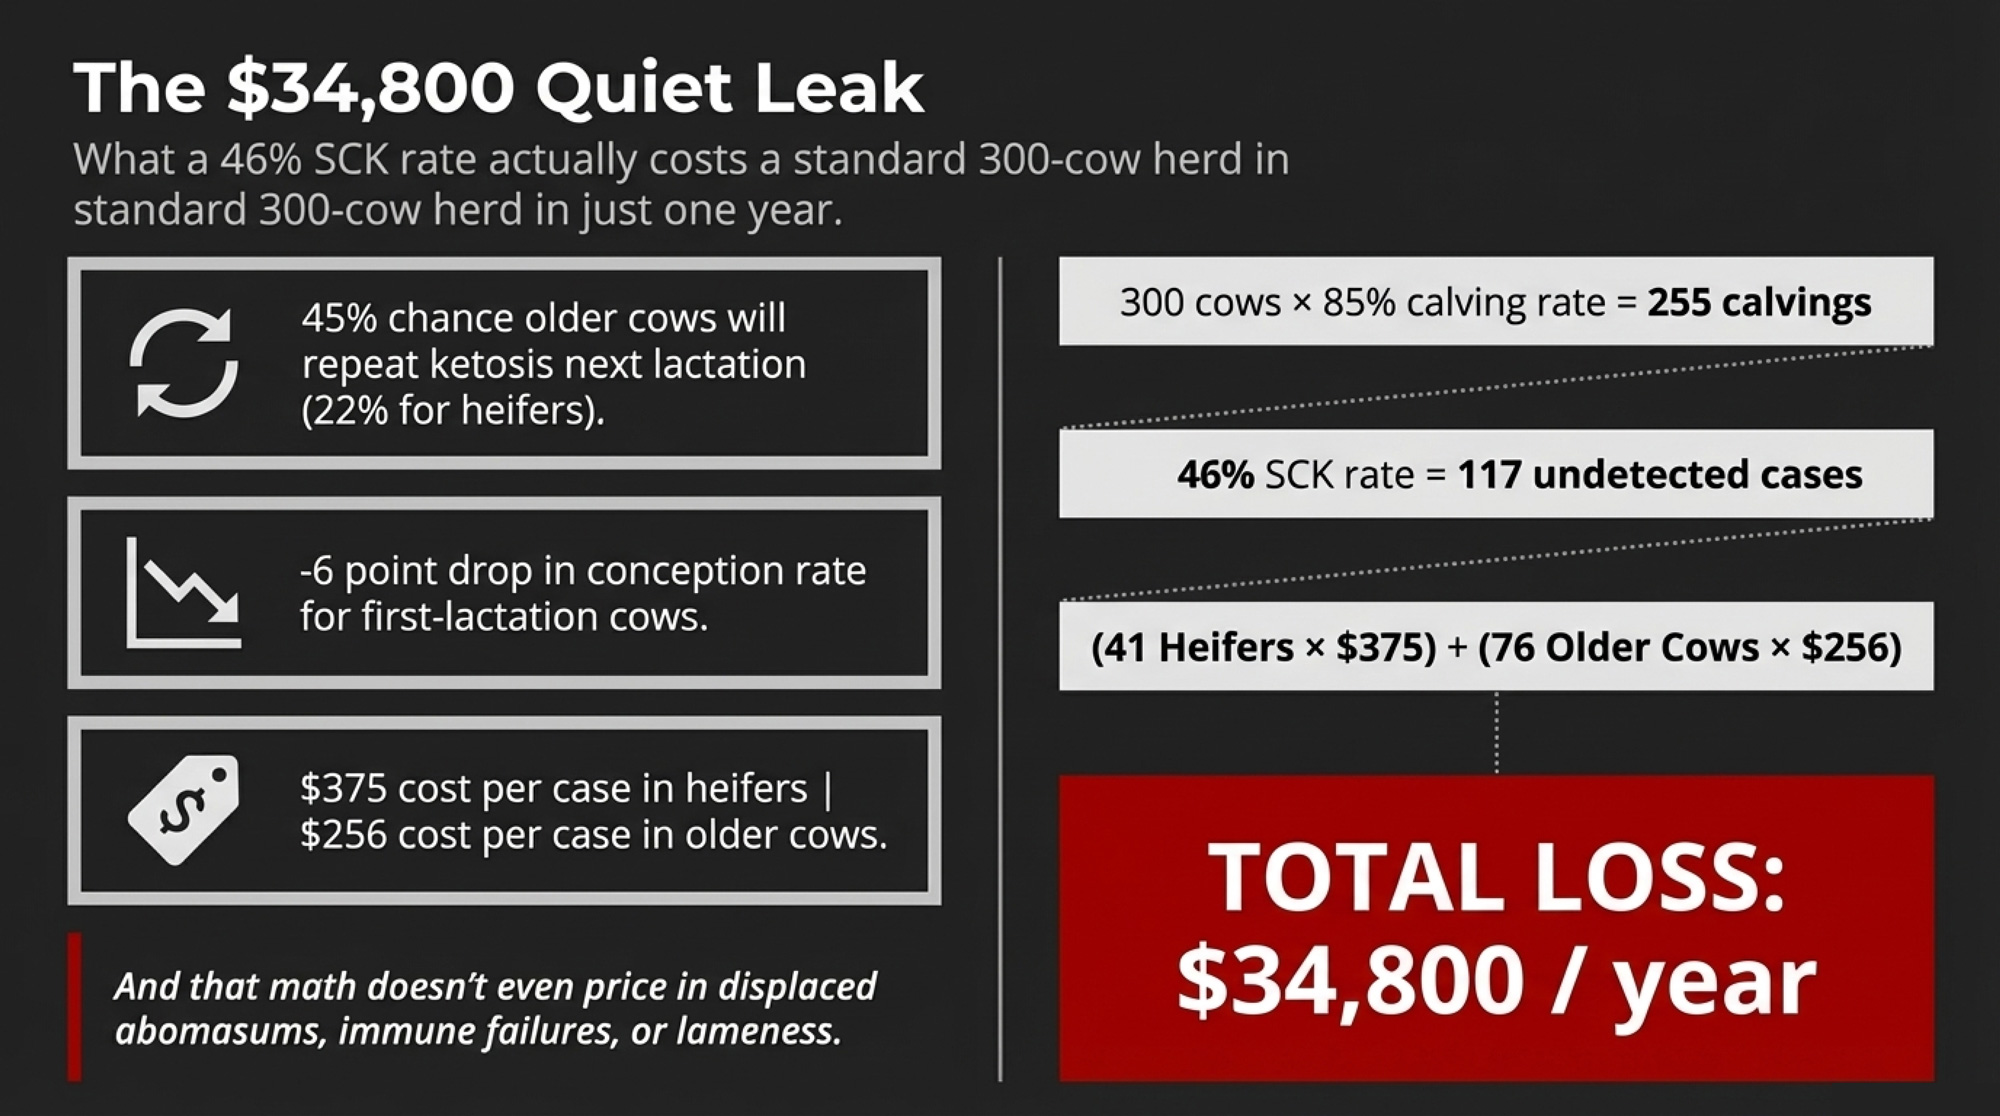
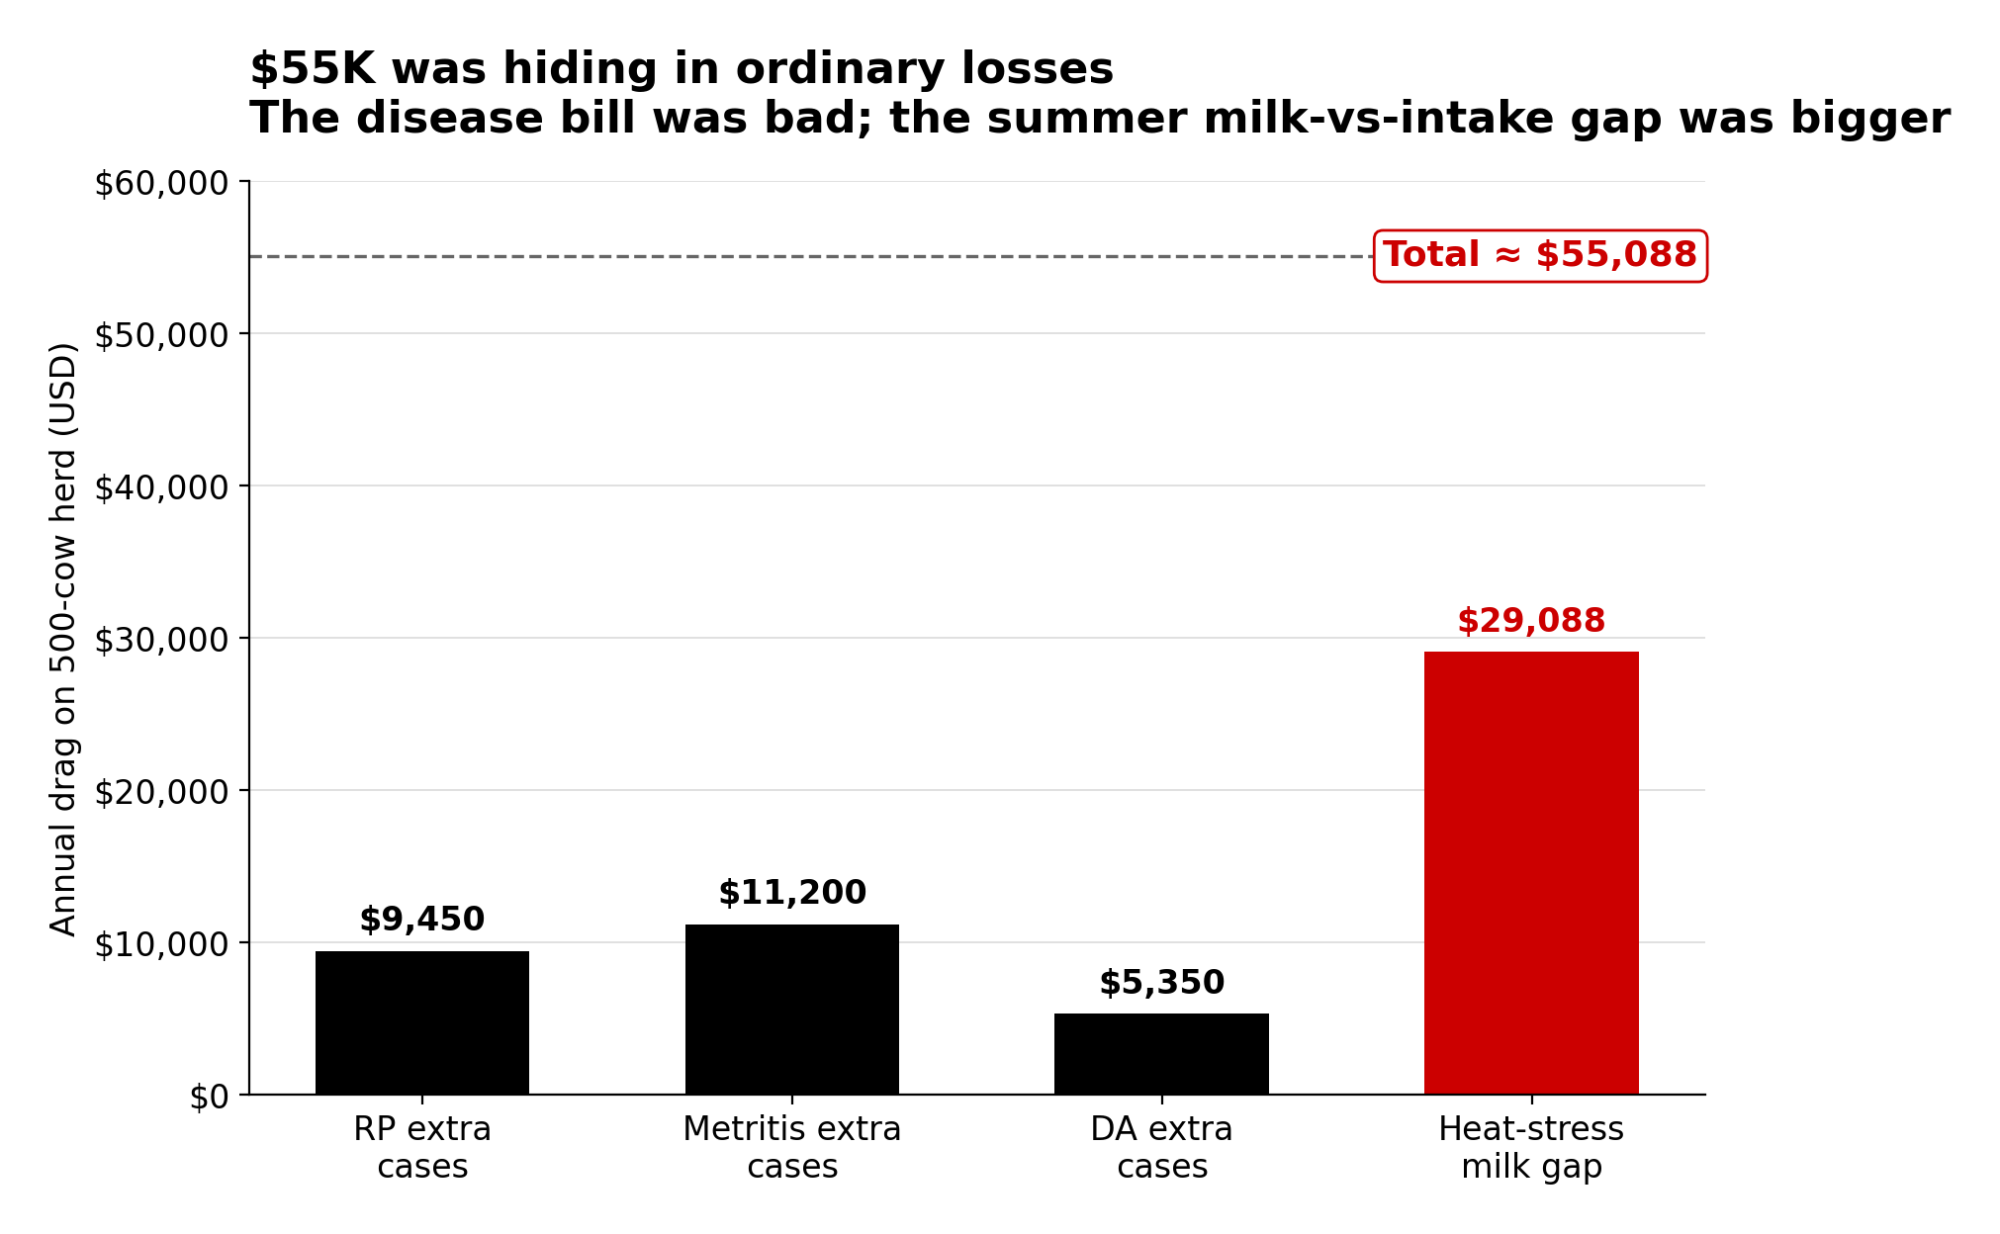
Once the team accepted they had an inflammation problem, the next step was the kind of barn math any 500‑cow herd can run. They started by writing the actual numbers on the whiteboard. Retained placentas were running roughly 12%of calvings against a target near 5%. Metritis sat in the 16–18% range against a 10% target. DAs were holding at 4–5%against a target closer to 3%. Summer milk loss hit 7–8 lb/cow/day, and intake drops only explained 3–4 lb of it.
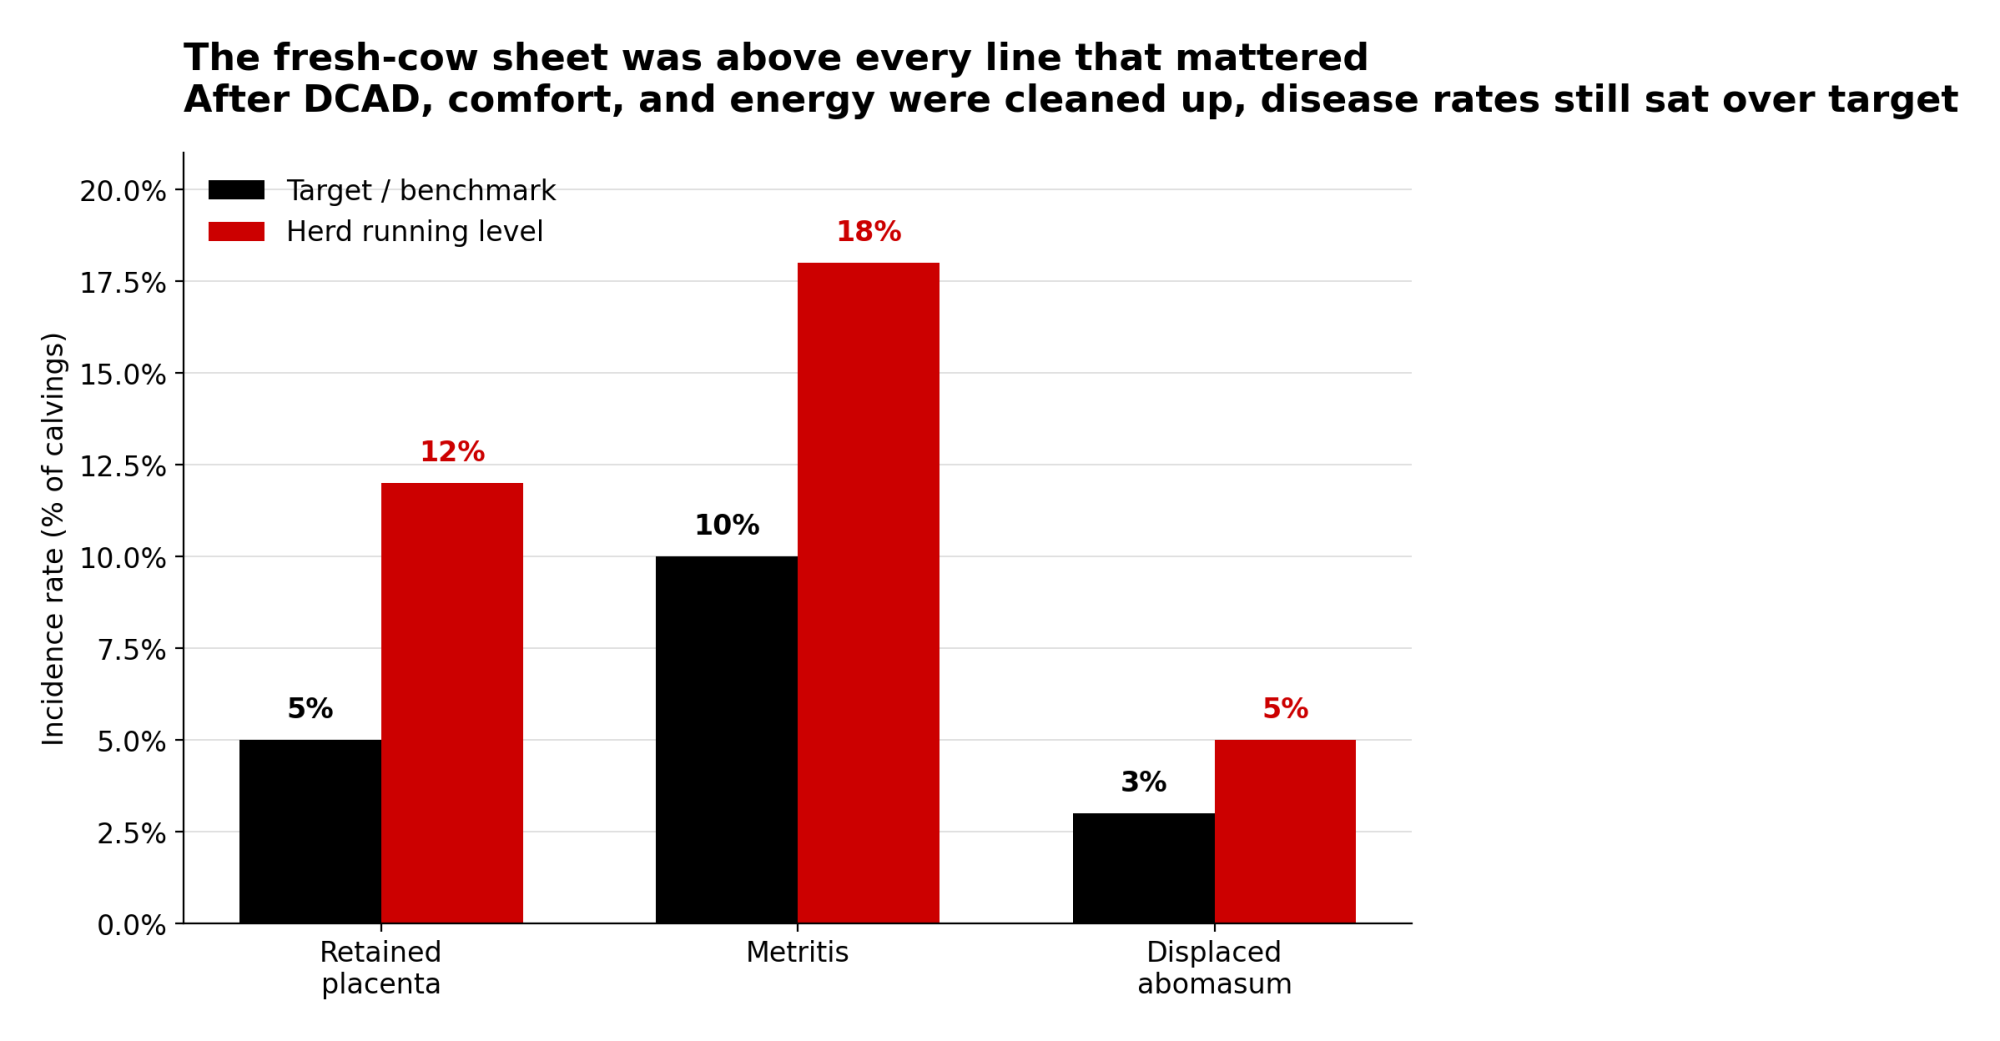
University benchmarks and field experience generally land under 5–8% RP, under 10–15% metritis, and under 3–5% DAs for Holsteins. This herd kept landing on the wrong side of every line — even after fixing the big stuff like DCAD and cow comfort.
Then they ran the disease math. RP at 12% versus a 5% target meant 35 extra cases a year. Metritis at 18% versus 10% meant another 40. DAs at 5% versus 3% meant 10 more. Not laboratory science. A realistic, conservative comparison for a herd doing most things right.
They pulled cost‑per‑case ranges from extension and economic summaries. RP runs about $150–$389/case. Metritis lands at $171–$386/case. DAs come in at $432–$639/case. Using mid‑range values: 35 × ~$270 ≈ $9,450. Forty × ~$280 ≈ $11,200. And 10 × ~$535 ≈ $5,350.
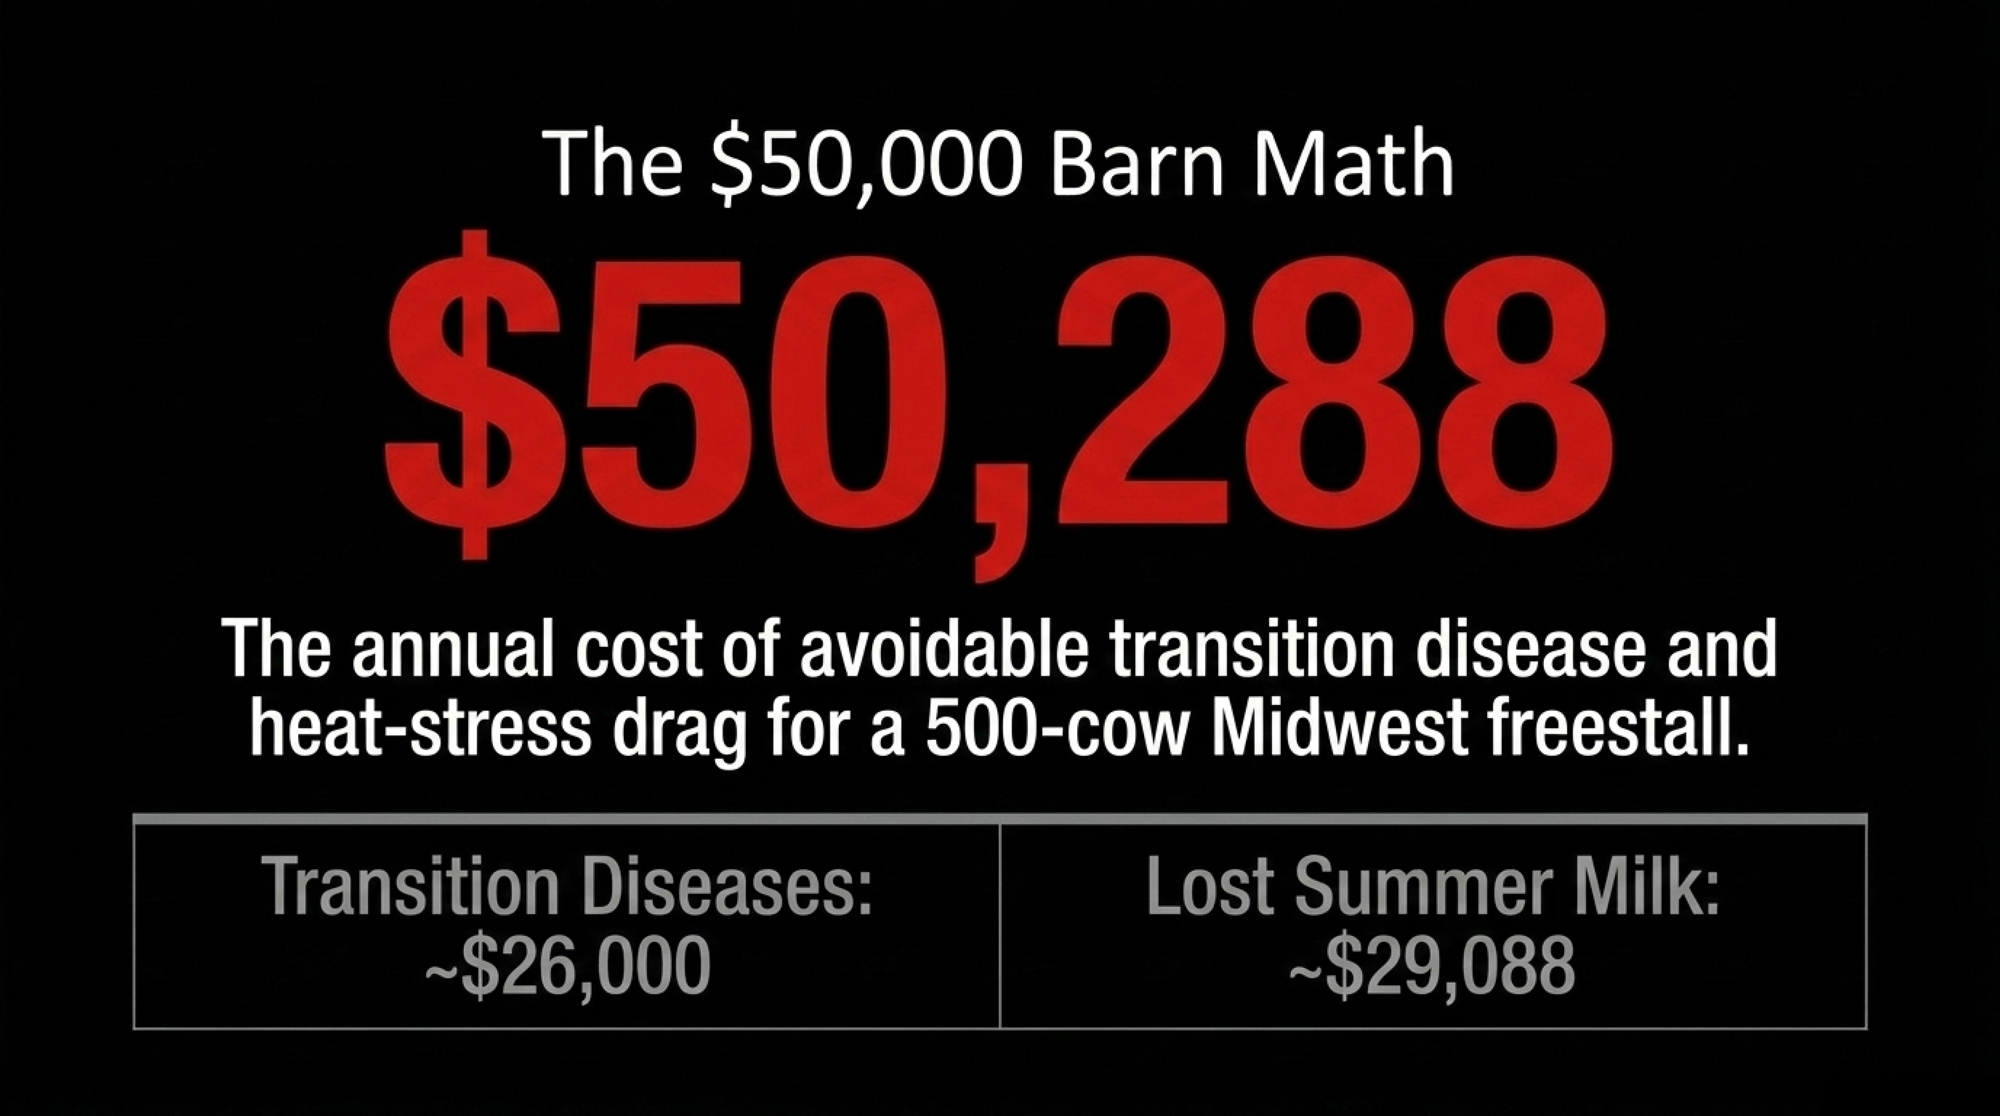
That’s roughly $26,000 a year in “above‑benchmark” transition disease cost without one clinical train wreck in the bunch. Worth keeping on the wall as a caveat: these are mid‑range cost‑per‑case values; actual herd costs vary with labor, lost milk, and culling assumptions.
Then they looked at heat stress. With 8 lb/cow/day of summer milk loss and intake explaining only 3–4 lb, that left a 4 lb “inflammation gap.” Over a 90‑day heat season, 4 lb × 500 cows × 90 days = 180,000 lb of milk. At a Class III milk price near $16.16/cwt — the figure carried through this thread for the March 2026 reference period — the math runs 180,000 ÷ 100 × $16.16 ≈ $29,088 in unexplained lost revenue. Run the same calculation against your current Class III or mailbox price before any decision; the dollar figure moves with the market, but the structural gap doesn’t.
Stack the two pieces and this 500‑cow herd was comfortably over $50,000 a year in avoidable transition disease and heat‑stress drag. Nobody at the table believed omega‑3 alone would erase that. Suddenly there was a big enough pot of money to justify checking whether their omega‑3 dollars were actually making it into cows.
“Cheap” Calcium Salts vs Real Omega‑3 Delivery: The Barn‑Math Flip
The farm wasn’t ready to throw calcium salts out of the ration. Palmitic‑based Ca‑salts still gave them the cheapest calories per pound of dry matter. But it was getting obvious they’d been expecting Ca‑salts to do a job they weren’t designed to do. The nutritionist drew up a comparison on the office whiteboard, using current commercial price ranges as the working assumption.
For the comparison, assume Product A is a calcium salt with fish oil at 250 g/kg EPA+DHA on the label, priced in the low single digits per kilogram. Product B is a verified bypass omega‑3 at the same 250 g/kg label claim, priced at roughly twice that. The ratio fits commonly observed price gaps but should be checked against your own supplier quotes before any commitment. Rumen data suggest roughly 80% of EPA and DHA are hydrogenated in Ca‑salt fish oil systems, leaving about 20% survival. The bypass technology is designed to protect EPA and DHA themselves; trials reported roughly 80% rumen bypass in protected forms.
| Metric | Product A — Ca‑Salt + Fish Oil | Product B — Verified Bypass |
| Label claim EPA+DHA | 250 g/kg | 250 g/kg |
| Working price assumption | ~1× (low single digits/kg) | ~2× Product A |
| Rumen survival of EPA+DHA | ~20% | ~80% |
| EPA+DHA delivered per kg fed | ~50 g | ~200 g |
| Cost per gram delivered | ~$0.06 | ~$0.03 |
| kg/cow/day to deliver 10 g EPA+DHA past rumen | ~0.20 kg | ~0.05 kg |
| Relative $/cow/day at that delivered target | ~2× | ~1× |
Cost‑per‑gram figures use a notional $3/kg for Product A and $6/kg for Product B to illustrate the 1×–2× price ratio described above. The ratio is what matters; replace with your own current supplier quotes before any commitment.
On the price assumptions above, the bypass product cost about half as much per cow per day to hit the same delivered EPA+DHA target. That changed the conversation from “bypass is too expensive” to “we’re paying more per gram of EPA/DHA delivered with this approach than we realized.” Calcium salts stayed in the ration for energy. The omega‑3 job moved.
Why They Started Treating EPA and DHA Like Methionine
This dairy was already paying for RP‑Met because they believed the biology. Methionine supports phosphatidylcholine and VLDL export from the liver, antioxidant systems like glutathione, and protein synthesis when cows are deep in negative energy balance. Let the rumen torch most of it and the cow pays for it later in early lactation.
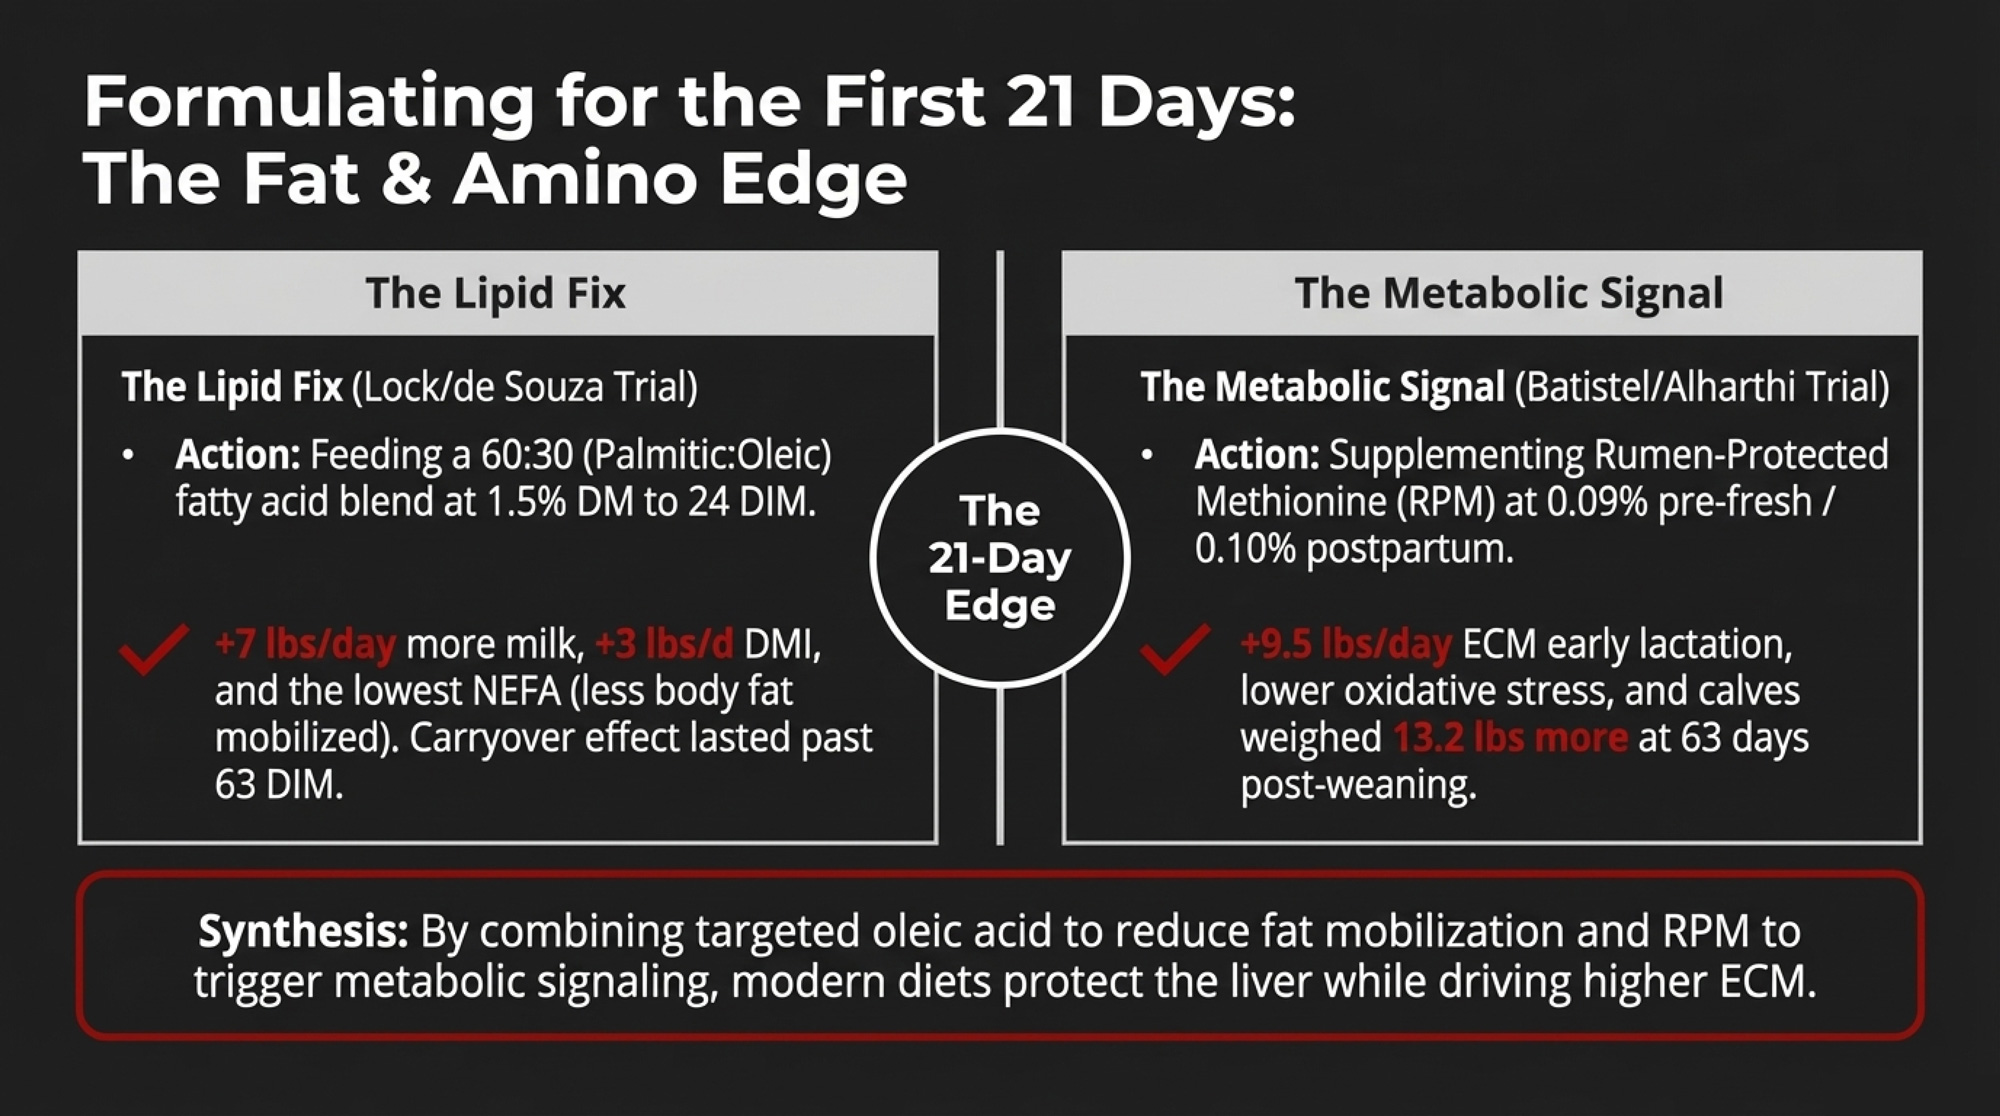
EPA and DHA work a different but complementary side of the transition problem. EPA competes with arachidonic acid at COX and LOX enzymes, capping how hot and how long inflammatory peaks run. DHA is the precursor for resolvins, protectins, and maresins — molecules that actively shut inflammation down and promote tissue repair.
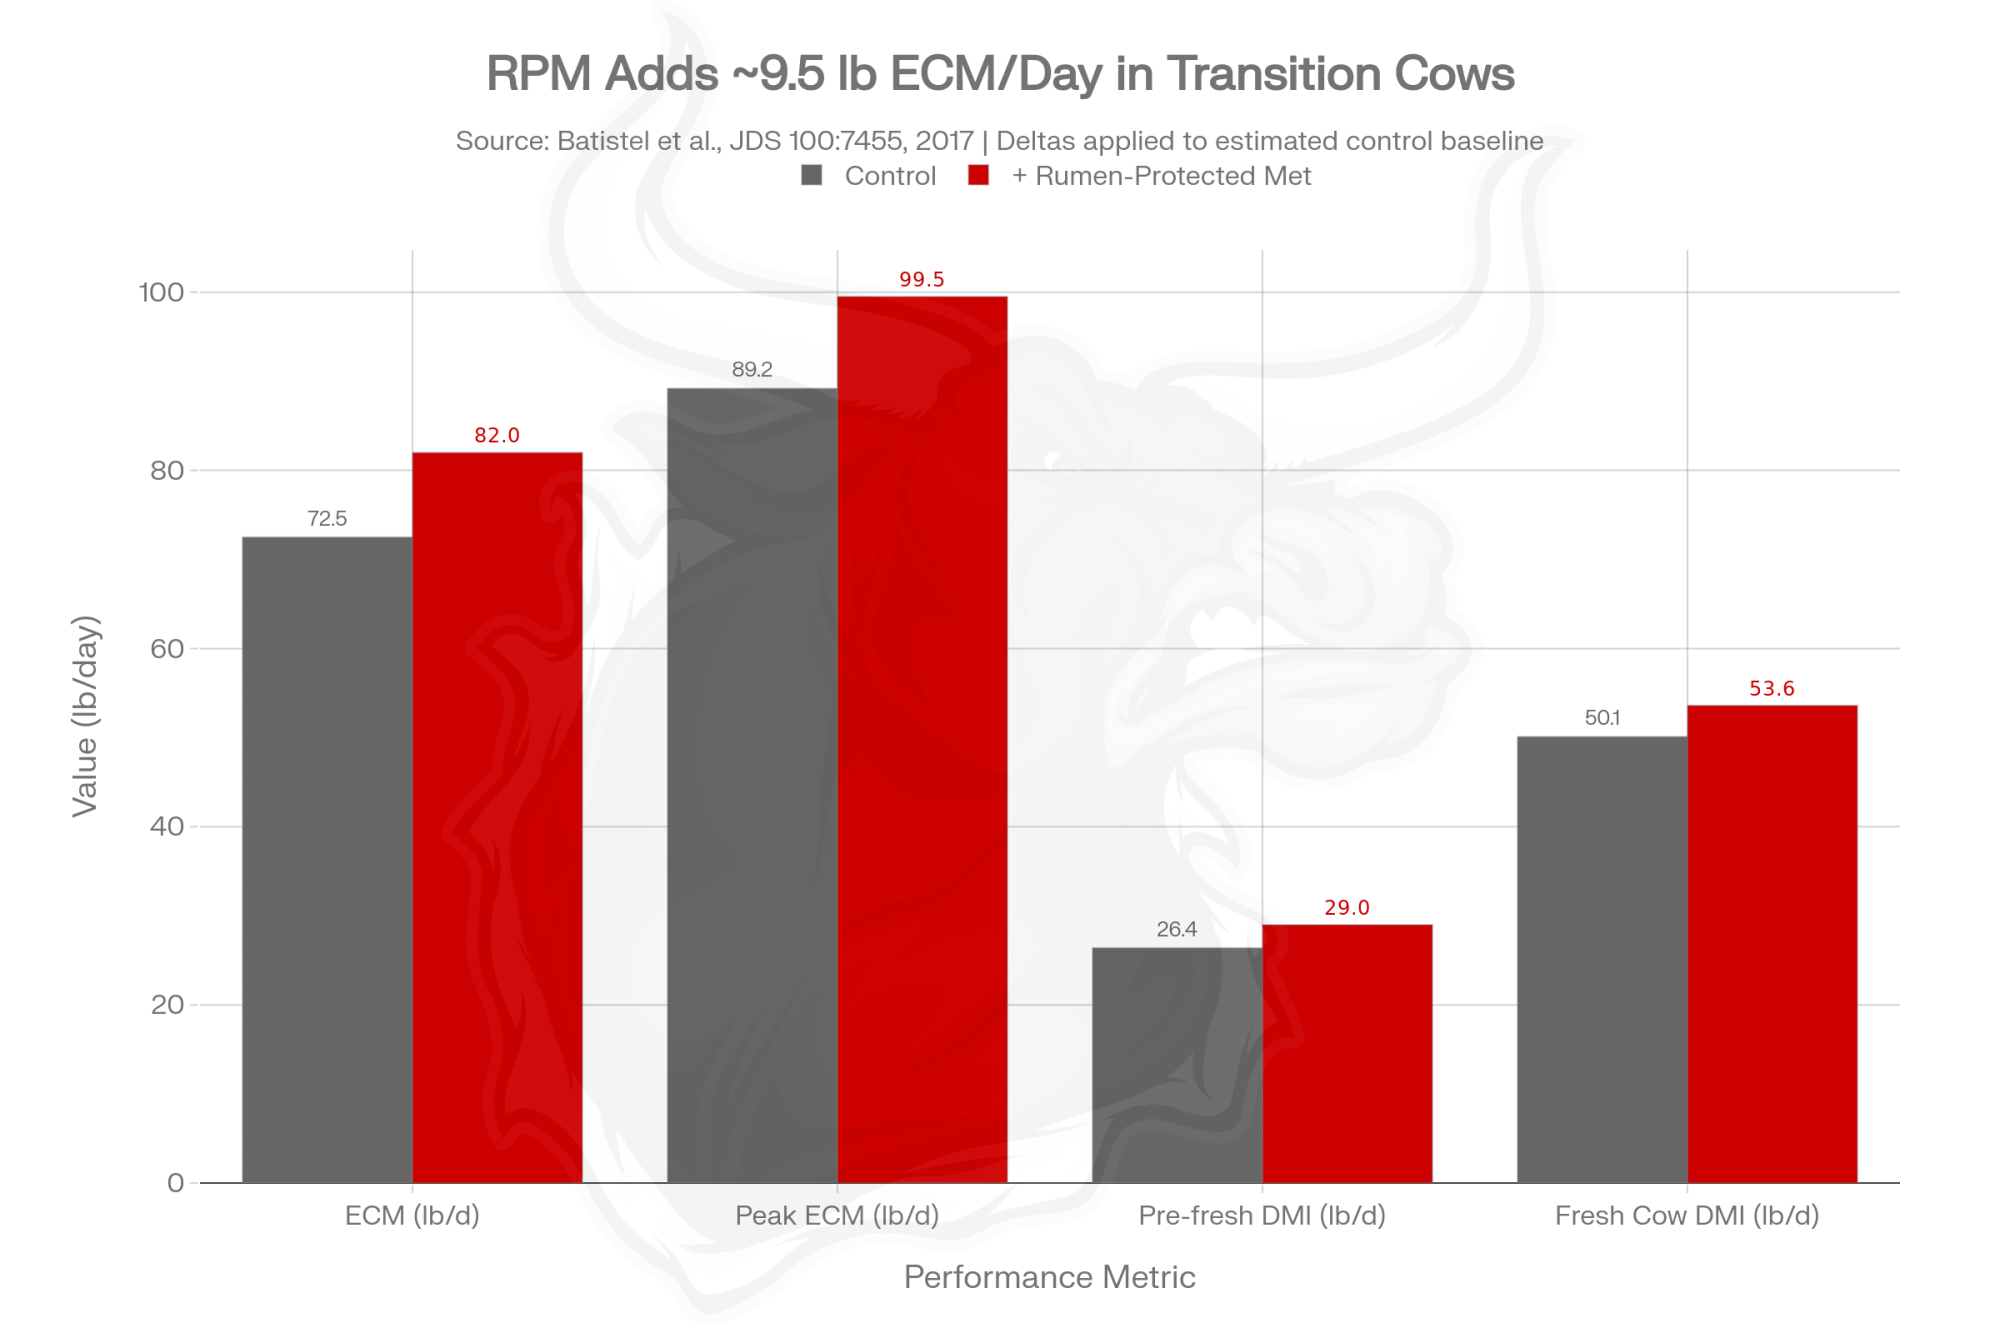
Work from Joseph McFadden’s lab at Cornell, with co‑supplementation findings reported in the Journal of Dairy Science, shows that when cows get both bypass EPA+DHA and rumen‑protected methionine, the story changes. Liver Functionality Index improves. Energy‑corrected milk goes up versus cows missing one or both. Reproductive performance within roughly 150 DIM tracks better in supplemented groups. Specific volume and issue numbers for the McFadden JDS co‑supplementation paper will be added at copy‑edit once the citation is pulled from the lab’s publication list.
For this herd, that was the last puzzle piece. Their methionine program was doing its job. Without enough EPA and DHA actually reaching tissues, the immune system was burning glucose longer than needed and the liver was fighting a bigger inflammatory load than it should — especially in older cows.
According to project communications from Australia’s Dairy UP program, lipidomic work led by researcher David Sheedy and colleagues drew on roughly two thousand blood samples from a cross‑section of commercial herds and tracked phospholipid fatty acids against health outcomes. The exact published sample frame and herd count will be reconciled with the Dairy UP source document at copy‑edit. Herds and cows with higher omega‑3‑rich lipid species tended toward better health and longevity. As cows moved into later parities, omega‑3 status dropped and risk of leaving the herd climbed. Not a controlled product trial. But it fit what this farm kept seeing: third‑ and fourth‑lactation cows were the ones that “didn’t bounce back” after calving or summer.
Options and Trade‑Offs for Farmers
Most dairies don’t need to copy this herd‘s ration to steal their decision process. The useful part is the framework, and there are several honest paths through it depending on your scale, labor, and risk tolerance.
Path 1 — Run the supplier audit first (30‑day action; works for any herd). Before you change a single pound of the ration, ask every “omega‑3” supplier this question: Show me in‑vivo rumen bypass or biohydrogenation data for EPA and DHA — not total fat or total PUFA — at the inclusion rate we’re feeding. If they can answer with real numbers, you’ve learned something useful. If they can’t, you’ve also learned something useful. Where it shines: zero ration risk, zero capital cost, immediate clarity on what you’re actually buying. Where it hurts: you might find out your favorite product can’t back up the line on the tag, and that’s an uncomfortable conversation.
Path 2 — Keep Ca‑salts for energy, move the omega‑3 job (most common). Palmitic‑based calcium salts still belong in high‑energy rations; nobody is arguing that. The flip is putting the EPA/DHA inflammation job on a product designed specifically for omega‑3 bypass, and feeding it where it pays — close‑up and the first 40–60 DIM, plus the heat‑stress window. Where it shines: lets you keep your cheapest energy source while finally putting real EPA/DHA into tissues. Where it hurts: higher per‑kg sticker on the bypass omega‑3 product even when the cost‑per‑gram‑delivered math goes the other way; expect pushback at first quote.
Path 3 — Run a paired on‑farm trial (90‑day action). Work with your nutritionist to compare a transition pen on calcium‑salt omega‑3 against a transition pen on documented‑bypass EPA/DHA. Track RP, metritis, DAs, early milk, and summer milk vs intake. Where it shines: turns a vendor argument into your own data. Where it hurts: requires real recordkeeping discipline, and small herds may not generate enough fresh cows in 90 days to make the numbers move convincingly.
Path 4 — Wait and watch the Ca‑salt category innovation. Some calcium salt manufacturers are working on improved omega‑3 protection chemistry. If your fresh‑cow numbers are already at benchmark and your summer milk loss is fully explained by intake drop, sitting tight while the category catches up is a defensible call. Where it shines:no change cost. Where it hurts: every summer and every transition cycle you’re above benchmark is real money walking off the farm — and “we’re already at benchmark” is a higher bar than most herds clear honestly.
The forward‑looking signal worth watching across all four paths: peer‑reviewed in‑vivo bypass data on calcium‑salt fish‑oil reformulations. If the gap closes, the math in Path 2 changes. Until it does, the gap is the gap.
What This Means for Your Operation
- Apply your methionine standard to your fat bin. If your nutritionist demands in‑vivo bypass numbers on RP‑Met, they should be demanding the same on any product carrying EPA and DHA on the tag. One conversation, this month.
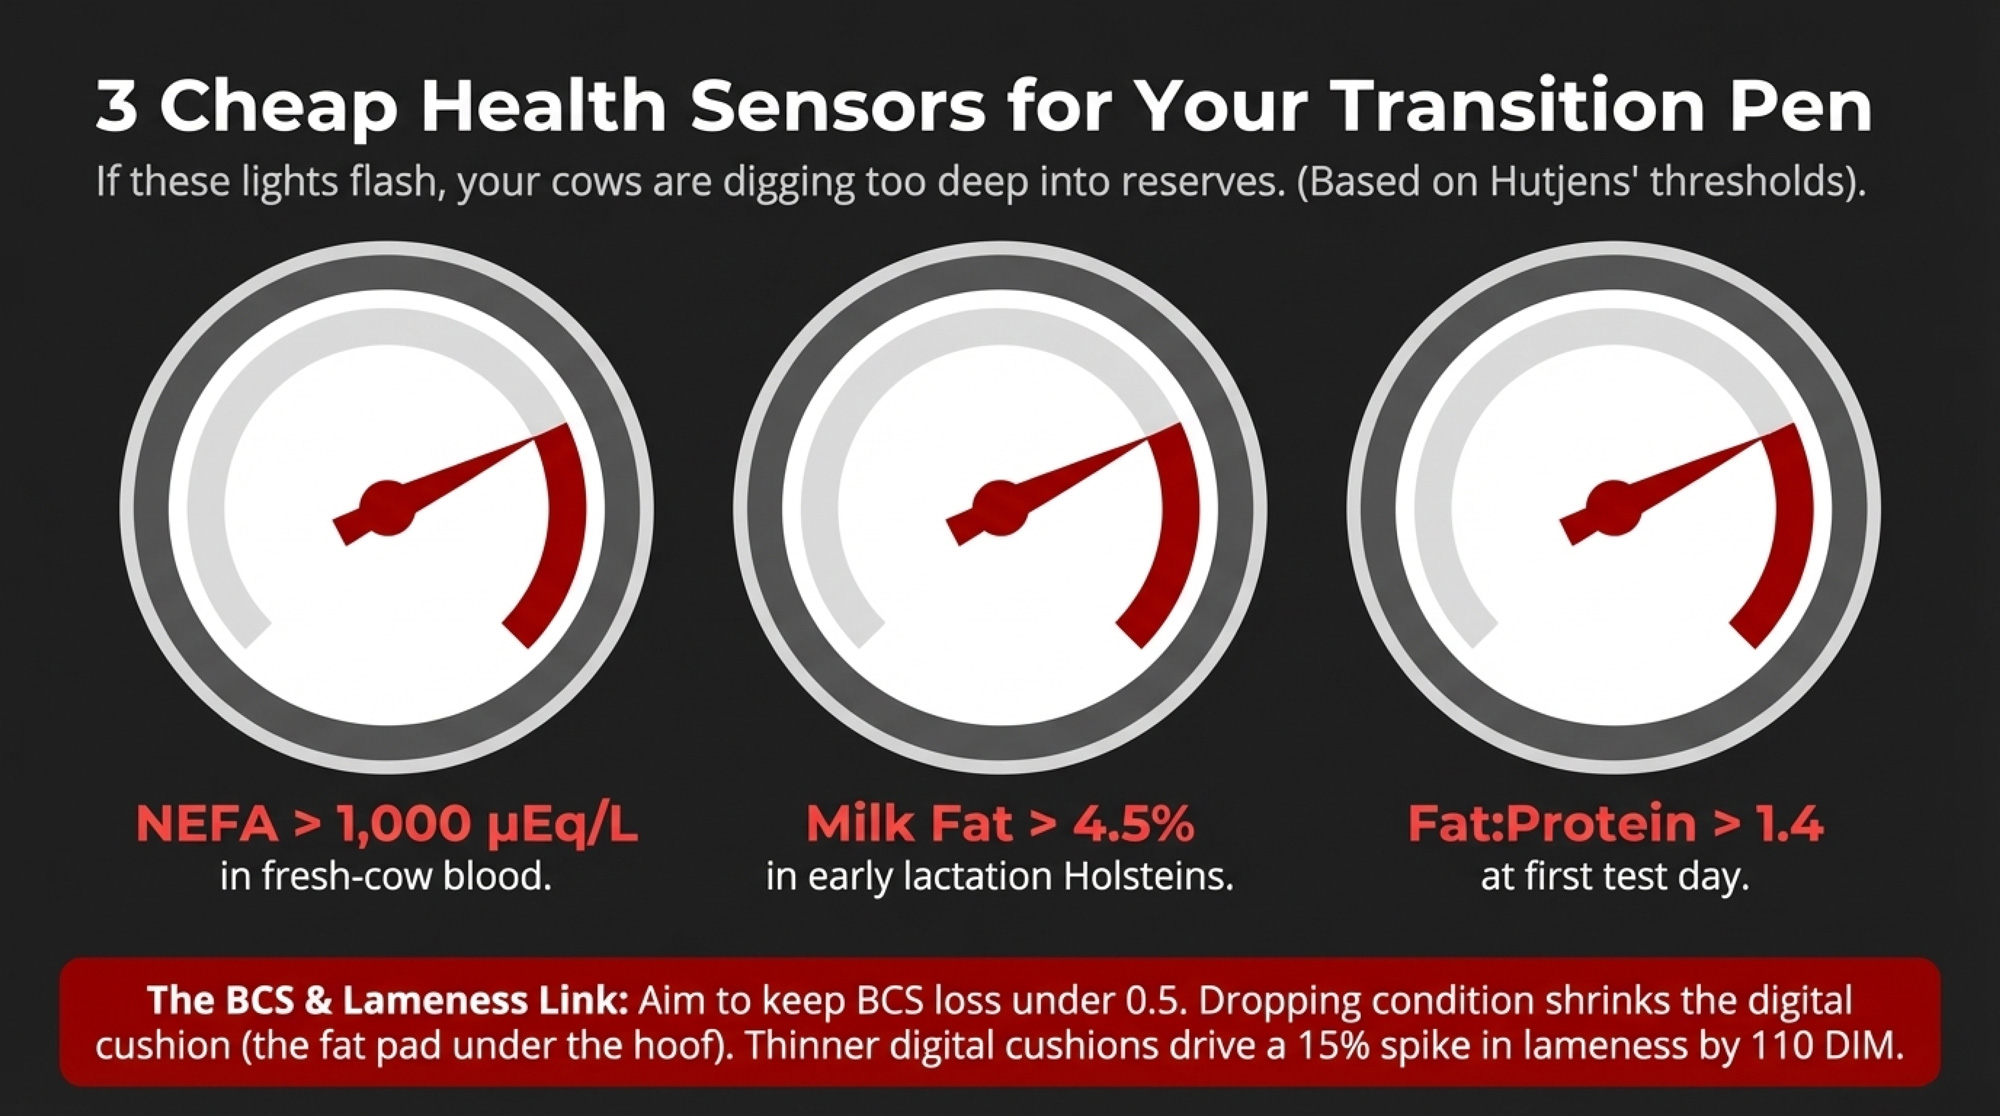
- Read your fresh‑cow sheet for inflammation, not just energy. RP stuck above 8%, metritis above 15%, or DAs above 5% after DCAD, energy, and cow comfort are clean is a different problem than most herds are diagnosing.
- Pull last summer’s milk and intake graphs side by side. If milk fell faster than intake — by 3 lb/cow/day or more — quantify the gap before next heat season. That’s your “inflammation bill” in real numbers, on your milk price.
- Audit suppliers before you audit the ration. The 30‑day question — “show me in‑vivo EPA and DHA bypass data at our inclusion rate” — costs nothing and changes the buying conversation immediately.
- Watch parity 3+ specifically. If your culls and transition wrecks cluster in older cows, treat that as an omega‑3 status flag, not a “those cows just got old” excuse. Dairy UP lipidomic work points the same direction.
- Don’t throw the Ca‑salts out. Palmitic‑based calcium salts still earn their slot for energy. The job that moves is the EPA/DHA inflammation job — not the calorie job.
- Keep watching Ca‑salt reformulations. If peer‑reviewed in‑vivo bypass data on next‑generation Ca‑salt fish oil ever closes the gap, the math in Path 2 changes. Until then, plan on the gap being real.
Key Takeaways
- If you wouldn’t buy rumen‑protected methionine without in‑vivo bypass data, don’t let any product call itself your omega‑3 strategy unless it has in‑vivo EPA and DHA bypass numbers at the rate you feed.
- If RP is stuck above 8%, metritis above 15%, or DAs above 5% even after fixing DCAD, energy, and cow comfort, you’re probably treating symptoms of unresolved inflammation rather than the nutritional gap that helps resolve it.
- If summer milk regularly runs 3–5 lb/cow/day below what your intake drop predicts, you’re paying a real “inflammation gap” bill — and heat‑stress trials suggest verified bypass EPA/DHA can claw back roughly 4 lb of that in the right setups.
- Calcium salts of palm fats still belong in high‑energy rations. For inflammation‑focused EPA and DHA delivery, the evidence reviewed here suggests omega‑3‑specific bypass technologies deliver more EPA/DHA per dollar than fish‑oil calcium salts.
- If third‑ and fourth‑lactation cows are over‑represented in your transition wrecks or early culls, treat that pattern as a parity‑driven omega‑3 status flag — not a “those cows just got old” excuse.
This 500‑cow Midwest dairy didn’t fix everything in one ration change. They started by holding their fat program to the same standard they were already demanding from their amino acid program — and once they did, the cost of not doing it stopped looking abstract.
Look at your own fresh‑cow sheet and your last summer’s milk graph. Where would the gap have to be on your operation before you’d ask your nutritionist for in‑vivo bypass data on every “omega‑3” line on the tag — and what would it cost you to wait another transition cycle to find out?
Complete references and supporting documentation are available upon request by contacting the editorial team at editor@thebullvine.com.
Learn More
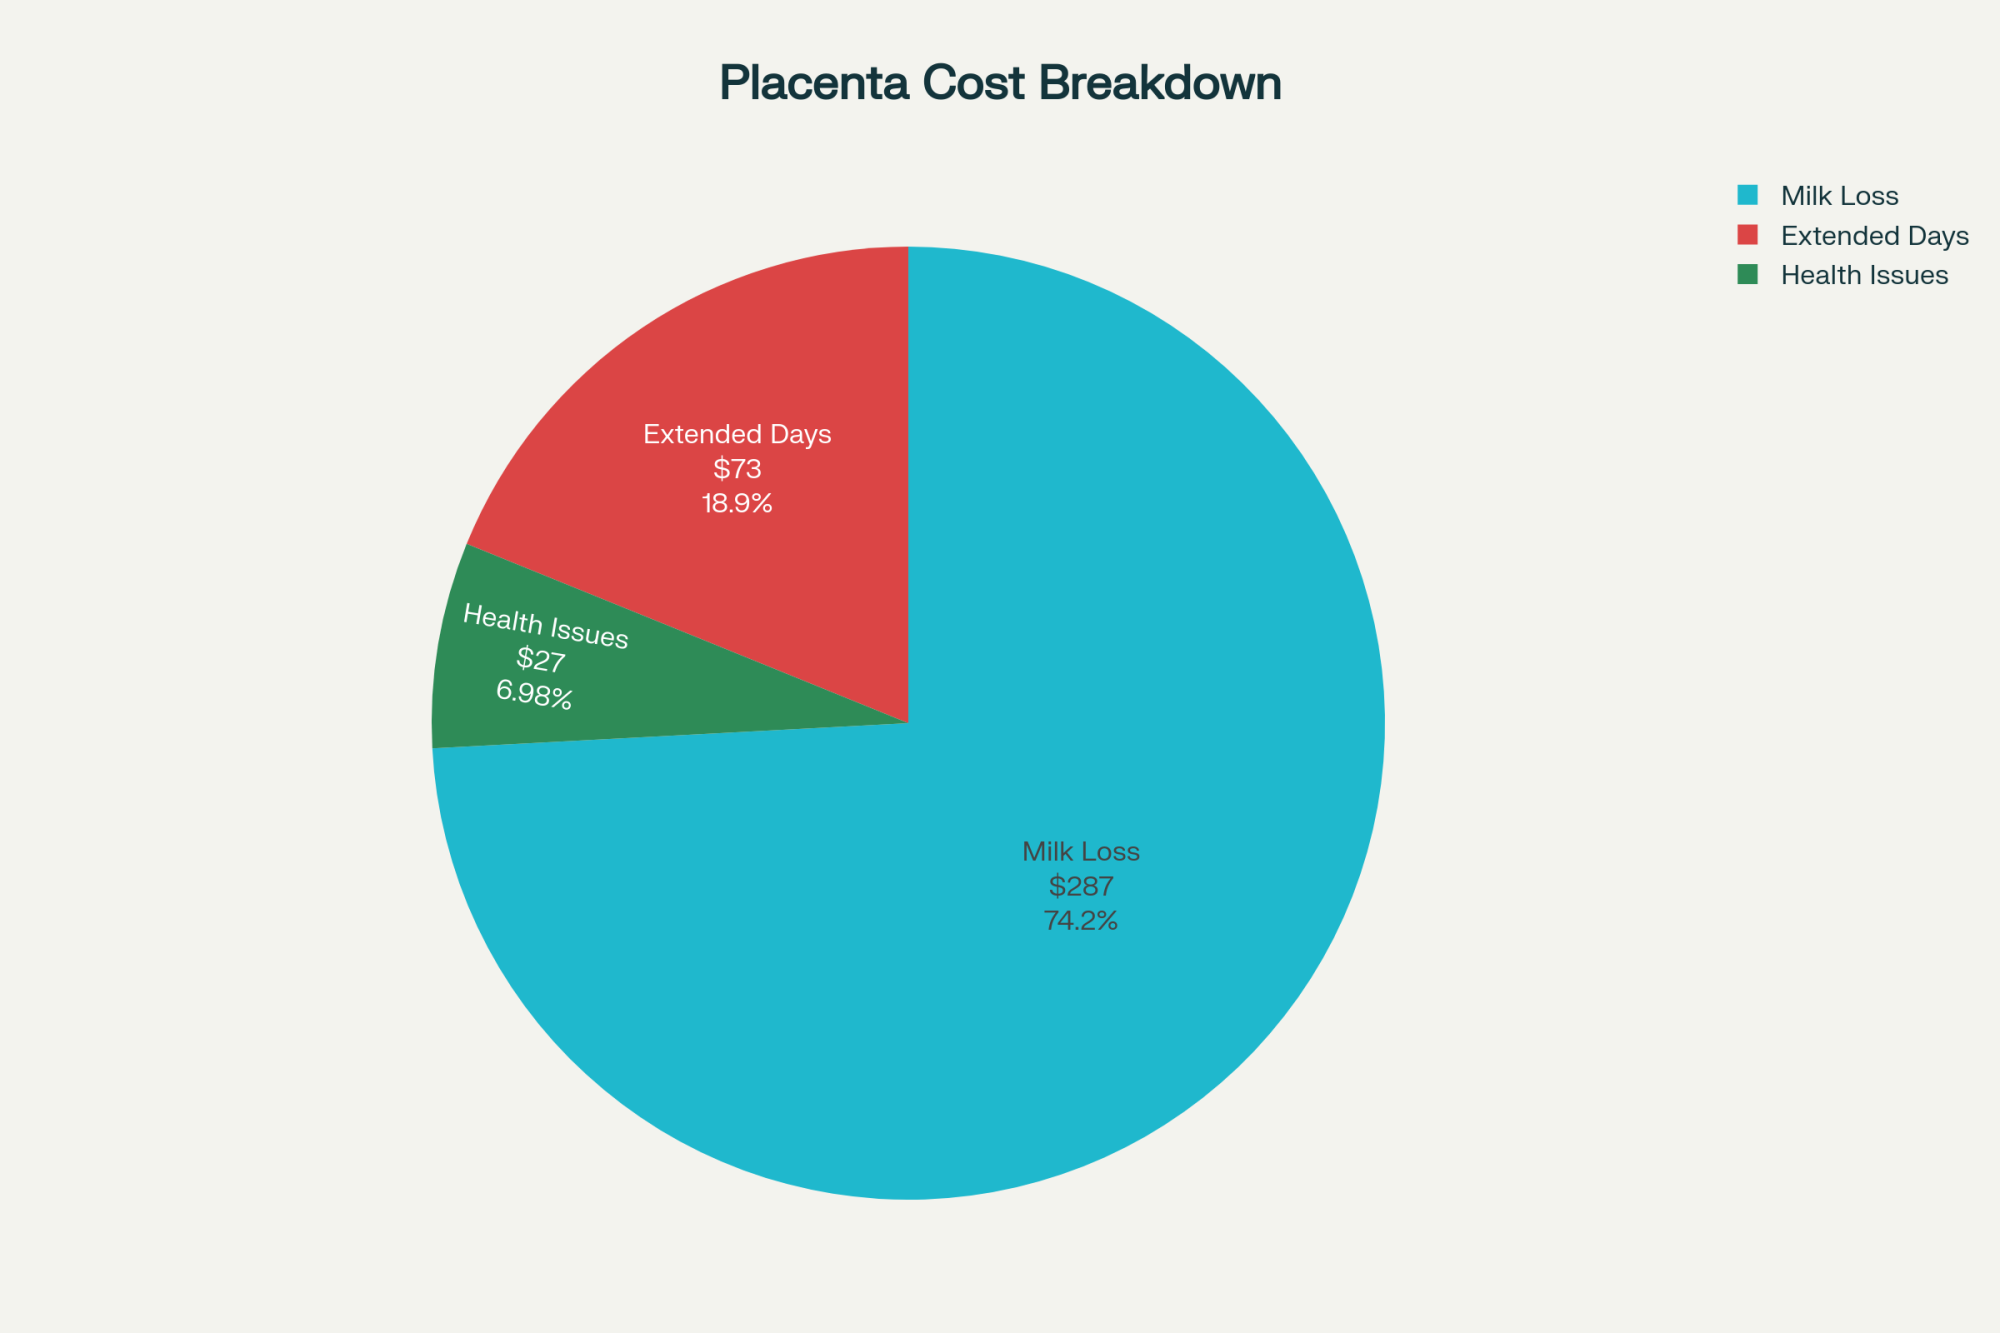
- Retained Placentas Are Costing You $389 Per Case — The Math Most Herds Avoid — Arms you with an actionable operational accounting protocol to quantify the silent economic baseline leak of fresh-cow uterine disorders rather than dismissing them as an unavoidable, fixed cost of milk production.
- The Heat‑Stress Milk You Can’t Blame on Intake — Exposes the hidden metabolic mechanisms behind hot-weather performance slumps, mapping out strategic adjustments to help your herd navigate regional multi-week heat events without suffering extensive physiological margins drop.
- Rumen‑Protected Methionine in Transition: Where the ROI Actually Lives — Delivers a critical benchmark analysis for the transition pen, shifting the decision framework from simple feed expense lines to measurable health improvements, liver functionality indices, and early-lactation peak volume gains.
- Cost‑of‑Disease 2026: What a Single Fresh‑Cow Case Really Runs Now — Follows the money on modern dairy health economics by breaking down hyper-inflated labor, treatment, and culling costs into updated per-case values to protect localized margins from systemic transition failures.
 The Sunday Read Dairy Professionals Don’t Skip.
 The Sunday Read Dairy Professionals Don’t Skip.
Every week, thousands of producers, breeders, and industry insiders open Bullvine Weekly for genetics insights, market shifts, and profit strategies they won’t find anywhere else. One email. Five minutes. Smarter decisions all week.