“Safe” 16% rations are bleeding $52,000/year in soybean meal your cows never needed. Two lines of barn math prove it.
Executive Summary: This feature argues that many Holstein herds are leaking profit on protein because they stick with “safe” 16% crude protein rations instead of managing for protein efficiency. Using a composite 500‑cow herd, it shows that dropping from 16% to 14% CP at 22 kg DMI can save about ,000/year in soybean meal at current futures, while Michigan State modelling ranks feed waste reduction and modest CP cuts as the biggest efficiency movers. Extension data from Wisconsin and Vermont are used to set guardrails, with MUN around 10–11 mg/dL, normal Holstein protein: fat ratios near 0.80, and higher fresh‑cow MP needs defining how far you can push CP without hurting milk or components. The article highlights the rumen as the cheapest protein factory on the farm — microbes can cover most amino acid needs when rumen carbs are 38–40% of DM — and shows where rumen‑protected amino acids actually pay once high groups are over 36 kg/day. It closes with a concrete playbook for the next month: calculate your protein efficiency once, average recent MUN scores, run your own 16% vs 14% barn math with current ingredient prices, check your protein: fat ratio, and treat any amino acid program as a defined IOFC trial rather than a permanent add‑on.
The whiteboard in the office was full.
Dry matter intake, ECM, starch, NDF, and bunk scores from last week’s walk. All the usual suspects that decide whether the month ends in black ink or red.
Then someone asked a question that stopped the room:
“Do we even know our protein efficiency?”
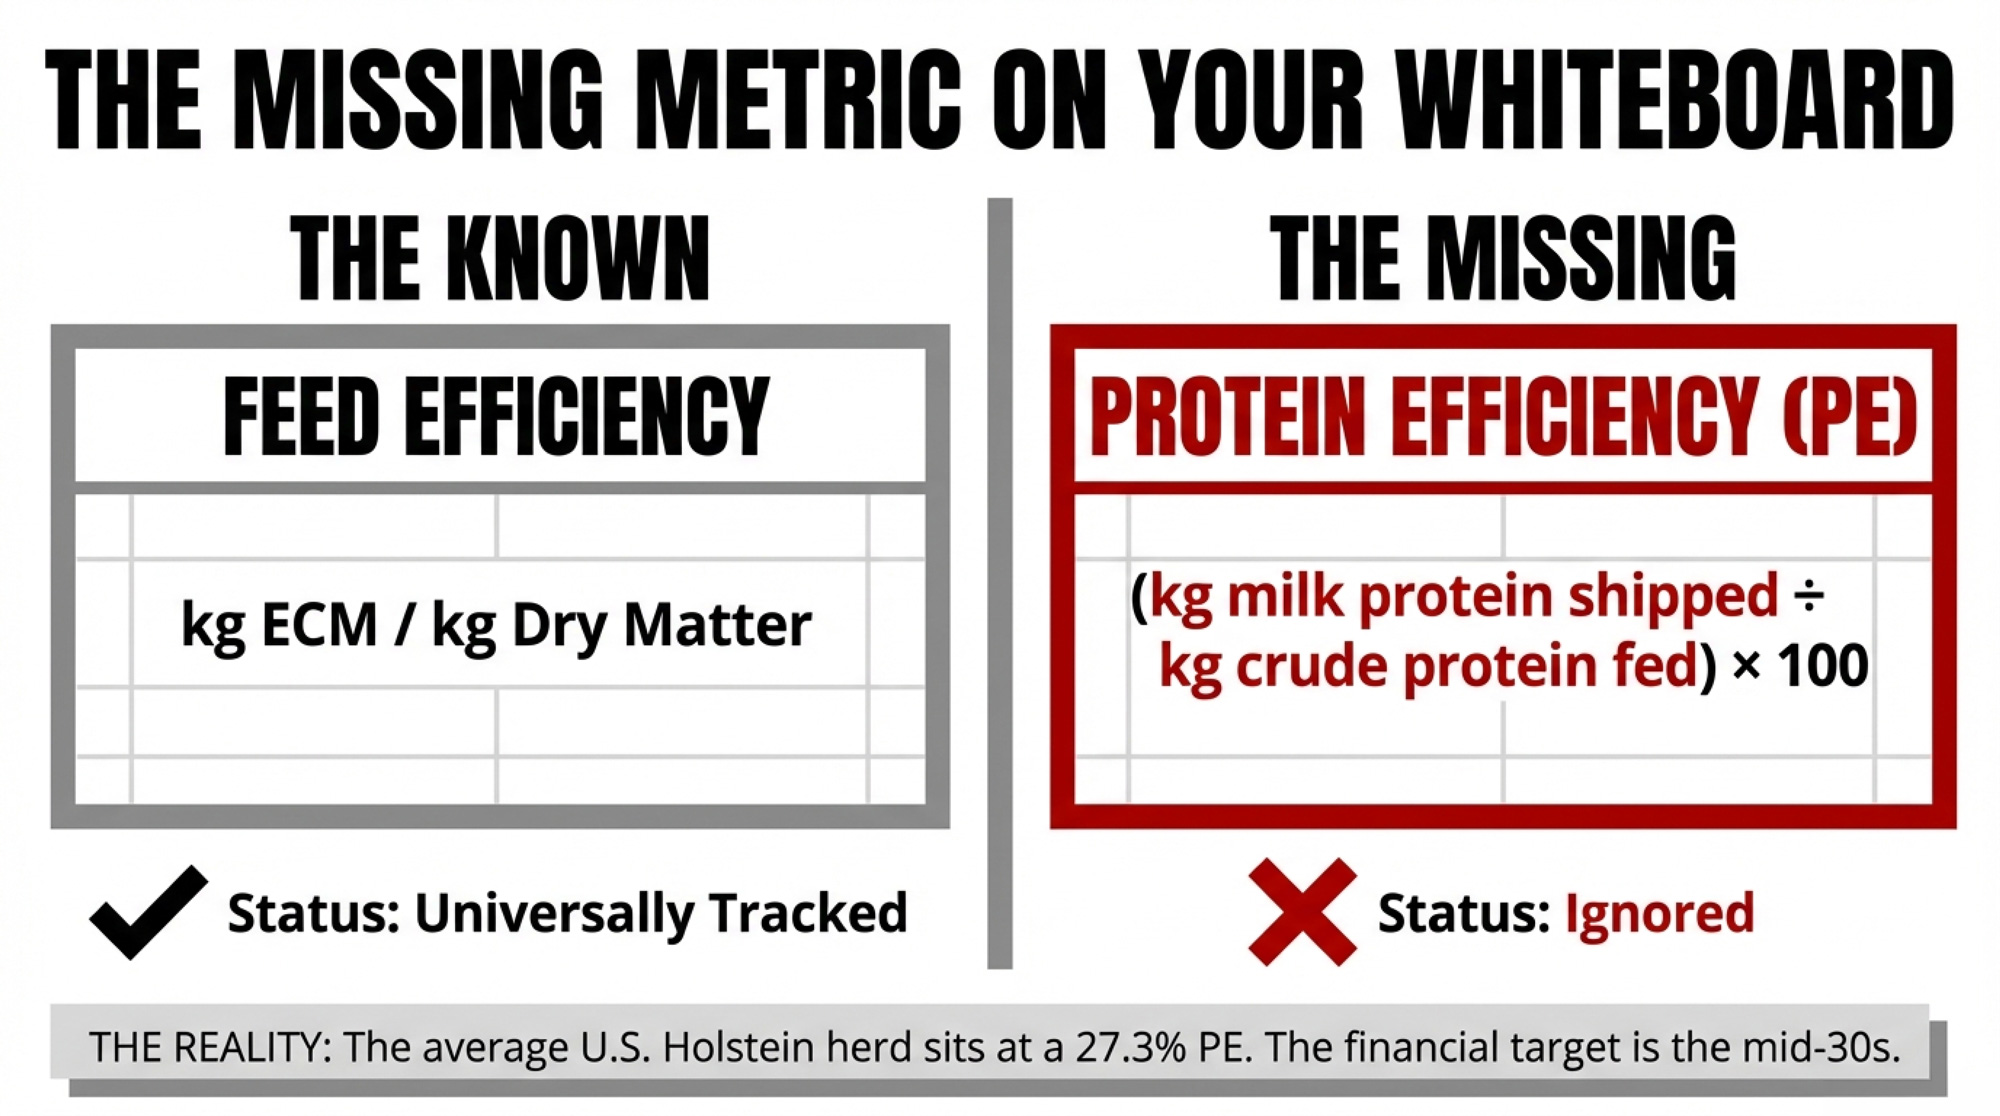
Silence. Lots of numbers on the board. None answering that one. So they grabbed a calculator, pulled the ration sheet and the last milk statement, and did the math. The number that came back was 27.3% protein efficiency — almost exactly where extension work says many U.S. Holstein herds sit today.
That single number changed the whole conversation.
The Protein Efficiency Metric Hiding Beside Feed Efficiency
Feed efficiency has been living on dairy whiteboards for years. Kilograms of ECM per kilogram of dry matter. Milk solids per kilogram of dry matter.
Protein efficiency sits right beside it, but rarely gets tracked:
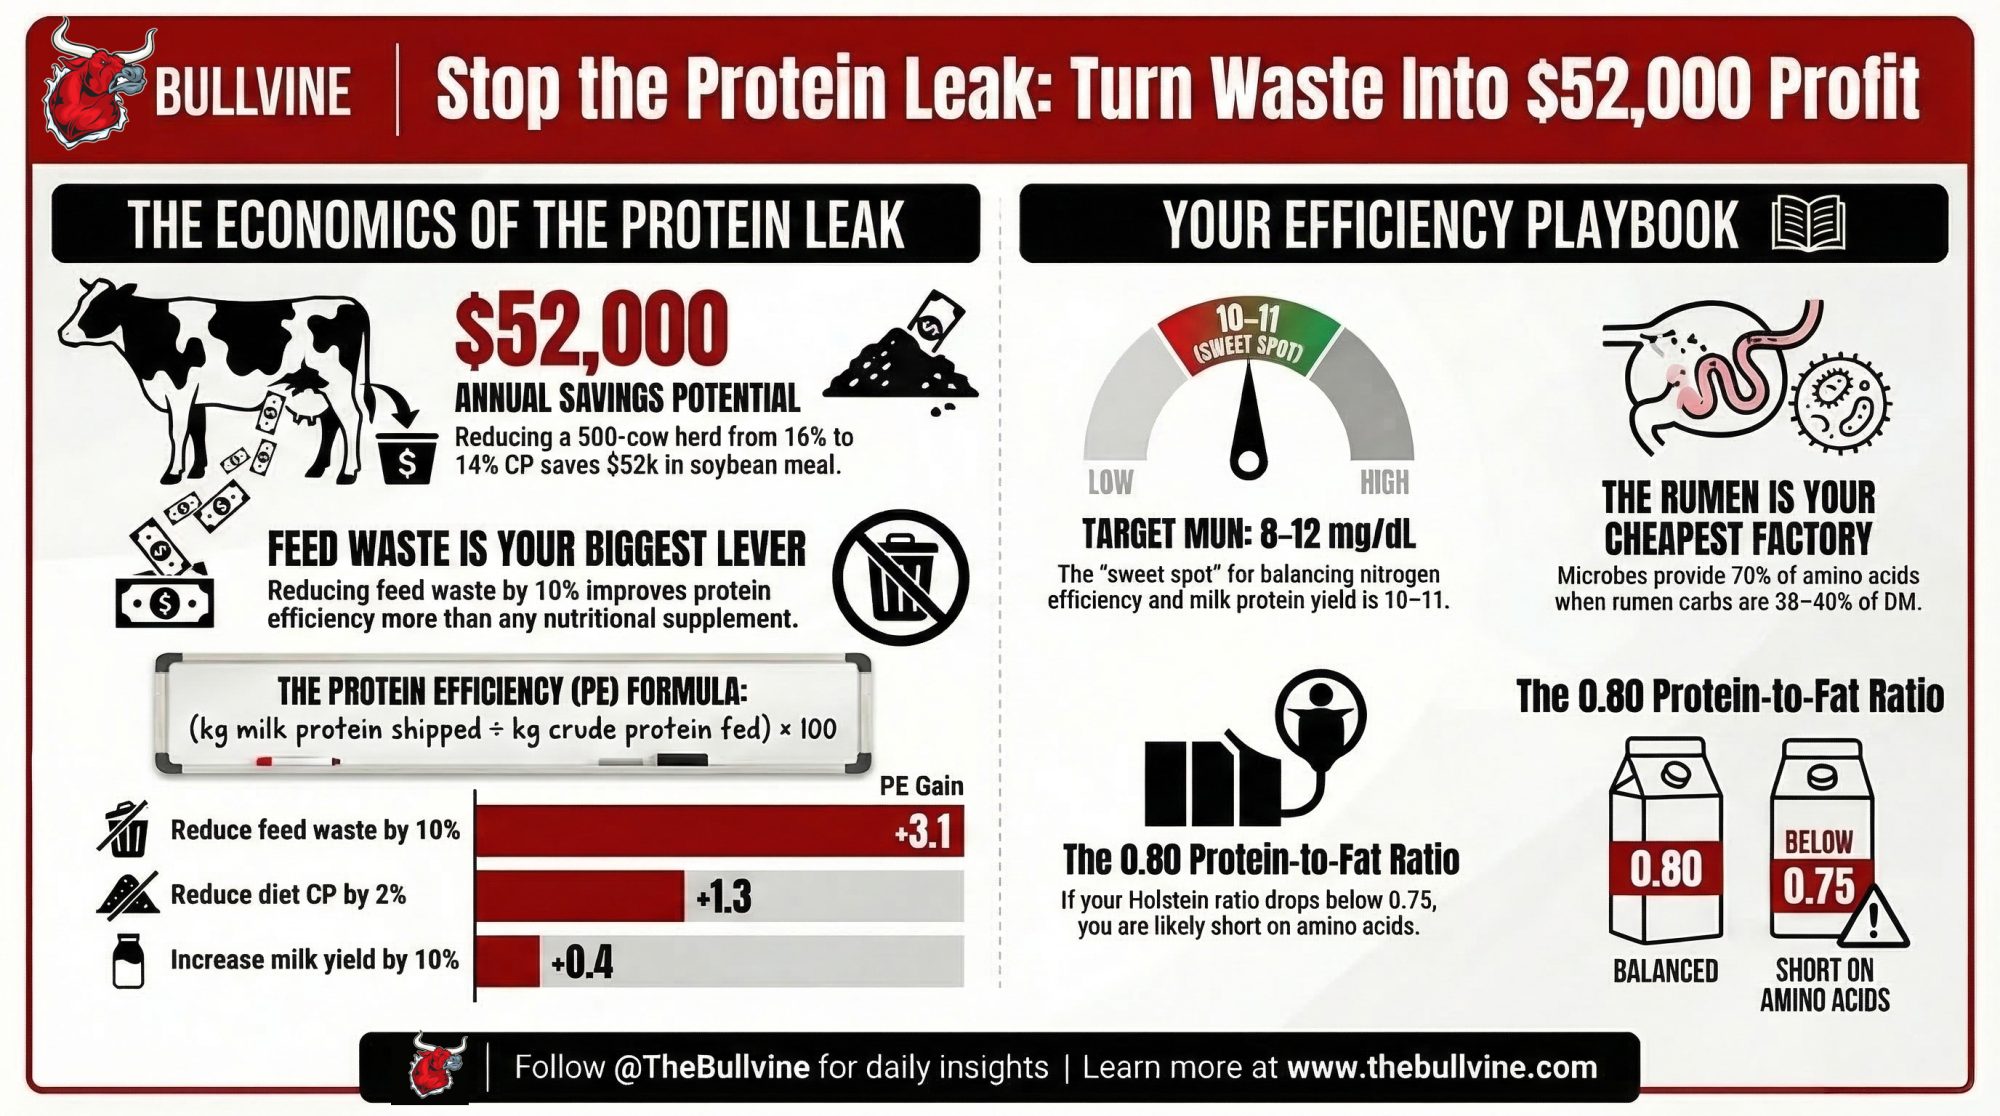
Protein efficiency (%) = (kg milk protein shipped ÷ kg crude protein fed) × 100
Extension examples use three simple scenarios from a typical Midwest Holstein herd to show how fast that number can move:
| Scenario 1 | Scenario 2 | Scenario 3 | |
| DMI, kg/day | 22 | 22 | 22 |
| Crude protein, % | 16 | 14 | 14 |
| CP fed, kg/day | 3.52 | 3.08 | 3.08 |
| Milk, kg/day | 30 | 30 | 33 |
| Milk protein, % | 3.2 | 3.2 | 3.3 |
| Milk protein, kg/day | 0.96 | 0.96 | 1.09 |
| Protein efficiency | 27.3% | 31.2% | 35.4% |
Same cows. Same 22 kg of dry matter.
- Dropping from 16% to 14% crude protein, while still meeting metabolizable protein and amino acid needs, bumps PE from 27.3% to 31.2%.
- Pushing milk from 30 to 33 kg and nudging protein from 3.2% to 3.3% on that same 14% diet takes PE to 35.4%.
Modelling work from Cornell and Michigan State suggests rations approaching 40% PE are possible on paper. The reality in most barns is still high‑20s. That’s the gap this story is about.
Is Feed Waste Really a Bigger Lever Than Protein Products?
Here’s the part the product sheets don’t lead with.
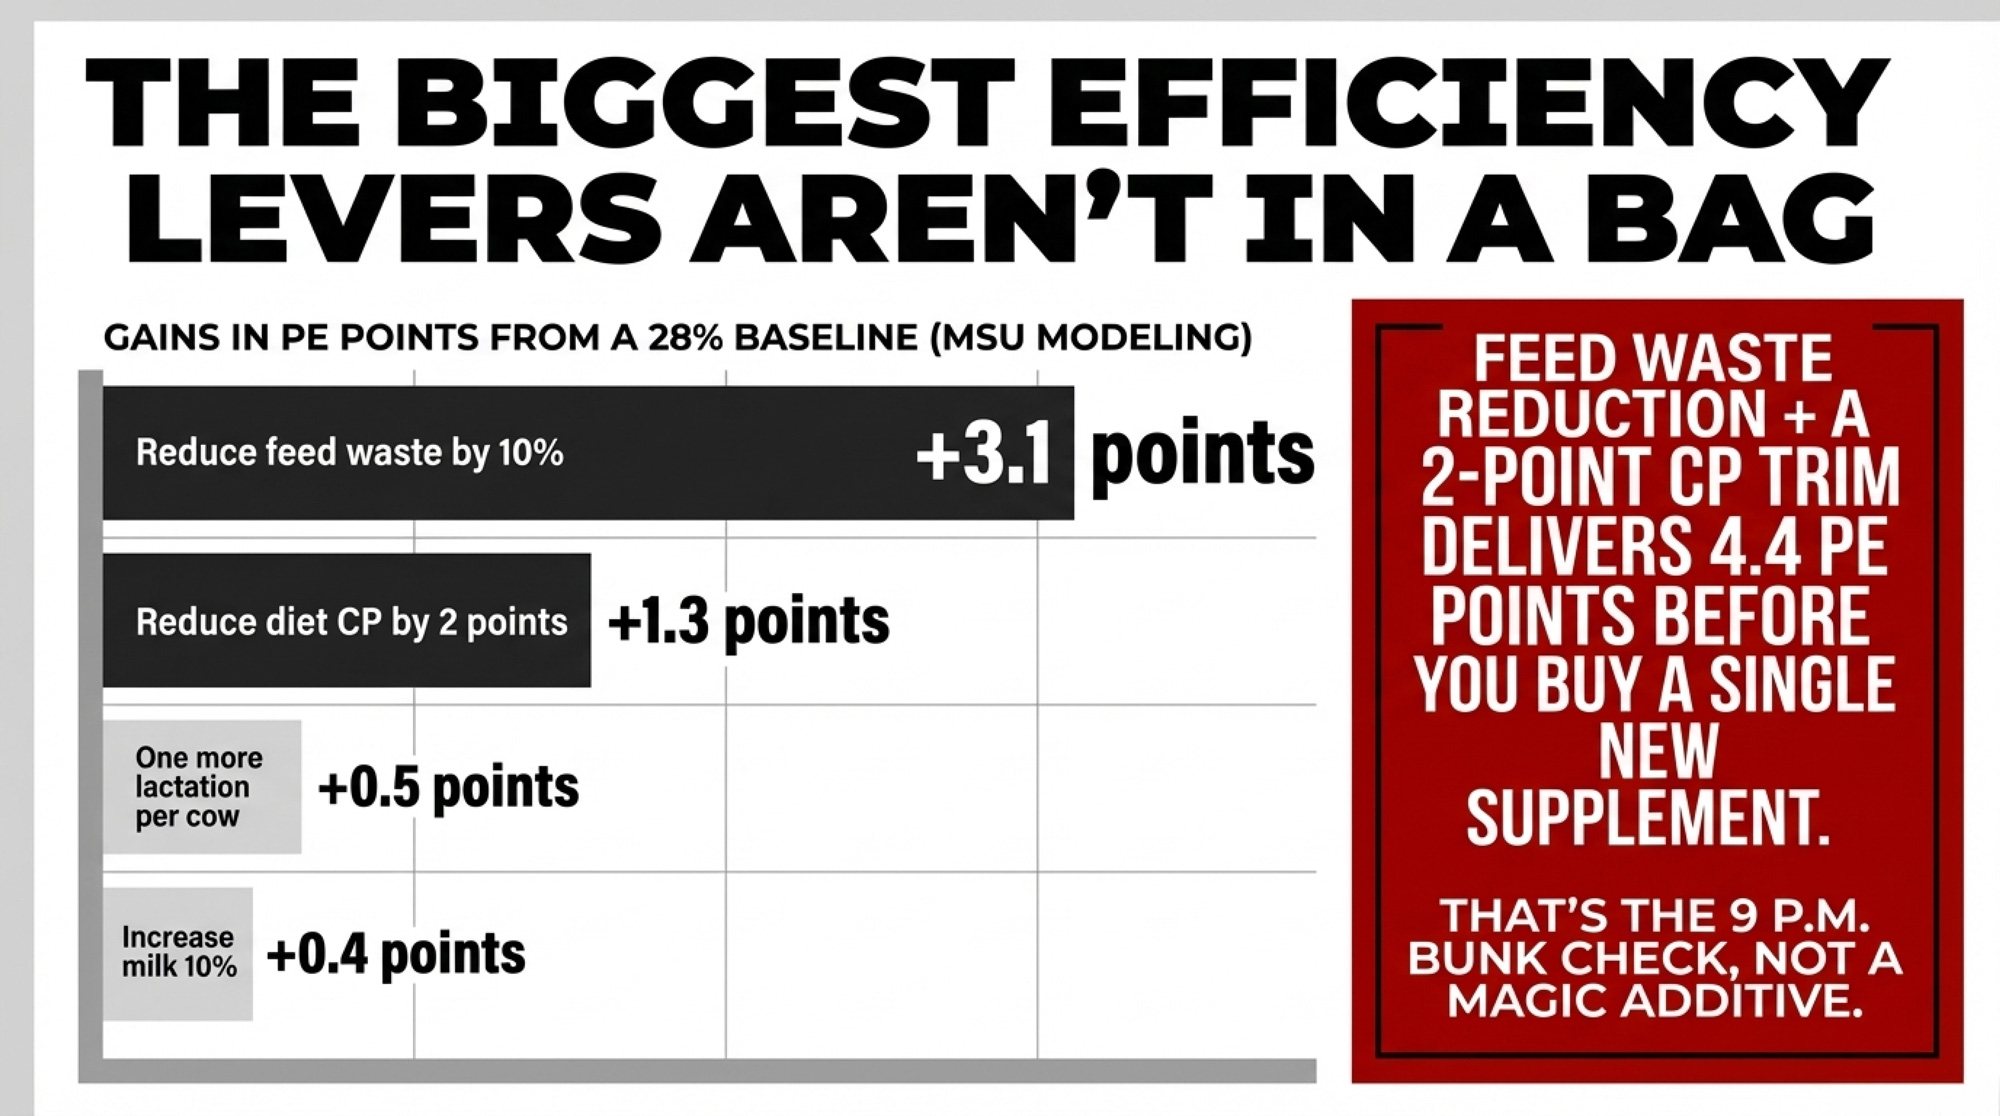
Michigan State University modelled how different management changes affect whole‑farm energy and protein efficiency, starting from a base of 28%. For protein, the gains looked like this:
| Management lever | Protein efficiency gain (points) |
| Reduce feed waste 10% | +3.1 |
| Reduce diet CP by 2 percentage points | +1.3 |
| One more lactation per cow | +0.5 |
| Increase milk 10% | +0.4 |
| Shorten calving interval by 1 month | +0.4 |
| Drop age at first calving by 2 months | +0.3 |
Feed waste sits right at the top.
That’s not a new bag or a new additive. That’s the 9 p.m. bunk check. It’s the inches of refusals you tolerate in front of your high group. It’s how often feed gets pushed up on the night shift.
Put another way:
Feed waste reduction (+3.1) and a 2‑point CP trim (+1.3) together deliver more than 4.4 PE points before you buy a single new supplement.
From a 28% baseline, that gets you into the low‑30s. Add better longevity and reproductive timing, and mid‑30s becomes realistic — without touching your semen tank or buying into the latest “protein booster.”
The Barn Math That Starts Arguments
Let’s go back to that composite 500‑cow Holstein herd.
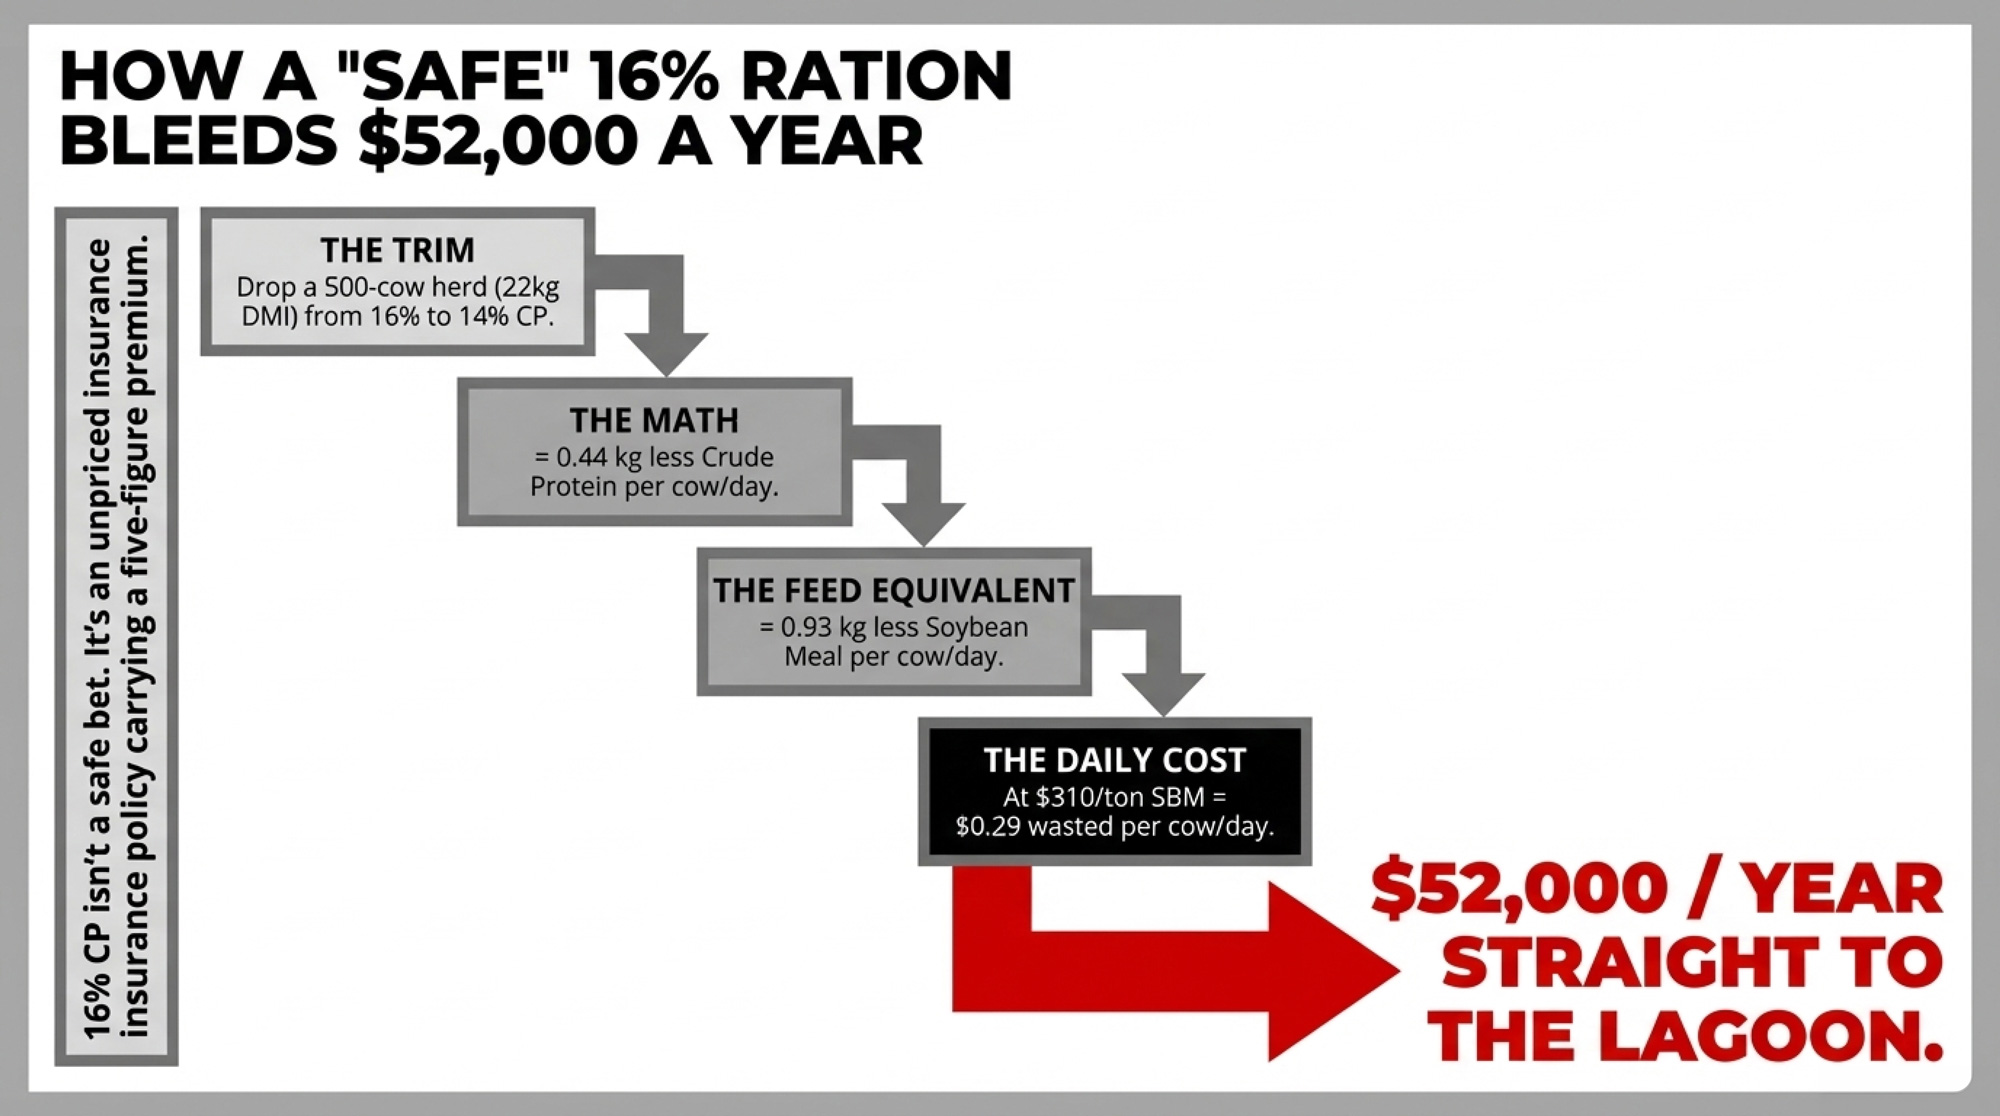
They were feeding 16% CP on a 22 kg DMI. That’s 3.52 kg of crude protein per cow per day. Dropping to 14% CPat the same intake brings that down to 3.08 kg. The difference is:
- 0.44 kg of crude protein per cow per day
If that protein is coming from standard 48% soybean meal (around 47.5% CP as fed), you’re looking at roughly:
- 0.44 ÷ 0.475 ≈ 0.93 kg soybean meal per cow per day
Soybean meal futures for mid‑2026 are trading in the low‑$300s per ton. Recent quotes put mid‑2026 contracts around $308–$312/ton, with continuous front‑month near $322/ton. Using a conservative $310/ton (~$0.31/kg) for barn math:
- 0.93 kg × $0.31/kg ≈ $0.29 per cow per day
- $0.29 × 500 cows × 365 days ≈ $52,000 per year
That’s the $52,000 protein leak in the headline. It’s straight multiplication off your ration sheet and the current meal board.
When this extension material was first presented, U.S. soybean meal was priced at around $460/ton. Run the same math:
- 0.93 kg × $0.46/kg ≈ $0.43 per cow per day
- Roughly $77,000 a year on 500 cows
Feed markets have moved since then, and they’ll move again. The underlying point doesn’t change: 16% isn’t “safe” by default. It’s an unpriced insurance policy that can quietly carry a five‑figure annual premium.
And in your own ration, that entire 0.44 kg CP won’t all come from soybean meal. But once you plug in your actual protein sources and prices, the direction of travel will look very similar.
What Your MUN Is Really Telling You About Protein Efficiency
Here’s the good news: you already have a real‑time nitrogen report card sitting on every milk statement.
Milk urea nitrogen (MUN) is routinely reported for U.S. herds and widely used in extension work. The guidance bands often look like this:
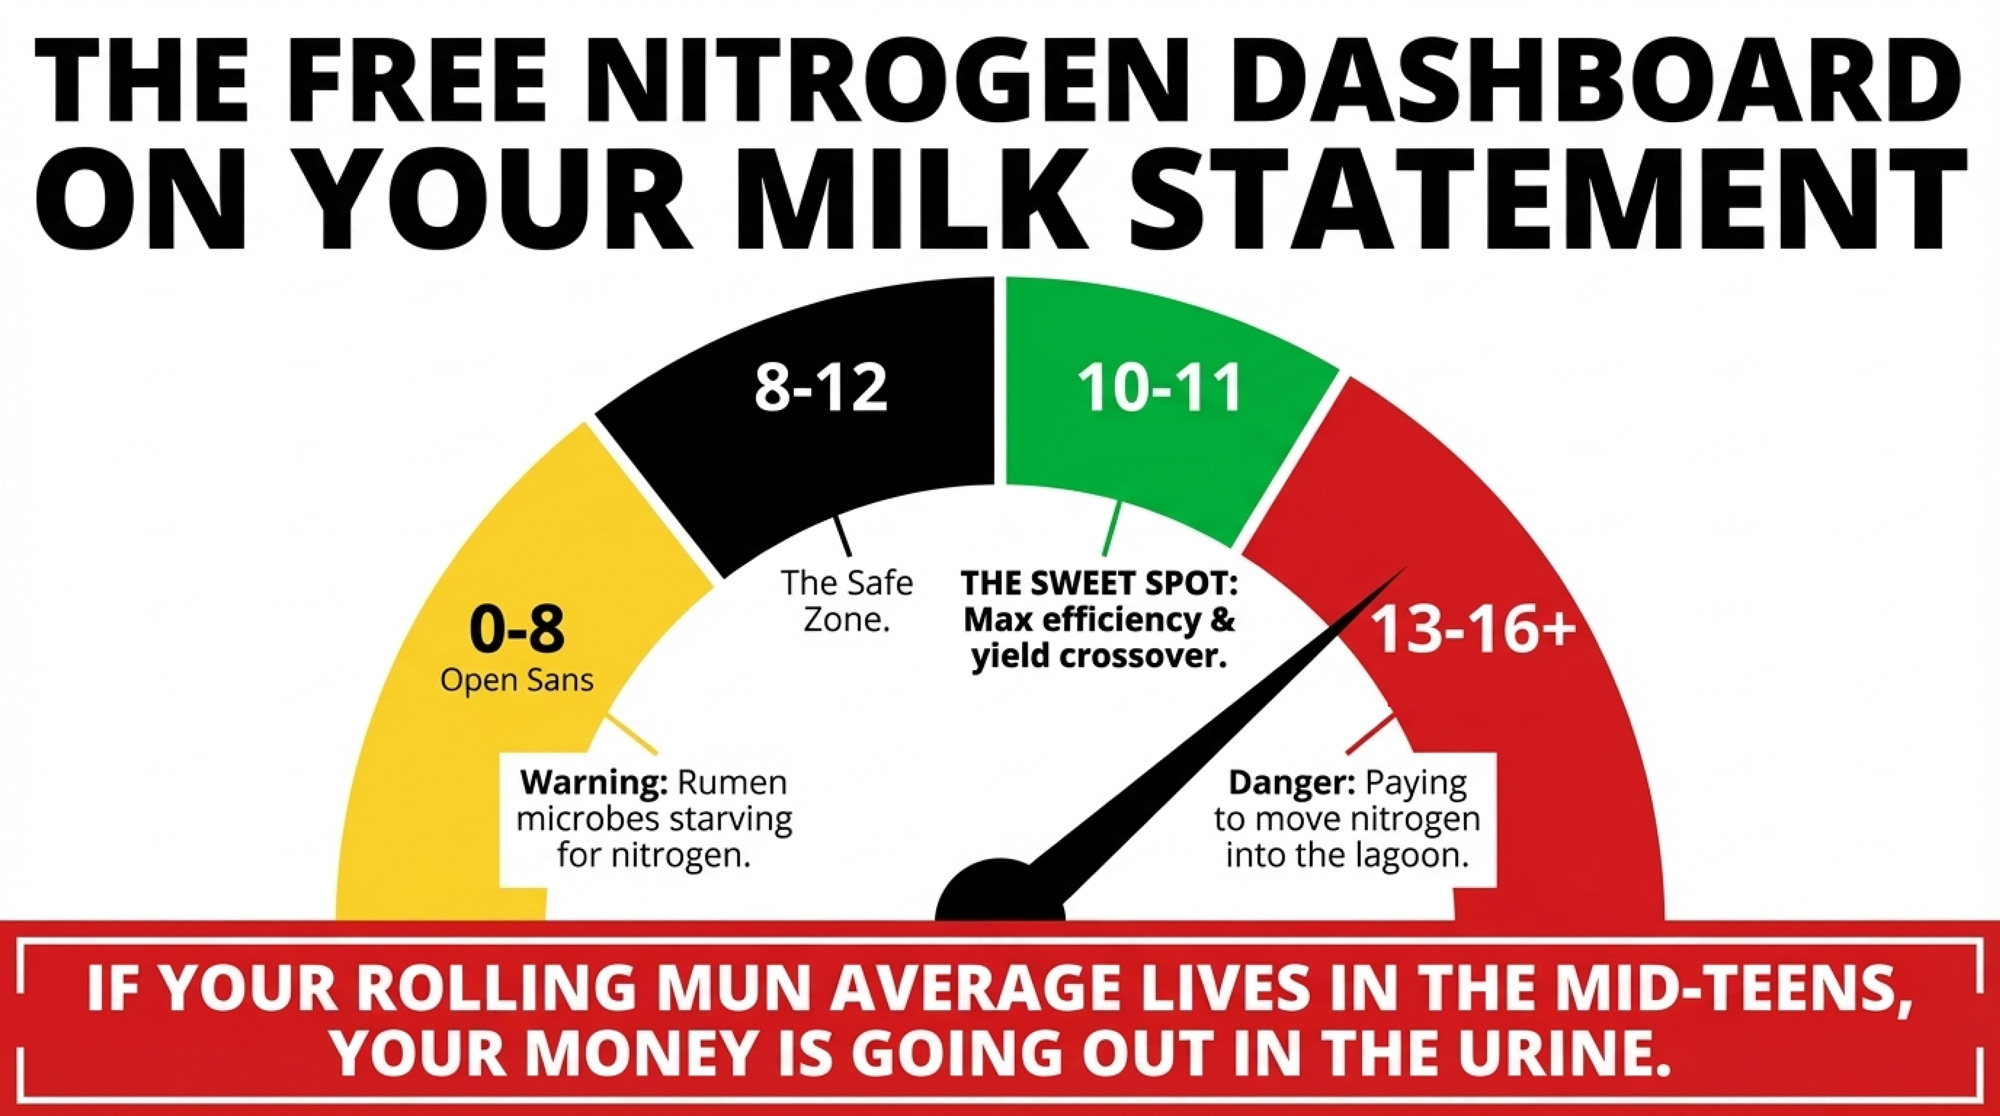
| MUN (mg/dL) | Status | What it tells you |
| 0–8 | ⚠️ Low | Rumen microbes may be short on nitrogen; may need more rumen‑degradable protein. |
| 8–12 | ✅ Target | Best balance between nitrogen efficiency and milk protein yield. |
| 12–16 | 🟠 Above target | Nitrogen use is less efficient; more loss as urine and milk urea. |
| 16–24 | 🔴 High | Higher risk for fertility impacts, nitrogen loss, and environmental load. |
A University of Wisconsin model, combined with work by Nousiainen et al. (2004), plotted:
- The percentage of intake nitrogen captured in milk, and
- Total milk protein yield
against MUN.
As MUN rises:
- The share of intake nitrogen showing up in milk drops.
- Milk protein yield increases with MUN up to about 20–25 mg/dL, then levels off.
The interesting part is where the two curves cross. That crossover — where you keep good milk protein yield without throwing nitrogen away — sits right around 10–11 mg/dL MUN.
So if your rolling MUN average lives in the mid‑teens, you’re paying to move nitrogen through the cow and into the lagoon instead of into the bulk tank.
Why Rumen Bugs Can Replace Expensive Protein
If you’re going to cut crude protein, you need to know something else is doing the heavy lifting on amino acids.
That “something” is your rumen.
A Vermont project compared model‑predicted allowable milk from metabolizable protein with actual milk shipped. The relationship was almost perfectly linear, with an R² of about 72%. In plain terms, metabolizable protein explained roughly three‑quarters of the variation in milk yield.
The source of that metabolizable protein matters. University tables comparing amino acid profiles show this:
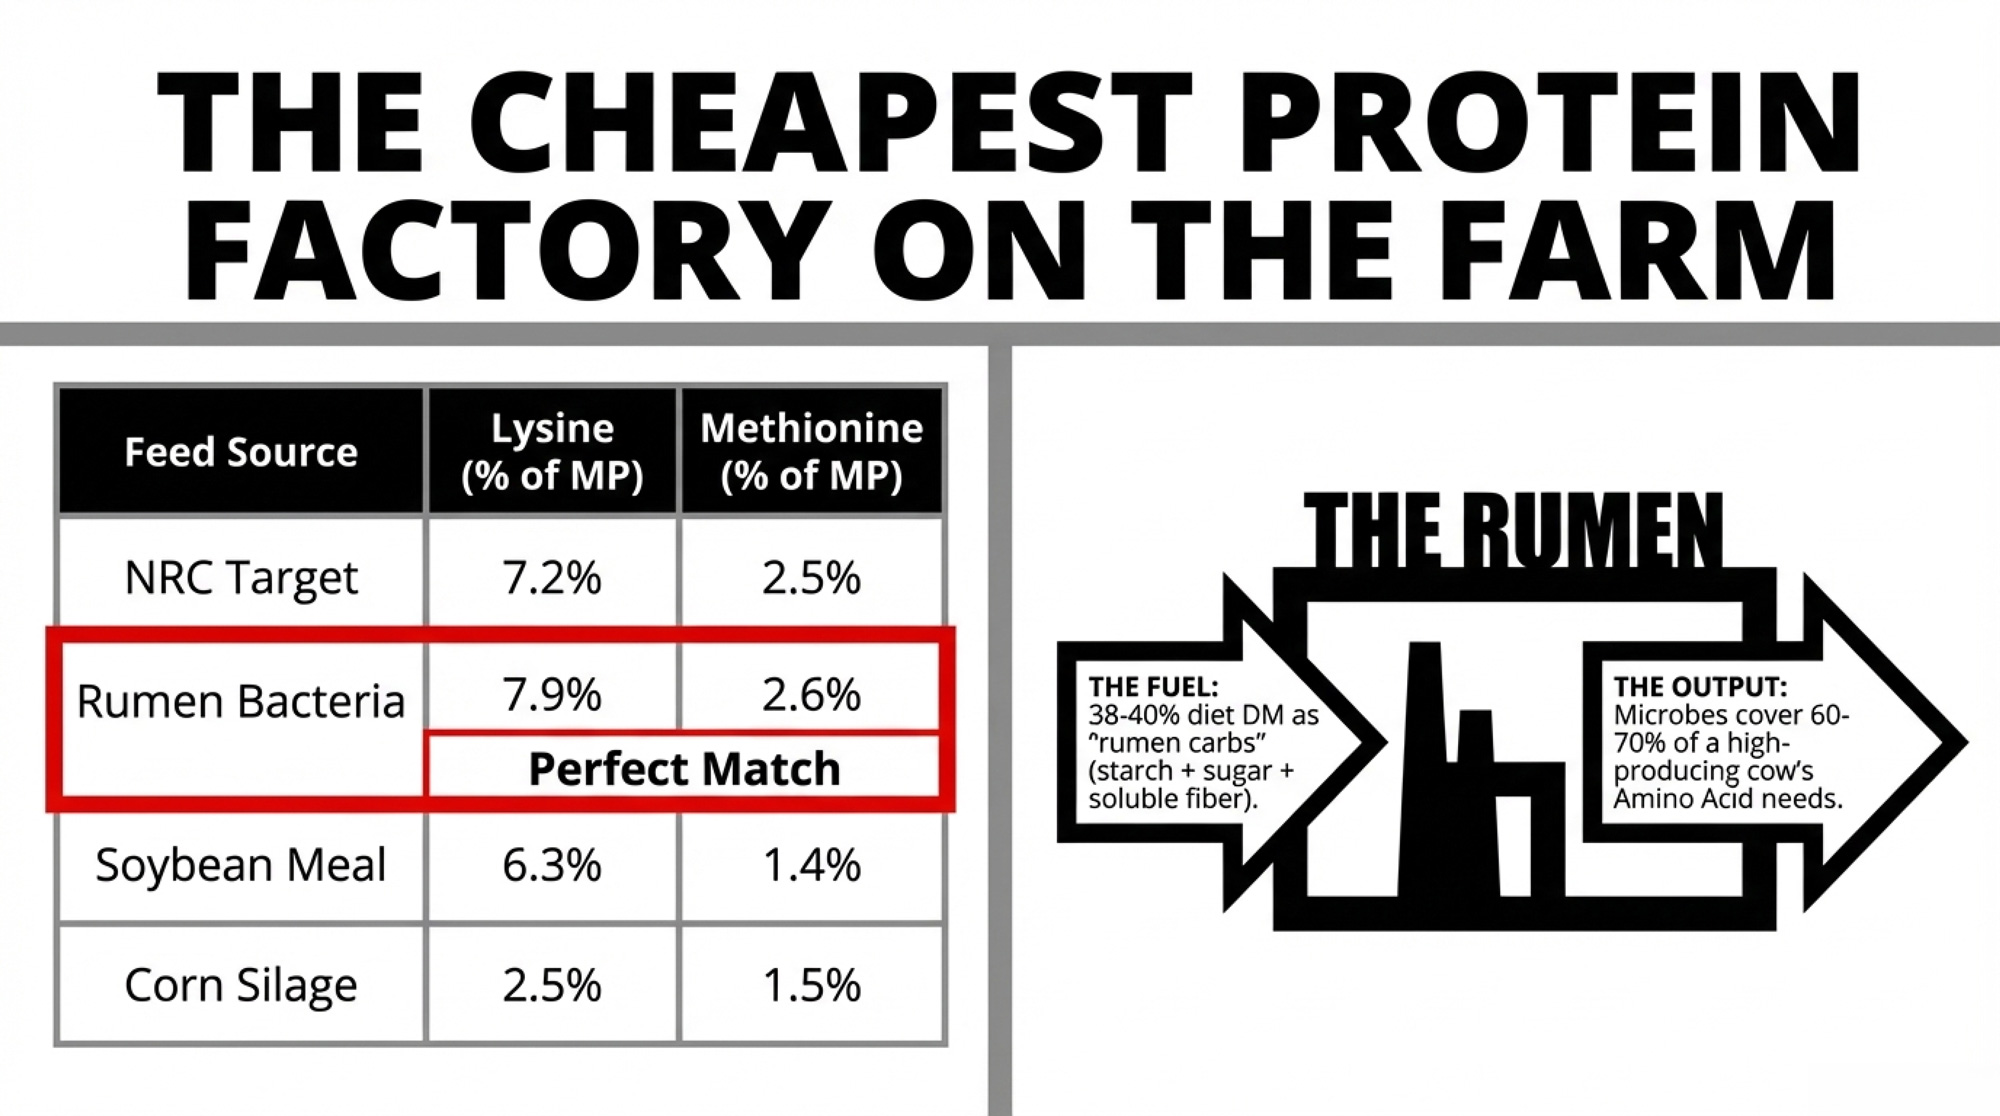
| Feed source | Lysine (% of MP) | Methionine (% of MP) |
| 🏆 Rumen bacteria | 7.9 | 2.6 |
| NRC target | 7.2 | 2.5 |
| Milk requirement | 7.6 | 2.7 |
| Corn silage | 2.5 | 1.5 |
| Corn grain | 2.8 | 2.1 |
| Soybean meal | 6.3 | 1.4 |
| Blood meal | 9.0 | 1.2 |
Rumen bacteria land almost exactly on the NRC target for 7.2% lysine and 2.5% methionine. When the rumen is firing, it can cover 60–70% of a high‑producing cow’s amino acid needs.
Corn silage and corn grain don’t come close on their own. Heavy corn‑based diets common in the Midwest and Northeast need help — either from high‑lysine ingredients like soybean meal or from rumen‑protected amino acids in the right pens.
The key to unlocking microbial protein isn’t throwing more crude protein at the cow. It’s giving the rumen bugs the right fuel:
Target roughly 38–40% of diet dry matter as “rumen carbs”: starch + sugar + soluble fiber.
That’s what lets microbes grab ammonia and turn it into near‑perfect protein instead of letting it blow off as urea.
How Do You Know If You’ve Cut Protein Too Far?
The big fear with any CP cut is simple: “What if the tank drops?”
That fear is valid. The fix is to put hard guardrails around the change.
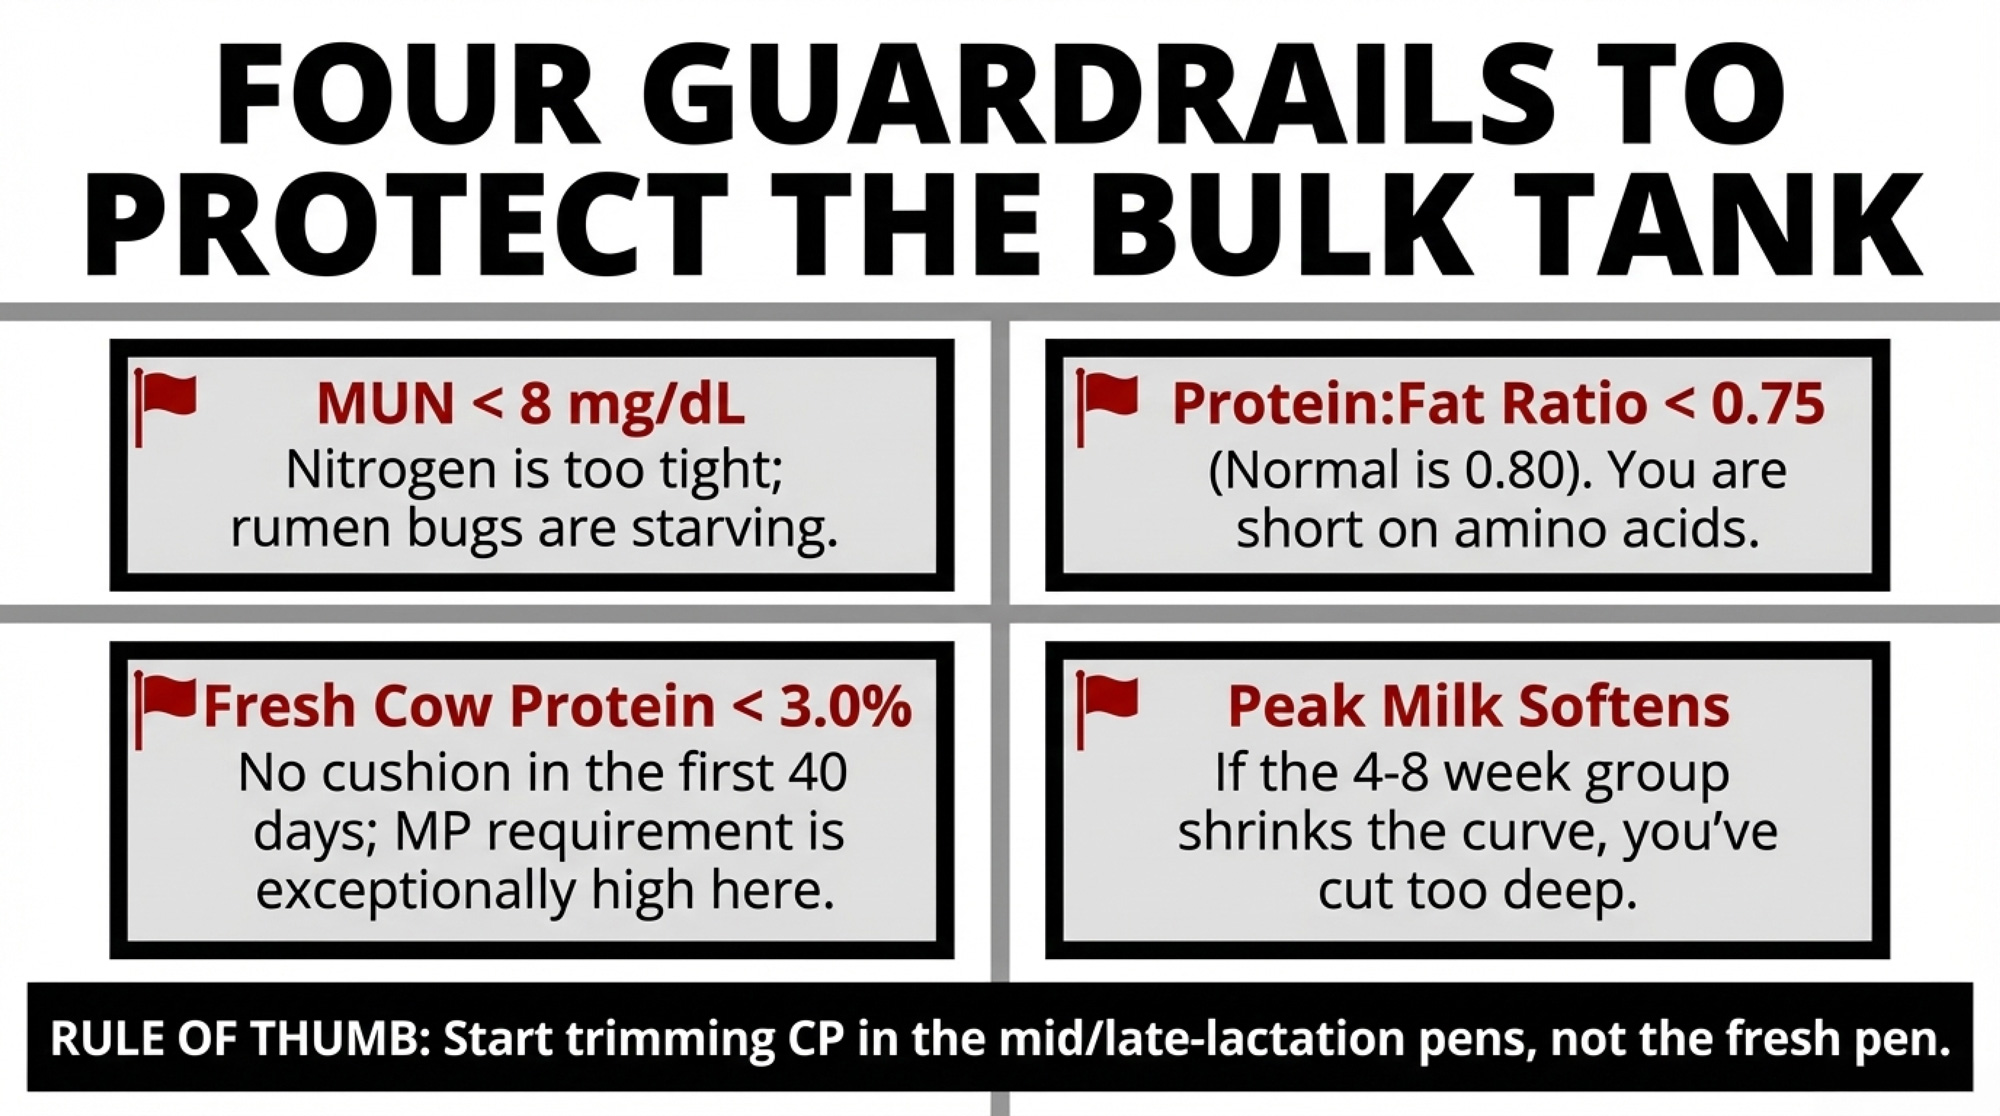
The extension material points to some clear red flags:
- MUN consistently < 8 mg/dL
Nitrogen is tight for the rumen bugs. You may have over‑cut RDP or shifted too much toward bypass protein. - Protein: fat ratio < 0.75
DHI averages for U.S. Holsteins are 3.81% fat and 3.04% true protein, a ratio of about 0.80. Drop below 0.75, and you’re likely short on amino acids — either from microbial protein or from RUP quality. - Fresh cow protein below 3.0% in the first 40 days
North Carolina DHIA data from 2009–2017 (herds from 19,000 to 30,000 lb RHA across three lactations) showed early‑lactation true protein values consistently under 3.0%, highlighted in red in the original tables. NRC (2001) sets the fresh Holstein MP requirement at 13.8% of DM, while DMI is only about 15 kg/day. There’s almost no cushion. - Peak milk softens in the 4–8 week group.
If peak shifts down after a CP cut, you didn’t improve efficiency — you just shrank the curve. - Dry matter intake slides
According to the same extension talk, protein is a driver of DMI. Lower intake means lower total nutrient delivery, even if PE looks better on paper.
The safest place to start trimming crude protein is not the fresh pen. It’s mid‑ and late‑lactation groups where:
- MUN is running high
- Protein tests have headroom
- Cows are past peak, and intakes are stable
In practice, that means agreeing ahead of time on your floors for milk yield, protein %, and MUN — and booking a 30‑day check‑in before you change anything.
If the cows don’t hold those lines, crude protein goes back up. No drama. No sunk‑cost pride.
When Amino Acid Balancing Is Actually Worth the Money
Once the simple levers — feed waste, crude protein, rumen carbs — are under control, the next question is usually about rumen‑protected amino acids.
Do they pay, or is it just one more shiny bag?
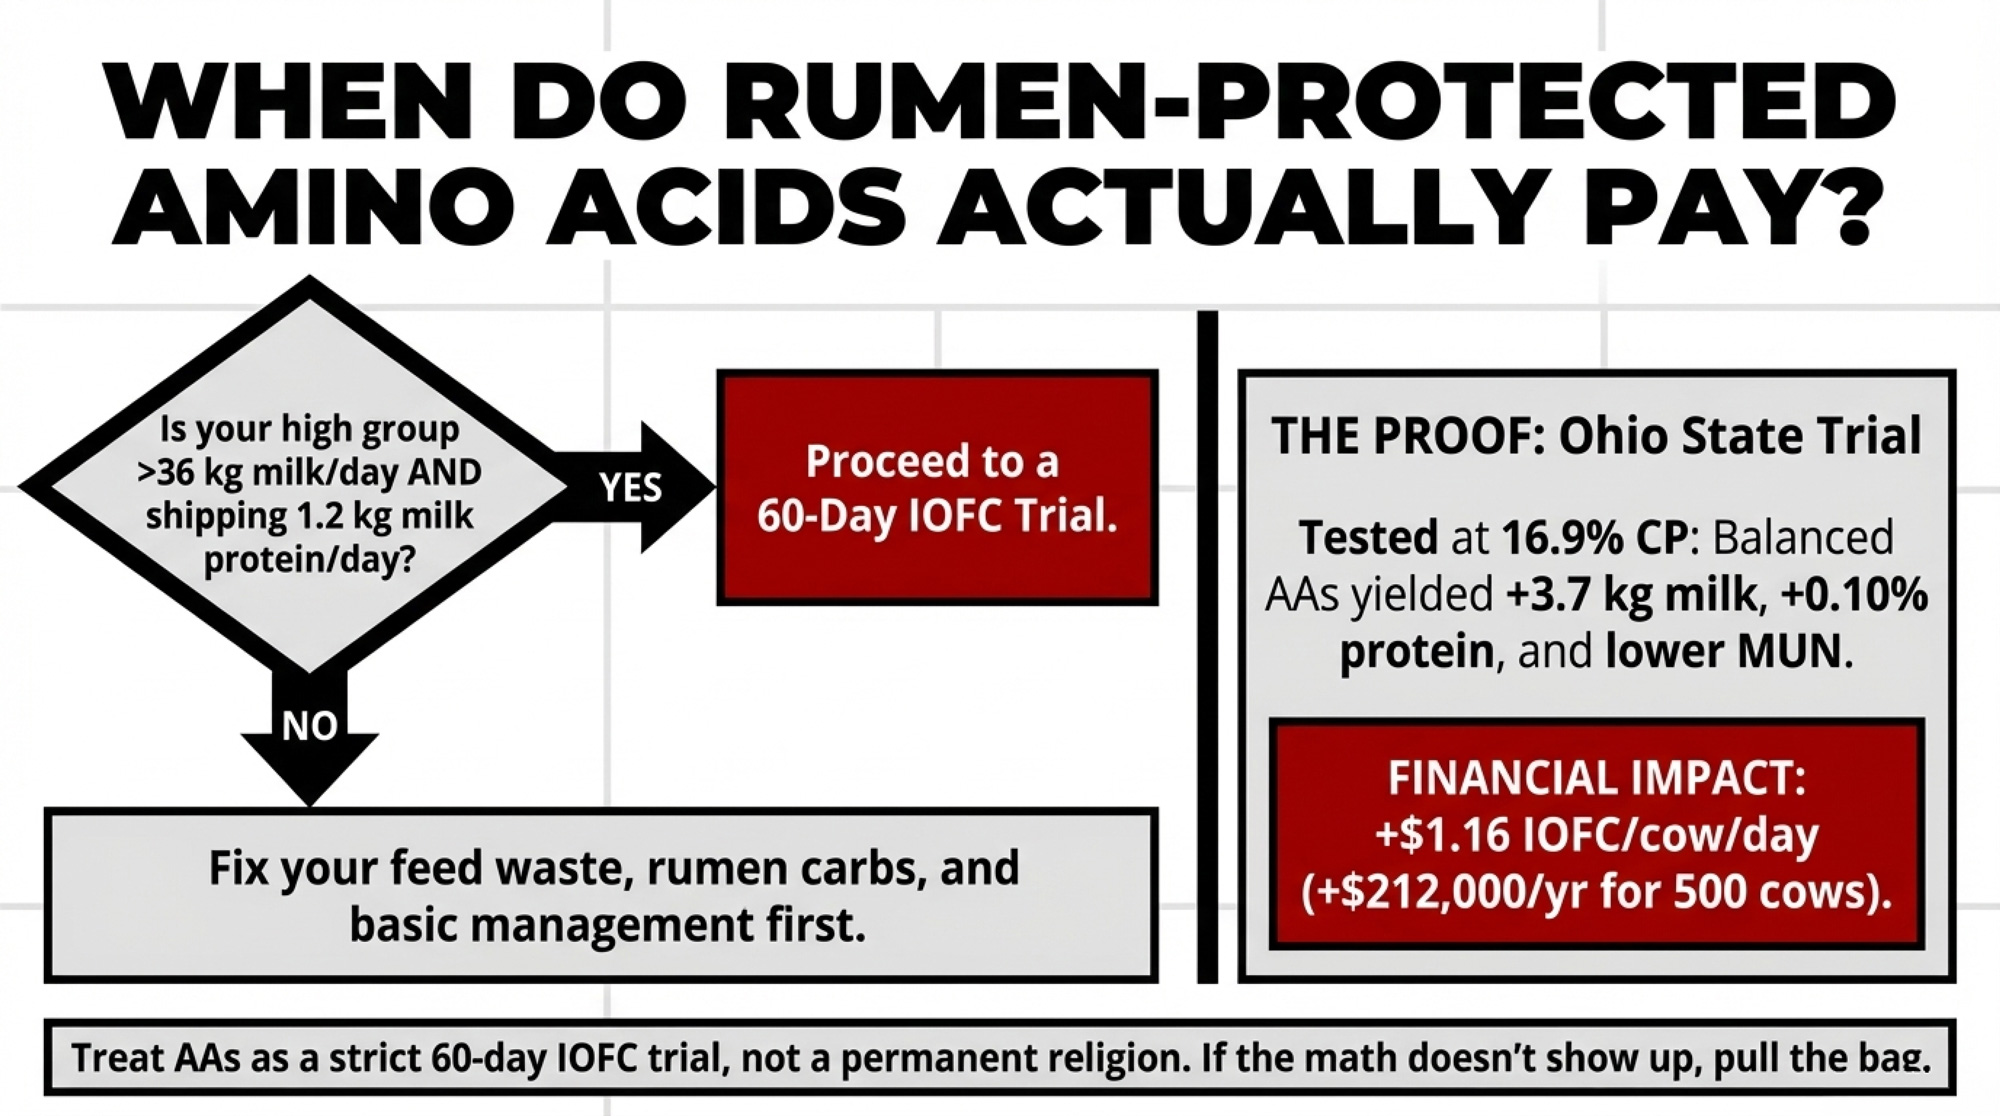
An Ohio State University trial, summarized in the extension slides, offers a clean comparison:
| Parameter | Control | Balanced AA |
| Crude protein, % | 16.9 | 16.9 |
| Milk, kg/day | 42.9 | 46.6 |
| Protein, % | 2.99 | 3.09 |
| MUN, mg/dL | 14.3 | 13.5 |
| IOFC, $/cow/day | $8.74 | $9.90 |
Same crude protein. Different amino acid profile.
- Milk jumped 3.7 kg per cow per day.
- Protein test nudged up 0.10 percentage unit.
- MUN dropped slightly while staying in a sensible range.
- Income over feed cost improved by $1.16/cow/day, including the cost of the amino acid product.
Scaled up to 500 cows for a full year, that’s roughly $212,000 more IOFC — at the feed prices and milk value that applied when the trial was run. Real herds won’t reproduce university results perfectly, but it shows what’s on the table when crude protein is already optimized.
The wider research summarized in the same presentation puts the range of field response roughly here:
- Milk yield: 0 to 2.3 kg/cow/day
- Protein test: +0.1 to +0.2 percentage units, often within days
- Where it works: mostly in early lactation, when cows are setting their curve, and RUP lysine/methionine can be limiting
One rule of thumb from that extension work:
When your high group is consistently over 36 kg/day and shipping about 1.2 kg of milk protein per cow per day, amino acid modelling and RP methionine are much more likely to pay.
Below that line, the big wins usually still come from management.
The key with any amino acid program is to treat it like a trial, not a belief system:
- Benchmark milk, components, MUN, and IOFC before you start.
- Run the product for a set period.
- Decide up front what success looks like.
- If the numbers don’t show up in 60 days, pull it.
What This Means for Your Operation
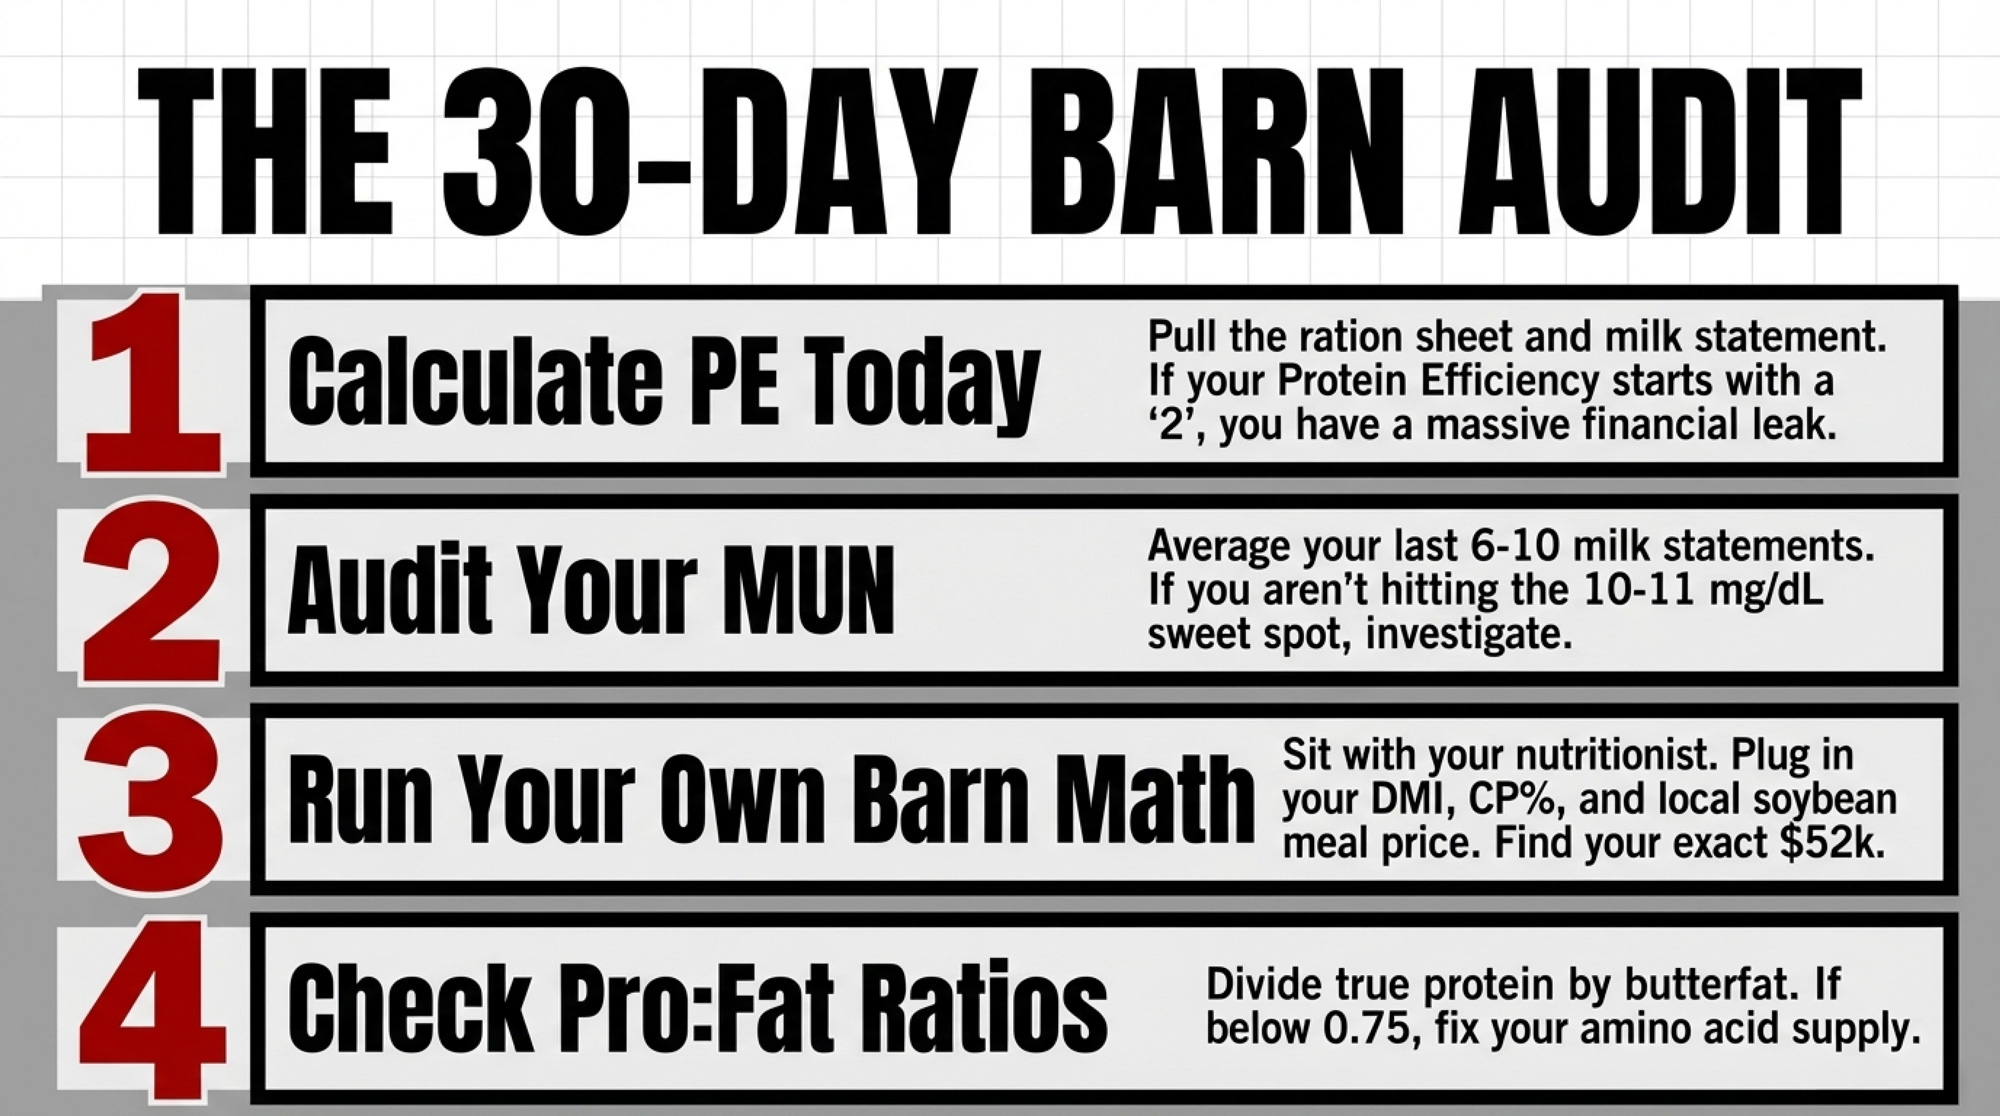
- Within the next 30 days, calculate protein efficiency at least once.
Use your current ration: estimate kilograms of crude protein fed per cow per day from DMI and CP%. Use your milk shipper statement to get kilograms of milk protein per cow per day. Divide. If that number starts with a 2instead of a 3, you’ve just sized a real opportunity. - Pull your last 6–10 MUN results and average them.
If you’re living between 8 and 12 mg/dL, you’re near the efficiency–yield crossover that the Wisconsin model points to. If you’re consistently in the 13–16 range, some of your protein is walking right past the mammary gland and out through urine. - Sit down with your nutritionist and run your own 16% vs 14% barn math.
Plug in your DMI, your CP %, your actual protein ingredients, and your current delivered meal price. The example here — $0.29/cow/day and $52,000/year at $310/ton soybean meal — is a template, not a budget. Decide which pens, if any, can move toward 14% CP, and set clear guardrails before making any changes. - Check your protein: fat ratio this week.
Take your Holstein herd average. Divide true protein % by butterfat %, and the data says the “normal” is about 0.80. If you’re well above 0.90, chase milk fat depression and rumen health first. If you’re below 0.75, look hard at amino acid supply — especially MP, microbial protein support, and RUP quality. - If your high group exceeds 36 kg/day, treat amino acids as a real trial.
Use a modelling tool to balance lysine and methionine. Pick a rumen‑protected methionine product with published data. Track IOFC, not just milk volume. Set a kill date if the economics don’t show up.
Key Takeaways
- If your protein efficiency starts with a “2,” management fixes are your first step.
Reducing feed waste by 10% and trimming diet CP by 2 points can add more than 4 PE points on their own, based on MSU modelling. - MUN is a free, powerful nitrogen dashboard you’re probably under‑using.
Aim for 8–12 mg/dL, with the efficiency–yield sweet spot right around 10–11. Averages in the mid‑teens point to nitrogen — and money — going out in urine. - Rumen microbes are the cheapest protein on your farm.
They can supply 60–70% of a high‑producing cow’s amino acids when rumen carbs sit around 38–40% of DM,and CP is balanced for MP and amino acid profile. - Amino acid products pay best when combined with good management, not instead of it.
The Ohio State trial shows what’s possible at 16.9% CP, but field herds will only see that kind of return once DMI, CP, MUN, and feed waste are under control.

The Bottom Line
None of this requires you to reinvent your feeding program overnight.
It does mean that at your next ration meeting, alongside ECM/DMI and feed cost per cow per day, there probably needs to be one more line on the whiteboard:
Protein efficiency =?
Once that number is up there, what you do with it is where the real management starts.
Complete references and supporting documentation are available upon request by contacting the editorial team at editor@thebullvine.com.
Learn More
- Your Feed Room’s Hidden $58,400 Leak – And How Smart Dairy Farms Are Plugging It – Stops the invisible profit bleed in your transition to high efficiency. Reveals how precision tracking uncovers 3–8% shrinkage you’ve been accepting as normal and arms you with the digital tools to reclaim $58,000 annually.
- 211,000 More Dairy Cows. Bleeding Margins. The 2026 Math That Won’t Wait. – Exposes the structural reset where beef-on-dairy premiums are currently masking collapsed milk margins. Breaks down the critical heifer shortage and delivers a survival playbook to protect your operation’s equity before the 2026 market shifts.
- The Next Frontier: What’s Really Coming for Dairy Cattle Breeding (2025–2030) – Reveals the genetic breakthroughs reshaping the 2030 landscape. Equips you to lead with advanced traits like feed conversion efficiency and casein optimization, turning regulatory environmental goals into a significant competitive advantage for your herd.
 The Sunday Read Dairy Professionals Don’t Skip.
 The Sunday Read Dairy Professionals Don’t Skip.
Every week, thousands of producers, breeders, and industry insiders open Bullvine Weekly for genetics insights, market shifts, and profit strategies they won’t find anywhere else. One email. Five minutes. Smarter decisions all week.